Embed Size (px)
Citation preview
Doctoral Dissertation
A Study on the Relationship between Upper Secondary School Track and Post-Secondary Aspiration of Science, Technology, Engineering,
and Mathematics (STEM) Majors in Cambodia
KAO SOVANSOPHAL
Graduate School for International Development and Cooperation Hiroshima University
March 2021
A Study on the Relationship between Upper Secondary School Track and Post-Secondary Aspiration of Science, Technology, Engineering,
and Mathematics (STEM) Majors in Cambodia
D180558
KAO SOVANSOPHAL
A Dissertation Submitted to the Graduate School for International Development and Cooperation
of Hiroshima University in Partial Fulfillment of the Requirement for the Degree of
Doctor of Philosophy in Education
March 2021
i
ACKNOWLEDGEMENTS
Undertaking this Ph.D. has been a challenging academic endeavour. However, it is also an
enlightening and delighting academic journey. Many people and institutions to whom I owe
deep gratitude have been instrumental throughout my quest for enlightenment in the
completion of my dissertation.
First, I would like to express my sincere thanks and gratitudes to my main academic
supervisor, Dr. SHIMIZU Kinya, who kindly supervised me during this doctoral course. I
would love to express my deep gratitude and sincere respect to him for all his thought-
provoking questions and critical comments, his tolerance and support, and his encouragement
throughout the three-year period of this doctoral programme. His care and concern during
conferences and presentations have helped me to develop positive self-efficacy in terms of
logically conducting and evidently concluding the study. Logic and evidence are two of his
words that I will never forget.
My respectful sub-supervisors and examiners—Dr. BABA Takuya, Dr. MAKI Takayoshi,
Dr. MATSUURA Takuya, and Dr. MILLER Jon D.—are great critical thinkers. Their
insightful comments and incisive questions during the candidacy exam, the preliminary
defence, and the public hearing session truly enriched the quality of this dissertation from the
introduction to the conclusion. They practically understood and tolerated some of the
limitations of this study conducted by a novice graduate student during the current pandemic.
This understanding has motivated me and changed the way I perceived things when designing
and conducting research, which will surely help me in my future career.
I would not have been able to successfully complete this study without the countless acts of
support and cooperation from the principals and vice-principals of the selected nine upper
secondary schools in Cambodia, for whom I will be forever thankful. Their long-lasting
warm-hearted collaboration allowed me to follow up with their energetic, honest students
during the two waves of quantitative data collection and qualitative interviews. Their kindness
and the value they placed on the research encouraged me to perform the study
comprehensively. I would also like to convey special gratitude to the home-room teachers of
the classes selected to participate in the survey. They were very accommodating and
understanding in permitting me to use the data on the students’ academic achievement for the
ii
10th and 11th grades. Without their help, I would not have been able to derive such significant
statistics. I would like to express my deep gratitude to the teachers whose teaching sessions
were replaced by the survey sessions.
Data collection, especially for this panel data (panel mortality) and mixed method designs,
was the hardest part of my doctoral endeavour. That said, I respectfully acknowledge all my
dear fellow participants. From the first meeting to the end of the survey, they voluntarily and
candidly spent their busiest, most valuable time to complete the questionnaires and took part
in the online interviews and the focus group discussion. Their careful, genuine responses
allowed me to gain insight into the issue and made this study a success. Most notably, the
classroom monitors deserve great acknowledgement for their support in facilitating the in-
classroom survey. Without their help, the real classroom survey would not have been that
smooth.
I would like to convey my sincere gratitude to all my peers in the Cambodian Students
Association in Hiroshima (CSAH), who from March 2018 to March 2021 accompanied me
throughout my three-year academic and social life in Saijo, Japan. I have the utmost gratitude
for Mr. Li Nge, a Cambodian who has lived here since my I began master’s degree in 2011.
He gave me the comfort and courage to pursue my doctoral degree at the very start of my
journey. He helped me to feel less stressed during the hardest start-up period, and has
influenced my way of thinking. I would also like to thank all my Cambodian peers who have
shaped and sharpened my method of conducting research and helped me to become confident
speaking in public (a lesson learnt from our Khmer Study Club [KSC]). We have shared sweet
and bitter experiences in academic and social life. My time here has been a great chapter in
my life.
Further, I give special thanks to the people of Japan in general and Japan International
Cooperation Center (JICE) in particular, for the scholarship they granted me. Without it, it
would have been impossible for me to spend my time from 11am to midnight concentrating
on my academic papers and doctoral dissertation within this three-year period. It has been an
exciting experience for me to return to Saijo in Hiroshima in 2018 after I left here in 2013.
Apart from my academic life, there are many social aspects of Japan and great Japanese
citizens that I truly admire. I cannot describe how much I appreciate this country in general
and Japanese citizens. The lessons I have learnt in my social life here will remain deeply
iii
embedded in my heart and in my memory. At the time of writing this paragraph, I am already
missing my academic and social life in the peaceful yet exciting area of Saijo, let alone when
I return to Cambodia.
I would like to express my deepest thanks to my loved ones at home in Cambodia. First, I
thank my parents. My dearest father, who instilled in me a sense of life-long learning as a
human treasure when I was eight years old, and my mother, who taught me survival skills
(especially cooking) for when I left home alone to live abroad. I also give special thanks to all
my relatives in Cambodia, who prayed for me and helped take care of my family while I was
here focusing on my academic papers and dissertation. Last but not least, I give great thanks,
with love, to my wife. Raising three small children alone while also earning a living is not an
easy task to do in Cambodia. I honestly thank her for her devotion to our family and for
sharpening my knowledge. Finally, I would like to convey my sincere gratitude to all the
special people I have come to know in Japan as well as in Cambodia, who realize the value of
human capital theory.
Hiroshima, March, 2021
KAO Sovansophal
iv
DEDICATION With the success of this dissertation, I dedicate this work to my amazing grandmother, Ngeth
Norn, to whom I owe deep gratitude.
I cherish what she told me: “Grandson, you must come to Phnom Penh to pursue your higher
education. It is good to become a lower secondary school teacher [which does not require
bachelor’s degree], yet you have even better chances attending university”. With such
profound words of business of knowledge, I owe her a lot. What I regret most is that I did not
have enough time to pay her back my gratitude, as I should have done.
She who had no education at all. She who loved the knowledge. She who love the truth. And
she who will be remembered.
v
SUMMARY
Introduction: Given the required role of human resources in science, technology,
engineering, and mathematics (STEM) to help Cambodia advance during the Fourth
Industrial Revolution (also called Industry 4.0) in general, and to help the country achieve
economic growth in particular, there is great demand for graduates with STEM majors.
However, fewer students are pursuing STEM nowadays. Although interest in STEM is
developed and nurtured in upper secondary school, in recent academic years, there has been a
worrisome declining number of science track students. Therefore, with the conceptual gap in
this context, the main objective of this explanatory sequential mixed methods study is to
examine, from a multi-dimensional perspective, factors influencing students’ choice of the
science track and the effects of tracking as well as other variables that explain Cambodian
upper secondary school students’ post-secondary aspirations of STEM majors in higher
education. To achieve this main objective, three related Research Questions guided the
investigation:
• Research Question 1: What factors are influencing Cambodian upper secondary
school students’ choice of science track?
• Research Question 2: What are the trends and patterns of the time-varying covariates
(TVCs) for students who attended in different tracks at upper secondary school for one
academic year?
• Research Question 3: What are the effects of the tracking system and other variables
on Cambodian upper secondary school students’ aspirations of STEM majors?
Methods: To answer the research questions, this study employed explanatory sequential
mixed method with repeated cross-sectional designs. A self-rated questionnaire containing 28
questions (25 closed-ended and 3 open-ended ones) were used to collect two waves of
quantitative data. To explain significant predictors in greater detail, qualitative semi-
structured interviews and focus group interviews were conducted online with 25 students. To
answer Research Question 1, since the outcome variable was coded dichotomously into the
science and social science tracks, Binary Logistic Regression was employed to analyze the
first wave data from a sample of 752 early 11th grade students. Second, Research Question 2
was addressed through a descriptive lens and some inferential statistics, including
independent sample t-test, pair sample t-test, and repeated ANOVA on the two waves of data
(waves 1 and 2). Third, to address Research Question 3, which aims to measure the effects of
vi
the tracking system and other variables on students’ aspirations of STEM majors, the study
employed Hierarchical Linear Model (HLM) with Bernoulli method to analyze the data of
700 participants from the second wave data (end of 11th grade). As the nature of the study
implies, the data from the first wave, first and second waves, and second wave were used to
answer research question one, question two, and question three respectively.
Key findings: From the analysis of the data, the study revealed:
• that performance in science and mathematics subjects, attitudes towards science, plan
to major in STEM, hours spent self-studying science and mathematics subjects, family
encouragement and support, mother’s education, and school location significantly
predicted upper secondary school students’ choice of the science track. Of the 49% of
variance explained by the final model, individual factors explained 47% of the
variance in Cambodian students’ choice of the science track.
• that students perceived science and mathematics outcome expectations, science as a
practical subject, and the importance of science in society at a high level. However,
they rated science and mathematics self-efficacy, science and mathematics self-
concept, interest in science at school, science activities outside school, extracurricular
activities in science, future plan in science, support from science and mathematics
teachers and interactive science and mathematics lessons at the moderate level. They
rated science and mathematics performance as lower than average. Most interestingly,
across the span of one academic year, some constructs exhibited increasing trends, yet
based on Cohen’s d, the effect size was at a small level. Moreover, there was a significant
negative trajectory for future plan in science and no significant effect for interactive
science and mathematics lessons. The patterns also varied across the observations as a
function of the covariates of study track, gender, and school location. Notwithstanding,
based on the value of partial eta2, the effect size was also at a small level.
• that there is class difference in the upper secondary school students’ aspirations of
STEM majors. Simply put, 18% of the variance in Cambodian students’ aspirations is
between classes and 82% of the variance in their choice lies between students within a
given class. Specifically, the random-regression coefficients model indicated that
gender, academic achievement, future plan in science, and family encouragement and
support had an impact. Next, the means-as-outcomes model revealed that students’
choice of the science track was not significantly associated with aspirations of STEM
majors; however, the interactive science and mathematics lessons were influential.
vii
Discussion:
Key themes for RQ 1:
The effect of academic performance in science and mathematics: A one-unit increase in
science and mathematics performance would lead to an increase by a factor of 3.16 in
choosing the science track. This implies that performance in science and mathematics
contributed to the decline in number of students that choose the science track. Under the strict
examination policy whereby Qualified students can pass (in Khmer: អកេចះគជប) students who
chose the science track failed the examination at a higher percentage than their peers in the
social science. From 2014–2019, on average, about 73% of students in the social science track
passed the examination compared to about 49% of students in the science track. While
science track students need to take mathematics and all science subjects, students in the social
science track only take mathematics and one science subject (usually earth-environmental
science). Thus, most of the students swing from science track to the social science track due
to their low academic performance in science and mathematics.
Attitudes towards science: Attitudes towards science—as measured on science as a practical
subject and future plan in STEM majors—were the second and third most influential factors,
respectively, in predicting Cambodian upper secondary school students’ choice of the science
track. This finding supports the long-held supposition that weaker attitudes towards science
and future participation in science are among the factors that reduce the probability of
students choosing science or influence students to swing from science. Interestingly, while
students should view science as having a practical nature, they might not have been trained to
realize the applications of science to their lives in the context.
Family encouragement and support in science: Encouragement and support from family
members are critical to Cambodian students’ decision-making. The family environment
tended to be a significant untapped resource of support for Cambodian upper secondary
school students. Further, encouragement and support include not only financial and emotional
support, but also the physical space that enables students to have time for studying at school
and at home.
Key themes for RQ 2:
Perceived importance, but lower future plan in science: Students’ awareness of science and
technology in general, and of the importance of science in society in particular, is high. This
viii
is a really interesting sign, since according to the Royal Government of Cambodia’s national
science and technology master plan for 2014–2020, Cambodia has only 17 science and
technology researchers and 13 technicians per million of its population. This was due to the
fact that Cambodia’s social awareness of science and technology is generally low. Although
students perceived the importance of science in society, because they might believe that
science is difficult and have lower self-concepts in science and mathematics, their future plan
in science is low (and even negative) when they move up through the grade levels.
Uneven patterns across the two observations: Although there were increasing trends for
some constructs, there was decreasing trend in future plan in science. This might be due to
lower self-concepts in science and mathematics and decreasing support from science and
mathematics teachers. The small effect of the statistically significant constructs is crucial.
Thus, attending in different tracks at upper secondary school for the span of one academic
year did not have much of an effect on encouraging students to take science majors at their
next level of education.
Study track mattered, yet with a small effect: The effect size increased from the first
observation, particularly for science and mathematics self-efficacy, extracurricular activities
in science, future plan in science, science and mathematics teachers’ support, and interactive
science and mathematics lessons. In statistical terms, the effect of the study track was
significant, yet small in practical terms. This may indicate a lower effect of attending in
different tracks in enhancing the constructs that affect students’ uptake from upper secondary
school to post-secondary education. There were also significant interaction effects of the
observations and study track for some constructs, but not for interactive science and
mathematics lessons.
Gender did not matter in early grades, it did in later grades: In the Cambodian context, the
public image of the term “science” entails male-dominated jobs. Thus, female students tend to
leave science disciplines. This is especially interesting when they move on to higher grades.
To a greater extent, this reveals lower interest in (and weaker attitudes towards) science
among female students. Further, since science subjects are usually viewed as difficult, and
because female students in Cambodian upper secondary school (aged 18–22) usually spend
their spare time helping their families (e.g., cleaning and cooking), they might not have
enough time to concentrate on such difficult subjects at home.
ix
Key themes for RQ 3:
The importance of interactive science and mathematics lessons, but not tracking: The
current study has added to the battery of knowledge to the field by emphasising the effects of
how interactive science and mathematics are taught, rather than solely on bifurcating students
into different tracks of science versus social science on students’ aspirations of STEM majors.
Put simply, tracking (increasing the teaching and learning hours, or giving students more time
to provide them with greater exposure to science and mathematics courses) does not matter in
the Cambodian context. What truly matters is how teachers teach science and mathematics
lessons. In other words, simply increasing more teaching hours to science and mathematics
but not changing the teaching practices (to the ones which foster the interactions between
teachers and students) had no significant influence on students’ aspirations of STEM majors
in higher education.
The role of gender, academic achievement, motivational belief, and family encouragement
and support: Cambodian upper secondary school female students are not likely to choose
STEM majors in higher education. This finding might be explained by Wiswall et al. (2014),
who suggested that STEM majors are characterised by a “chilly environment” where female
students can feel unwelcome. This finding might extend the literature on the relationship
between gender and choice of major, as reflected in Cambodia’s cultural reality. Gender
stereotypes still exert considerable influence on the decision making process regarding STEM
majors, especially when parents are involved.
Another of this study’s key findings corroborates results in both Western and non-Western
contexts: the positive correlation between students’ academic achievement in the 11th grade
and their aspirations of STEM major at university. Similar results have been confirmed in the
Cambodian literature by Eng and Szmodis (2015), Kao and Shimizu (2019), and Eam et al.
(2019) and in other contexts such as Lowinger and Song (2017), Shim and Paik (2014), as
well as Wang (2013). They claimed that high academic achievement at the pre-university
level can impact students’ interest and a positive attitudes towards STEM major at university.
Of the four motivational attributes (attitudes towards science and mathematics, science and
math self-efficacy, future plan in science, and aspirations to earn a graduate degree) clearly
mattered in STEM enrolment (Wang, 2013), this study demonstrated that future plan in
science have a significant influence on students’ choice of a STEM major. This reflects the
x
importance of students’ motivational belief on their majors and career aspirations. Those who
have clearer plan in science in upper secondary school tend to have greater aspirations in
choosing STEM majors in higher education.
Conclusion and implications: After all, the main result of this study could be concluded as
follows. The finding from the first study helped explained that the worrisome declining
number of students that choose the science track is due not only to individual academic ability
and attitudinal variables, but also to cultural influences from family and the condition of
upper secondary school. The second study showed that despite the significant influence of
different tracks on the time-varying covariates, different tracks had a small effect in
improving the constructs that predict aspirations of STEM majors. The effect was negative for
students’ future plan in science. Consequently, given the small effect, course-taking behaviour
between the science and social science tracks in Cambodian upper secondary school did not
have any significant association with the students’ aspirations of STEM majors in higher
education. Instead, their aspirations were influenced by how interactive science and
mathematics lessons (in different classes for each respective track) were conducted.
The process leading students to enter STEM fields is complex, as it involves the diverse
influences of individual, psychological, contextual, and social factors. Therefore, to address
this issue, science and mathematics teachers need to realize that, in addition to enhancing
students’ academic performance through their teaching practice, one of their ultimate
missions is to inspire and deepen students’ science self-concept. Also, because the practicality
of science subjects matters in one’s choice of science track, the most substantial change
entails framing the presentation of the material to make science and mathematics lessons
(especially starting in early grades) more practical, interactive, and realistic for students.
Moreover, learning experiences related to teaching science and mathematics should focus on
providing a learning environment with a high level of interaction to propel cognitive
activation. Thus, in order for upper secondary school science track to be more effective in
promoting students’ STEM interest and success, the norms of science and mathematics
instruction (for science track) need to be reconsidered. Parents can engage in many school-
related tasks to boost their children’s science performance and to motivate them to take
STEM. Finally, starting in the early grades of secondary education, students should be made
aware of how one’s choice of track is associated with one’s future major and career prospects,
so that students have enough information to make a well-informed decision to major in STEM.
xi
TABLE OF CONTENTS
ACKNOWLEDGEMENTS ........................................................................................................ i
DEDICATION .......................................................................................................................... iv
SUMMARY ............................................................................................................................... v
TABLE OF CONTENTS .......................................................................................................... xi
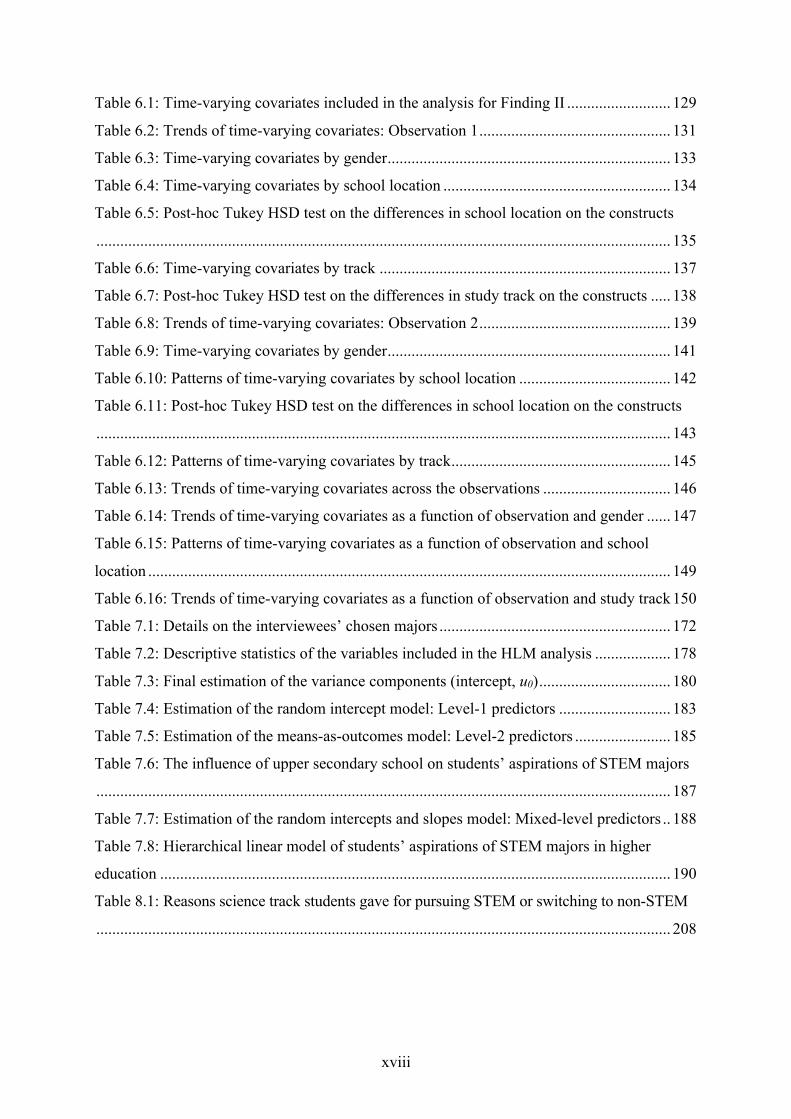
LIST OF TABLES ................................................................................................................. xvii
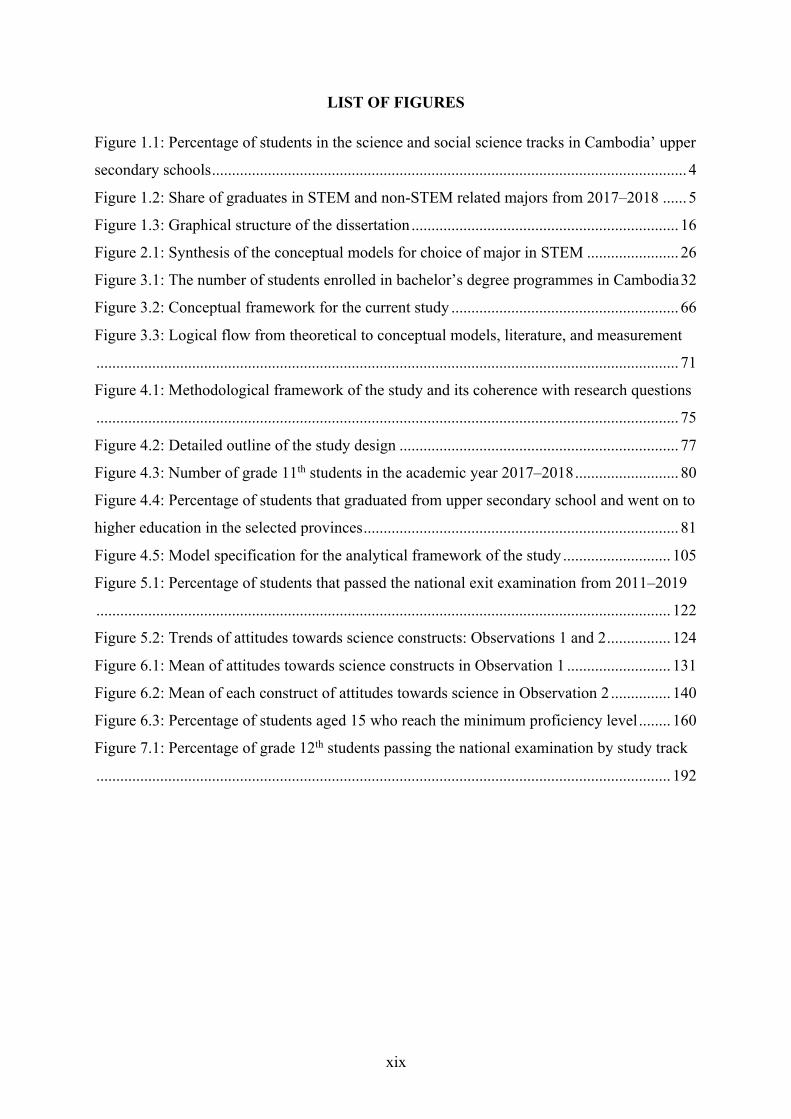
LIST OF FIGURES ................................................................................................................. xix
CHAPTER ONE : INTRODUCTION ....................................................................................... 1
1.1 Research background ................................................................................................... 1
1.2 Research problem ........................................................................................................ 5
1.3 Rationale and significance: Responding to the research problem ............................... 7
1.4 Research focus: Purpose, questions, and objectives .................................................... 8
1.4.1 Research purpose and main questions .................................................................. 8
1.4.2 Specific research questions .................................................................................. 9
1.4.3 Specific research objectives ............................................................................... 10
1.5 Originality of the study .............................................................................................. 11
1.6 Definitions of terms ................................................................................................... 11
1.7 Limitations of the study ............................................................................................. 14
1.8 Research ethics .......................................................................................................... 15
1.9 Structure of the dissertation ....................................................................................... 15
CHAPTER TWO : CONCEPTUAL MODELS FOR CHOICE OF ACADEMIC MAJOR ... 17
2.1 Theoretical orientation ............................................................................................... 17
2.1.1 The theoretical foundations for one’s choice of majors in higher education ..... 17
2.2 Theoretical and conceptual models for choice of STEM major ................................ 20
2.2.1 Students’ choice of academic major model ........................................................ 21
2.2.2 The making of engineers and scientists model ................................................... 21
2.2.3 Social cognitive career theory (SCCT) .............................................................. 22
2.2.4 The STEM transfer model .................................................................................. 24
2.3 Synthesis of the four theoretical and conceptual models .......................................... 25
CHAPTER THREE : LITERATURE REVIEW ..................................................................... 27
3.1 Cambodia’s general education system ...................................................................... 27
xii
3.2 Cambodian higher education ..................................................................................... 29
3.2.1 The structure of Cambodia’s higher education system ...................................... 30
3.2.2 The employment status of graduates .................................................................. 33
3.2.3 Brief strategies and initiatives towards STEM uptake in higher education ....... 34
3.2.3.1 Tracking system at Cambodia’s upper secondary school ........................... 34
3.2.3.2 Secondary resource schools, NGS, and E2STEM schools ......................... 36
3.2.4 Other initiatives to promote STEM aspirations .................................................. 39
3.2.5 Admission into the higher education system ...................................................... 39
3.3 Tracking: Definitions and types ................................................................................ 41
3.4 Empirical evidence for students’ choice of STEM major: Global perspectives ........ 42
3.4.1 Time-invariant predictors ................................................................................... 44
3.4.1.1 Predictors at the individual level ................................................................. 44
3.4.1.1.1 Gender ........................................................................................................ 44
3.4.1.2 Predictors at the family level ...................................................................... 45
3.4.1.2.1 Parental education ...................................................................................... 46
3.4.1.2.2 Parental occupation .................................................................................... 47
3.4.1.3 Predictors at the school level ...................................................................... 47
3.4.1.3.1 Tracking/Streaming system ....................................................................... 48
3.4.2 Time-varying predictors ..................................................................................... 49
3.4.2.1 Predictors at the individual level ................................................................. 49
3.4.2.1.1 Science and mathematics academic achievement ...................................... 49
3.4.2.1.2 Science and mathematics self-efficacy ...................................................... 50
3.4.2.1.3 Attitudes towards science .......................................................................... 51
3.4.2.1.4 Outcome expectations ................................................................................ 54
3.4.2.1.5 Hours spent self-studying .......................................................................... 54
3.4.2.2 Predictors at the family level ...................................................................... 55
3.4.2.2.1 Family income ........................................................................................... 55
3.4.2.2.2 Parental educational aspiration .................................................................. 57
3.4.2.2.3 Parental encouragement and support ......................................................... 58
3.4.2.2.4 Siblings and relatives’ majors .................................................................... 59
3.4.2.3 Predictors at the school level ...................................................................... 59
3.4.2.3.1 Science and mathematics teachers’ support ............................................... 59
3.4.2.3.2 Interactive science and mathematics lessons ............................................. 61
3.5 Studies on the choice of STEM major: Cambodian perspective ............................... 62
xiii
3.6 Synthesis of the literature .......................................................................................... 65
3.7 Conceptual framework of the current study .............................................................. 66
3.8 Logical connection from conceptual model, literature review, and measurement .... 70
CHAPTER FOUR : RESEARCH METHODOLOGY ............................................................ 72
4.1 Philosophical and methodological foundations ......................................................... 72
4.1.1 Worldview: The pragmatism of the mixed methods approach .......................... 72
4.1.2 Brief methodological framework: The logical flow of the study ....................... 74
4.2 Overall design ............................................................................................................ 76
4.3 Research design ......................................................................................................... 78
4.3.1 Research context ................................................................................................ 79
4.4 Quantitative design and methods ............................................................................... 80
4.4.1 Research sampling and samples ......................................................................... 80
4.4.2 Characteristics of the sampled upper secondary schools ................................... 84
4.5 Instrumentation .......................................................................................................... 88
4.5.1 Students’ questionnaire ...................................................................................... 88
4.5.2 School checklist .................................................................................................. 90
4.6 Variables and their measures ..................................................................................... 90
4.6.1 Dependent variables ........................................................................................... 90
4.6.2 Independent variables ......................................................................................... 90
4.6.2.1 Time-constant covariates (TCCs) ............................................................... 91
4.6.2.1.1 Variables at the individual level ................................................................ 91
4.6.2.1.2 Variables at the family level ...................................................................... 91
4.6.2.1.3 Variables at the school level ...................................................................... 91
4.6.2.2 Time-varying covariates (TVCs) ................................................................ 92
4.6.2.2.1 Variables at the individual level ................................................................ 92
4.6.2.2.2 Variables at the family level ...................................................................... 95
4.6.2.2.3 Variables at the school level ...................................................................... 96
4.7 Observation period and interval ................................................................................ 98
4.8 Data collection procedure .......................................................................................... 99
4.9 Data analysis .............................................................................................................. 99
4.9.1 Data processing .................................................................................................. 99
4.9.2 Overall data analysis ........................................................................................ 100
4.10 Qualitative design and methods ............................................................................... 101
xiv
4.10.1 Samples and sampling ...................................................................................... 101
4.10.2 Qualitative interview instrument ...................................................................... 102
4.10.3 Qualitative data collection ................................................................................ 102
4.10.4 Qualitative data analysis and interpretation ..................................................... 103
4.11 Analytical framework of the current study .............................................................. 105
CHAPTER FIVE : CHOICE OF THE SCIENCE TRACK: FINDING I .............................. 106
5.1 Method for RQ 1 ...................................................................................................... 106
5.1.1 Samples ............................................................................................................ 106
5.1.2 Data analysis method ....................................................................................... 106
5.2 Results of RQ 1 ........................................................................................................ 109
5.2.1 Descriptive results ............................................................................................ 109
5.2.2 Interpretation and overall fit of the model ....................................................... 112
5.2.3 Factors influencing upper secondary school students’ choice of the science track
.......................................................................................................................... 114
5.2.3.1 Individual-level factors ............................................................................. 114
5.2.3.2 Family factors ........................................................................................... 119
5.2.3.3 School factors ............................................................................................ 120
5.3 Discussion of key themes for RQ 1 ......................................................................... 121
5.3.1 The influence of academic preparedness ......................................................... 121
5.3.2 The influence of attitudes towards science ...................................................... 123
5.3.3 Gender: A contrasting perspective ................................................................... 124
5.3.4 The crucial role of the family environment ...................................................... 125
5.3.5 Geographical area ............................................................................................. 126
5.4 Concluding remarks ................................................................................................. 127
CHAPTER SIX : TRENDS AND PATTERNS OF TIME-VARYING COVARIATES:
FINDING II ............................................................................................................................ 128
6.1 Method for RQ 2 ...................................................................................................... 128
6.1.1 Samples ............................................................................................................ 128
6.1.2 Data analysis method ....................................................................................... 129
6.2 Trends and patterns: Observation 1 ......................................................................... 130
6.2.1 Trends of time-varying covariates: Observation 1 ........................................... 130
6.2.2 Patterns of time-varying covariates: Observation 1 ......................................... 132
xv
6.2.2.1 Patterns across gender ............................................................................... 132
6.2.2.2 Patterns across school location ................................................................. 133
6.2.2.3 Patterns across study tracks ...................................................................... 136
6.3 Trends and patterns: Observation 2 ......................................................................... 139
6.3.1 Trends of time-varying covariates: Observation 2 ........................................... 139
6.3.2 Patterns of time-varying covariates: Observation 2 ......................................... 140
6.3.2.1 Patterns across gender ............................................................................... 141
6.3.2.2 Patterns across school location ................................................................. 142
6.3.2.3 Patterns across study tracks ...................................................................... 144
6.4 Trends and patterns across the two observations ..................................................... 146
6.4.1 Trends across observations ............................................................................... 146
6.4.2 Patterns across observations and gender .......................................................... 147
6.4.3 Patterns across observations and school locations ........................................... 148
6.4.4 Patterns across observations and study tracks .................................................. 150
6.5 Discussion of key themes for RQ 2 ......................................................................... 154
6.5.1 Trends of time-varying covariates .................................................................... 154
6.5.2 Gender perspective ........................................................................................... 157
6.5.3 School location matters .................................................................................... 158
6.5.4 Study track matters, yet it has a small effect .................................................... 164
6.5.5 The effects of tracking across the two observations ........................................ 166
6.6 Concluding remarks ................................................................................................. 170
CHAPTER SEVEN : ASPIRATIONS OF STEM MAJORS: FINDING III ......................... 171
7.1 Method for RQ 3 ...................................................................................................... 171
7.1.1 Samples ............................................................................................................ 171
7.1.2 Data analysis method ....................................................................................... 173
7.2 The effects of tracking and other variables on students’ aspirations of STEM majors .
................................................................................................................................. 177
7.2.1 Descriptive results ............................................................................................ 177
7.2.2 Unconditional (null) model: Only the outcome variable ................................. 180
7.2.3 Random intercepts model: Level-1 predictors (individual and family) ........... 181
7.2.4 The means-as-outcomes model: Level-2 predictors ......................................... 184
7.2.5 The random intercepts and slopes model: Mixed-level predictors .................. 187
7.3 Discussion of key themes for RQ 3 ......................................................................... 191
xvi
7.3.1 Tracking: A negative trend ............................................................................... 191
7.3.2 Interactive science and mathematics lessons really matter .............................. 192
7.3.3 The gender gap still exists in STEM in higher education ................................ 193
7.3.4 Academic achievement still matters ................................................................. 194
7.3.5 Attitudes towards science matter ...................................................................... 195
7.3.6 The role of family encouragement and support in science ............................... 195
7.4 Concluding remarks ................................................................................................. 196
CHAPTER EIGHT : OVERALL DISCUSSION, CONCLUSION, AND IMPLICATIONS
................................................................................................................................................ 197
8.1 Summary of all key findings for each specific question ......................................... 197
8.2 Discussion of key themes responding to the main research objective .................... 199
8.2.1 The claims explaining science track choice among Cambodian students ........ 199
8.2.2 The effects of different tracks on time-varying covariates .............................. 202
8.2.3 What matters most in students’ aspirations of STEM majors .......................... 205
8.2.4 Talking about leaving: Why do science track students leave STEM? ............. 208
8.3 Conclusion ............................................................................................................... 214
8.4 Implications ............................................................................................................. 217
8.5 Further studies ......................................................................................................... 220
REFERENCES ....................................................................................................................... 222
APPENDICES ........................................................................................................................ 243
Appendix 1: STEM categorization and major fields of study ................................................ 243
Appendix 2: Survey questionnaire (English) ......................................................................... 248
Appendix 3: Survey questionnaire (Khmer Translation) ....................................................... 256
Appendix 4: School checklist (English) ................................................................................. 266
Appendix 5: Online semi-structure interview protocol (English) .......................................... 267
Appendix 6: Education system in Cambodia ......................................................................... 269
Appendix 7: Data collection administrative documents ........................................................ 270
Appendix 8: Example list of higher education majors and oriented subjects ........................ 277
Appendix 9: Map of Cambodia and selected research sites ................................................... 278
Appendix 10: Curriculum vitae .............................................................................................. 279
xvii
LIST OF TABLES
Table 3.1: Distribution of subjects and hours of study for grades 4th through 6th .................... 28
Table 3.2: Higher education institutions and their supervising ministries ............................... 30
Table 3.3: Number of HEIs offering STEM-related majors in Cambodia ............................... 33
Table 3.4: Comparison of the focus of the science and social science tracks in traditional
upper secondary school ............................................................................................................ 35
Table 3.5: Distribution of subjects and weekly study hours in resource upper secondary school
.................................................................................................................................................. 36
Table 3.6: Teaching hours for the social science track, the science track, and NGS ............... 38
Table 3.7. Percentage of scholarship students compared to upper secondary school leavers .. 40
Table 3.8: Typologies of curricular differentiation across nations .......................................... 42
Table 3.9: Summaries of prior studies (conducted in Cambodian context) on students’ choice
of major .................................................................................................................................... 64
Table 3.10: Details of the dependent and independent variables ............................................. 68
Table 4.1: Number of grade 12th students and the percentages that passed the baccalaureate
examination in the three sampled provinces ............................................................................ 79
Table 4.2: Description of the quantitative sample sizes ........................................................... 83
Table 4.3: The profiles of the samples by characteristic .......................................................... 84
Table 4.4: Detailed variables covered in the student questionnaire ......................................... 89
Table 4.5: Factor loadings of students’ attitudes towards science ........................................... 93
Table 4.6: List of all variables discussed, specific items on the questionnaire, data type, and
range of responses .................................................................................................................... 97
Table 4.7: Research methods by specific research objectives ............................................... 100
Table 4.8: Demographic information of the interviewees ...................................................... 102
Table 5.1: Methods of estimation for Finding I ..................................................................... 107
Table 5.2: Variables included in the logistic regression model ............................................. 108
Table 5.3: Descriptive results of the variables included in the logistic regression model ..... 110
Table 5.4: Estimation results for upper secondary school students' choice of the science track
................................................................................................................................................ 113
Table 5.5: Individual-level factors predicting students’ choice of the science track ............. 115
Table 5.6: Family-level factors that predicted students’ choice of the science track ............. 119
Table 5.7: Upper secondary school-level factors predicted students’ choice of the science track
................................................................................................................................................ 121
xviii
Table 6.1: Time-varying covariates included in the analysis for Finding II .......................... 129
Table 6.2: Trends of time-varying covariates: Observation 1 ................................................ 131
Table 6.3: Time-varying covariates by gender ....................................................................... 133
Table 6.4: Time-varying covariates by school location ......................................................... 134
Table 6.5: Post-hoc Tukey HSD test on the differences in school location on the constructs
................................................................................................................................................ 135
Table 6.6: Time-varying covariates by track ......................................................................... 137
Table 6.7: Post-hoc Tukey HSD test on the differences in study track on the constructs ..... 138
Table 6.8: Trends of time-varying covariates: Observation 2 ................................................ 139
Table 6.9: Time-varying covariates by gender ....................................................................... 141
Table 6.10: Patterns of time-varying covariates by school location ...................................... 142
Table 6.11: Post-hoc Tukey HSD test on the differences in school location on the constructs
................................................................................................................................................ 143
Table 6.12: Patterns of time-varying covariates by track ....................................................... 145
Table 6.13: Trends of time-varying covariates across the observations ................................ 146
Table 6.14: Trends of time-varying covariates as a function of observation and gender ...... 147
Table 6.15: Patterns of time-varying covariates as a function of observation and school
location ................................................................................................................................... 149
Table 6.16: Trends of time-varying covariates as a function of observation and study track 150
Table 7.1: Details on the interviewees’ chosen majors .......................................................... 172
Table 7.2: Descriptive statistics of the variables included in the HLM analysis ................... 178
Table 7.3: Final estimation of the variance components (intercept, u0) ................................. 180
Table 7.4: Estimation of the random intercept model: Level-1 predictors ............................ 183
Table 7.5: Estimation of the means-as-outcomes model: Level-2 predictors ........................ 185
Table 7.6: The influence of upper secondary school on students’ aspirations of STEM majors
................................................................................................................................................ 187
Table 7.7: Estimation of the random intercepts and slopes model: Mixed-level predictors .. 188
Table 7.8: Hierarchical linear model of students’ aspirations of STEM majors in higher
education ................................................................................................................................ 190
Table 8.1: Reasons science track students gave for pursuing STEM or switching to non-STEM
................................................................................................................................................ 208
xix
LIST OF FIGURES Figure 1.1: Percentage of students in the science and social science tracks in Cambodia’ upper
secondary schools ....................................................................................................................... 4Figure 1.2: Share of graduates in STEM and non-STEM related majors from 2017–2018 ...... 5Figure 1.3: Graphical structure of the dissertation ................................................................... 16Figure 2.1: Synthesis of the conceptual models for choice of major in STEM ....................... 26Figure 3.1: The number of students enrolled in bachelor’s degree programmes in Cambodia 32Figure 3.2: Conceptual framework for the current study ......................................................... 66Figure 3.3: Logical flow from theoretical to conceptual models, literature, and measurement
.................................................................................................................................................. 71Figure 4.1: Methodological framework of the study and its coherence with research questions
.................................................................................................................................................. 75Figure 4.2: Detailed outline of the study design ...................................................................... 77Figure 4.3: Number of grade 11th students in the academic year 2017–2018 .......................... 80Figure 4.4: Percentage of students that graduated from upper secondary school and went on to
higher education in the selected provinces ............................................................................... 81Figure 4.5: Model specification for the analytical framework of the study ........................... 105Figure 5.1: Percentage of students that passed the national exit examination from 2011–2019
................................................................................................................................................ 122Figure 5.2: Trends of attitudes towards science constructs: Observations 1 and 2 ................ 124Figure 6.1: Mean of attitudes towards science constructs in Observation 1 .......................... 131Figure 6.2: Mean of each construct of attitudes towards science in Observation 2 ............... 140Figure 6.3: Percentage of students aged 15 who reach the minimum proficiency level ........ 160Figure 7.1: Percentage of grade 12th students passing the national examination by study track
................................................................................................................................................ 192
xx
“Science, Technology, Engineering, and Mathematics (STEM) professions create,
explain, build, and innovate the world around us. Our nation needs STEM
graduates to become more competitive in the region and the world, most notably
as the country integrates with the ASEAN Economic Community…I encourage
Cambodian students to take a strong interest in these subjects, and parents and
teachers to support students going into STEM majors” “STEM majors are driver
for Cambodia to achieve the economic development in 2030 and 2050.”
H.E. Dr. Hang Chuon Naron (2016)
Minister of Education, Youth and Sport
Kingdom of Cambodia
1
CHAPTER ONE: INTRODUCTION
This study aimed to examine factors that explain Cambodian upper secondary school
students’ choice of the science track as well as the relationship between tracking and other
variables on students’ aspirations of Science, Technology, Engineering, and Mathematics
(STEM) majors in higher education. To understand why it is important to study students’
transition from the science track in upper secondary school to STEM majors in higher
education, it is vital to grasp the current status and issues surrounding STEM enrolment in
Cambodian higher education. This introduction commences with a brief discussion of these
themes. The chapter subsequently elaborates on research problems, significance, research
focuses, definitions of key terms, and the study’s overall organisation. In general, this
introduction section gives a snapshot of the entire study.
1.1 Research background
The Royal Government of Cambodia (RGC) has continued to prioritize capacity building and
human resource development as the first growth rectangle of the Rectangular Strategy Phase
IV (RGC, 2018). The strategic goal of the RGC is to develop a quality, equitable, and
inclusive education system by focusing on science and technology, labour market orientation,
and physical education to support national socio-economic development. In compliance with
this strategy and to ensure consistency in terms of hierarchy, coherence, and synchronisation
with National Strategic Development Plan (NSDP) Updated 2019–2023, and the Industrial
Development Policy 2015-2025 of the Royal Government of Cambodia (RGC, 2019a),
Ministry of Education, Youth and Sport (MoEYS) launched its Education Strategic Plan
(ESP) for 2019–2023, with a continued focus on two medium-term education policy
objectives: (1). Ensure inclusive and equitable quality education and promote life-long
learning opportunities for all and (2). Ensure effective leadership and management of
education officials at all levels (MoEYS, 2019a).
In responding to the strategic objective of the Rectangular Strategy, as the effect of the first
policy objective of ESP, there has been a dramatic increase in the number of students enrolled
in higher education sector. According to the statistics compiled by the Department of Higher
Education (DHE), enrolment rose from 14,778 in academic year 1998–1999 to 179,258 in the
academic year 2018–2019 (MoEYS, 2019b).
2
From the perspective of economic growth, Cambodia has traditionally been an agricultural
society and agricultural development has always been given priority to reduce poverty and
strengthen rural development. However, after being admitted into the Association of Southeast
Asian Nations (ASEAN) in 1999 and becoming a member of the World Trade Organization
(WTO) in 2004, in addition to agriculture, the RGC has come to focus on three additional
pillars: garments, tourism, and construction. Recently, the Fourth Cambodian Economic
Forum on “The Cambodian economy in post-crisis environment: Industrial development
policy options toward a sustainable economic development” strongly emphasized the strategic
vision of the RGC in shifting the country’s economic growth from dependence on agriculture,
garments, tourism, and construction to a broad-based industrial, technology-oriented economy
to help the country to become a higher-middle income nation by 2030 and a high-income state
by 2050 (RGC, 2015; 2018; 2019b).
Science, Technology, Engineering, and Mathematics (STEM) disciplines, without question,
are crucial to maintaining the country’s global competitiveness. STEM fields are receiving
national and international attentions, as they are the foundation for partnerships and alliances
in the global economy. In this sense, post-secondary education is necessary to achieve desired
levels of competency and efficiency in STEM fields (Means et al., 2018; Moakler Jr & Kim,
2014; Owens, Shelton, Bloom, & Cavil, 2012; Wang, 2013). The demand for graduates in
STEM fields around the world has risen at a relatively rapid rate. Cambodia is no exception.
As stated, one of the primary aims of the RGC’s Rectangular Strategy Phase IV is to
strengthen and enhance education, science and technology and technical training to support
Cambodia’s new economic growth during the Fourth Industrial Revolution (also called
Industry 4.0) (RGC, 2013, 2018). In line with this, human resource in STEM fields is vital.
STEM graduates create, explain, build and innovate the world around us. Thus, Cambodia
needs more young people who are skilled and qualified in these subjects to develop the
Kingdom human resources, economy, and to drive its development. The nation critically
needs STEM graduates to become more competitive in the region and the world, most notably
as the country integrates into the ASEAN Economic Community. Science and technology will
be indispensable to the government’s New Growth Strategy and Cambodia’s long-term vision
(British Embassy, 2016; RGC, 2015, 2018). According to the Cambodia Development
Resource Institute (CDRI, 2015) and the Japan International Cooperation Agency (JICA,
2016), in order to maintain the country’s gross domestic product (GDP) growth of 6% – 8%
between now and 2020 Cambodia would need about 35,000 engineers and another 46,000
3
technicians. Furthermore, as reported by the National Employment Agency (NEA, 2018), the
number of employment opportunities for graduates in technical and scientific realms is very
high and expected to increase significantly. To serve industrial needs, this is true not only for
those who have a lot of experience but also for fresh graduates. From a broader perspective,
based on a survey by the World Economic Forum (WEF) on employment opportunities from
2015–2020, conducted in 15 developed and developing countries, in fields such as
architecture, engineering, and computer science human resource will be in great demand in
the coming year during Industry 4.0 (CDRI, 2015; WEF, 2018).
Accordingly, MoEYS developed its Science, Technology, Engineering, and Mathematics
(STEM) Education Policy (MoEYS, 2016a). The policy emphasized that since Cambodia is a
developing country with a growing economy, its inhabitants need to be encouraged to explore
the demand for 21st–century skills and thus produce more human resource in STEM fields in
order to move the economy forward. However, to be more competitive in the region and in
the world, Cambodia still has a great demand for graduates in STEM fields (Asian
Development Bank [ADB], 2011; RCG, 2015; Un & Sok, 2016; UNESCO National
Education Support Strategy [UNESS], 2010). Consequently, MoEYS, as stated in the ESP for
2014–2018, politically aims to increase overall enrolment in STEM fields in both public and
private higher education institutions (MoEYS, 2014a). Notwithstanding, according to the
statistics compiled by DHE and MoEYS, the share of students enrolling in these fields
remains low. In short, according to the CDRI (2015) and MoEYS (2017), despite higher
market demand—which is likely to transform and modernise Cambodia’s industrial sector by
2025—not many students are enrolling in STEM-related fields, but rather non-STEM fields.
To address this issue, several initiatives have been implemented. In order to train competent
professionals in science and mathematics in upper secondary school and to provide more
guided pathways for choosing academic majors in higher education, MoEYS implemented a
tracking system in 2010 (MoEYS, 2010). This bifurcation system requires all 11th grade
students to choose either the science or social science track. While the former focuses on
mathematics and science subjects (physics, chemistry, biology, earth–environmental science),
the latter centres on Khmer literature, history, geography, and moral civics. Statistically, since
the beginning of its implementation, the science track has drawn more students than the social
science track. As shown in Figure 1.1, of the 84,934 upper secondary school students in
4
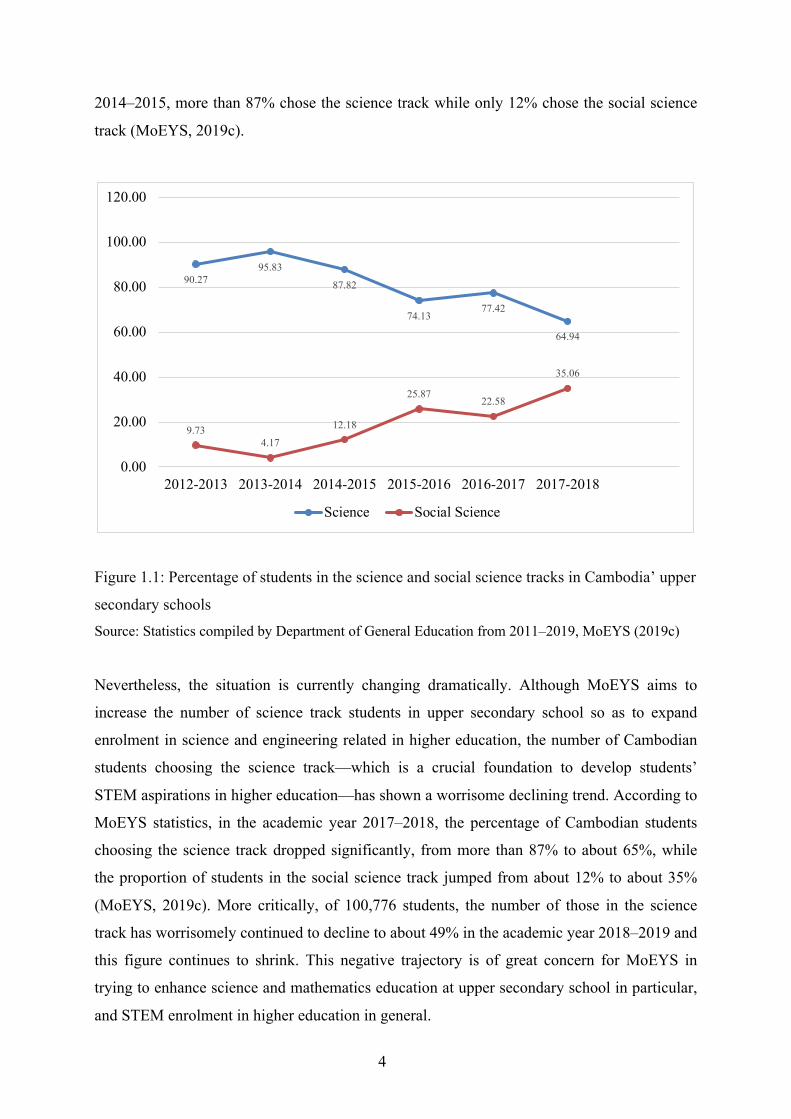
2014–2015, more than 87% chose the science track while only 12% chose the social science
track (MoEYS, 2019c).
Figure 1.1: Percentage of students in the science and social science tracks in Cambodia’ upper
secondary schools Source: Statistics compiled by Department of General Education from 2011–2019, MoEYS (2019c)
Nevertheless, the situation is currently changing dramatically. Although MoEYS aims to
increase the number of science track students in upper secondary school so as to expand
enrolment in science and engineering related in higher education, the number of Cambodian
students choosing the science track—which is a crucial foundation to develop students’
STEM aspirations in higher education—has shown a worrisome declining trend. According to
MoEYS statistics, in the academic year 2017–2018, the percentage of Cambodian students
choosing the science track dropped significantly, from more than 87% to about 65%, while
the proportion of students in the social science track jumped from about 12% to about 35%
(MoEYS, 2019c). More critically, of 100,776 students, the number of those in the science
track has worrisomely continued to decline to about 49% in the academic year 2018–2019 and
this figure continues to shrink. This negative trajectory is of great concern for MoEYS in
trying to enhance science and mathematics education at upper secondary school in particular,
and STEM enrolment in higher education in general.
90.2795.83
87.82
74.1377.42
64.94
9.734.17
12.18
25.8722.58
35.06
0.00
20.00
40.00
60.00
80.00
100.00
120.00
2012-2013 2013-2014 2014-2015 2015-2016 2016-2017 2017-2018
Science Social Science
5
1.2 Research problem
The Cambodia Development Resource Institute (CDRI, 2018) reported that while the number
of those enrolled in higher education institutions rose from 13,461 to 179,256—or from 1% in
1996 to 13.3% of the youth-aged cohort in 2019 (MoEYS, 2020a)—only 27% majored in
science, technology, engineering, and mathematics (STEM). In post-graduate courses, less
than 10% of students major in STEM, which highlights the imbalance in students’ majors and
the mismatch with the share of those in the science track at upper secondary school level
(ADB-ILO, 2015). In line with this, JICA (2016) further emphasized that the lack of STEM-
related graduates is hindering the diversification and modernisation of Cambodia’s industrial
structure in trying to achieve economic growth by 2030 and 2050.
To transform Cambodia from a lower-income to a higher middle-income country, it is crucial
to improve the skills of the existing workforce and those who are prepared to enter the
workplace. Through this mechanism, the number of low-skilled workers would be reduced,
while the low number of medium and highly-skilled workers would rise (RGC, 2017; Un,
2012). In this regard, there is a greater need for medium and highly-skilled STEM graduates
(JICA, 2016). Consequently, although MoEYS has aimed to increase the enrolment in STEM
fields to 32% by 2023 in order to respond to the Industrial Development Policy (IDP) and the
Rectangular Strategy phase IV of the RGC (MoEYS, 2019a), a lower percentage of students
in STEM remains a main obstacle in MoEYS achievement plan for 2014–2018 (RGC, 2019a).
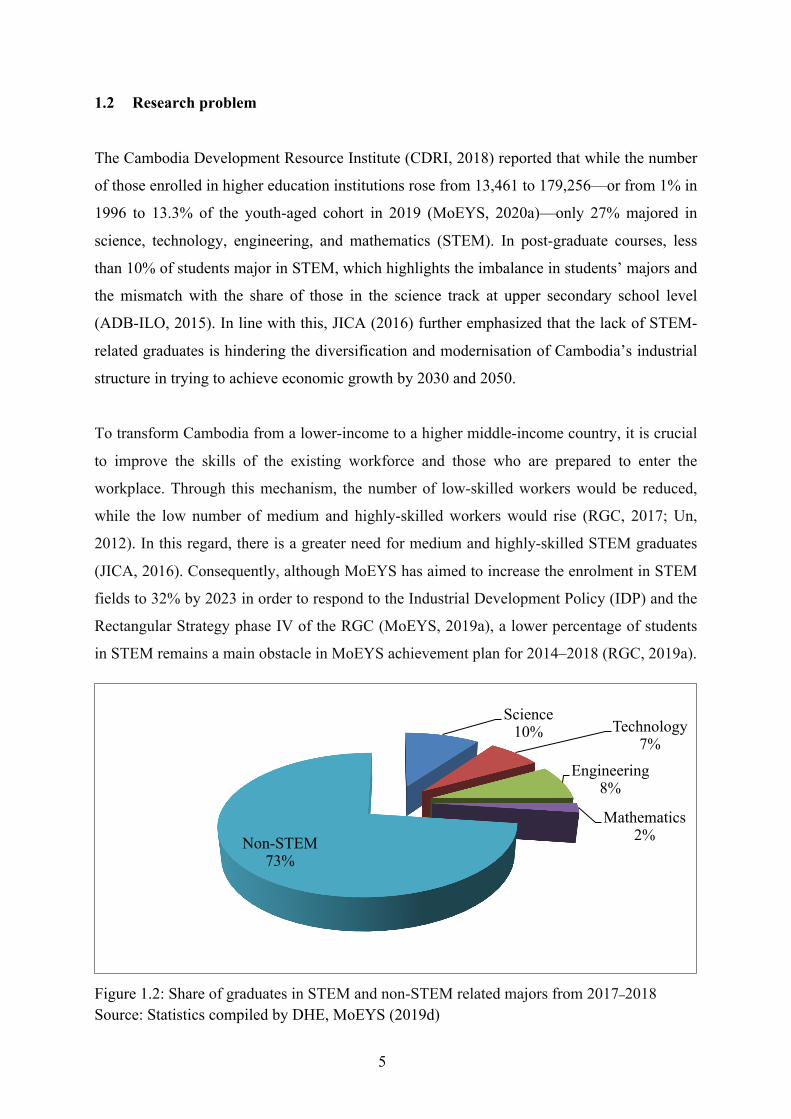
Figure 1.2: Share of graduates in STEM and non-STEM related majors from 2017–2018 Source: Statistics compiled by DHE, MoEYS (2019d)
Science10% Technology
7%Engineering
8%
Mathematics2%Non-STEM
73%
6
However, more seriously, as can be seen in Figure 1.2, there is an imbalance between the
share of those enrolled in STEM and non-STEM fields. While the upper secondary school
level has experienced an alarming-decline in the proportion of students in the science track,
Cambodia’s higher education level has faced mass enrolment in (and oversupply of graduates
in) non-STEM fields such as business, management, economics, humanities, and accounting
(comprising more than 70% of total enrolment) (MoEYS, 2019d). This indicates an unsettling
drop in students’ interest in, and attitudes towards science from upper secondary school to
STEM in higher education.
For decades, concerns have mounted among policy makers and researchers with respect to the
decline of students’ interest in science and their decision to study science/STEM majors
worldwide (e.g., Kinyota, 2013; Li & Kuan, 2018; Myeong & Crawley, 1993; Paik & Shim,
2013; Shim & Paik, 2014; Zuniga, Olson, & Winter, 2005). In particular, researchers have
sought to understand the root causes of the drop in science enrolment and in scientific literacy
(Han & Buchmann, 2016; Kinyota, 2013; Myeong & Crawley, 1993; Shim & Paik, 2014;
Shimpkins, Price, & Garcia, 2015). This is no exception in the Cambodian context. Low
enrolment has a significant impact on the need for human resources in supporting Cambodia’s
current phase of economic development and has given rise to the quest among educators and
scholars to understand students’ choice of major in higher education (e.g., CDRI, 2018; Eam
et al., 2019; Eng & Szmodis, 2016; Kao & Shimizu, 2019; Pen, 2011; Peou, 2017) as well as
how upper secondary school tracking influences one’s choice of majors in higher education.
However, until recently, none of the studies have extensively examined, at the fundamental
level of upper secondary school students’ choice of track (science versus social science).
Little is known about how variables such as individual ability and attitudes, family
background and encouragement, and upper secondary school experience and support
contributed to explain Cambodian students’ choice of the science track and how it affects
students’ academic aspirations in STEM majors in higher education. The paucity of empirical
evidence as such is surprising given the decrease in the number of students in the science
track, and the growing demand for STEM graduates in the developing context like that of
Cambodia in the Industry 4.0 era.
Upper secondary school has been considered as a critical period for attracting students to
science, as it is significantly correlated with their post-secondary educational choices of major
and career interest in STEM (Dustmann, 2004; Kier, Blanchard, Osborne, & Albert, 2014;
7
Kinyota, 2013; Lee, Min, & Mamerow, 2015; Li & Kuan, 2018; Maltese & Tai, 2011; Seymour
& Hewitt, 1997; Shim & Paik, 2014; Shimpkins et al., 2015; Stearns et al., 2016; Unfried,
Faber, Stanhope, & Wiebe, 2015). It is at upper secondary school that students’ academic
choice making in STEM is developed and nurtured. In addition, as some researchers (e.g.,
Myeong & Crawley, 1993; Paik & Shim, 2013; Welch, 1985) maintained, students' choice of
the science track is one of the much-needed research areas within respective context to
investigate the students’ aspiration of STEM majors in higher education. Therefore, the main
purpose of the current study is to investigate factors that explain Cambodian upper secondary
school students’ choice of the science track and the relationship between the tracking system
and other variables that explain their aspirations of STEM majors in higher education.
1.3 Rationale and significance: Responding to the research problem
This current study endeavoured to understand Cambodian upper secondary school science
outcomes in STEM majors. Basically, this study scrutinized the correlates among one’s
choice of the science track, the trends and patterns of time-varying covariates (TVCs) of
students in different tracks, and the association between one’s choice of science track and
other multi-dimensional factors on Cambodian upper secondary school students’ aspirations
of STEM majors in higher education. While some prior studies have handled the problem in
certain ways, the present study is unique in its own critical respects.
• First, the findings from this study contribute significantly to the understanding of the
theoretical gap identified in the extant literature in Southeast Asian countries, as well
as in the Cambodian context. Because the conceptual framework was built from a
multi-dimensional perspective, the current study can provide a comprehensive look
into science outcomes (the aspirations of STEM majors) uniquely among Cambodian
upper secondary school students.
• The study is also unique in its methodology; it is the first study to undertake a panel
investigation of the upper secondary school students’ aspirations of STEM majors in
higher education in Cambodia. Further, since the study was conducted under the
pragmatic philosophical view, the explanatory sequential mixed method nature
provides a holistic, insightful landscape for explaining Cambodian students’ choice
of the science track and its relationship to their aspirations of STEM majors in higher
education.
8
Practically, in response to the discussion of the research problem described above, this current
study is likely to contribute to the process of developing human resources in STEM majors as
well as promoting the relevancy of Cambodia’s higher education sector. The following points
highlight such functional and academic contributions.
• The question of how Cambodian upper secondary school students choose their
majors and why they choose them remains unanswered in most schools and higher
education institutions. Due to the unavailability of adequate information and
effective help, many students may have difficulty in determining their choice of track
and majors. This can be a great waste of resources and time for students, institutions,
and MoEYS. Hence, results of this study could inform policymakers by offering
implications for DHE and the DGE (of MoEYS) for future policy initiatives, in order
to guide upper secondary school students regarding their choice of majors and to
ignite their interests in STEM-related fields.
• The results also provide some guidelines for policy action at upper secondary school
level to help students in term of track selection, major, and career plan. Eng and
Szmodis (2015) and Nugent, Barker, Welch, Grandgenett, and Nelson (2015)
highlighted an imminent need for additional major and career preparations for
students who are about to graduate from upper secondary school.
• The effects of different tracks at upper secondary school in improving students’
outcomes (especially science outcomes) are understudied. Hence, the results would
contribute to practical knowledge of how different choices of tracks influence
students’ science outcomes. Consequently, this will provide suggestions for effective
measures that could be applied to boost students’ science outcomes at upper
secondary school and their aspirations of STEM majors in higher education.
1.4 Research focus: Purpose, questions, and objectives
1.4.1 Research purpose and main questions
The main purpose of this explanatory sequential mixed method study is to examine the effect
of tracking and other multi-dimensional variables that explain Cambodian upper secondary
school students’ aspirations of STEM majors in higher education by holistically
conceptualising diverse dimensions of personal ability and attitudes, family support, and
school-enabling conditions. Therefore, the study basically tried to answer two main questions:
9
What factors influence Cambodian upper secondary school students’ choice of science track?
and are upper secondary school science track and other variables influencing Cambodian
upper secondary school students’ aspirations of STEM majors in higher education?
1.4.2 Specific research questions
To achieve the aforementioned main purpose and main questions, the current study could be
viewed as a combination of three related minor studies. That being said, the specific purpose
of this study was to answer three related Research Questions:
• Research Question 1: What factors (individual, family, and school) are influencing
Cambodian upper secondary school students’ choice of science track?
• Research Question 2: What are the trends and patterns of the time-varying covariates
for students who attended in different tracks at upper secondary school for one
academic year?
• Research Question 3: What are the effects of the tracking system and other variables
on Cambodian upper secondary school students’ aspirations of STEM majors?
Simply put, Research Question 1 focuses on the factors that explain the students’ choice of
science track at upper secondary school from the three dimensions of individual input, family,
and school support. Research Question 2 centres on the trends and patterns of the time-
covarying variables across the period of two repeated measurements as a function of gender,
school location, and study track. Research Question 3 focuses on the effects of tracking and
other multi-dimensional variables (individual, family, and school) on students’ aspirations of
STEM majors in higher education. This question aimed to determine whether the students’
choice of the science track had a significant association with their aspirations of STEM
majors, net of the other dimensional variables, and the effects of the other factors that explain
students’ aspirations of STEM majors in higher education. This last question responds
directly to the main purpose of the current study.
These three research questions are related from two perspectives. From a practical
perspective, the aforementioned research questions are coherently connected in such a way
that, to investigate the relationship between tracking and other multi-dimensional variables
that influenced students’ science outcomes in majoring in STEM majors (Research Question
10
3), it was logically necessary to delve deeply into the trends and patterns of the time-varying
predictors variables across the two observations as a function of gender, school location, and
study track (Research Question 2), and fundamentally the factors that explain the students’
choice of the science track at upper secondary school (Research Question 1). RQ1 also aimed
to determine if future plan in science is associated with students’ choice of science or social
science track. Theoretically, the three research questions logically linked together under a
multi-dimensional framework, conceptualised from the four theoretical and conceptual
models that explore the factors explaining the students’ choice of STEM majors in the
international and local context. After all, this study takes an explanatory sequential mixed
method approaches as it strives to answer the questions of “what factors” and “why”.
1.4.3 Specific research objectives
The specific research objectives herein elaborate the focused aspects of the data analysis that
ultimately answer each of the three research questions. Each research question was
specifically scrutinized based on the features of quantitative trends, quantitative patterns, and
qualitative explanations.
Research Question 1 focuses on investigating upper secondary school students’ choice of
science track. The objective of the first research question was to quantitatively identify the
factors from the three dimensions (individual, family, and school) that explain the students’
decision to enrol in the science or social science track at upper secondary school. Quantitative
Binary Logistics Regression analysis of the individual dimension, family dimension, and
school dimension variables that significantly explain this association was one of the key
methodological objectives of the current study. Follow-up interviews were conducted to
provide further qualitative explanations for the significant factors revealed by the quantitative
data analysis.
Research Question 2 focuse on orientation of individual students towards STEM majors. In
specific terms, the objective of this research question was to measure the quantitative level of
time-varying covariates (e.g., students’ attitudes towards science, self-efficacy, and family
encouragement and supports), as well as general and particular trends (e.g., students’ attitudes
towards science, self-efficacy, and encouragement and support). Another sub-objective of this
question was to investigate the patterns of these variables across individual and institutional
11
demographic variables (the relationship between science outcome orientation variables and
repeated measurements as a function of gender, school location, and study track). That is to
say, the objective of research question 2 was to present the quantitative trends of indicators,
and the quantitative patterns of relationships between indicators and the individual, family,
and institutional demographic variables through a descriptive lens.
Research Question 3 focuses on investigating the effects of choosing the science track and
other variables (individual, family, and school) on upper secondary school students’
aspirations of STEM majors. Hence, the objective of this research question was to
quantitatively measure and investigate if there was any significant association between
science track and students’ aspirations of STEM majors. The specific objective was to
discover the variation in aspirations of STEM majors when students were nested in different
tracks and classroom practices and to thus identify its association with the students’ aspirations
of STEM majors from a multilevel analysis, specifically the Hierarchical Linear Model. In the
same sense as research question 1, follow-up interviews were conducted to provide a deeper
understanding of the significant predictors revealed in the quantitative investigation.
1.5 Originality of the study
The study was designed and conducted to fill the gap in the literature on promoting students’
interest in majoring in STEM in higher education, so as to meet the need for human resource
for Cambodia’s new trend of economic development. To the best of researcher’s knowledge,
this study is the first of its kind to discern the factors that explain Cambodian students’
aspirations of STEM majors prospectively from the science track at upper secondary school.
This study, thus, aims at introducing a novel perspective for reconsidering the important
aspects of various factors, with the ultimate goal of expanding enrolment in STEM majors
from the upper secondary school to higher education nexus.
1.6 Definitions of terms
This study contains numerous terms that frequently used, and to help clarify their use, they
deserved to be defined below. This section offers explanations based on theoretical or
practical definitions, and elaborates on how the terms were defined in the current study so as
to strike a balance between theoretical benchmarks and practical feasibility.
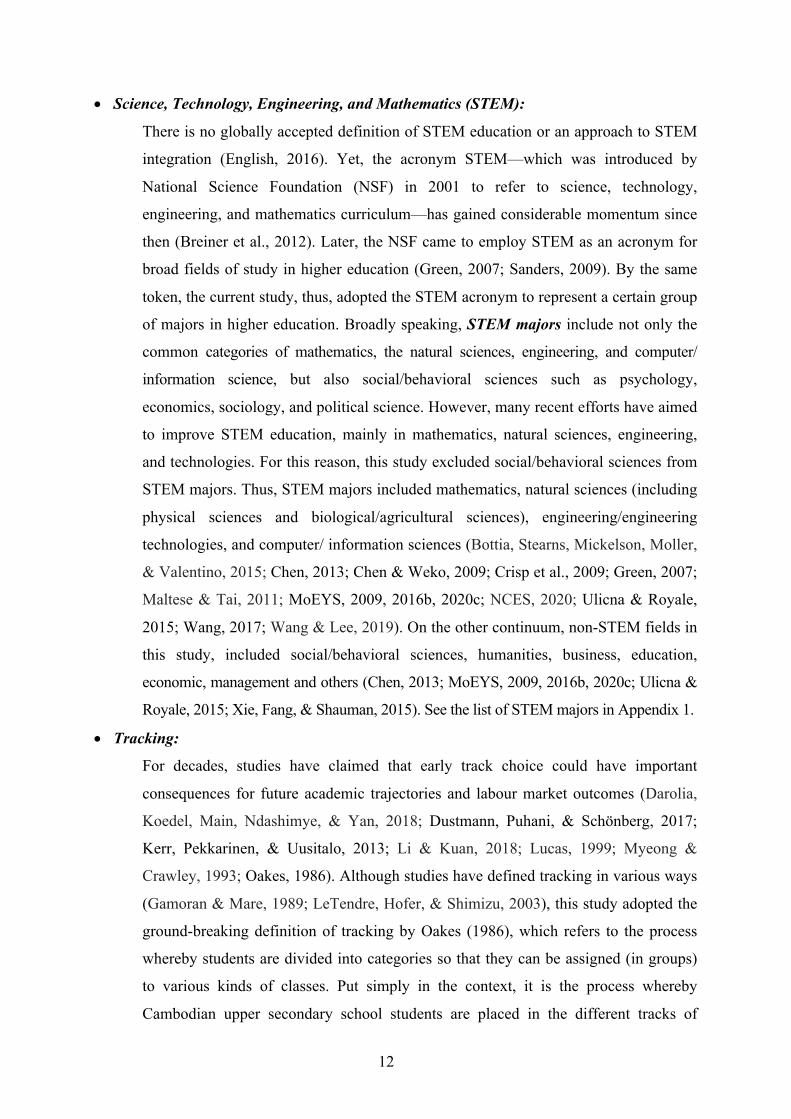
12
• Science, Technology, Engineering, and Mathematics (STEM):
There is no globally accepted definition of STEM education or an approach to STEM
integration (English, 2016). Yet, the acronym STEM—which was introduced by
National Science Foundation (NSF) in 2001 to refer to science, technology,
engineering, and mathematics curriculum—has gained considerable momentum since
then (Breiner et al., 2012). Later, the NSF came to employ STEM as an acronym for
broad fields of study in higher education (Green, 2007; Sanders, 2009). By the same
token, the current study, thus, adopted the STEM acronym to represent a certain group
of majors in higher education. Broadly speaking, STEM majors include not only the
common categories of mathematics, the natural sciences, engineering, and computer/
information science, but also social/behavioral sciences such as psychology,
economics, sociology, and political science. However, many recent efforts have aimed
to improve STEM education, mainly in mathematics, natural sciences, engineering,
and technologies. For this reason, this study excluded social/behavioral sciences from
STEM majors. Thus, STEM majors included mathematics, natural sciences (including
physical sciences and biological/agricultural sciences), engineering/engineering
technologies, and computer/ information sciences (Bottia, Stearns, Mickelson, Moller,
& Valentino, 2015; Chen, 2013; Chen & Weko, 2009; Crisp et al., 2009; Green, 2007;
Maltese & Tai, 2011; MoEYS, 2009, 2016b, 2020c; NCES, 2020; Ulicna & Royale,
2015; Wang, 2017; Wang & Lee, 2019). On the other continuum, non-STEM fields in
this study, included social/behavioral sciences, humanities, business, education,
economic, management and others (Chen, 2013; MoEYS, 2009, 2016b, 2020c; Ulicna &
Royale, 2015; Xie, Fang, & Shauman, 2015). See the list of STEM majors in Appendix 1.
• Tracking:
For decades, studies have claimed that early track choice could have important
consequences for future academic trajectories and labour market outcomes (Darolia,
Koedel, Main, Ndashimye, & Yan, 2018; Dustmann, Puhani, & Schönberg, 2017;
Kerr, Pekkarinen, & Uusitalo, 2013; Li & Kuan, 2018; Lucas, 1999; Myeong &
Crawley, 1993; Oakes, 1986). Although studies have defined tracking in various ways
(Gamoran & Mare, 1989; LeTendre, Hofer, & Shimizu, 2003), this study adopted the
ground-breaking definition of tracking by Oakes (1986), which refers to the process
whereby students are divided into categories so that they can be assigned (in groups)
to various kinds of classes. Put simply in the context, it is the process whereby
Cambodian upper secondary school students are placed in the different tracks of
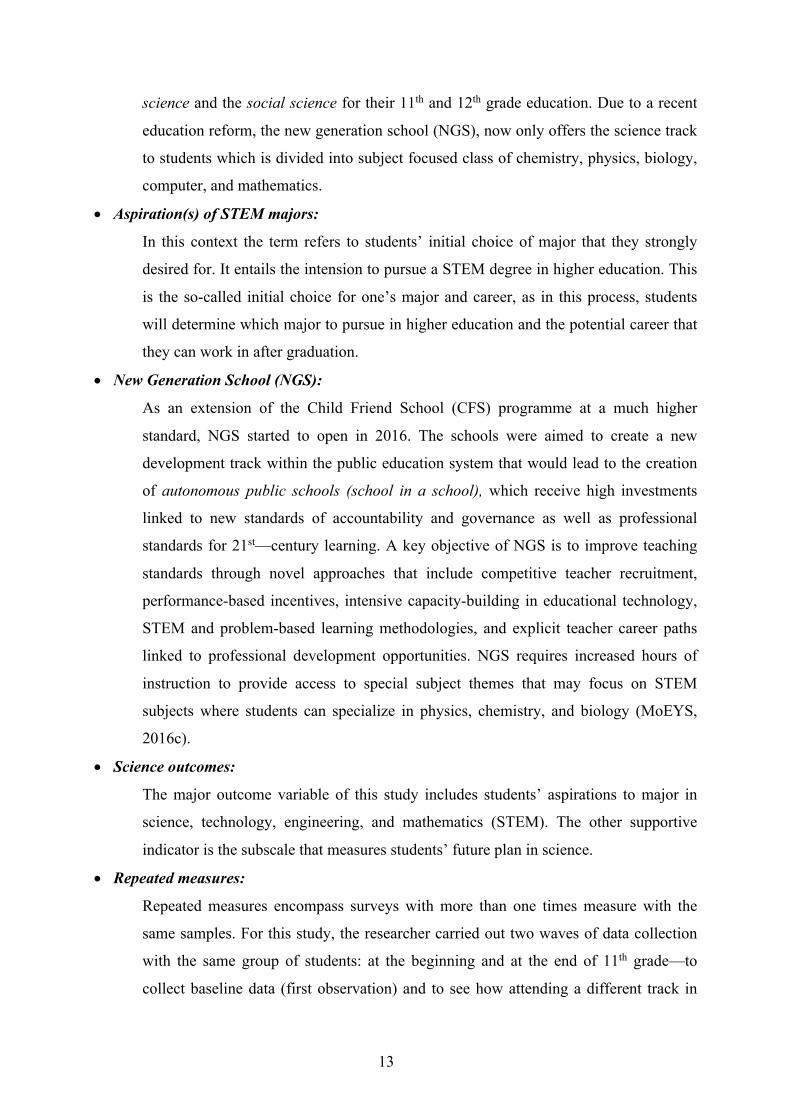
13
science and the social science for their 11th and 12th grade education. Due to a recent
education reform, the new generation school (NGS), now only offers the science track
to students which is divided into subject focused class of chemistry, physics, biology,
computer, and mathematics.
• Aspiration(s) of STEM majors:
In this context the term refers to students’ initial choice of major that they strongly
desired for. It entails the intension to pursue a STEM degree in higher education. This
is the so-called initial choice for one’s major and career, as in this process, students
will determine which major to pursue in higher education and the potential career that
they can work in after graduation.
• New Generation School (NGS):
As an extension of the Child Friend School (CFS) programme at a much higher
standard, NGS started to open in 2016. The schools were aimed to create a new
development track within the public education system that would lead to the creation
of autonomous public schools (school in a school), which receive high investments
linked to new standards of accountability and governance as well as professional
standards for 21st—century learning. A key objective of NGS is to improve teaching
standards through novel approaches that include competitive teacher recruitment,
performance-based incentives, intensive capacity-building in educational technology,
STEM and problem-based learning methodologies, and explicit teacher career paths
linked to professional development opportunities. NGS requires increased hours of
instruction to provide access to special subject themes that may focus on STEM
subjects where students can specialize in physics, chemistry, and biology (MoEYS,
2016c).
• Science outcomes:
The major outcome variable of this study includes students’ aspirations to major in
science, technology, engineering, and mathematics (STEM). The other supportive
indicator is the subscale that measures students’ future plan in science.
• Repeated measures:
Repeated measures encompass surveys with more than one times measure with the
same samples. For this study, the researcher carried out two waves of data collection
with the same group of students: at the beginning and at the end of 11th grade—to
collect baseline data (first observation) and to see how attending a different track in
14
11th grade affected the students’ science outcomes—end of grade 11th (second
observation). Six months transpired between the first observation and the second one.
There were two main justifications for setting this span. First, the period was
consistent with the Cambodian academic calendar. Although the school calendar
started on 01st November and ended on 31st August, a greater number of students are
usually absent in the first and the last months. Also, the total time period was designed
in accordance with the researcher’s academic calendar at the university.
1.7 Limitations of the study
The interpretation of the results of this study could be done in light of the following
methodological limitations. First, the academic majors in this study were the aspired majors
students intended to pursue in higher education, not the actual majors they are doing at the
time of the study. In other words, the majors here refer to the intended majors 11th grade
students were applying rather than the final ones. Notwithstanding, this is consistent with
social cognitive career theory (SCCT) in which the behaviour can start with an initial choice
and a final choice (Lent, Brown, & Hackett, 2002). Second, due to time and budget
constraints, the samples for this study were not very big compared other cross-sectional
studies conducted elsewhere that addressed a similar issue. Third, the academic achievement
used in this study was the readily available score, averaged from the targeted school norm-
referenced semester tests scores. The researcher was unable to formulate the test items, which
could have covered all science and social science subjects, but would have consumed much
more class time to conduct the tests. The diversity of scoring from school to school was also a
concern. Nevertheless, the obtained score was standardized into a z-score before carrying out
further analysis. Next, despite the fact that the predictive relationships in this current research
were modeled using an advanced and sophisticated software, the conclusion does not imply
any causality of the relationships embodied in the data. No causality should be inferred from
this study. The experimentation of specific variables would be suggestive of confirming
cause-and-effects relationships. Last but not least, the study explains the factors influencing
upper secondary school students’ aspirations of STEM majors in higher education
predominantly based on quantitative data from the questionnaire survey, which were measured
by multi-item psychometric scales. Research that wholly investigates the issue qualitatively is
needed to gain greater insight into effective teaching and learning practices for the science track
at upper secondary school and their relations with students’ aspirations of STEM majors.
15
1.8 Research ethics
Because this study has a repeated cross-sectional nature, personal data about the sampled
students was gathered. To guarantee research ethics, the study took the following measures.
First, researcher sent the permission letter from the Department of Higher Education
requesting for permission to conduct the field research study to get approval from the targeted
schools. The survey was conducted after receiving the authorization from each school.
Second, since the study also collected data on the students’ academic achievement, the
researcher obtained approval from the school principals as well as from each student that
participated. In this token, the researcher asked the students to voluntarily sign the informed
consent forms. The study excluded questionnaires from the students who did not sign it. Thus,
participation was completely voluntarily. Students who voluntarily participated in the first
and the second waves of data collection could drop out at anytime. Also, the researcher gave
the students a 10-minute instruction on the purpose, the how, and the possible benefits they
might gain from this study before they completed the survey questionnaire. Fourth, to keep
track of the selected samples, the study used name tags with personal information as the cover
page of the questionnaire (please refer to Appendix 2). After the researcher coded the
questionnaire, the name tags were then removed from the questionnaires, and confidentially
kept in a safe envelope so that no personal identity of the participating students could be
recognised. Fifth, the dataset was kept secured and accessed by only the researcher and only
used for the current study.
1.9 Structure of the dissertation
The whole dissertation is segmented into eight chapters. Each chapter discussed on related
topics. Chapter One highlights the problem, the significance, and purposes of the research,
and presents the coherence of the study’s three research questions and how they were
investigated. It also defines several important key terms to facilitate readers’ understanding.
Chapter Two proceeds to discuss and synthesize the extant theoretical foundations of
students’ enrolment into higher education in general, and the theoretical and conceptual
models for students’ choice of STEM majors in higher education in particular. This chapter
aims at drawing the conceptual constructs and dimensions to be employed in the current
study. Chapter Three begins with an overview of Cambodia’s general and higher education as
well as recent reforms, especially on science education enhancement so as to increase
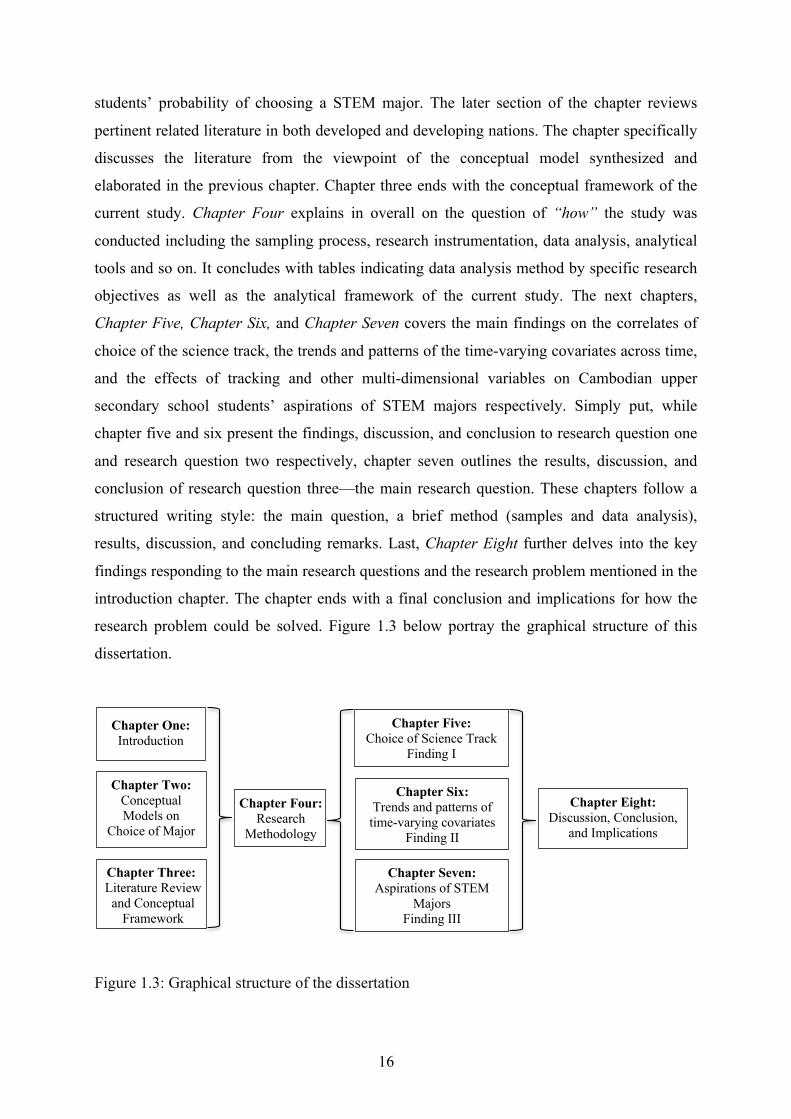
16
students’ probability of choosing a STEM major. The later section of the chapter reviews
pertinent related literature in both developed and developing nations. The chapter specifically
discusses the literature from the viewpoint of the conceptual model synthesized and
elaborated in the previous chapter. Chapter three ends with the conceptual framework of the
current study. Chapter Four explains in overall on the question of “how” the study was
conducted including the sampling process, research instrumentation, data analysis, analytical
tools and so on. It concludes with tables indicating data analysis method by specific research
objectives as well as the analytical framework of the current study. The next chapters,
Chapter Five, Chapter Six, and Chapter Seven covers the main findings on the correlates of
choice of the science track, the trends and patterns of the time-varying covariates across time,
and the effects of tracking and other multi-dimensional variables on Cambodian upper
secondary school students’ aspirations of STEM majors respectively. Simply put, while
chapter five and six present the findings, discussion, and conclusion to research question one
and research question two respectively, chapter seven outlines the results, discussion, and
conclusion of research question three—the main research question. These chapters follow a
structured writing style: the main question, a brief method (samples and data analysis),
results, discussion, and concluding remarks. Last, Chapter Eight further delves into the key
findings responding to the main research questions and the research problem mentioned in the
introduction chapter. The chapter ends with a final conclusion and implications for how the
research problem could be solved. Figure 1.3 below portray the graphical structure of this
dissertation.
Figure 1.3: Graphical structure of the dissertation
Chapter One: Introduction
Chapter Two: Conceptual Models on
Choice of Major
Chapter Four: Research
Methodology
Chapter Three: Literature Review and Conceptual
Framework
Chapter Five: Choice of Science Track
Finding I
Chapter Six: Trends and patterns of time-varying covariates
Finding II
Chapter Seven: Aspirations of STEM
Majors Finding III
Chapter Eight: Discussion, Conclusion,
and Implications
17
CHAPTER TWO: CONCEPTUAL MODELS FOR CHOICE OF ACADEMIC
MAJOR
This chapter synthesizes the extant theoretical foundations of students’ choice of majors in
higher education general, and theoretical and conceptual models for students’ choice of
STEM major in particular. The chapter begins with the bigger theoretical foundations of
students’ choice of major in higher education, then proceeds to the nuances of the models
employed to investigate one’s choice of STEM major in higher education. The chapter
concludes with a synthesis of the discussion on the conceptual models, and draws on the
dimensions and constructs covered in the conceptual framework of the current study.
2.1 Theoretical orientation
2.1.1 The theoretical foundations for one’s choice of majors in higher education
This study employed three vital theoretical foundations to understand the students’ choice of
major in higher education: Holland’s vocational choice theory, rational choice theory, and
human capital theory. First, Holland’s vocational choice theory, a combination of
psychological and sociological components, argues that students choose study fields based
upon their own personality type: realistic, artistic, investigative, social, enterprising, or
conventional (RAISEC) (Furnham, 2001; Holland, 1959; Holland, 1966). People with
different personality types possess different attitudes, interests, and competencies. The salient
difference between Holland’s vocational choice theory and the psychological perspective on
decision-making is that Holland’s theory connects individual personalities with the
environment in which people find themselves. People do best in an environment where their
competencies, skills, and interests are valued, and preferred activities are rewarded (Arnold,
2004; Hogan & Blake, 1999; Holland, 1959). Moreover, when making a vocational choice, a
person is the product of the interactions between his/her unique heredity and various cultural
and personal forces, including parents and the physical environment. Similarly, the theory
links psychological factors (e.g., students’ personality types) to create a model of person-
environment fit that can be used to explain students’ selection of academic majors in college
(Smart, Feldman, & Ethington, 2000). Both psychological and sociological interpretations of
Holland’s theory are significantly needed to grasp students’ expectations and experiences
(Pike, 2006). Positively, because its emphasizes the interactions between individuals and the
environment, Holland’s vocational choice theory has been widely adopted for investigating
18
students’ choice of major and occupation among certain student populations, such as those at
selective liberal arts colleges (Arnold, 2004; Furnham, 2001; Porter & Umbach, 2006).
Despite considerable applicability, Holland’s theory does have limitations. Leong, Austin,
Sekaran, and Komarraju (1998) asserted that students’ other demographic characteristics
including socio-economic status (SES) might also have a bearing on students’ choice of
major. In this regard, the influence of these factor—as well as possible interactions between
person-environment congruence and educational, social, and economic factors—should not be
ignored when examining the mechanism underlying one’s choice of college major.
Nevertheless, these aspects have been the pitfalls of Holland’s theory (Nui, 2017).
Secondly, while Holland’s vocational choice theory is rooted in a psychological perspective,
rational choice theory stems from economics and sociology. As such, rational choice theory
maintains that individuals act rationally by calculating the costs and benefits of an action
before deciding what to do (Scott, 2000; Sianou-Kyrgioy, 2010). Individuals are motivated by
their own preferences, yet, also acted within given constraints. They make decisions in
relation to both their preferences and the means for reaching their goals. At the simplest level,
since it is impossible for individuals to achieve various things they desire, they must also
make choices in relation to both their goals and the means for attaining them. Hence,
individuals must anticipate the outcomes of diverse courses of action and calculate one which
will be best for them (Hechter & Kanazawa, 1997; Scott, 2000). Rational choice theory has
been applied in educational research to scrutinize students’ decision-making process and the
different types of participation in higher education among students of varying social classes
(Nui, 2013). Individuals anticipate the outcomes of alternative options in choosing their
majors and determine the one that will benefit them the most. Rational individuals choose the
alternative that is most likely to give them the greatest satisfaction. Despite this power, the
term “rationality” is not defined by that theory. Therefore, the meaning has been left open to
interpretations, which may lead to doubt about validity of the theory in explaining students’
behaviours, and about its application in research on students’ decision-making process
(DesJardins & Toutkoushian, 2005; Nui, 2013).
Thirdly, although Holland’s vocational choice theory and rational choice theory focused on
the psychological angle and the rationality of different individual preferences as well as
personal and environmental constraints on decision-making, respectively, social and
economic factors that represented personal and environmental constraints remained
19
unexplained (Nui, 2013). Human capital theory, formulated by Schultz in the 1960s (Blaug,
1976), argues that individuals and society derived economic benefits from investing in higher
education (Olaniyan & Okemakinde, 2008; Scott, 2000; Sweetland, 1996; Van der Merwe,
2010). Parents strongly feel that in today’s era of high demand for skilled manpower, the
better the education their children could get, the better are their chances of getting a well-paid
job. Moreover, in the process of investing in getting a better education, social constraints
relative to individual characteristics—such as gender, age, ethnicity, family composition, and
socio-economic status (since they determined one’s position in society)—played an inevitable
role in students’ decision-making process (Brown, 1995; Bucher, 1979; Nui, 2017; Sianou-
Kyrgioy, 2010; Van der Merwe, 2010). Thus, personal preferences and competencies are not
the only determinants of decision-making. These environmental constraints necessitated the
investigation of students’ choice of major from a sociological and economic standpoint. The
returns of a college education that individuals receive depend heavily on factors such as their
family background, demographic characteristics, and even the features of the college they
attended (Nui, 2013; Olaniyan & Okemakinde, 2008). Family income is thus one of the most
important factors in students’ educational choices.
The aforementioned theoretical foundations are primarily grounded in three approaches: (1)
the social psychological perspective, (2) sociological status attainment, and (3) economic
approaches. While the social psychological perspective centres on the influences of the
environment and the person-environment fit, the sociological status attainment approach
focuses on the impact of students’ social background. The economic approach relies on
human capital theory to model students’ decision-making impacted by the rational behaviour
of financial considerations. The study utilized these three approaches to determine the
theoretical and conceptual models for students’ choice of STEM majors. Consequently, the
study derived four main conceptual models—(1) students’ choice of academic major model,
(2) the making of engineering and scientists model, (3) social cognitive career theory, and (4)
the STEM transfer model—which were employed as the framework to identify the constructs
to be investigated in the current study.
The three theoretical foundations are coherently associated with the four theoretical and
conceptual models from two critical angles. First, understanding the mechanism underlying
the students’ decision-making process requires careful consideration of students’ preferences
and social background, environmental constraints, and educational contexts. Despite that in
20
Holland’s vocational choice theory, personal preferences, attitudes, interests, and competence
play a pivotal role in students’ decision-making process—at a time when access and equity in
higher education are yet to be achieved—some students might not be able to afford to make
decisions based on personal interests and preferences. Other factors might be more pressing
and weigh more heavily on their considerations of their educational choices. As a result,
human capital theory and rational choice theory provided a framework for exploring such
factors from an economic perspective. Costs or benefits alone do not determine people’s
choices; rather, it is the balance between the two that play a substantial role. The notion that
students make decisions within contextual constraints recognises the complexity of students’
reality, which goes beyond personal preferences and places students in layers of factors
(including cultural constraints and educational context) that might have bearing on their
educational choices. Consistently, overall, the constructs in the four theoretical and
conceptual models also fall within the multi-dimensional aspects of individual inputs, cultural
influences from one’s family, and support in the education setting (the next section outlines
the details). Therefore, the theoretical foundations as well as the theoretical and conceptual
models indicate the impact of multi-dimensional factors on students’ choice of academic
majors. Secondly, the study employed the three theoretical foundations, as well as the four
theoretical and conceptual models, to investigate the students’ choice of majors in higher
education in general, and their choice of STEM majors in particular. While the synthesis of
the former emphasizes the effects of students’ preferences and social background,
environmental constraint, and educational setting, the synthesis of the latter underscores the
impact of individual inputs, cultural influences from one’s family, and the support in the
education context on students’ choice of major.
2.2 Theoretical and conceptual models for choice of STEM major
The literature has adopted a number of theoretical and conceptual models investigating
students’ choice of STEM major. Based on the previously discussed theoretical foundations
on one’s choice of major in higher education, the theoretical and conceptual models for
STEM enrollment behaviour tend to vary from motivational psychology, to individual
behaviour, to contextual and social behaviour (Lowinger & Song, 2017; Seymour & Hewitt,
1997; Wang, 2013; Wang & Lee, 2019). The following sections discusses the four theoretical
models that have gained much attention and that have been empirically employed in the
studies on students’ choice of science and engineering or STEM majors in higher education.
21
2.2.1 Students’ choice of academic major model
Based on the concept that one’s choice of academic major is a key tenet of both the market
economy and a democratic society, this decision involves matching and combining individual
goals with one’s social role (Hu, 1996). Likewise, the model for students’ choice of academic
major classifies the decision-making process into two main stages: the initial choice and final
choice. The initial choice of college majors is influenced by predisposition (upper secondary
school achievement, socio-economic status, parental income, educational aspirations, etc.),
school attributes (school and class size, geographical location, etc.), significant others,
financial aid, one’s perception of economic factors, and perceived quality of the programme
involved (Hu, 1996). As a consequence, predisposition, perceived quality of the programme,
school attributes, and one’s perception of economic factors will procedurally affect the
students’ final choice. Synthesised with the components from the work of Hossler, Braxton,
and Coopersmith (1989), the students’ choice of academic major model integrates the
variables into four dimensions: the econometrics model, sociological model, consumer model,
and combined models. For instance, the students’ views of economic benefit are drawn from
the econometrics model, while college experience and educational aspirations with different
socio-economic status are derived from the sociological model. Satisfaction of self-fulfillment
for personality is developed based on the consumer model, with multiple stages and a
dynamic process, and the availability of information in the process of decision-making is in
line with the combined model (Hu, 1996). Contextually, the model has been utilised to
examine upper secondary school students’ choice of major (Pen, 2011) and students’ choice
of science and engineering majors in higher education (Kao & Shimizu, 2019). However, the
use of this conceptual model in relation to repeated investigations remains to be researched in
the context.
2.2.2 The making of engineers and scientists model
To scrutinize the factors that affect the students’ choice of science and engineering majors in
higher education, a model for the making of engineers and scientists was developed in 1994.
Based on this model, the development path of students’ choice of science and engineering
majors is influenced by individual inputs (e.g., student potential, ability and personality),
school factors (e.g., school type, curriculum), and external input (e.g., parental advices,
institutional initiatives) (Woolnough, 1994a; Woolnough et al., 1997). Put simply, the
22
essential dimensions of the model’s variables include individual inputs, family environment,
and school supports. In 1997, the model was employed as a framework for a large-scale,
parallel study on factors that influence students’ choice of career in science and engineering in
Australia, Canada, China, England, Japan, and Portugal (Woolnough et al., 1997).
Overall, the model posits that students who transition from the upper secondary school system
to higher education in science and engineering are significantly influenced by their scientific
home background. This includes not only their attitudes towards science, but also their
technical hobbies and skills. Second, from the angle of school support, the teaching practices
of science and mathematics teachers at upper secondary school matter regarding the students’
choice of science and engineering. There is some evidence that the future scientists prefer a
student-centered approach to a more structured, teacher-directed one (Woolnough, 1994a,
Woolnough et al., 1997). Practically speaking, the importance of both the quality of science
teachers and extracurricular activities in science is of the concerns when encouraging students
to major in science and engineering career choice (Woolnough, 1994a, Woolnough et al.,
1997). In sum, the making of engineers and scientists model covers the three crucial aspects
of students’ potential (personal input), school factors, and so-called external input (family and
society). Although the model has not been wisely used, the transitional nature from upper
secondary school to higher education nexus, as well as the consistency with human capital
theory, enhance the applicability for the current study.
2.2.3 Social cognitive career theory (SCCT)
The most fundamental theoretical model, SCCT, has often been employed in research on
students’ choice of STEM major (e.g., Ekmekci, Sahin, & Waxman, 2019; Fouad & Smith,
1996; Lee, Min, & Mamerow, 2015; Lent et al., 2018; Maltese & Tai, 2011; Moakler & Kim,
2014; Navarro, Flores, & Worthington, 2007; Ruse & Xu, 2018; Sahin et al, 2017; Usher &
Pajares, 2009; Wang, 2013; Wang & Lee, 2019). SCCT rooted from the Social Cognitive
Theory of Albert Bandura’s general social cognitive theory (SCT; 1986), and highlights the
interplay between self-referent thought and the social process in guiding human behaviour.
SCCT is cyclical in nature and longitudinal in scope (Lent, Brown, & Hackett, 1994); it has
been immensely heuristic, finding application in a wide range of psychosocial domains
including education, health, management, and affective reactions (Bandura, 1986). SCCT is
also linked to the two branches of career inquiry that evolved from Bandura’s general
23
framework: Krumboltz’s social learning theory of career decision-making (Krumboltz, 1979)
and the self-efficacy construct for women’s career development by Hacket and Betz (1981).
Although SCCT was built on the conceptual foundation of Krumboltz’s theory, it is closely
aligned with the self-efficacy construct by Hackett and Betz (Lent, Brown, & Hackett, 2002).
However, SCCT shares Krumboltz’s emphasis on the learning experiences that shape
people’s occupational interests, values, and choices; and acknowledges the influence of
genetic factors, ability, and environmental conditions in decision-making.
To illustrate the interacting influences among people, their environment, and behaviour,
SCCT contains a bidirectional model of causality of personal attributes (internal cognitive and
affective states and physical characteristics), external environmental factors, and overt
behaviour. In conceptualising personal determinants, SCCT, incorporates three crucial
variables from general Social Cognitive Theory (SCT)—(1) self-efficacy, (2) outcome
expectations, and (3) personal goals—as the basic building blocks (Lent, Brown, & Hackett,
2002). First, self-efficacy concerns with one’s capability to perform a given task (the
mentality of “I can do it”). Self-efficacy is acquired and modified through four primary
sources: (1) personal performance accomplishment, (2) vicarious learning, (3) social
persuasion, and (4) physiological and affective states (Bandura, 2010; Hackett & Betz, 1981).
Secondly, outcome expectations are personal beliefs about the consequences of performing a
particular activity or behaviour. According to Lent et al. (2002), outcome expectations
consisted of extrinsic reinforcements (receiving tangible rewards for performing a task
successfully), self-directed consequences (pride in oneself for mastering a challenging task),
and outcomes derived from the process of completing a given activity. Some scholars claimed
that outcome expectations—which are acquired through learning experiences and probably
influenced by self-efficacy—played a vital role in motivating behaviour. Thirdly, a goal may
be defined as the determination to engage in a specific activity or to influence a future
outcome (Bandura, 1986; Lent et al., 2018).
By and large, SCCT entails a complex interplay of goals, self-efficacy, and outcome
expectations in the self-regulation behavior (Bandura, 1986). For example, self-efficacy and
outcome expectations affect the goals one selects and the efforts expended in one’s pursuit of
them. In return, personal goal influence the development of self-efficacy and outcome
expectations. Put simply, people form goals to sustain or increase their involvement in a
particular activity when they develop an affinity for, for which they are efficacious and expect
24
positive outcomes (Lent et al., 2002; Lent et al., 2018). The goals increase the likelihood of
engaging in the particular activity. Also, along with self-efficacy, outcome expectations
promote particular goals for engaging in the activity. The achievement obtained from
performing it produces crucial feedback that reshapes self-efficacy and outcome expectations,
and in turn, interest in the activity.
Lent et al. (2002) further asserted that SCCT assumes that the basic process is constantly in
motion throughout the lifespan, and that through this process, people develop patterns of
interest in a certain major. Most noteworthy, whether new interests emerge depends less on
exposure and past reinforcement experiences, and more on how people perceive their self-
efficacy and their prospective expectations. In addition, SCCT acknowledges that ability and
value are important parts of the vocational interest. However, the effects primarily occur
through self-efficacy and outcome expectations. SCCT also accounts for other individuals and
contextual influences such as gender, race/ethnicity, physical health or disability, genetic
endowment, and socio-economic conditions (Lent et al., 2002; Wang, 2013) that could
influence the social cognitive variables and to the career development.
In sum, SCCT (which is rooted in social cognitive theory [SCT]), revealed the influences of
self-efficacy, outcome expectations, and interest in choosing a goal. Notwithstanding, since
the theory is not established in a vacuum, several other factors are also taken into account. For
instance, personal input (predisposition, gender, race), background contextual affordances,
and learning experience stemming from Krumboltz’s social learning theory have also been
positioned in the theoretical model of SCCT.
2.2.4 The STEM transfer model
Lastly, in integrating Social Cognitive Career Theory (SCCT) with the extant literature, Wang
(2013, 2017) came up with a theoretical model for STEM majors—the STEM transfer
model—which stresses the secondary and post-secondary context in determining the students’
choice of STEM major. Put simply, the model hypothesizes that students’ intention to major
in STEM is affected by their 12th grade mathematics achievement, their exposure to science
and mathematics courses, and science and mathematics self-efficacy beliefs. In turn, all of
these variables are influenced by prior achievement in (and attitudes towards) science and
mathematics. On the other continuum, entrance into STEM fields is also impacted by post-
25
secondary contextual supports and barriers. To be specific, while post-secondary supports
includes not only academic interactions but also financial aid, college readiness in
mathematics and science, academic aspirations, and enrollment intensity; post-secondary
barriers encompass remediation, and external demands from one’s family (Wang, 2013, 2017;
Wang & Lee, 2019).
Although a number of studies on choosing a STEM major have applied SCCT, and SCCT is
supposedly a valid explanatory framework, such research is largely limited by cross-sectional
and single institution data (Lent et al., 2010). The model for choice of STEM majors stresses
the importance of early mathematics and science experiences, which are vital for future plan
in STEM education (e.g., Adelman, 1999, Kao & Shimizu, 2019; Lowinger & Song, 2017;
Moakler & Kim, 2014; Trusty, 2002). Thus, mathematics and science learning at upper
secondary school, mathematics achievement, and exposure to science courses are linked to the
students’ intention to later specialize in a STEM field. Most noteworthy, these three elements
are shaped by early mathematics achievement and attitudes, especially in light of the
longitudinal and developmental nature of achievement in (and attitudes towards) science and
mathematics (Eccles, 1994; Trusty, 2002). In addition to SCCT, the modified STEM transfer
model includes not only the early preparation (e.g., attitudes towards mathematics and science
in grade 10th and mathematics achievement), but also the exposure to science and mathematics
and secondary and post-secondary contextual supports.
2.3 Synthesis of the four theoretical and conceptual models
Numerous theoretical and conceptual models have been employed to investigate students’
choice of major in STEM in higher education. As framed by theoretical foundations of one’s
choice of major in higher education, the study analyzed and synthesized the previously
described four theoretical and conceptual models. As consequent, Figure 2.1 presents a
synthesis of them so as to draw the conceptual framework that provides the lens of
investigation in the current explanatory study. In a broad sense, this synthesis illustrates the
crucial dimensions and variables underlying each dimension. The study synthesized the
variables in order to give a holistic view of the variables. By and large, the study extracted
and then classified the constructs of each conceptual model into the multi-dimensional
variables of personal or individual input, family influence, and school support. From an
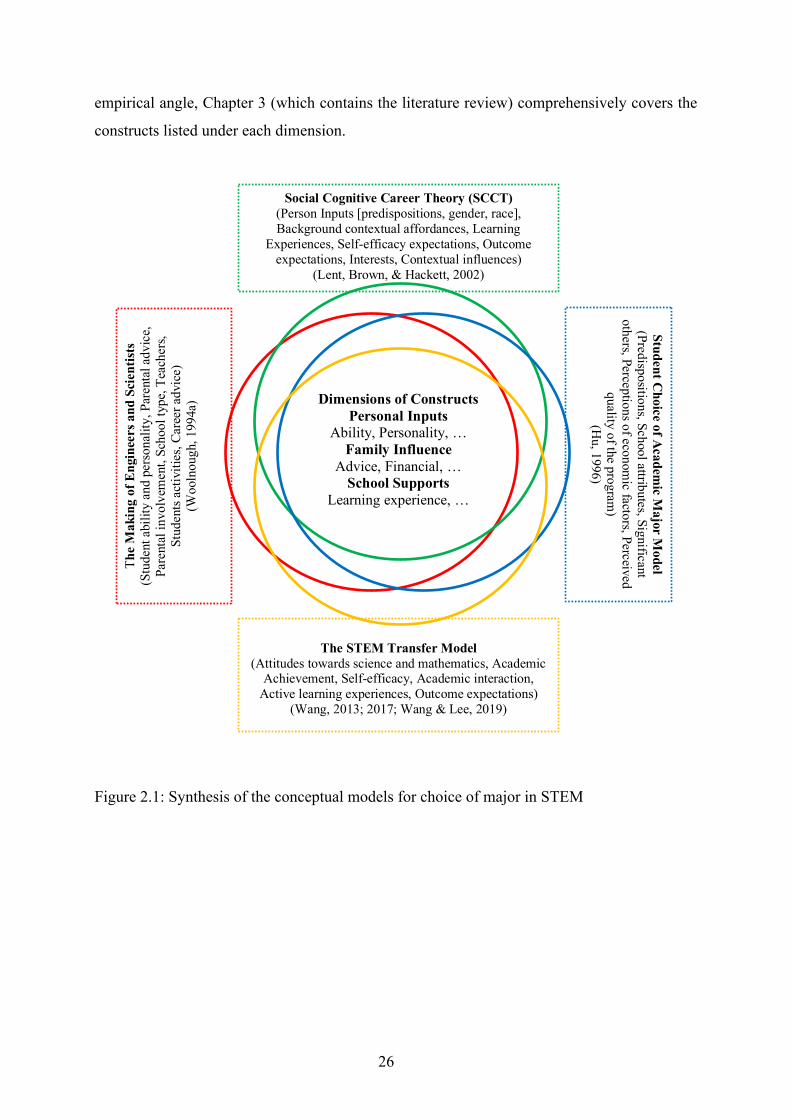
26
Social Cognitive Career Theory (SCCT) (Person Inputs [predispositions, gender, race], Background contextual affordances, Learning
Experiences, Self-efficacy expectations, Outcome expectations, Interests, Contextual influences)
(Lent, Brown, & Hackett, 2002)
The M
akin
g of
Eng
inee
rs a
nd S
cien
tists
(Stu
dent
abi
lity
and
pers
onal
ity, P
aren
tal a
dvic
e, Pa
rent
al in
volv
emen
t, Sc
hool
type
, Tea
cher
s, St
uden
ts ac
tiviti
es, C
aree
r adv
ice)
(W
ooln
ough
, 199
4a)
Student Choice of Academ
ic Major M
odel (Predispositions, School attributes, Significant
others, Perceptions of economic factors, Perceived
quality of the program)
(Hu, 1996)
The STEM Transfer Model
(Attitudes towards science and mathematics, Academic Achievement, Self-efficacy, Academic interaction,
Active learning experiences, Outcome expectations) (Wang, 2013; 2017; Wang & Lee, 2019)
empirical angle, Chapter 3 (which contains the literature review) comprehensively covers the
constructs listed under each dimension.
Figure 2.1: Synthesis of the conceptual models for choice of major in STEM
Dimensions of Constructs Personal Inputs
Ability, Personality, … Family Influence
Advice, Financial, … School Supports
Learning experience, …
27
CHAPTER THREE: LITERATURE REVIEW
This chapter provides an overview of general education and higher education as well as
detailed discussions of factors that empirically explained the students’ choice of STEM
majors. The chapter begins with brief summary of modern general education and higher
education in Cambodia and the country’s educational structure, followed by the academic
transition from upper secondary to higher education, and the admissions system into higher
education. The chapter then describes the tracking system, its form and types, and delves into
the global and contextual perspectives on the empirical evidence for students’ choice of
STEM majors. Further, in synthesis with the initiatives implemented by several developed
countries in promoting students to major in STEM, the chapter elaborates on the evidence-
based variables as both time-invariant predictors and time-varying predictors, based on the
multi-dimensional variables through the lens of the synthesized conceptual model. The
chapter concludes with a recap of the literature to direct the reader toward the conceptual
framework, as well as the indicators and their measurements.
3.1 Cambodia’s general education system
To understand a single educational problems without having grasped its broader context is
somehow misleading. Hence, this section examines the development of Cambodia’s
education system in general and higher education in particular. After its reform from 1996–
1997, the nation’s formal educational structure is formulated based on a “6+3+3”
configuration. This means it takes 12 years to complete one’s general education: six years of
primary school (1st–6th grades) followed by six years of secondary school (7th–12th grades).
Secondary education consists of three years of lower secondary school (7th–9th grades) and
three years of upper secondary school (10th–12th grade). (See Appendix 6 for details.)
Primary school is the first level of education in Cambodia. The curriculum is divided into two
three-year cycles (1st–3rd and 4th–6th grades). Children from the age of six are eligible to enter.
The purpose of the basic education curriculum (1st–3rd grades) is to ensure that every child has
a strong foundation in literacy and mathematics and that children develop their health,
physical appearance, moral understanding, learning skills and life skills. In the first cycle,
pupils study the Khmer language (13 hours/week), mathematics (7 hours/week), science and
the social science (including arts; 3 hours/week), physical and health education (2
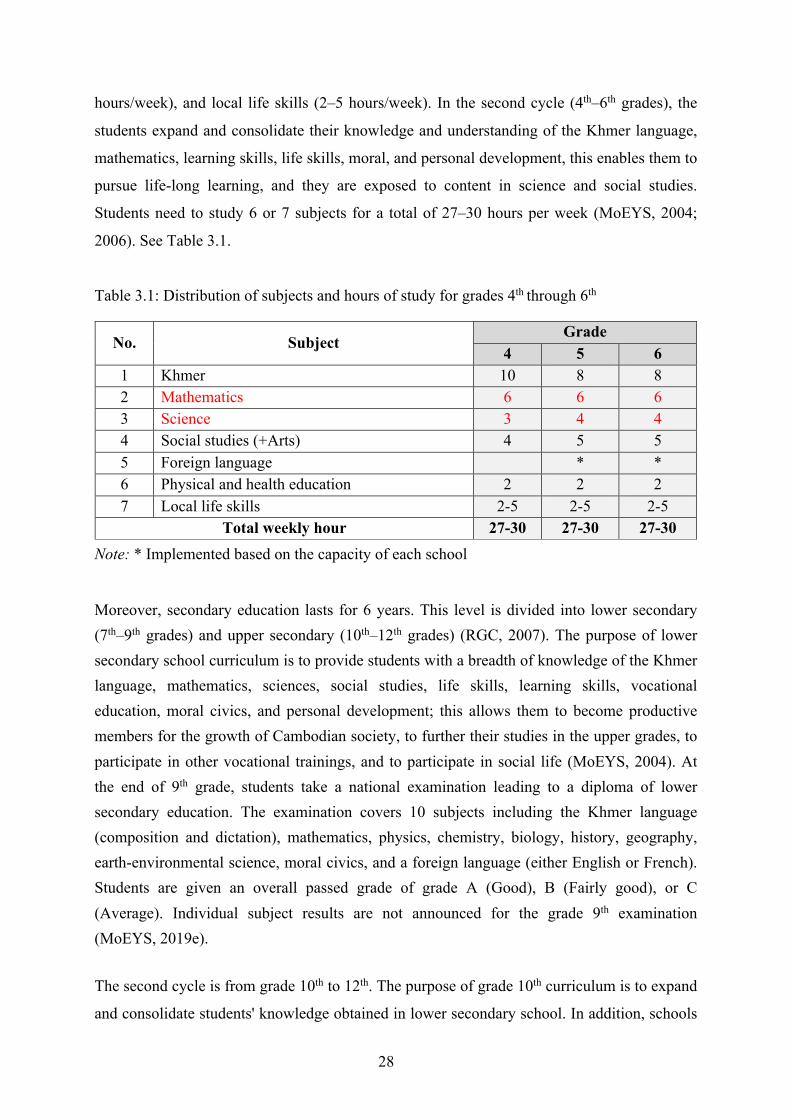
28
hours/week), and local life skills (2–5 hours/week). In the second cycle (4th–6th grades), the
students expand and consolidate their knowledge and understanding of the Khmer language,
mathematics, learning skills, life skills, moral, and personal development, this enables them to
pursue life-long learning, and they are exposed to content in science and social studies.
Students need to study 6 or 7 subjects for a total of 27–30 hours per week (MoEYS, 2004;
2006). See Table 3.1.
Table 3.1: Distribution of subjects and hours of study for grades 4th through 6th
No. Subject Grade
4 5 6 1 Khmer 10 8 8 2 Mathematics 6 6 6 3 Science 3 4 4 4 Social studies (+Arts) 4 5 5 5 Foreign language * * 6 Physical and health education 2 2 2 7 Local life skills 2-5 2-5 2-5
Total weekly hour 27-30 27-30 27-30
Note: * Implemented based on the capacity of each school
Moreover, secondary education lasts for 6 years. This level is divided into lower secondary (7th–9th grades) and upper secondary (10th–12th grades) (RGC, 2007). The purpose of lower secondary school curriculum is to provide students with a breadth of knowledge of the Khmer language, mathematics, sciences, social studies, life skills, learning skills, vocational education, moral civics, and personal development; this allows them to become productive members for the growth of Cambodian society, to further their studies in the upper grades, to participate in other vocational trainings, and to participate in social life (MoEYS, 2004). At the end of 9th grade, students take a national examination leading to a diploma of lower secondary education. The examination covers 10 subjects including the Khmer language (composition and dictation), mathematics, physics, chemistry, biology, history, geography, earth-environmental science, moral civics, and a foreign language (either English or French). Students are given an overall passed grade of grade A (Good), B (Fairly good), or C (Average). Individual subject results are not announced for the grade 9th examination (MoEYS, 2019e).
The second cycle is from grade 10th to 12th. The purpose of grade 10th curriculum is to expand
and consolidate students' knowledge obtained in lower secondary school. In addition, schools
29
must ensure the provision of a significant subject choice advice for students to study in grade
11th and 12th. The career advice provision must start from the beginning of the school year.
Consequently, grade 11th and grade 12th curricula aim to give students the opportunities for:
increased specialization by freely choosing a subject to develop an in-depth knowledge of
particular subjects or to take training-based vocational classes in order to continue on to
higher education, to study vocational subjects, or to participate in their social lives (MoEYS,
2004). The grade 12th examination covers 6 compulsory subjects and 1 lucky-draw selective
subject. In the science track, students take mathematics, physics, chemistry, biology, Khmer
literature, English or French, and one lucky-draw selective social science subject. However,
students in the social science track take Khmer literature, mathematics, history, moral civics,
geography, English or French, and one lucky-draw selective science subject. Students are
awarded an overall grade of A (Excellent), B (Very good), C (Good), D (Fairly good) or E
(Average) and percentile rank. Individual subject results (Grades A–E) are also shown
(MoEYS, 2020b).
3.2 Cambodian higher education
According to Clayton and Yuok (1997) and Sam et al. (2012), due to the pressure from the
West and diminishing support from the (now former) Soviet Union, Vietnam withdrew its
occupation forces from Cambodia in 1989, leaving behind a fragile yet functioning
government. In terms of higher education, the period between the Vietnamese withdrawal and
the United Nations (UN)-supervised election in 1993 was particularly difficult for Cambodian
higher education. Along with troops, Vietnamese educational advisors and professors
returned back to Vietnam, and Soviet professors left shortly after the Soviet Union collapsed.
As a result, in some cases, higher education institutions employed fresh Cambodian graduates
as lecturers. In other cases, some higher education institutions were forced to close. For
example, the Agricultural Institutes was forced to close briefly in 1990, and the Khmer-Soviet
Friendship Higher Technical Institute might have closed if no teachers had returned from the
Soviet Union in 1991 (Ayres, 1999, 2000). This phenomenon has also affected the the current
landscape of higher education enrolment in general and in science and engineering-related
majors in particular.
Consequently, during the transition from 1991–1993, because the government retained
control over the existing educational administration, there were few changes conducted by
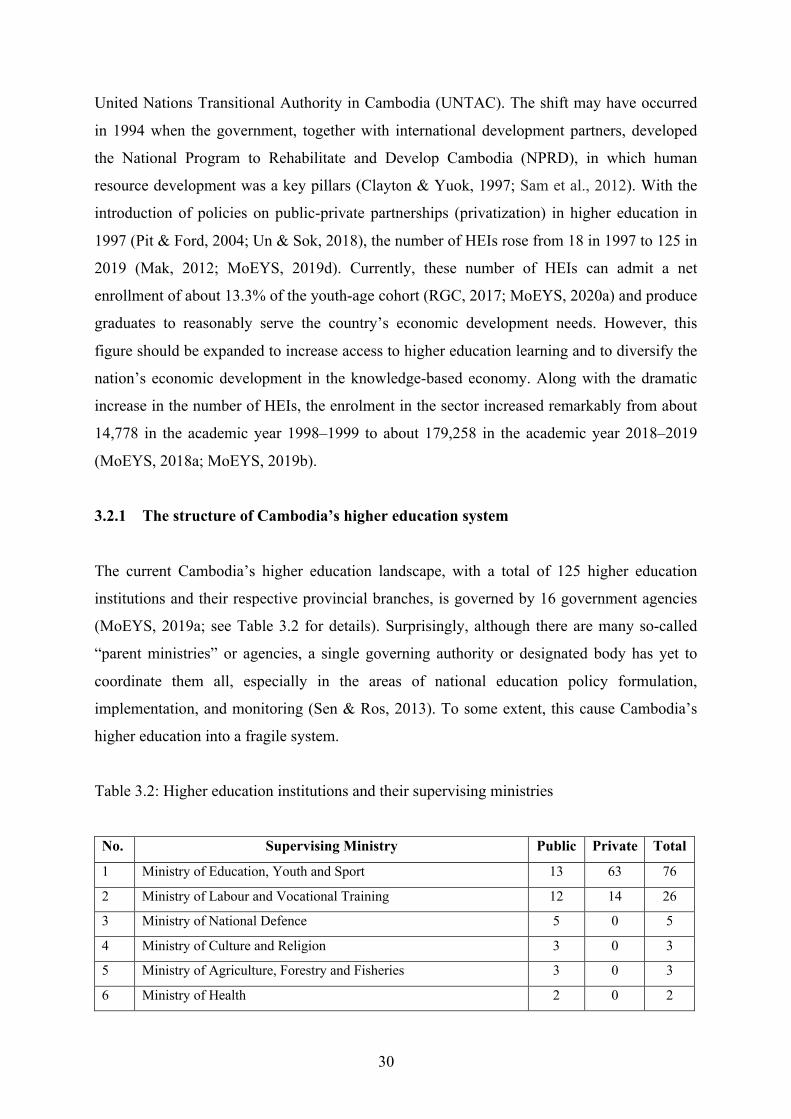
30
United Nations Transitional Authority in Cambodia (UNTAC). The shift may have occurred
in 1994 when the government, together with international development partners, developed
the National Program to Rehabilitate and Develop Cambodia (NPRD), in which human
resource development was a key pillars (Clayton & Yuok, 1997; Sam et al., 2012). With the
introduction of policies on public-private partnerships (privatization) in higher education in
1997 (Pit & Ford, 2004; Un & Sok, 2018), the number of HEIs rose from 18 in 1997 to 125 in
2019 (Mak, 2012; MoEYS, 2019d). Currently, these number of HEIs can admit a net
enrollment of about 13.3% of the youth-age cohort (RGC, 2017; MoEYS, 2020a) and produce
graduates to reasonably serve the country’s economic development needs. However, this
figure should be expanded to increase access to higher education learning and to diversify the
nation’s economic development in the knowledge-based economy. Along with the dramatic
increase in the number of HEIs, the enrolment in the sector increased remarkably from about
14,778 in the academic year 1998–1999 to about 179,258 in the academic year 2018–2019
(MoEYS, 2018a; MoEYS, 2019b).
3.2.1 The structure of Cambodia’s higher education system
The current Cambodia’s higher education landscape, with a total of 125 higher education
institutions and their respective provincial branches, is governed by 16 government agencies
(MoEYS, 2019a; see Table 3.2 for details). Surprisingly, although there are many so-called
“parent ministries” or agencies, a single governing authority or designated body has yet to
coordinate them all, especially in the areas of national education policy formulation,
implementation, and monitoring (Sen & Ros, 2013). To some extent, this cause Cambodia’s
higher education into a fragile system.
Table 3.2: Higher education institutions and their supervising ministries
No. Supervising Ministry Public Private Total 1 Ministry of Education, Youth and Sport 13 63 76
2 Ministry of Labour and Vocational Training 12 14 26
3 Ministry of National Defence 5 0 5
4 Ministry of Culture and Religion 3 0 3
5 Ministry of Agriculture, Forestry and Fisheries 3 0 3
6 Ministry of Health 2 0 2
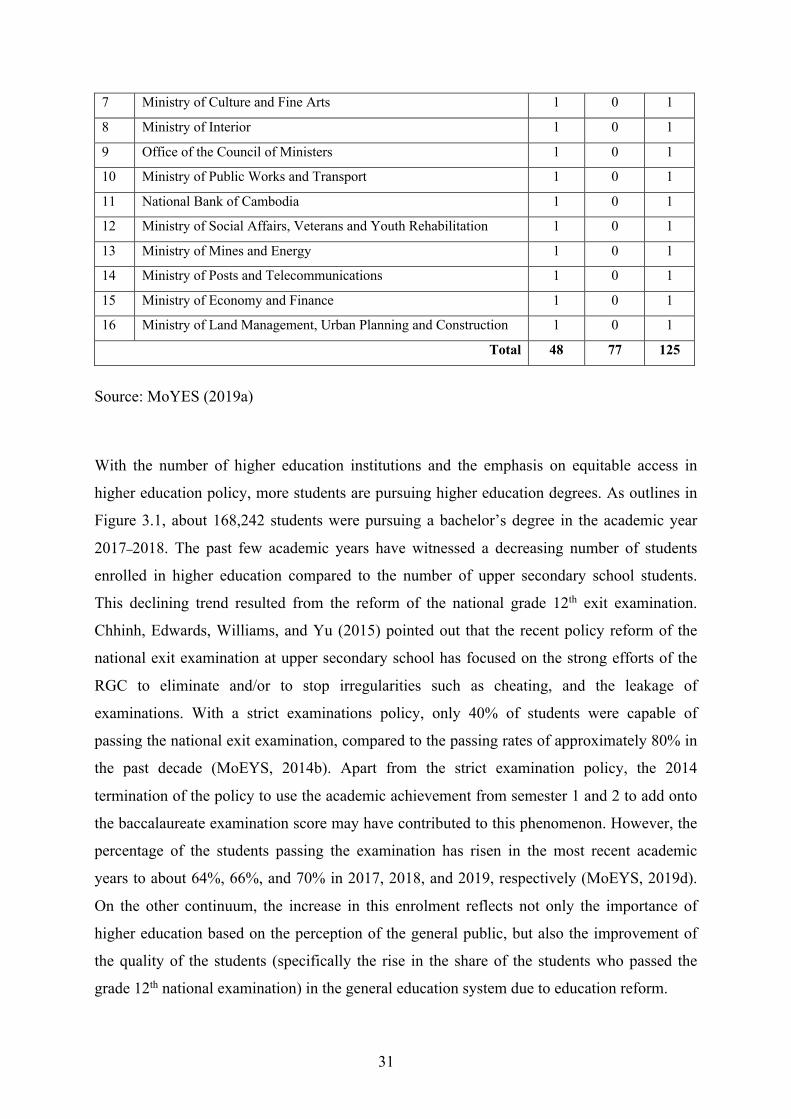
31
7 Ministry of Culture and Fine Arts 1 0 1
8 Ministry of Interior 1 0 1
9 Office of the Council of Ministers 1 0 1
10 Ministry of Public Works and Transport 1 0 1
11 National Bank of Cambodia 1 0 1
12 Ministry of Social Affairs, Veterans and Youth Rehabilitation 1 0 1
13 Ministry of Mines and Energy 1 0 1
14 Ministry of Posts and Telecommunications 1 0 1
15 Ministry of Economy and Finance 1 0 1
16 Ministry of Land Management, Urban Planning and Construction 1 0 1
Total 48 77 125
Source: MoYES (2019a)
With the number of higher education institutions and the emphasis on equitable access in
higher education policy, more students are pursuing higher education degrees. As outlines in
Figure 3.1, about 168,242 students were pursuing a bachelor’s degree in the academic year
2017–2018. The past few academic years have witnessed a decreasing number of students
enrolled in higher education compared to the number of upper secondary school students.
This declining trend resulted from the reform of the national grade 12th exit examination.
Chhinh, Edwards, Williams, and Yu (2015) pointed out that the recent policy reform of the
national exit examination at upper secondary school has focused on the strong efforts of the
RGC to eliminate and/or to stop irregularities such as cheating, and the leakage of
examinations. With a strict examinations policy, only 40% of students were capable of
passing the national exit examination, compared to the passing rates of approximately 80% in
the past decade (MoEYS, 2014b). Apart from the strict examination policy, the 2014
termination of the policy to use the academic achievement from semester 1 and 2 to add onto
the baccalaureate examination score may have contributed to this phenomenon. However, the
percentage of the students passing the examination has risen in the most recent academic
years to about 64%, 66%, and 70% in 2017, 2018, and 2019, respectively (MoEYS, 2019d).
On the other continuum, the increase in this enrolment reflects not only the importance of
higher education based on the perception of the general public, but also the improvement of
the quality of the students (specifically the rise in the share of the students who passed the
grade 12th national examination) in the general education system due to education reform.
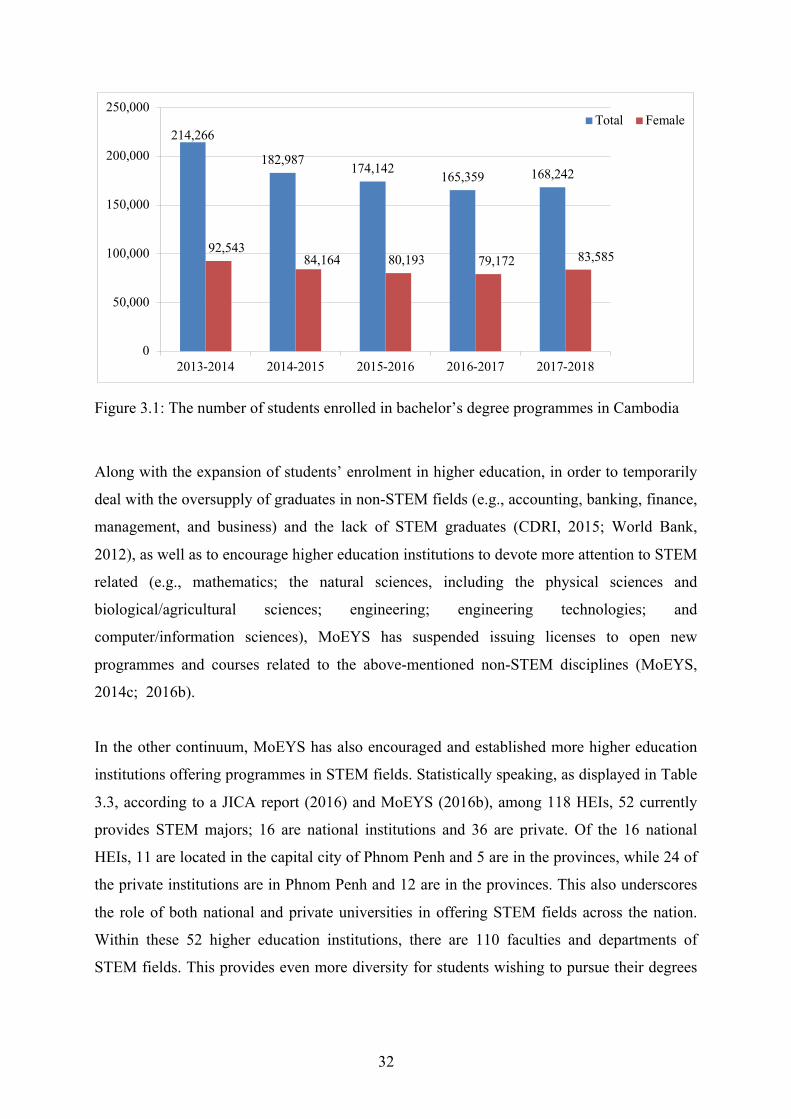
32
Figure 3.1: The number of students enrolled in bachelor’s degree programmes in Cambodia
Along with the expansion of students’ enrolment in higher education, in order to temporarily
deal with the oversupply of graduates in non-STEM fields (e.g., accounting, banking, finance,
management, and business) and the lack of STEM graduates (CDRI, 2015; World Bank,
2012), as well as to encourage higher education institutions to devote more attention to STEM
related (e.g., mathematics; the natural sciences, including the physical sciences and
biological/agricultural sciences; engineering; engineering technologies; and
computer/information sciences), MoEYS has suspended issuing licenses to open new
programmes and courses related to the above-mentioned non-STEM disciplines (MoEYS,
2014c; 2016b).
In the other continuum, MoEYS has also encouraged and established more higher education
institutions offering programmes in STEM fields. Statistically speaking, as displayed in Table
3.3, according to a JICA report (2016) and MoEYS (2016b), among 118 HEIs, 52 currently
provides STEM majors; 16 are national institutions and 36 are private. Of the 16 national
HEIs, 11 are located in the capital city of Phnom Penh and 5 are in the provinces, while 24 of
the private institutions are in Phnom Penh and 12 are in the provinces. This also underscores
the role of both national and private universities in offering STEM fields across the nation.
Within these 52 higher education institutions, there are 110 faculties and departments of
STEM fields. This provides even more diversity for students wishing to pursue their degrees
214,266
182,987 174,142 165,359 168,242
92,54384,164 80,193 79,172 83,585
0
50,000
100,000
150,000
200,000
250,000
2013-2014 2014-2015 2015-2016 2016-2017 2017-2018
Total Female
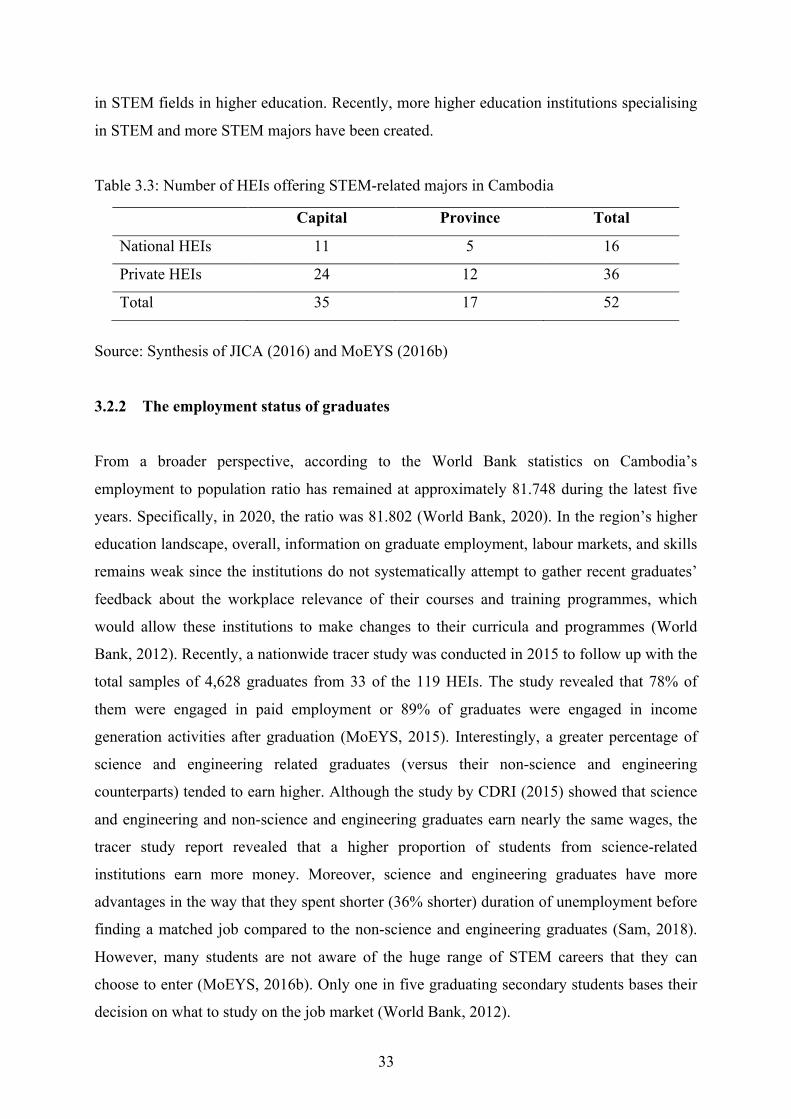
33
in STEM fields in higher education. Recently, more higher education institutions specialising
in STEM and more STEM majors have been created.
Table 3.3: Number of HEIs offering STEM-related majors in Cambodia
Capital Province Total
National HEIs 11 5 16
Private HEIs 24 12 36
Total 35 17 52
Source: Synthesis of JICA (2016) and MoEYS (2016b)
3.2.2 The employment status of graduates
From a broader perspective, according to the World Bank statistics on Cambodia’s
employment to population ratio has remained at approximately 81.748 during the latest five
years. Specifically, in 2020, the ratio was 81.802 (World Bank, 2020). In the region’s higher
education landscape, overall, information on graduate employment, labour markets, and skills
remains weak since the institutions do not systematically attempt to gather recent graduates’
feedback about the workplace relevance of their courses and training programmes, which
would allow these institutions to make changes to their curricula and programmes (World
Bank, 2012). Recently, a nationwide tracer study was conducted in 2015 to follow up with the
total samples of 4,628 graduates from 33 of the 119 HEIs. The study revealed that 78% of
them were engaged in paid employment or 89% of graduates were engaged in income
generation activities after graduation (MoEYS, 2015). Interestingly, a greater percentage of
science and engineering related graduates (versus their non-science and engineering
counterparts) tended to earn higher. Although the study by CDRI (2015) showed that science
and engineering and non-science and engineering graduates earn nearly the same wages, the
tracer study report revealed that a higher proportion of students from science-related
institutions earn more money. Moreover, science and engineering graduates have more
advantages in the way that they spent shorter (36% shorter) duration of unemployment before
finding a matched job compared to the non-science and engineering graduates (Sam, 2018).
However, many students are not aware of the huge range of STEM careers that they can
choose to enter (MoEYS, 2016b). Only one in five graduating secondary students bases their
decision on what to study on the job market (World Bank, 2012).
34
3.2.3 Brief strategies and initiatives towards STEM uptake in higher education
As mentioned, Cambodia’s education system has shifted to the “6-3-3-4” pattern: six years of
primary, three years of lower secondary, three years upper secondary, and four years for a
bachelor’s degree. (see Appendix 6 for details) (MoEYS, 2018a). Higher education studies
consist of a four-year graduate degree (bachelor’s) and two (master’s) and three-year
(doctoral) post-graduate degrees. Also, with the current demand for human resource in STEM
in higher education, a number of policy initiatives have been launched at upper secondary
school to promote students’ uptake from upper secondary school to higher education. Several
key initiatives (including tracking system, NGS, and others) are being implemented. This sub-
section, therefore, delves into such initiatives.
3.2.3.1 Tracking system at Cambodia’s upper secondary school
The purpose of tracking is to help students build strong competence in science and
mathematics at upper secondary school and to provide clearer pathways for them to choose
majors in higher education (MoEYS, 2010). This bifurcation takes place at the end of grade
10th (the first year of upper secondary school) so that all 11th graders are enrolling in either the
science or social science track. The key differences between these two tracks lie in the core
subjects, the extent of the emphasis place on the curriculum content, the number of teaching
hours, and the subjects and the scoring method of the national exit examination. While the
former track centres on science subjects (physics, chemistry, biology, earth-environmental
science) and mathematics, the latter focuses on Khmer literature, history, geography, and
moral civics. For example, in the science track, the learning hours is five sessions/hours per
week for mathematics and three hours for each science subjects with the total scores of 125
and 75 for mathematics and each science subject, respectively. By contrast, in the social
science track, three and two sessions/hours per week, with the total scores of 75 and 50, are
allocated for mathematics and each science subject, respectively (MoEYS, 2010). This
scoring method is also applied to the baccalaureate examination. Table 3.4 illustrates the list
of subjects that are given different emphasis in the science and social science tracks. While
the students from the science track have to take all science subjects, the students from the
social science track take only one lucky-draw-selective science subject in the baccalaureate
examination. The subject and achievement have significant influence on the oriented subjects
to enrol in higher education (MoEYS, 2009; 2020d).
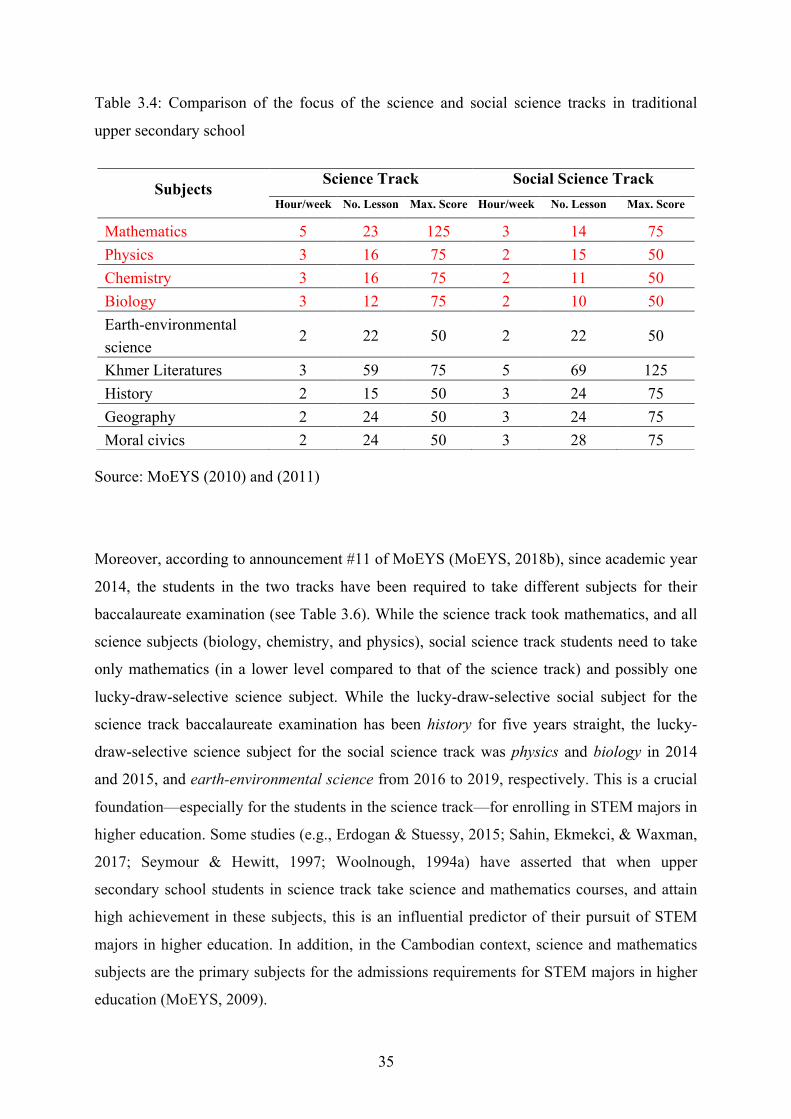
35
Table 3.4: Comparison of the focus of the science and social science tracks in traditional
upper secondary school
Source: MoEYS (2010) and (2011)
Moreover, according to announcement #11 of MoEYS (MoEYS, 2018b), since academic year
2014, the students in the two tracks have been required to take different subjects for their
baccalaureate examination (see Table 3.6). While the science track took mathematics, and all
science subjects (biology, chemistry, and physics), social science track students need to take
only mathematics (in a lower level compared to that of the science track) and possibly one
lucky-draw-selective science subject. While the lucky-draw-selective social subject for the
science track baccalaureate examination has been history for five years straight, the lucky-
draw-selective science subject for the social science track was physics and biology in 2014
and 2015, and earth-environmental science from 2016 to 2019, respectively. This is a crucial
foundation—especially for the students in the science track—for enrolling in STEM majors in
higher education. Some studies (e.g., Erdogan & Stuessy, 2015; Sahin, Ekmekci, & Waxman,
2017; Seymour & Hewitt, 1997; Woolnough, 1994a) have asserted that when upper
secondary school students in science track take science and mathematics courses, and attain
high achievement in these subjects, this is an influential predictor of their pursuit of STEM
majors in higher education. In addition, in the Cambodian context, science and mathematics
subjects are the primary subjects for the admissions requirements for STEM majors in higher
education (MoEYS, 2009).
Subjects Science Track Social Science Track Hour/week No. Lesson Max. Score Hour/week No. Lesson Max. Score
Mathematics 5 23 125 3 14 75 Physics 3 16 75 2 15 50 Chemistry 3 16 75 2 11 50 Biology 3 12 75 2 10 50 Earth-environmental science
2 22 50 2 22 50
Khmer Literatures 3 59 75 5 69 125 History 2 15 50 3 24 75 Geography 2 24 50 3 24 75 Moral civics 2 24 50 3 28 75
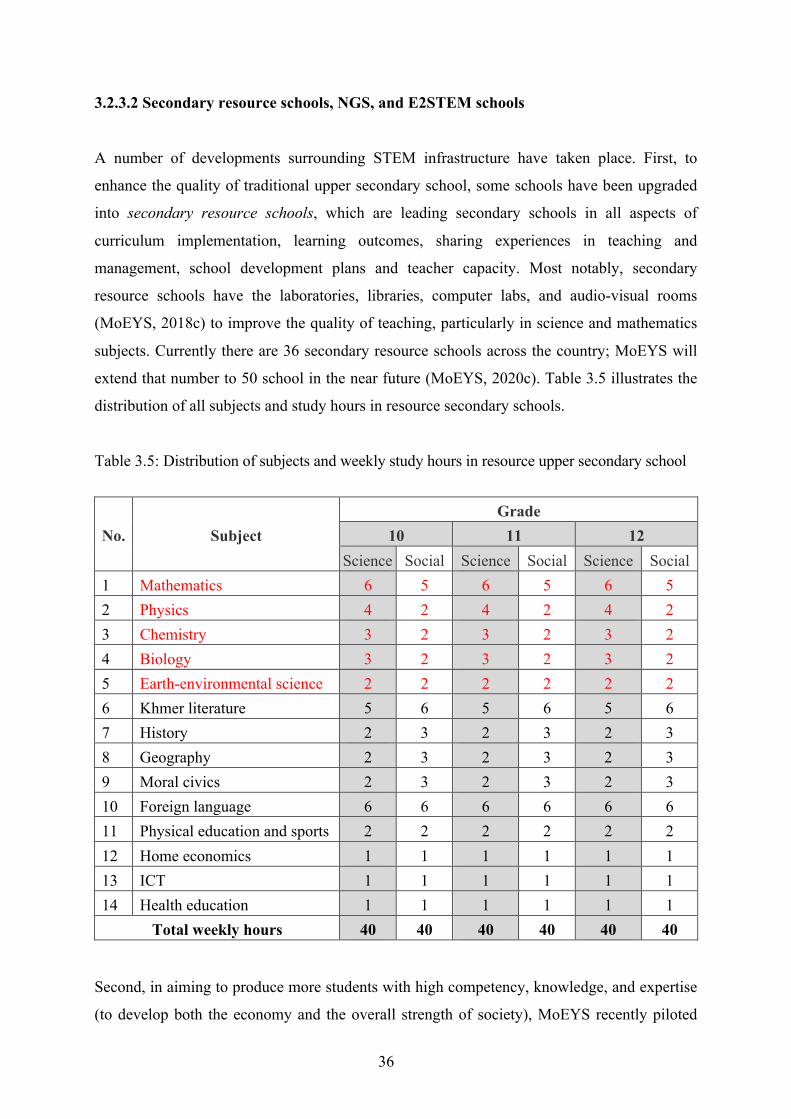
36
3.2.3.2 Secondary resource schools, NGS, and E2STEM schools
A number of developments surrounding STEM infrastructure have taken place. First, to
enhance the quality of traditional upper secondary school, some schools have been upgraded
into secondary resource schools, which are leading secondary schools in all aspects of
curriculum implementation, learning outcomes, sharing experiences in teaching and
management, school development plans and teacher capacity. Most notably, secondary
resource schools have the laboratories, libraries, computer labs, and audio-visual rooms
(MoEYS, 2018c) to improve the quality of teaching, particularly in science and mathematics
subjects. Currently there are 36 secondary resource schools across the country; MoEYS will
extend that number to 50 school in the near future (MoEYS, 2020c). Table 3.5 illustrates the
distribution of all subjects and study hours in resource secondary schools.
Table 3.5: Distribution of subjects and weekly study hours in resource upper secondary school
No. Subject Grade
10 11 12 Science Social Science Social Science Social
1 Mathematics 6 5 6 5 6 5 2 Physics 4 2 4 2 4 2 3 Chemistry 3 2 3 2 3 2 4 Biology 3 2 3 2 3 2 5 Earth-environmental science 2 2 2 2 2 2 6 Khmer literature 5 6 5 6 5 6 7 History 2 3 2 3 2 3 8 Geography 2 3 2 3 2 3 9 Moral civics 2 3 2 3 2 3 10 Foreign language 6 6 6 6 6 6 11 Physical education and sports 2 2 2 2 2 2 12 Home economics 1 1 1 1 1 1 13 ICT 1 1 1 1 1 1 14 Health education 1 1 1 1 1 1
Total weekly hours 40 40 40 40 40 40
Second, in aiming to produce more students with high competency, knowledge, and expertise
(to develop both the economy and the overall strength of society), MoEYS recently piloted
37
the so-called New Generation School (NGS). The main goal of these schools is to increase
educational quality throughout the entire education system, especially science and
mathematics-related subjects at upper secondary schools. According to MoEYS (2016b),
though it is a pilot school, NGS are aimed to deeply enhance the presence of educational
innovation throughout the school system that empower the Cambodia’s education system to
effectively compete with other education systems, and to produce a workforce with 21st-
century skills (MoEYS, 2018d). More specific than traditional upper secondary school, NGS
increase skill levels in STEM subjects at upper secondary school through intensive capacity
building in educational technology, STEM, and inquiry and problem-based learning
methodologies. Currently, there are 11 NGS (four primary and seven secondary schools).
Among these seven secondary NGS, three are located in Phnom Penh and four in the
provinces (Sam, 2020). Most noteworthy, since NGS is the pilot project, only two secondary
NGS are currently accepting and training grade 11th of upper secondary school level students:
Sisovath upper secondary school and Hun Sen Kampong Cham upper secondary schools.
Other five NGS will train upper secondary level in consecutive academic year.
In 2017 a similar type of school, E2STEM school has been established in Phnom Penh. This
type of school is a public-private partnerships between MoEYS, Cambodia, and an
international non-profit organisation (NGO) called E2STEM Education. This school aims to
bring the best modern practices STEM, English, and e-learning into Cambodia’s education
system so as to train Cambodian upper secondary school students and produce 1,000
internationally recognised STEM graduates by 2028. Another unique characteristic of this
school is that it integrates upper secondary school and technical college. Students can spend
three years on their upper secondary education and pursue another two years of technical-
skills training. Currently, MoEYS has been equipping the experimental equipment for
physics, chemistry, biology, and earth-environmental science in this E2STEM school to
promote students’ learning.
The main difference between NGS and traditional schools is the number of teaching and
learning hours. The teaching hours for mathematics and other science subjects (physics,
chemistry, biology, and computer science) have been increased to six and four hours per
week, respectively. Table 3.6 exhibits the different numbers of hours by subject that students
in traditional and NGS schools need for studying each week, and the subjects they need to
focus on for the national examination.
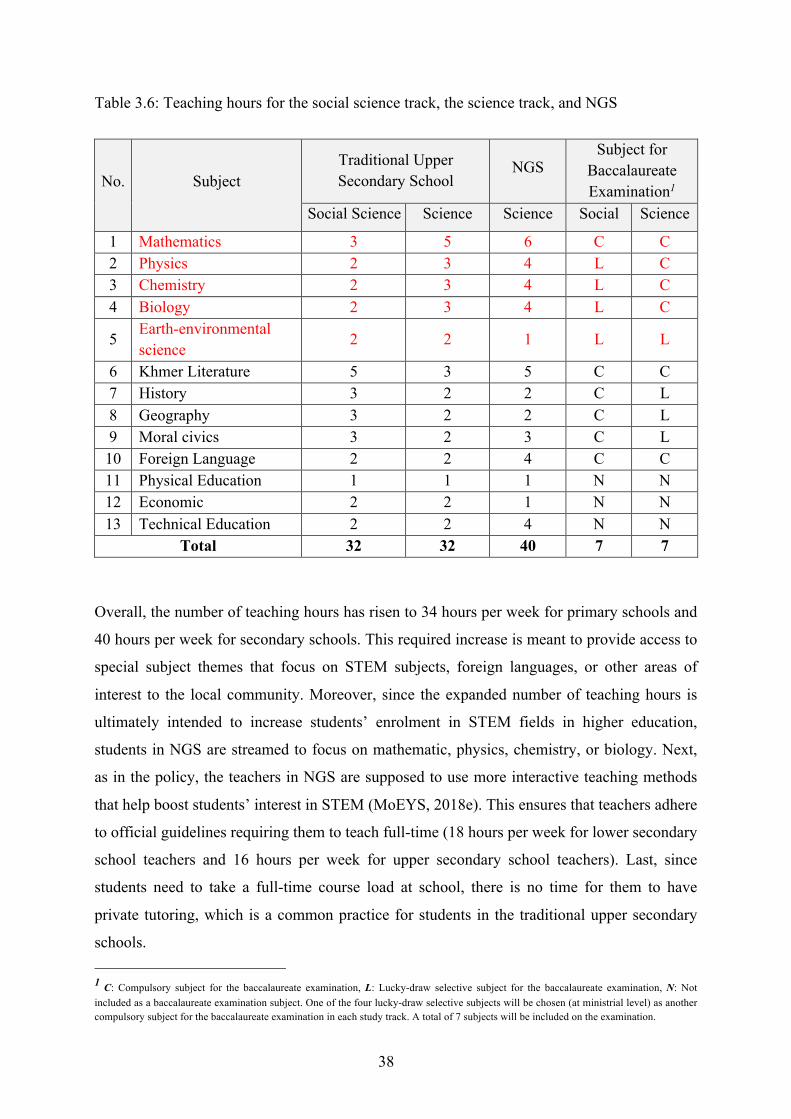
38
Table 3.6: Teaching hours for the social science track, the science track, and NGS
No. Subject Traditional Upper Secondary School
NGS Subject for
Baccalaureate Examination1
Social Science Science Science Social Science
1 Mathematics 3 5 6 C C 2 Physics 2 3 4 L C 3 Chemistry 2 3 4 L C 4 Biology 2 3 4 L C
5 Earth-environmental science 2 2 1 L L
6 Khmer Literature 5 3 5 C C 7 History 3 2 2 C L 8 Geography 3 2 2 C L 9 Moral civics 3 2 3 C L 10 Foreign Language 2 2 4 C C 11 Physical Education 1 1 1 N N 12 Economic 2 2 1 N N 13 Technical Education 2 2 4 N N
Total 32 32 40 7 7
Overall, the number of teaching hours has risen to 34 hours per week for primary schools and
40 hours per week for secondary schools. This required increase is meant to provide access to
special subject themes that focus on STEM subjects, foreign languages, or other areas of
interest to the local community. Moreover, since the expanded number of teaching hours is
ultimately intended to increase students’ enrolment in STEM fields in higher education,
students in NGS are streamed to focus on mathematic, physics, chemistry, or biology. Next,
as in the policy, the teachers in NGS are supposed to use more interactive teaching methods
that help boost students’ interest in STEM (MoEYS, 2018e). This ensures that teachers adhere
to official guidelines requiring them to teach full-time (18 hours per week for lower secondary
school teachers and 16 hours per week for upper secondary school teachers). Last, since
students need to take a full-time course load at school, there is no time for them to have
private tutoring, which is a common practice for students in the traditional upper secondary
schools.
1 C: Compulsory subject for the baccalaureate examination, L: Lucky-draw selective subject for the baccalaureate examination, N: Not
included as a baccalaureate examination subject. One of the four lucky-draw selective subjects will be chosen (at ministrial level) as another compulsory subject for the baccalaureate examination in each study track. A total of 7 subjects will be included on the examination.
39
3.2.4 Other initiatives to promote STEM aspirations
A number of extracurricular initiatives are being implemented to foster students’ aspirations.
More practically, MoEYS and the British Embassy in Cambodia recently published the STEM
Career Booklet listing potential STEM careers and Higher Education Institutions (HEIs) that
offer STEM majors in Cambodia to give upper secondary school students the chance of better
guidance, and to help them make well-informed choices in matriculating into STEM fields in
higher education (British Embassy, 2016).
Also, aiming to increase students’ interest in pursuing STEM majors in higher education,
other extracurricular activities such as the STEM Bus (a mobile vehicle that brings science
experiments to secondary students across the country), and the Science and Engineering
Festival (to raise public awareness of STEM) have been conducted. To date, the bus has
travelled to 123 upper secondary schools and 4 lower secondary schools in the 25 provinces
of Cambodia, and the 16th annual STEM festival was held in 2020. Some secondary school
students have been invited to join the event. MoEYS has also encouraged the formation of
mathematics and physics study clubs (Science Clubs) at 36 upper secondary schools in Phnom
Penh. However, the effects of these programmes on student’s aspirations of STEM majors are
greatly underrated.
3.2.5 Admission into the higher education system
In terms of the admissions process of Cambodia’s higher education, the successful completion
of a baccalaureate degree is not the only pathway; it is merely the primary route. Overall,
there are two types of admissions: scholarship and fee-paying (MoEYS, 2002). Scholarships,
(and government scholarships through MoEYS in particular) are provided based on four main
priorities: (1) merit, (2) gender, (3) poverty, and (4) geographical location. To apply for
government scholarships, students must choose any two majors (as their first and second
priorities) (MoEYS, 2018f) in any HEIs of their interest listed in the MoEYS booklet and
apply through the Department of Higher Education (DHE) in the second semester of grade
12th of each respective academic year. The application process starts in mid-March and lasts
until the end of May. The selection is mostly grounded in the students’ performance on the
baccalaureate examination. However, to be enrolled into STEM majors at some prestigious
HEIs—such as engineering at the Institute of Technology of Cambodia (ITC) and health
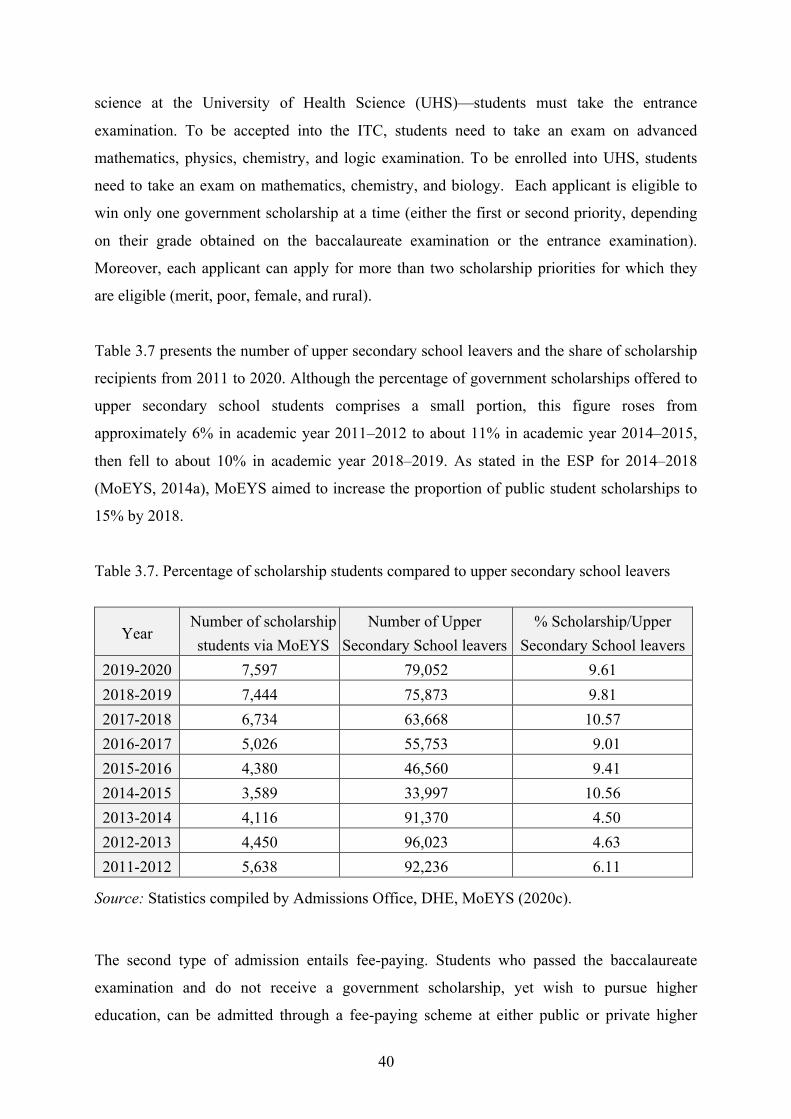
40
science at the University of Health Science (UHS)—students must take the entrance
examination. To be accepted into the ITC, students need to take an exam on advanced
mathematics, physics, chemistry, and logic examination. To be enrolled into UHS, students
need to take an exam on mathematics, chemistry, and biology. Each applicant is eligible to
win only one government scholarship at a time (either the first or second priority, depending
on their grade obtained on the baccalaureate examination or the entrance examination).
Moreover, each applicant can apply for more than two scholarship priorities for which they
are eligible (merit, poor, female, and rural).
Table 3.7 presents the number of upper secondary school leavers and the share of scholarship
recipients from 2011 to 2020. Although the percentage of government scholarships offered to
upper secondary school students comprises a small portion, this figure roses from
approximately 6% in academic year 2011–2012 to about 11% in academic year 2014–2015,
then fell to about 10% in academic year 2018–2019. As stated in the ESP for 2014–2018
(MoEYS, 2014a), MoEYS aimed to increase the proportion of public student scholarships to
15% by 2018.
Table 3.7. Percentage of scholarship students compared to upper secondary school leavers
Year Number of scholarship students via MoEYS
Number of Upper Secondary School leavers
% Scholarship/Upper Secondary School leavers
2019-2020 7,597 79,052 9.61 2018-2019 7,444 75,873 9.81 2017-2018 6,734 63,668 10.57 2016-2017 5,026 55,753 9.01 2015-2016 4,380 46,560 9.41 2014-2015 3,589 33,997 10.56 2013-2014 4,116 91,370 4.50 2012-2013 4,450 96,023 4.63 2011-2012 5,638 92,236 6.11
Source: Statistics compiled by Admissions Office, DHE, MoEYS (2020c).
The second type of admission entails fee-paying. Students who passed the baccalaureate
examination and do not receive a government scholarship, yet wish to pursue higher
education, can be admitted through a fee-paying scheme at either public or private higher
41
education institutions. In academic year 2017–2018, of the 168,242 students with a bachelor’s
degree, there were 143,605 (about 85%) enrolled under the fee-paying scheme. Most private
higher education institutions are providing a similarly narrow range of courses that require
little capital investment at the expense of fields that are vital for the country’s economic
growth (Pit & Ford, 2004).
With either type (scholarship or fee-paying), students are admitted based on two main
methods: their scores on grade 12th national examination and the institution’s entrance
examination. With the first method, if the students passed grade 12th national examination and
got a passing grade on the subjects required for enrolling in a certain major, they do not need
to take entrance examination. However, they need to take the entrance examination if they
pass the grade 12th examination but receive a failing grade for one of the required subjects.
For example, if a student passes the grade 12th national exam and gets a passing grade for
mathematics and physics, she/he could be enrolled in a mathematics majors in higher
education without taking the entrance examination. However, a student needs to take the
entrance examination if she/he receives a failing grade in science or mathematics on the grade
12th national examination. Students need to take the entrance examination if they want to be
enrolled in a major that requires subjects they did not take on grade 12th national examination.
Therefore, science track students have more advantages for being admitted into STEM
majors. (See Appendix 8 for a list of some majors and the subjects required.)
3.3 Tracking: Definitions and types
Although the definition of “tracking’” (conventional or selective) is, to some extent shared
around the world, countries seemed to differ widely in terms of the type, degree, and age at
which students begin to be tracked (Darolia et al., 2018; Dustmann, Puhani, & Schönberg,
2017). Some countries track students into differing-ability schools as early as age 10 (e.g.,
Austria, Germany, Hungary, and the Slovak Republic). By contrast, others (e.g., Canada,
Japan, Norway, Sweden, Korean, the United Kingdom, and the United States) keep their
entire lower secondary school system comprehensive (Hanushek & Wößmann, 2006;
Organisation for Economic Co-operation and Development [OECD], 2004) and begin
tracking students at age 16 years old (Woessmann, 2009). Various scholars have categorized
the multiple forms and understandings of tracking into five main types (see Table 3.8 for
details).
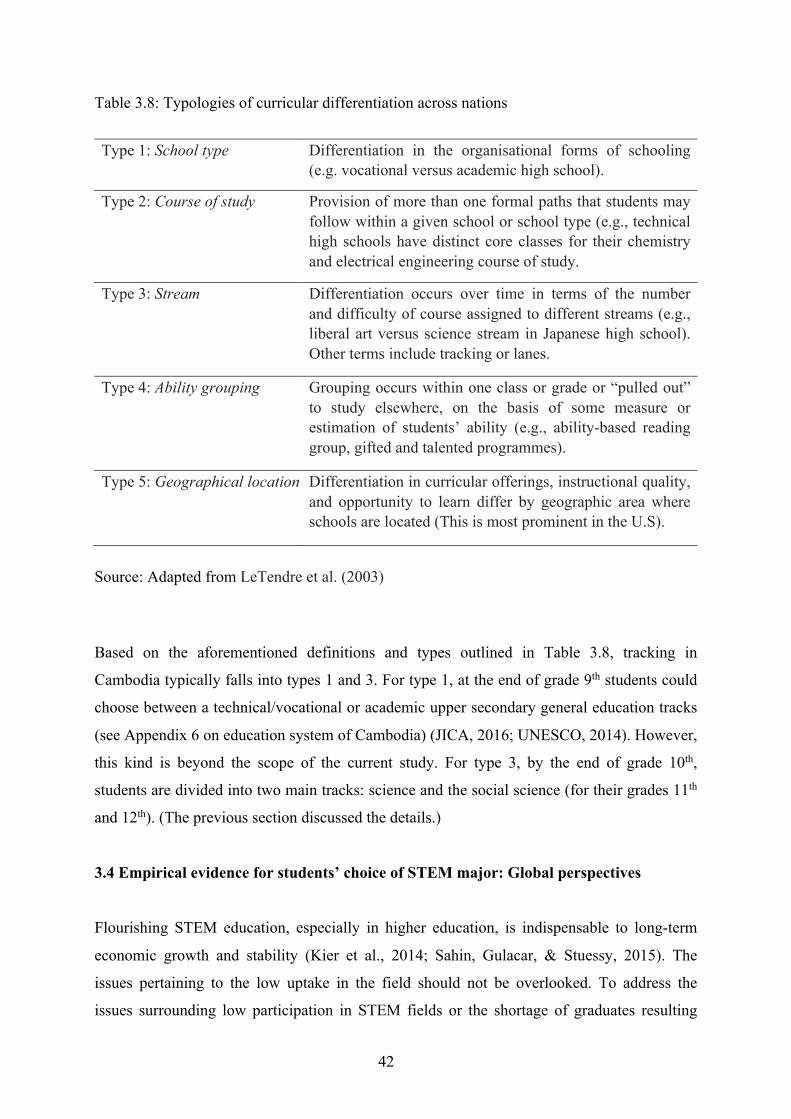
42
Table 3.8: Typologies of curricular differentiation across nations
Type 1: School type Differentiation in the organisational forms of schooling
(e.g. vocational versus academic high school).
Type 2: Course of study Provision of more than one formal paths that students may follow within a given school or school type (e.g., technical high schools have distinct core classes for their chemistry and electrical engineering course of study.
Type 3: Stream Differentiation occurs over time in terms of the number and difficulty of course assigned to different streams (e.g., liberal art versus science stream in Japanese high school). Other terms include tracking or lanes.
Type 4: Ability grouping Grouping occurs within one class or grade or “pulled out” to study elsewhere, on the basis of some measure or estimation of students’ ability (e.g., ability-based reading group, gifted and talented programmes).
Type 5: Geographical location Differentiation in curricular offerings, instructional quality, and opportunity to learn differ by geographic area where schools are located (This is most prominent in the U.S).
Source: Adapted from LeTendre et al. (2003)
Based on the aforementioned definitions and types outlined in Table 3.8, tracking in
Cambodia typically falls into types 1 and 3. For type 1, at the end of grade 9th students could
choose between a technical/vocational or academic upper secondary general education tracks
(see Appendix 6 on education system of Cambodia) (JICA, 2016; UNESCO, 2014). However,
this kind is beyond the scope of the current study. For type 3, by the end of grade 10th,
students are divided into two main tracks: science and the social science (for their grades 11th
and 12th). (The previous section discussed the details.)
3.4 Empirical evidence for students’ choice of STEM major: Global perspectives
Flourishing STEM education, especially in higher education, is indispensable to long-term
economic growth and stability (Kier et al., 2014; Sahin, Gulacar, & Stuessy, 2015). The
issues pertaining to the low uptake in the field should not be overlooked. To address the
issues surrounding low participation in STEM fields or the shortage of graduates resulting
43
from the decline in students’ interest in (and lower attitudes towards) studying science,
effective initiatives and strategies implemented in the other countries merit consideration. To
achieve this objective, the researchers desk-reviewed, analyzed, contrasted, and synthesized
existing policy documents and literatures on policy initiatives implemented to promote
students’ understanding and to enhance their matriculation from the science track at upper
secondary school into STEM fields in higher education. The researcher compare STEM:
Country comparison report on Canada, France, Japan, the United Kingdom, and the United
States. The key data sources were policy documents and articles, including a 2013 report
comparing Canada (Weinrib & Jones, 2013), France (Oliveira & Roberts, 2013), Japan
(Ishikawa et al., 2013), the United Kingdom (Tomei et al., 2013), and the US (Maltlese, Lung,
Potvin, & Hochbein, 2013), as well as educational policies and practices in STEM and
science education in Europe. These include national policies, practices, and research
(Freeman et al., 2015). These STEM country comparison reports were the synthesis of the
extant studies and reports on each respective country.
There were three main justifications for selecting the aforementioned countries for
comparison. First, by definition, in STEM: Country comparison reports, these nations
excluded social and behavioural sciences from the category of “STEM fields” (Chen, 2013;
Crisp et al., 2009; Marginson et al., 2013; MoEYS, 2016b; Ulicna & Royale, 2015). This was
in congruence with the classification of STEM fields in the Cambodian context. Second,
based on the share of tertiary graduates in STEM and the gender distribution from the 2015
Organization for Economic Cooperation and Development [OECD] database (OECD, 2017),
France and the United Kingdom (whose shares of tertiary graduates in STEM fields were
above the OECD average) and Canada, Japan, and the United States (with the shares below
the OECD average) were selected to be the comparator countries. Lastly, all of the chosen
countries have experienced and overcome the decline in students’ interest in (and negative
attitudes towards) science and participation in STEM fields as they transitioned to another
stage of industrial development (Marginson et al., 2013).
In addition to reviewing the initiatives to promote STEM uptake, the researcher also
conducted a comprehensive review on a large number of empirical studies on factors that
explain students’ choice of STEM majors in higher education. The literature revealed diverse
variables that empirically influence students’ choice of STEM majors. The researcher thus
synthesized the findings from these empirical studies, along with the policy initiatives.
44
Conceptualized through the lens of the synthesised theoretical and conceptual models, and
given that some attitudinal and belief variables change over time (e.g. Barmby, Kind, & Jone,
2008; George, 2006; Navarro, Flores, & Worthington, 2007; Siegel & Ranney, 2003; Tan &
Laswad, 2007; Wang, 2017), the researcher then classified the factors into two sub-
components: time-invariant and time-varying predictors. Next the researcher categorized
these two components as predictors at the individual level, predictors at the family level, and
predictors at the upper secondary school level.
3.4.1 Time-invariant predictors
3.4.1.1 Predictors at the individual level
A large body of literature on students’ choice of STEM majors at the individual level
perspective was based on theorists’ interests. Normally, behaviourists look at the factors that
affect students’ choice through the lens of students behaviours. Similar practices are applied
when the psychologists or experts in academic achievement examine this phenomenon. The
first area to investigate regarding the factors involved in the students’ science outcomes in
choosing a STEM major entailed personal ability and affective factors. In this section, the
study discusses on the effects of gender on students’ choice to transition from the science
track at upper secondary school to a STEM major in higher education.
3.4.1.1.1 Gender
From gender perspective, gender differences in STEM majors participation in higher
education are by no means new, and have generated debates among researchers for several
decades. A central question was whether these distinctions springed from genetic differences
(e.g., in mathematical aptitude between young men and women) or from gender stereotypes.
However, evidence indicates that socio-cultural factors and constraints constitute the most
powerful explanatory factors underlying women’s underrepresentation. For example, Trusty,
Robinson, Plata, and Ng (2000) which investigated the effect of gender on post-secondary
educational choices, found that men choose STEM majors more frequently than women do.
This result is consistent with Eccles’s (1994) model of achievement-related choices and the
work of Sahin, Ekmekci, and Waxman (2017). Together, they contended that the cause of the
difference is that women and men differ in their subject task values. While women placed
more importance on language-related skills and tasks, men placed more value on
45
mathematics-related skills and tasks. Eccles (1994) and Riegle-Crumb and King (2010) added
that this difference explains the lower frequency of women entering into science and
mathematics fields. Moreover, Whitelaw, Milosevic, and Daniels (2000), confirmed that
gender is probably the most important variable related to attitudes towards science. To
support this, many studies for instance, Francis and Geer (1999), Gunderson, Ramirez,
Levine, and Beilock (2012), and Jone, Howe, and Rua (2000) reported that males have more
positive attitudes towards science and mathematics than females. Recently, Lavy and Sand
(2015) signalled that some teachers have a biased belief of female inferiority in mathematics
and tended to give lower score to female students, and this had long-term effects on students’
attitudes towards mathematics and STEM majors. Also, males tended to perform better than
females in science and mathematics subjects (Hill & Tyson, 2009; Steffens, Jelenec, &
Noack, 2010) and more likely to be involved in disciplines that required advanced
mathematics and science (Osborne, Simon, & Collins, 2003; Seymour & Hewitt, 1997).�In
the same vein, men are almost twice as likely as women to cite being good at mathematics
and science in high school as a reason for choosing STEM majors in higher education.
However, some recent studies (e.g. Dom & Yi, 2018; Lee, Min, & Mamerow, 2015; Nix,
Perez-Felkner, & Thomas, 2015; Riegle-Crumb, King, Grodsky, & Muller, 2015) have argued
that gender gaps in some STEM majors are not fully explained by achievement in science and
mathematics. Rather the gender stereotypes, which are closely related to environmental
factors than individual characteristics, that influence the less likelihood of females majoring
STEM. In sum, a man is found to be significantly more likely to choose a STEM major than a
woman (Crisp, Nora, & Taggart, 2009; Hackett, 1985; Kao & Shimizu, 2019; Kelly, 1988;
Montmarquette, Cannings, & Mahseredjian, 2002; Nosek & Smyth, 2011; Porter & Umbach,
2006; Seymour & Hewitt, 1997; Song & Glick, 2004; Vooren, Haelermans, Groot, & Van den
Brink, 2019; Wang, 1995; Westrick, Radunzel, & Bassiri, 2018). To date, the conclusion on
whether this difference stems from performance or behavioral differences remains a
controversial idea.
3.4.1.2 Predictors at the family level
Interests of the social science researchers often have their explanations for different outcomes
in science (students majoring in STEM) emphasize on the deficiencies within students’
homes. According to human capital theory, the home is an area where students gain
differential exposure to cultural capital from their families, and different access to networks
46
within their communities. Researches have also revealed several home environmental
variables that could influence students’ choice of STEM majors in higher education including
parental factors, socio-economic factors, and relatives’ influence.
3.4.1.2.1 Parental education
In terms of family educational background, parents’ education level has a significant effect on
children’s choice of major (Shim & Paik, 2014; Wei et al., 2014). A higher percentage of the
students majoring in STEM have at least one parents who also studied STEM in higher
education (Moakler & Kim, 2014; Sonnert, 2009; Ware, Steckler, & Leserman, 1985;
Woolnough, 1994a, 1994b). This finding was confirmed by Fleming, Engerman, and Griffin
(2005), who investigated students at historically black colleges and universities that pursued a
STEM major; they found that students were impacted in their choice to major in STEM due to
their parents’ education level. Similarly, children of less educated parents are markedly less
likely to enrol in post-secondary education of any kind, which is an automatic disqualification
from STEMM (Miller & Kimmel, 2012). Highly educated parents are more likely to
encourage their children to learn about science overtly and indirectly through science-related
books, materials, and toys. If their parents (especially the mother) have a high level of
education, students’ probability of choosing science and engineering is also high. However,
for male scientists, an increase in parental education level is associated with a steeper increase
in the likelihood of the parents named as the influencer, whereas this increase was lower for
female scientists. This finding is consistent with the finding that women are more likely to
choose male-dominated majors and careers in science and engineering if their father has a
high level of education. In this respect, women with highly educated fathers are more likely to
major in science and engineering than those who do not (Lapel, Williams, & Waldauer, 2001;
Miller & Kimmel, 2012). In short, the increase in parents’ educational level (and especially
parents who majored in STEM) increases the probability of the students to major in STEM in
higher education. The highest parental degree was found to influence one’s choice of STEM
majors (Wang, 2013; Sax, Kanny, Riggers, Whang, & Paulson, 2015; Ruse & Xu, 2018). This
effect is even stronger for females with parents having higher degrees (Leppel, Williams, &
Waldauer, 2001; Sahin et al., 2017). Parental education also has a significant effect on
students’ attitudes towards science, which in turn influences their choice of STEM majors
(Hacieminoglu, 2016). Moreover, decades ago, a study employing the dichotomous
dependent variable of science and non-science also found that having highly educated parents
47
increased the probability of women choosing to major in science, but this outcome is
negatively for boys (Ware et al., 1985).
3.4.1.2.2 Parental occupation
Besides parents’ education, the significant influence of parents’ occupation on one’s choice of
major has also attracted attention from social researchers. Today, parental factors that
influence an individual’s choice of major extend beyond parents’ level of education, to their
occupations. Parents certainly make a difference in their children’s interests and choices. In
particular, parents would exert a major influence on their children’s interest in science, choice
of major in, and career in science (Bleeker & Jacobs, 2004; Dick & Rallis, 1991; Harwell,
2012; Kao & Shimizu, 2019; Seymore & Hewitt, 1997). Parents who work in Science,
Technology, Engineering, and Mathematics (STEM) fields have a positive impact on their
children choosing to major in STEM. To reiterate, if students’ parents work in a STEM
career, their likelihood of pursuing a STEM major also increase, thus following family
tradition (Crisp & Nora, 2006; Eng & Szmodis, 2016; Harwell, 2012; Kao & Shimizu, 2019;
Leslie, McClure, & Oaxaca, 1998; Seymore & Hewitt, 1997; Woolnough et al., 1997).
Students, from their efficacy beliefs, see such a major and career as feasible. Most
noteworthy, Sonnert (2009) found that the closer the parents’ job are to science-related
professions, the more likely they are to influence their children’s choice of a science major.
Thus, empirically speaking, parents’ occupation has a significant effect on students’ choice of
major in higher education. The probability of students choosing a STEM major increases if
their parents work in a STEM fields; this effect is stronger if the father works in a STEM area
(Leppel et al., 2001).
3.4.1.3 Predictors at the school level
In the previous section, the researcher outlined how family background predictors can
influence the students’ choice of STEM majors. These factors are important, but school
practices are also crucial for understanding the landscape of students’ choices. In particular,
upper secondary schools provide a pivotal time for students to decide whether to pursue a
STEM-related major and career (e.g., Darolia et al., 2018; Lee, Min, & Mamerow, 2015;
Maltese & Tai, 2011; Shimpkins et al., 2015). Upper secondary schools can either encourage
students to learn science and mathematics to gain literacy and thus choose to enter the STEM
48
pipeline, or they can push students away from the pipeline. The section that follows, thus,
discusses how each aspect of upper secondary school predictors impacts students’ STEM
majors in higher education.
3.4.1.3.1 Tracking/Streaming system
For decades, researchers have sought to understand the effect of tracking/streaming (in
science) on one’s choice of major in general, and for STEM majors in particular. Zuniga,
Olson, and Winter (2005) examined the tracking policy of high schools among Hispanics and
found that this policy might negatively influence students’ academic experiences in
mathematics and science. Consequently, students who were placed in a lower-level science
track, regardless of academic ability, are unlikely to take subsequent courses required for
college admissions despite that most of them have college aspirations; they are thus turned off
by science in higher education. In contrast, students in the science track at upper secondary
school are more likely to pursue their education in science-related majors (Kao & Shimizu,
2019; Kinyota, 2013; Lee, 1987; Li & Kuan, 2018; Myeong & Crawley, 1993; Paik & Shim,
2013; Shim & Paik, 2014; Trusty, 2002; Wang & Lee, 2019). Studies have confirmed that
students in the science track are more able to experience and be involved in (or exposed to)
more science and mathematics courses at upper secondary school, and hence have a higher
interest in (and attitudes towards) science-related courses. As such, they are more likely to
major in science or STEM related in higher education. Moreover, the number of mathematics
courses taken has the strongest effect on one’s choice of science and mathematics-related
majors among women, whereas for men, the number of science courses taken has the
strongest effect. On the contrary, students placed in a lower-level humanities/social science
track at upper secondary school are more likely to pursue majors with non-intensive science
and mathematics.
However, some studies counter argued that merely increasing the number of science and
mathematics courses taken in high school does not have any significant influence on the
students’ choice of STEM majors (Darolia, Koedel, Main, Ndashimye, & Yan, 2018; Maltese
& Tai, 2011; Means et al., 2018). Rather, the students’ interest in STEM majors is influenced
by how science and mathematics courses are actually conducted in the classroom, and the
quality of exposure to lessons. In the Cambodian context, aiming to guide students toward
higher education in general and science-related in particular, MoEYS has also been
49
implementing a tracking/streaming policy. Students are required to choose either the social
science or science track starting in grade 11th (MoYES, 2010). On top of this, NGS have been
piloted to promote STEM education and choosing a STEM major. As a result, this study
posits that students in the science track or those who attend NGS will be more likely to pursue
STEM majors than those in the social science track.
3.4.2 Time-varying predictors
Researchers (e.g. Barmby, Kind, & Jone, 2008; George, 2006; Gibson & Chase, 2002;
Navarro, Flores, & Worthington, 2007; Siegel & Ranney, 2003; Tan & Laswad, 2007; Wang,
1995) have demonstrated that some attitudinal and perceptual variables change over time.
Therefore, this section addresses the three dimensions variables that were hypothesized to
change overtime. The key objective was to investigate if the teaching and learning process in
the science and social science tracks at upper secondary school truly has an influence on these
variables, and to identify if the multi-dimensional variables influence students’ aspirations of
STEM majors in higher education.
3.4.2.1 Predictors at the individual level
3.4.2.1.1 Science and mathematics academic achievement
From academic achievement perspective, science and mathematics achievement and choice of
STEM major have also gained attention in many scholarly works. Upper secondary school
education in science and mathematics is an essential starting point for building a logical
extension into STEM majors in higher education. In this regard, science and mathematics
achievement from upper secondary school is often an influential factors in students’ choice of
STEM major. Empirically, strong pre-college academic achievement in science and
mathematics positively affects students’ decision to pursue a STEM major (Almeida, Leite, &
Woolnough, 1998; Bonous, 2000; Kao & Shimizu, 2019; Kelly, 1988; Lent, Lopez, &
Bieschke, 1993; Mau & Li, 2018; Miller & Kimmel, 2012; Nicholls et al., 2007; Rask, 2010;
Sax, 1996; Selema, 2010; Seymore & Hewitt, 1997; Trusty, 2002; Wang, 1995; Westrick et
al., 2018). Students with better performance in science and mathematics during high school
are more likely to be self-motivated to declare a mathematic-intensive STEM major due to the
fact that these fields require advanced mathematics. In accordance with this finding,
Woolnough (1994a), who conducted a study in England and measured the General Certificate
50
of Secondary Education (GCSE) score, found that students with higher or better achievement
in science and mathematics courses are more able than non-science majors to be involved in
STEM majors. Other studies (e.g., Adelman, 1999; Chen & Weko, 2009; Crisp, Nora, et al.,
2009; Lent, et al., 1993; Nicholls, et al., 2007; Wang, 2013; Woolnough, 1994b; Woolnough
et al., 1997) have also confirmed this finding. Porter and Umbach (2006) discovered no
significance of science and mathematics achievement in one’s choice of STEM majors in
higher education. Most empirical evidence has revealed that this choice is significantly
influenced by science and mathematics achievement in high school.
3.4.2.1.2 Science and mathematics self-efficacy
From a psychological perspective, besides science and mathematics academic achievement,
science and mathematics self-efficacy also have a considerable influence on choosing science
and engineering-related majors. Findings from many studies have indicated that science and
mathematics self-efficacy beliefs are positively linked to college students’ choice of science
and mathematics related academic majors (e.g. Lent et al., 2018; Sahin et al., 2017; Wang,
2013; Wang & Lee, 2019). Crucially, despite moderate science and mathematics
achievement, students are more likely to sign up for STEM majors if they have high levels of
science and mathematics self-efficacy; that is, the belief in one’s ability to successfully
perform in that academic area (Bandura, 1986; Bethz & Hackett, 1983; Crisp & Nora, 2006;
Meece, Parsons, Kaczala, Goff, & Futterman, 1982; Seymour & Hewitt, 1997). Moreover,
Leslie, McClure, and Oaxaca (1998) also confirmed that the probability of choosing a STEM
major increases with students’ perceptions that they possessed a solid science and
mathematics background, and in the belief that they can perform well in those courses. In a
sense, science and mathematics self-efficacy is influenced by one’s mathematics and science
background, which in turn affects technical and scientific interests or academic choice of
majors (Hackett, 1985; Lent et al., 2008; Lent, Lopez, & Bieschke, 1993; Nugent et al., 2015;
Scott & Mallinckrodt, 2005; Turner, Steward, & Lapan, 2004; Wang, 2013). For example,
DeBoer (1987) indicated that students with high confidence in their ability, and who expect to
do well in scientific fields, are more likely to take more STEM majors (Nauta & Epperson,
2003). Strongly self-efficacy tends to influence their academic achievement, and in turn
students’ choice of STEM majors.
51
From a gender perspective, there are significant gender differences in terms of science and
mathematics self-efficacy. According to (Betz & Hackett, 1983; Eccles, 1994; Lapan, Boggs,
& Morrill, 1989; Lent, Lopez, & Bieschke, 1991; Matsui, Matsui & Ohnishi, 1990; Seymour
& Hewitt, 1997; Strayhorn, 2015; Wang, 2013), males have stronger science and mathematics
efficacy than females. However, recent research suggests that this gender gap may be closing.
The study revealed that there was no gender difference in terms of how science and
mathematics self-efficacy works to influence students’ choice of major in a STEM-related
field (Wang, 2013). Notwithstanding, interestingly, a recent study conducted by Lowinger
and Song (2017) found that mathematics self-efficacy does not predict one’s choice of STEM
major, as those who reported higher mathematics self-efficacy tended to major in business
rather than STEM. Further, it was explained that Asian American students who are proficient
in mathematics tend to be more modest regarding their mathematics ability (Lee, 2009;
Lowinger & Song, 2017).
3.4.2.1.3 Attitudes towards science
For decades, a problem that has been raised when studying about attitudes towards science is
the definition of attitude itself (Francis & Greer, 1999; Germann, 1988; Osborne, Simon, &
Collins, 2003). The controversy stems from the fact that there are many concepts that related
to attitudes towards science that might not be included in each definition. However, the most
common definition involved in describing attitudes encompasses the three components of
cognition, affect, and behaviour. As such, attitudes towards science in this study, according to
(Bagozzi & Burnkrant, 1979; Gardner, 1975; Kind, et al., 2007; McGuire, 1985; OECD,
2016; Yara, 2009), entail feelings, beliefs, and values held about science (that may be a
school of science), the impacts of science on society, or careers in science.
Concerns about attitudes towards science and choice of STEM majors are not new. From a
behaviourist standpoint, nearly 30 years ago, Ormerod and Duckworth (1975) had begun their
review and emphasized that among the factors that had been lessening or swinging students
away from science was due to the lessening of their attitudes towards science. In addition,
more studies on attitudes towards science have confirmed that such attitudes not only consist
of a single unitary construct, but rather a large number of sub-constructs, all of which
contribute in one’s attitudes towards STEM (Osborne, Simon, & Collins, 2003; Ventura,
1992). To support this, studies by (e.g., Breakwell & Beardsell 1992; Brown, 1976; Conrad,
52
Canetto, MacPhee, & Farro, 2009; Crawley & Black 1992; Gardner, 1975; Haladyna, Olsen,
& Shaughnessy, 1982; Kao & Shimizu, 2019; Koballa Jr., 1995; Osborne, Simon & Collins,
2003; Nicholls et al., 2007; Woolnough, 1994a) which incorporated a range of components
into their measures of attitudes towards science including perception of science teachers,
anxiety about science, the importance of science, self-esteem in science, the motivation
towards science, enjoyment of science and the nature of science classroom environment and
so on, found that students with a low self-rating on attitudes measures are less likely to be
engaged in STEM majors. In line with this, Menis (1989) argued that the assessment of
student’s attitudes towards science should be concerned with at least three distinct referents:
(1) attitudes towards the importance of science, (2) attitudes towards science as a career, and
(3) attitudes towards science in the school curriculum. He further indicated that when these
three distinct referents are positive, students also have more positive attitudes towards
science.
As consequent, in 2007, Kind, Jones, and Barmby, developed and validated another attitudes
towards science measure that covers seven sub-constructs: (1) learning science in school, (2)
self-concept in science, (3) practical work in science, (4) science outside of school, (5) future
participation in science, (6) the importance of science, and (7) general attitudes towards
school science. They discovered that students are more likely to make choices that will lead to
science-related majors. In gender debate perspective, male students have more positive
attitudes towards science than female students (Crisp & Nora, 2006; Francis & Greer, 1999;
Hodson & Freeman, 1983; Simpson & Oliver, 1990; Weinburgh, 1995). From time
perspective, it was found that students’ attitudes towards science declined as they progress
through secondary school, and the decline is more pronounced for females (Barmby et al.,
2008; Gibson & Chase, 2002; George, 2006; OECD, 2016; Osborne et al, 2003; Zhou et al.,
2019).
Although there have been diversed measures, attitudes towards science itself are strongly
determined differently by three independent constructs: (1) self-related variables, (2) teachers,
and (3) the learning environment (Freedman, 1997; Papanastasiou & Papanastasiou, 2004;
Zacharia & Barton, 2003). Consequently, there has been some agreements on attitudes
referenced to personal characteristics. From a gender perspective, male students have higher
positive attitudes towards science than female students (Crisp & Nora, 2006; Francis & Greer,
1999; George, 2000; Hodson & Freeman 1983; Kao, 2019a; OECD, 2016; Simpson & Oliver,
53
1990). In a sense, males exhibits significantly higher positive attitudes towards science than
females. Studies reported that, over time, female tended to have lower ratings of attitudes
towards science, which are likely related to their self-concept and their notions of male
dominance in science classes and careers (Handley & Morse, 1986; OECD, 2016). However,
this is not always the case for all science subjects. Weinburgh (1995) revealed that boys
usually show more positive attitudes towards physics and chemistry because they are much
more interested in speed, electrical circuits, and technological applications in physics.
Regarding the teaching and learning environment, findings from previous studies also showed
that students’ attitudes towards science generally declined over the period of middle school
and high school years (Barmby et al., 2008; George, 2006; OECD, 2016; Osborne et al., 2003
Simpson & Oliver, 1990). Research also consistently indicates that, since the attitudes scale is
linked to the numbers of science classes taken, it is possible that the decline in students’
attitudes towards science could be related to the different types and levels of science courses
they take at school. Hence, tracking systems have a significant impact on students’ attitudes
towards science. Students in the science track are able to experience and be more involve in
science and mathematics courses, which consequently leads to higher positive attitudes
towards science-related courses in the future (Kao, 2019a; Marginson, et al., 2013; Myeong,
et al., 1991).
From the angle of locality, in the discourse on nationality, studies showed that attitudes
towards science are not the same (Awan et al., 2011; Barmby et al., 2008). The attitude in
general and attitudes towards science in particular varied remarkably in different parts of the
world, and students’ nationality affects this variation (Ye, Wells, Talkmitt, & Ren, 1998).
Surprisingly, compared to developed countries, children in developing nations appear more
interested in science and science-related topics. In a narrower geographical area perspective,
results also showed two contrasting schools of debate. Measuring the same constructs of
attitudes towards science using test of science related attitude (TOSRA), Anwer, et al. (2012),
George (2000), Kao (2019a), Papanastasiou and Papanastasiou (2004), and Serin and
Mohammadzadeh (2008) consistently verified the stance that students from non-urban areas
seem to rate higher on science attitudes scales compared to students from urban areas.
However, some other studies (see, for example, Hammrich, 1998; Zacharia & Barton, 2004),
maintained that due to environmental advantage, students from urban origins usually have
higher positive attitudes towards science than students from non-urban localities. These

54
debates have laid bare the gaps for future research to fill, especially in the developing state
like Cambodia. Studies that investigate the effects of attitudes towards science on one’s
choice of majors in science-related are crucial.
3.4.2.1.4 Outcome expectations
Outcome expectations, one of the key constructs in social cognitive career theory (SCCT),
involve the imagined consequences of performing a particular behaviour (If I do this, what
will happen?) Similarly, in thought, the types of outcomes people anticipated depend largely
on their judgements of how well they will be able to perform in given situations (Bandura,
1986; Betz & Hackett, 1983; Hackett & Bethz, 1981; Lent et al., 2018; Nugent et al., 2015).
SCCT posits that outcome expectations were critical mediators of academic interests
development. Thus, outcome expectations have become one of the key focus in the academic
studies on predicting one’s choice of major. Empirically, a number of studies (e.g. Fouad &
Smith, 1996; Nauta & Epperson, 2003; Nugent et al., 2015; Wang, 2017) have confirmed that
outcome expectations positively influence students’ choice of STEM majors. It was claimed
that when testing STEM intention as a proxy, outcome expectations have the biggest positive
effect of all on the students’ choice of majors. This result implies that an individual’s
intention to engage in a certain activity helps to organize, guide, and sustain individual’s
efforts over a period of time (Fouad & Smith, 1996; Nugent et al., 2015; Wang, 2013, Wang
& Lee, 2019). The combination of ability, learning experiences, and self-efficacy lead to more
positive outcome expectations (Nauta & Epperson, 2003). Most noteworthy, it was found that
there is a relationship between gender and outcome expectations. Using paths analysis, Fouad
and Smith (1996) revealed that male students have higher outcome expectations than female
students. Moreover, it was exhibited that students develop higher outcome expectations when
parents stress the importance and the value of majors, and support STEM experiences and
efforts not only inside, but also outside of school (Nugent et al., 2015).
3.4.2.1.5 Hours spent self-studying
Time spent outside of school has been reported to have a positive effect on students’ interest
in STEM majors. The variation of this effect might depend on the moderators such as
programme focus, grade level, and the quality of the programmes. Prior researches has
recognized the effect of out of school time (OST) as a positive, contributing factor to
55
academic success of students in mathematics. Further, the study also provided an assessment
of the extended benefit of OST programme on student interest in STEM. With that said,
STEM programmes that are exclusively academic are less effective in promoting students’
interest in STEM. As it was indicated, students’ interest is not sufficiently developed in OST
settings that lack a social focus. Moreover, the adolescent years are crucial for fostering and
maintaining interest in STEM. Lastly, the synthesis suggested that well-designed studies are
more effective at promoting interest in OST STEM programmes (Young, Ortiz, & Young,
2017).
On the other continuum, OST includes the hours spent self-studying or doing homework. It
was claimed that as the number of hours spent self-studying or doing homework per week
increases, the likelihood of choosing a STEM major increases. It was found that the effect is
more visible the more hours a student spends self-studying. For instance, students who study
or do homework 20 hours or more each week, are approximately 1.6 times more likely to
choose a STEM major (Moakler & Kim, 2014; Trusty, 2002). From a gender perspective,
Trusty (2002) indicated that time spent on homework is weakly and positively related to male
students’ choice of science and mathematics-related majors in comparison to female students.
For women, the amount of time spent on homework outside school only has an indirect effect
through course-taking. In this regard, due to the limited empirical evidence and the contextual
gap in Cambodia, the current study aimed to investigate whether the amount of time the
students spend self-studying or doing homework at home is significantly associated with
aspirations of STEM majors in higher education. This effect is predicted to enhance students’
academic achievement, especially in science and mathematics.
3.4.2.2 Predictors at the family level
3.4.2.2.1 Family income
Since choice of academic major does not only reflect one’s social, cultural, and economic
background, but also determines one’s future educational, social, and economic development,
it could help to either maintain the status quo or to break it depending on the pattern of how
students self-select into different study fields and career paths (Brand & Xie, 2010; Goyette &
Mullen, 2006; Niu, 2017; Seymour & Hewitt, 1997; Xie, Fang, & Shauman, 2015). An
investigation of STEM enrolment, from the socio-economic perspective, suffered from both
56
low quantity and inconsistent findings, particularly on the direction of the association between
family SES and patterns of choosing one’s major (Nui, 2017).
Notwithstanding, there seem to be two schools of debates. Some studies have found that
students with high SES are more likely to enrol in science majors, while others have
concluded that students with high SES are more likely to choose culturally intensive majors,
such as social and the humanities (Ma, 2009). For decades, research has suggested that there
are fewer underrepresented students with low SES in STEM fields compared to their more
socio-economically advantaged counterparts (e.g. Kienzl & Trent, 2009; Mau & Li, 2018;
Sianou-Kyrgioy, 2010). Moreover, they even tended to give up on their major after
sometimes due to the conflict between the financial burden they carry and the demanding
workload of STEM majors (Seymour & Hewitt, 1997; Shaw & Barbuti, 2010). Low SES
students receive less assistance with school-related tasks due to their parents’ limited
education, time, and financial resources, and also have limited access to role models with a
college degree (Engle & Tinto, 2008; Kao, 2019b; Kao & Shimizu, 2019). Furthermore,
social connections and cultural resources are often scarce. Thus, children from these families
may lack educational support from family and school in preparing for college. Nui (2017) and
Kao and Shimizu (2019) recently confirmed that family SES is a source of inequality in
STEM enrolment, even after controlling for the level of academic preparation. Students with
high SES benefit from pushing effects to pursue STEM studies, while low SES students are
disadvantaged in making well-informed decisions regarding STEM enrollment. High SES
families can provide their children with encouragement, support, and exposure to science, as
well as access to any STEM enrichment experiences necessary to develop and sustain early
interest, confidence, and aspirations in STEM fields (Xie, Fang, & Shauman, 2015). In
addition to the home environment, the context of high school and the mathematics/science
curriculum offered to students varies greatly, with schools serving low SES families
providing few STEM educational opportunities to students (Becker, 1986; Conrad, Canetto,
MacPhee, & Farro, 2009; Oakes, 1990).
On the other continuum, others counter argued that for economically disadvantaged students,
the decision to attend college and arguably major in STEM is rooted in cultural norms and
expectations. They found that economically disadvantaged students generally have more
confidence in their STEM majors than their high-income counterparts (Brand & Xie, 2010;
Lichtenberger & George-Jackson, 2013). Socio-economic status continues to exert significant
57
influence well beyond general education level, since high SES students make up a
disproportionate percentage of those obtaining STEM degrees (Chen, 2009; Ware & Lee,
1988). Though family background plays an influential role in acquiring the academic skills
necessary to attain a postsecondary degree, it does not play a direct role in the pursuit and
attainment of a STEM degree specifically (Chen & Soldner, 2014; Ma, 2009). Traditionally
underserved students with a higher likelihood of being economically disadvantaged have
maintained a relatively high level of interest in STEM while traditionally served and well-
represented students have maintained a relatively low interest in STEM. Students from high
and middle-high income families have significantly lower odds of developing an early interest
in STEM relative to their low-income counterparts (Leppel, Williams & Waldauer, 2001;
Lichtenberger & George-Jackson, 2013). Also, high school students from low SES families
may be more likely to perceive STEM majors as leading them directly to the workforce,
potentially reducing the opportunity costs associated with attending college.
3.4.2.2.2 Parental educational aspiration
It has been previously found that family environment plays an important role in students’
decision to continue in science (Dick & Rallis, 1991; Grandy, 1992; Huang, Taddese, &
Walter, 2000; Miller & Kimmel, 2012; Wells & Gaus, 1991, as cited in Wang, 1995). In
questioning way, male students regarded their family environment to be more of an
encouraging factor than did female students (Wang, 1995). Furthermore, as to confirm this
finding, a study conducted in Korea by Myeong, Jeon, Crawley, and Frank (1991) has also
found that parents’ intention is an influential factor, and is likely to be stronger for students in
the science track than for their counterparts in non-science track. Simply put, the finding
claimed that if parents’ intention is for their children to study a non-science subject, they may
not force their children to comply with their wishes. In contrast, if parents favour science,
they will be more determined for their children choose science. In line with this, other
research has found that parents’ interest in science is greater than in arts, and fathers influence
their sons more through their interests, this outcome was smaller for a group of women with
professional mothers (Crisp, Nora, & Taggart, 2009; Hodson & Freeman, 1983; Seymour &
Hewitt, 1997). Furthermore, the study also discovered that women are about twice as likely as
men to choose to major in science and engineering because of the active influence of someone
close to them, especially their parents (Seymour & Hewitt, 1997). Cambodian families are no
exception. As revealed by a very recent survey conducted by Cambodian Federation of
58
Employers and Business Associations (CAMFEBA), 10% of the upper secondary school
students would follow their parents’ intentions, regardless of their own interests (CAMFEBA,
2008). However, the question on how this intention differs between science and non-science
track students remains to be investigated.
3.4.2.2.3 Parental encouragement and support
In the family environment, family encouragement and support were reported to be one of the
influential factors in students’ choice of major. In Asian cultures, children tended to obey
their parents and meet parental expectations. Thus, students with greater parental supports are
more likely to choose STEM rather than social science or humanity majors (Dom & Yi, 2018;
Lent et al., 2018; Shen, 2015; Lowinger & Song, 2017; Miller & Kimmel, 2012). Empirically,
students, in an unquestioning way, follow in their family’s footsteps so as to support for the
family career trend (CAMFEBA, 2008; Malecki & Demaray, 2002; Porter & Umbach, 2006;
Seymour & Hewitt, 1997; Simpson, 2001). Thus, students whose family career trend is in
science would be more likely to maintain it, although without the impact of parental intention.
For example, a study to investigate the factors both within school and outside of school that
affect students towards or away from higher education course in one of physical science or
engineering in Portugal found that students who majored in this field have more probability of
coming from a scientific home background. This reflects the fact that, despite there being no
intentional advice from a parent or sibling, student’s probability of entering into STEM
majors stems mainly from the family member who is working in that field. It was
contextually found that parents play an important role in assisting students to select the right
academic majors (Durdyev & Ihtiyar, 2019) and in inspiring students’ interest in STEM
majors and that parental support seems to have a greater influence on STEM interests
compared to non-STEM fields (Eng & Szmodiz, 2016). More specifically, based on gender
stratification, research has found that there is a disparity across genders. It was argued that
parental expectations convey to children could influence females’ attitudes towards
mathematics and science, and their perception of mathematics and science-related majors
(Gunderson et al., 2012; Tenenbaum & Leaper, 2003). In addition, students develop higher
self-efficacy and STEM outcome expectations when parents stressed the importance and
value of these subjects and support STEM experiences and efforts, both inside and outside
school. Perceived parental support also predicts science and mathematics self-efficacy (Lent
et al., 2018; Navarro et al., 2007; Nugent et al., 2015; Ekmekci et al., 2019).
59
3.4.2.2.4 Siblings and relatives’ majors
From the perspective of family environment, besides parents, siblings and other close
relatives can also play a significant role in students’ choice of major. Students’ decision of the
major is also affected by the experienced family members—siblings and relatives
(CAMFEBA, 2008; Kao & Shimizu, 2019; Poeu, 2017; Seymour & Hewitt, 1997). There is a
limited number of available empirical evidence to explain this phenomenon. Yet, the study in
Cambodia conducted by CAMFEBA (2008) revealed that experienced family members and
relatives could orientate students on the majors they should take in higher education.
However, the question on how these experienced family members influenced students’ choice
of science and engineering-related remains to be unanswered. This finding was later
confirmed by a recent study by Kao and Shimizu (2019). Study by Seymour and Hewitt
(1997) also indicated that in either a questioning way or unquestioning way, students opt for a
major based on what their experienced family members are doing; they aimed not only to
keep track of the family career trends, but also to obtain a clear vision that the major was
feasible for them (Seymour & Hewitt, 1997). The study, thus, seemed to indicate that older
siblings or close relatives who majored (or are majoring) in STEM will be a more
encouraging factor for students to follow in their footsteps. A recent study has also revealed
that young people placed their trust in their family or khsae (meaning “string” or “social
network” in Khmer language) in deciding what major to study. One might choose to study a
certain degree because in the khsae, older relatives could potentially influence the workplace
(Poeu, 2017). In this respect, if family members or close relatives majored (or are majoring)
in STEM, this would increase the probability of students pursuing the same field in higher
education.
3.4.2.3 Predictors at the school level
3.4.2.3.1 Science and mathematics teachers’ support
From the standpoint of social support, science and mathematics teachers in any part of the
world can learn an important lesson about attracting students to science-related courses.
Upper secondary school science and mathematics teachers have significant influence on
students’ choice of STEM major. The influences of upper secondary school science and
mathematics teachers are critical in inspiring some students to follow them into mathematics
or science. Psychologically, students might view them as role models (George, 2012; Kao &
60
Shimizu, 2019; Malecki & Demaray, 2002; Myeong et, al., 1991; Seymour & Hewitt, 1997;
Woolnough, 1991). It was also confirmed that good science and mathematics teachers inspire
students to take up majors or a career in these subjects. They are likely to have a positive
effects in persuading students to continue with science.
Science and mathematics teachers can interpret the curriculum and interact with students on a
daily basis by helping students realize the significance of the subject matter and activities;
from their evaluations, teachers can influence how students think about their self-efficacy in
the subjects involve, as well as changing students’ beliefs about the consequences of choosing
science (Gaskell, Mclaren, Oberg, & Eyre, 1993; Lindner et al., 2004; Myeong et al., 1991;
Woolnough, 1994a). Seymour and Hewitt (1997) and Mau and Li (2018) also supported this
finding, and affirmed that science and mathematics teachers influence students in several
ways.
First, good teachers are critical to the development of a strong interest in science and
mathematics and to build a good foundation for basic knowledge and skills. The teachers who
dazzle, excited, and promote their discipline have often been cited as students’ primary
inspiration for choosing a science and engineering related majors. The influence of some
teachers is vital in inspiring students to follow them into teaching science or mathematics.
Therefore, upper secondary school science and mathematics teachers are influential factors in
explaining students’ probability of choosing science and engineering majors in higher
education. Moreover, it was found that teacher’s expectations have a long-lasting effect on
achievement compared to parents’ expectations. It has also been shown that expectations and
encouragement from mathematics and science teachers each has strong and positive
correlation with students’ academic success and pursuit of STEM majors. Research has
shown that the crucial role of science and mathematics teachers is increasing students’ interest
and motivation to pursue STEM in higher education (Bottia, Stearns, Mickelson, Moller, &
Valentino, 2015; Heaverlo, 2011; Lee, Min, & Mamerow, 2015; Palmer, Maramba, & Dancy,
2011; Shumow & Schmidt, 2013). Good high school science and mathematics teachers with
genuine personal interest in the subjects they teach are pivotal in inspiring students to follow
them into teaching mathematics and science (Seymour & Hewitt, 1997).
From the perspective teachers’ gender, female science and mathematics teachers can
influence female students in two ways: as passive and active representatives. In the first
61
instance, the sizeable number of science and mathematics teachers may interrupt the cognitive
association (i.e. gender schema) that increases girls enrolment in STEM fields. On the active
side, female teachers in science and mathematics have been shown to have higher subjective
evaluations of their female students and encourage them more than male teachers do (Ma,
2011; Stearns et al., 2016). This is consistent with the ecology model by Erdogan and Stuessy
(2015) and Mitchell (2016), who claimed that teachers serve to support students’ development,
which in turn spiritually supports students to choose a STEM major in higher education.
3.4.2.3.2 Interactive science and mathematics lessons
Along with the curriculum, from a pedagogical perspective, a major part of classroom
learning is how teachers educate students and how this influences students’ choice of major.
Besides quantitative exposure to science and mathematics, the quality instruction also matters
in terms of increasing students’ interest in STEM majors. Students come to class with unique
ways of processing information, and when their teachers’ instructional methods match with
students’ learning styles, they often experienced higher achievement (Rakow & Bermudez,
1993). Science is characterised as a field—independent course where students are expected to
ask questions, carry out investigations, look for answers, and come up with formulas (Lee &
Luykx, 2006). Moreover, there were also indications that the chosen pedagogy can have an
important impact on students’ interest. Therefore, teachers should vary their teaching methods
and pedagogical novelty (Holmegaard et al., 2014; Potvin et al., 2018) to ignite students’
interest in STEM.
A large body of the literature presents convincing conclusions that engaging students in active
learning—as well as pedagogical approaches that engage them intellectually and entail
thinking, problem-solving, questioning, or analyzing information—can improve their
performance and lead them to pursue their intentions in majoring STEM (Graham, Frederick,
Byars-Winston, Hunter, & Handelsman, 2013; Lopatto, 2007; Wang & Lee, 2019). A study
on increasing the persistence of college students in STEM majors indicated that active
learning experiences are inspiring, as they incorporated classroom teaching practices that
engaged students in the learning process; further “active” or “interactive” or student-centered
pedagogies (such as collaborative learning) has been shown to increase students’ enrolment
into STEM majors (Erdogan & Stuessy, 2015; Gibson & Chase, 2002; Graham et al., 2013;
Simon, Aulls, Dedic, Hubbard, & Hall, 2015). Therefore, the current study hypothesized that
62
besides the different numbers of courses taken in science and mathematics (science versus the
social science track and NGS), interactive science and mathematics teaching at the upper
secondary school level would significantly affect students’ aspirations of STEM majors in
higher education.
3.5 Studies on the choice of STEM major: Cambodian perspective
The mismatch between students’ choice of major and the demand for STEM graduates is a
long-standing issue. To address the mismatch, it is indispensable to investigate the factors that
influence students’ choice of STEM majors. However, in the Cambodian context, little
research has investigated and provided evidence-based approaches to deal with this problem.
Empirically, several studies have conducted to explore the factors influencing Cambodian
students’ choice of STEM major in higher education. Table 3.9 summarizes their findings.
Overall, they are mainly retrospective, cross-sectional studies that only investigated students
who had already made a final choice and enrolled in a higher education institution. First, for
instance, the study by Kao and Shimizu (2019) retrospectively identified the factors that
influenced students’ current majors in higher education. The study was conducted with
freshmen who had already chosen their academic majors at different higher education
institutions to discern the different characteristics among students who had chosen science
and engineering (versus non-science and engineering) majors. Moreover, merely extended the
scope of the sample from the previous study, another retrospective, quantitative investigation
by Eam et al. (2019) also employed the cross-sectional designs to identify the variables that
explain Cambodian freshmen’s choice of STEM versus non-STEM majors in higher
education. Third, although study by Pen (2011) investigated the upper secondary school
students’ aspirations of the choice of major, the study was a purely cross-sectional, and the
samples were limited to 175 students. On top of this, Pen did not focus primarily on the
choice of STEM majors, but rather on the choice of academic major in general. In short, due
to the conceptual limitations in the extant research in the context, the current study fills the
gap in the literature on students’ aspirations of STEM majors in the Southeast Asian context
in general, and in the developing world (like that of Cambodian upper secondary school) in
particular.
To reiterate, the current study is unique in terms of its two main characteristics. First, the
current study employed an explanatory sequential mixed method approaches in repeated
63
cross-sectional designs to track students from the upper secondary school level to their
prospective choice of STEM major in higher education. The study investigated the effects of
tracking on time-varying covariates that influence students’ choice of STEM major, as well as
students’ aspirations of STEM majors. Second, the current study employed a conceptual
framework grounded in the four theoretical and conceptual models that supported the study’s
repeated cross-sectional investigation nature. These four conceptual models were utilised
based on the theoretical foundations of holland’s vocational choice theory, rational choice
theory, and human capital theory.
On the other continuum, since upper secondary school year has been revealed to have
significant influence on students’ STEM choice in higher education and future career (e.g.
Holmegaard, 2015; Ito & McPherson, 2018; Mean et al., 2018; Nugent et al., 2015; Ruse &
Xu, 2018; Wang, 2013), the current study targeted the samples of upper secondary school
students (rather than students who have already made a final choice and enrolled in higher
education) and scrutinized how students who chose to attend in different tracks at upper
secondary school were influenced in terms of their science outcomes (i.e. aspirations of
STEM majors). Therefore, effective interventions to enhance students’ STEM aspirations
could be drawn and implemented in the very early grades of upper secondary school
education. Table 3.9 below outlines the summary findings covering the main focus, data
source(s), samples, outcome variables, and predictor variables of the extant study conducted
in the Cambodian context.
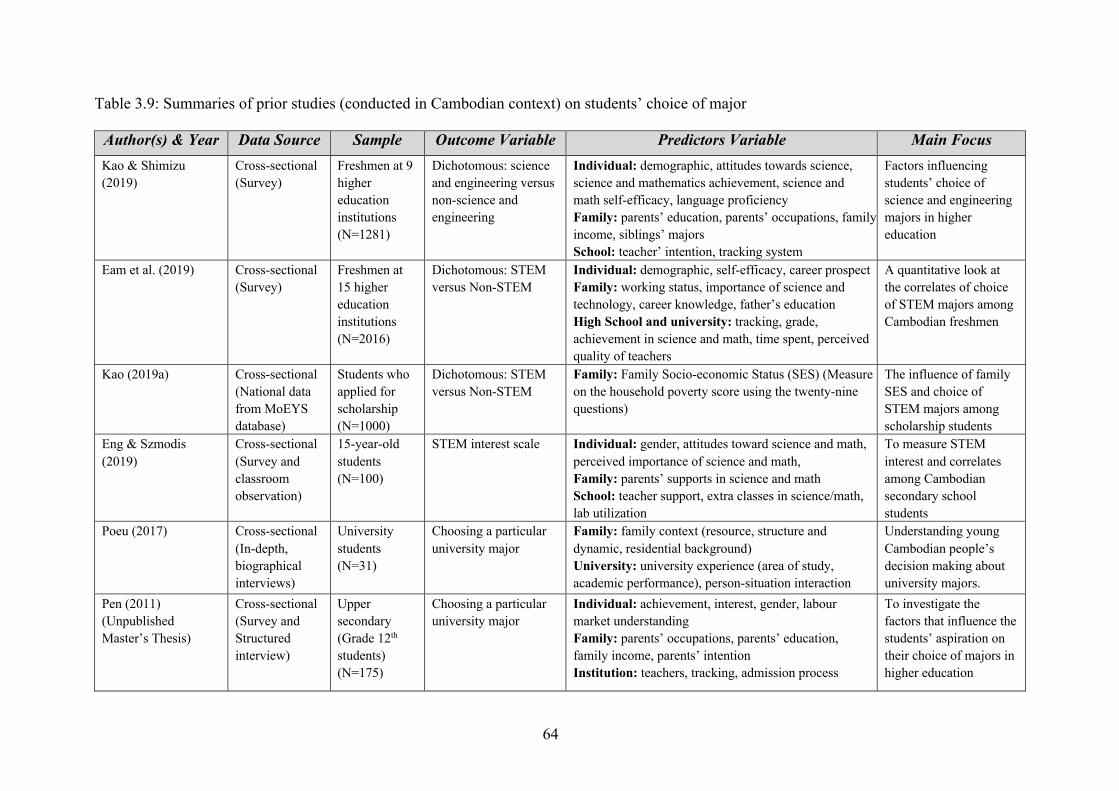
64
Table 3.9: Summaries of prior studies (conducted in Cambodian context) on students’ choice of major
Author(s) & Year Data Source Sample Outcome Variable Predictors Variable Main Focus Kao & Shimizu (2019)
Cross-sectional (Survey)
Freshmen at 9 higher education institutions (N=1281)
Dichotomous: science and engineering versus non-science and engineering
Individual: demographic, attitudes towards science, science and mathematics achievement, science and math self-efficacy, language proficiency Family: parents’ education, parents’ occupations, family income, siblings’ majors School: teacher’ intention, tracking system
Factors influencing students’ choice of science and engineering majors in higher education
Eam et al. (2019) Cross-sectional (Survey)
Freshmen at 15 higher education institutions (N=2016)
Dichotomous: STEM versus Non-STEM
Individual: demographic, self-efficacy, career prospect Family: working status, importance of science and technology, career knowledge, father’s education High School and university: tracking, grade, achievement in science and math, time spent, perceived quality of teachers
A quantitative look at the correlates of choice of STEM majors among Cambodian freshmen
Kao (2019a) Cross-sectional (National data from MoEYS database)
Students who applied for scholarship (N=1000)
Dichotomous: STEM versus Non-STEM
Family: Family Socio-economic Status (SES) (Measure on the household poverty score using the twenty-nine questions)
The influence of family SES and choice of STEM majors among scholarship students
Eng & Szmodis (2019)
Cross-sectional (Survey and classroom observation)
15-year-old students (N=100)
STEM interest scale Individual: gender, attitudes toward science and math, perceived importance of science and math, Family: parents’ supports in science and math School: teacher support, extra classes in science/math, lab utilization
To measure STEM interest and correlates among Cambodian secondary school students
Poeu (2017) Cross-sectional (In-depth, biographical interviews)
University students (N=31)
Choosing a particular university major
Family: family context (resource, structure and dynamic, residential background) University: university experience (area of study, academic performance), person-situation interaction
Understanding young Cambodian people’s decision making about university majors.
Pen (2011) (Unpublished Master’s Thesis)
Cross-sectional (Survey and Structured interview)
Upper secondary (Grade 12th students) (N=175)
Choosing a particular university major
Individual: achievement, interest, gender, labour market understanding Family: parents’ occupations, parents’ education, family income, parents’ intention Institution: teachers, tracking, admission process
To investigate the factors that influence the students’ aspiration on their choice of majors in higher education
65
3.6 Synthesis of the literature
Synthesis of the extant international and local literature reveals that a number of factors
involving in the complex process of students’ choice of majors in general, and their choice of
STEM majors in particular. Previous studies have thrown several implications for further
examination. First, the decision to pursue a STEM major is not a one-time decision, but an
on-going process that begins in upper secondary school education (Holmegaard, 2015; Ito &
McPherson, 2018; Lee, Min, & Mamerow, 2015; Lent et al., 2018; Lent, Lopez Jr, Lopez, &
Sheu, 2008; Mean et al., 2018; Nugent et al., 2015; Palmer, Maramba, & Dancy, 2011; Ruse
& Xu, 2018; Wang, 2013). Since extant studies are cross-sectional of their kind, a repeated
measures cross-sectional designs is vital to further delineate how the factors explain the
students’ choice of science track, and how the study track influences students to further
transition into a STEM major in higher education throughout their time at upper secondary
school. Put simply, despite a growing body of research describing the myriad factors that
influence whether or not a student chooses a STEM major, little research has explored the
lasting effects of such factors, which necessarily requires panel data analysis of upper
secondary school and higher education nexus. In other words, not many research studies have
examined the matriculation of the students from the science track at upper secondary school
into STEM majors in higher education (Kao & Shimizu, 2019; Moakler & Kim, 2014; Ruse
& Xu, 2018).
From an analytical perspective, employing a method which could account for testing the
effects of the predictors when students are nested in different classes of upper secondary
school is inevitable. Research on STEM education represents substantial empirical efforts to
form a better understanding of the underlying factors that influence students’ choice of STEM
majors. However, few academic studies have dealt with the very first step of STEM
participation: why students choose STEM majors. The primary focus of contemporary
research is based on national samples revolves around students who have already chosen
STEM majors (e.g., Eam et al., 2019; Eng & Szmodis, 2016; Kao & Shimizu, 2019). Aside
from the imperative need to add to the empirical knowledge on STEM enrolment, studies in
this vein have also called for a new theoretical framework that holistically captures the
supports and barriers affecting upper secondary school students in choosing a major.
Although these investigations are well grounded in prior literature, their conceptual
consideration provides limited insight, and does not explicitly account for the developmental
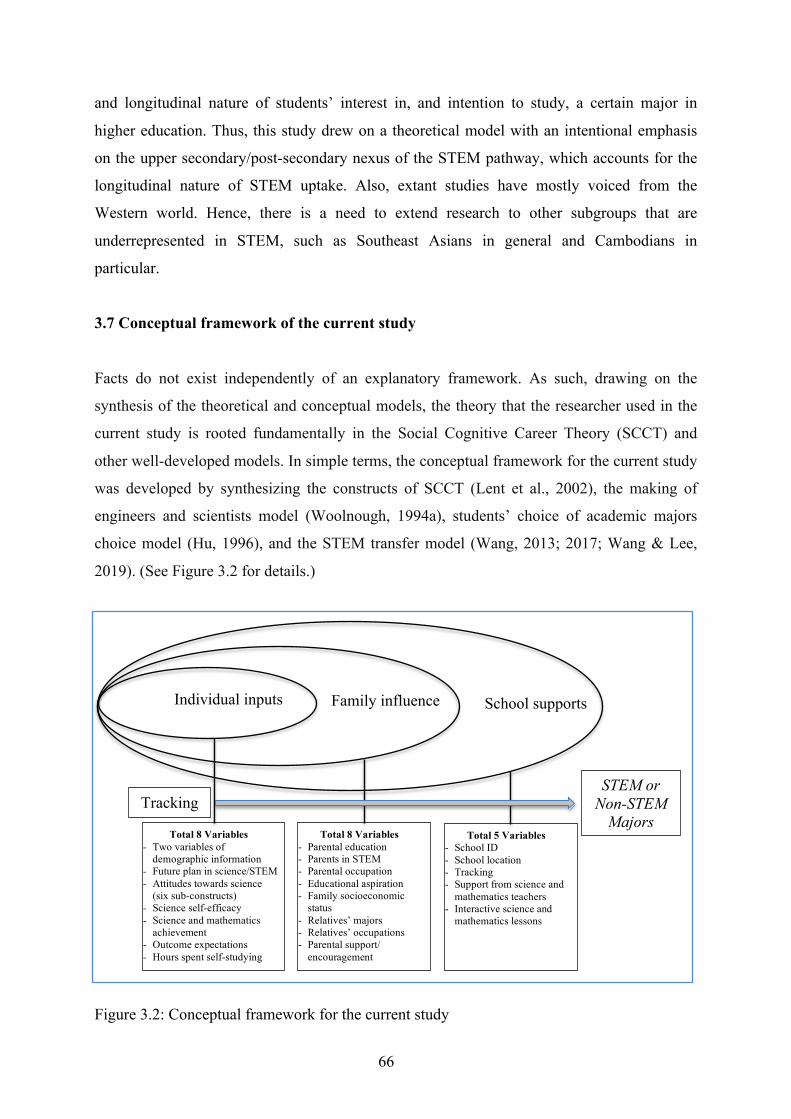
66
and longitudinal nature of students’ interest in, and intention to study, a certain major in
higher education. Thus, this study drew on a theoretical model with an intentional emphasis
on the upper secondary/post-secondary nexus of the STEM pathway, which accounts for the
longitudinal nature of STEM uptake. Also, extant studies have mostly voiced from the
Western world. Hence, there is a need to extend research to other subgroups that are
underrepresented in STEM, such as Southeast Asians in general and Cambodians in
particular.
3.7 Conceptual framework of the current study
Facts do not exist independently of an explanatory framework. As such, drawing on the
synthesis of the theoretical and conceptual models, the theory that the researcher used in the
current study is rooted fundamentally in the Social Cognitive Career Theory (SCCT) and
other well-developed models. In simple terms, the conceptual framework for the current study
was developed by synthesizing the constructs of SCCT (Lent et al., 2002), the making of
engineers and scientists model (Woolnough, 1994a), students’ choice of academic majors
choice model (Hu, 1996), and the STEM transfer model (Wang, 2013; 2017; Wang & Lee,
2019). (See Figure 3.2 for details.)
Figure 3.2: Conceptual framework for the current study
Family influence Individual inputs School supports
Total 8 Variables - Two variables of
demographic information - Future plan in science/STEM - Attitudes towards science
(six sub-constructs) - Science self-efficacy - Science and mathematics
achievement - Outcome expectations - Hours spent self-studying
Total 8 Variables - Parental education - Parents in STEM - Parental occupation - Educational aspiration - Family socioeconomic
status - Relatives’ majors - Relatives’ occupations - Parental support/
encouragement
Total 5 Variables - School ID - School location - Tracking - Support from science and
mathematics teachers - Interactive science and
mathematics lessons
STEM or Non-STEM
Majors Tracking
67
The lens of the synthesized model and the extant literature indicate that individual input
(ability, attitudes, etc.), family influence (advice, financial support, etc.), and upper secondary
school supports (learning experiences and support etc.) are key constructs to be investigated
in the theory. Applying this concept to this study, the researcher posited that the independent
variable(s) of the three dimensions of individual input, family influence, and upper secondary
school support could influence or explain the dependent variable of students’ transition from
the upper secondary school science track to STEM majors in higher education. Figure 3.2
illustrates the holistic picture of the conceptual framework of the current study.
It should be noted again that the current study used the synthesized conceptual framework to
address one main research objective; that is, to quantitatively examine the effects of tracking
and the three dimensions (i.e. individual input, family influence, and upper secondary school
support) on students’ choice of STEM majors in higher education in Cambodia. Next, the
study discusses the variables and their indicators (as synthesized from the literature review
through the lens of the conceptual framework).
Dependent variable: For the analysis, within the individual dimension, the dependent
variable (i.e. choosing a science track and majoring in STEM) was measured. The STEM
majors in this study consisted of two items: whether students are considering in a STEM field
in university and asking students about the specific major they want to pursue. According to the
synthesized list of majors (see Appendix 1), researcher then classified the majors listed by the
respondents into two broad fields of STEM and non-STEM majors. To reiterate, the list
resulted from the synthesis of the contextual category of MoEYS (2009, 2016b, 2020c), the
classification of STEM majors by the National Center for Education Statistics (NCES), and
the classification of STEM majors by several prior studies (i.e. Chen, 2013; Chen & Weko,
2009; Crisp et al., 2009; Green, 2007; Ulicna & Royale, 2015; Wang & Lee, 2019).
Independent variables: The total number of independent variables (excluding the
demographic variables) in the two-sections questionnaire consisted basically of eight key
constructs. The study further classified these constructs into specific variables after
exploratory factor analysis with principal axis factoring and Varimax and Keiser
normalization in rotation. Each construct contained from 2 to 35 items, measured by a 1–4, 1–
5, and 1–6-point Likert scale (see Table 3.10 for details). Measurements of the variables were
developed based on current empirical investigations, with some modifications to fit the
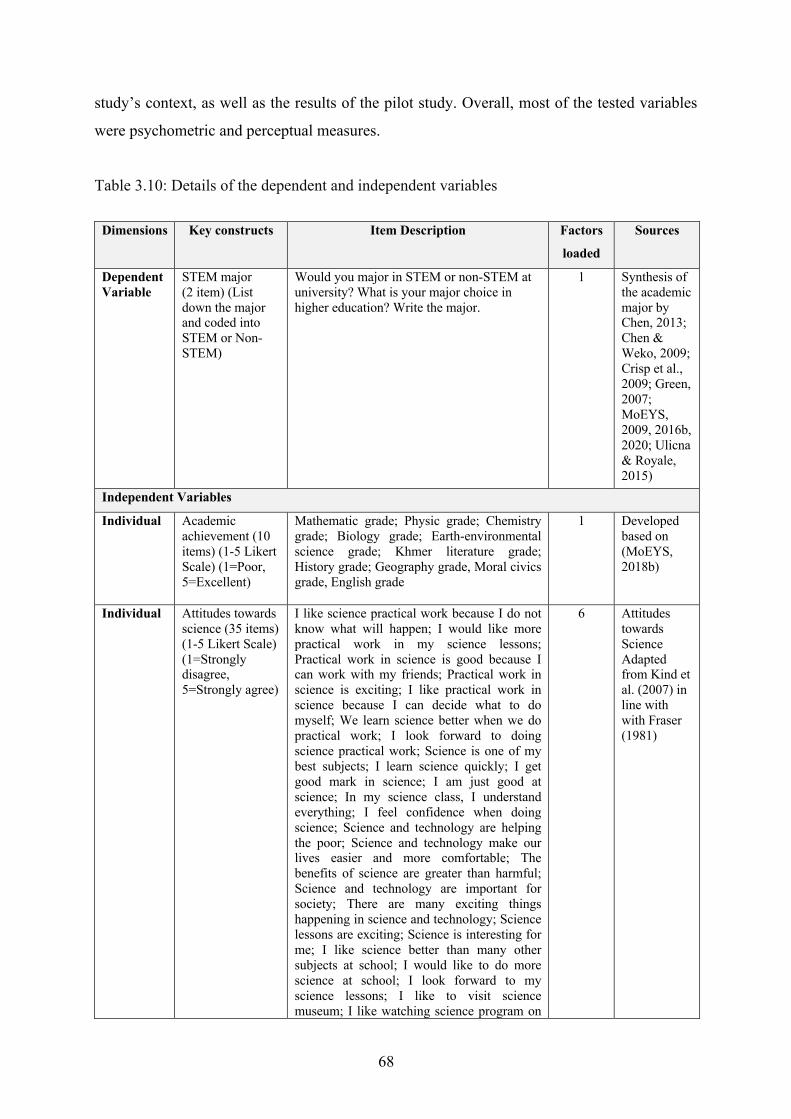
68
study’s context, as well as the results of the pilot study. Overall, most of the tested variables
were psychometric and perceptual measures.
Table 3.10: Details of the dependent and independent variables
Dimensions Key constructs Item Description Factors
loaded
Sources
Dependent Variable
STEM major (2 item) (List down the major and coded into STEM or Non-STEM)
Would you major in STEM or non-STEM at university? What is your major choice in higher education? Write the major.
1 Synthesis of the academic major by Chen, 2013; Chen & Weko, 2009; Crisp et al., 2009; Green, 2007; MoEYS, 2009, 2016b, 2020; Ulicna & Royale, 2015)
Independent Variables
Individual Academic achievement (10 items) (1-5 Likert Scale) (1=Poor, 5=Excellent)
Mathematic grade; Physic grade; Chemistry grade; Biology grade; Earth-environmental science grade; Khmer literature grade; History grade; Geography grade, Moral civics grade, English grade
1 Developed based on (MoEYS, 2018b)
Individual Attitudes towards science (35 items) (1-5 Likert Scale) (1=Strongly disagree, 5=Strongly agree)
I like science practical work because I do not know what will happen; I would like more practical work in my science lessons; Practical work in science is good because I can work with my friends; Practical work in science is exciting; I like practical work in science because I can decide what to do myself; We learn science better when we do practical work; I look forward to doing science practical work; Science is one of my best subjects; I learn science quickly; I get good mark in science; I am just good at science; In my science class, I understand everything; I feel confidence when doing science; Science and technology are helping the poor; Science and technology make our lives easier and more comfortable; The benefits of science are greater than harmful; Science and technology are important for society; There are many exciting things happening in science and technology; Science lessons are exciting; Science is interesting for me; I like science better than many other subjects at school; I would like to do more science at school; I look forward to my science lessons; I like to visit science museum; I like watching science program on
6 Attitudes towards Science Adapted from Kind et al. (2007) in line with with Fraser (1981)
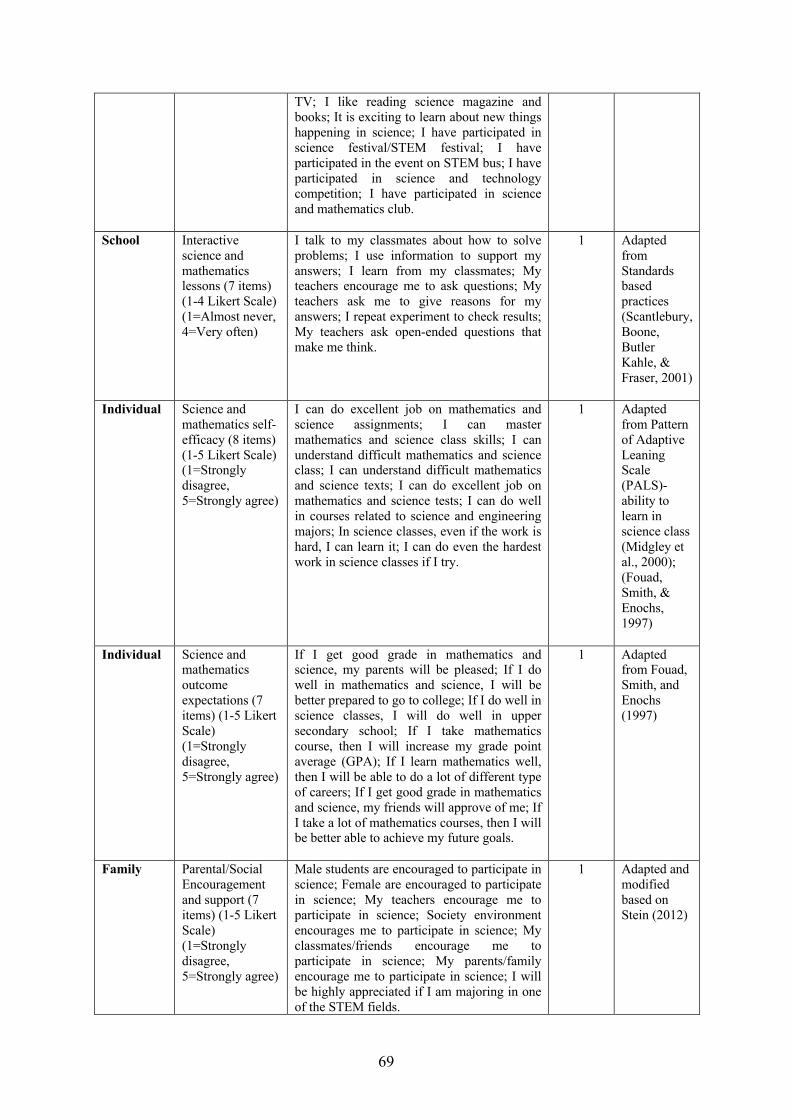
69
TV; I like reading science magazine and books; It is exciting to learn about new things happening in science; I have participated in science festival/STEM festival; I have participated in the event on STEM bus; I have participated in science and technology competition; I have participated in science and mathematics club.
School Interactive science and mathematics lessons (7 items) (1-4 Likert Scale) (1=Almost never, 4=Very often)
I talk to my classmates about how to solve problems; I use information to support my answers; I learn from my classmates; My teachers encourage me to ask questions; My teachers ask me to give reasons for my answers; I repeat experiment to check results; My teachers ask open-ended questions that make me think.
1 Adapted from Standards based practices (Scantlebury, Boone, Butler Kahle, & Fraser, 2001)
Individual Science and mathematics self-efficacy (8 items) (1-5 Likert Scale) (1=Strongly disagree, 5=Strongly agree)
I can do excellent job on mathematics and science assignments; I can master mathematics and science class skills; I can understand difficult mathematics and science class; I can understand difficult mathematics and science texts; I can do excellent job on mathematics and science tests; I can do well in courses related to science and engineering majors; In science classes, even if the work is hard, I can learn it; I can do even the hardest work in science classes if I try.
1 Adapted from Pattern of Adaptive Leaning Scale (PALS)-ability to learn in science class (Midgley et al., 2000); (Fouad, Smith, & Enochs, 1997)
Individual Science and mathematics outcome expectations (7 items) (1-5 Likert Scale) (1=Strongly disagree, 5=Strongly agree)
If I get good grade in mathematics and science, my parents will be pleased; If I do well in mathematics and science, I will be better prepared to go to college; If I do well in science classes, I will do well in upper secondary school; If I take mathematics course, then I will increase my grade point average (GPA); If I learn mathematics well, then I will be able to do a lot of different type of careers; If I get good grade in mathematics and science, my friends will approve of me; If I take a lot of mathematics courses, then I will be better able to achieve my future goals.
1 Adapted from Fouad, Smith, and Enochs (1997)
Family Parental/Social Encouragement and support (7 items) (1-5 Likert Scale) (1=Strongly disagree, 5=Strongly agree)
Male students are encouraged to participate in science; Female are encouraged to participate in science; My teachers encourage me to participate in science; Society environment encourages me to participate in science; My classmates/friends encourage me to participate in science; My parents/family encourage me to participate in science; I will be highly appreciated if I am majoring in one of the STEM fields.
1 Adapted and modified based on Stein (2012)
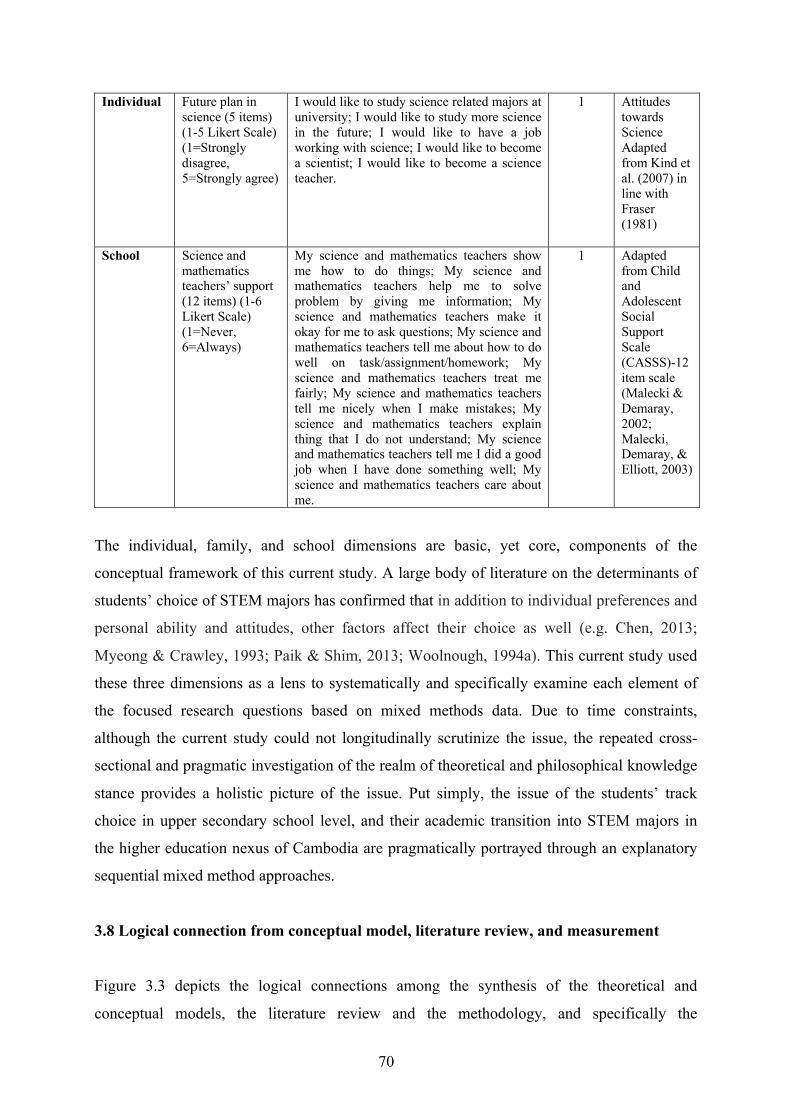
70
Individual Future plan in science (5 items) (1-5 Likert Scale) (1=Strongly disagree, 5=Strongly agree)
I would like to study science related majors at university; I would like to study more science in the future; I would like to have a job working with science; I would like to become a scientist; I would like to become a science teacher.
1 Attitudes towards Science Adapted from Kind et al. (2007) in line with Fraser (1981)
School Science and mathematics teachers’ support (12 items) (1-6 Likert Scale) (1=Never, 6=Always)
My science and mathematics teachers show me how to do things; My science and mathematics teachers help me to solve problem by giving me information; My science and mathematics teachers make it okay for me to ask questions; My science and mathematics teachers tell me about how to do well on task/assignment/homework; My science and mathematics teachers treat me fairly; My science and mathematics teachers tell me nicely when I make mistakes; My science and mathematics teachers explain thing that I do not understand; My science and mathematics teachers tell me I did a good job when I have done something well; My science and mathematics teachers care about me.
1 Adapted from Child and Adolescent Social Support Scale (CASSS)-12 item scale (Malecki & Demaray, 2002; Malecki, Demaray, & Elliott, 2003)
The individual, family, and school dimensions are basic, yet core, components of the
conceptual framework of this current study. A large body of literature on the determinants of
students’ choice of STEM majors has confirmed that in addition to individual preferences and
personal ability and attitudes, other factors affect their choice as well (e.g. Chen, 2013;
Myeong & Crawley, 1993; Paik & Shim, 2013; Woolnough, 1994a). This current study used
these three dimensions as a lens to systematically and specifically examine each element of
the focused research questions based on mixed methods data. Due to time constraints,
although the current study could not longitudinally scrutinize the issue, the repeated cross-
sectional and pragmatic investigation of the realm of theoretical and philosophical knowledge
stance provides a holistic picture of the issue. Put simply, the issue of the students’ track
choice in upper secondary school level, and their academic transition into STEM majors in
the higher education nexus of Cambodia are pragmatically portrayed through an explanatory
sequential mixed method approaches.
3.8 Logical connection from conceptual model, literature review, and measurement
Figure 3.3 depicts the logical connections among the synthesis of the theoretical and
conceptual models, the literature review and the methodology, and specifically the
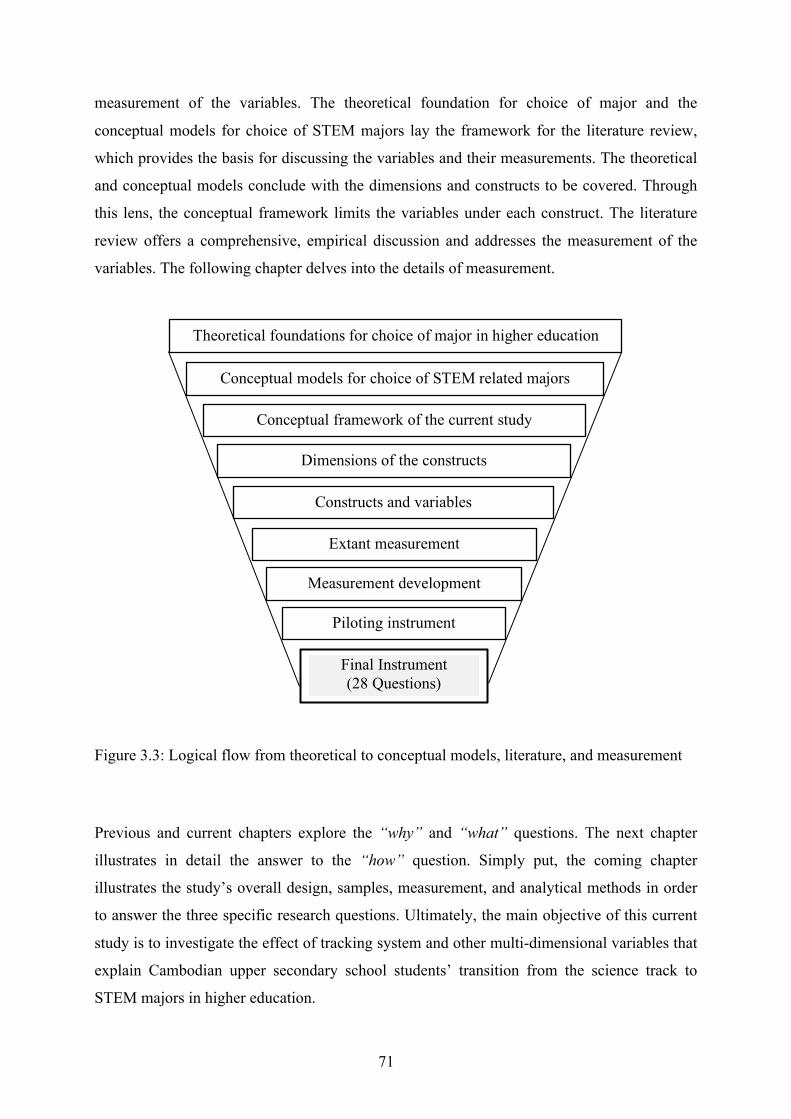
71
measurement of the variables. The theoretical foundation for choice of major and the
conceptual models for choice of STEM majors lay the framework for the literature review,
which provides the basis for discussing the variables and their measurements. The theoretical
and conceptual models conclude with the dimensions and constructs to be covered. Through
this lens, the conceptual framework limits the variables under each construct. The literature
review offers a comprehensive, empirical discussion and addresses the measurement of the
variables. The following chapter delves into the details of measurement.
Figure 3.3: Logical flow from theoretical to conceptual models, literature, and measurement
Previous and current chapters explore the “why” and “what” questions. The next chapter
illustrates in detail the answer to the “how” question. Simply put, the coming chapter
illustrates the study’s overall design, samples, measurement, and analytical methods in order
to answer the three specific research questions. Ultimately, the main objective of this current
study is to investigate the effect of tracking system and other multi-dimensional variables that
explain Cambodian upper secondary school students’ transition from the science track to
STEM majors in higher education.
Conceptual models for choice of STEM related majors
Conceptual framework of the current study
Dimensions of the constructs
Constructs and variables
Extant measurement
Theoretical foundations for choice of major in higher education
Measurement development
Final Instrument (28 Questions)
Piloting instrument
72
CHAPTER FOUR: RESEARCH METHODOLOGY
The previous three chapters explained the question of “why” and “what” the current study is
about. This chapter, thus, answers the question of “how” the study was conducted in order to
respond to the “what” question. Chapter four starts with a description of overall design of the
study, justifications for selecting the research context and its descriptions, the procedures for
samples selection and their characteristics, and the research site. The chapter then delves into
the details of the data collection procedures, the instrument and measurement of each
variable, and briefly summarizes the analytical tools employed to achieve the output for the
specific research objectives mentioned in Chapter one. The chapter concludes with the figure
of the study’s analytical framework.
4.1 Philosophical and methodological foundations
According to Slife and William (1995), philosophical foundations (worldview [Guba, 1990],
paradigms [Lincoln, Lynham, & Guba, 2011; Mertens, 2010]) remains largely hidden in
research, even though its influences on the practices of research need to be identified. Thus, it
was suggested that philosophical ideas should be made explicit for the larger philosophical
worldviews they espouse (Creswell & Creswell, 2018). Philosophical worldviews help to
explain why certain kind of (i.e., quantitative, qualitative, or mixed methods) approaches are
employed in research being conducted (Bryman, 2016). In this regard, this section elaborates
on the philosophical foundations that the current study employed to investigate the issue so as
to draw conclusion and implications.
4.1.1 Worldview: The pragmatism of the mixed methods approach
The worldview, philosophical foundations, or paradigms employed in this study take a
pragmatist theoretical stance. To understand why the current study adopted the pragmatism of
the mixed methods approach, it is significant to discuss the different philosophical
foundations frame each research approach. This sub-section briefly discusses the three main
philosophical foundations—post-positivist, constructivist, and pragmatist.
First, the post-positivist view challenges the traditional notion of the absolute truth of
knowledge, and recognises that people cannot be positive about claims of knowledge when
73
studying human behaviours and actions (Creswell & Creswell, 2018; Smallbone & Quinton,
2004). The post-positivist worldview focuses on: the causes that influenced the outcomes; the
intent to reduce an idea into a small, discrete set to test (i.e., variables that comprise
hypotheses and research questions); the observations and measurements of the existing
objective reality out there in the world (i.e., numeric measures of the observations and
behaviour of the individuals); and the laws or theories that govern the world. Thus, to
understand the world, these aspects need to be tested or verified and refined. To reiterate, the
worldview involved is significant, as the philosophical worldview assumptions is related to
the research design and specific method (or procedure of research) that translate the approach
into practice. Post-positivist assumptions hold true for quantitative approaches since they
support theory-driven stance (Creswell & Creswell, 2018).
Another worldview is constructivism or social constructivism, which originated from Berger
and Luckman’s (1967) Social construction of reality and Lincoln and Guba’s (1985)
Naturalistic inquiry. Constructivists believe that people seek to understand the world in which
they live and work through the development of the subjective meanings of their experiences
towards certain objects. With that herein, the goal of the research study is to rely as much as
possible on the views of the situation or condition being examined based on the perspective of
the participants. Researcher guided by a constructivist foundation tends to make sense of the
meanings that others have about the world, rather than to be guided by a theory, to inductively
develop a theory or pattern of meaning about a given situation (Creswell & Creswell, 2018).
The constructivist worldview is seen as an approach to qualitative research.
The pragmatic worldview derives from the work of Peirce, James, Mead, and Dewey; it
emphasizes on the research problem and question, rather than the method. The researcher uses
all approaches available to understand the problem (Creswell & Creswell, 2018), and tries to
apply what works in order to solve it. Pragmatists do not see the world as an absolute unity;
rather they agree that research always occurs in social, historical, and political contexts. They
look to the “what” and the “how” so as to conduct research based on the intended
consequences.
In this regard, as guided by the theoretical framework—and because the factors involved
ultimately have different effects on students’ aspirations of STEM majors upon graduating
from upper secondary school—it was crucial to employ an explanatory sequential mixed
74
methods approaches. In quantitative methods researchers have tested theories by specifying
narrow hypotheses and collecting data to support or to refute them (Creswell & Creswell,
2018). In qualitative approaches, researchers seek to understand a phenomenon through
students’ perceptions. With that said, it was essential to incorporate both quantitative and
qualitative approaches to determine the most significant predictors for Cambodian upper
secondary school students’ science outcomes (i.e. their aspirations of STEM majors) through
the conceptualized lens of empirical theoretical models for students’ choice of STEM majors.
Additionally, it is crucial to ensure that students’ lived experiences are described in their own
words. All in all, the current study entailed an explanatory sequential mixed method
approaches to investigate the relationship between theory and research; which the accent was
placed on testing the theory, and embodied a view of social reality as an external, objective
reality, as well as the students’ subjective explanations and opinion (Bryman, 2016; Cohen &
Morrison, 2007; Creswell & Creswell, 2018). Therefore, this study was guided by the
pragmatism of the mixed method approaches.
4.1.2 Brief methodological framework: The logical flow of the study
The brief methodological framework illustrates the central methodological and conceptual
principles on which this study is based, how it logically relates to the current study’s specific
research questions, and ultimately its main question. Simply illustrate, this study focuses on
how the tracking system between the science and social science tracks and multi-dimensional
factors, influence Cambodian upper secondary school students’ transition to STEM majors in
higher education. Chapter 3 (literature review on choice of STEM majors and conceptual
framework) covers the details of the conceptual framework.
The framework included the investigations of the effects of multi-dimensional factors—
individual (e.g., academic achievement, attitudes towards science, science and mathematics
self-efficacy, science and mathematics outcome expectations, science and mathematics
achievement), family (e.g., parents’ education, occupations, encouragements and support),
and upper secondary school (e.g., support from science and mathematics teachers, interactive
science and mathematics lessons, and institutional demographic variables)—on upper
secondary school students’ choice of the science track and aspirations of STEM majors. These
multi-dimensional factors comprise the synthesis of extant local and international literature, as
well as policy initiatives that foster students’ interest in STEM majors. Figure 4.1 provides a
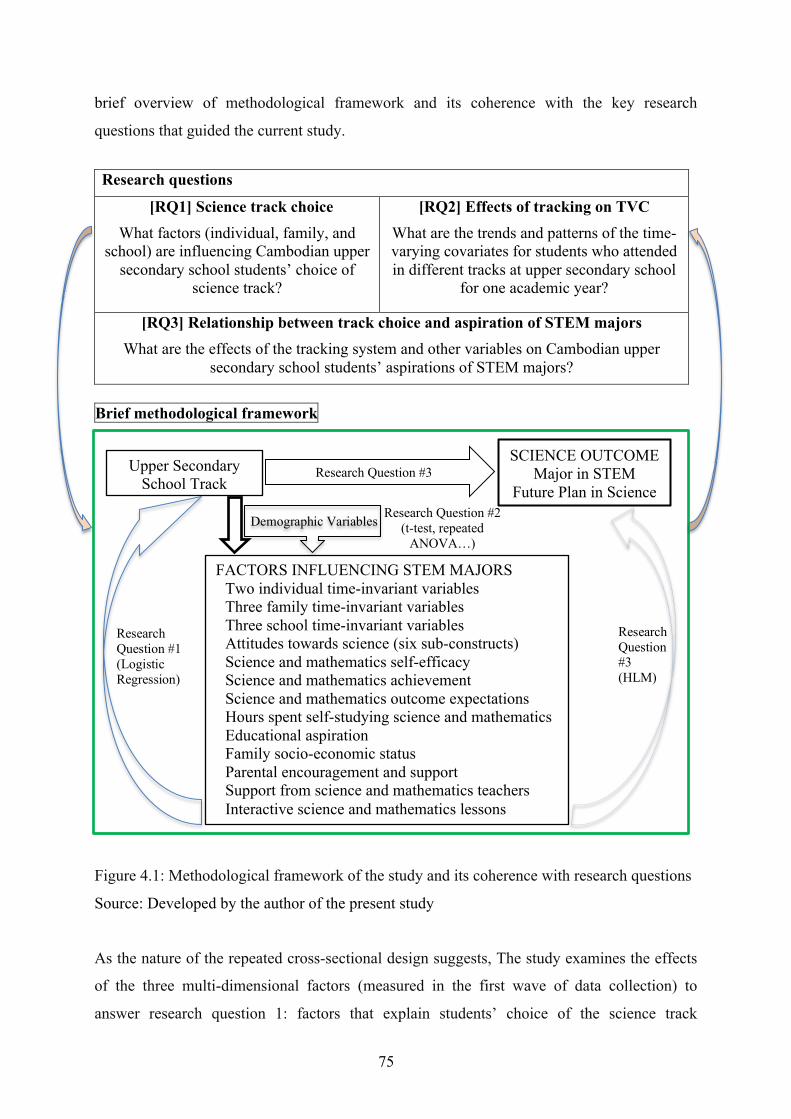
75
brief overview of methodological framework and its coherence with the key research
questions that guided the current study.
Research questions
[RQ1] Science track choice What factors (individual, family, and
school) are influencing Cambodian upper secondary school students’ choice of
science track?
[RQ2] Effects of tracking on TVC What are the trends and patterns of the time-varying covariates for students who attended in different tracks at upper secondary school
for one academic year?
[RQ3] Relationship between track choice and aspiration of STEM majors What are the effects of the tracking system and other variables on Cambodian upper
secondary school students’ aspirations of STEM majors?
Brief methodological framework
Figure 4.1: Methodological framework of the study and its coherence with research questions
Source: Developed by the author of the present study
As the nature of the repeated cross-sectional design suggests, The study examines the effects
of the three multi-dimensional factors (measured in the first wave of data collection) to
answer research question 1: factors that explain students’ choice of the science track
SCIENCE OUTCOME Major in STEM
Future Plan in Science Research Question #3 Upper Secondary
School Track
FACTORS INFLUENCING STEM MAJORS Two individual time-invariant variables Three family time-invariant variables Three school time-invariant variables Attitudes towards science (six sub-constructs) Science and mathematics self-efficacy Science and mathematics achievement Science and mathematics outcome expectations Hours spent self-studying science and mathematics Educational aspiration Family socio-economic status Parental encouragement and support Support from science and mathematics teachers Interactive science and mathematics lessons
Research Question #3 (HLM)
Research Question #2 (t-test, repeated
ANOVA…)
Research Question #1 (Logistic Regression)
Demographic Variables
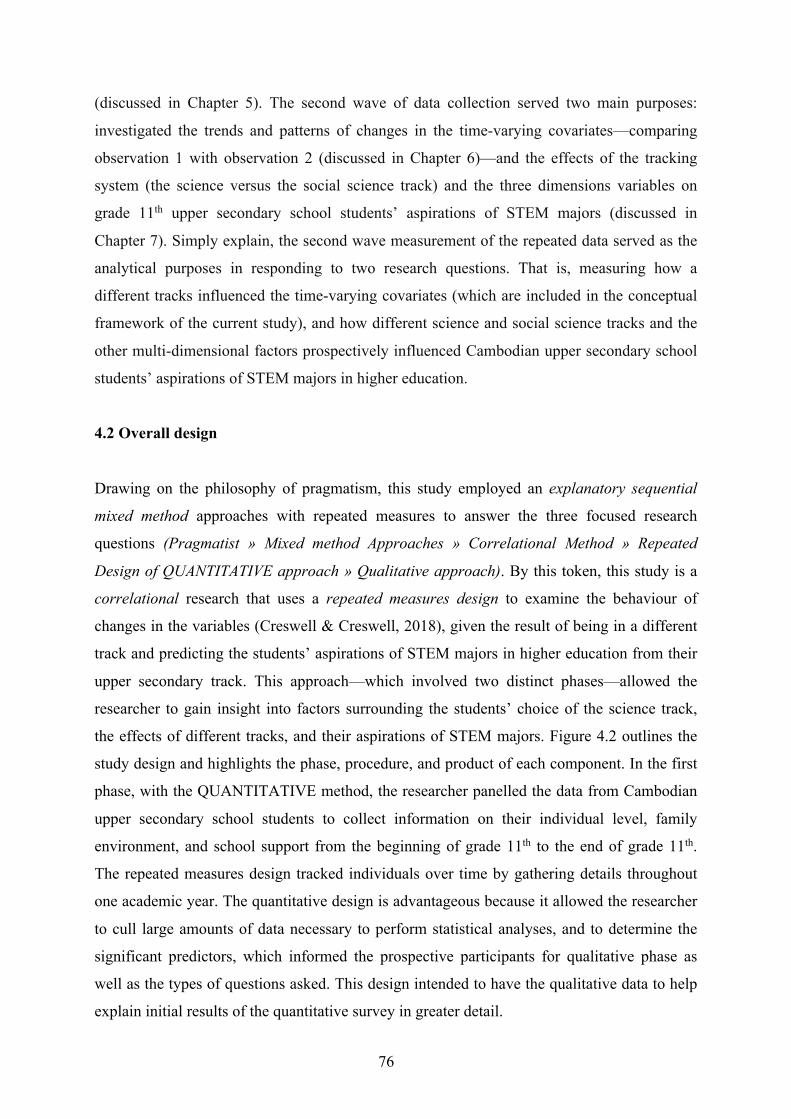
76
(discussed in Chapter 5). The second wave of data collection served two main purposes:
investigated the trends and patterns of changes in the time-varying covariates—comparing
observation 1 with observation 2 (discussed in Chapter 6)—and the effects of the tracking
system (the science versus the social science track) and the three dimensions variables on
grade 11th upper secondary school students’ aspirations of STEM majors (discussed in
Chapter 7). Simply explain, the second wave measurement of the repeated data served as the
analytical purposes in responding to two research questions. That is, measuring how a
different tracks influenced the time-varying covariates (which are included in the conceptual
framework of the current study), and how different science and social science tracks and the
other multi-dimensional factors prospectively influenced Cambodian upper secondary school
students’ aspirations of STEM majors in higher education.
4.2 Overall design
Drawing on the philosophy of pragmatism, this study employed an explanatory sequential
mixed method approaches with repeated measures to answer the three focused research
questions (Pragmatist » Mixed method Approaches » Correlational Method » Repeated
Design of QUANTITATIVE approach » Qualitative approach). By this token, this study is a
correlational research that uses a repeated measures design to examine the behaviour of
changes in the variables (Creswell & Creswell, 2018), given the result of being in a different
track and predicting the students’ aspirations of STEM majors in higher education from their
upper secondary track. This approach—which involved two distinct phases—allowed the
researcher to gain insight into factors surrounding the students’ choice of the science track,
the effects of different tracks, and their aspirations of STEM majors. Figure 4.2 outlines the
study design and highlights the phase, procedure, and product of each component. In the first
phase, with the QUANTITATIVE method, the researcher panelled the data from Cambodian
upper secondary school students to collect information on their individual level, family
environment, and school support from the beginning of grade 11th to the end of grade 11th.
The repeated measures design tracked individuals over time by gathering details throughout
one academic year. The quantitative design is advantageous because it allowed the researcher
to cull large amounts of data necessary to perform statistical analyses, and to determine the
significant predictors, which informed the prospective participants for qualitative phase as
well as the types of questions asked. This design intended to have the qualitative data to help
explain initial results of the quantitative survey in greater detail.
77
Figure 4.2: Detailed outline of the study design
Phase Procedure Product
Adapted from Ivankova and Stick (2007)
Quantitative
Data Collection
Quantitative
Data Analysis
Case Selection
Qualitative
Data Collection
Qualitative
Data Analysis
Integration of Quantitative and
Qualitative Results
• Panel data with grade 11th students
• First wave (N=752) • Second wave (N=700)
• Numerical data from • First wave (N=752) • Second wave (N=700) • Consolidate data (N=700)
• Data screening • Factor analysis • Frequency • Mean difference • Logistic regression • HLM analysis
• Descriptive statistics • Factor loadings • Significant difference • Difference by observation • Significant predictors
• Purposefully selecting students
• Gathering students’ contact • Developing interview
instrument
• Case (N=25) selected • Social network for online
interview (Facebook messenger)
• Interview protocol
• Approach students • Online interview • Online focus group
interview (N=10) • Online interview (N=15)
• Focus group discussion records (4)
• Interview records (15) • Transcripts (19)
• Coding and analysis for themes
• Category coding and thematic analysis
• Codes and themes • Similar and different
themes and categories • Qualitative explanation
• Triangulation of results • Interpretation and
explanation of the quantitative and qualitative results
•
• Discussion of the results • Implications • Further research
78
Furthermore, studies of this kind often collect information during (and alongside) parallel
processes and at different levels (micro, meso, and macro). The underlying idea is that an
individual’s life course can only be understood if (or when) it is placed into the context of the
trajectories of one’s social life. Because change at the “macro” level could potentially affect
the life course of an individual, the life course should not be isolated from the “situation” in
which it is set. In other words, these data make it possible to analyze the developments within
the institutional, cultural, and social contexts in which an individual’s life course unfolds. By
focusing on events and transitions in individual lives, the interactions between actions and
structures can be closely observed. Thus, this panel study is concerned with illuminating
social changes to deepen understanding of causal influences over time. The design is
somewhat better for dealing with the problem of ambiguity about the direction of causal
influence that plagues cross-sectional research (Bryman, 2016).
In the second phase of the study, qualitative approach through semi-structured interviews,
using coding and thematic analysis approach, was employed. The goal of the semi-structured
interviews was to give the quantitative participants an opportunity to express their personal
views and feelings in their own words, which allowed the refinement of the survey results and
to determine alternative predictors for students’ choice of the science track and their
aspirations of STEM majors. The study employed both the semi-structured interviews and the
focus group discussions. There were three justifications for this follow-up focus group
discussion. First, this method promoted discussion among group members to elicit deeper
viewpoint and insight. Second, focus group discussion increased the understanding of the
students’ view and feelings by gathering common expressions and in-dept details within a
short time period. Lastly, the method enhanced the accessibility of the participants to the
online interview. Some students did not have access to the Internet services; thus, they were
able to join their friends during the focus group discussion.
4.3 Research design
As briefly stated earlier, this study employed an explanatory sequential mixed method
approaches with a panel study design to examine the factors that explain Cambodian students’
transition from the science track to STEM majors in higher education. This section details the
approach used in this study. The chapter begins by explaining the context of the study, the
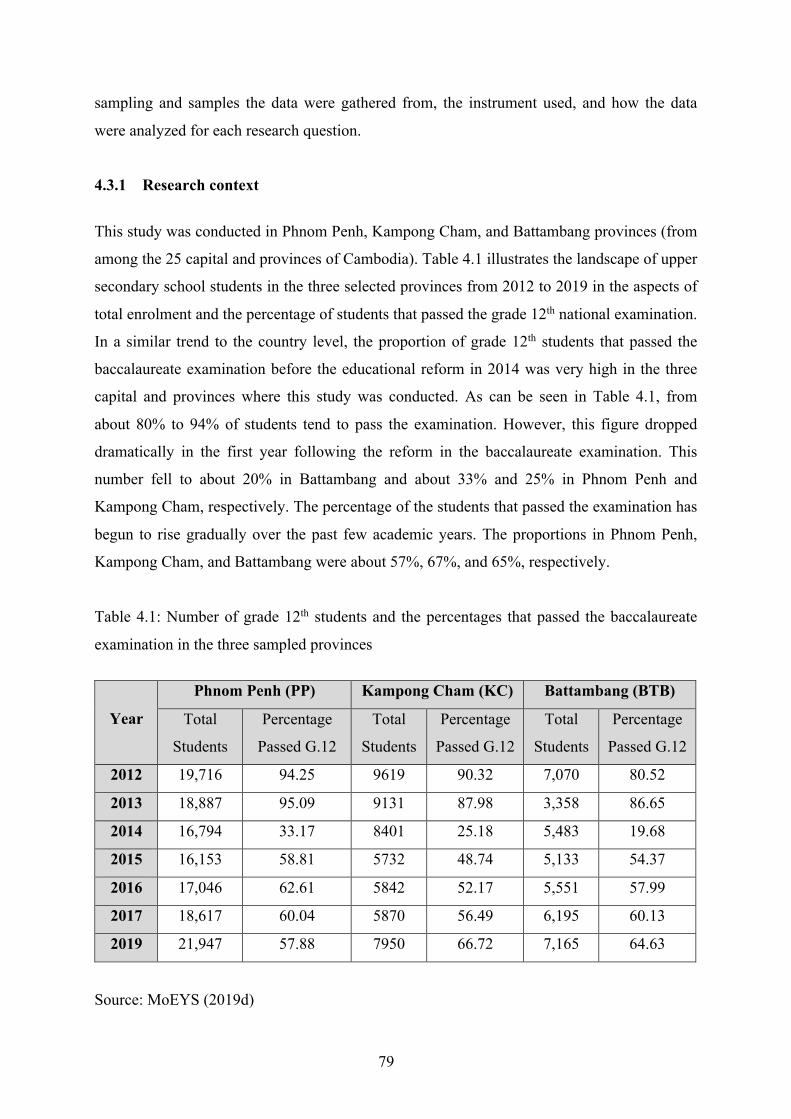
79
sampling and samples the data were gathered from, the instrument used, and how the data
were analyzed for each research question.
4.3.1 Research context
This study was conducted in Phnom Penh, Kampong Cham, and Battambang provinces (from
among the 25 capital and provinces of Cambodia). Table 4.1 illustrates the landscape of upper
secondary school students in the three selected provinces from 2012 to 2019 in the aspects of
total enrolment and the percentage of students that passed the grade 12th national examination.
In a similar trend to the country level, the proportion of grade 12th students that passed the
baccalaureate examination before the educational reform in 2014 was very high in the three
capital and provinces where this study was conducted. As can be seen in Table 4.1, from
about 80% to 94% of students tend to pass the examination. However, this figure dropped
dramatically in the first year following the reform in the baccalaureate examination. This
number fell to about 20% in Battambang and about 33% and 25% in Phnom Penh and
Kampong Cham, respectively. The percentage of the students that passed the examination has
begun to rise gradually over the past few academic years. The proportions in Phnom Penh,
Kampong Cham, and Battambang were about 57%, 67%, and 65%, respectively.
Table 4.1: Number of grade 12th students and the percentages that passed the baccalaureate
examination in the three sampled provinces
Year
Phnom Penh (PP) Kampong Cham (KC) Battambang (BTB)
Total
Students
Percentage
Passed G.12
Total
Students
Percentage
Passed G.12
Total
Students
Percentage
Passed G.12
2012 19,716 94.25 9619 90.32 7,070 80.52
2013 18,887 95.09 9131 87.98 3,358 86.65
2014 16,794 33.17 8401 25.18 5,483 19.68
2015 16,153 58.81 5732 48.74 5,133 54.37
2016 17,046 62.61 5842 52.17 5,551 57.99
2017 18,617 60.04 5870 56.49 6,195 60.13
2019 21,947 57.88 7950 66.72 7,165 64.63
Source: MoEYS (2019d)
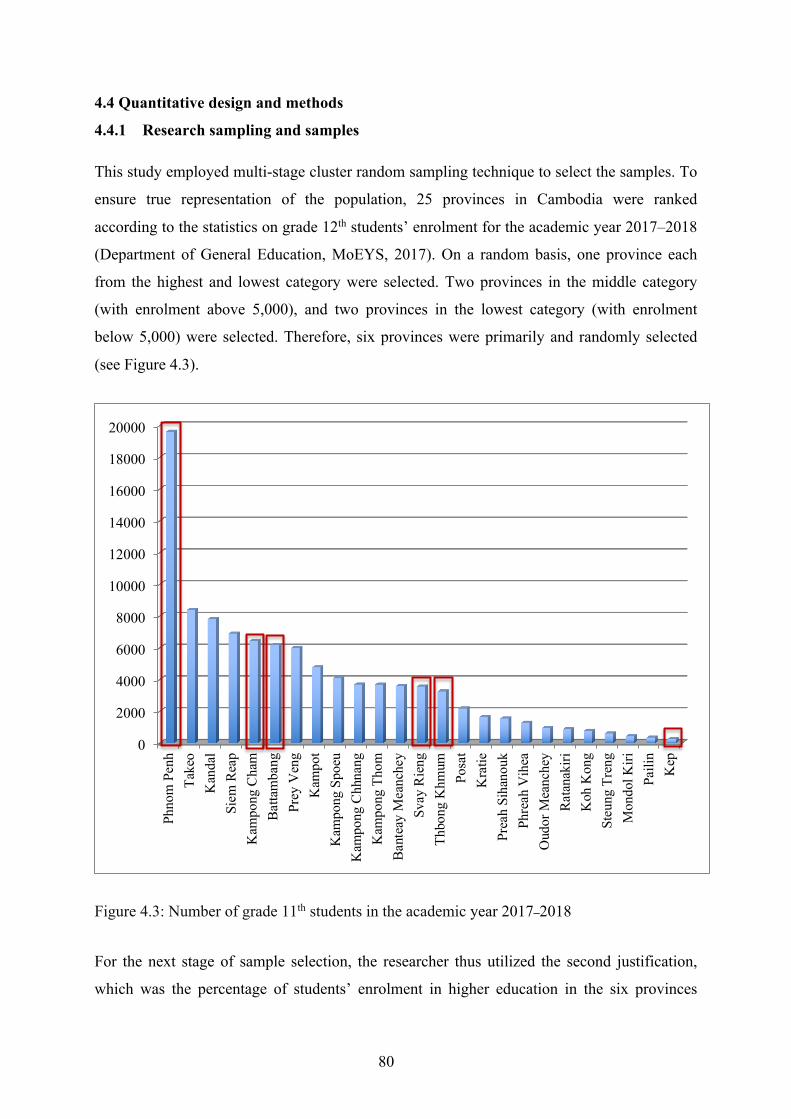
80
4.4 Quantitative design and methods
4.4.1 Research sampling and samples
This study employed multi-stage cluster random sampling technique to select the samples. To
ensure true representation of the population, 25 provinces in Cambodia were ranked
according to the statistics on grade 12th students’ enrolment for the academic year 2017–2018
(Department of General Education, MoEYS, 2017). On a random basis, one province each
from the highest and lowest category were selected. Two provinces in the middle category
(with enrolment above 5,000), and two provinces in the lowest category (with enrolment
below 5,000) were selected. Therefore, six provinces were primarily and randomly selected
(see Figure 4.3).
Figure 4.3: Number of grade 11th students in the academic year 2017–2018
For the next stage of sample selection, the researcher thus utilized the second justification,
which was the percentage of students’ enrolment in higher education in the six provinces
0
2000
4000
6000
8000
10000
12000
14000
16000
18000
20000
Phno
m P
enh
Take
oK
anda
lSi
em R
eap
Kam
pong
Cha
mBa
ttam
bang
Prey
Ven
gK
ampo
tK
ampo
ng S
poeu
Kam
pong
Chh
nang
Kam
pong
Tho
mBa
ntea
y M
eanc
hey
Svay
Rie
ngTh
bong
Khm
umPo
sat
Kra
tiePr
eah
Siha
nouk
Phre
ah V
ihea
Oud
or M
eanc
hey
Rata
naki
riK
oh K
ong
Steu
ng T
reng
Mon
dol K
iriPa
ilin
Kep
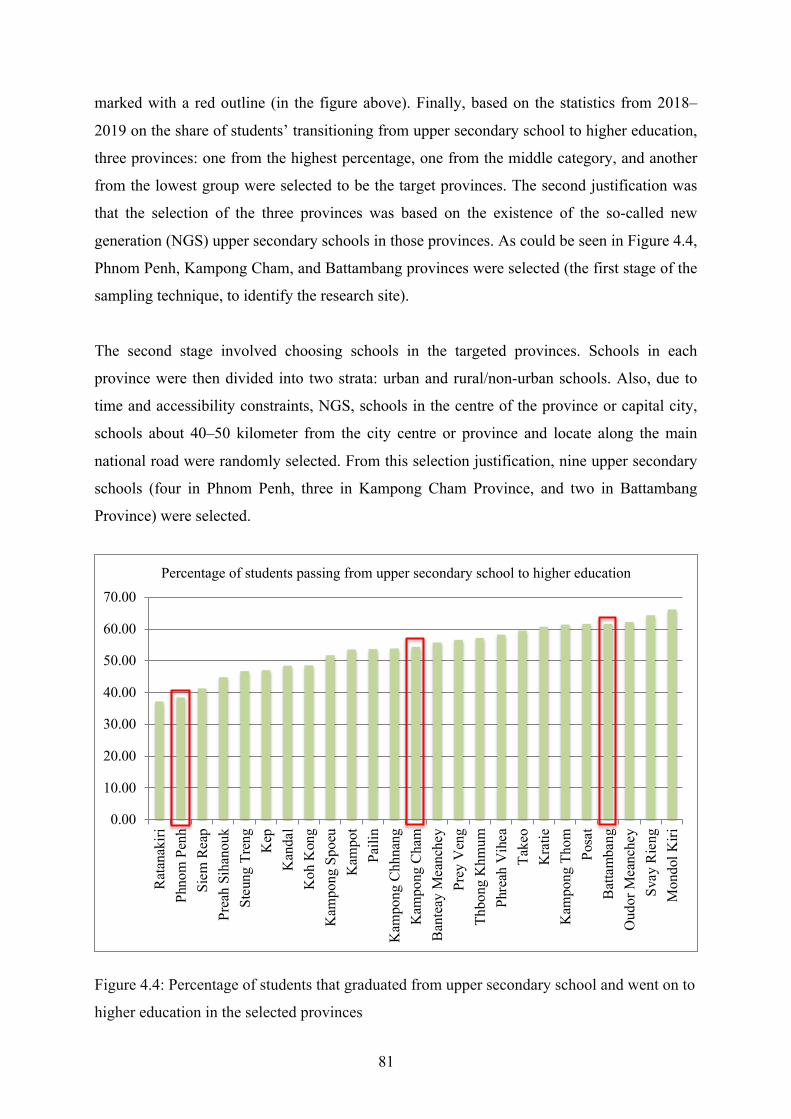
81
marked with a red outline (in the figure above). Finally, based on the statistics from 2018–
2019 on the share of students’ transitioning from upper secondary school to higher education,
three provinces: one from the highest percentage, one from the middle category, and another
from the lowest group were selected to be the target provinces. The second justification was
that the selection of the three provinces was based on the existence of the so-called new
generation (NGS) upper secondary schools in those provinces. As could be seen in Figure 4.4,
Phnom Penh, Kampong Cham, and Battambang provinces were selected (the first stage of the
sampling technique, to identify the research site).
The second stage involved choosing schools in the targeted provinces. Schools in each
province were then divided into two strata: urban and rural/non-urban schools. Also, due to
time and accessibility constraints, NGS, schools in the centre of the province or capital city,
schools about 40–50 kilometer from the city centre or province and locate along the main
national road were randomly selected. From this selection justification, nine upper secondary
schools (four in Phnom Penh, three in Kampong Cham Province, and two in Battambang
Province) were selected.
Figure 4.4: Percentage of students that graduated from upper secondary school and went on to
higher education in the selected provinces
0.00
10.00
20.00
30.00
40.00
50.00
60.00
70.00
Rat
anak
iriPh
nom
Pen
hSi
em R
eap
Prea
h Si
hano
ukSt
eung
Tre
ngK
epK
anda
lK
oh K
ong
Kam
pong
Spo
euK
ampo
tPa
ilin
Kam
pong
Chh
nang
Kam
pong
Cha
mB
ante
ay M
eanc
hey
Prey
Ven
gTh
bong
Khm
umPh
reah
Vih
eaTa
keo
Kra
tieK
ampo
ng T
hom
Posa
tB
atta
mba
ngO
udor
Mea
nche
ySv
ay R
ieng
Mon
dol K
iri
Percentage of students passing from upper secondary school to higher education
82
Furthermore, for the purpose of group comparison, the selected schools needed to have
approximately equal proportions of students in the science and social science track. Thus,
each stratum was then further divided into two sub-strata (i.e. science and social science track
classes). To select the class, the researcher requested a list of the grade 11th students by class.
Consequently, the last stage of random technique was to select one class each from the sub-
strata for the survey. However, because in the two NGS, there were only science classes and
there were only three and two classes, respectively, all classes were selected. All students in
each randomly chosen class were cluster-selected to be the samples. Finally, students from 21
classes from nine upper secondary schools in three provinces were selected to be the samples
for the repeated cross-sectional survey.
There were two waves of data collection. In the first wave of data collection, there were 766
students participated in the survey. However, researcher removed 14 students who did not
completed the questionnaire and/or did not provide the personal information needed for
follow-up survey. Thus, 752 usable samples remained from the first wave, which the
researcher followed up with for the second wave, conducted six months after the first. In this
second wave, 700 students took part (which was equal to 93.09% of the first wave’s figure)
and completed the second wave survey questionnaire.
In a panel design of the repeated cross-sectional approach, panel mortality is a key problem.
There are a few anecdotes to explain the loss of samples. First, dropping out of upper
secondary school is a major concern (from interview with the students). Most students,
especially those from the non-urban areas, dropped out of school to find work in Phnom Penh
or other provinces. Second, because the second wave data collection was carried out after the
second semester examination and it was during the hot season in Cambodia, a number of
students were absent. Being aware of this issue, the researcher first needed to contact the
school principals or the people in charge of data collection, and asked them to kindly inform
to the students about the date of data collection and to invite them. Also, the researcher
needed to go to one target school at least two times to administer the survey to the students
who missed out (excluding those who had dropped out of school) for the first meeting of the
data collection session. Due to this, there was only about 7% loss of the sample from the first
to the second wave. See Table 4.2 for details on the samples from the nine upper secondary
schools that participated in the two waves data collection.
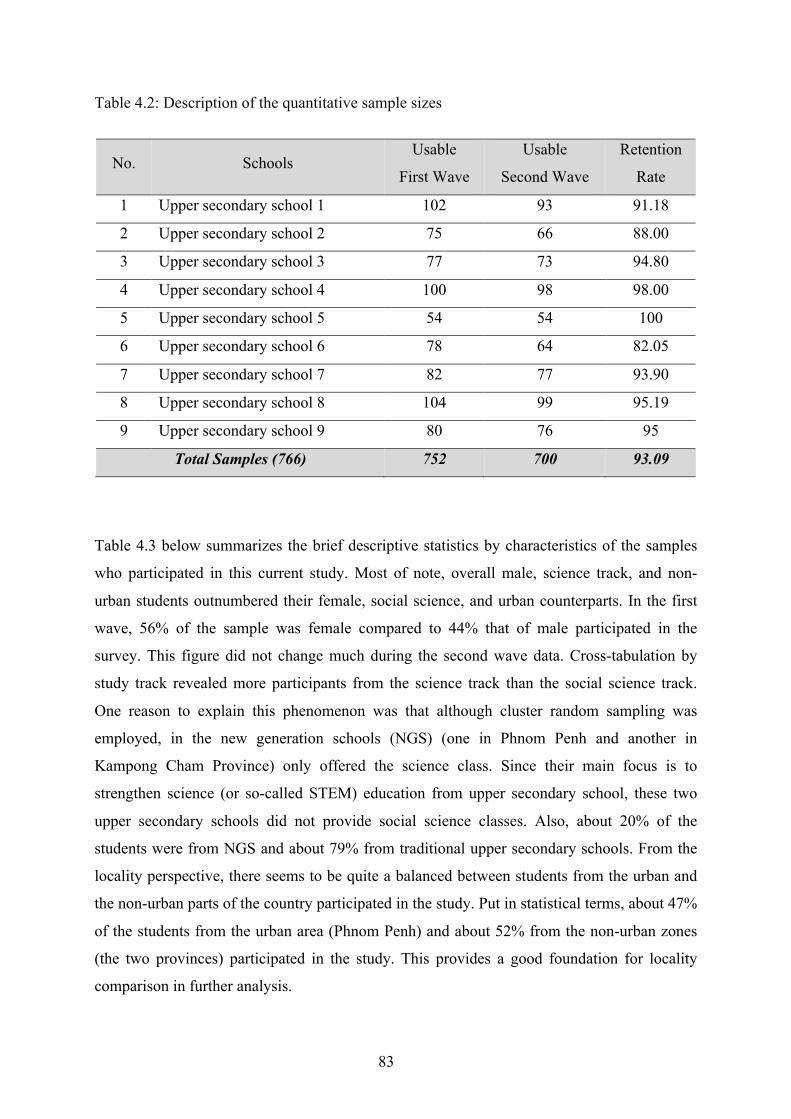
83
Table 4.2: Description of the quantitative sample sizes
No. Schools Usable
First Wave
Usable
Second Wave
Retention
Rate
1 Upper secondary school 1 102 93 91.18
2 Upper secondary school 2 75 66 88.00
3 Upper secondary school 3 77 73 94.80
4 Upper secondary school 4 100 98 98.00
5 Upper secondary school 5 54 54 100
6 Upper secondary school 6 78 64 82.05
7 Upper secondary school 7 82 77 93.90
8 Upper secondary school 8 104 99 95.19
9 Upper secondary school 9 80 76 95
Total Samples (766) 752 700 93.09
Table 4.3 below summarizes the brief descriptive statistics by characteristics of the samples
who participated in this current study. Most of note, overall male, science track, and non-
urban students outnumbered their female, social science, and urban counterparts. In the first
wave, 56% of the sample was female compared to 44% that of male participated in the
survey. This figure did not change much during the second wave data. Cross-tabulation by
study track revealed more participants from the science track than the social science track.
One reason to explain this phenomenon was that although cluster random sampling was
employed, in the new generation schools (NGS) (one in Phnom Penh and another in
Kampong Cham Province) only offered the science class. Since their main focus is to
strengthen science (or so-called STEM) education from upper secondary school, these two
upper secondary schools did not provide social science classes. Also, about 20% of the
students were from NGS and about 79% from traditional upper secondary schools. From the
locality perspective, there seems to be quite a balanced between students from the urban and
the non-urban parts of the country participated in the study. Put in statistical terms, about 47%
of the students from the urban area (Phnom Penh) and about 52% from the non-urban zones
(the two provinces) participated in the study. This provides a good foundation for locality
comparison in further analysis.
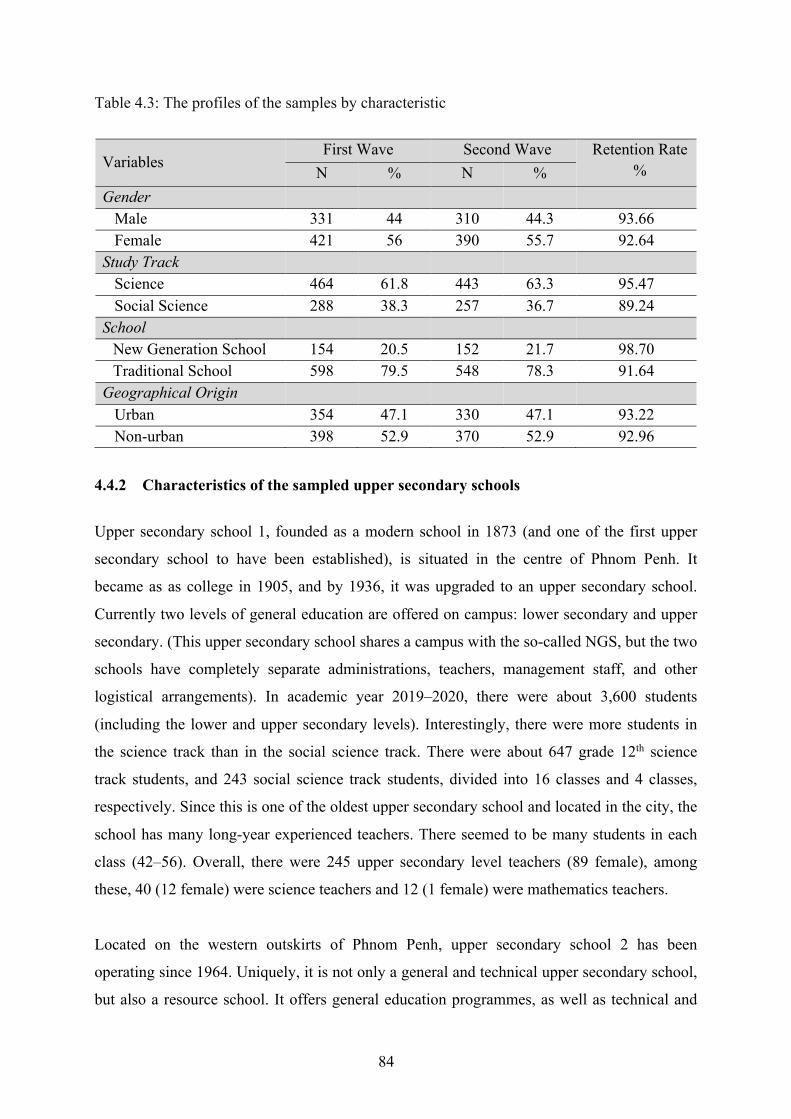
84
Table 4.3: The profiles of the samples by characteristic
Variables First Wave Second Wave Retention Rate
% N % N %
Gender Male 331 44 310 44.3 93.66 Female 421 56 390 55.7 92.64 Study Track Science 464 61.8 443 63.3 95.47 Social Science 288 38.3 257 36.7 89.24 School
New Generation School 154 20.5 152 21.7 98.70 Traditional School 598 79.5 548 78.3 91.64
Geographical Origin Urban 354 47.1 330 47.1 93.22 Non-urban 398 52.9 370 52.9 92.96
4.4.2 Characteristics of the sampled upper secondary schools
Upper secondary school 1, founded as a modern school in 1873 (and one of the first upper
secondary school to have been established), is situated in the centre of Phnom Penh. It
became as as college in 1905, and by 1936, it was upgraded to an upper secondary school.
Currently two levels of general education are offered on campus: lower secondary and upper
secondary. (This upper secondary school shares a campus with the so-called NGS, but the two
schools have completely separate administrations, teachers, management staff, and other
logistical arrangements). In academic year 2019–2020, there were about 3,600 students
(including the lower and upper secondary levels). Interestingly, there were more students in
the science track than in the social science track. There were about 647 grade 12th science
track students, and 243 social science track students, divided into 16 classes and 4 classes,
respectively. Since this is one of the oldest upper secondary school and located in the city, the
school has many long-year experienced teachers. There seemed to be many students in each
class (42–56). Overall, there were 245 upper secondary level teachers (89 female), among
these, 40 (12 female) were science teachers and 12 (1 female) were mathematics teachers.
Located on the western outskirts of Phnom Penh, upper secondary school 2 has been
operating since 1964. Uniquely, it is not only a general and technical upper secondary school,
but also a resource school. It offers general education programmes, as well as technical and
85
vocational education programmes, on campus. There were 2,567 students for academic year
2017–2018 (among them, 1,243 were female); this figure rose to about 2,830 for academic
year 2018–2019 (among them, 1,439 were female). At the time of the first wave data
collection, in grade 11th, there were 10 classes comprising 618 students in the science track
and 4 classes made up of 303 students in the social science track. Although upper secondary
school 2 has implemented the two-shifts system, there seems to be a lack of classrooms as a
single classroom contained up to 65 students on average. According to the statistics from
2019, there were 116 teachers (45 of whom were female). Most noteworthy, there were 50
science teachers (14 of whom were female) and 13 mathematics teachers (one of whom were
female); all of them held a bachelor’s degree at minimum.
Upper secondary school 3 is located on the eastern outskirts of Phnom Penh and was founded
in 1980. There were 687 (355 female) and 537 (298 female) students in academic year 2017–
2018 and 2018–2019, respectively. This figure rose to 572 (323 female) students in academic
year 2019–2020. In the most recent academic year, there were 4 classes of grade 12th science
track students, and only two classes of socials science track students. However, this trend
seems to have reversed completely. Although the usual policy is to promote students’ interest
in the science track, the number of classes in the science track has decreased to only 3, while
the number of classes in the social science track has increased to 4. In this last academic year,
there were 80 (27 female) teachers with a bachelor’s degree and above who were teaching at
the upper secondary level. More importantly, this school is the home to the so-called NGS.
Since academic year 2017–2018, the school has been implementing the pilot project of NGS.
However, the programme is still at the lower secondary school level (grades 7th, 8th, 9th). In
academic year 2018–2019, there were six classes each for grade 7th, 8th, and 9th, respectively.
To be enrolled in this new school, students need to pass the entrance examination which
covers the subject of science (physics, chemistry, and biology), Khmer literature,
mathematics, and critical thinking skills. Unlike the traditional upper secondary school in the
system, students need to study full-time, from 7 in the morning to 4 in the afternoon. Since it
is a three-year pilot project, the school became autonomous in academic year 2019–2020.
Located on the campus of the first upper secondary school, upper secondary school 4 is one of
the pilot NGS and contains the 7th to 12th grades. The school was inaugurated on 23rd June
2016 as an NGS to implement STEM teaching and learning. The rooms in this school are
equipped with teaching facilities and experimentation laboratories. Moreover, the teaching
86
hours have been increased from 32 hours at traditional upper secondary school to 40 hours a
week. Thus, the students have to take classes full-time, from morning to afternoon, Monday
through Saturday. The teachers have also been incentivized by a bonus of about 150 USD, in
addition to the regular salary of mainstream Cambodian civil servants. Statistically, there
were 756 students in academic year 2017–2018; this number increased to 917 in academic
year 2018–2019. At the time of the first wave of data collection, there were 3 classes of grade
11th students, with an average of 35 students in one class. The three science classes were
divided into physics, chemistry, and biology. There were about 40 teachers, among whom 16
were science teachers; all of them held a bachelor’s degree at minimum.
Upper secondary school 5 is situated in the centre of Kampong Cham Province, about 130
kilometers from Phnom Penh. It shares a building with Kampong Cham Regional Teacher
Training Centre, and was first established as an anuwath (practical) primary school in 1998. It
was upgraded to a lower secondary school in 2012 and to an upper secondary school in 2015.
Starting with only the grade 10th in academic year 2014–2015, the upper secondary school 5
expanded to include two grade 11th classes (Khmer literature and mathematics) in academic
year 2015–2016, and two more classes (physics and chemistry) in academic year 2016–2017.
In academic year 2017–2018, the school was upgraded to an NGS and offered a general
education programmes to 427 (228 female) students and 402 (216 female) students in
academic year 2018–2019. By the time of the first wave of data collection, there were only
two grade 11th science track classes with a total of 65 students (of whom 34 were female). In
the most recent academic year, there were 31 teachers (20 of whom were female) 15 science
teachers (10 of whom were female) and 6 mathematics teachers (2 of whom were female). All
of them held a bachelor’s degree and had at least 4 years of teaching experience.
Upper secondary school 6 is located about 30 kilometers along the national road from
Kampong Cham to Phnom Penh. It was first established as a lower secondary school in 1966
and upgraded to an upper secondary in 1999. There were 1,740 students (982 of whom were
female) in academic year 2017–2018. However, this number decreased to 1,691 students (932
of whom were female) in academic year 2018–2019. During the first wave of data collection,
this upper secondary school had 131 (87 female) and 182 (102 female) grade 11th students
which were divided into 3 and 4 classes, respectively. On average, a single class had about 45
students. Currently, there are about 110 teachers (70 female) teaching at both the lower and
upper secondary school levels. Among them, 12 are science teachers and 6 are mathematics
87
teachers. Since, there are not enough teachers, although teacher who work at upper secondary
school should hold a bachelor’s degree, some current teachers only have an associate’s
degree. The teacher shortage—especially in science and mathematics—and teachers whose
qualifications does not match with the requirements for their position—seem to be among the
concerns that school have.
Also located along the national road from Kampong Cham to Phnom Penh, upper secondary
school 7 is about 50 kilometers from Kampong Cham and about 80 kilometers from Phnom
Penh. It was first opened in 1963 and it was completely destroyed during the Pol Pot regime.
It was rebuilt in 1980 as a lower secondary school and was upgraded into an upper secondary
school in 1993. Now it becomes the resource school. In academic year 2017–2018 there were
2,190 students; and the number of enrolment remained almost stable in academic year 2018–
2019, when there were 295 science track students compared to about 49 social science track
students. Although the school was operating under the two-shift system, the number of
students within one class was also high (around 45 students per class). In the last academic
year, there were approximately 90 teachers (among whom 41 were female). It is interesting to
note that there were 23 science teachers (of whom 12 were female) and 13 mathematics
teachers (one of whom was female). Most of them had more than 10 years of teaching
experience, while other were just grade 12th graduates.
Upper secondary school 8 was first established as a lower secondary level II school, and was
upgraded to an upper secondary school in 1989. It is located about 50 kilometers from
Battambang Province’s city centre. Once a graveyard in the 1960s, the area currently locates
the upper secondary school, which enrolled 2,039 students in academic years 2017–2018, and
2,303 students in academic year 2018–2019. During the samples selection period, there were
279 science track students (divided into 6 classes) and 426 social science track students
(divided into 6 classes). The conditions seemed to be crowded in a single classroom, as there
were up to around 50–60 students per classroom. Currently, the school seems unconcerned
with the teacher shortage, as in the case of upper secondary school 7, where there were about
73 teaching staffs (all with a bachelor’s degree) among whom 33 were science teachers
(among whom 10 were female) and 14 were mathematics teachers (one of whom was female).
Located in the centre of Battambang Province, Upper secondary school 9 first opened as a
lower secondary school in 1958 and then was upgraded to an upper secondary school in 1968.
88
This school was selected over the other big upper secondary schools in the province because
of its proportion of students in the science and social science tracks. (At other schools, the
majority of the students were in the social science track). In academic year 2017–2018 there
were 2,025 students; and this number fell slightly to 1,969 in the last academic year, during
which there were 202 (130 female) and 222 (172 female) grade 11th science and social science
track, respectively. Of all 143 teachers (67 of whom were female), 35 were science teachers
(12 of whom were female), and 13 mathematic teachers (though none of them were female).
Most of them had many years of teaching experience and held a master’s and/or a bachelor’s
degree at minimum.
In conclusion, there seems to be a good representation of upper secondary schools selected for
the current study. There was a balance between schools in the urban areas, non-urban areas,
regular schools, NGS, resource schools, and general and technical schools. Second, there
were samples from schools that are concerned with the teacher shortage and the mismatch
between the requirement for the job and schools with better qualified teachers.
4.5 Instrumentation
4.5.1 Students’ questionnaire
A student self-rated questionnaire with 28 questions (25 closed-questions and 3 word-based
questions) was employed to obtain information on grade 11th students, their families, and
school related variables (see Appendix 2 for the questionnaire). Most of the questions were
adapted from the other well-developed instruments. For example, the question on attitudes
towards science was adapted from Kind, Jones, and Barmby (2007) in line with Fraser’s
(1981) Test of Related Attitudes (TORA) questionnaire, science and mathematics self-
efficacy was adapted from the Pattern of Adaptive Leaning Scale (PALS)-ability to learn in
science class (Fouad, Smith, & Enochs, 1997; Kao & Shimizu, 2019; Midgley et al., 2000),
and interactive science and mathematics lessons was adapted from standards-based practices
(Scantlebury, Boone, Butler Kahle, & Fraser, 2001). After developed and translated into
Khmer language, the researcher requested two 11th graders to proofread the questionnaire and
make any revisions to improve its readability and understandability. To improve reliability
and content validity, piloting was also carried out to discern any mistakes or any misleading
concepts, as well as problems with language use, answer choices, timing, procedures, and the
like. The pilot was conducted with a total sample of 455 11th grade students (males=279,
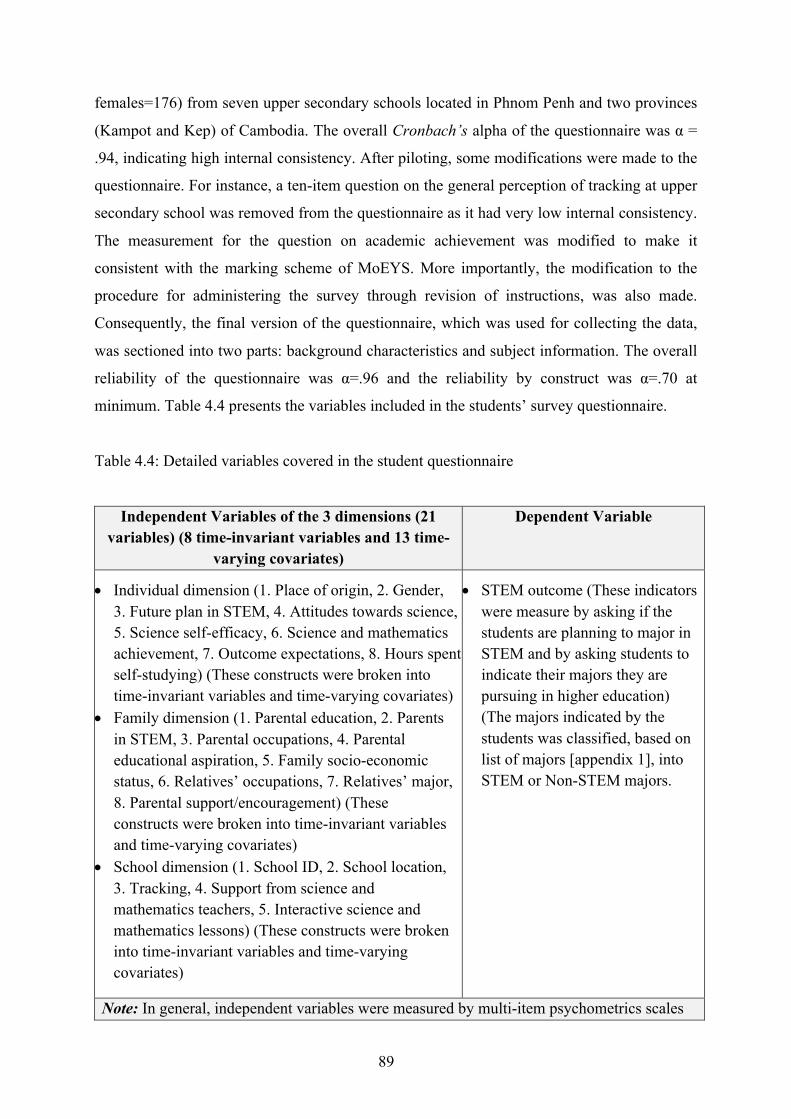
89
females=176) from seven upper secondary schools located in Phnom Penh and two provinces
(Kampot and Kep) of Cambodia. The overall Cronbach’s alpha of the questionnaire was α =
.94, indicating high internal consistency. After piloting, some modifications were made to the
questionnaire. For instance, a ten-item question on the general perception of tracking at upper
secondary school was removed from the questionnaire as it had very low internal consistency.
The measurement for the question on academic achievement was modified to make it
consistent with the marking scheme of MoEYS. More importantly, the modification to the
procedure for administering the survey through revision of instructions, was also made.
Consequently, the final version of the questionnaire, which was used for collecting the data,
was sectioned into two parts: background characteristics and subject information. The overall
reliability of the questionnaire was α=.96 and the reliability by construct was α=.70 at
minimum. Table 4.4 presents the variables included in the students’ survey questionnaire.
Table 4.4: Detailed variables covered in the student questionnaire
Independent Variables of the 3 dimensions (21 variables) (8 time-invariant variables and 13 time-
varying covariates)
Dependent Variable
• Individual dimension (1. Place of origin, 2. Gender, 3. Future plan in STEM, 4. Attitudes towards science, 5. Science self-efficacy, 6. Science and mathematics achievement, 7. Outcome expectations, 8. Hours spent self-studying) (These constructs were broken into time-invariant variables and time-varying covariates)
• Family dimension (1. Parental education, 2. Parents in STEM, 3. Parental occupations, 4. Parental educational aspiration, 5. Family socio-economic status, 6. Relatives’ occupations, 7. Relatives’ major, 8. Parental support/encouragement) (These constructs were broken into time-invariant variables and time-varying covariates)
• School dimension (1. School ID, 2. School location, 3. Tracking, 4. Support from science and mathematics teachers, 5. Interactive science and mathematics lessons) (These constructs were broken into time-invariant variables and time-varying covariates)
• STEM outcome (These indicators were measure by asking if the students are planning to major in STEM and by asking students to indicate their majors they are pursuing in higher education) (The majors indicated by the students was classified, based on list of majors [appendix 1], into STEM or Non-STEM majors.
Note: In general, independent variables were measured by multi-item psychometrics scales
90
4.5.2 School checklist
To gather data on the characteristics of the sampled schools, a one-page school checklist was
also developed. The aim of the school checklist was to collect information on the enrolment
statistics regarding the two tracks of science and social science (NGS were included in the
science track group), from academic year 2016–2018 to the latest date. Moreover, the
statistics on the teachers at these respective upper secondary schools in general, and science
and mathematics teachers in particular, were also included in the interview guide. In addition
to the statistics, their qualifications as well as teaching experience and other factors that might
influence their teaching practice were crucial. The background characteristics of the schools
support the discussion of the findings in the main survey. In total, there were 15 questions (6
closed-ended and 9 open-ended questions) on the school checklist for interviewing the school
management teams.
4.6 Variables and their measures
4.6.1 Dependent variables
The main dependent variable in this current study is the students’ aspirations of STEM or
non-STEM majors in higher education. Students’ aspiration of STEM majors was coded as 1
and students’ aspiration of non-STEM was coded as 0. This variable was measured by asking
students to indicate the majors they intended or aimed to pursue in higher education after
graduating from their upper secondary school education. Appendix 1 portrays a detailed
classification of the academic majors in the two broad fields of STEM and non-STEM (the
dependent variable in this study).
4.6.2 Independent variables
All independent covariates (variables) based on the three dimensions (individual, family, and
school) were categorized into two different groups. The first group was named time-constant
covariates. Those were the variables that did not change their value over time. For example,
no matter how many times the data are gathered, the answer on gender of the samples remains
the same. The second group was named as time-varying covariates. These were the variables
that value were hypothesized to keep changing over time. The following section provides a
full description of their meanings and measurements.
91
4.6.2.1 Time-constant covariates (TCCs)
4.6.2.1.1 Variables at the individual level
At this level, a number of individual-level demographic variables need further description in
order to fully comprehend the meaning of the statistical values presented in the upcoming
finding section. First, on dummy-coded gender variable, a male student was coded 0 while a
female student was labeled 1. Second, place of origin was also a dummy-coded variable. The
students originated from Phnom Penh was coded as 0 and the students who were from the
other provinces rather than Phnom Penh was given a value of 1. With that said, the two
provinces (Battambang and Kampong Cham) were dummy-coded into the other provinces in
the SPSS dataset.
4.6.2.1.2 Variables at the family level
At the family level, three variables were categorized as time-constant covariates. First,
parental education level, which was obtained from question #7.1 and #7.2 on the student’
questionnaire (see Appendix 2), were measured on 1–6 ordinal scale. If a student’s mother or
father had not finished upper secondary school education, 1 would be coded on this variable.
Parents who had completed upper secondary school were given a value of 2. Those who had
completed an associate’s degree were coded 3. Parents with a bachelor’s degree, a master’s
degree, and a doctoral degree were labeled 4, 5, and 6, respectively. Second, the variable
investigating if the students’ parents with a bachelor’s degree or above had majored in STEM
(parents’ majors) was obtained through dichotomous response questions #8.1 and #8.2. The
participants indicated if their parents had majored in STEM by choosing 1 (if their parents
majored in STEM) and indicated the major or choosing 0 (if they majored in non-STEM
fields). Third, parental occupation was aimed to ask if their parents were working in STEM-
related jobs. Students chose 1 and indicated the kinds of occupations their parents had if their
parents were working in STEM related occupations. However, if their parents were working
in non-STEM fields, students would mark 0.
4.6.2.1.3 Variables at the school level
There were three time-constant covariates at the school level. First, school ID was coded 1 to
9 for the upper secondary school 1 to upper secondary school 9 accordingly. This was used
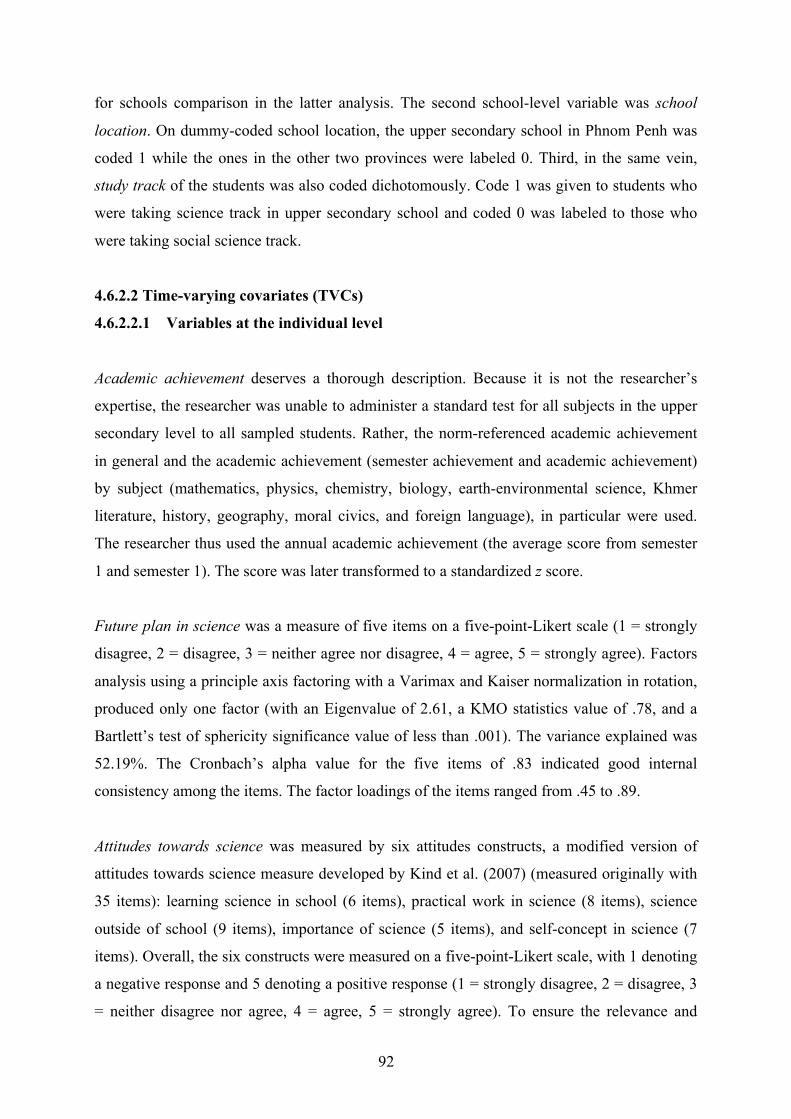
92
for schools comparison in the latter analysis. The second school-level variable was school
location. On dummy-coded school location, the upper secondary school in Phnom Penh was
coded 1 while the ones in the other two provinces were labeled 0. Third, in the same vein,
study track of the students was also coded dichotomously. Code 1 was given to students who
were taking science track in upper secondary school and coded 0 was labeled to those who
were taking social science track.
4.6.2.2 Time-varying covariates (TVCs)
4.6.2.2.1 Variables at the individual level
Academic achievement deserves a thorough description. Because it is not the researcher’s
expertise, the researcher was unable to administer a standard test for all subjects in the upper
secondary level to all sampled students. Rather, the norm-referenced academic achievement
in general and the academic achievement (semester achievement and academic achievement)
by subject (mathematics, physics, chemistry, biology, earth-environmental science, Khmer
literature, history, geography, moral civics, and foreign language), in particular were used.
The researcher thus used the annual academic achievement (the average score from semester
1 and semester 1). The score was later transformed to a standardized z score.
Future plan in science was a measure of five items on a five-point-Likert scale (1 = strongly
disagree, 2 = disagree, 3 = neither agree nor disagree, 4 = agree, 5 = strongly agree). Factors
analysis using a principle axis factoring with a Varimax and Kaiser normalization in rotation,
produced only one factor (with an Eigenvalue of 2.61, a KMO statistics value of .78, and a
Bartlett’s test of sphericity significance value of less than .001). The variance explained was
52.19%. The Cronbach’s alpha value for the five items of .83 indicated good internal
consistency among the items. The factor loadings of the items ranged from .45 to .89.
Attitudes towards science was measured by six attitudes constructs, a modified version of
attitudes towards science measure developed by Kind et al. (2007) (measured originally with
35 items): learning science in school (6 items), practical work in science (8 items), science
outside of school (9 items), importance of science (5 items), and self-concept in science (7
items). Overall, the six constructs were measured on a five-point-Likert scale, with 1 denoting
a negative response and 5 denoting a positive response (1 = strongly disagree, 2 = disagree, 3
= neither disagree nor agree, 4 = agree, 5 = strongly agree). To ensure the relevance and
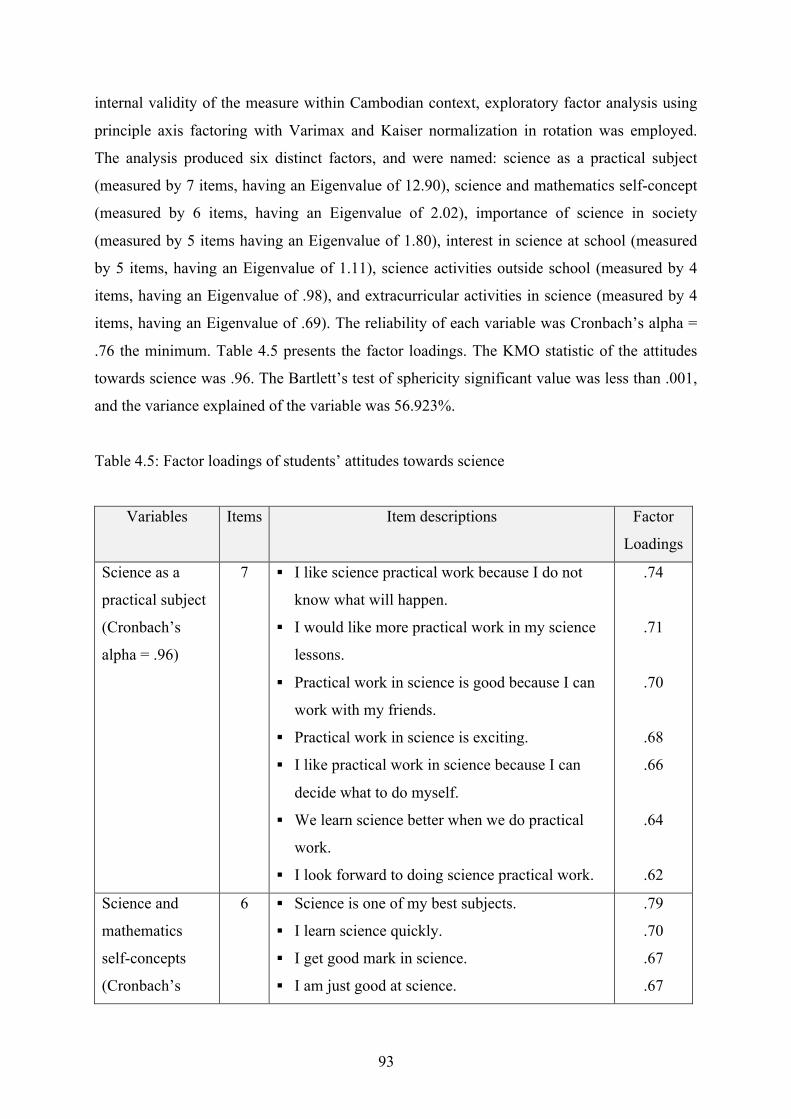
93
internal validity of the measure within Cambodian context, exploratory factor analysis using
principle axis factoring with Varimax and Kaiser normalization in rotation was employed.
The analysis produced six distinct factors, and were named: science as a practical subject
(measured by 7 items, having an Eigenvalue of 12.90), science and mathematics self-concept
(measured by 6 items, having an Eigenvalue of 2.02), importance of science in society
(measured by 5 items having an Eigenvalue of 1.80), interest in science at school (measured
by 5 items, having an Eigenvalue of 1.11), science activities outside school (measured by 4
items, having an Eigenvalue of .98), and extracurricular activities in science (measured by 4
items, having an Eigenvalue of .69). The reliability of each variable was Cronbach’s alpha =
.76 the minimum. Table 4.5 presents the factor loadings. The KMO statistic of the attitudes
towards science was .96. The Bartlett’s test of sphericity significant value was less than .001,
and the variance explained of the variable was 56.923%.
Table 4.5: Factor loadings of students’ attitudes towards science
Variables Items Item descriptions Factor
Loadings
Science as a
practical subject
(Cronbach’s
alpha = .96)
7 § I like science practical work because I do not
know what will happen.
§ I would like more practical work in my science
lessons.
§ Practical work in science is good because I can
work with my friends.
§ Practical work in science is exciting.
§ I like practical work in science because I can
decide what to do myself.
§ We learn science better when we do practical
work.
§ I look forward to doing science practical work.
.74
.71
.70
.68
.66
.64
.62
Science and
mathematics
self-concepts
(Cronbach’s
6 § Science is one of my best subjects.
§ I learn science quickly.
§ I get good mark in science.
§ I am just good at science.
.79
.70
.67
.67
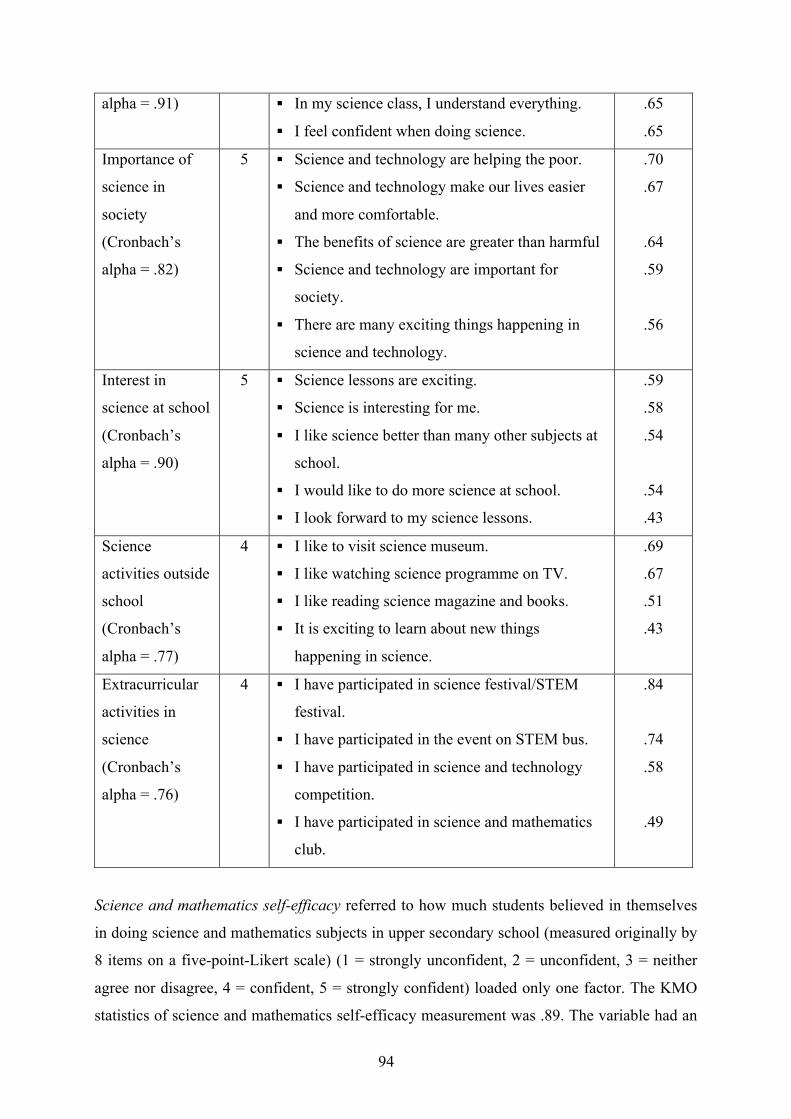
94
alpha = .91) § In my science class, I understand everything.
§ I feel confident when doing science.
.65
.65
Importance of
science in
society
(Cronbach’s
alpha = .82)
5 § Science and technology are helping the poor.
§ Science and technology make our lives easier
and more comfortable.
§ The benefits of science are greater than harmful
§ Science and technology are important for
society.
§ There are many exciting things happening in
science and technology.
.70
.67
.64
.59
.56
Interest in
science at school
(Cronbach’s
alpha = .90)
5 § Science lessons are exciting.
§ Science is interesting for me.
§ I like science better than many other subjects at
school.
§ I would like to do more science at school.
§ I look forward to my science lessons.
.59
.58
.54
.54
.43
Science
activities outside
school
(Cronbach’s
alpha = .77)
4 § I like to visit science museum.
§ I like watching science programme on TV.
§ I like reading science magazine and books.
§ It is exciting to learn about new things
happening in science.
.69
.67
.51
.43
Extracurricular
activities in
science
(Cronbach’s
alpha = .76)
4 § I have participated in science festival/STEM
festival.
§ I have participated in the event on STEM bus.
§ I have participated in science and technology
competition.
§ I have participated in science and mathematics
club.
.84
.74
.58
.49
Science and mathematics self-efficacy referred to how much students believed in themselves
in doing science and mathematics subjects in upper secondary school (measured originally by
8 items on a five-point-Likert scale) (1 = strongly unconfident, 2 = unconfident, 3 = neither
agree nor disagree, 4 = confident, 5 = strongly confident) loaded only one factor. The KMO
statistics of science and mathematics self-efficacy measurement was .89. The variable had an
95
Eigenvalue of 4.32 and the Cronbach’s alpha was .90 with the explained variance of 52.97%.
The factor loadings of the items ranged from .62 to .81.
Science and mathematics outcome expectations referred to what will happen when students
are performing well in science and mathematics in upper secondary school. The variable was
measured originally by 7 items on a five-point-Likert scale (1 = strongly disagree, 2 =
disagree, 3 = neither disagree nor agree, 4 = agree, 5 = strongly agree). The items loaded only
one factor with a KMO statistics of .90 and an Eigenvalue of 3.61. The Bartlett’s test of
sphericity significant value was less than .001. and the variance explained of the variable was
51.53%. The Cronbach’s alpha value of .88 also indicated a good internal consistency among
items and the factor loading of each item was .64 at minimum.
Hours spent self-studying at home was measured by one item asking students to indicate the
numbers of hours they spent per week doing homework or self-studying for each of the
following subjects: mathematics, physics, chemistry, biology, Khmer, history, geography, and
other. The students completed the amount of certain number of hours, which then be used to
calculate the mean hours spent self-studying science and social science subjects each week.
4.6.2.2.2 Variables at the family level
Parental educational aspiration referred to the highest educational level that the parents
wanted their children (i.e., the students) to obtain. It was measured by one five-multiple
choice item (1 = finished grade 12th, 2 = associate’s degree, 3 = bachelor’s degree, 4 =
master’s degree, 5 = doctoral degree).
Family socio-economic status was originally measured by three items: (1) monthly income of
the family, (2) the number of family members who earn the income, and (3) the status of the
parents (married or divorced). The first item asked the students to choose between four
categories of income scale. If their family income was lower than 200 USD per month, code 1
was given. Code 2 was labeled to those who indicated that their family income was between
200 to 400 USD per month. If family monthly income was between 400 to 600 USD and
more than 600 USD, coded 3 and 4 were labeled, respectively. The second item asked about
who the main family income earner was. Code 1 was given to father, code 2 to mother and
code 3 to both of them accordingly. The third item, with two categories response, was to
96
investigate if the students lived in a two-parents or single-parent family. Code 1 was given to
two-parents family and code 2 was labeled to the single-parent one.
Relatives’ occupations and majors aimed to ask if any of the students’ relatives were working
in STEM fields. If their relative were working in STEM-related occupations, they chose 1 and
indicated the occupations. If their relatives were working in non-STEM related fields, the
students reported with code 0 and indicated the occupations.
Parental/social encouragement and support in science and mathematics (measured originally
by 7 items on a five-point-Likert scale) also loaded only one factor. The Eigenvalue of the
variable was 3.201, and the KMO statistics was .825. The Bartlett’s test of sphericity
significance value was less than .001. The variance explained was 45.722%. The variable also
indicated a good internal consistency among the items as the Cronbach’s alpha value was .85
and the factors loading score of each item was .58 at minimum.
4.6.2.2.3 Variables at the school level
Support from science and mathematics teachers referred to how science and mathematics
teachers treat and guide their students during their teaching practice. It was measured
originally by 12 items on a six-point-Likert scale (1 = never, 2 = almost never, 3 = some of
the time, 4 = most of the time, 5 = almost always, 6 = always). The items loaded only one
factor (since the factor loadings for 3 items were lower than the cut-off point of .40, only 9
items remained), having a Cronbach’s alpha value of .89 and an Eigenvalue of 4.30). The
KMO statistics of the variable was .90. The Bartlett’s test of sphericity significance value was
less than .001. The variance explained was 47.79%. The factor loadings of the items ranged
from .57 to .76.
Interactive science and mathematics lessons (measured originally using 7 items), and which
reflects how science and mathematics lessons are regularly conducted also loaded only one
factor. The Eigenvalue of the variable was 2.33, the KMO statistics was .84, and the Bartlett’s
test of sphericity significance value was less than .001. However, the variance explained was
only 33.25%. The Cronbach’s alpha value of .775 also indicated a good internal consistency
among the items. The value of factor loading of the items was .49 at minimum and .64 at
maximum. Table 4.6 summarizes the variables, data type, and range of responses.
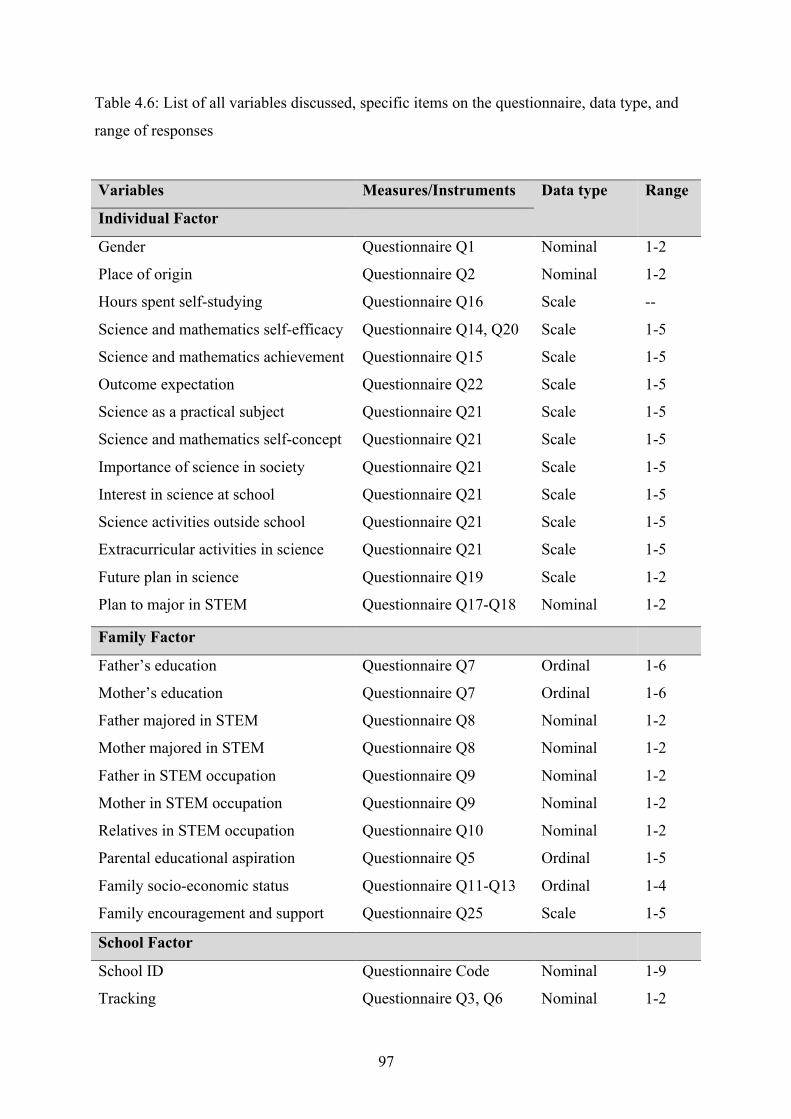
97
Table 4.6: List of all variables discussed, specific items on the questionnaire, data type, and
range of responses
Variables Measures/Instruments Data type Range
Individual Factor
Gender Questionnaire Q1 Nominal 1-2
Place of origin Questionnaire Q2 Nominal 1-2
Hours spent self-studying Questionnaire Q16 Scale --
Science and mathematics self-efficacy Questionnaire Q14, Q20 Scale 1-5
Science and mathematics achievement Questionnaire Q15 Scale 1-5
Outcome expectation Questionnaire Q22 Scale 1-5
Science as a practical subject Questionnaire Q21 Scale 1-5
Science and mathematics self-concept Questionnaire Q21 Scale 1-5
Importance of science in society Questionnaire Q21 Scale 1-5
Interest in science at school Questionnaire Q21 Scale 1-5
Science activities outside school Questionnaire Q21 Scale 1-5
Extracurricular activities in science Questionnaire Q21 Scale 1-5
Future plan in science Questionnaire Q19 Scale 1-2
Plan to major in STEM Questionnaire Q17-Q18 Nominal 1-2
Family Factor
Father’s education Questionnaire Q7 Ordinal 1-6
Mother’s education Questionnaire Q7 Ordinal 1-6
Father majored in STEM Questionnaire Q8 Nominal 1-2
Mother majored in STEM Questionnaire Q8 Nominal 1-2
Father in STEM occupation Questionnaire Q9 Nominal 1-2
Mother in STEM occupation Questionnaire Q9 Nominal 1-2
Relatives in STEM occupation Questionnaire Q10 Nominal 1-2
Parental educational aspiration Questionnaire Q5 Ordinal 1-5
Family socio-economic status Questionnaire Q11-Q13 Ordinal 1-4
Family encouragement and support Questionnaire Q25 Scale 1-5
School Factor
School ID Questionnaire Code Nominal 1-9
Tracking Questionnaire Q3, Q6 Nominal 1-2
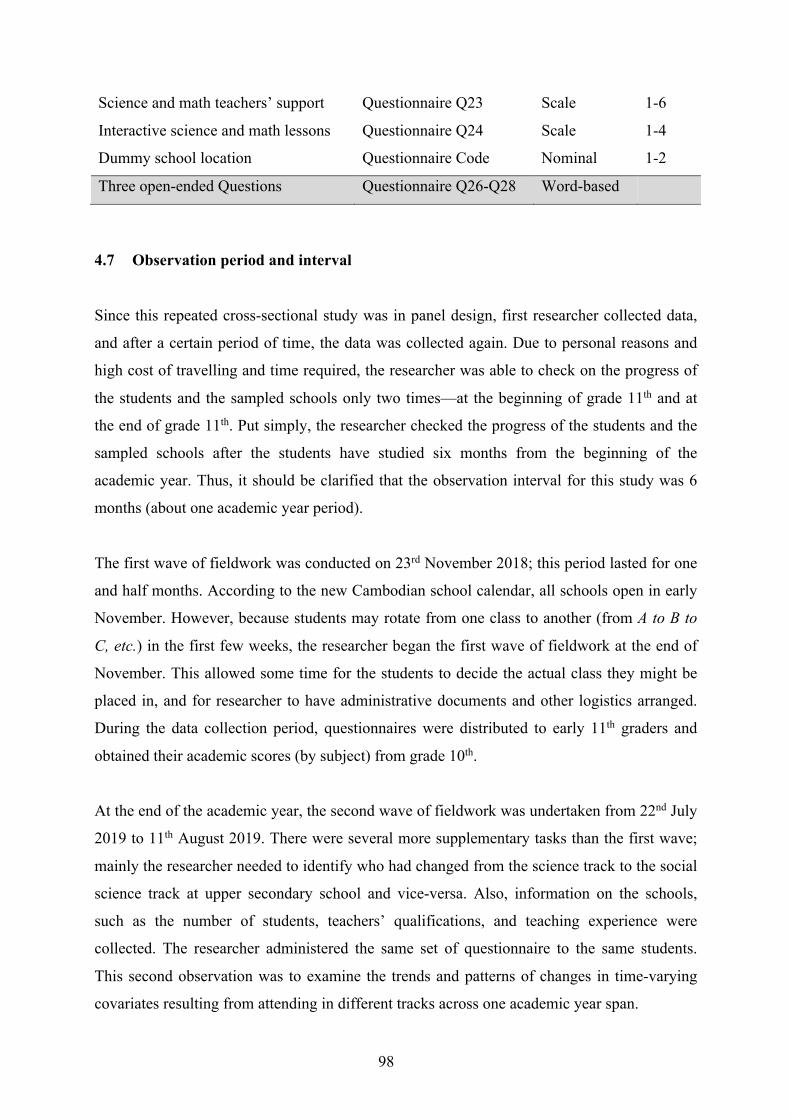
98
Science and math teachers’ support Questionnaire Q23 Scale 1-6
Interactive science and math lessons Questionnaire Q24 Scale 1-4
Dummy school location Questionnaire Code Nominal 1-2
Three open-ended Questions Questionnaire Q26-Q28 Word-based
4.7 Observation period and interval
Since this repeated cross-sectional study was in panel design, first researcher collected data,
and after a certain period of time, the data was collected again. Due to personal reasons and
high cost of travelling and time required, the researcher was able to check on the progress of
the students and the sampled schools only two times—at the beginning of grade 11th and at
the end of grade 11th. Put simply, the researcher checked the progress of the students and the
sampled schools after the students have studied six months from the beginning of the
academic year. Thus, it should be clarified that the observation interval for this study was 6
months (about one academic year period).
The first wave of fieldwork was conducted on 23rd November 2018; this period lasted for one
and half months. According to the new Cambodian school calendar, all schools open in early
November. However, because students may rotate from one class to another (from A to B to
C, etc.) in the first few weeks, the researcher began the first wave of fieldwork at the end of
November. This allowed some time for the students to decide the actual class they might be
placed in, and for researcher to have administrative documents and other logistics arranged.
During the data collection period, questionnaires were distributed to early 11th graders and
obtained their academic scores (by subject) from grade 10th.
At the end of the academic year, the second wave of fieldwork was undertaken from 22nd July
2019 to 11th August 2019. There were several more supplementary tasks than the first wave;
mainly the researcher needed to identify who had changed from the science track to the social
science track at upper secondary school and vice-versa. Also, information on the schools,
such as the number of students, teachers’ qualifications, and teaching experience were
collected. The researcher administered the same set of questionnaire to the same students.
This second observation was to examine the trends and patterns of changes in time-varying
covariates resulting from attending in different tracks across one academic year span.
99
4.8 Data collection procedure
Conducting a repeated cross-sectional study in general, and a panel design in particular, was
one of the most challenging tasks, especially in terms of data collection. This section therefore
details how the data of this study was collected. First, after receiving the permission letter
from the authorizing department, Department of Higher Education, the researcher sent the
letters to the targeted upper secondary schools so as to seek their approval. The researcher
made an appointment as soon as the request was approved. At upper secondary school, there
were three main steps undertook to collect the data.
First, the researcher asked for a list of all grade 11th in that particular school. Stratified
random sampling was then employed to select one or two classes each from the science track
and the social science track, respectively. As the classes were identified, the researcher had to
go to that randomly selected classes to begin the data collection procedure. Prior to
administering the questionnaire, researcher explained to the students the objective, purpose,
contribution, and how to complete the questionnaire (specifically each part). The students
needed approximately 45 to 60 minutes to fill out the questionnaire.
As the in-class collection procedure finished, the third step was to collect data on academic
achievement of each participating students. The researcher worked with the school principal
or vice-principal in charge to obtain the students’ academic scores of grade 10th and grade
11th. The academic achievement was recorded from the so-called Academic record booklet.
The academic scores of the 10 subjects (mathematics, physics, chemistry, biology, earth-
environmental science, Khmer literature, history, geography, moral civics, and foreign
languages) were recorded for each sample. Although researcher asked about these scores in
the questionnaire, students may have forgotten their scores or gave incorrect ones. Researcher
applied this process (except for the first step) in the second phase of data collection.
4.9 Data analysis
4.9.1 Data processing
Prior to the main data analysis several steps of data processing to manage the current study’s
data were employed. First, after the collection of the survey questionnaire, the researcher
checked the data manually to see if the questionnaires had been completely filled out and if
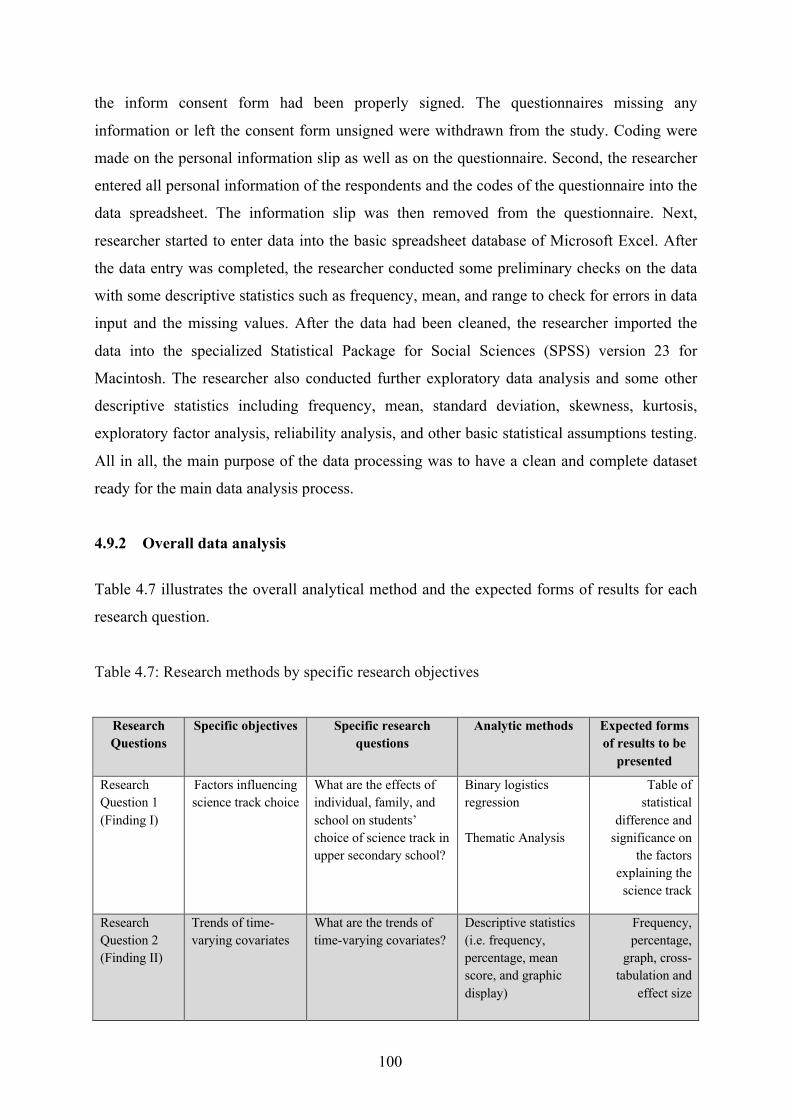
100
the inform consent form had been properly signed. The questionnaires missing any
information or left the consent form unsigned were withdrawn from the study. Coding were
made on the personal information slip as well as on the questionnaire. Second, the researcher
entered all personal information of the respondents and the codes of the questionnaire into the
data spreadsheet. The information slip was then removed from the questionnaire. Next,
researcher started to enter data into the basic spreadsheet database of Microsoft Excel. After
the data entry was completed, the researcher conducted some preliminary checks on the data
with some descriptive statistics such as frequency, mean, and range to check for errors in data
input and the missing values. After the data had been cleaned, the researcher imported the
data into the specialized Statistical Package for Social Sciences (SPSS) version 23 for
Macintosh. The researcher also conducted further exploratory data analysis and some other
descriptive statistics including frequency, mean, standard deviation, skewness, kurtosis,
exploratory factor analysis, reliability analysis, and other basic statistical assumptions testing.
All in all, the main purpose of the data processing was to have a clean and complete dataset
ready for the main data analysis process.
4.9.2 Overall data analysis
Table 4.7 illustrates the overall analytical method and the expected forms of results for each
research question.
Table 4.7: Research methods by specific research objectives
Research Questions
Specific objectives Specific research questions
Analytic methods Expected forms of results to be
presented
Research Question 1 (Finding I)
Factors influencing science track choice
What are the effects of individual, family, and school on students’ choice of science track in upper secondary school?
Binary logistics regression Thematic Analysis
Table of statistical
difference and significance on
the factors explaining the science track
Research Question 2 (Finding II)
Trends of time-varying covariates
What are the trends of time-varying covariates?
Descriptive statistics (i.e. frequency, percentage, mean score, and graphic display)
Frequency, percentage,
graph, cross-tabulation and
effect size
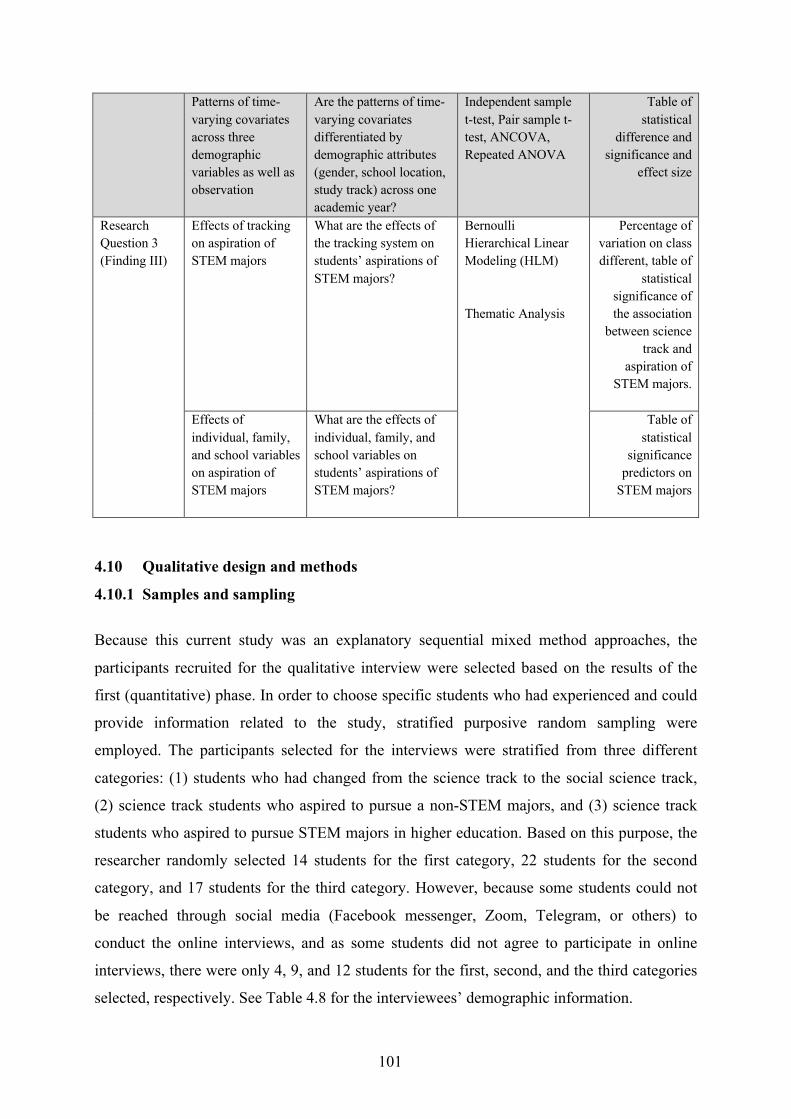
101
Patterns of time-varying covariates across three demographic variables as well as observation
Are the patterns of time-varying covariates differentiated by demographic attributes (gender, school location, study track) across one academic year?
Independent sample t-test, Pair sample t-test, ANCOVA, Repeated ANOVA
Table of statistical
difference and significance and
effect size
Research Question 3 (Finding III)
Effects of tracking on aspiration of STEM majors
What are the effects of the tracking system on students’ aspirations of STEM majors?
Bernoulli Hierarchical Linear Modeling (HLM) Thematic Analysis
Percentage of variation on class different, table of
statistical significance of the association
between science track and
aspiration of STEM majors.
Effects of individual, family, and school variables on aspiration of STEM majors
What are the effects of individual, family, and school variables on students’ aspirations of STEM majors?
Table of statistical
significance predictors on
STEM majors
4.10 Qualitative design and methods
4.10.1 Samples and sampling
Because this current study was an explanatory sequential mixed method approaches, the
participants recruited for the qualitative interview were selected based on the results of the
first (quantitative) phase. In order to choose specific students who had experienced and could
provide information related to the study, stratified purposive random sampling were
employed. The participants selected for the interviews were stratified from three different
categories: (1) students who had changed from the science track to the social science track,
(2) science track students who aspired to pursue a non-STEM majors, and (3) science track
students who aspired to pursue STEM majors in higher education. Based on this purpose, the
researcher randomly selected 14 students for the first category, 22 students for the second
category, and 17 students for the third category. However, because some students could not
be reached through social media (Facebook messenger, Zoom, Telegram, or others) to
conduct the online interviews, and as some students did not agree to participate in online
interviews, there were only 4, 9, and 12 students for the first, second, and the third categories
selected, respectively. See Table 4.8 for the interviewees’ demographic information.
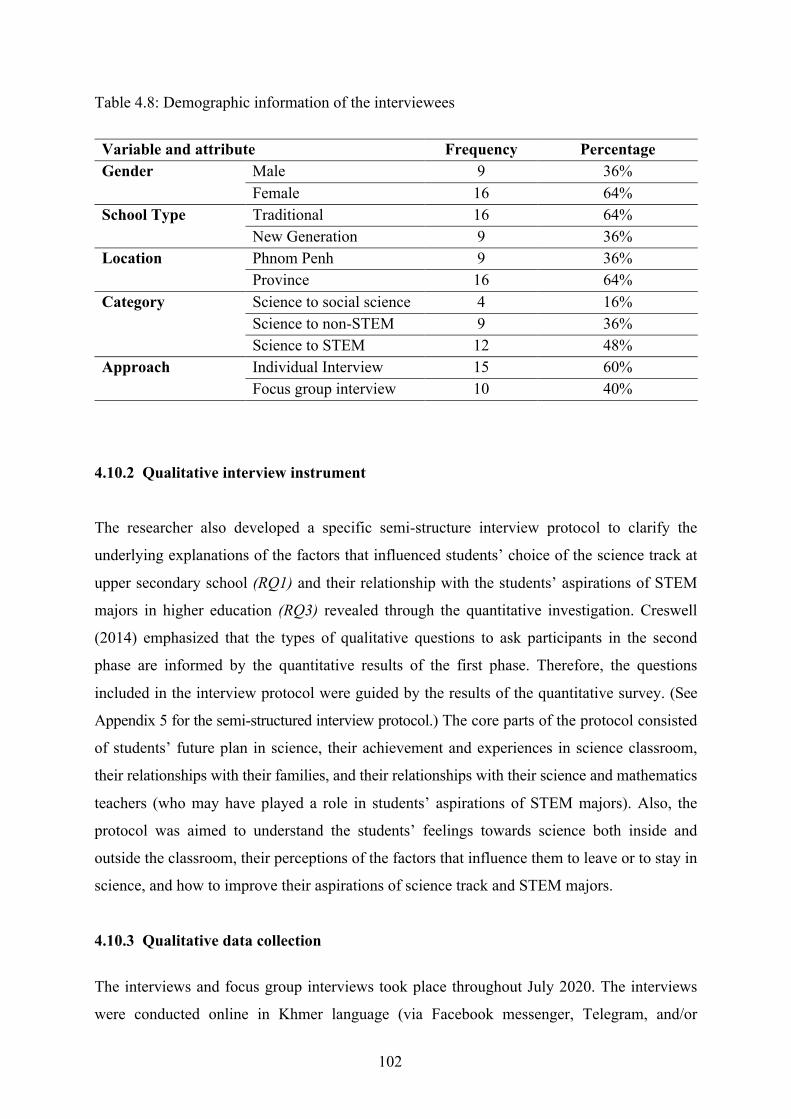
102
Table 4.8: Demographic information of the interviewees
Variable and attribute Frequency Percentage Gender Male 9 36%
Female 16 64% School Type Traditional 16 64%
New Generation 9 36% Location Phnom Penh 9 36%
Province 16 64% Category Science to social science 4 16%
Science to non-STEM 9 36% Science to STEM 12 48%
Approach Individual Interview 15 60% Focus group interview 10 40%
4.10.2 Qualitative interview instrument
The researcher also developed a specific semi-structure interview protocol to clarify the
underlying explanations of the factors that influenced students’ choice of the science track at
upper secondary school (RQ1) and their relationship with the students’ aspirations of STEM
majors in higher education (RQ3) revealed through the quantitative investigation. Creswell
(2014) emphasized that the types of qualitative questions to ask participants in the second
phase are informed by the quantitative results of the first phase. Therefore, the questions
included in the interview protocol were guided by the results of the quantitative survey. (See
Appendix 5 for the semi-structured interview protocol.) The core parts of the protocol consisted
of students’ future plan in science, their achievement and experiences in science classroom,
their relationships with their families, and their relationships with their science and mathematics
teachers (who may have played a role in students’ aspirations of STEM majors). Also, the
protocol was aimed to understand the students’ feelings towards science both inside and
outside the classroom, their perceptions of the factors that influence them to leave or to stay in
science, and how to improve their aspirations of science track and STEM majors.
4.10.3 Qualitative data collection
The interviews and focus group interviews took place throughout July 2020. The interviews
were conducted online in Khmer language (via Facebook messenger, Telegram, and/or
103
ZOOM). The interviews lasted from 30 minutes to 1 hour depending on the quality of Internet
connection, the availability of the participants, and their willingness to express more insights.
The researcher first needed to arrange the interviews with the students, since they also have
had to take online classes during the Covid-19 pandemic. The interviews were mostly
conducted in the evening and on the weekend. Since the researcher did not want to miss the
exact words from the interviewees and to increase the transferability of the data, the
researcher requested permission to record the interviews, which all students granted.
4.10.4 Qualitative data analysis and interpretation
According to Creswell (2014), the quantitative and qualitative data in explanatory sequential
mixed method approaches should be analyzed separately. Therefore, the analysis of the
qualitative data in this current study was made after finishing the interviews. Overall, the
analysis followed the approach of qualitative data analysis of coding and thematic analysis.
The following were the data analysis and representation steps (Williamson, Given, & Scifleet,
2018):
• Step1: Data organization: the interviews were transcribed and translated into English.
The researcher organized the data according to the categories of the respondents.
• Step 2: Reading and memoing: research first read through all the transcripts from all the
respondents to get a holistic understanding of the data and made some memos on the
margins of the script.
• Step 3: Describing the data into codes and themes (open coding): researcher read five
transcripts and made margin notes.
• Step 4: Classifying the data into codes and themes (axial coding): researcher re-read the
transcripts and began to develop a set of categories that worked across them. The
categories were listed and used as coding manual for analyzing the other transcripts.
• Step 5: Using open coding and axial coding to code other data: the remaining transcripts
were coded using the codes in the manual, but the list could be added and refined.
• Step 6: Coding towards themes or categories (selective coding): the categories and sub-
categories were listed. The major themes should now be drawn from the list.
Briefly explain, to analyze the data from the individual interviews and focus group interviews,
first the researcher transcribed the data. Since the interviews were conducted in Khmer
language, the transcripts were made in Khmer language. As the transcript was done, the
104
researcher organized the data according to the categories of the respondents (science to social
science, science to STEM, and science to non-STEM majors). Second, research first read
through all the transcripts to gain a holistic understanding of the data and wrote down some
memos in the margins of the scripts. Next, the researcher began to critically read five
transcripts and made the margin notes of the codes. Fourth, the researcher re-read the
transcripts and began to develop a set of categories that worked across them. During this axial
coding, categories were connected to identify themes (Strauss & Corbin, 1999) by
summarising the highlighted codes and categories for each participant in order to develop
themes and patterns among individuals. The categories were listed and used as coding manual
for analyzing the other transcripts. Next, to code the remaining transcripts, the research used
the coding manual developed. However, the list of the codes was able to be refined as there
was any emerging codes. Finally, the categories and sub-categories were listed so as to draw
emerging themes that corresponded to the guided questions. The researcher recorded the
themes in Microsoft Excel spreadsheet.
In the explanatory sequential mixed method approaches, researcher interpreted the follow-up
qualitative findings in a discussion section of the study. Creswell and Creswell (2018) directed
that researcher should first report on the results of the first (quantitative) phase and then the
findings of the second (qualitative) phase. The qualitative findings were used to provide insight
into the quantitative findings. Therefore, in this study, the qualitative findings were interpreted
and discussed in each quantitative finding and in the overall discussion respectively.
Grounded in the specific research objectives and variables, Figure 4.5 further illustrates the
holistic analytical framework for the current study. It indicates the time-invariant variables and
time-varying covariates within the three dimensions of individual, family, and upper secondary
school. The figure further indicates which variables and how the current study analyzed the data
for each specific research question. Again, the main outcome for the first wave of data relates to
explaining upper secondary school students’ choice of the science track (Research Question 1).
The outcomes of the first and the second waves of data were the trends and patterns of time-
varying covariates across the two observations (as a function of gender, school location, and
study track [Research Question 2]). The outcomes of the second wave of data entailed
investigating the effects of tracking and other multi-dimensional variables on Cambodian upper
secondary school students’ aspirations of STEM majors from a multilevel analysis perspective
(the main research question, Research Question 3).
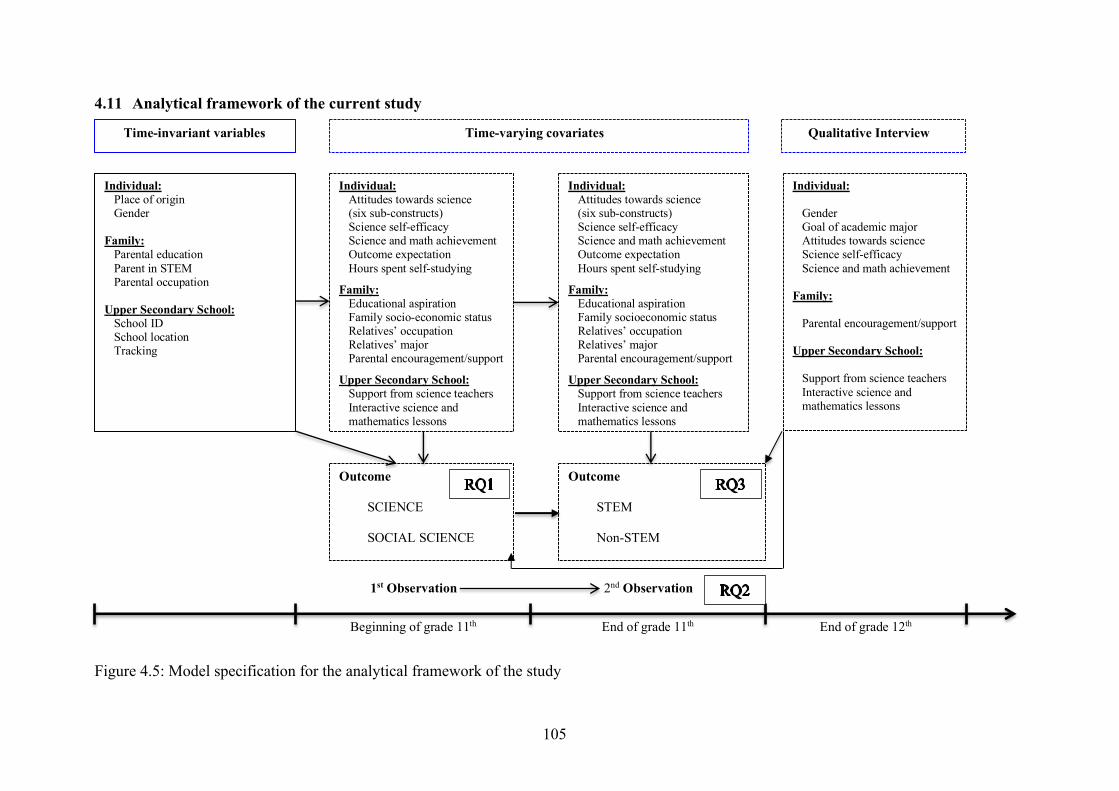
105
4.11 Analytical framework of the current study
Figure 4.5: Model specification for the analytical framework of the study
Time-invariant variables Time-varying covariates
Individual: Place of origin Gender Family: Parental education Parent in STEM Parental occupation Upper Secondary School: School ID School location Tracking
Individual: Attitudes towards science (six sub-constructs) Science self-efficacy
Science and math achievement Outcome expectation Hours spent self-studying
Family: Educational aspiration Family socio-economic status Relatives’ occupation Relatives’ major Parental encouragement/support
Upper Secondary School: Support from science teachers
Interactive science and mathematics lessons
Individual: Attitudes towards science (six sub-constructs) Science self-efficacy
Science and math achievement Outcome expectation Hours spent self-studying
Family: Educational aspiration Family socioeconomic status Relatives’ occupation Relatives’ major Parental encouragement/support
Upper Secondary School: Support from science teachers
Interactive science and mathematics lessons
Outcome
SCIENCE SOCIAL SCIENCE
Outcome
STEM Non-STEM
Beginning of grade 11th End of grade 11th End of grade 12th
1st Observation 2nd Observation
Qualitative Interview
Individual: Gender Goal of academic major Attitudes towards science Science self-efficacy
Science and math achievement Family: Parental encouragement/support Upper Secondary School: Support from science teachers
Interactive science and mathematics lessons
106
CHAPTER FIVE: CHOICE OF THE SCIENCE TRACK: FINDING I
The problem, objective, the framework, and the “how” components of the current study
discussed in the previous chapters serve as the foundation for displaying the purpose of this
chapter. This chapter, therefore, starts with the details of the first key finding of the study. Put
simply, the chapter displays and discusses the findings on factors that explained Cambodian
upper secondary school students’ choice of the science track. Employing the main conceptual
framework, the current study looked at the factors from the three dimensions stated earlier
(individual, family, and upper secondary school related factors). This chapter begins with the
method (samples and data analysis) and ends with a discussion and conclusion responding to
research question 1.
In this chapter, the researcher addressed the following research question as follow.
RQ 1: What factors (individual, family, and school) are influencing Cambodian upper
secondary school students’ choice of science track?
5.1 Method for RQ 1
5.1.1 Samples
As briefly reported, the data from the first wave was analyzed to answer research question 1.
Therefore, the data for the first research question was collected from 752 early grade 11th
students from 9 upper secondary schools in the three provinces (Phnom Penh, Kampong
Cham, and Battambang) of Cambodia. Of these samples, 44% were male students and 56%
were female students. In this first wave data, from the tracking perspective, 61.8% of the
students were in the science track and 38.3% were in the social science track. While 47.1%
were from urban areas, 52.9% were from non-urban areas.
5.1.2 Data analysis method
It is worth to remind here that the first objective of this current study was to investigate the
factors that explained Cambodian upper secondary school students’ choice of the science
track versus the social science track. Since the outcome variable was coded dichotomously,
Binary Logistic Regression (Field, 2009; Leech, Barrett, & Morgan, 2005), Enter Method,
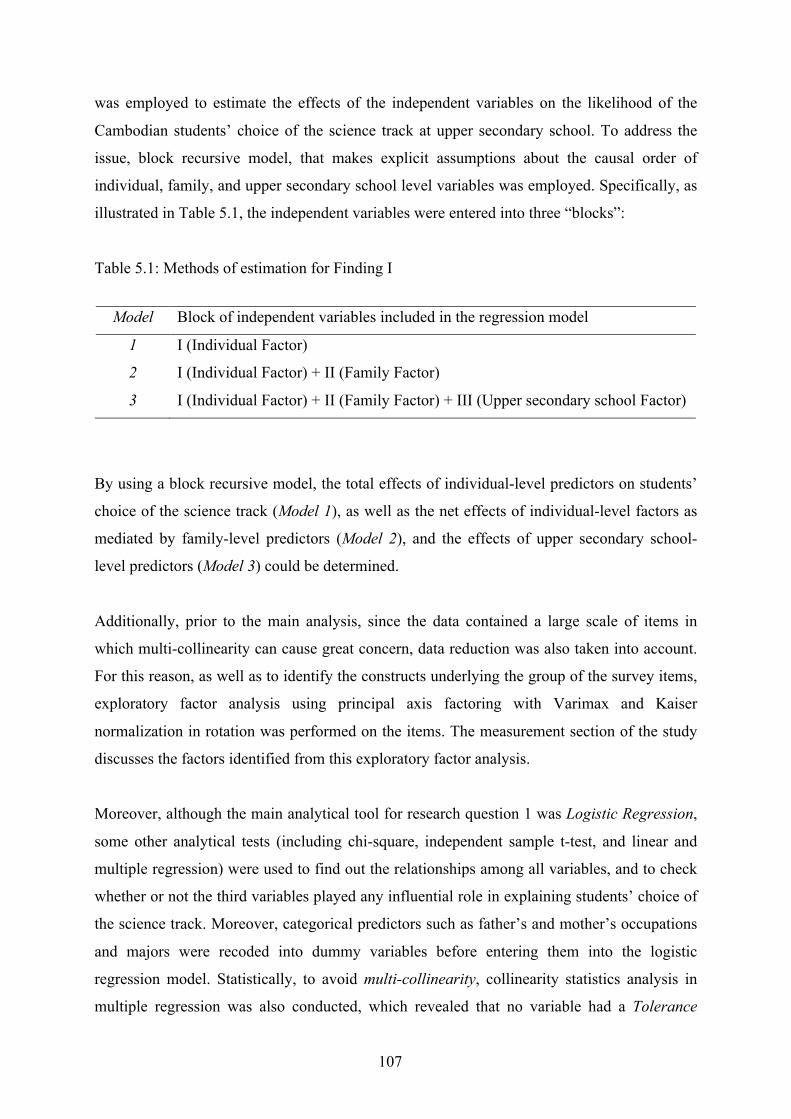
107
was employed to estimate the effects of the independent variables on the likelihood of the
Cambodian students’ choice of the science track at upper secondary school. To address the
issue, block recursive model, that makes explicit assumptions about the causal order of
individual, family, and upper secondary school level variables was employed. Specifically, as
illustrated in Table 5.1, the independent variables were entered into three “blocks”:
Table 5.1: Methods of estimation for Finding I
Model Block of independent variables included in the regression model
1 I (Individual Factor)
2 I (Individual Factor) + II (Family Factor)
3 I (Individual Factor) + II (Family Factor) + III (Upper secondary school Factor)
By using a block recursive model, the total effects of individual-level predictors on students’
choice of the science track (Model 1), as well as the net effects of individual-level factors as
mediated by family-level predictors (Model 2), and the effects of upper secondary school-
level predictors (Model 3) could be determined.
Additionally, prior to the main analysis, since the data contained a large scale of items in
which multi-collinearity can cause great concern, data reduction was also taken into account.
For this reason, as well as to identify the constructs underlying the group of the survey items,
exploratory factor analysis using principal axis factoring with Varimax and Kaiser
normalization in rotation was performed on the items. The measurement section of the study
discusses the factors identified from this exploratory factor analysis.
Moreover, although the main analytical tool for research question 1 was Logistic Regression,
some other analytical tests (including chi-square, independent sample t-test, and linear and
multiple regression) were used to find out the relationships among all variables, and to check
whether or not the third variables played any influential role in explaining students’ choice of
the science track. Moreover, categorical predictors such as father’s and mother’s occupations
and majors were recoded into dummy variables before entering them into the logistic
regression model. Statistically, to avoid multi-collinearity, collinearity statistics analysis in
multiple regression was also conducted, which revealed that no variable had a Tolerance
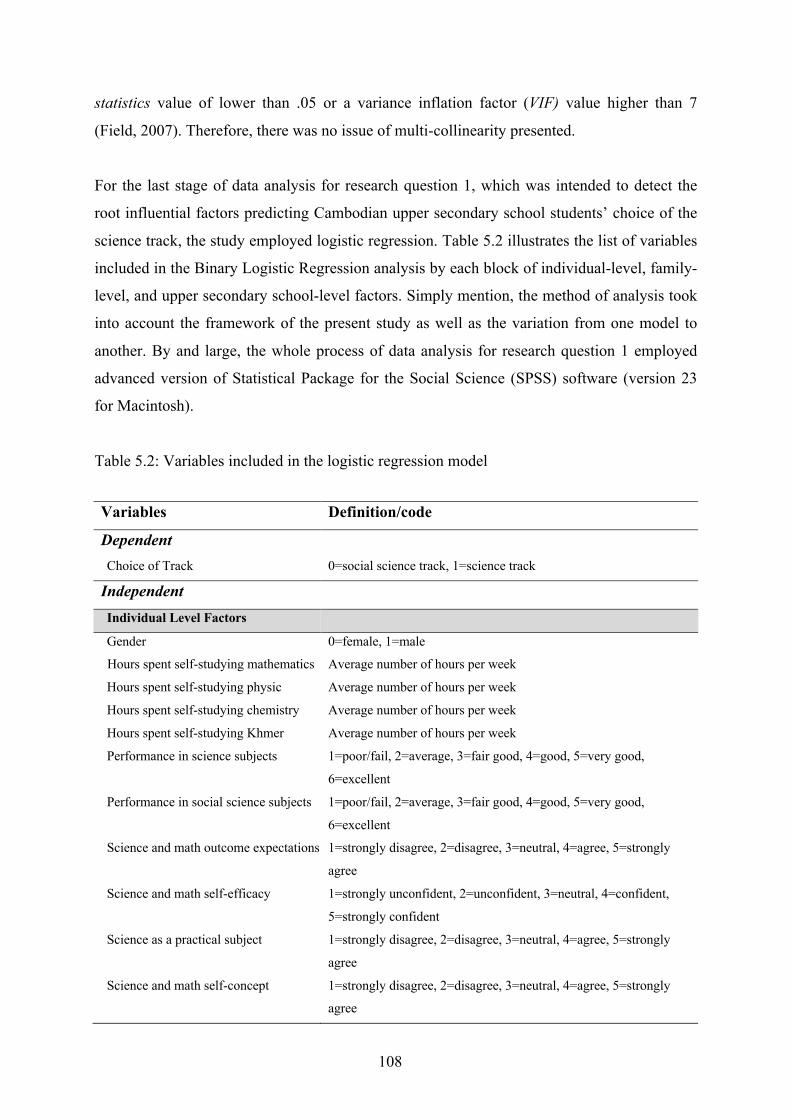
108
statistics value of lower than .05 or a variance inflation factor (VIF) value higher than 7
(Field, 2007). Therefore, there was no issue of multi-collinearity presented.
For the last stage of data analysis for research question 1, which was intended to detect the
root influential factors predicting Cambodian upper secondary school students’ choice of the
science track, the study employed logistic regression. Table 5.2 illustrates the list of variables
included in the Binary Logistic Regression analysis by each block of individual-level, family-
level, and upper secondary school-level factors. Simply mention, the method of analysis took
into account the framework of the present study as well as the variation from one model to
another. By and large, the whole process of data analysis for research question 1 employed
advanced version of Statistical Package for the Social Science (SPSS) software (version 23
for Macintosh).
Table 5.2: Variables included in the logistic regression model
Variables Definition/code
Dependent
Choice of Track 0=social science track, 1=science track
Independent
Individual Level Factors
Gender 0=female, 1=male
Hours spent self-studying mathematics Average number of hours per week
Hours spent self-studying physic Average number of hours per week
Hours spent self-studying chemistry Average number of hours per week
Hours spent self-studying Khmer Average number of hours per week
Performance in science subjects 1=poor/fail, 2=average, 3=fair good, 4=good, 5=very good,
6=excellent
Performance in social science subjects 1=poor/fail, 2=average, 3=fair good, 4=good, 5=very good,
6=excellent
Science and math outcome expectations 1=strongly disagree, 2=disagree, 3=neutral, 4=agree, 5=strongly
agree
Science and math self-efficacy 1=strongly unconfident, 2=unconfident, 3=neutral, 4=confident,
5=strongly confident
Science as a practical subject 1=strongly disagree, 2=disagree, 3=neutral, 4=agree, 5=strongly
agree
Science and math self-concept 1=strongly disagree, 2=disagree, 3=neutral, 4=agree, 5=strongly
agree
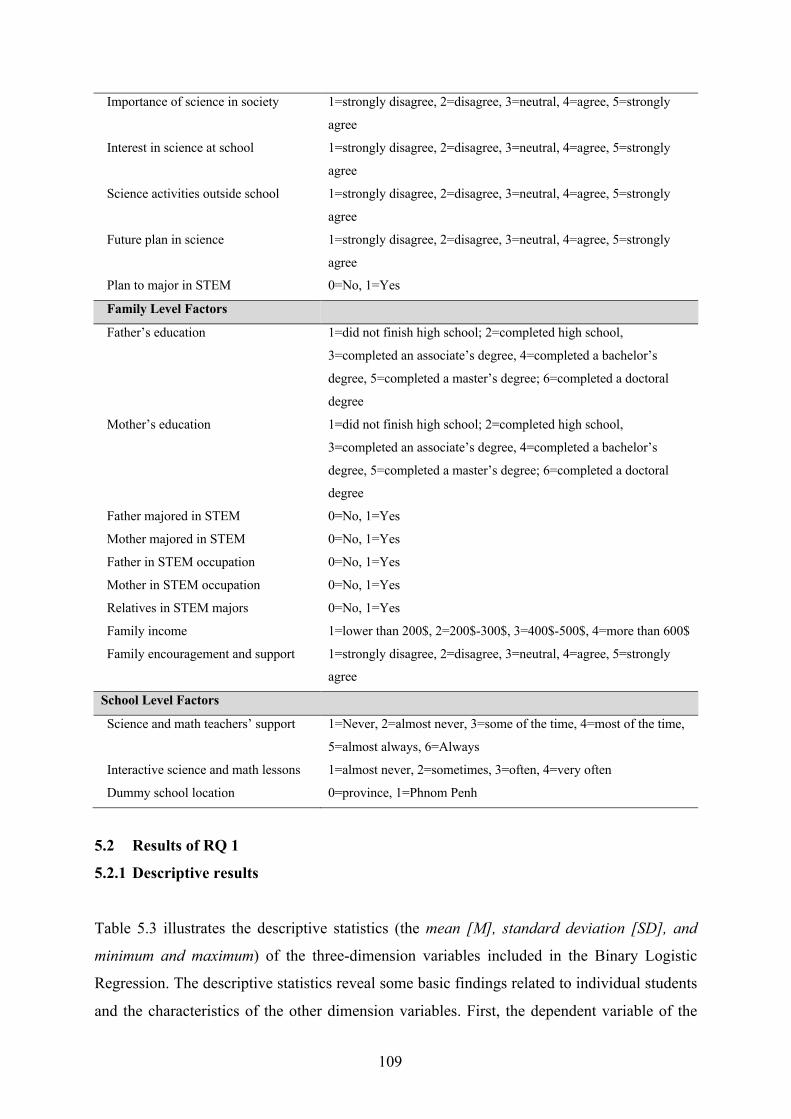
109
Importance of science in society 1=strongly disagree, 2=disagree, 3=neutral, 4=agree, 5=strongly
agree
Interest in science at school 1=strongly disagree, 2=disagree, 3=neutral, 4=agree, 5=strongly
agree
Science activities outside school 1=strongly disagree, 2=disagree, 3=neutral, 4=agree, 5=strongly
agree
Future plan in science 1=strongly disagree, 2=disagree, 3=neutral, 4=agree, 5=strongly
agree
Plan to major in STEM 0=No, 1=Yes
Family Level Factors
Father’s education 1=did not finish high school; 2=completed high school,
3=completed an associate’s degree, 4=completed a bachelor’s
degree, 5=completed a master’s degree; 6=completed a doctoral
degree
Mother’s education 1=did not finish high school; 2=completed high school,
3=completed an associate’s degree, 4=completed a bachelor’s
degree, 5=completed a master’s degree; 6=completed a doctoral
degree
Father majored in STEM 0=No, 1=Yes
Mother majored in STEM 0=No, 1=Yes
Father in STEM occupation 0=No, 1=Yes
Mother in STEM occupation 0=No, 1=Yes
Relatives in STEM majors 0=No, 1=Yes
Family income 1=lower than 200$, 2=200$-300$, 3=400$-500$, 4=more than 600$
Family encouragement and support 1=strongly disagree, 2=disagree, 3=neutral, 4=agree, 5=strongly
agree
School Level Factors
Science and math teachers’ support 1=Never, 2=almost never, 3=some of the time, 4=most of the time,
5=almost always, 6=Always
Interactive science and math lessons 1=almost never, 2=sometimes, 3=often, 4=very often
Dummy school location 0=province, 1=Phnom Penh
5.2 Results of RQ 1
5.2.1 Descriptive results
Table 5.3 illustrates the descriptive statistics (the mean [M], standard deviation [SD], and
minimum and maximum) of the three-dimension variables included in the Binary Logistic
Regression. The descriptive statistics reveal some basic findings related to individual students
and the characteristics of the other dimension variables. First, the dependent variable of the
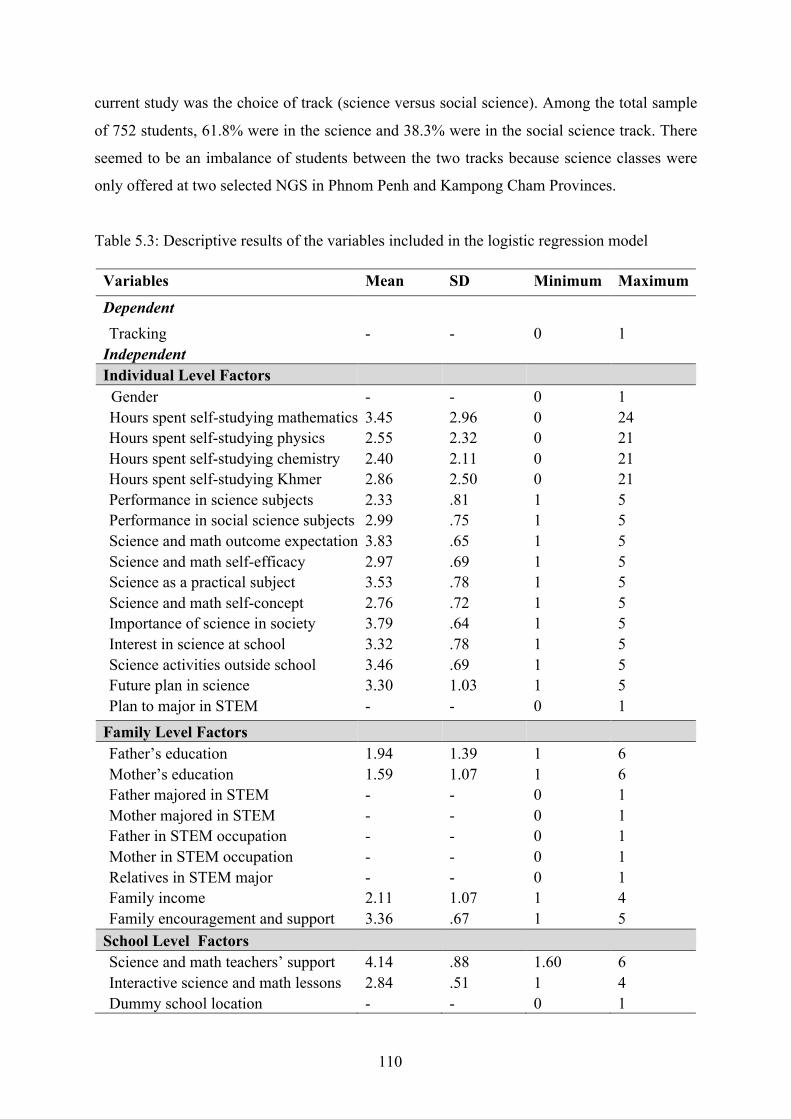
110
current study was the choice of track (science versus social science). Among the total sample
of 752 students, 61.8% were in the science and 38.3% were in the social science track. There
seemed to be an imbalance of students between the two tracks because science classes were
only offered at two selected NGS in Phnom Penh and Kampong Cham Provinces.
Table 5.3: Descriptive results of the variables included in the logistic regression model
Variables Mean SD Minimum Maximum Dependent Tracking - - 0 1
Independent Individual Level Factors Gender - - 0 1 Hours spent self-studying mathematics 3.45 2.96 0 24 Hours spent self-studying physics 2.55 2.32 0 21 Hours spent self-studying chemistry 2.40 2.11 0 21 Hours spent self-studying Khmer 2.86 2.50 0 21 Performance in science subjects 2.33 .81 1 5 Performance in social science subjects 2.99 .75 1 5 Science and math outcome expectation 3.83 .65 1 5 Science and math self-efficacy 2.97 .69 1 5 Science as a practical subject 3.53 .78 1 5 Science and math self-concept 2.76 .72 1 5 Importance of science in society 3.79 .64 1 5 Interest in science at school 3.32 .78 1 5 Science activities outside school 3.46 .69 1 5 Future plan in science 3.30 1.03 1 5 Plan to major in STEM - - 0 1
Family Level Factors Father’s education 1.94 1.39 1 6 Mother’s education 1.59 1.07 1 6 Father majored in STEM - - 0 1 Mother majored in STEM - - 0 1 Father in STEM occupation - - 0 1 Mother in STEM occupation - - 0 1 Relatives in STEM major - - 0 1 Family income 2.11 1.07 1 4 Family encouragement and support 3.36 .67 1 5
School Level Factors Science and math teachers’ support 4.14 .88 1.60 6 Interactive science and math lessons 2.84 .51 1 4 Dummy school location - - 0 1
111
Of the independent variables, since gender was measured dichotomously, mean score
calculation was not applicable. However, based on the descriptive statistics, 56% of the
sample was female and 44% was male. Next, hours spent self-studying mathematics and
science subjects entailed the average number of hours per week each student spent self-
studying at home. On average, students spent several hours (M=3.45, SD=2.96) on
mathematics, (M=2.55, SD=2.32) physics, (M=2.40, SD=2.11) chemistry, and (M=2.86,
SD=2.50) Khmer literature. With regards to academic performance, based on MoEYS grading
guidelines, most students had lower performance in science and mathematics subjects
(M=2.33, SD=.81) than social science subjects (M=2.99, SD=.75). With this performance
being just above average, although students seemed to have a higher level of science and
mathematics outcome expectations (M=3.83, SD=.65), they tended to have a moderate level
of science and mathematics self-efficacy (M=2.97, SD=.69). Most of note, for attitudes
towards science sub-constructs, the students had higher views of the practicality of science
subjects (M=3.53, SD=.78), lower science and mathematics self-concepts (M=2.76, SD=.72),
higher attitudes towards the importance of science in society (M=3.79, SD=.64), higher
attitudes towards science at school (M=3.32, SD=.78), higher attitudes towards science
activities outside school (M=3.46, SD=0.69), and future plan in science (M=3.30, SD=1.03).
Interestingly, 57% of the students planned to major in STEM, while 43% did not have any plan.
In terms of family-level factors, most of the students’ fathers had finished upper secondary
school (M=1.95, SD=1.39), but their mothers had an even lower level of education (M=1.59,
SD=1.07). Also, a lower percentage of them majored in STEM, and even fewer worked in
STEM-related occupations (less than 10%). Another predictor of family factors, the family’s
monthly income, seemed to fall somewhere between 200–400 USD (M=2.11, SD=1.07).
Lastly, reflected in Cambodia’s supportive culture, students received a high level of
encouragement and support from their families (M=3.36, SD=.67) in choosing to study
science.
Last, for upper secondary school-level factors, the students also seemed to receive moderate
support from their science and mathematics teachers regarding their choice of the science
track (M=4.14, SD=.88). However, the teaching of science and mathematics lessons were not
very interactive (M=2.84, SD=0.51). Lastly, based on a dummy-coded variable, 52.9% of the
samples attended upper secondary schools in the provinces, while only 47.1% were from
schools in Phnom Penh.
112
5.2.2 Interpretation and overall fit of the model
To gain deeper insight into the factors affecting students’ choice of the science track, analysis
by model (the individual-level factor model, the family-level factor model, and the upper
secondary school-level factor model) was conducted. Binary Logistic Regression, Enter
Method was employed because the dependent variable was dichotomously coded (0 for social
science track and 1 for the science track). In this regard, to facilitate the statistical
interpretation of the logistic regression results, three mechanisms for data reading were
utilised. First, to see if the model was a significant fit for the data, the -2log-likelihood
statistic and its associated chi-square statistics should be examined. This could be obtained
from the analogue of Cox & Snell R square or Nagelkerke R square. In statistical terms, the
proportion presented the amount of variance in the students’ choice of the science track,
accounted for by a combination of variables under each main factor (such as individual,
family, and upper secondary school factors). However, the interpretation in this study was
based on the Cox & Snell R square as it was more accurate than its counterpart. While the
value of the Cox and Snell R Square ranges from 0–.75, the value of Nagelkerke R square
ranges from 0–1. Second, to see the relationship of each variable contributing to explain the
variance in the students’ choice of the science track, researcher examined the value of
coefficient (B). The interpretation was based on the direction of the sign and numeric value.
For instance, in an equation where the science track is the referenced category, a negative
coefficient indicates that individuals with a higher value for the independent variables are
more likely to choose the social science than the science track and vice versa. Third, the
coefficient or odds ratio Exp(B), when exponentiated and subtracted from 1, was interpreted
as an indicator of the change in odds resulting from a unit of change in the predictor variables.
Put simply, it explains the level of change in the likelihood of the students’ choice of the
science track derived from a unit of change of each significant predictor variable. For ease of
interpretation, the formula [Exp(coefficient)–1] x 100 was used to convert the coefficient into
percentage differences in terms of odds.
Before delving into the explanation of each significant variable, let’s have a look at the
snapshot of the overall fit of the data to the model. Logistic regression analysis exhibited that
the total factors related to Cambodian upper secondary school students’ choice of the science
track explained 48.7% of the variance in students’ choice (Cox & Snell R Square=.487; see
Table 5.4). To be specific, individual-level factors accounted for 46.9% (Cox & Snell R
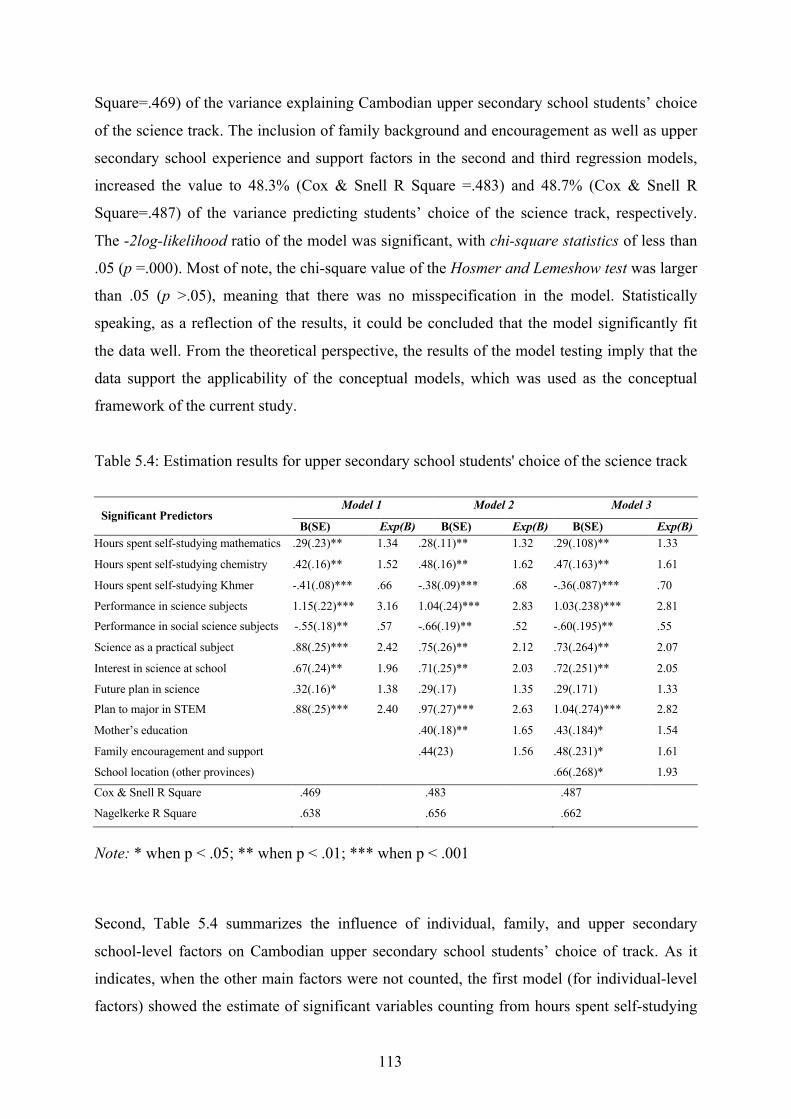
113
Square=.469) of the variance explaining Cambodian upper secondary school students’ choice
of the science track. The inclusion of family background and encouragement as well as upper
secondary school experience and support factors in the second and third regression models,
increased the value to 48.3% (Cox & Snell R Square =.483) and 48.7% (Cox & Snell R
Square=.487) of the variance predicting students’ choice of the science track, respectively.
The -2log-likelihood ratio of the model was significant, with chi-square statistics of less than
.05 (p =.000). Most of note, the chi-square value of the Hosmer and Lemeshow test was larger
than .05 (p >.05), meaning that there was no misspecification in the model. Statistically
speaking, as a reflection of the results, it could be concluded that the model significantly fit
the data well. From the theoretical perspective, the results of the model testing imply that the
data support the applicability of the conceptual models, which was used as the conceptual
framework of the current study.
Table 5.4: Estimation results for upper secondary school students' choice of the science track
Significant Predictors
Model 1 Model 2 Model 3
B(SE) Exp(B) B(SE) Exp(B) B(SE) Exp(B) Hours spent self-studying mathematics .29(.23)** 1.34 .28(.11)** 1.32 .29(.108)** 1.33
Hours spent self-studying chemistry .42(.16)** 1.52 .48(.16)** 1.62 .47(.163)** 1.61
Hours spent self-studying Khmer -.41(.08)*** .66 -.38(.09)*** .68 -.36(.087)*** .70
Performance in science subjects 1.15(.22)*** 3.16 1.04(.24)*** 2.83 1.03(.238)*** 2.81
Performance in social science subjects -.55(.18)** .57 -.66(.19)** .52 -.60(.195)** .55
Science as a practical subject .88(.25)*** 2.42 .75(.26)** 2.12 .73(.264)** 2.07
Interest in science at school .67(.24)** 1.96 .71(.25)** 2.03 .72(.251)** 2.05
Future plan in science .32(.16)* 1.38 .29(.17) 1.35 .29(.171) 1.33
Plan to major in STEM .88(.25)*** 2.40 .97(.27)*** 2.63 1.04(.274)*** 2.82
Mother’s education .40(.18)** 1.65 .43(.184)* 1.54
Family encouragement and support .44(23) 1.56 .48(.231)* 1.61
School location (other provinces) .66(.268)* 1.93
Cox & Snell R Square
Nagelkerke R Square
.469
.638
.483
.656
.487
.662
Note: * when p < .05; ** when p < .01; *** when p < .001 Second, Table 5.4 summarizes the influence of individual, family, and upper secondary
school-level factors on Cambodian upper secondary school students’ choice of track. As it
indicates, when the other main factors were not counted, the first model (for individual-level
factors) showed the estimate of significant variables counting from hours spent self-studying
114
chemistry and mathematics, performance in science subjects, science as a practical subject,
interest in science at school, future plan in science, and plan to major in STEM. Of these, the
total variance explained of students’ choice of the science track was 46.9% (Cox & Snell R
square=.469).
Interestingly, the inclusion of the second model (for family-level factors) into the first
model—in which the mother’s education level had a significant influence—expanded the total
variance. Of the total variance explained by the first model (46.9%), family-level factors
increased the variance to 48.3% (an increase of about 1.4%). However, the inclusion of this
model had neutralized the effect of future plan in science in the first model, because the
coefficient value of the future plan in science was a bit low, at .32 (p <.05). Lastly, regarding
the inclusion of the third model (for upper secondary school factors), and the total variance
explained by the entire model (48.7%), the third model added 04% to the variance in students’
choice of the science track.
5.2.3 Factors influencing upper secondary school students’ choice of the science track
5.2.3.1 Individual-level factors
The outcomes of logistic regression analysis indicate that individual-level factors impact
Cambodian upper secondary school students’ choice of the science track. Overall, the model
explained 46.9% (Cox & Snell R Square =.469) of the variance explaining students’ choice of
track (see Table 5.5). Among the key factors that survived in the model, the variables
included students’ background characteristics, personal ability, and attitudes or behaviours
accordingly. In particular, the following significantly predicted Cambodian upper secondary
school students’ choice of the science track: performance in science subjects (Exp(B)=3.16),
science as a practical subject (Exp(B)=2.42), plan to major in STEM in higher education
(Exp(B)=2.40), interest in science at school (Exp(B)=1.96), hours spent self-studying
chemistry (Exp(B)=1.52), and hours spent self-studying mathematics (Exp(B)=1.34).
Regarding influential factors, students with higher performance in science subjects were more
likely to choose the science track at the rate of 3.16 times higher than those with poor
performance in science subjects (Exp(B)=3.16, p <0.001). Conversely, students with higher
performance in social science subjects were less likely to choose the science track
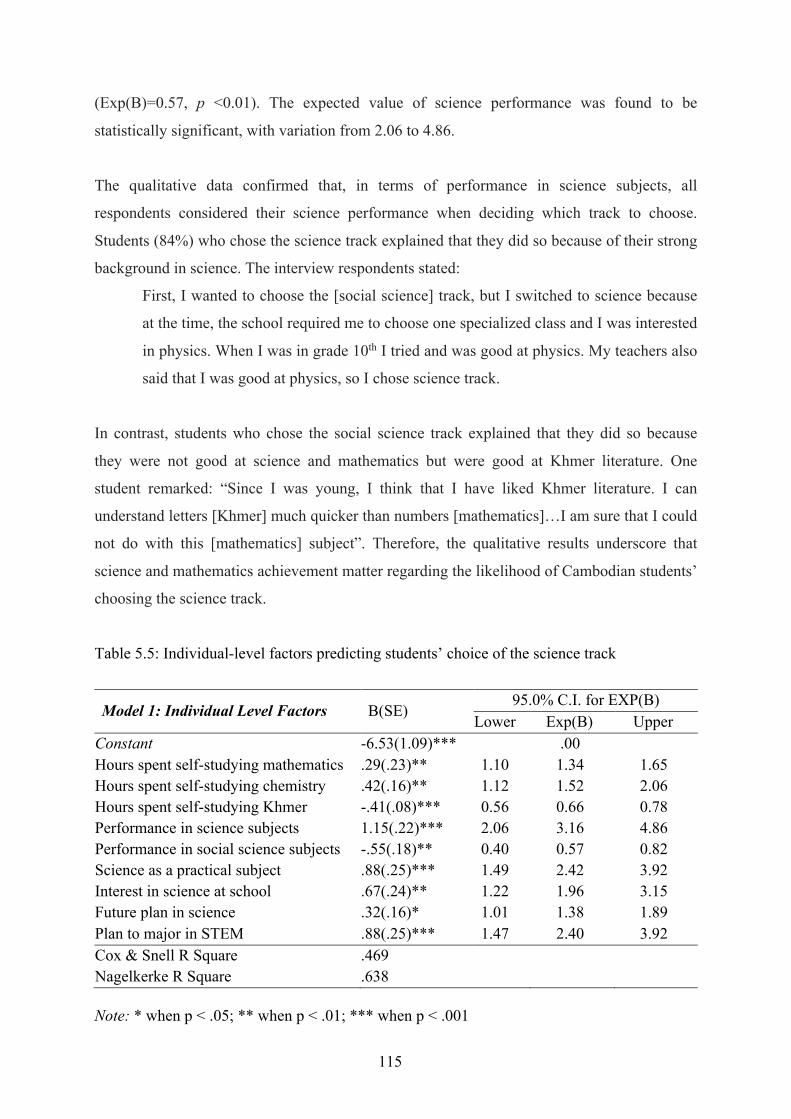
115
(Exp(B)=0.57, p <0.01). The expected value of science performance was found to be
statistically significant, with variation from 2.06 to 4.86.
The qualitative data confirmed that, in terms of performance in science subjects, all
respondents considered their science performance when deciding which track to choose.
Students (84%) who chose the science track explained that they did so because of their strong
background in science. The interview respondents stated:
First, I wanted to choose the [social science] track, but I switched to science because
at the time, the school required me to choose one specialized class and I was interested
in physics. When I was in grade 10th I tried and was good at physics. My teachers also
said that I was good at physics, so I chose science track.
In contrast, students who chose the social science track explained that they did so because
they were not good at science and mathematics but were good at Khmer literature. One
student remarked: “Since I was young, I think that I have liked Khmer literature. I can
understand letters [Khmer] much quicker than numbers [mathematics]…I am sure that I could
not do with this [mathematics] subject”. Therefore, the qualitative results underscore that
science and mathematics achievement matter regarding the likelihood of Cambodian students’
choosing the science track.
Table 5.5: Individual-level factors predicting students’ choice of the science track
Model 1: Individual Level Factors B(SE) 95.0% C.I. for EXP(B)
Lower Exp(B) Upper Constant -6.53(1.09)*** .00 Hours spent self-studying mathematics .29(.23)** 1.10 1.34 1.65 Hours spent self-studying chemistry .42(.16)** 1.12 1.52 2.06 Hours spent self-studying Khmer -.41(.08)*** 0.56 0.66 0.78 Performance in science subjects 1.15(.22)*** 2.06 3.16 4.86 Performance in social science subjects -.55(.18)** 0.40 0.57 0.82 Science as a practical subject .88(.25)*** 1.49 2.42 3.92 Interest in science at school .67(.24)** 1.22 1.96 3.15 Future plan in science .32(.16)* 1.01 1.38 1.89 Plan to major in STEM .88(.25)*** 1.47 2.40 3.92 Cox & Snell R Square Nagelkerke R Square
.469
.638
Note: * when p < .05; ** when p < .01; *** when p < .001
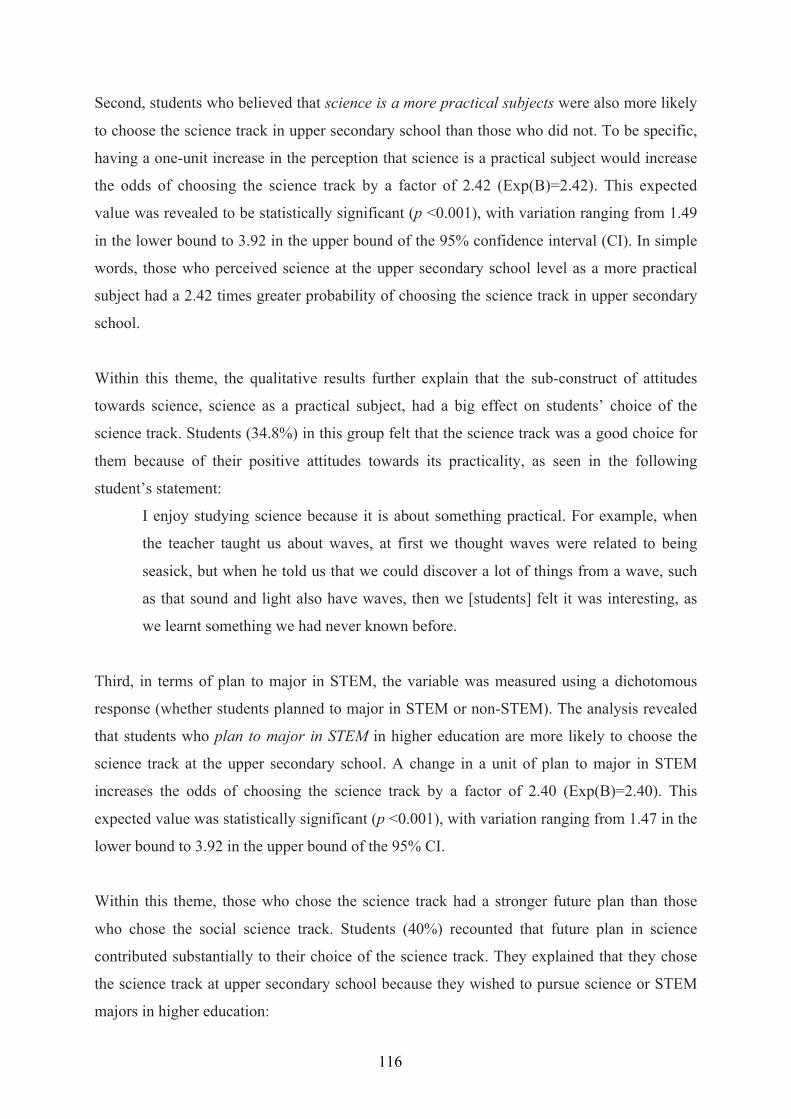
116
Second, students who believed that science is a more practical subjects were also more likely
to choose the science track in upper secondary school than those who did not. To be specific,
having a one-unit increase in the perception that science is a practical subject would increase
the odds of choosing the science track by a factor of 2.42 (Exp(B)=2.42). This expected
value was revealed to be statistically significant (p <0.001), with variation ranging from 1.49
in the lower bound to 3.92 in the upper bound of the 95% confidence interval (CI). In simple
words, those who perceived science at the upper secondary school level as a more practical
subject had a 2.42 times greater probability of choosing the science track in upper secondary
school.
Within this theme, the qualitative results further explain that the sub-construct of attitudes
towards science, science as a practical subject, had a big effect on students’ choice of the
science track. Students (34.8%) in this group felt that the science track was a good choice for
them because of their positive attitudes towards its practicality, as seen in the following
student’s statement:
I enjoy studying science because it is about something practical. For example, when
the teacher taught us about waves, at first we thought waves were related to being
seasick, but when he told us that we could discover a lot of things from a wave, such
as that sound and light also have waves, then we [students] felt it was interesting, as
we learnt something we had never known before.
Third, in terms of plan to major in STEM, the variable was measured using a dichotomous
response (whether students planned to major in STEM or non-STEM). The analysis revealed
that students who plan to major in STEM in higher education are more likely to choose the
science track at the upper secondary school. A change in a unit of plan to major in STEM
increases the odds of choosing the science track by a factor of 2.40 (Exp(B)=2.40). This
expected value was statistically significant (p <0.001), with variation ranging from 1.47 in the
lower bound to 3.92 in the upper bound of the 95% CI.
Within this theme, those who chose the science track had a stronger future plan than those
who chose the social science track. Students (40%) recounted that future plan in science
contributed substantially to their choice of the science track. They explained that they chose
the science track at upper secondary school because they wished to pursue science or STEM
majors in higher education:
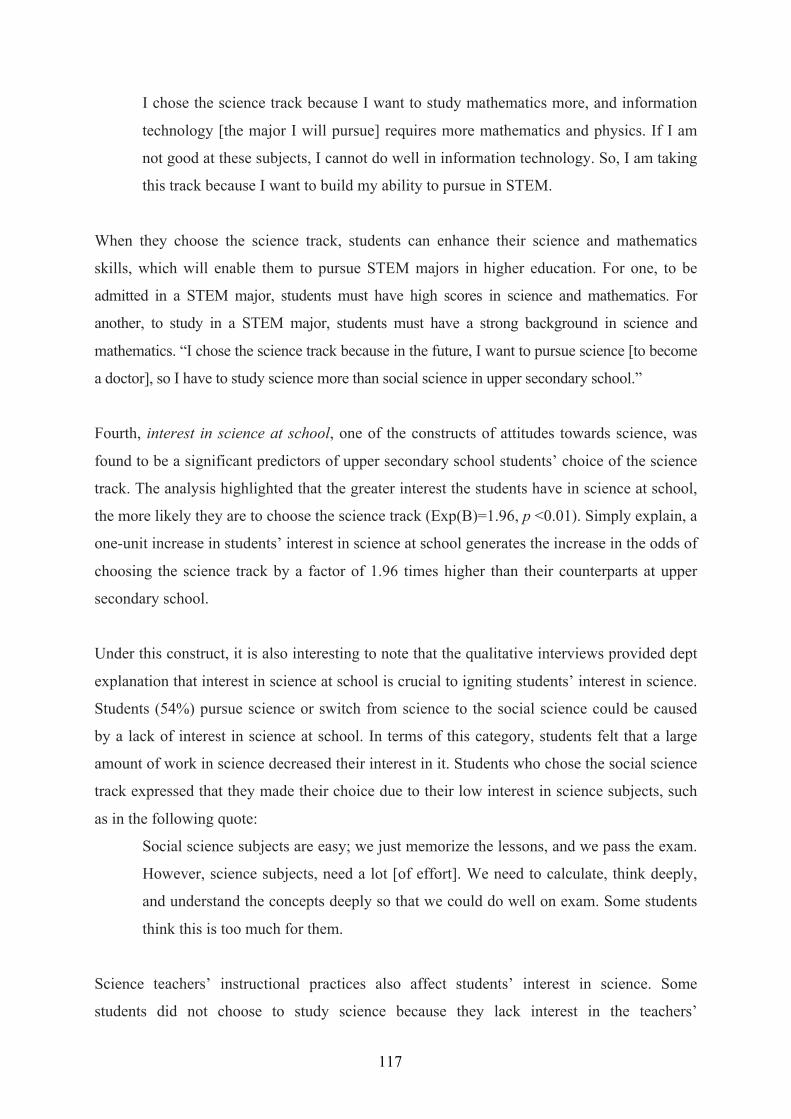
117
I chose the science track because I want to study mathematics more, and information
technology [the major I will pursue] requires more mathematics and physics. If I am
not good at these subjects, I cannot do well in information technology. So, I am taking
this track because I want to build my ability to pursue in STEM.
When they choose the science track, students can enhance their science and mathematics
skills, which will enable them to pursue STEM majors in higher education. For one, to be
admitted in a STEM major, students must have high scores in science and mathematics. For
another, to study in a STEM major, students must have a strong background in science and
mathematics. “I chose the science track because in the future, I want to pursue science [to become
a doctor], so I have to study science more than social science in upper secondary school.”
Fourth, interest in science at school, one of the constructs of attitudes towards science, was
found to be a significant predictors of upper secondary school students’ choice of the science
track. The analysis highlighted that the greater interest the students have in science at school,
the more likely they are to choose the science track (Exp(B)=1.96, p <0.01). Simply explain, a
one-unit increase in students’ interest in science at school generates the increase in the odds of
choosing the science track by a factor of 1.96 times higher than their counterparts at upper
secondary school.
Under this construct, it is also interesting to note that the qualitative interviews provided dept
explanation that interest in science at school is crucial to igniting students’ interest in science.
Students (54%) pursue science or switch from science to the social science could be caused
by a lack of interest in science at school. In terms of this category, students felt that a large
amount of work in science decreased their interest in it. Students who chose the social science
track expressed that they made their choice due to their low interest in science subjects, such
as in the following quote:
Social science subjects are easy; we just memorize the lessons, and we pass the exam.
However, science subjects, need a lot [of effort]. We need to calculate, think deeply,
and understand the concepts deeply so that we could do well on exam. Some students
think this is too much for them.
Science teachers’ instructional practices also affect students’ interest in science. Some
students did not choose to study science because they lack interest in the teachers’
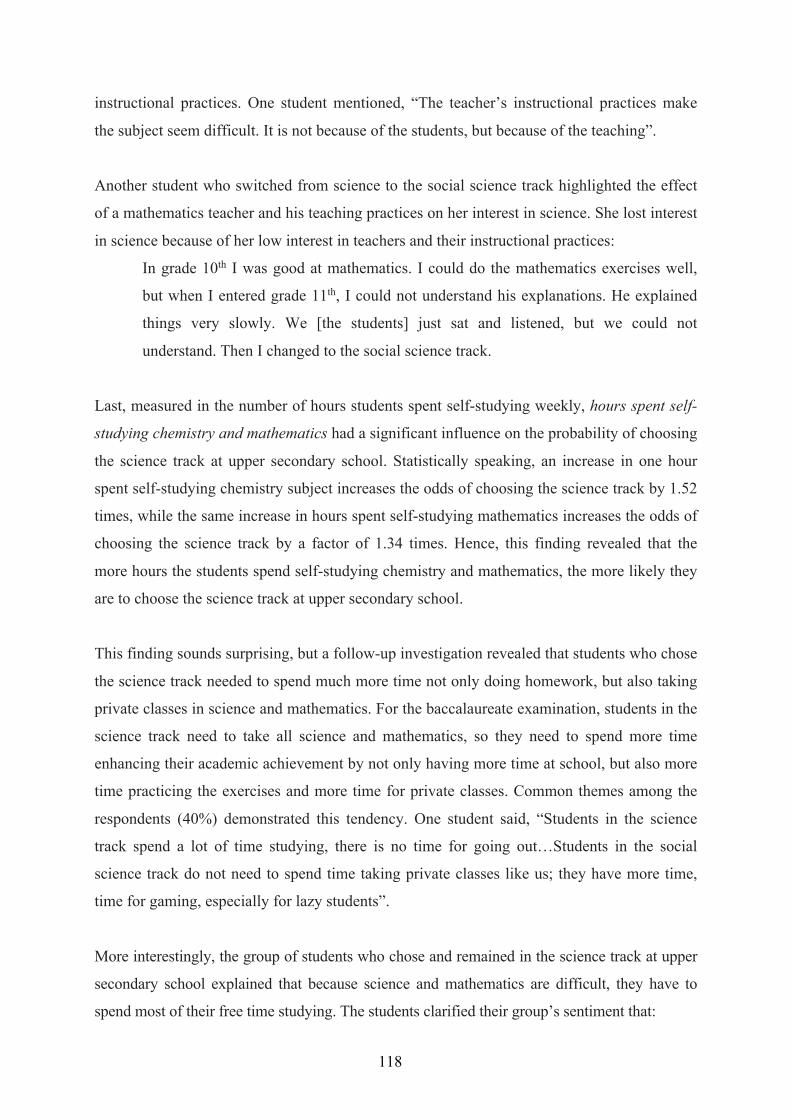
118
instructional practices. One student mentioned, “The teacher’s instructional practices make
the subject seem difficult. It is not because of the students, but because of the teaching”.
Another student who switched from science to the social science track highlighted the effect
of a mathematics teacher and his teaching practices on her interest in science. She lost interest
in science because of her low interest in teachers and their instructional practices:
In grade 10th I was good at mathematics. I could do the mathematics exercises well,
but when I entered grade 11th, I could not understand his explanations. He explained
things very slowly. We [the students] just sat and listened, but we could not
understand. Then I changed to the social science track.
Last, measured in the number of hours students spent self-studying weekly, hours spent self-
studying chemistry and mathematics had a significant influence on the probability of choosing
the science track at upper secondary school. Statistically speaking, an increase in one hour
spent self-studying chemistry subject increases the odds of choosing the science track by 1.52
times, while the same increase in hours spent self-studying mathematics increases the odds of
choosing the science track by a factor of 1.34 times. Hence, this finding revealed that the
more hours the students spend self-studying chemistry and mathematics, the more likely they
are to choose the science track at upper secondary school.
This finding sounds surprising, but a follow-up investigation revealed that students who chose
the science track needed to spend much more time not only doing homework, but also taking
private classes in science and mathematics. For the baccalaureate examination, students in the
science track need to take all science and mathematics, so they need to spend more time
enhancing their academic achievement by not only having more time at school, but also more
time practicing the exercises and more time for private classes. Common themes among the
respondents (40%) demonstrated this tendency. One student said, “Students in the science
track spend a lot of time studying, there is no time for going out…Students in the social
science track do not need to spend time taking private classes like us; they have more time,
time for gaming, especially for lazy students”.
More interestingly, the group of students who chose and remained in the science track at upper
secondary school explained that because science and mathematics are difficult, they have to
spend most of their free time studying. The students clarified their group’s sentiment that:

119
In science class, because it is hard, especially on the exam, we often use most of our
free time for study rather than play. When we study, we often spend time together
doing exercises given by the teachers and we help explain each other.
5.2.3.2 Family factors
As illustrated in Table 5.6, the inclusion of one’s family background and the upper secondary
school supports factors (in the second and third models) increased the effect size of most
variables in the first model, respectively. Although subject choice could be due to individual
preference, family background and encouragement, as well as school experience and support,
still play indispensable roles in Cambodian upper secondary school students’ likelihood of
choosing the science track.
Table 5.6: Family-level factors that predicted students’ choice of the science track
Model 2: Family Level Factors B(SE) 95.0% C.I. for EXP(B)
Lower Exp(B) Upper Constant -12.01(2.95)*** .00 Mother’s education level .40(.18)** 1.15 1.65 2.36 Cox & Snell R Square Nagelkerke R Square
.016
.018
Note: ** when p < .01; *** when p < .001
Of the variables in the family dimension, the mother’s education level contributed to the
significant value of children choosing the science track (Exp(B)=1.65, p <0.01). When an
important issue (such as students’ choice of track) is of concern, parents’ last minutes
persuasion tended to override students’ prior intentions. If the mother’s educational level
increases by one unit, the odds of a student choosing the science track at upper secondary
school increases by 1.65 times higher than students whose mother’s education is one unit
lower. This expected value was found to be statistically significant (p <0.01), with variation
ranging from 1.15 in the lower bound to 2.36 in the upper bound of the 95% CI. More
interestingly, in the third model, with the inclusion of upper secondary school factors, family
encouragement and support also exerted a significant influence on the students’ choice of the
science track. Statistically, a one-unit increase in family encouragement and support increases
120
the odds of students choosing the science track at upper secondary school by a factor of 1.61
times, (Exp(B)=1.61, p <.05).
In terms of the home environment, the students had a few comments, including about parents’
education and family encouragement and support. The students (25%) explained that parents’
education mattered in their choice of the science track, because if their parents have higher
knowledge, they will have a positive perception of science and vice versa. Parents objected to
students’ choice of the science track if they did not have much knowledge about it. One
student said:
My parents do not know what I am doing. Sometimes they asked me why I need to
work from dawn to dusk. I tell them that I am taking science classes at school. Then
they ask me why I have to study a lot for the science classes and if the students in
these classes will pass the national exam easily. I tell them that I have to study a lot for
the science classes, that they will be good for me in terms of going to university and
finding a job. They just reply [ehh] [ehh] because they do not have much knowledge
in this area as they have little education.
Regarding family encouragement and support, students in the science track need a lot of
support from their parents. This could be financial as well as time for their children to study
and for extracurricular activities in science. One explained that:
Another thing when studying in science classes is that we need a lot of support from
our parents. Like us, when we study and we have to complete a project, we need not
only the financial support, but also time to buy the equipment and to complete the
project.
Overall, the inclusion of variables at the family level lowered the effects of hours spent self-
studying mathematics, performance in science subjects, science as a practical subject, and
future plan in science. Interestingly, they have increased the odds of hours spent self-studying
chemistry, interest in science at school, and plan to major in STEM.
5.2.3.3 School factors
Third, from school experiences and support perspective, of the variables included in the
regression model, only upper secondary school location mattered in students’ choice of the
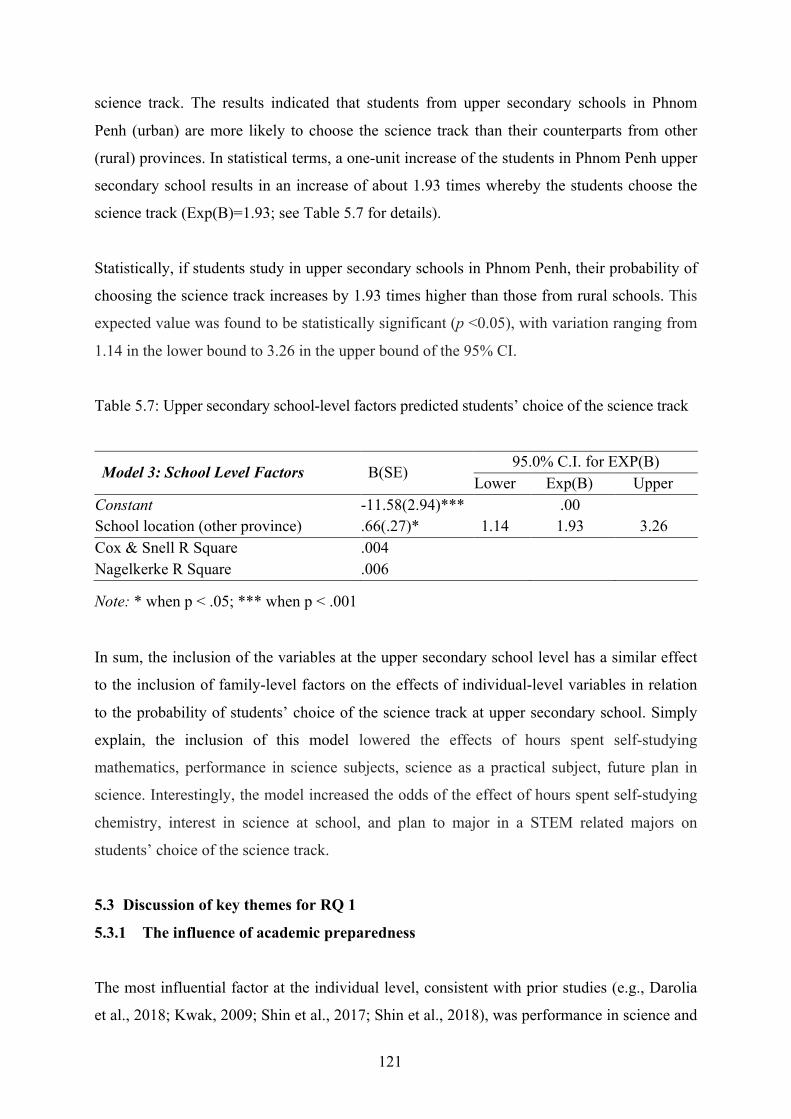
121
science track. The results indicated that students from upper secondary schools in Phnom
Penh (urban) are more likely to choose the science track than their counterparts from other
(rural) provinces. In statistical terms, a one-unit increase of the students in Phnom Penh upper
secondary school results in an increase of about 1.93 times whereby the students choose the
science track (Exp(B)=1.93; see Table 5.7 for details).
Statistically, if students study in upper secondary schools in Phnom Penh, their probability of
choosing the science track increases by 1.93 times higher than those from rural schools. This
expected value was found to be statistically significant (p <0.05), with variation ranging from
1.14 in the lower bound to 3.26 in the upper bound of the 95% CI.
Table 5.7: Upper secondary school-level factors predicted students’ choice of the science track
Model 3: School Level Factors B(SE) 95.0% C.I. for EXP(B)
Lower Exp(B) Upper Constant -11.58(2.94)*** .00 School location (other province) .66(.27)* 1.14 1.93 3.26 Cox & Snell R Square Nagelkerke R Square
.004
.006
Note: * when p < .05; *** when p < .001
In sum, the inclusion of the variables at the upper secondary school level has a similar effect
to the inclusion of family-level factors on the effects of individual-level variables in relation
to the probability of students’ choice of the science track at upper secondary school. Simply
explain, the inclusion of this model lowered the effects of hours spent self-studying
mathematics, performance in science subjects, science as a practical subject, future plan in
science. Interestingly, the model increased the odds of the effect of hours spent self-studying
chemistry, interest in science at school, and plan to major in a STEM related majors on
students’ choice of the science track.
5.3 Discussion of key themes for RQ 1
5.3.1 The influence of academic preparedness
The most influential factor at the individual level, consistent with prior studies (e.g., Darolia
et al., 2018; Kwak, 2009; Shin et al., 2017; Shin et al., 2018), was performance in science and
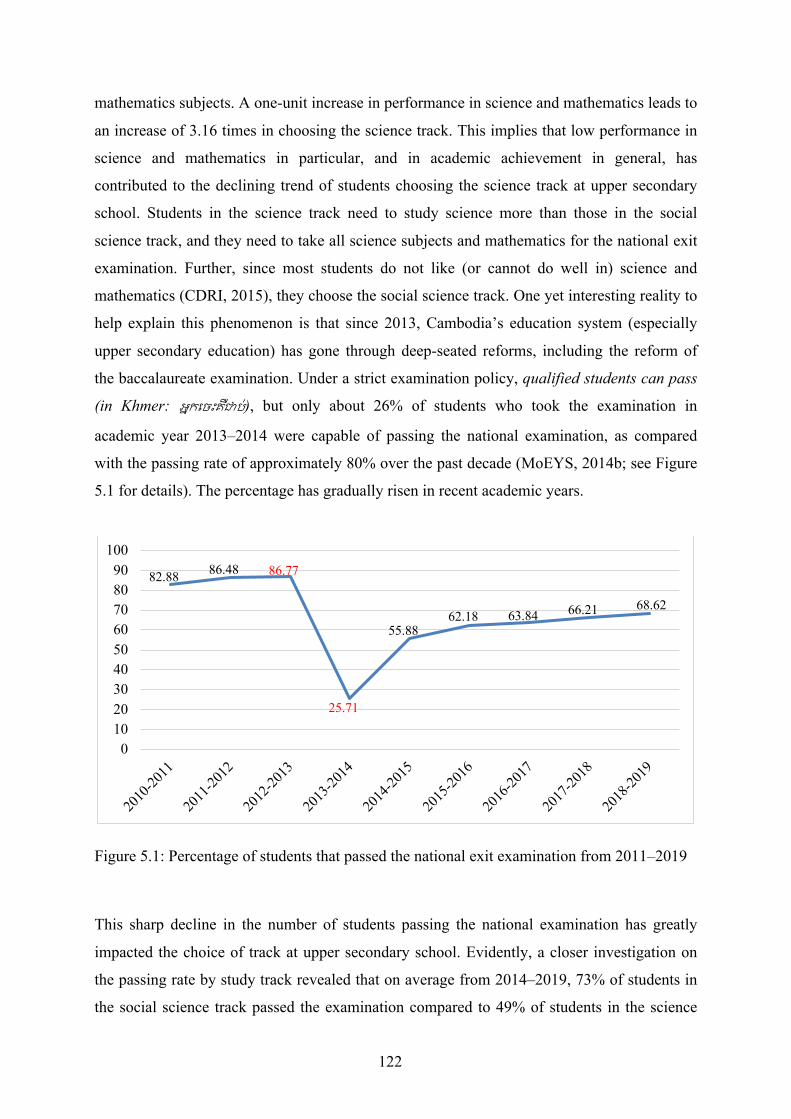
122
mathematics subjects. A one-unit increase in performance in science and mathematics leads to
an increase of 3.16 times in choosing the science track. This implies that low performance in
science and mathematics in particular, and in academic achievement in general, has
contributed to the declining trend of students choosing the science track at upper secondary
school. Students in the science track need to study science more than those in the social
science track, and they need to take all science subjects and mathematics for the national exit
examination. Further, since most students do not like (or cannot do well in) science and
mathematics (CDRI, 2015), they choose the social science track. One yet interesting reality to
help explain this phenomenon is that since 2013, Cambodia’s education system (especially
upper secondary education) has gone through deep-seated reforms, including the reform of
the baccalaureate examination. Under a strict examination policy, qualified students can pass
(in Khmer: អកេចះគជប), but only about 26% of students who took the examination in
academic year 2013–2014 were capable of passing the national examination, as compared
with the passing rate of approximately 80% over the past decade (MoEYS, 2014b; see Figure
5.1 for details). The percentage has gradually risen in recent academic years.
Figure 5.1: Percentage of students that passed the national exit examination from 2011–2019
This sharp decline in the number of students passing the national examination has greatly
impacted the choice of track at upper secondary school. Evidently, a closer investigation on
the passing rate by study track revealed that on average from 2014–2019, 73% of students in
the social science track passed the examination compared to 49% of students in the science
82.88 86.48 86.77
25.71
55.8862.18 63.84 66.21 68.62
0102030405060708090
100
2010
-2011
2011
-2012
2012
-2013
2013
-2014
2014
-2015
2015
-2016
2016
-2017
2017
-2018
2018
-2019
123
track (MoEYS, 2019f). The lower rate of students in the science track passing the national
exit examination might have lowered students’ self-efficacy in passing it, possibly causing
them to switch to the social science track, which has higher passing rate. Furthermore, in
addition to overall performance, academic achievement in mathematics and science is of great
concern. As evidence, during the 2015 national examination, out of the 83,325 students who
took it, only 23.3% passed the mathematics portion, while 41.7% passed the biology portion.
Since students in the science track have to take more difficult science and mathematics test on
the examination, most students might lower their self-concept and efficacy in science and
mathematics subjects and choose the social science track, which is generally perceived as
easier, and has a higher percentage in terms of getting a passing grade on the baccalaureate
examination. This finding confirms what has been recently found in the Korean context that
not only the overall but also the science and mathematics performance are the most significant
predictors of students’ likelihood of choosing the science track (Paik & Shim, 2013).
5.3.2 The influence of attitudes towards science
Of the attitudes towards science constructs, science as a practical subject and future plan in
science are the second and third most influential factors in predicting Cambodian upper
secondary school students’ choice of the science track. This finding supports the longstanding
discussed supposition that weaker attitudes towards science and future participation in science
are among the factors that have been reducing students’ likelihood of choosing the science
track, or causing students to leave science altogether (e.g., Ormerod & Duckworth, 1975;
Freedman, 1997; Kind et al., 2007; Osborne et al., 2003; Papanastasiou & Papanastasiou,
2004; Woolnough, 1994b; Woolnough et al., 1997). Students with low self-rated attitudes
towards science—including one’s perception of science teachers, anxiety toward science, the
importance of science, self-esteem in science, motivation towards science, one’s enjoyment of
science, and the nature of the science classroom environment—are likely to have lower
performance in science and lower interest in science-related majors.
In this regard, the declining trend of Cambodian upper secondary school students’ interest in
science might be explained by the lower attitudes towards science. The students tended to
have a low to moderate level for the constructs of attitudes towards science. The most
alarming trend entailed science and mathematics self-concepts and the extracurricular
activities in science. This finding was consistent with the results of Kao (2019a), who showed
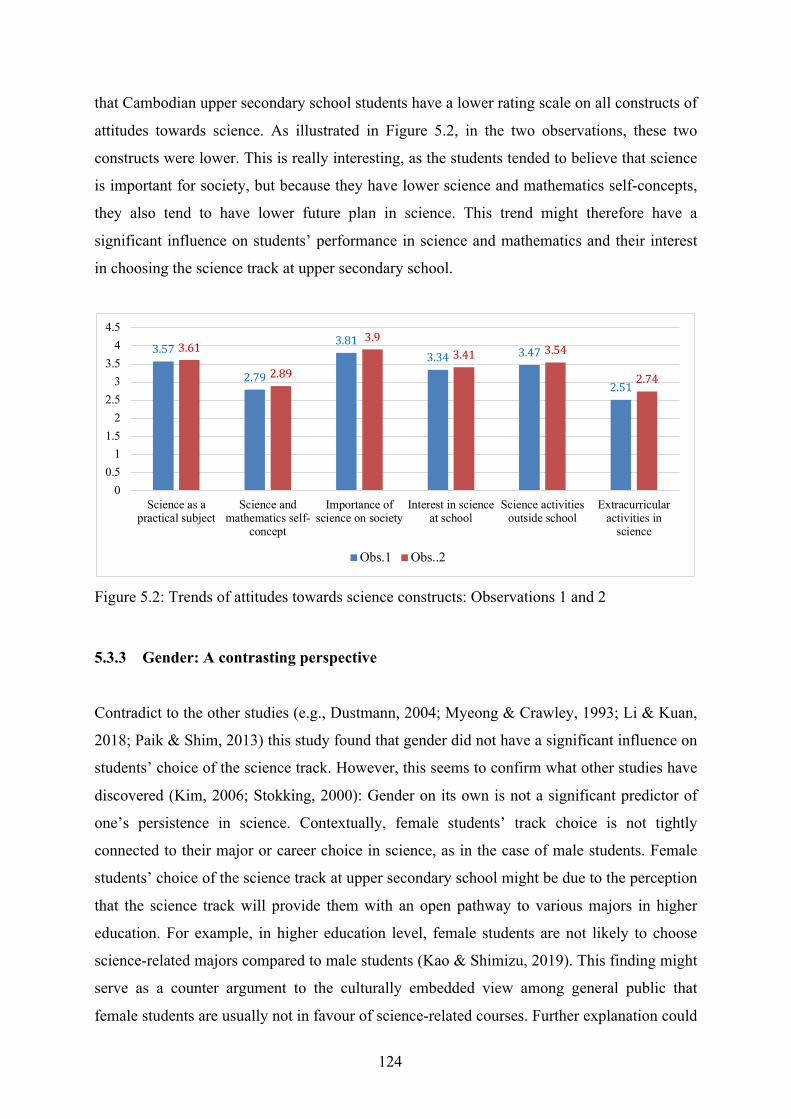
124
that Cambodian upper secondary school students have a lower rating scale on all constructs of
attitudes towards science. As illustrated in Figure 5.2, in the two observations, these two
constructs were lower. This is really interesting, as the students tended to believe that science
is important for society, but because they have lower science and mathematics self-concepts,
they also tend to have lower future plan in science. This trend might therefore have a
significant influence on students’ performance in science and mathematics and their interest
in choosing the science track at upper secondary school.
Figure 5.2: Trends of attitudes towards science constructs: Observations 1 and 2
5.3.3 Gender: A contrasting perspective
Contradict to the other studies (e.g., Dustmann, 2004; Myeong & Crawley, 1993; Li & Kuan,
2018; Paik & Shim, 2013) this study found that gender did not have a significant influence on
students’ choice of the science track. However, this seems to confirm what other studies have
discovered (Kim, 2006; Stokking, 2000): Gender on its own is not a significant predictor of
one’s persistence in science. Contextually, female students’ track choice is not tightly
connected to their major or career choice in science, as in the case of male students. Female
students’ choice of the science track at upper secondary school might be due to the perception
that the science track will provide them with an open pathway to various majors in higher
education. For example, in higher education level, female students are not likely to choose
science-related majors compared to male students (Kao & Shimizu, 2019). This finding might
serve as a counter argument to the culturally embedded view among general public that
female students are usually not in favour of science-related courses. Further explanation could
3.57
2.79
3.813.34 3.47
2.51
3.61
2.89
3.93.41 3.54
2.74
0
0.5
1
1.5
2
2.5
3
3.5
4
4.5
Science as apractical subject
Science andmathematics self-
concept
Importance ofscience on society
Interest in scienceat school
Science activitiesoutside school
Extracurricularactivities in
science
Obs.1 Obs..2
125
be supported by the qualitative finding that all of the 16 females participated in the interviews
mentioned that gender stereotypes are not involved in choosing the science track at upper
secondary school. Two students stated “Mostly only female students are in the science track.
Male students seemed to be lazy; they enjoy going out, so they switch to the social science”.
In short, it could be concluded that students’ gender does not play a considerable role in the
students’ choice of the science or social science track at upper secondary school.
5.3.4 The crucial role of the family environment
Although subject choice could be due to individual preferences, family background and
encouragement, as well as school experiences, support, and the environment are contributing
indispensable influences in students’ choice of the science track. Family encouragement and
support had the most influential effect. An increase in this variable increases the odds of
students choosing the science track at upper secondary school by 1.61 times, (Exp(B)=1.61).
Consistent with prior studies (e.g., Ekmekci et al., 2019; Shimpkins et al., 2015; Shin et al.,
2015), current study found that the family environment tended to be a significant untapped
resource of support for students. For example, parents’ provision of enriching experiences at
home (such as playing mathematics games, hobbies, science activities, and encouragement to
take science classes and complete science homework) is central to students’ interest in
science, knowledge, and skills. Family encouragement and support propels students’
persistence in science since this variable is related to the quality of the family interactions,
which are intrinsically focused on or emphasized mastery goals. This effect might be due to
what Ekmekci (2019) highlighted as the Pygmalion factors, which refers to an improvement
in a person’s performance when someone close to him/her expects him/her to perform well or
to achieve more in something. Thus, students feel motivated and secured when they receive
encouragement and support from their families. Contextually, as some students in science
class need to take a lot of private classes, they need to have a good balance of not only
financial resources, but also time allowed to study at home. Hence, family encouragement and
support in science plays an indispensable role in motivating students to perform well in
science and mathematics and inspiring their interest in the science track.
Most notably, the mother’s education level contributed significantly to the odds of students
choosing the science track (Exp(B)=1.07) at upper secondary school. The study positioned on
what has been debated that when an important issue such as students’ track choice is of
126
concern, parents’ last minutes persuasion tended to override students’ prior intentions.
Consistent with the findings by previous research (e.g., Dustmann, 2004; Kinyota, 2013;
Miller & Kimmel, 2012; Shin et al., 2017), current study also posited that aspects of family
background, especially educated mothers, would lead to a higher level of encouragement
towards children to enrol in the science track, versus a family with a mother that has less
education. This result is in line with the work of Arslan (2016), Kwak (1993), and Paik and
Shim (2013) who revealed that the mother’s education level is more effective than the father’s
education level in terms of students choosing science. The in-depth analysis of the data also
revealed that, in addition to encouragement and support from one’s parents, the female
students tended to have higher encouragement and support from their parents (M=3.37,
SD=.064) than male students (M=3.34, SD=.708). In the Cambodian context, there might be a
few anecdotes to explain this phenomenon. First, Cambodian children traditionally tend to
have closer connections with their mothers than their fathers. Also, when mothers have higher
education level, they might not only have more financial and academic resources to support
their children, but also value science more and be aware of current labour market demands.
Consequently, when their children discussed their educational choices, these mothers will be
more likely to persuade their children to choose science. This might especially be unique in
Asian culture, where family influence still matters a lot in students’ educational choice. Thus,
choosing the science track still recount on the effects of encouragement and support from one’s
family, especially when the mother has a higher level of education.
5.3.5 Geographical area
From the standpoint of school experiences and a supportive environment, the study indicated
that students from upper secondary schools in Phnom Penh (urban) were more likely to
choose the science track than students from schools in the other (rural) provinces. Put in
statistical terms, a one-unit increase of the students in Phnom Penh upper secondary school
leads to an increase of 1.93 in students choosing the science track (Exp(B)=1.93). This
finding was consistent with Woolnough (1994a), who claimed that, due to some
disadvantages, students from the rural areas have less interest in science than those from the
urban areas. More significantly, the data also revealed that students in upper secondary school
in the (rural) provinces have lower performance in science subjects (M=2.23, SD=.03)
compares to (M=2.43, SD=.04) students in Phnom Penh (t=-3.03; p<0.01). In contrast,
performance in social subjects was higher (M=3.00, SD=.04) for students in the (rural)
127
provinces than (M=2.97, SD=.04) for students in Phnom Penh. This supports one of the
current study results whereby students who scored high in science and mathematics tended to
choose the science track at higher odds than their counterparts. The diverse characteristics of
the upper secondary schools in urban and the rural zones regarding the quality of the teachers,
the availability of teaching resources, and school culture might also contribute to this
phenomenon (Eng & Szmodis, 2015; Woolnough, 1994b). Some Cambodian upper secondary
schools might still be at disadvantage in accessing enough qualified teachers and teaching
resources (CDRI, 2015); this will be a burden for rural counterparts. Further, although
students in the non-urban areas seemed to rate higher on attitudes towards science than those
from urban areas (Kao, 2019a), academic performance (especially in science and
mathematics) might have more of an impact on their decision to take the science or social
science track at upper secondary school. As students in Phnom Penh performed higher in
science and mathematics than those from the provinces, about 87% of the students in Phnom
Penh chose the science track compared to that of 81% and 77% in Battambang and Kampong
Cham, respectively (MoEYS, 2019c).
5.4 Concluding remarks
The current study could lead us to draw the following conclusions. First, students’
performance in science subjects, attitudes towards science (the practicality of science subjects
[facts and fun] and self-interest in science at school), and future plan to major in STEM
influenced students toward choosing the science track. In the same vein, adding to the battery
of knowledge on students’ choice of the science track, their engagement in their academic
pursuits by spending more time self-studying at home (particularly chemistry and
mathematics) signified their likelihood of choosing the science track. Second, reflecting the
cultural influence from one’s family on students’ choice, family encouragement and support,
(which might be a unique cultural influence in Asian families, especially ones with higher
educated mothers) contributed to the variance that explains students’ choice of the science
track. Third, students who were studying in upper secondary school in Phnom Penh choose
the science track more than their rural counterparts. In sum, the results contributed to the
knowledge that the worrisome declining trend of students in the science track is due not only
to individual academic ability and attitudinal variables, but also to cultural influence from
one’s family and the conditions of upper secondary schools.
128
CHAPTER SIX: TRENDS AND PATTERNS OF TIME-VARYING COVARIATES:
FINDING II
To investigate the effects of different tracks at upper secondary school on Cambodian
students’ aspirations of STEM majors in higher education, it is crucial to understand the
trends and patterns of the time-varying covariates of the students who chose different tracks
for one academic year. The purpose of this chapter is thus to investigate the trends and
patterns of the time-varying covariates across one academic year. This chapter begins by
reviewing the method (including the samples and data analysis procedure), followed by the
results of the trends and patterns of the covariates in Observation 1, and those of Observation
2. The chapter proceeds with the trends and patterns of the covariates across the two
observations, so as to determine if there was any significant change from observations 1 to 2
as well as significant changes in the time-varying covariates across the two observations as a
function of gender, school location, and study track. The discussion and conclusion
responding to Research Question 2 serve as the closure of the current chapter.
In this chapter, the researcher addressed the following research question as follow.
RQ 2: What are the trends and patterns of the time-varying covariates for students who
attended in different tracks at upper secondary school for one academic year?
6.1 Method for RQ 2
6.1.1 Samples
Since the purpose of the second study was to scrutinize the trends and patterns of time-
varying covariates, the data from the first and second waves were used in the analysis. While
the first wave was conducted with early grade 11th students, the second wave was conducted
with late grade 11th students. Although there were 752 students in the first wave, because
some students dropped out of school and some moved to the other schools, the retention rate
for the second wave was 93.09. Therefore, only 700 students participated in the second wave.
To respond to the purpose of the current study, the researcher only used the data from the 700
respondents who participated in both the first and second waves in the data analysis to answer
Research Question 2.
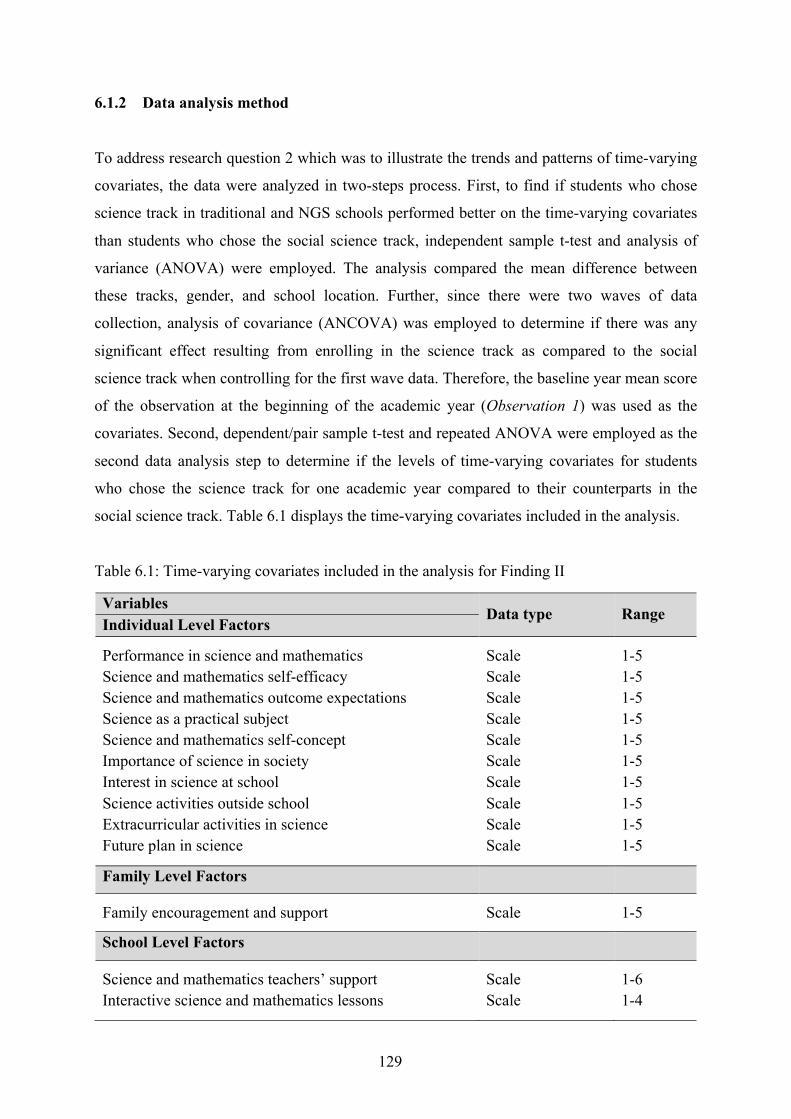
129
6.1.2 Data analysis method
To address research question 2 which was to illustrate the trends and patterns of time-varying
covariates, the data were analyzed in two-steps process. First, to find if students who chose
science track in traditional and NGS schools performed better on the time-varying covariates
than students who chose the social science track, independent sample t-test and analysis of
variance (ANOVA) were employed. The analysis compared the mean difference between
these tracks, gender, and school location. Further, since there were two waves of data
collection, analysis of covariance (ANCOVA) was employed to determine if there was any
significant effect resulting from enrolling in the science track as compared to the social
science track when controlling for the first wave data. Therefore, the baseline year mean score
of the observation at the beginning of the academic year (Observation 1) was used as the
covariates. Second, dependent/pair sample t-test and repeated ANOVA were employed as the
second data analysis step to determine if the levels of time-varying covariates for students
who chose the science track for one academic year compared to their counterparts in the
social science track. Table 6.1 displays the time-varying covariates included in the analysis.
Table 6.1: Time-varying covariates included in the analysis for Finding II
Variables Data type Range
Individual Level Factors
Performance in science and mathematics
Scale
1-5 Science and mathematics self-efficacy Scale 1-5 Science and mathematics outcome expectations Scale 1-5 Science as a practical subject Scale 1-5 Science and mathematics self-concept Scale 1-5 Importance of science in society Scale 1-5 Interest in science at school Scale 1-5 Science activities outside school Scale 1-5 Extracurricular activities in science Scale 1-5 Future plan in science Scale 1-5
Family Level Factors
Family encouragement and support Scale 1-5
School Level Factors
Science and mathematics teachers’ support Scale 1-6 Interactive science and mathematics lessons Scale 1-4
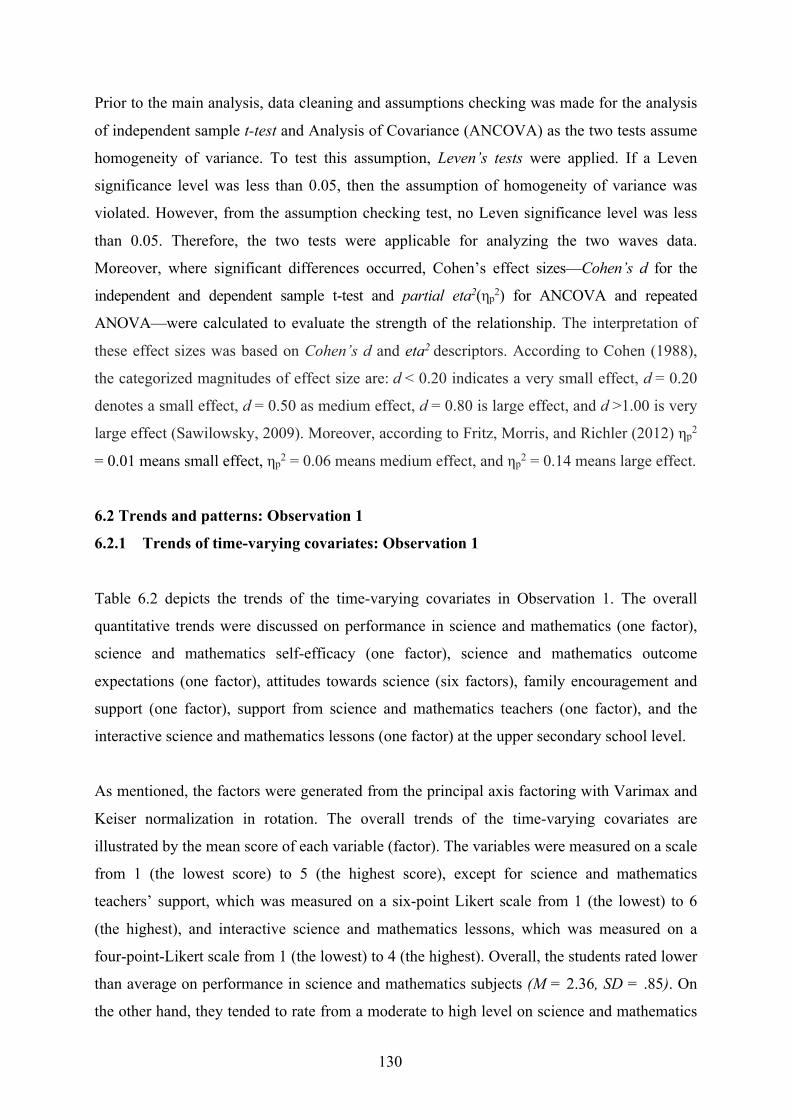
130
Prior to the main analysis, data cleaning and assumptions checking was made for the analysis
of independent sample t-test and Analysis of Covariance (ANCOVA) as the two tests assume
homogeneity of variance. To test this assumption, Leven’s tests were applied. If a Leven
significance level was less than 0.05, then the assumption of homogeneity of variance was
violated. However, from the assumption checking test, no Leven significance level was less
than 0.05. Therefore, the two tests were applicable for analyzing the two waves data.
Moreover, where significant differences occurred, Cohen’s effect sizes—Cohen’s d for the
independent and dependent sample t-test and partial eta2(ηp2) for ANCOVA and repeated
ANOVA—were calculated to evaluate the strength of the relationship. The interpretation of
these effect sizes was based on Cohen’s d and eta2 descriptors. According to Cohen (1988),
the categorized magnitudes of effect size are: d < 0.20 indicates a very small effect, d = 0.20
denotes a small effect, d = 0.50 as medium effect, d = 0.80 is large effect, and d >1.00 is very
large effect (Sawilowsky, 2009). Moreover, according to Fritz, Morris, and Richler (2012) ηp2
= 0.01 means small effect, ηp2 = 0.06 means medium effect, and ηp2 = 0.14 means large effect.
6.2 Trends and patterns: Observation 1
6.2.1 Trends of time-varying covariates: Observation 1
Table 6.2 depicts the trends of the time-varying covariates in Observation 1. The overall
quantitative trends were discussed on performance in science and mathematics (one factor),
science and mathematics self-efficacy (one factor), science and mathematics outcome
expectations (one factor), attitudes towards science (six factors), family encouragement and
support (one factor), support from science and mathematics teachers (one factor), and the
interactive science and mathematics lessons (one factor) at the upper secondary school level.
As mentioned, the factors were generated from the principal axis factoring with Varimax and
Keiser normalization in rotation. The overall trends of the time-varying covariates are
illustrated by the mean score of each variable (factor). The variables were measured on a scale
from 1 (the lowest score) to 5 (the highest score), except for science and mathematics
teachers’ support, which was measured on a six-point Likert scale from 1 (the lowest) to 6
(the highest), and interactive science and mathematics lessons, which was measured on a
four-point-Likert scale from 1 (the lowest) to 4 (the highest). Overall, the students rated lower
than average on performance in science and mathematics subjects (M = 2.36, SD = .85). On
the other hand, they tended to rate from a moderate to high level on science and mathematics
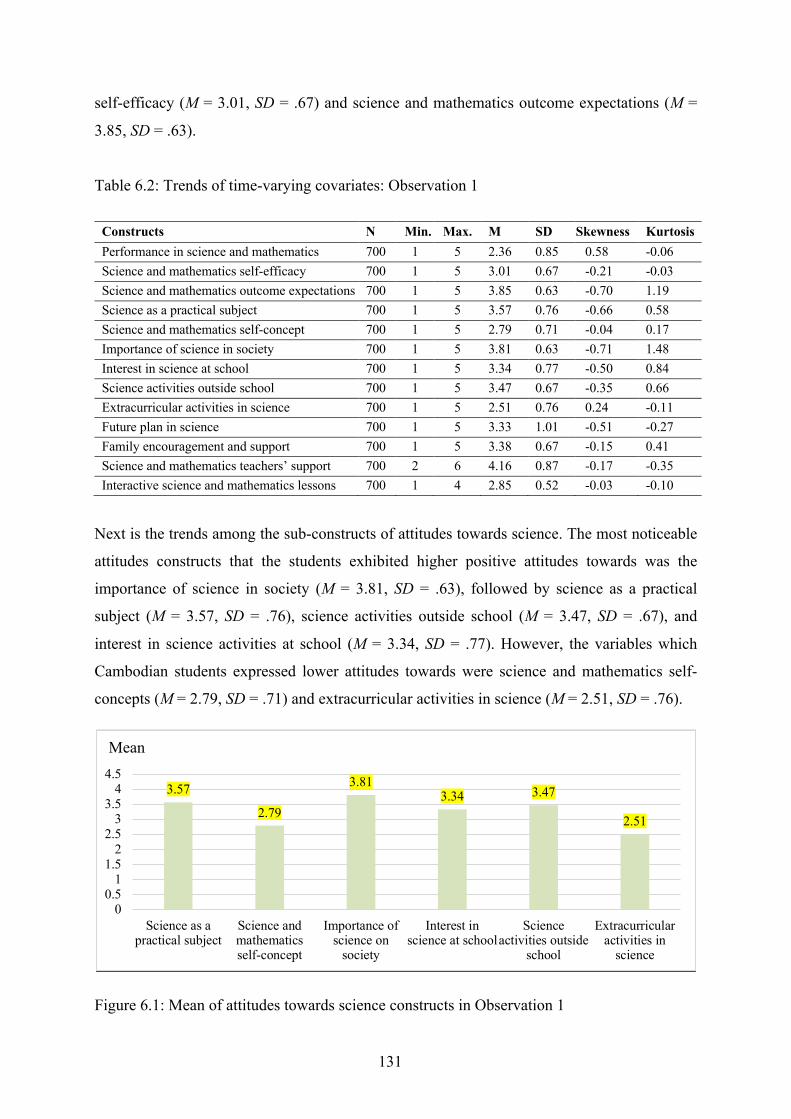
131
self-efficacy (M = 3.01, SD = .67) and science and mathematics outcome expectations (M =
3.85, SD = .63).
Table 6.2: Trends of time-varying covariates: Observation 1
Constructs N Min. Max. M SD Skewness Kurtosis Performance in science and mathematics 700 1 5 2.36 0.85 0.58 -0.06 Science and mathematics self-efficacy 700 1 5 3.01 0.67 -0.21 -0.03 Science and mathematics outcome expectations 700 1 5 3.85 0.63 -0.70 1.19 Science as a practical subject 700 1 5 3.57 0.76 -0.66 0.58 Science and mathematics self-concept 700 1 5 2.79 0.71 -0.04 0.17 Importance of science in society 700 1 5 3.81 0.63 -0.71 1.48 Interest in science at school 700 1 5 3.34 0.77 -0.50 0.84 Science activities outside school 700 1 5 3.47 0.67 -0.35 0.66 Extracurricular activities in science 700 1 5 2.51 0.76 0.24 -0.11 Future plan in science 700 1 5 3.33 1.01 -0.51 -0.27 Family encouragement and support 700 1 5 3.38 0.67 -0.15 0.41 Science and mathematics teachers’ support 700 2 6 4.16 0.87 -0.17 -0.35 Interactive science and mathematics lessons 700 1 4 2.85 0.52 -0.03 -0.10
Next is the trends among the sub-constructs of attitudes towards science. The most noticeable
attitudes constructs that the students exhibited higher positive attitudes towards was the
importance of science in society (M = 3.81, SD = .63), followed by science as a practical
subject (M = 3.57, SD = .76), science activities outside school (M = 3.47, SD = .67), and
interest in science activities at school (M = 3.34, SD = .77). However, the variables which
Cambodian students expressed lower attitudes towards were science and mathematics self-
concepts (M = 2.79, SD = .71) and extracurricular activities in science (M = 2.51, SD = .76).
Figure 6.1: Mean of attitudes towards science constructs in Observation 1
3.57
2.79
3.813.34 3.47
2.51
00.5
11.5
22.5
33.5
44.5
Science as apractical subject
Science andmathematicsself-concept
Importance ofscience on
society
Interest inscience at school
Scienceactivities outside
school
Extracurricularactivities in
science
Mean
132
The trends of Cambodian students’ attitudes towards science were interesting, as expected.
While most students tended to believe that science plays a crucial role in society and that they
are more likely to be interested in the practical work of science and science activities outside
school, they seemed to have a lower self-concept in science and science learning which, as a
result, influenced their extracurricular activities in science. (See Figure 6.1).
Last, it is significant to note that the students rate at a moderate level for future plan in science
(M = 3.33, SD = 1.01), encouragement and support from their families (M = 3.38, SD = .67),
science and mathematics teachers’ support (M = 4.16, SD = .87), and interactive science and
mathematics lessons (M = 2.85, SD = .52). Of the time-varying covariates, the students
seemed to rate science and mathematics outcome expectations, science as a practical subject,
and the importance of science in society at high level. However, they tended to rate science
self-efficacy, science and mathematics self-concepts, interest in science at school, science
activities outside school, extracurricular activities in science, future plan in science, support
from one’s family and science and mathematics teacher, and interactive science and mathematics
lessons at a moderate level, and performance in science and mathematics at a low level.
6.2.2 Patterns of time-varying covariates: Observation 1
This section explains whether the previously discussed time-varying covariates measured in
Observation 1, were differentiated by the three demographic attributes of gender, school
location, and study track.
6.2.2.1 Patterns across gender
Table 6.3 illustrates the patterns of time-varying covariates in observation 1 across gender
differences. Overall, for Observation 1, it is surprising to note that male students had a lower
mean score than female students for most of the constructs, except for science and
mathematics self-concepts, importance of science in society, science activities outside school,
and extracurricular activities in science. The independent sample t-test revealed that although
female students exhibited a higher mean score than their male peers in Observation 1, the
differences were not statistically significant. In sum, male and female students tended to have
a slightly equal level of science and mathematics performance, science and mathematics self-
efficacy, science and mathematics outcome expectations, attitudes towards science, family
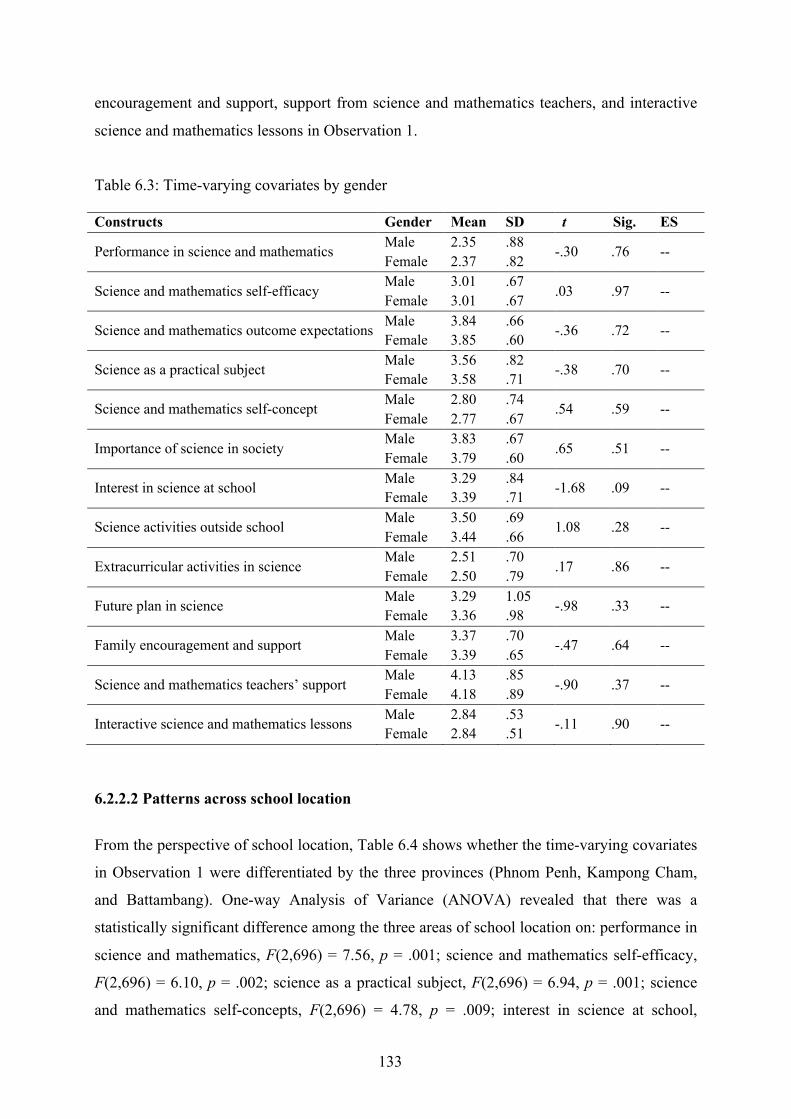
133
encouragement and support, support from science and mathematics teachers, and interactive
science and mathematics lessons in Observation 1.
Table 6.3: Time-varying covariates by gender Constructs Gender Mean SD t Sig. ES
Performance in science and mathematics Male Female
2.35 2.37
.88
.82 -.30 .76 --
Science and mathematics self-efficacy Male Female
3.01 3.01
.67
.67 .03 .97 --
Science and mathematics outcome expectations Male Female
3.84 3.85
.66
.60 -.36 .72 --
Science as a practical subject Male Female
3.56 3.58
.82
.71 -.38 .70 --
Science and mathematics self-concept Male Female
2.80 2.77
.74
.67 .54 .59 --
Importance of science in society Male Female
3.83 3.79
.67
.60 .65 .51 --
Interest in science at school Male Female
3.29 3.39
.84
.71 -1.68 .09 --
Science activities outside school Male Female
3.50 3.44
.69
.66 1.08 .28 --
Extracurricular activities in science Male Female
2.51 2.50
.70
.79 .17 .86 --
Future plan in science Male Female
3.29 3.36
1.05 .98 -.98 .33 --
Family encouragement and support Male Female
3.37 3.39
.70
.65 -.47 .64 --
Science and mathematics teachers’ support Male Female
4.13 4.18
.85
.89 -.90 .37 --
Interactive science and mathematics lessons Male Female
2.84 2.84
.53
.51 -.11 .90 --
6.2.2.2 Patterns across school location
From the perspective of school location, Table 6.4 shows whether the time-varying covariates
in Observation 1 were differentiated by the three provinces (Phnom Penh, Kampong Cham,
and Battambang). One-way Analysis of Variance (ANOVA) revealed that there was a
statistically significant difference among the three areas of school location on: performance in
science and mathematics, F(2,696) = 7.56, p = .001; science and mathematics self-efficacy,
F(2,696) = 6.10, p = .002; science as a practical subject, F(2,696) = 6.94, p = .001; science
and mathematics self-concepts, F(2,696) = 4.78, p = .009; interest in science at school,
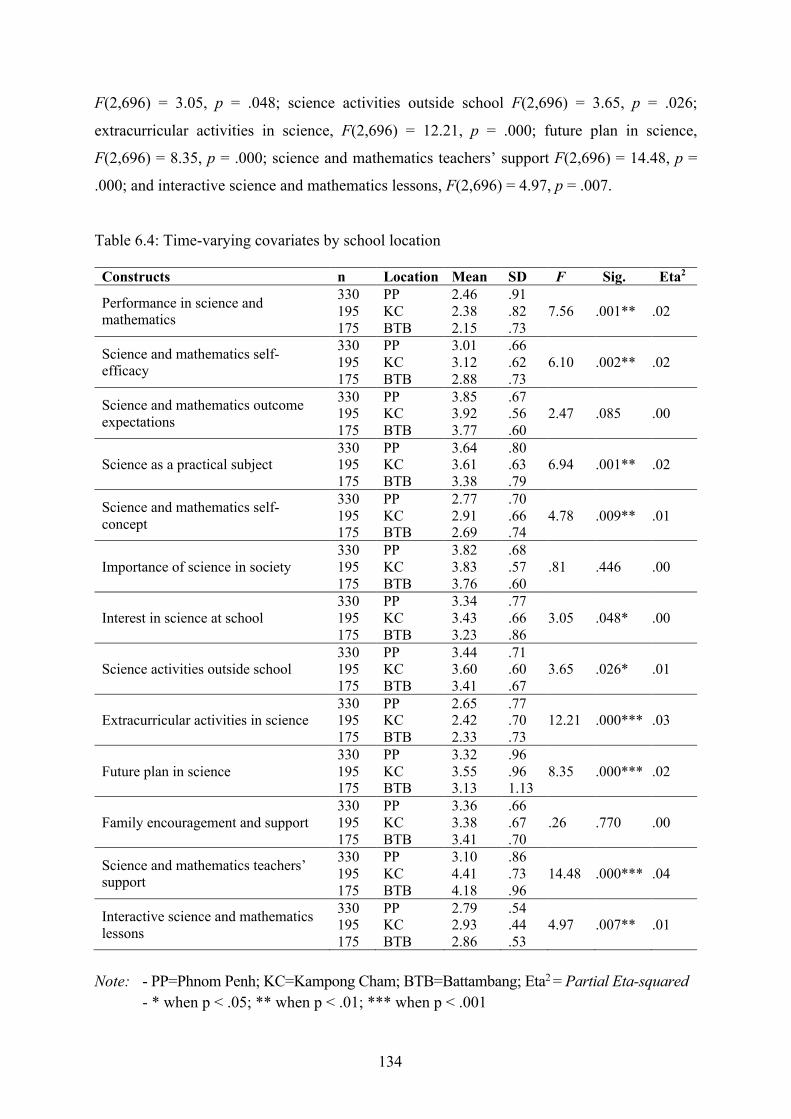
134
F(2,696) = 3.05, p = .048; science activities outside school F(2,696) = 3.65, p = .026;
extracurricular activities in science, F(2,696) = 12.21, p = .000; future plan in science,
F(2,696) = 8.35, p = .000; science and mathematics teachers’ support F(2,696) = 14.48, p =
.000; and interactive science and mathematics lessons, F(2,696) = 4.97, p = .007.
Table 6.4: Time-varying covariates by school location
Constructs n Location Mean SD F Sig. Eta2
Performance in science and mathematics
330 195 175
PP KC BTB
2.46 2.38 2.15
.91
.82
.73 7.56 .001** .02
Science and mathematics self-efficacy
330 195 175
PP KC BTB
3.01 3.12 2.88
.66
.62
.73 6.10 .002** .02
Science and mathematics outcome expectations
330 195 175
PP KC BTB
3.85 3.92 3.77
.67
.56
.60 2.47 .085 .00
Science as a practical subject 330 195 175
PP KC BTB
3.64 3.61 3.38
.80
.63
.79 6.94 .001** .02
Science and mathematics self-concept
330 195 175
PP KC BTB
2.77 2.91 2.69
.70
.66
.74 4.78 .009** .01
Importance of science in society 330 195 175
PP KC BTB
3.82 3.83 3.76
.68
.57
.60 .81 .446 .00
Interest in science at school 330 195 175
PP KC BTB
3.34 3.43 3.23
.77
.66
.86 3.05 .048* .00
Science activities outside school 330 195 175
PP KC BTB
3.44 3.60 3.41
.71
.60
.67 3.65 .026* .01
Extracurricular activities in science 330 195 175
PP KC BTB
2.65 2.42 2.33
.77
.70
.73 12.21 .000*** .03
Future plan in science 330 195 175
PP KC BTB
3.32 3.55 3.13
.96
.96 1.13
8.35 .000*** .02
Family encouragement and support 330 195 175
PP KC BTB
3.36 3.38 3.41
.66
.67
.70 .26 .770 .00
Science and mathematics teachers’ support
330 195 175
PP KC BTB
3.10 4.41 4.18
.86
.73
.96 14.48 .000*** .04
Interactive science and mathematics lessons
330 195 175
PP KC BTB
2.79 2.93 2.86
.54
.44
.53 4.97 .007** .01
Note: - PP=Phnom Penh; KC=Kampong Cham; BTB=Battambang; Eta2 = Partial Eta-squared
- * when p < .05; ** when p < .01; *** when p < .001
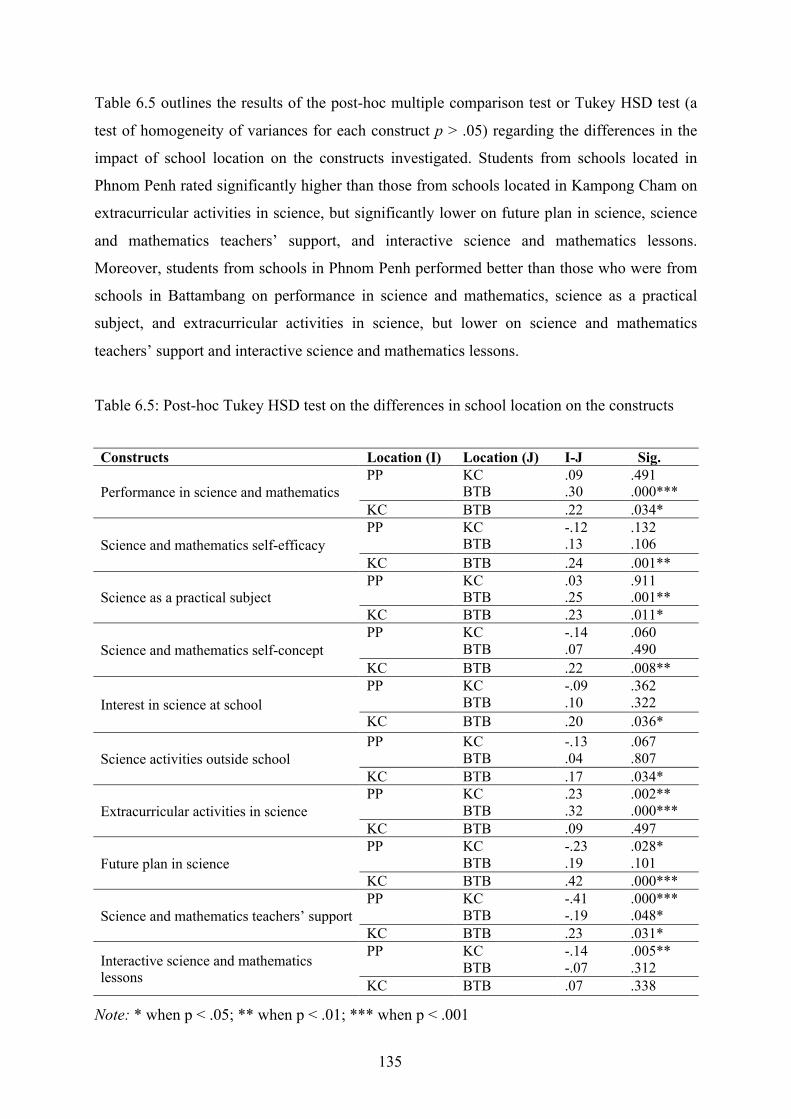
135
Table 6.5 outlines the results of the post-hoc multiple comparison test or Tukey HSD test (a
test of homogeneity of variances for each construct p > .05) regarding the differences in the
impact of school location on the constructs investigated. Students from schools located in
Phnom Penh rated significantly higher than those from schools located in Kampong Cham on
extracurricular activities in science, but significantly lower on future plan in science, science
and mathematics teachers’ support, and interactive science and mathematics lessons.
Moreover, students from schools in Phnom Penh performed better than those who were from
schools in Battambang on performance in science and mathematics, science as a practical
subject, and extracurricular activities in science, but lower on science and mathematics
teachers’ support and interactive science and mathematics lessons.
Table 6.5: Post-hoc Tukey HSD test on the differences in school location on the constructs Constructs Location (I) Location (J) I-J Sig.
Performance in science and mathematics PP
KC BTB
.09
.30 .491 .000***
KC BTB .22 .034*
Science and mathematics self-efficacy PP
KC BTB
-.12 .13
.132
.106 KC BTB .24 .001**
Science as a practical subject PP
KC BTB
.03
.25 .911 .001**
KC BTB .23 .011*
Science and mathematics self-concept PP
KC BTB
-.14 .07
.060
.490 KC BTB .22 .008**
Interest in science at school PP
KC BTB
-.09 .10
.362
.322 KC BTB .20 .036*
Science activities outside school PP
KC BTB
-.13 .04
.067
.807 KC BTB .17 .034*
Extracurricular activities in science PP
KC BTB
.23
.32 .002** .000***
KC BTB .09 .497
Future plan in science PP
KC BTB
-.23 .19
.028*
.101 KC BTB .42 .000***
Science and mathematics teachers’ support PP
KC BTB
-.41 -.19
.000***
.048* KC BTB .23 .031*
Interactive science and mathematics lessons
PP
KC BTB
-.14 -.07
.005**
.312 KC BTB .07 .338
Note: * when p < .05; ** when p < .01; *** when p < .001
136
Lastly, the sampled schools in Kampong Cham performed higher than schools in Battambang
on science and mathematics, science and mathematics self-efficacy, science as a practical
subject, science and mathematics self-concepts, interest in science at school, science activities
outside school, future plan in science, and science and mathematics teachers’ support.
6.2.2.3 Patterns across study tracks
Academically, inquiry into how different groups of students exhibited their science and
mathematics performance, science self-efficacy, attitudes towards science, family and science
and mathematics teachers’ support, and science learning experiences was also made with
reference to their study tracks at upper secondary school. As mentioned earlier, starting in
academic year 2010, MoEYS introduced the tracking system, requesting all grade 10th
students to choose either the science or the social science track for the 11th and 12th grades.
Also, just as recently, another type of school, NGS (which only offers science track classes)
were opened. More interestingly, the science track in NGS was streamed into the focused
classes of mathematics, physics, biology, and chemistry so as to build students’ competence
in STEM majors.
Table 6.6 indicates the effects of choosing different tracks at upper secondary school on the
time-varying covariates in Observation 1. As could be seen, in all instances, the level of the
constructs was differentiated by the three types of tracks the students attended. Overall,
students in the science track at NGS performed higher than those in the science track and the
social science track in traditional schools. To be precise, students from NGS showed a
significant difference between students from the science track and the social science track
regarding their performance in science and mathematics, science and mathematics self-
efficacy, science and mathematics outcome expectations, all sub-constructs of attitudes
towards science, future plan in science, family supports and encouragement, science and
mathematics teachers’ support, and interactive science and mathematics lessons, with p <.001
and the effect size of the Partial Eta-squared ranging from .04 to .30. Of the investigated
constructs, the strongest significant effects emphasized performance in science and
mathematics, science as a practical subject, and science and mathematics self-efficacy. The
constructs that revealed weaker effects were support from science and mathematics teachers,
interactive science and mathematics lessons, and science and mathematics outcome
expectations, and the importance of science in society.
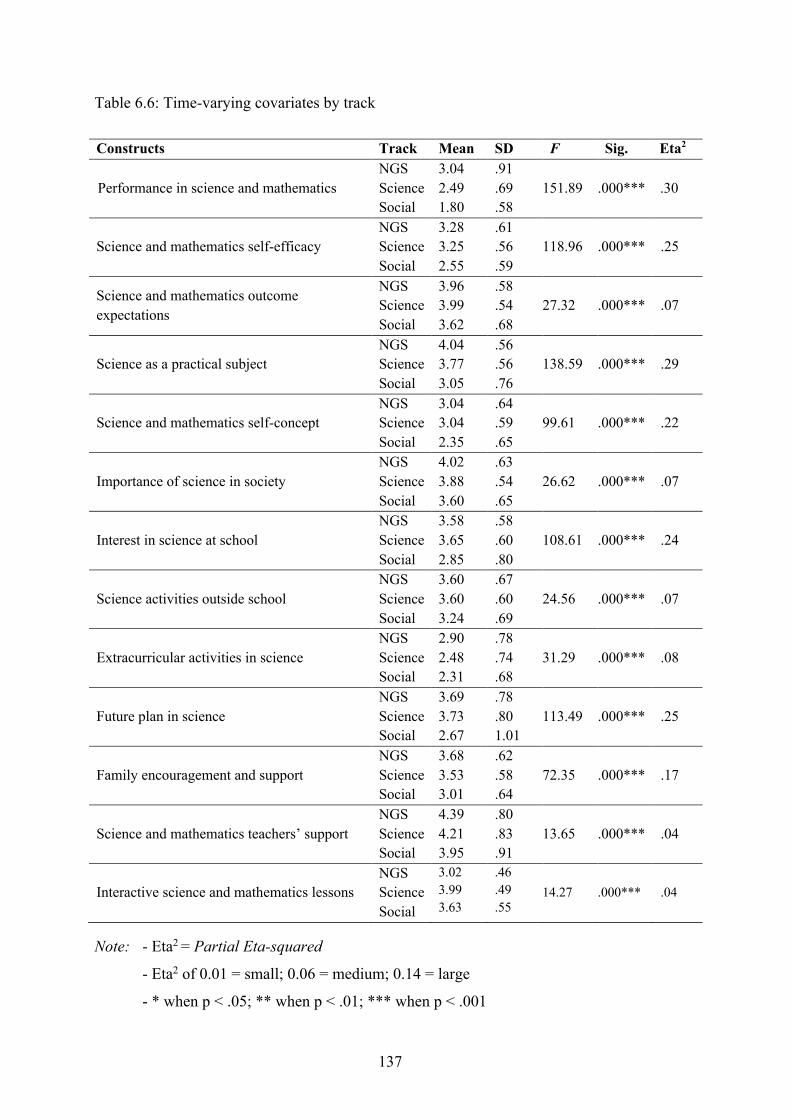
137
Table 6.6: Time-varying covariates by track
Constructs Track Mean SD F Sig. Eta2
Performance in science and mathematics NGS Science Social
3.04 2.49 1.80
.91
.69
.58 151.89 .000*** .30
Science and mathematics self-efficacy NGS Science Social
3.28 3.25 2.55
.61
.56
.59 118.96 .000*** .25
Science and mathematics outcome expectations
NGS Science Social
3.96 3.99 3.62
.58
.54
.68 27.32 .000*** .07
Science as a practical subject NGS Science Social
4.04 3.77 3.05
.56
.56
.76 138.59 .000*** .29
Science and mathematics self-concept NGS Science Social
3.04 3.04 2.35
.64
.59
.65 99.61 .000*** .22
Importance of science in society NGS Science Social
4.02 3.88 3.60
.63
.54
.65 26.62 .000*** .07
Interest in science at school NGS Science Social
3.58 3.65 2.85
.58
.60
.80 108.61 .000*** .24
Science activities outside school NGS Science Social
3.60 3.60 3.24
.67
.60
.69 24.56 .000*** .07
Extracurricular activities in science NGS Science Social
2.90 2.48 2.31
.78
.74
.68 31.29 .000*** .08
Future plan in science NGS Science Social
3.69 3.73 2.67
.78
.80 1.01
113.49 .000*** .25
Family encouragement and support NGS Science Social
3.68 3.53 3.01
.62
.58
.64 72.35 .000*** .17
Science and mathematics teachers’ support NGS Science Social
4.39 4.21 3.95
.80
.83
.91 13.65 .000*** .04
Interactive science and mathematics lessons NGS Science Social
3.02 3.99 3.63
.46
.49
.55 14.27 .000*** .04
Note: - Eta2 = Partial Eta-squared
- Eta2 of 0.01 = small; 0.06 = medium; 0.14 = large
- * when p < .05; ** when p < .01; *** when p < .001
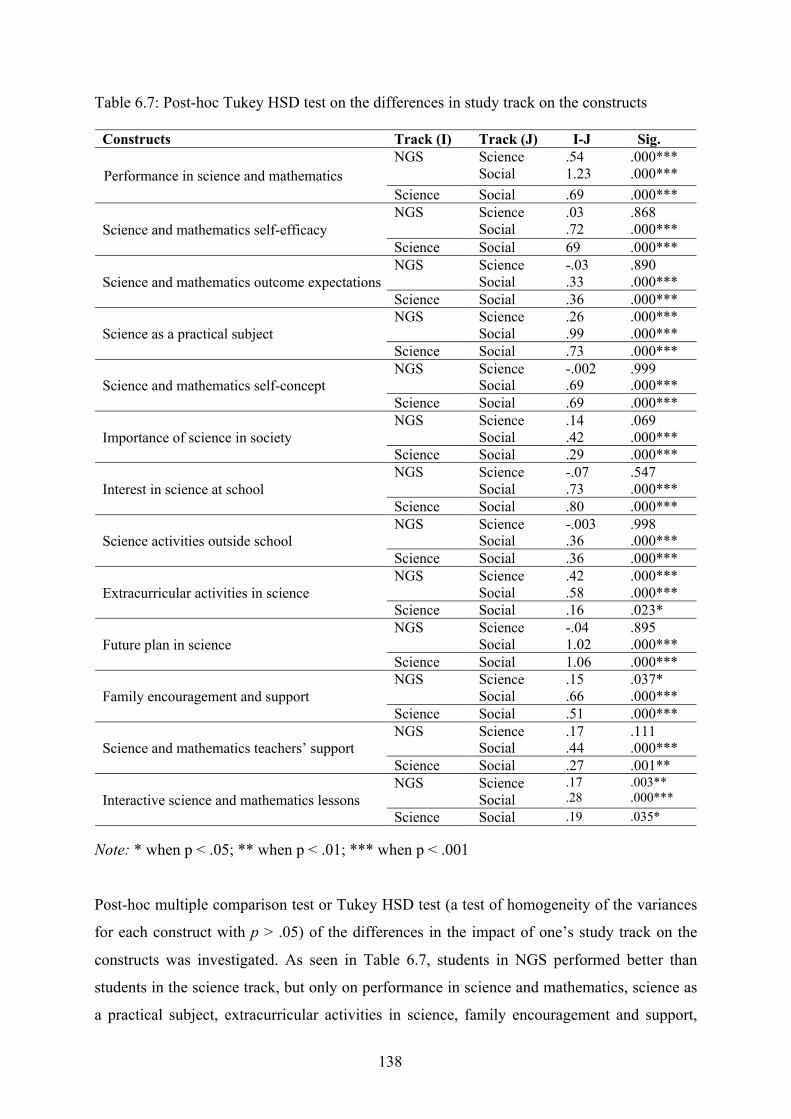
138
Table 6.7: Post-hoc Tukey HSD test on the differences in study track on the constructs
Constructs Track (I) Track (J) I-J Sig.
Performance in science and mathematics NGS
Science Social
.54 1.23
.000***
.000*** Science Social .69 .000***
Science and mathematics self-efficacy NGS
Science Social
.03
.72 .868 .000***
Science Social 69 .000***
Science and mathematics outcome expectations NGS
Science Social
-.03 .33
.890
.000*** Science Social .36 .000***
Science as a practical subject NGS
Science Social
.26
.99 .000*** .000***
Science Social .73 .000***
Science and mathematics self-concept NGS
Science Social
-.002 .69
.999
.000*** Science Social .69 .000***
Importance of science in society NGS
Science Social
.14
.42 .069 .000***
Science Social .29 .000***
Interest in science at school NGS
Science Social
-.07 .73
.547
.000*** Science Social .80 .000***
Science activities outside school NGS
Science Social
-.003 .36
.998
.000*** Science Social .36 .000***
Extracurricular activities in science NGS
Science Social
.42
.58 .000*** .000***
Science Social .16 .023*
Future plan in science NGS
Science Social
-.04 1.02
.895
.000*** Science Social 1.06 .000***
Family encouragement and support NGS
Science Social
.15
.66 .037* .000***
Science Social .51 .000***
Science and mathematics teachers’ support NGS
Science Social
.17
.44 .111 .000***
Science Social .27 .001**
Interactive science and mathematics lessons NGS
Science Social
.17
.28 .003** .000***
Science Social .19 .035*
Note: * when p < .05; ** when p < .01; *** when p < .001
Post-hoc multiple comparison test or Tukey HSD test (a test of homogeneity of the variances
for each construct with p > .05) of the differences in the impact of one’s study track on the
constructs was investigated. As seen in Table 6.7, students in NGS performed better than
students in the science track, but only on performance in science and mathematics, science as
a practical subject, extracurricular activities in science, family encouragement and support,
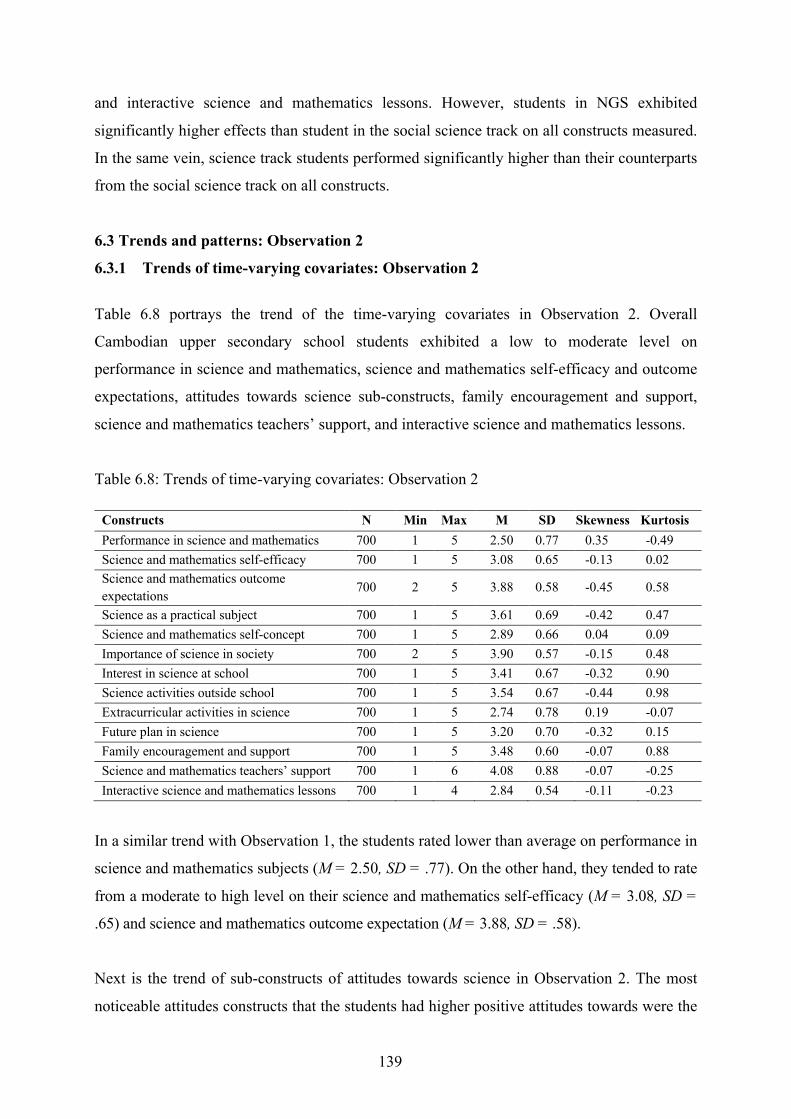
139
and interactive science and mathematics lessons. However, students in NGS exhibited
significantly higher effects than student in the social science track on all constructs measured.
In the same vein, science track students performed significantly higher than their counterparts
from the social science track on all constructs.
6.3 Trends and patterns: Observation 2
6.3.1 Trends of time-varying covariates: Observation 2
Table 6.8 portrays the trend of the time-varying covariates in Observation 2. Overall
Cambodian upper secondary school students exhibited a low to moderate level on
performance in science and mathematics, science and mathematics self-efficacy and outcome
expectations, attitudes towards science sub-constructs, family encouragement and support,
science and mathematics teachers’ support, and interactive science and mathematics lessons.
Table 6.8: Trends of time-varying covariates: Observation 2
Constructs N Min Max M SD Skewness Kurtosis Performance in science and mathematics 700 1 5 2.50 0.77 0.35 -0.49 Science and mathematics self-efficacy 700 1 5 3.08 0.65 -0.13 0.02 Science and mathematics outcome expectations 700 2 5 3.88 0.58 -0.45 0.58
Science as a practical subject 700 1 5 3.61 0.69 -0.42 0.47 Science and mathematics self-concept 700 1 5 2.89 0.66 0.04 0.09 Importance of science in society 700 2 5 3.90 0.57 -0.15 0.48 Interest in science at school 700 1 5 3.41 0.67 -0.32 0.90 Science activities outside school 700 1 5 3.54 0.67 -0.44 0.98 Extracurricular activities in science 700 1 5 2.74 0.78 0.19 -0.07 Future plan in science 700 1 5 3.20 0.70 -0.32 0.15 Family encouragement and support 700 1 5 3.48 0.60 -0.07 0.88 Science and mathematics teachers’ support 700 1 6 4.08 0.88 -0.07 -0.25 Interactive science and mathematics lessons 700 1 4 2.84 0.54 -0.11 -0.23
In a similar trend with Observation 1, the students rated lower than average on performance in
science and mathematics subjects (M = 2.50, SD = .77). On the other hand, they tended to rate
from a moderate to high level on their science and mathematics self-efficacy (M = 3.08, SD =
.65) and science and mathematics outcome expectation (M = 3.88, SD = .58).
Next is the trend of sub-constructs of attitudes towards science in Observation 2. The most
noticeable attitudes constructs that the students had higher positive attitudes towards were the
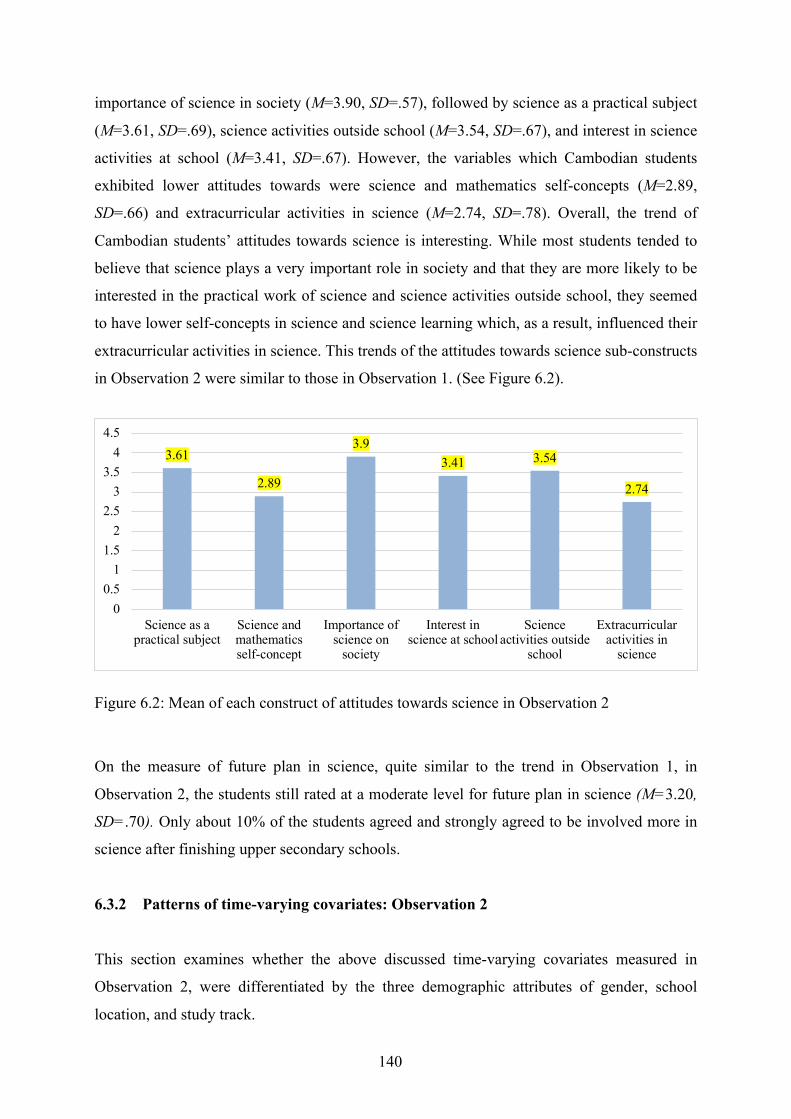
140
importance of science in society (M=3.90, SD=.57), followed by science as a practical subject
(M=3.61, SD=.69), science activities outside school (M=3.54, SD=.67), and interest in science
activities at school (M=3.41, SD=.67). However, the variables which Cambodian students
exhibited lower attitudes towards were science and mathematics self-concepts (M=2.89,
SD=.66) and extracurricular activities in science (M=2.74, SD=.78). Overall, the trend of
Cambodian students’ attitudes towards science is interesting. While most students tended to
believe that science plays a very important role in society and that they are more likely to be
interested in the practical work of science and science activities outside school, they seemed
to have lower self-concepts in science and science learning which, as a result, influenced their
extracurricular activities in science. This trends of the attitudes towards science sub-constructs
in Observation 2 were similar to those in Observation 1. (See Figure 6.2).
Figure 6.2: Mean of each construct of attitudes towards science in Observation 2
On the measure of future plan in science, quite similar to the trend in Observation 1, in
Observation 2, the students still rated at a moderate level for future plan in science (M=3.20,
SD=.70). Only about 10% of the students agreed and strongly agreed to be involved more in
science after finishing upper secondary schools.
6.3.2 Patterns of time-varying covariates: Observation 2
This section examines whether the above discussed time-varying covariates measured in
Observation 2, were differentiated by the three demographic attributes of gender, school
location, and study track.
3.61
2.89
3.93.41 3.54
2.74
00.5
11.5
22.5
33.5
44.5
Science as apractical subject
Science andmathematicsself-concept
Importance ofscience on
society
Interest inscience at school
Scienceactivities outside
school
Extracurricularactivities in
science
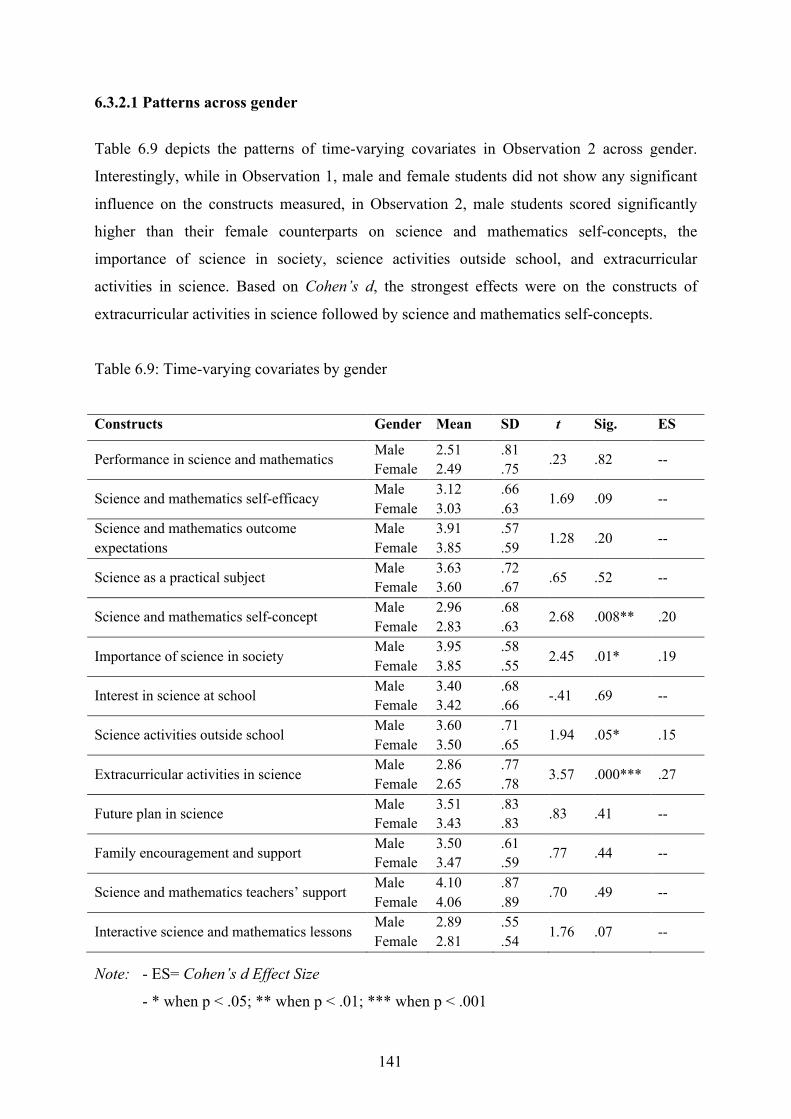
141
6.3.2.1 Patterns across gender
Table 6.9 depicts the patterns of time-varying covariates in Observation 2 across gender.
Interestingly, while in Observation 1, male and female students did not show any significant
influence on the constructs measured, in Observation 2, male students scored significantly
higher than their female counterparts on science and mathematics self-concepts, the
importance of science in society, science activities outside school, and extracurricular
activities in science. Based on Cohen’s d, the strongest effects were on the constructs of
extracurricular activities in science followed by science and mathematics self-concepts.
Table 6.9: Time-varying covariates by gender
Constructs Gender Mean SD t Sig. ES
Performance in science and mathematics Male Female
2.51 2.49
.81
.75 .23 .82 --
Science and mathematics self-efficacy Male Female
3.12 3.03
.66
.63 1.69 .09 --
Science and mathematics outcome expectations
Male Female
3.91 3.85
.57
.59 1.28 .20 --
Science as a practical subject Male Female
3.63 3.60
.72
.67 .65 .52 --
Science and mathematics self-concept Male Female
2.96 2.83
.68
.63 2.68 .008** .20
Importance of science in society Male Female
3.95 3.85
.58
.55 2.45 .01* .19
Interest in science at school Male Female
3.40 3.42
.68
.66 -.41 .69 --
Science activities outside school Male Female
3.60 3.50
.71
.65 1.94 .05* .15
Extracurricular activities in science Male Female
2.86 2.65
.77
.78 3.57 .000*** .27
Future plan in science Male Female
3.51 3.43
.83
.83 .83 .41 --
Family encouragement and support Male Female
3.50 3.47
.61
.59 .77 .44 --
Science and mathematics teachers’ support Male Female
4.10 4.06
.87
.89 .70 .49 --
Interactive science and mathematics lessons Male Female
2.89 2.81
.55
.54 1.76 .07 --
Note: - ES= Cohen’s d Effect Size
- * when p < .05; ** when p < .01; *** when p < .001
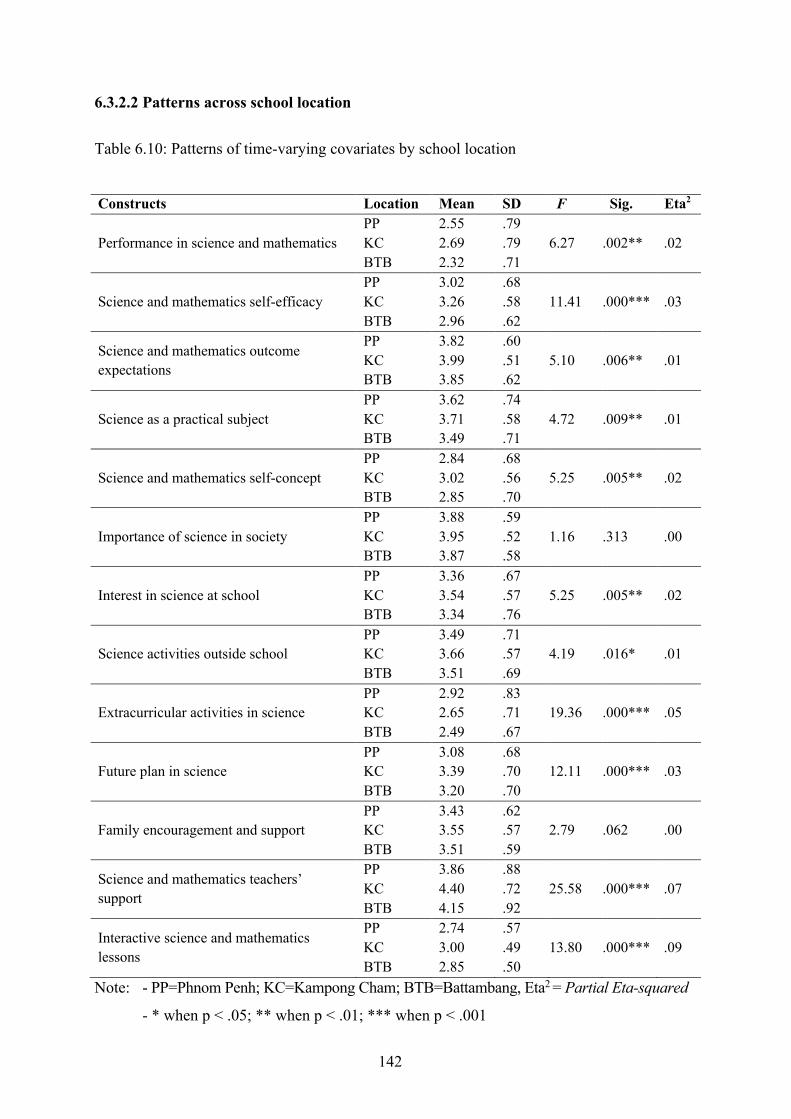
142
6.3.2.2 Patterns across school location
Table 6.10: Patterns of time-varying covariates by school location
Constructs Location Mean SD F Sig. Eta2
Performance in science and mathematics PP KC BTB
2.55 2.69 2.32
.79
.79
.71 6.27 .002** .02
Science and mathematics self-efficacy PP KC BTB
3.02 3.26 2.96
.68
.58
.62 11.41 .000*** .03
Science and mathematics outcome expectations
PP KC BTB
3.82 3.99 3.85
.60
.51
.62 5.10 .006** .01
Science as a practical subject PP KC BTB
3.62 3.71 3.49
.74
.58
.71 4.72 .009** .01
Science and mathematics self-concept PP KC BTB
2.84 3.02 2.85
.68
.56
.70 5.25 .005** .02
Importance of science in society PP KC BTB
3.88 3.95 3.87
.59
.52
.58 1.16 .313 .00
Interest in science at school PP KC BTB
3.36 3.54 3.34
.67
.57
.76 5.25 .005** .02
Science activities outside school PP KC BTB
3.49 3.66 3.51
.71
.57
.69 4.19 .016* .01
Extracurricular activities in science PP KC BTB
2.92 2.65 2.49
.83
.71
.67 19.36 .000*** .05
Future plan in science PP KC BTB
3.08 3.39 3.20
.68
.70
.70 12.11 .000*** .03
Family encouragement and support PP KC BTB
3.43 3.55 3.51
.62
.57
.59 2.79 .062 .00
Science and mathematics teachers’ support
PP KC BTB
3.86 4.40 4.15
.88
.72
.92 25.58 .000*** .07
Interactive science and mathematics lessons
PP KC BTB
2.74 3.00 2.85
.57
.49
.50 13.80 .000*** .09
Note: - PP=Phnom Penh; KC=Kampong Cham; BTB=Battambang, Eta2 = Partial Eta-squared
- * when p < .05; ** when p < .01; *** when p < .001
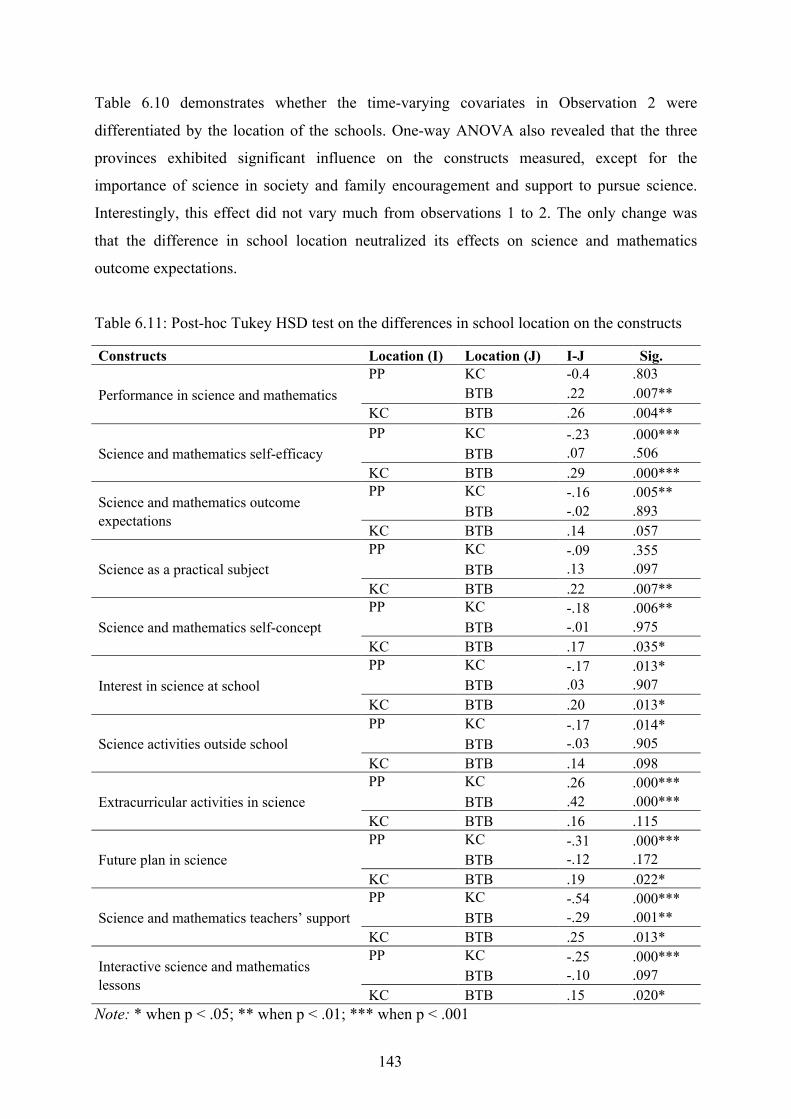
143
Table 6.10 demonstrates whether the time-varying covariates in Observation 2 were
differentiated by the location of the schools. One-way ANOVA also revealed that the three
provinces exhibited significant influence on the constructs measured, except for the
importance of science in society and family encouragement and support to pursue science.
Interestingly, this effect did not vary much from observations 1 to 2. The only change was
that the difference in school location neutralized its effects on science and mathematics
outcome expectations.
Table 6.11: Post-hoc Tukey HSD test on the differences in school location on the constructs
Constructs Location (I) Location (J) I-J Sig.
Performance in science and mathematics PP
KC BTB
-0.4 .22
.803
.007** KC BTB .26 .004**
Science and mathematics self-efficacy PP
KC BTB
-.23 .07
.000***
.506 KC BTB .29 .000***
Science and mathematics outcome expectations
PP
KC BTB
-.16 -.02
.005**
.893 KC BTB .14 .057
Science as a practical subject PP
KC BTB
-.09 .13
.355
.097 KC BTB .22 .007**
Science and mathematics self-concept PP
KC BTB
-.18 -.01
.006**
.975 KC BTB .17 .035*
Interest in science at school PP
KC BTB
-.17 .03
.013*
.907 KC BTB .20 .013*
Science activities outside school PP
KC BTB
-.17 -.03
.014*
.905 KC BTB .14 .098
Extracurricular activities in science PP
KC BTB
.26
.42 .000*** .000***
KC BTB .16 .115
Future plan in science PP
KC BTB
-.31 -.12
.000***
.172 KC BTB .19 .022*
Science and mathematics teachers’ support PP
KC BTB
-.54 -.29
.000***
.001** KC BTB .25 .013*
Interactive science and mathematics lessons
PP
KC BTB
-.25 -.10
.000***
.097 KC BTB .15 .020*
Note: * when p < .05; ** when p < .01; *** when p < .001
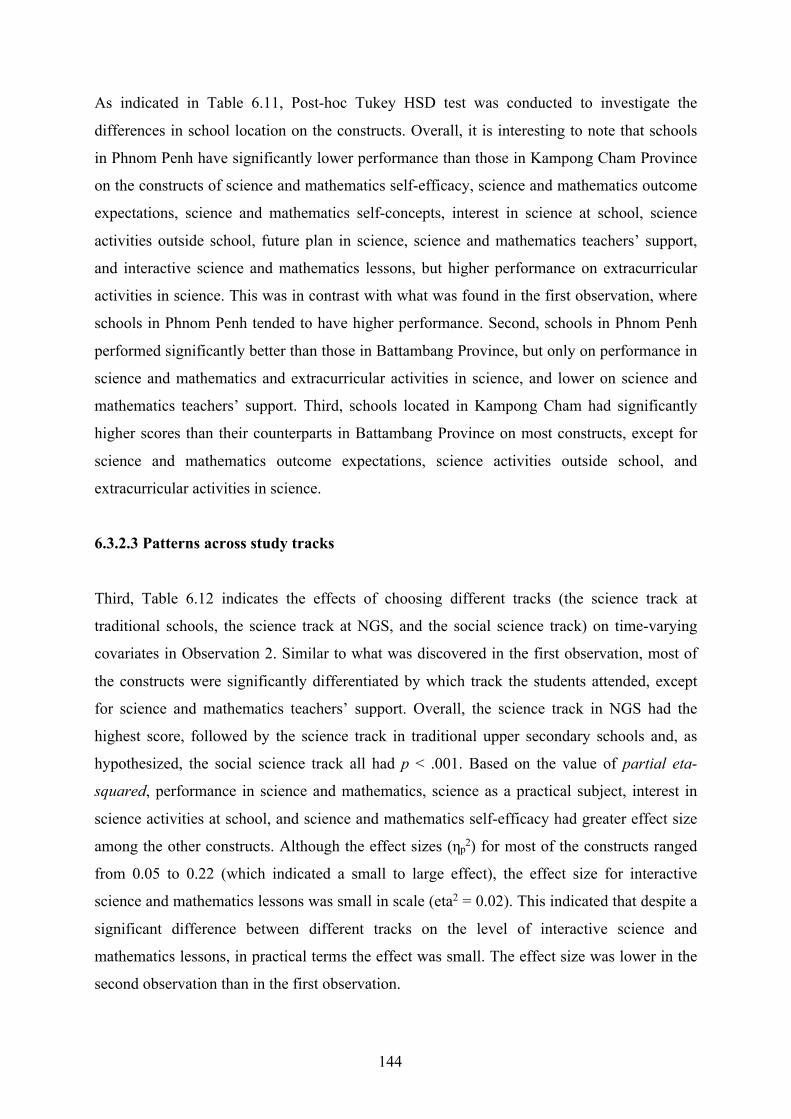
144
As indicated in Table 6.11, Post-hoc Tukey HSD test was conducted to investigate the
differences in school location on the constructs. Overall, it is interesting to note that schools
in Phnom Penh have significantly lower performance than those in Kampong Cham Province
on the constructs of science and mathematics self-efficacy, science and mathematics outcome
expectations, science and mathematics self-concepts, interest in science at school, science
activities outside school, future plan in science, science and mathematics teachers’ support,
and interactive science and mathematics lessons, but higher performance on extracurricular
activities in science. This was in contrast with what was found in the first observation, where
schools in Phnom Penh tended to have higher performance. Second, schools in Phnom Penh
performed significantly better than those in Battambang Province, but only on performance in
science and mathematics and extracurricular activities in science, and lower on science and
mathematics teachers’ support. Third, schools located in Kampong Cham had significantly
higher scores than their counterparts in Battambang Province on most constructs, except for
science and mathematics outcome expectations, science activities outside school, and
extracurricular activities in science.
6.3.2.3 Patterns across study tracks
Third, Table 6.12 indicates the effects of choosing different tracks (the science track at
traditional schools, the science track at NGS, and the social science track) on time-varying
covariates in Observation 2. Similar to what was discovered in the first observation, most of
the constructs were significantly differentiated by which track the students attended, except
for science and mathematics teachers’ support. Overall, the science track in NGS had the
highest score, followed by the science track in traditional upper secondary schools and, as
hypothesized, the social science track all had p < .001. Based on the value of partial eta-
squared, performance in science and mathematics, science as a practical subject, interest in
science activities at school, and science and mathematics self-efficacy had greater effect size
among the other constructs. Although the effect sizes (ηp2) for most of the constructs ranged
from 0.05 to 0.22 (which indicated a small to large effect), the effect size for interactive
science and mathematics lessons was small in scale (eta2 = 0.02). This indicated that despite a
significant difference between different tracks on the level of interactive science and
mathematics lessons, in practical terms the effect was small. The effect size was lower in the
second observation than in the first observation.
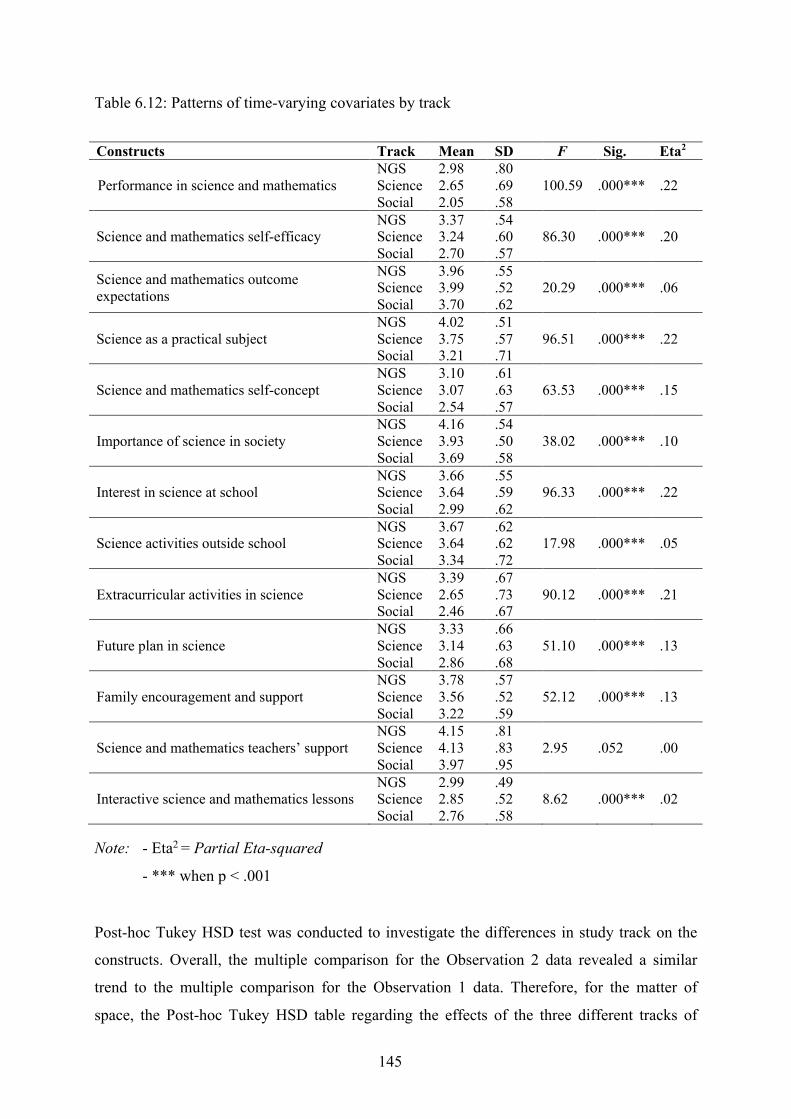
145
Table 6.12: Patterns of time-varying covariates by track
Constructs Track Mean SD F Sig. Eta2
Performance in science and mathematics NGS Science Social
2.98 2.65 2.05
.80
.69
.58 100.59 .000*** .22
Science and mathematics self-efficacy NGS Science Social
3.37 3.24 2.70
.54
.60
.57 86.30 .000*** .20
Science and mathematics outcome expectations
NGS Science Social
3.96 3.99 3.70
.55
.52
.62 20.29 .000*** .06
Science as a practical subject NGS Science Social
4.02 3.75 3.21
.51
.57
.71 96.51 .000*** .22
Science and mathematics self-concept NGS Science Social
3.10 3.07 2.54
.61
.63
.57 63.53 .000*** .15
Importance of science in society NGS Science Social
4.16 3.93 3.69
.54
.50
.58 38.02 .000*** .10
Interest in science at school NGS Science Social
3.66 3.64 2.99
.55
.59
.62 96.33 .000*** .22
Science activities outside school NGS Science Social
3.67 3.64 3.34
.62
.62
.72 17.98 .000*** .05
Extracurricular activities in science NGS Science Social
3.39 2.65 2.46
.67
.73
.67 90.12 .000*** .21
Future plan in science NGS Science Social
3.33 3.14 2.86
.66
.63
.68 51.10 .000*** .13
Family encouragement and support NGS Science Social
3.78 3.56 3.22
.57
.52
.59 52.12 .000*** .13
Science and mathematics teachers’ support NGS Science Social
4.15 4.13 3.97
.81
.83
.95 2.95 .052 .00
Interactive science and mathematics lessons NGS Science Social
2.99 2.85 2.76
.49
.52
.58 8.62 .000*** .02
Note: - Eta2 = Partial Eta-squared
- *** when p < .001
Post-hoc Tukey HSD test was conducted to investigate the differences in study track on the
constructs. Overall, the multiple comparison for the Observation 2 data revealed a similar
trend to the multiple comparison for the Observation 1 data. Therefore, for the matter of
space, the Post-hoc Tukey HSD table regarding the effects of the three different tracks of
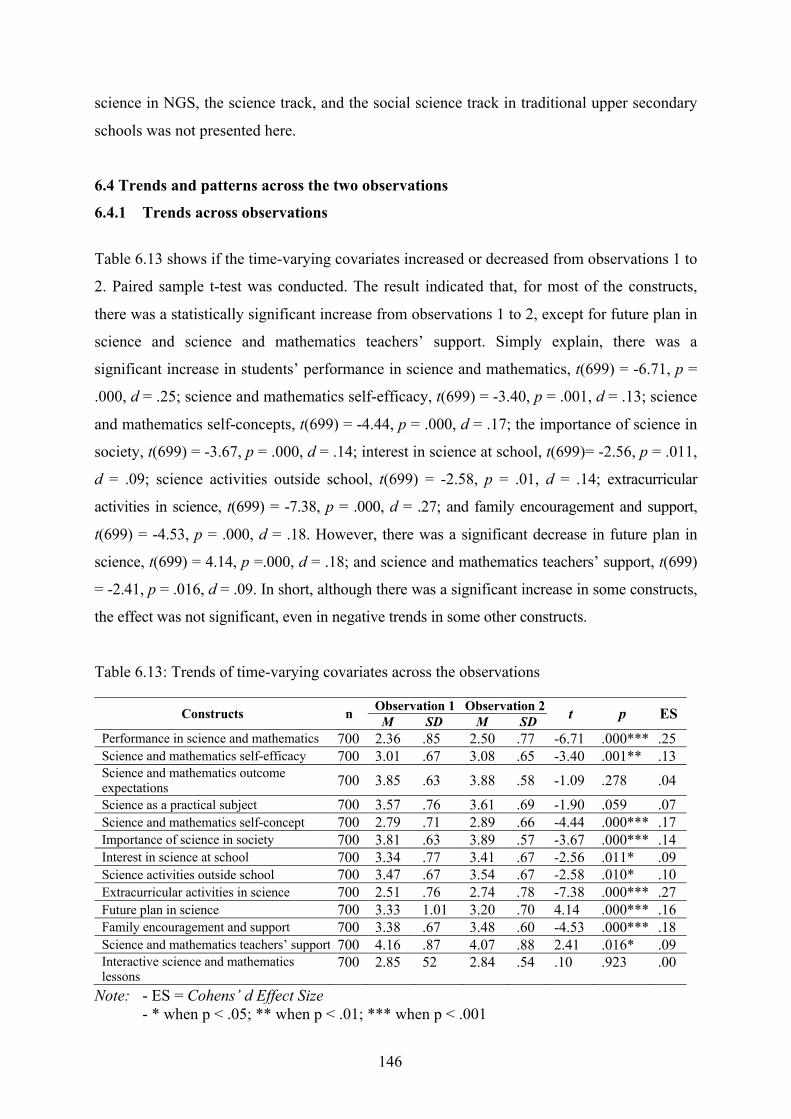
146
science in NGS, the science track, and the social science track in traditional upper secondary
schools was not presented here.
6.4 Trends and patterns across the two observations
6.4.1 Trends across observations
Table 6.13 shows if the time-varying covariates increased or decreased from observations 1 to
2. Paired sample t-test was conducted. The result indicated that, for most of the constructs,
there was a statistically significant increase from observations 1 to 2, except for future plan in
science and science and mathematics teachers’ support. Simply explain, there was a
significant increase in students’ performance in science and mathematics, t(699) = -6.71, p =
.000, d = .25; science and mathematics self-efficacy, t(699) = -3.40, p = .001, d = .13; science
and mathematics self-concepts, t(699) = -4.44, p = .000, d = .17; the importance of science in
society, t(699) = -3.67, p = .000, d = .14; interest in science at school, t(699)= -2.56, p = .011,
d = .09; science activities outside school, t(699) = -2.58, p = .01, d = .14; extracurricular
activities in science, t(699) = -7.38, p = .000, d = .27; and family encouragement and support,
t(699) = -4.53, p = .000, d = .18. However, there was a significant decrease in future plan in
science, t(699) = 4.14, p =.000, d = .18; and science and mathematics teachers’ support, t(699)
= -2.41, p = .016, d = .09. In short, although there was a significant increase in some constructs,
the effect was not significant, even in negative trends in some other constructs.
Table 6.13: Trends of time-varying covariates across the observations
Constructs n Observation 1 Observation 2 t p ES M SD M SD Performance in science and mathematics 700 2.36 .85 2.50 .77 -6.71 .000*** .25 Science and mathematics self-efficacy 700 3.01 .67 3.08 .65 -3.40 .001** .13 Science and mathematics outcome expectations 700 3.85 .63 3.88 .58 -1.09 .278 .04 Science as a practical subject 700 3.57 .76 3.61 .69 -1.90 .059 .07 Science and mathematics self-concept 700 2.79 .71 2.89 .66 -4.44 .000*** .17 Importance of science in society 700 3.81 .63 3.89 .57 -3.67 .000*** .14 Interest in science at school 700 3.34 .77 3.41 .67 -2.56 .011* .09 Science activities outside school 700 3.47 .67 3.54 .67 -2.58 .010* .10 Extracurricular activities in science 700 2.51 .76 2.74 .78 -7.38 .000*** .27 Future plan in science 700 3.33 1.01 3.20 .70 4.14 .000*** .16 Family encouragement and support 700 3.38 .67 3.48 .60 -4.53 .000*** .18 Science and mathematics teachers’ support 700 4.16 .87 4.07 .88 2.41 .016* .09 Interactive science and mathematics lessons
700 2.85 52 2.84 .54 .10 .923 .00
Note: - ES = Cohens’ d Effect Size - * when p < .05; ** when p < .01; *** when p < .001
147
6.4.2 Patterns across observations and gender
A 2 (observation) x 2 (gender) repeated ANOVA was conducted to observe the patterns of
time-varying covariates across the two observations and gender, see Table 6.14. First, the
main effect for observation was significant for most constructs, except for science and
mathematics outcome expectations and interactive science and mathematics lessons. Thus,
there was a difference in the other constructs for Observation 1 compared to Observation 2.
However, the effect size was small (the eta-squared ranged from .01 to .08). More
interestingly, a significant observations x gender was also obtained. Quite opposite to the
main effect, the interaction effect between observation and gender was not significant for
most constructs, except for science and mathematics self-efficacy, science and mathematics
self-concepts, and extracurricular activities in science. The effect size was small.
Investigation of the estimated marginal mean indicated that in the first observation, males and
females scored the same on science and mathematics self-efficacy. Notwithstanding, in
Observation 2, males increased their science and mathematics self-efficacy more than
females. This indicates that males tended to increase the constructs at a higher rate than
females. Second, for science and mathematics self-concepts, there was an increasing trend for
both males and females from observations 1 to 2. Yet, it is significant to note that the trend
was much larger for males than for females. Males and females scored nearly the same in
Observation 1, but the gap was extended in Observation 2. Third, for extracurricular activities
in science, males and females had the same low mean score in Observation 1. However, there
was an increasing trend in Observation 2, with males being more involved in the activities in
Observation 2 than their female counterparts. In short, within these three constructs, there
was increasing trends from observations 1 to 2, with males having higher scores than female
students.
Table 6.14: Trends of time-varying covariates as a function of observation and gender
Constructs Source Df MS F p Eta2
Performance in science and mathematics
Observation 1 7.26 45.59 .000*** .06
Obs.*Gender 2, 697 .09 .59 .443 .00
Science and mathematics self-efficacy
Observation 1 1.86 13.08 .000*** .02
Obs.*Gender 2, 697 .57 4.02 .045* .00
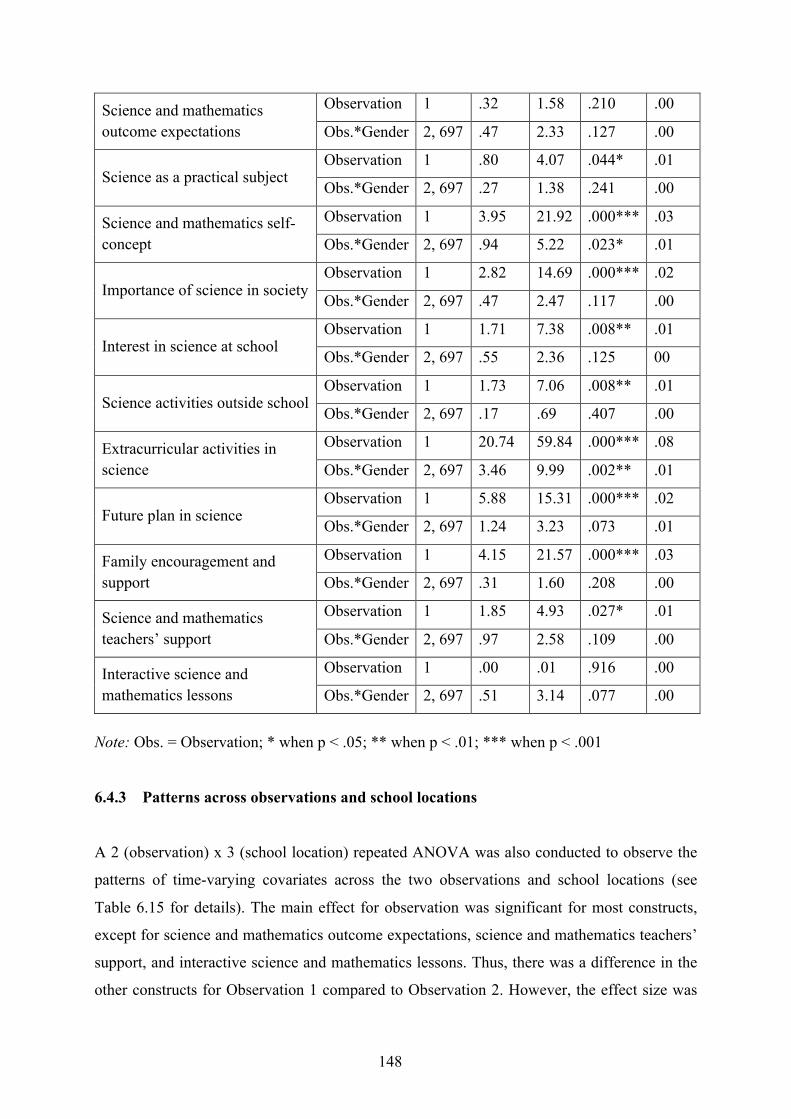
148
Science and mathematics outcome expectations
Observation 1 .32 1.58 .210 .00
Obs.*Gender 2, 697 .47 2.33 .127 .00
Science as a practical subject Observation 1 .80 4.07 .044* .01
Obs.*Gender 2, 697 .27 1.38 .241 .00
Science and mathematics self-concept
Observation 1 3.95 21.92 .000*** .03
Obs.*Gender 2, 697 .94 5.22 .023* .01
Importance of science in society Observation 1 2.82 14.69 .000*** .02
Obs.*Gender 2, 697 .47 2.47 .117 .00
Interest in science at school Observation 1 1.71 7.38 .008** .01
Obs.*Gender 2, 697 .55 2.36 .125 00
Science activities outside school Observation 1 1.73 7.06 .008** .01
Obs.*Gender 2, 697 .17 .69 .407 .00
Extracurricular activities in science
Observation 1 20.74 59.84 .000*** .08
Obs.*Gender 2, 697 3.46 9.99 .002** .01
Future plan in science Observation 1 5.88 15.31 .000*** .02
Obs.*Gender 2, 697 1.24 3.23 .073 .01
Family encouragement and support
Observation 1 4.15 21.57 .000*** .03
Obs.*Gender 2, 697 .31 1.60 .208 .00
Science and mathematics teachers’ support
Observation 1 1.85 4.93 .027* .01
Obs.*Gender 2, 697 .97 2.58 .109 .00
Interactive science and mathematics lessons
Observation 1 .00 .01 .916 .00
Obs.*Gender 2, 697 .51 3.14 .077 .00
Note: Obs. = Observation; * when p < .05; ** when p < .01; *** when p < .001
6.4.3 Patterns across observations and school locations
A 2 (observation) x 3 (school location) repeated ANOVA was also conducted to observe the
patterns of time-varying covariates across the two observations and school locations (see
Table 6.15 for details). The main effect for observation was significant for most constructs,
except for science and mathematics outcome expectations, science and mathematics teachers’
support, and interactive science and mathematics lessons. Thus, there was a difference in the
other constructs for Observation 1 compared to Observation 2. However, the effect size was
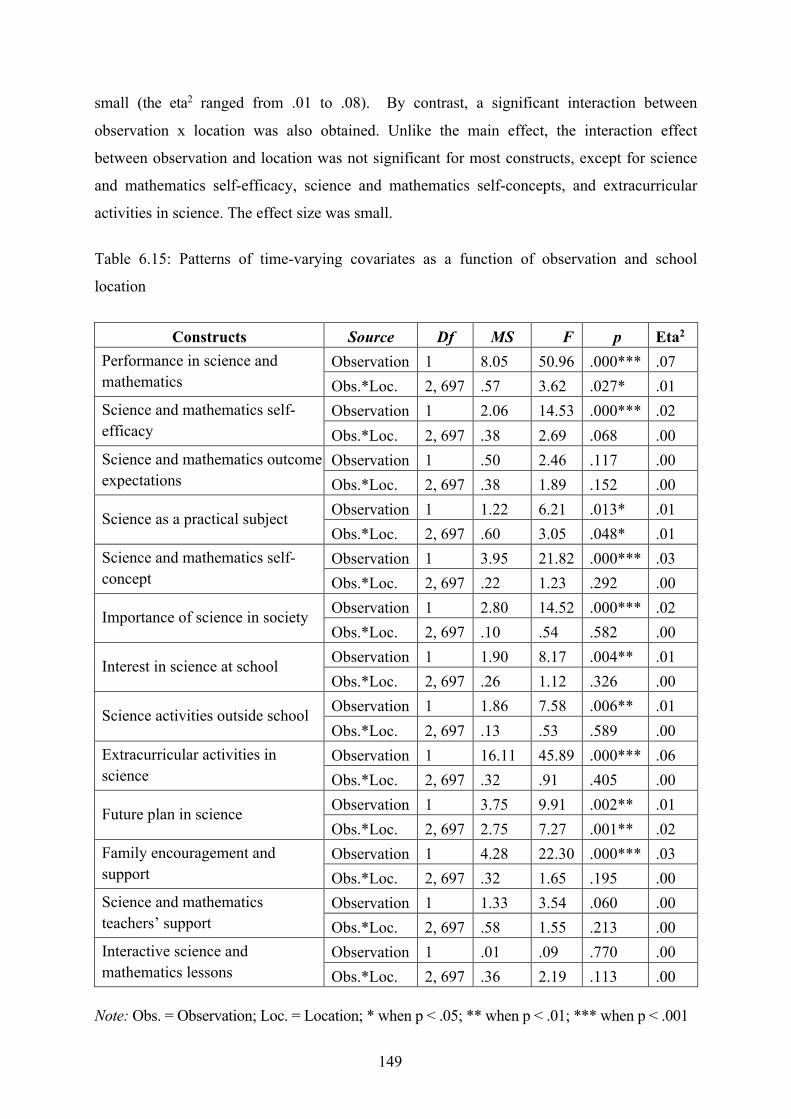
149
small (the eta2 ranged from .01 to .08). By contrast, a significant interaction between
observation x location was also obtained. Unlike the main effect, the interaction effect
between observation and location was not significant for most constructs, except for science
and mathematics self-efficacy, science and mathematics self-concepts, and extracurricular
activities in science. The effect size was small.
Table 6.15: Patterns of time-varying covariates as a function of observation and school
location
Constructs Source Df MS F p Eta2
Performance in science and mathematics
Observation 1 8.05 50.96 .000*** .07 Obs.*Loc. 2, 697 .57 3.62 .027* .01
Science and mathematics self-efficacy
Observation 1 2.06 14.53 .000*** .02 Obs.*Loc. 2, 697 .38 2.69 .068 .00
Science and mathematics outcome expectations
Observation 1 .50 2.46 .117 .00 Obs.*Loc. 2, 697 .38 1.89 .152 .00
Science as a practical subject Observation 1 1.22 6.21 .013* .01 Obs.*Loc. 2, 697 .60 3.05 .048* .01
Science and mathematics self-concept
Observation 1 3.95 21.82 .000*** .03 Obs.*Loc. 2, 697 .22 1.23 .292 .00
Importance of science in society Observation 1 2.80 14.52 .000*** .02 Obs.*Loc. 2, 697 .10 .54 .582 .00
Interest in science at school Observation 1 1.90 8.17 .004** .01 Obs.*Loc. 2, 697 .26 1.12 .326 .00
Science activities outside school Observation 1 1.86 7.58 .006** .01 Obs.*Loc. 2, 697 .13 .53 .589 .00
Extracurricular activities in science
Observation 1 16.11 45.89 .000*** .06 Obs.*Loc. 2, 697 .32 .91 .405 .00
Future plan in science Observation 1 3.75 9.91 .002** .01 Obs.*Loc. 2, 697 2.75 7.27 .001** .02
Family encouragement and support
Observation 1 4.28 22.30 .000*** .03 Obs.*Loc. 2, 697 .32 1.65 .195 .00
Science and mathematics teachers’ support
Observation 1 1.33 3.54 .060 .00 Obs.*Loc. 2, 697 .58 1.55 .213 .00
Interactive science and mathematics lessons
Observation 1 .01 .09 .770 .00 Obs.*Loc. 2, 697 .36 2.19 .113 .00
Note: Obs. = Observation; Loc. = Location; * when p < .05; ** when p < .01; *** when p < .001
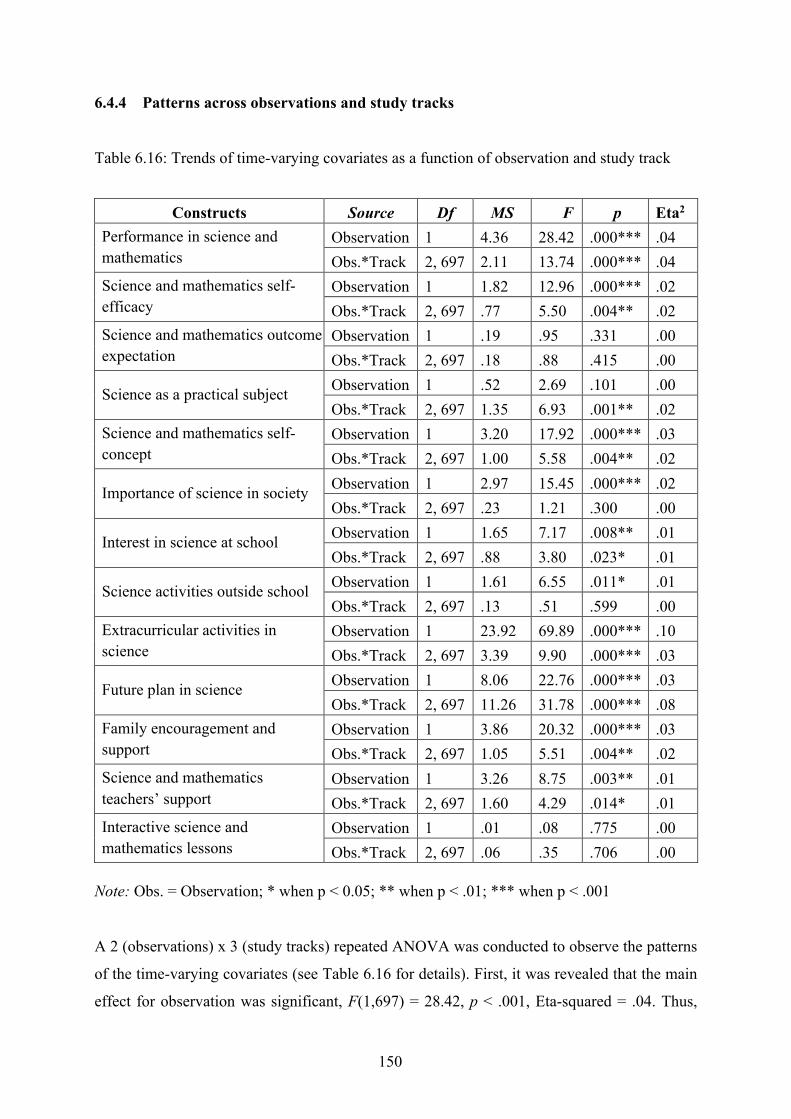
150
6.4.4 Patterns across observations and study tracks
Table 6.16: Trends of time-varying covariates as a function of observation and study track
Constructs Source Df MS F p Eta2
Performance in science and mathematics
Observation 1 4.36 28.42 .000*** .04 Obs.*Track 2, 697 2.11 13.74 .000*** .04
Science and mathematics self-efficacy
Observation 1 1.82 12.96 .000*** .02 Obs.*Track 2, 697 .77 5.50 .004** .02
Science and mathematics outcome expectation
Observation 1 .19 .95 .331 .00 Obs.*Track 2, 697 .18 .88 .415 .00
Science as a practical subject Observation 1 .52 2.69 .101 .00 Obs.*Track 2, 697 1.35 6.93 .001** .02
Science and mathematics self-concept
Observation 1 3.20 17.92 .000*** .03 Obs.*Track 2, 697 1.00 5.58 .004** .02
Importance of science in society Observation 1 2.97 15.45 .000*** .02 Obs.*Track 2, 697 .23 1.21 .300 .00
Interest in science at school Observation 1 1.65 7.17 .008** .01 Obs.*Track 2, 697 .88 3.80 .023* .01
Science activities outside school Observation 1 1.61 6.55 .011* .01 Obs.*Track 2, 697 .13 .51 .599 .00
Extracurricular activities in science
Observation 1 23.92 69.89 .000*** .10 Obs.*Track 2, 697 3.39 9.90 .000*** .03
Future plan in science Observation 1 8.06 22.76 .000*** .03 Obs.*Track 2, 697 11.26 31.78 .000*** .08
Family encouragement and support
Observation 1 3.86 20.32 .000*** .03 Obs.*Track 2, 697 1.05 5.51 .004** .02
Science and mathematics teachers’ support
Observation 1 3.26 8.75 .003** .01 Obs.*Track 2, 697 1.60 4.29 .014* .01
Interactive science and mathematics lessons
Observation 1 .01 .08 .775 .00 Obs.*Track 2, 697 .06 .35 .706 .00
Note: Obs. = Observation; * when p < 0.05; ** when p < .01; *** when p < .001
A 2 (observations) x 3 (study tracks) repeated ANOVA was conducted to observe the patterns
of the time-varying covariates (see Table 6.16 for details). First, it was revealed that the main
effect for observation was significant, F(1,697) = 28.42, p < .001, Eta-squared = .04. Thus,
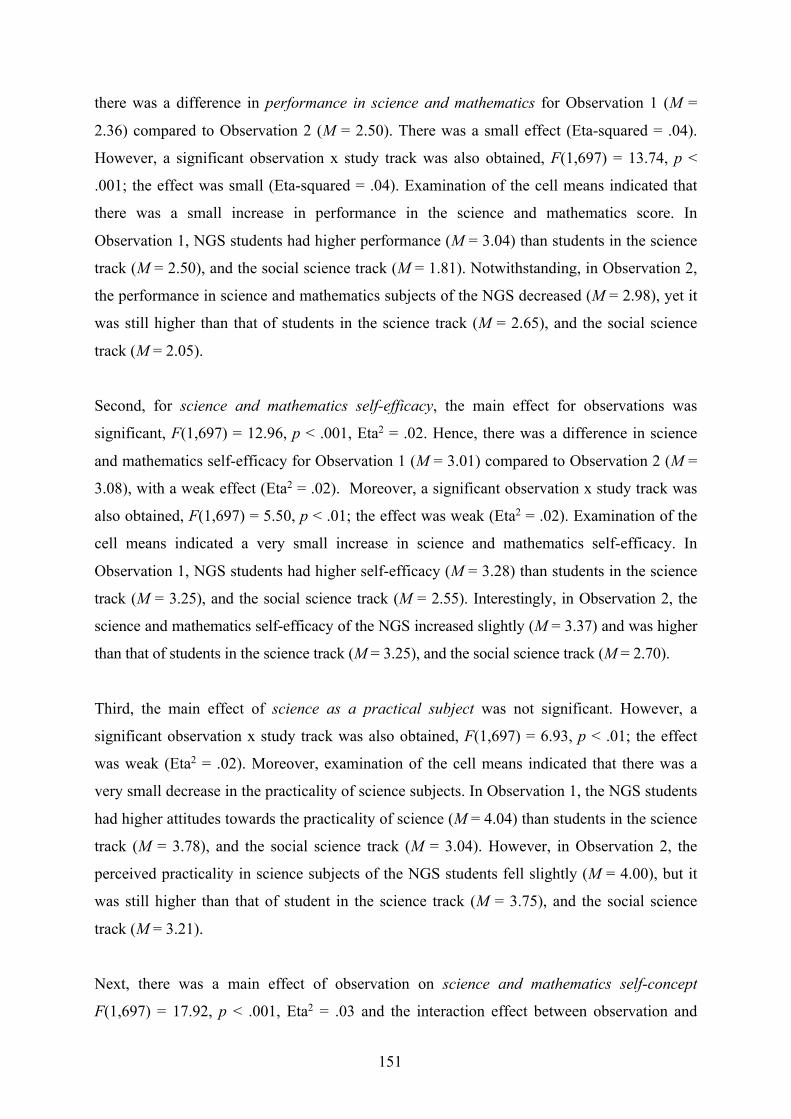
151
there was a difference in performance in science and mathematics for Observation 1 (M =
2.36) compared to Observation 2 (M = 2.50). There was a small effect (Eta-squared = .04).
However, a significant observation x study track was also obtained, F(1,697) = 13.74, p <
.001; the effect was small (Eta-squared = .04). Examination of the cell means indicated that
there was a small increase in performance in the science and mathematics score. In
Observation 1, NGS students had higher performance (M = 3.04) than students in the science
track (M = 2.50), and the social science track (M = 1.81). Notwithstanding, in Observation 2,
the performance in science and mathematics subjects of the NGS decreased (M = 2.98), yet it
was still higher than that of students in the science track (M = 2.65), and the social science
track (M = 2.05).
Second, for science and mathematics self-efficacy, the main effect for observations was
significant, F(1,697) = 12.96, p < .001, Eta2 = .02. Hence, there was a difference in science
and mathematics self-efficacy for Observation 1 (M = 3.01) compared to Observation 2 (M =
3.08), with a weak effect (Eta2 = .02). Moreover, a significant observation x study track was
also obtained, F(1,697) = 5.50, p < .01; the effect was weak (Eta2 = .02). Examination of the
cell means indicated a very small increase in science and mathematics self-efficacy. In
Observation 1, NGS students had higher self-efficacy (M = 3.28) than students in the science
track (M = 3.25), and the social science track (M = 2.55). Interestingly, in Observation 2, the
science and mathematics self-efficacy of the NGS increased slightly (M = 3.37) and was higher
than that of students in the science track (M = 3.25), and the social science track (M = 2.70).
Third, the main effect of science as a practical subject was not significant. However, a
significant observation x study track was also obtained, F(1,697) = 6.93, p < .01; the effect
was weak (Eta2 = .02). Moreover, examination of the cell means indicated that there was a
very small decrease in the practicality of science subjects. In Observation 1, the NGS students
had higher attitudes towards the practicality of science (M = 4.04) than students in the science
track (M = 3.78), and the social science track (M = 3.04). However, in Observation 2, the
perceived practicality in science subjects of the NGS students fell slightly (M = 4.00), but it
was still higher than that of student in the science track (M = 3.75), and the social science
track (M = 3.21).
Next, there was a main effect of observation on science and mathematics self-concept
F(1,697) = 17.92, p < .001, Eta2 = .03 and the interaction effect between observation and
152
study track, F(1,697) = 5.58, p < .01, Eta2 = .02. In Observation 1 NGS students had the same
level of science and mathematics self-concepts (M = 3.04) as students in the science track (M
= 3.04), but higher than students in the social science track (M = 2.35). However, in
Observation 2, the science and mathematics self-concepts of the NGS slightly increased (M =
3.10). Thus, it was higher than that of students in the science track (M = 3.07), and the social
science track (M = 2.55).
For the importance of science in society, there was only the main effect of the observations,
F(1,697) = 15.45, p < .001, Eta2 = .02, but there was no significant interaction effects between
observations and study tracks on the perceived importance of science in society, F(1,697) =
1.21, p > .05. This was also the case for science activities outside school. The main effect of
observations on science activities outside school was significant, F(1,697) = 6.55, p < .05,
Eta2 = .01, but there was no interaction effect between the observations and study tracks.
Furthermore, for interest in science at school, the main effect for observation was significant
F(1,697) = 7.17, p < .01, Eta2 = .01. Thus, there was a difference in interest in science at
school for Observation 1 (M = 3.34) as compared to Observation 2 (M = 3.41). There was a
weak effect (Eta2 = .01). Moreover, a significant observation x study track was also obtained,
F(1,697) = 3.80, p < .05, although there was a weak effect (Eta2 = .01). Examination of the
cell means indicated that there was a very small increase in interest in science at school. In
Observation 1, NGS students had lower interest (M = 3.58) than students in the science track
(M = 3.65), but higher than in the social science track (M = 2.85). However, in Observation 2,
interest in science at school among students in the NGS slightly increased (M = 3.66) to be
higher than that of students in the science track (M = 3.64), and the social science track (M =
2.99).
The main effect of extracurricular activities in science was significant, F(1,697) = 69.89, p <
.001, Eta2 = .01. Thus, there was a difference in extracurricular activities in science for
Observation 1 (M = 2.51) compared to Observation 2 (M = 2.74), but the effects were small.
Furthermore, a significant observation x study track was also obtained, F(1,697) = 9.90, p <
.001; the effect was weak (Eta2 = .03). Examination of the cell means indicated that there was
an increase in extracurricular activities in science. In Observation 1, the NGS students had
higher extracurricular activities in science (M = 2.90) than students in the science track (M =
2.48), and the social science track (M = 2.31). Interestingly, in Observation 2, the level of
153
extracurricular activities in science of the NGS increased to (M = 3.39) higher than that of
student in the science track (M = 2.65), and the social science track (M = 2.46).
It is surprising to note that the main effect of future plan in science was significant, F(1,697)
= 22.76, p < .001, Eta2 = .03. Thus, there was a difference in students’ future plan in science
for Observation 1 (M = 3.33) compared to Observation 2 (M = 3.19). Furthermore, a
significant observation x study track was also obtained, F(1,697) = 31.78, p < .001, with a
medium effect (Eta2 = .08). Examination of the cell means pointed to a decrease in future plan
in science as the students moved on to higher grades. In Observation 1, NGS students had
lower future plan in science (M = 3.69) than the students in the science track (M = 3.73), but
higher than students in the social science track (M = 2.67). In a worrisome trend, in
Observation 2, the students’ future plan in science at the NGS decreased to M = 3.33, and
continued to be lower compared to students in the science track (M = 3.41), but higher than
students in the social science track (M = 2.87).
For the contextual support constructs, the main effect of family encouragement and support
was significant, but with a very small effect, F(1,697) = 20.32, p < .001, Eta2 = .03. Thus,
there was a difference in family encouragement and support for Observation 1 (M = 3.37)
compared to Observation 2 (M = 3.48). Furthermore, a significant observation x study track
was also obtained, F(1,697) = 5.51, p < .01, with a small effect (Eta2 = .02). Examination of
the cell means revealed an increase in family encouragement and support as students moved
on to higher grades. In Observation 1, NGS students had higher family encouragement and
support (M = 3.68) than students in the science track (M = 3.53), and the social science track
(M = 3.02). In Observation 2, the family encouragement and support of the NGS students
increased to (M = 3.78) and continued to be higher compared to students in the science track
(M = 3.60), and the social science track (M = 3.22).
Lastly, for another contextual support construct, the main effect of science and mathematics
teachers’ support was also significant, F(1,697) = 8.75, p < .01, Eta2 = .01. Thus, there was a
difference in science and mathematics teachers’ support for Observation 1 (M = 4.15)
compared to Observation 2 (M = 4.07). Furthermore, a significant observation x study track
was also witnessed, F(1,697) = 4.29, p < .05, but with a small effect (Eta2 = .01). Examination
of the cell means indicated a decrease in science and mathematics teachers’ support as the
students moved on to higher grades. In Observation 1 NGS students had higher science and
154
mathematics teachers’ support (M = 4.39) than students in the science track (M = 4.22), and
the social science track (M = 3.95). In Observation 2 the science and mathematics teachers’
support among the NGS students decreased to (M = 4.15), and continued to be just the same
as students in the science track (M = 4.13), but higher than student in the social science track
(M = 3.97).
6.5 Discussion of key themes for RQ 2
6.5.1 Trends of time-varying covariates
According to the trends witnessed in the time-varying covariates, in Observation 1,
Cambodian upper secondary school students rated science and mathematics outcome
expectations, science as a practical subject, and the importance of science in society at a high
level. However, they rated science and mathematics self-efficacy, science and mathematics
self-concepts, interest in science at school, science activities outside school, extracurricular
activities in science, future plan in science, support from science and mathematics teachers
and interactive science and mathematics lessons at a moderate level. They rated their
performance in science and mathematics at a low level. For Observation 2, the students
exhibited a low to moderate level of performance in science and mathematics, science and
mathematics self-efficacy and outcome expectations, attitudes towards science sub-constructs
(an uneven trend among the sub-construct), future plan in science, family encouragement and
support, science and mathematics teachers’ support, and the interactive science and
mathematics lessons.
There are a few interesting trends to be noted. Emerging findings are reflected with respect to
the realities of Cambodian upper secondary school students’ performance in science and
mathematics. The students tended to state that they have low performance in science and
mathematics. This finding is consistent with a recent study, which revealed that on the 2015
national examination, out of 83,325 students, only 23.3% passed the mathematics portion,
while 41.7% passed the biology portion (Chey & Khieu, 2017). Moreover, according to the
outcomes of the Programme for International Student Assessment for Development (PISA-
D), Cambodian 15-year-old (grade 11th) students outperformed those in Senegal and Zambia
in all subjects and obtained academic performance in mathematics comparable to those in
other PISA-D member states (Cambodia scored 325, while the PISA-D average was 324).
However, they had significantly lower performance in science than those in PISA-D and
155
ASEAN countries (Vietnam, Thailand, Indonesia, and Singapore). Their performance was
especially lower than students in OECD member nations. Cambodian students scored 330 in
science out of roughly 700. On average, students in PISA-D member countries scored 349 in
science (MoEYS, 2018g). The result of the follow-up interviews confirmed that students did
not like to struggle with science and mathematics at upper secondary school, especially on the
baccalaureate examination. As a result, most students have tended to choose the social science
track (for which they do not need to do science and mathematics) rather than the social
science track in the last few academic years (MoEYS, 2019c).
On another note, there is an uneven trend of attitudes towards the science sub-constructs.
With the current development of science and technology, of all other instances, the students
displayed a higher level of awareness of science and technology, particularly regarding the
importance of science in society. This is a very interesting sign, since according to
Cambodia’s national science and technology master plan for 2014–2020 of the Royal
Government of Cambodia (RGC, 2013), Cambodia only had 17 science and technology
researchers and 13 technicians per million of its population, due to the fact that Cambodia’s
social awareness of science and technology is generally low in the country. However, the
results of the present study indicated a different trend of students’ awareness of science and
technology in general, and the importance of science in society in particular.
Students showed more positive attitudes towards the practical work of science subjects.
According to Marginson et al. (2013), Freedman (1997), and Papanastasiou and
Papanastasiou (2004), the teaching methods of problem-solving, inquiry, critical thinking, and
creativity should be considered because they can enhance both students’ attitudes towards and
practical competency in science-related fields. In the Cambodian upper secondary school
context, practical work—especially in science classes—is of concern (CDRI, 2015).
However, with the current improvements of MoEYS, this teaching practice has been
improving. For instance, from 2000 to 2005, JICA launched several projects. These included
the Secondary School Teacher Training Project in Science and Mathematics (STEPSAM), to
reinforce the science and mathematics teaching functions and capabilities of the country’s
National Institute of Education (NIE), which trains high school teachers; the Project for
Improving Science and Mathematics Education at the Upper Secondary Level (ISMEC),
implemented from 2005 to 2008; and STEPSAM II, which was carried out from 2008 to 2012
(Center for Research and Development Strategy, 2015); the Flemish Association for
156
Development Cooperation and Technical Assistance (VVOB) to improve mathematics and
science teaching methods at the classroom level; and other projects (Secondary Education
Improvement Project [SEIP]) from other development partners. This might have influenced
the improvement of science and mathematics education in Cambodia and boosted students’
attitudes towards practical work in science in the long run.
In the other continuum, the results also revealed the emerging trend of Cambodian students’
self-interest in science activities outside school, which included science movies on TV,
reading science magazines, and other science activities. Besides these self-interest activities,
students also exhibited a moderate level of attitudes towards extracurricular activities in
science. Some students that participated in the survey have experienced the so-called STEM
bus and STEM festival, which are meant to enhance their attitudes towards science subjects at
upper secondary school. In existence now for a few years, the STEM bus (modelled from Lab
in a Lorry in the British context), travels to upper secondary schools across the country to
exhibit science expos as well as to promote awareness of and interest in STEM majors in
secondary schools (MoEYS, 2018d). Empirically, Barmby et al. (2008) and Forsthuber,
Motiejunaite, and de Almeida Coutinho (2011), reported that Lab in a Lorry has been
significantly contributing to building students’ interest in and attitudes towards the practical
work of science and science learning in school. In this regard, in the same vein of
implementation as Lab in a Lorry, the STEM Bus in the Cambodian context might have also
contributed to enhancing students’ interest in and attitudes towards science in general, and
attitudes towards extracurricular activities in science in particular.
Students exhibited moderate level of attitudes towards the self-concepts of science and
mathematics might be due to the fact that science is perceived as a difficult subject. There is
an interesting reflection in this finding. In the past years, at the upper secondary school about
80% of the students have taken science classes (MoEYS, 2017; 2018a). This might be because
students believed that science was difficult, especially in terms of passing the national
examination; together with the lower self-concepts in science and mathematics, their future
plan in science were low, and even lower in the second observation. The qualitative results
confirmed that science is difficult, especially during the examination. As evidence, MoEYS
(2019c) reported that the number of students in the science track at upper secondary school
keep decreasing. The percentage has fallen from about 80% to 49% in the last few academic
years.
157
6.5.2 Gender perspective
From a gender perspective, in the first observation, there was no significant difference
between males and females on all of the constructs measured. However, in the second
observation, there was a difference between males and females for the three constructs of
attitudes towards science: (1) science and mathematics self-concepts, (2) interest in science
activities outside school, and (3) extracurricular activities in science, for which males seemed
to have a higher scale.
The results showed divergent features of students’ attitudes towards science that emerged
within students’ gender dynamics. Overall, adding on the findings by Crisp and Nora (2006),
Francis and Greer (1999), Hodson and Freeman (1983), OECD (2016), and Simpson and
Oliver (1990) this study revealed that male students seemed to have higher attitudes than
female students towards science. The most advantageous aspects that male students had over
females were science and mathematics self-concepts, science activities outside school, and
extracurricular activities in science. The most noticeable patterns of the differences relative to
gender were in extracurricular activities in science among males (M = 2.86, SD = .77), who
scored significantly higher than females (M = 2.65, SD = .78), p < .001 with a moderate effect
size of d = .27, followed by science and mathematics self-concepts (effect size of d = .20) and
science activities outside school (effect size of d = .15). Contextually, these differences may
be partly due to the cultural perceptions of Cambodian people, especially parents, that science
is a male-dominant field. This finding is also supported by the empirical justifications that
females have lower attitudes towards science because of their science self-conceptions and
their conception of minority aspects in science classes (Handley & Morse, 1986, OECD,
2016).
In the Cambodian context, the term “science” is associated with male-dominated jobs (Mark,
2016; Kaing, 2016). Thus, female students tended to swing from science. This is particularly
interesting when they move on to higher grades. To a great extent, this signals a lower interest
in and attitudes towards science among female students. Moreover, because science subjects
are usually perceived as difficult (CDRI, 2015), and since female students in Cambodia’s
upper secondary school (aged 18–22) usually spend their spare time supporting their families’
daily routines (e.g., cleaning and cooking), they might not have enough time to spend on
those difficult subjects at home. Eng and Szmodis (2015) highlighted that social norms
158
require females to stay close to home and to help with household chores and care for younger
siblings. This finding could also be explained by the fact that female teachers in science and
mathematics have higher subjective evaluations for their female students and to encourage
them more than male teachers do (Ma, 2011; Stearns et al., 2016). However, in the sampled
schools, there were fewer female science and mathematics teachers than male teachers. This
might have led to lower interest among female students in participating in science related
activities.
In the other continuum, male students have more access to the extracurricular activities
outside the home, which could reinforce their attitudes towards science, as exhibited in this
current study. Hence, this might influence their science performance and attitudes towards
science in the long run. The discussion during the interviews corroborated the finding, as the
interviewees expresses that male students tend to have more science self-concept than female
students. Males may not take the science track at the beginning, but they are more willing to
major in science or STEM fields because they have higher self-concepts in science and
mathematics than females in later grade (t=2.68, p<.01; d=.20).
6.5.3 School location matters
From the angle of location, the results revealed a significant difference in the level of
constructs across school location. Schools in Phnom Penh had a significantly higher mean
score than schools in Kampong Cham for extracurricular activities in science, but a
significantly lower mean score for future plan in science, science and mathematics teachers’
support, and interactive science and mathematics lessons. Moreover, schools in Phnom Penh
performed better than schools in Battambang for performance in science and mathematics,
science as a practical subject, and extracurricular activities in science, but lower for science
and mathematics teachers’ support and interactive science and mathematics lessons. From the
standpoint of provinces, schools in Kampong Cham performed significantly higher than
schools in Battambang for performance in science and mathematics, science and mathematics
self-efficacy, science as a practical subject, science and mathematics self-concepts, interest in
science activities outside school, future plan in science, and science and mathematics
teachers’ support in science. Similar trends could be seen in Observation 2. However, there
was an increase in effect size from the first observation, particularly for science and
mathematics self-efficacy, extracurricular activities in science, future plan in science, science
159
and mathematics teachers’ support, and interactive science and mathematics lessons. This
phenomenon highlighted the different effects of school location/condition in enhancing the
constructs under investigation.
First, there were moderate effects of different school locations on science and mathematics
teachers’ support in science. Science and mathematics teachers at schools in the provinces
provided more support in science to students than teachers from schools in Phnom Penh. The
effect size increased from the first to the second observation. This reflected the influence of
science and mathematics teachers on students’ interest in science. This study was consistent
with other contexts, which highlighted that teachers influence how students think about their
self-efficacy in the subjects, as well as change students’ beliefs about the consequences of
choosing science (e.g., Gaskell et al., 1993; Lindner et al., 2004; Myeong, et, al. 1991;
Woolnough, 1994a). Contextually, there are a few anecdotes to explain this phenomenon.
First, students in the provinces might perceive that science and mathematics majors as being
more oriented towards becoming science and mathematics teachers. Since they see their
science and mathematics teachers as their role models, they tended to approach their teachers
for more support and advice for the school-to-work transition. The qualitative interviews
confirmed this phenomenon. Remarks included, “You could approach me any time I am just
your teacher.” and “My teacher encouraged me to take science”. Second, students in the
provinces may have closer relationships with their teachers than those in Phnom Penh.
Next, schools in Kampong Cham Province tended to have higher support from science and
mathematics teachers, which might be due to a few reasons. First, as mentioned earlier,
science and mathematics teachers at upper secondary school in the provinces tend to provide
higher support to the students. Second, there is one NGS located in this province. Based on
the characteristics of the NGS, teachers should have more time to interact with the students
both in and outside the classroom activities. As stated in the policy on NGS, one objective of
this school is to expand educational services for Cambodian youth, including career
counselling services, differentiated learning channels (e.g., project work, subject clubs),
mobile learning, and life skills education (MoEYS, 2016c). With this objective, students from
NGS might have more advantages than those from traditional upper secondary schools in
accessing interactive sessions/time with their teachers, especially in guiding their career
pursuits.
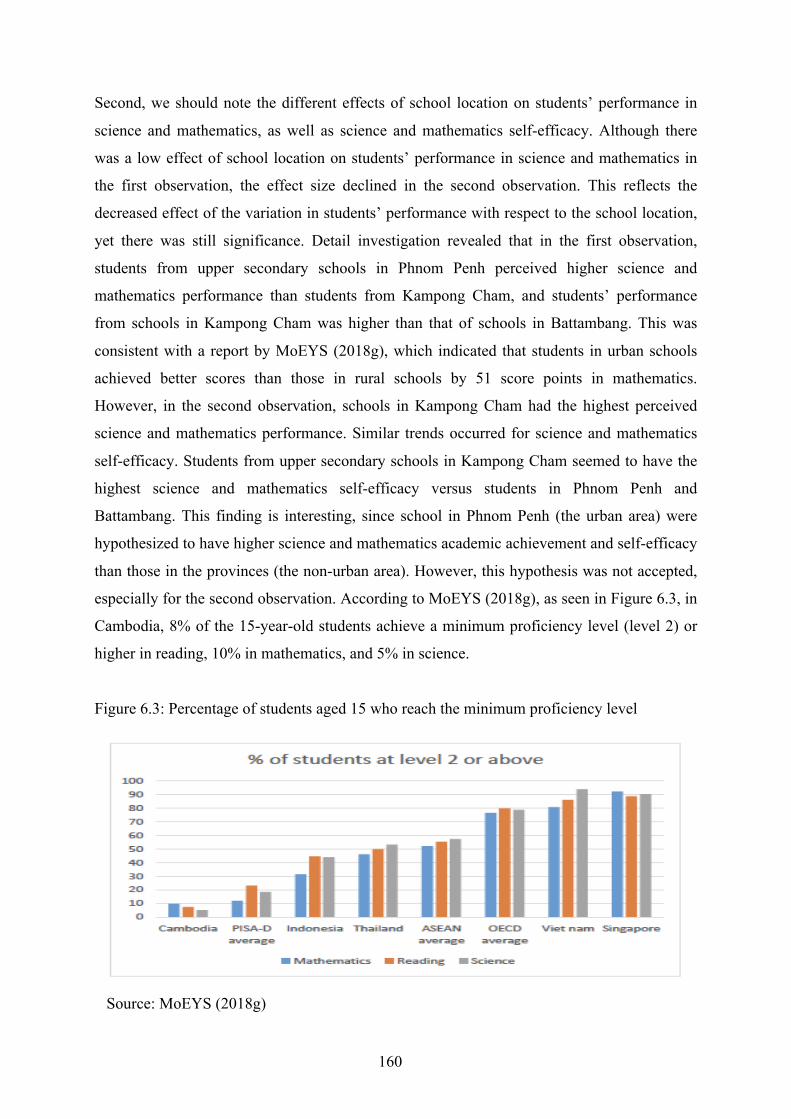
160
Second, we should note the different effects of school location on students’ performance in
science and mathematics, as well as science and mathematics self-efficacy. Although there
was a low effect of school location on students’ performance in science and mathematics in
the first observation, the effect size declined in the second observation. This reflects the
decreased effect of the variation in students’ performance with respect to the school location,
yet there was still significance. Detail investigation revealed that in the first observation,
students from upper secondary schools in Phnom Penh perceived higher science and
mathematics performance than students from Kampong Cham, and students’ performance
from schools in Kampong Cham was higher than that of schools in Battambang. This was
consistent with a report by MoEYS (2018g), which indicated that students in urban schools
achieved better scores than those in rural schools by 51 score points in mathematics.
However, in the second observation, schools in Kampong Cham had the highest perceived
science and mathematics performance. Similar trends occurred for science and mathematics
self-efficacy. Students from upper secondary schools in Kampong Cham seemed to have the
highest science and mathematics self-efficacy versus students in Phnom Penh and
Battambang. This finding is interesting, since school in Phnom Penh (the urban area) were
hypothesized to have higher science and mathematics academic achievement and self-efficacy
than those in the provinces (the non-urban area). However, this hypothesis was not accepted,
especially for the second observation. According to MoEYS (2018g), as seen in Figure 6.3, in
Cambodia, 8% of the 15-year-old students achieve a minimum proficiency level (level 2) or
higher in reading, 10% in mathematics, and 5% in science.
Figure 6.3: Percentage of students aged 15 who reach the minimum proficiency level
Source: MoEYS (2018g)
161
With low science and mathematics performance, together with the diverse characteristics of
upper secondary schools in the urban and rural areas regarding the quality of teachers
(MoEYS, 2018h), the availability of teaching resources and school culture might also
contribute to the diverse science and mathematics performance and self-efficacy levels
relative to different locations (Woolnough, 1994b). Bandura (1986) indicated that there are
four primary sources of science and mathematics self-efficacy, one of which is the academic
achievement. Hence, as the students’ performance in science and mathematics increased in
upper secondary school in Kampong Cham, their science and mathematics self-efficacy might
also increase. There might be one yet interesting fact to explain this phenomenon. According
to the results of the national baccalaureate examination in 2019, among the three sampled
provinces, Kampong Cham got the highest percentage of the student passing rate on the
national examination. As evidence, 66.72% of the grade 12th students passed the examination
while there were 57.88% and 64.63% of the students passed the national examination in
Phnom Penh and Battambang, respectively (MoEYS, 2019d).
Third, there has been an interesting discourse among researchers on the different patterns of
students’ attitudes towards science relative to geographic region. Unlike what has been
debated, this current study found that students from non-urban areas had higher positive
attitudes towards science constructs than students from urban areas (Anwer, et al., 2012;
George, 2000; Serin & Mohammadzadeh, 2008). Rather, the current study confirmed some
other studies (see, for example, Hammrich, 1998; Zacharia & Barton, 2004), that due to
environmental advantages, students from urban zones usually have higher attitudes towards
science than students from non-urban areas. These results reflect the contextual reality that
since students from the urban areas are presumed to be at an advantages in accessing more
science interest-driven activities and facilities, students from these places are more likely to
express higher attitudes towards science in the long run. The quality of mathematics and
science instruction is impacted not only by the teacher quality, but also by access to quality
materials and the curriculum (Eng & Szmodis, 2015). Thus, students with more access to
quality science and mathematics lessons might be more likely to have higher attitudes towards
science than those who do not. Schools in Phnom Penh and Kampong Cham performed better
than schools in Battambang, especially regarding science as a practical subject and
extracurricular activities in science.
162
Contextually, there are a few, yet interesting facts to explain this phenomenon. First, there are
NGS in these two provinces. As stated in the NGS policy (MoEYS 2016c), one of the main
goals of NGS is to introduce STEM and inquiry-based or project-based teaching. Therefore,
interactive science and mathematics lessons and practical work in science, characteristics that
are embedded in inquiry-based teaching, are much more common in NGS than in traditional
schools. Second, the school facilities of NGS—from lab experiments and teaching and
learning facilities to other extracurricular facilities—are essential to their characteristics
(MoEYS 2018e). Therefore, these aspects might become advantages for NGS students in
these two provinces, leading them to have higher scores on the constructs than students from
traditional upper secondary schools in Battambang Province.
Fourth, it is indispensable to highlight the effect of school location on students’ future plan in
science. Overall, in both observations, students from upper secondary schools in non-urban
areas had higher future plan in science than those from the urban area. Although in the first
observation, schools in Phnom Penh seemed to perform better than schools in Battambang,
the effect decreased such that their students were among the lowest groups willing to pursue
science in the future. The effect size increased to .03 in the second observation. In a broader
sense, this result was consistent with the review of the students’ attitudes, for which future
plan in science was included as a construct, with reference to the nationality perspective,
whereby developing countries exhibited higher attitudes towards science than developed
nations (Ye, et al., 1998). Further, students from non-urban areas have higher attitudes
towards science than students from urban areas (Anwer et al., 2012; George, 2000; Serin &
Mohammadzadeh, 2008, Kao, 2019a). These results come as a surprise, since the latter are
presumed to be at an advantage in accessing more science interest-driven activities and
facilities. However, in the Cambodian context, there might be a few interesting anecdotes to
explain this phenomenon. First, it is generally believed that science subjects are more oriented
to becoming science teachers at upper secondary school. Also, because students need to adjust
to the norms of their parents (especially from those non-urban areas), who believed that
becoming a teacher is one of the most secure and permanent jobs (i.e., civil servants), they are
more likely to exhibit higher future plan in science in the long run.
Another possible explanation is that non-urban students consider science subjects to be ideal
for a better future and to have a higher socio-economic status (Anwer et al., 2012; OECD,
2016). Therefore, non-urban students showed significantly higher future plan in science than
163
urban students. On top of this, one of the striking differences between urban and non-urban
students was self-interest in science and science activities, with (M = 3.36, SE = .04) among
the former and (M = 3.44, SE = .04) among the later. This might be due to the fact that non-
urban students are exposed more to a natural environment in which they can discover more to
enhance their attitudes towards science in general, and their future plan in science in
particular, compared to their urban counterparts.
Last but not least, interactive science and mathematics lessons were perceived differently
relative to school location. Simply said, students from schools in the non-urban areas
(Kampong Cham and Battambang) perceived that their science and mathematics lessons were
more interactive than students from schools in the urban area (Phnom Penh). These
differences occurred for both the first and second observations; from observations 1 to 2, the
effect size changed from .04 to .09.
The finding is surprising, since the students from schools in the urban area has more
advantages in accessing more qualified teachers and more interactive teaching facilities. This
unexpected result can be explained by a few anecdotes. First, the selected upper secondary
schools in Kampong Cham were the so-called NGS and the Resource Upper Secondary
Schools. Empirically, the STEM-focused upper secondary schools student attendance
enhanced interactive science and mathematics lessons compared to their counterpart schools.
Teachers in STEM-focused schools were encouraged to implement interactive teaching and
learning methods in the classrooms, including project-based learning, inquiry-based learning
engaging STEM teaching, and real-world STEM experiences (Bicer et al., 2015; Mean et al.,
2016). Seemingly, inquiry and thinking were highly valued and discussed within schools, but
inquiry-based learning as pedagogy varied greatly in implementation across schools and
disciplines. Teachers and students developed strong social interactions through group work,
small school relationships, and peer teaching and learning, leading to higher learning
outcomes in STEM-focused schools (Morrison et al., 2015). Second, one selected school in
Battambang was a resource school. Secondary resource schools also have advantages in
accessing teaching and learning facilities which could enhance science and mathematics
teaching instruction. This school was reformed to have students streamed into the classes of
mathematics, physics, and Khmer literature. After this reform, in academic year 2018–2019,
students gained an increased number of learning hours in science and mathematics to double
the normal school’s learning hours.
164
6.5.4 Study track matters, yet it has a small effect
The bifurcation of science and the social science and the NGS exerted significant effects on
all time-varying covariates in both the first and second observations. It is interesting to note
that although NGS was hypothesized to have a larger effect than the science track of
traditional upper secondary school, there was no significant difference between these two
tracks for the constructs of science and mathematics self-efficacy, science and mathematics
outcome expectations, science and mathematics self-concepts, interest in science at school,
science activities outside school, future plan in science, and science and mathematics
teachers’ support. However, based on the strength of the effects, there are some interesting
findings to be highlighted.
First, it is undeniable to highlight the effect of attending in different tracks on students’
performance in science and mathematics as well as on science and mathematics self-efficacy.
First, from the academic achievement perspective, it was found that students in NGS and in
the science track at traditional upper secondary schools perceived higher performance and
self-efficacy than students in the social science. This finding was in line with a broader
perspective whereby students at STEM-focused upper secondary schools outperform their
counterparts in traditional schools on mathematics and reading tests (Becker & Park, 2011;
Bicer et al., 2015; Bicer et al., 2018; Han et al., 2016; Judson, 2014; Mean et al. 2016;
Morrison et al., 2015; Scott 2012). STEM-focused schools can strengthen students’ science
and mathematics self-efficacy (Baran & Maskan, 2010), but their impact gradually declines
(Zeng, Yao, Gu, & Przybylki, 2018). From a narrower perspective, the current study
confirmed what other studies have found: Since students in the science track are more
exposed to more science and mathematics courses at upper secondary school, they are more
likely to have better achievement and higher self-efficacy in science and mathematics. This
finding is not surprising and reflects the contextual reality of Cambodia. Students in NGS and
the science track are exposed to more science and mathematics subjects than student in the
social science track.
While the focus of the science track is on mathematics and science subjects (physics,
chemistry, biology, and earth-environmental science) the social science track centres on
Khmer literature, history, geography, and moral civics (MoEYS, 2010; MoEYS, 2018c). In
NGS, the number of teaching hours for mathematics and other science subjects (physics,
165
chemistry, biology, and computer science) was increased to six and four hours weekly,
respectively. The total number of instructional hours is 34 hours a week for primary schools,
and 40 hours a week for secondary schools. This required increase in instructional time is
meant to provide students access to special subject themes that focus on STEM subjects,
foreign languages, or other areas of interest to the local community. Also, students in NGS
are streamed into mathematic, physics, chemistry, or biology classes (specialised class), since
the higher number of instructional hours is ultimately meant to encourage more students to
enrol in STEM-related fields in higher education. The increases teaching hours (which
increased the students’ exposure to science and mathematics subjects) and the focus on each
science and mathematics class in NGS might lead higher students’ performance and self-
efficacy in science and mathematics subjects among those in the science track and NGS
(versus students in the social science track).
Second, the tracking system at upper secondary school exhibited a significant impact on
attitudes towards science constructs, including science as a practical subject, science and
mathematics self-concepts, and interest in science at school. Students in the science track
indicated significantly higher positive attitudes towards science than students in the social
science track. However, it is surprising to note that there was no significant difference
between students in NGS and student in the science track in traditional schools for the
constructs of science and mathematics self-concepts, the importance of science in society, and
interest in science activities at school. This finding corroborated with other research (George,
2006; Myeong, et al., 1991; OECD, 2016; Simpson & Oliver, 1990) that revealed that the
number of science and mathematics classes taken at school is positively linked to one’s
attitudes towards science.
Contextually, according to announcement #23 of MoEYS, students in the science track need
to take five hours/sessions of mathematics per week, while students in the social science only
need to take two hours/sessions per week. Thus, greater exposure to science and mathematics,
especially on the practical work of science, had a greater influence on students’ positive
attitudes towards science. Second, NGS employ more interactive teaching methods, such as
inquiry-based or project-based learning (Bicer et al., 2015; Mean et al., 2016). These
approaches not only foster active interest and interactions among teachers and students, but
also involve more practical work in science (experiments) and engage students in their
classroom activities (Keselman, 2003; National Research Council, 2000). Notably, the current
166
study also confirmed recent studies that students’ involvement in STEM extracurricular and
out-of-school activities are common in STEM-focused upper secondary schools versus their
traditional counterparts (Mean et al., 2016; Sahin, 2013).
Third, it is indispensable to highlight the effect of tracking on students’ future plan in science.
Students from the science track have stronger future plan in science than their peers in the
social science track. However, students from NGS had lower future plan in science than
students in the science track. This finding confirms that future participation in science is
higher in STEM-focused schools (Kao & Shimizu, 2019; Shim & Park, 2013; Tofel-Grehl &
Callahan 2014; Wang & Lee, 2019). Some researchers (George, 2006; Myeong, et al., 1991;
OECD, 2016; Simpson & Oliver, 1990) have asserted that the number of science and
mathematics classes taken in different tracks at school is positively linked to the level of
attitudes towards science in general, and future participation in science in particular. While
students in NGS are exposed to more science and mathematics classes, their participation in
science after finishing upper secondary education is lower than students in the science track in
traditional schools. There might be a few anecdotes to explain this phenomenon. First, some
students might not attend NGS to build their future plan in science, but rather to build their
capacity in general. One student from NGS said, “I have never thought about science or social
science; I just want to study”. Second, students from NGS might not have a clear plan for
their future majors.
6.5.5 The effects of tracking across the two observations
The results across the two observations revealed that performance in science and
mathematics, science and mathematics self-efficacy, science and mathematics self-concepts,
the importance of science in society, interest in science at school, science activities outside
school, extracurricular activities in science, and family encouragement and support increased
from observations 1 to 2. However, there were decreasing trends for future plan in science
and science and mathematics teachers’ support in science. Based on the value of Cohen’s d
effect size, although there was a statistically significant difference across the two
observations, only a few of the constructs had a small effect (extracurricular activities in
science, performance in science and mathematics, family encouragement and support, science
and mathematics self-concepts, and future plan in science) while the other had a very small
effect in enhancing the constructs.
167
First, the increasing trend of extracurricular activities in science, a sub-construct of attitudes
towards science, had one of the strongest effect sizes. The mean score increased from (M =
2.51) in the first observation to (M = 2.74) in the second observation. The effect size of d =
.27 indicated a small effect. Also, science and mathematics self-concepts, another construct of
attitudes towards science, exhibited a small effect (d = .17) of the increasing trend from
observations 1 to 2. This finding showed a contrasting trend with the finding by George
(2006), Hacieminoglu (2016), and Simpson and Oliver (1990), who discovered that students’
attitudes towards science declined from the lower secondary school to the upper secondary
school years. Since attitudes towards science are related to the science classes students take,
this decline might be related to the type of science courses they take in each grade (Simpson
& Oliver, 1990). In the Cambodian context, while students in grade 10th take the same
number of science and mathematics lessons, students take a different number of science and
mathematics lessons in grade 11th. Also, since students in grade 11th of NGS have a higher
number of science and mathematics lessons, their attitudes towards science in general and
attitudes towards extracurricular activities, as well as science and mathematics self-concepts,
might also increase. Surprisingly, although there exhibited an increasing trend, the size of the
effect was small. This might have little effect on enhancing students’ aspirations of STEM
majors in higher education.
Second, despite a small effect (with an effect size of d =.25), performance in science and
mathematics increased from the first observation (M = 2.36) to the second observation (M =
2.50). Given this small increase, the finding was consistent with what the PISA-D assessment
revealed: the students had a minimum proficiency level 2 (level 2 is the baseline competency
level of the 6 levels of PISA-D or PISA), in line with the competency level that is the UN
Sustainability Development Goad (SDG) #4 on Education (MoEYS, 2018g). Specifically,
only 10% and 5% of students achieved the minimum proficiency level in mathematics and
science, respectively.
Third, there is a statistically significant increase of perceived family encouragement and
support in science from observations 1 to 2. The effect size was d =.18 which denoted a small
effect. Family encouragement and support are crucial in students’ lives including their
educational choices (Simpkins et al., 2015). This might be unique in Asian culture, where
family influence still weighs heavily in students’ academic choice. Thus, the finding extends
the understanding of culturally embedded phenomena in context, whereby students are prone
168
to listening to parental advice, as parents are a primary source of academic and financial
support (Bieri Buschor, Berweger, Keck Frei, & Kappler, 2014). As students moved up in
grade level, their need for academic and financial supports also increased. Eng and Szmodis
(2015) highlighted that with less than 2% of students enrolling in the sciences, it is reasonable
to assume that many parents and students do not see the value of majoring in science when
exploring profitable, prestigious career options. However, if parents and students are educated
on the value of science as a discipline and lucrative future career choices, especially for
females, there may be an increase in science as a major in higher education. The results of the
qualitative interviews also triangulated the quantitative findings. In pursuing science, students
need a lot of supports and encouragements from their parents because they need to spend both
time and money on their studies. One respondent mentioned, “When I am working on a
project, I need to spend money on equipment, and I need time to do the project”.
Future plan in science exhibited a worrisome declining trend from the end of grade 10th to the
end of grade 11th, although the trend had a small effect size of d = .16. This finding is
consistent with other studies (e.g., Chonkaew, Sukhummek, Faikhamta, 2016; George, 2006;
OECD, 2016; Simpson & Oliver, 1990); that is, attitudes towards science generally declined
throughout middle and high school. The most alarming trend is students’ future participation
in science. Empirically, students who were exposed to more science and mathematics classes
were more likely to have higher participation in science or STEM in higher education.
Nonetheless, this study seemed surprising as students who were exposed to more science and
mathematics classes throughout the grade levels tended to decrease their level of future
participation in science. The finding might be explained by a few interesting facts. First, the
decline could be due to a lack of support from science and mathematics teachers. Teachers are
encouraged to implement student-centered approaches (including inquiry or project-based
learning) in which students are engaged in the learning process and motivated to be interested
in science (Bicer et al., 2015). However, it was found that there was no significant change in
interactive science and mathematics lessons across tracks throughout one academic year span.
Empirically, it was also revealed that inquiry is not often used by primary (MoEYS, 2019b)
and traditional upper secondary school science teachers, who are more teacher-centered (Sar,
2014) with little student interaction, teamwork, or problem-solving (World Bank, 2012).
Thus, the variation in employing these approaches among Cambodian upper secondary school
teachers might contribute to the phenomenon.
169
The investigation of the marginal means of the patterns of time-varying covariates, as a
function of observation and study track, exhibited different trends of the constructs of the
social science track, the science, and the NGS track across the two observations. There were
both within and between group variations for the values of the constructs. Overall, students
from NGS performed higher than students in the science track, and students in the science
track performed better than students in the social science track. Based on the size of the effect,
the notable effects were on future plan in science, performance in science and mathematics,
extracurricular activities in science, family encouragement and support in science, science and
mathematics self-concepts, science as a practical subject, and science and mathematics self-
efficacy. Specifically, it is surprising to observe that future plan in science of the NGS and
science track students decreased from observations 1 to 2, while the trend of student in the
social science track slightly increased. This reflects a social problem; while most students
chose the science track at upper secondary school, their participation in science or STEM
majors in higher education decreased. This finding is in line with the long-term widespread
decline in interest in science, which Dainton (1968) termed the phenomena as “swing from
science”. This declining trend might also be explained by the shrinking support from science
and mathematics teachers. As evidenced in the current study, support from science and
mathematics in both the NGS and the science track decreased from observations 1 to 2. The
trend was higher for students in the NGS than students in the science track of traditional
schools.
Last, regarding performance in science and mathematics, NGS students outperformed
students in the science track and social science track. However, there was a slight falling trend
from observations 1 to 2, but the opposite trend for students in the science track and social
science track. This trend might be contributed by the perceived declining trend of science as a
practical subject. Moreover, NGS students employed more practical work in science subjects
than students in the other two tracks. Third, there was between group and within group
variation for extracurricular activities in science, with NGS students having the most
advantages. Simply put, NGS students outscored students in the other two tracks (science and
social science). The gap was even larger in the second observation. This finding is consistent
with the unique characteristics of the so-called STEM focused schools. Students’ involvement
in STEM extracurricular and out-of-school activities, and interest in science careers and
aspirations were significantly higher for student in STEM-focused schools than their non-
STEM counterparts (Mean et al. 2016; Sahin 2013). More interestingly, similar trends
170
occurred for the other two constructs of attitudes towards science: science and mathematics
self-concepts and science as a practical subject. NGS students were exposed to more
extracurricular activities in science including the STEM Bus, the STEM festival, and a robotic
competition. This might have contributed to the higher score for extracurricular activities in
the science participation of the students from NGS compared to their counterparts.
6.6 Concluding remarks
The students had a high level of science and mathematics outcome expectations, science as a
practical subject, and the importance of science in society. However, science and mathematics
self-efficacy, science and mathematics self-concepts, interest in science at school, science
activities outside school, extracurricular activities in science, future plan in science, support
from science and mathematics teachers, and interactive science and mathematics lessons were
at a moderate level. Performance in science and mathematics was at a low level. More
interesting, regarding patterns, there was no significant difference between males and females
for most of the constructs. However, there was a significant difference between schools and
study tracks. Simply said, schools in Kampong Cham tended to have a higher mean score on
most of the constructs than schools in Phnom Penh and Battambang. Students from NGS
tended to have a higher score than students in the other tracks (science and social science).
Across one academic year span, students had uneven trends across the constructs. Some
constructs exhibited increasing trends, while the other constructs showed a decreasing trend.
This varied according to the covariates of gender, school location, and study track. This result
could be concluded that, across one academic year span, although there was a significant
influence of different tracks on the time-varying covariates, the tracks had small effects on
improving the constructs, which influenced students’ choice of the science track at upper
secondary school and transition into STEM majors in higher education. The effect was in a
negative trajectory for students’ future plan in science. Surprisingly, there was no effect of
different tracks on interactive science and mathematics lessons across the two observations.
The trends and patterns of the constructs should also be considered from the angles of gender
and school location.
171
CHAPTER SEVEN: ASPIRATIONS OF STEM MAJORS: FINDING III
Little is known about the actual effects of tracking system at the Cambodian upper secondary
school level on students’ aspirations of STEM majors in higher education. Thus, building
upon the previous chapter on the effects of different tracks on trends of time-varying
covariates and served as the main purpose of the current study, this chapter highlights the
effects of tracking between the social science and science tracks at traditional upper
secondary school, and the science track at new generation upper secondary schools and the
other multi-dimensional variables (individual, family, and school) on students’ aspirations of
STEM majors in higher education. The chapter begins with the main question that guided the
investigation in this chapter, followed by the method (samples and data analysis). Results,
discussion, and a brief conclusion responding to Research Question 3 come to serve as the
closing section of this chapter.
In this chapter, the researcher addressed the following research question as follow.
RQ 3: What are the effects of the tracking system and other variables on Cambodian
upper secondary school students’ aspirations of STEM majors?
7.1 Method for RQ 3
7.1.1 Samples
The data for Research Question 3 was the second wave data collected from 700 late grade
11th students (males = 310, females = 390) from nine upper secondary schools in Phnom Penh
(N = 330) and two provinces (N = 370) (Kampong Cham and Battambang, located 124 and
291 kilometers from Phnom Penh, respectively). One significant justification for selecting this
sample was that according to MoEYS (2010), by the end of 10th grade, students must choose to
study in either the science track or social science track for their 11th and 12th grades. From this
academic decision, the 11th grade students might have developed a clearer picture of what the
science and social science tracks mean, and been able to sensitize the consequences of their
track choice on higher education major. Furthermore, Simpkins et al. (2015) claimed that
upper secondary school is the first time when students could drop out of science coursework,
which could inadvertently close the doors to STEM opportunities. As such, any intervention
should begin at this point.
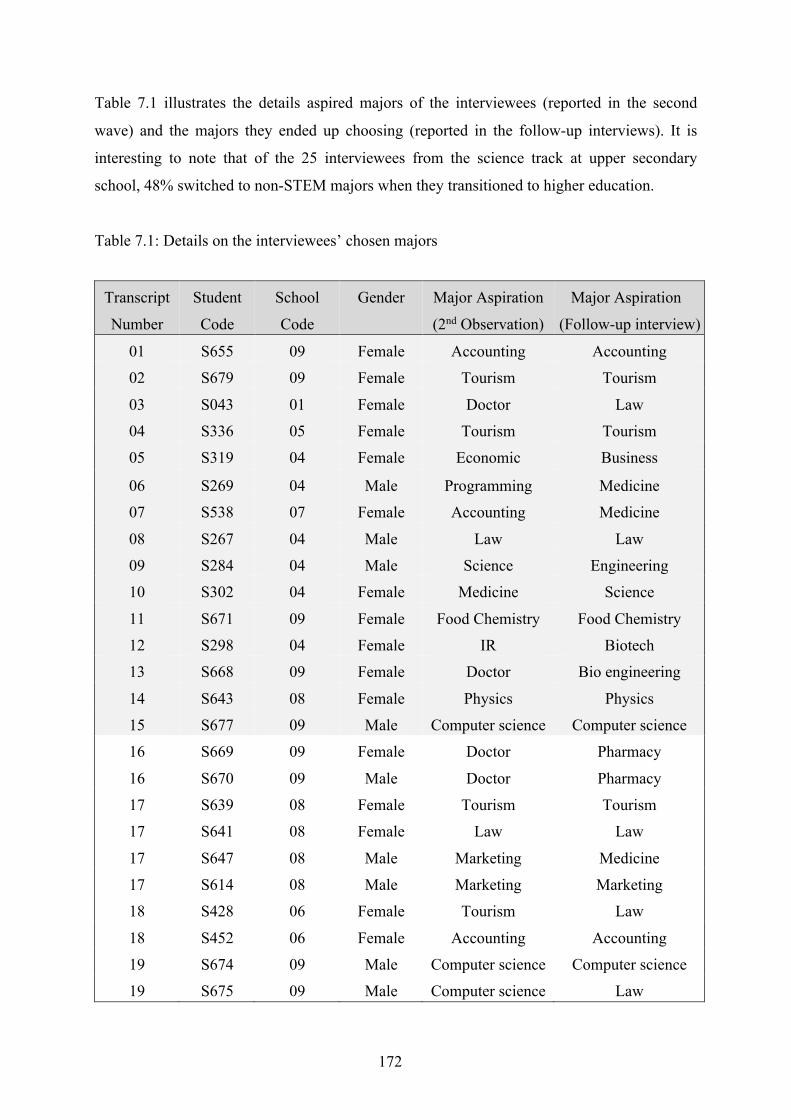
172
Table 7.1 illustrates the details aspired majors of the interviewees (reported in the second
wave) and the majors they ended up choosing (reported in the follow-up interviews). It is
interesting to note that of the 25 interviewees from the science track at upper secondary
school, 48% switched to non-STEM majors when they transitioned to higher education.
Table 7.1: Details on the interviewees’ chosen majors
Transcript
Number
Student
Code
School
Code
Gender Major Aspiration
(2nd Observation)
Major Aspiration
(Follow-up interview)
01 S655 09 Female Accounting Accounting 02 S679 09 Female Tourism Tourism
03 S043 01 Female Doctor Law 04 S336 05 Female Tourism Tourism 05 S319 04 Female Economic Business
06 S269 04 Male Programming Medicine 07 S538 07 Female Accounting Medicine
08 S267 04 Male Law Law 09 S284 04 Male Science Engineering 10 S302 04 Female Medicine Science
11 S671 09 Female Food Chemistry Food Chemistry 12 S298 04 Female IR Biotech 13 S668 09 Female Doctor Bio engineering
14 S643 08 Female Physics Physics 15 S677 09 Male Computer science Computer science 16 S669 09 Female Doctor Pharmacy
16 S670 09 Male Doctor Pharmacy 17 S639 08 Female Tourism Tourism 17 S641 08 Female Law Law
17 S647 08 Male Marketing Medicine 17 S614 08 Male Marketing Marketing 18 S428 06 Female Tourism Law
18 S452 06 Female Accounting Accounting 19 S674 09 Male Computer science Computer science 19 S675 09 Male Computer science Law
173
7.1.2 Data analysis method
To address Research Question 3, which aimed to investigate the effects of tracking and the
other three-dimension variables on students’ aspirations of STEM majors in higher education,
Hierarchical Linear Modeling 8 (HLM-8) was employed to analyze the data structure, where
700 students (Level-1) were nested within 21 classes (Level-2). Hierarchical Linear Modeling
was employed instead of Binary Logistic Regression because the researcher aimed to
investigate if there were any class differences when students were nested in different classes.
In a sense, the practices in the science track and social science tracks might have had different
levels of influence on students’ aspirations of STEM majors in higher education. Put simply,
of the specific interest were the relationships among Cambodian upper secondary school
students’ aspirations of STEM majors (the outcome variable in level-1) and individual
students’ ability and motivational beliefs, and family background and encouragement (level-1
predictor variables) and their track, experience, and support in science and mathematics
classrooms (level-2 predictor variables). While logistic regression is also appropriate for
analyzing student-level data, a single-level regression analysis is considered to have breached
a number of assumptions when applied to multi-level/nested data. A single-level regression
analysis, when used with data that are highly structured at different levels, likely produces a
much-biased estimation of the resultant standard errors in the analysis (Type I error;
Raudenbush et al., 2019; Woltman et al., 2012)
A multi-level model is highly suggestive because it accounts for the shared variance in
hierarchically structured data. It accurately estimates the lower level slope and its estimation
of higher-level outcome (Woltman et al., 2012). In addition, multi-level analysis was the most
appropriate for this study since the data had nested and hierarchical structures. Each student
was nested within each class. Therefore, predictor variables at level-1 were, in principle,
nested within level-2. Prospective data consisted of independent variables or predictors
variables which were organized in two hierarchical levels: individual (family background
included) and upper secondary school.
To analyze the data, model testing proceeded in four phases (Raudenbush et al., 2019;
Woltman et al., 2012): (1) unconditional (null) model (only the outcome variable was
included in the model); (2) the random intercepts model (only level-1 variables); (3) the
means-as-outcomes model (only level-2 variables); and (4) the random intercepts and slopes
174
model (the final model of level-1 and level-2 variables). Because the outcome variable was
dichotomously coded (STEM versus non-STEM majors), Bernoulli Method with Restricted
Maximum Likelihood Method (RMLM) of estimation was employed to analyze the nested
data structure. This main research question aimed to determine the effects of tracking and
individual, family, and upper secondary school-related factors on Cambodian upper secondary
school students’ aspirations of STEM majors in higher education. This question involved a
hierarchy with two levels. Classroom-level related variables were at the highest level (level-2)
which included predictor variables such as the tracking system, science and mathematics
teachers’ support, and interactive science and mathematics lessons. Level-1 variables
consisted of measurements on gender, hours spent self-studying science, academic
achievement, performance in science and mathematics, science and mathematics outcome
expectations, science and mathematics self-efficacy, future plan in science, constructs of
attitudes towards science (science as a practical subject, science and mathematics self-
concepts, the importance of science in society, science activities outside school, and
extracurricular activities in science). This level also included predictor variables related to
individual students’ family characteristics such as father’s education, mother’s education,
relative’s majors, family income, and family encouragement and support). Level-1 variables
at the lowest level of the hierarchy were nested with level-2 groups and shared the influence
of level-2 variables. The outcome variable, aspirations of STEM majors, was also measured at
level-1. In principal, the outcome variable should always be located at the lowest level of the
hierarchy in the HLM model (Raudenbush et al., 2019).
As briefly stated, the two-level HLM analysis started with a null model to examine the
amount of variability in the Cambodian upper secondary school students’ aspirations of
STEM majors that was attributable to students and classroom levels (Raudenbush et al., 2019;
Woltman et al., 2012). The null model estimated the variances of the “intercepts” at all the
two levels and contained no predictor variable from any level. The intercept represented the
mean scores of students’ aspirations of STEM majors for each class. According to
Raudenbush et al. (2019) and Woltman et al. (2012), the first step of HLM is to evaluate the
level-2 variance components in order to determine if there is statistical justification for
running HLM analyses. The null model produced the chi-square tests of the between-class
variance components, which evaluated whether there were statistically significant differences
in the students’ aspirations of STEM majors in higher education across level-2, that was
between the classes the students were in (Woltman et al., 2012).
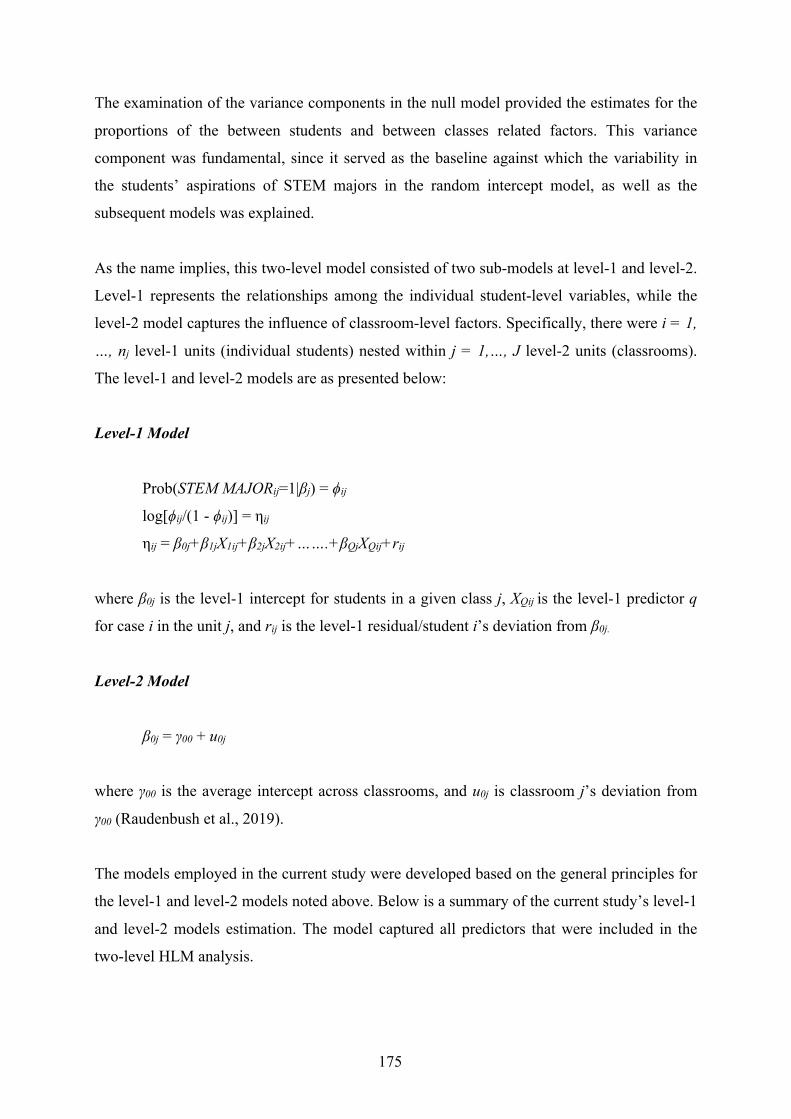
175
The examination of the variance components in the null model provided the estimates for the
proportions of the between students and between classes related factors. This variance
component was fundamental, since it served as the baseline against which the variability in
the students’ aspirations of STEM majors in the random intercept model, as well as the
subsequent models was explained.
As the name implies, this two-level model consisted of two sub-models at level-1 and level-2.
Level-1 represents the relationships among the individual student-level variables, while the
level-2 model captures the influence of classroom-level factors. Specifically, there were i = 1,
…, nj level-1 units (individual students) nested within j = 1,…, J level-2 units (classrooms).
The level-1 and level-2 models are as presented below:
Level-1 Model
Prob(STEM MAJORij=1|βj) = ϕij
log[ϕij/(1 - ϕij)] = ηij
ηij = β0j+β1jX1ij+β2jX2ij+…….+βQjXQij+rij
where β0j is the level-1 intercept for students in a given class j, XQij is the level-1 predictor q
for case i in the unit j, and rij is the level-1 residual/student i’s deviation from β0j.
Level-2 Model
β0j = γ00 + u0j
where γ00 is the average intercept across classrooms, and u0j is classroom j’s deviation from
γ00 (Raudenbush et al., 2019).
The models employed in the current study were developed based on the general principles for
the level-1 and level-2 models noted above. Below is a summary of the current study’s level-1
and level-2 models estimation. The model captured all predictors that were included in the
two-level HLM analysis.
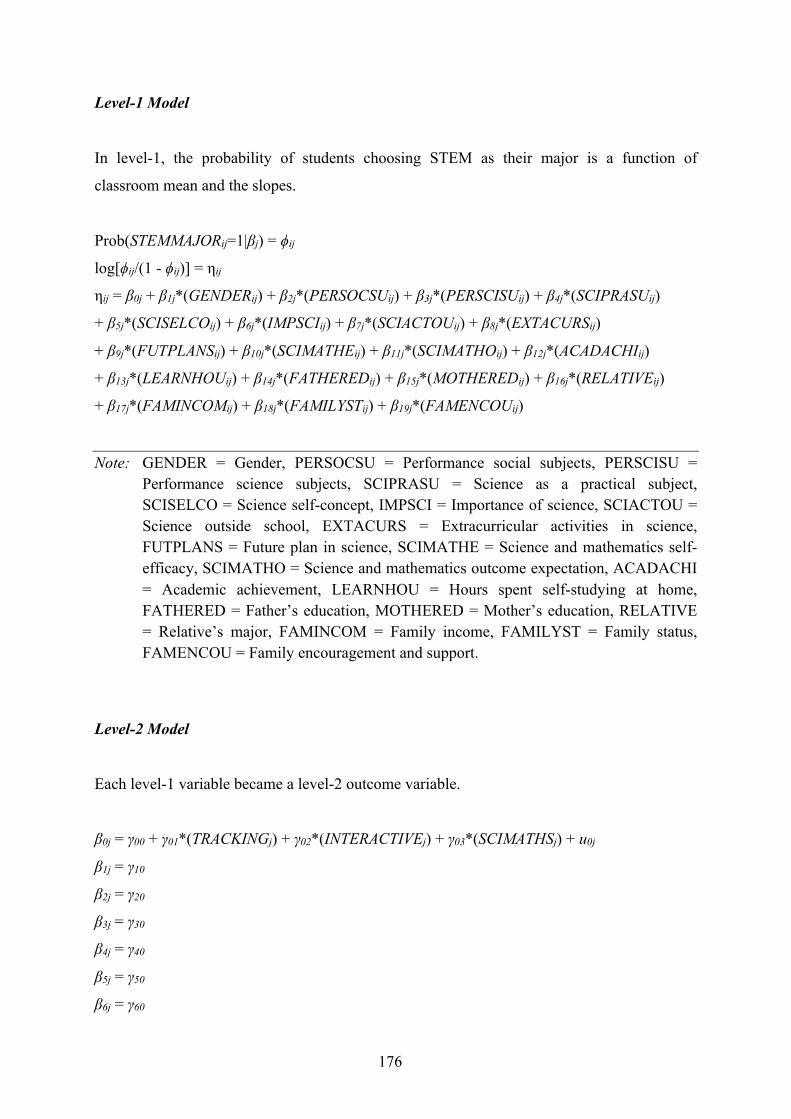
176
Level-1 Model
In level-1, the probability of students choosing STEM as their major is a function of
classroom mean and the slopes.
Prob(STEMMAJORij=1|βj) = ϕij
log[ϕij/(1 - ϕij)] = ηij
ηij = β0j + β1j*(GENDERij) + β2j*(PERSOCSUij) + β3j*(PERSCISUij) + β4j*(SCIPRASUij)
+ β5j*(SCISELCOij) + β6j*(IMPSCIij) + β7j*(SCIACTOUij) + β8j*(EXTACURSij)
+ β9j*(FUTPLANSij) + β10j*(SCIMATHEij) + β11j*(SCIMATHOij) + β12j*(ACADACHIij)
+ β13j*(LEARNHOUij) + β14j*(FATHEREDij) + β15j*(MOTHEREDij) + β16j*(RELATIVEij)
+ β17j*(FAMINCOMij) + β18j*(FAMILYSTij) + β19j*(FAMENCOUij)
Note: GENDER = Gender, PERSOCSU = Performance social subjects, PERSCISU = Performance science subjects, SCIPRASU = Science as a practical subject, SCISELCO = Science self-concept, IMPSCI = Importance of science, SCIACTOU = Science outside school, EXTACURS = Extracurricular activities in science, FUTPLANS = Future plan in science, SCIMATHE = Science and mathematics self-efficacy, SCIMATHO = Science and mathematics outcome expectation, ACADACHI = Academic achievement, LEARNHOU = Hours spent self-studying at home, FATHERED = Father’s education, MOTHERED = Mother’s education, RELATIVE = Relative’s major, FAMINCOM = Family income, FAMILYST = Family status, FAMENCOU = Family encouragement and support.
Level-2 Model
Each level-1 variable became a level-2 outcome variable.
β0j = γ00 + γ01*(TRACKINGj) + γ02*(INTERACTIVEj) + γ03*(SCIMATHSj) + u0j
β1j = γ10
β2j = γ20
β3j = γ30
β4j = γ40
β5j = γ50
β6j = γ60
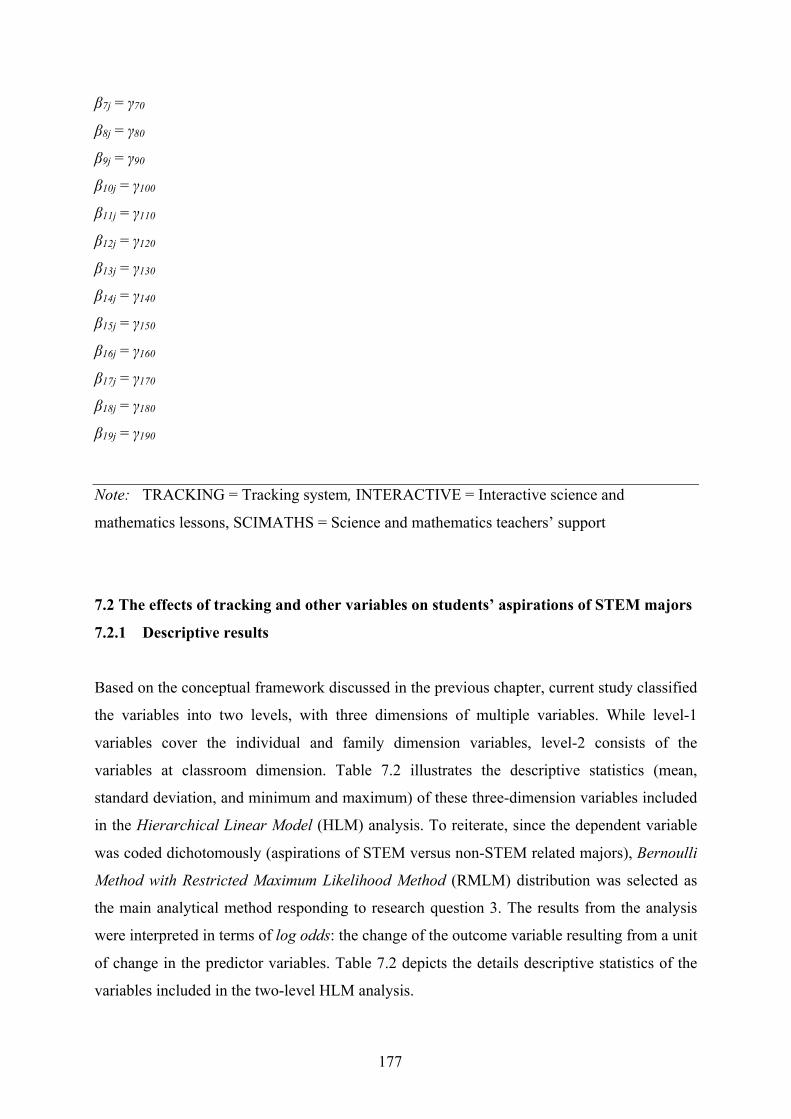
177
β7j = γ70
β8j = γ80
β9j = γ90
β10j = γ100
β11j = γ110
β12j = γ120
β13j = γ130
β14j = γ140
β15j = γ150
β16j = γ160
β17j = γ170
β18j = γ180
β19j = γ190
Note: TRACKING = Tracking system, INTERACTIVE = Interactive science and
mathematics lessons, SCIMATHS = Science and mathematics teachers’ support
7.2 The effects of tracking and other variables on students’ aspirations of STEM majors
7.2.1 Descriptive results
Based on the conceptual framework discussed in the previous chapter, current study classified
the variables into two levels, with three dimensions of multiple variables. While level-1
variables cover the individual and family dimension variables, level-2 consists of the
variables at classroom dimension. Table 7.2 illustrates the descriptive statistics (mean,
standard deviation, and minimum and maximum) of these three-dimension variables included
in the Hierarchical Linear Model (HLM) analysis. To reiterate, since the dependent variable
was coded dichotomously (aspirations of STEM versus non-STEM related majors), Bernoulli
Method with Restricted Maximum Likelihood Method (RMLM) distribution was selected as
the main analytical method responding to research question 3. The results from the analysis
were interpreted in terms of log odds: the change of the outcome variable resulting from a unit
of change in the predictor variables. Table 7.2 depicts the details descriptive statistics of the
variables included in the two-level HLM analysis.
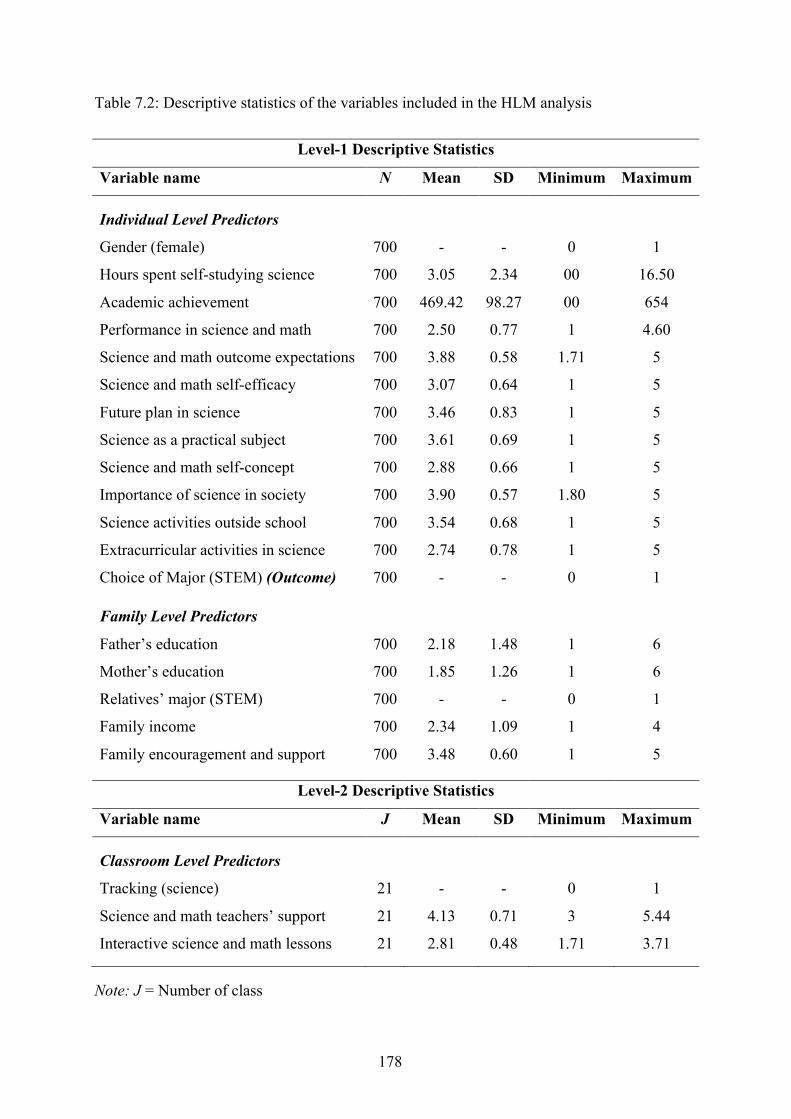
178
Table 7.2: Descriptive statistics of the variables included in the HLM analysis
Level-1 Descriptive Statistics
Variable name N Mean SD Minimum Maximum
Individual Level Predictors
Gender (female) 700 - - 0 1
Hours spent self-studying science 700 3.05 2.34 00 16.50
Academic achievement 700 469.42 98.27 00 654
Performance in science and math 700 2.50 0.77 1 4.60
Science and math outcome expectations 700 3.88 0.58 1.71 5
Science and math self-efficacy 700 3.07 0.64 1 5
Future plan in science 700 3.46 0.83 1 5
Science as a practical subject 700 3.61 0.69 1 5
Science and math self-concept 700 2.88 0.66 1 5
Importance of science in society 700 3.90 0.57 1.80 5
Science activities outside school 700 3.54 0.68 1 5
Extracurricular activities in science 700 2.74 0.78 1 5
Choice of Major (STEM) (Outcome) 700 - - 0 1
Family Level Predictors
Father’s education 700 2.18 1.48 1 6
Mother’s education 700 1.85 1.26 1 6
Relatives’ major (STEM) 700 - - 0 1
Family income 700 2.34 1.09 1 4
Family encouragement and support 700 3.48 0.60 1 5
Level-2 Descriptive Statistics
Variable name J Mean SD Minimum Maximum
Classroom Level Predictors
Tracking (science) 21 - - 0 1
Science and math teachers’ support 21 4.13 0.71 3 5.44
Interactive science and math lessons 21 2.81 0.48 1.71 3.71
Note: J = Number of class
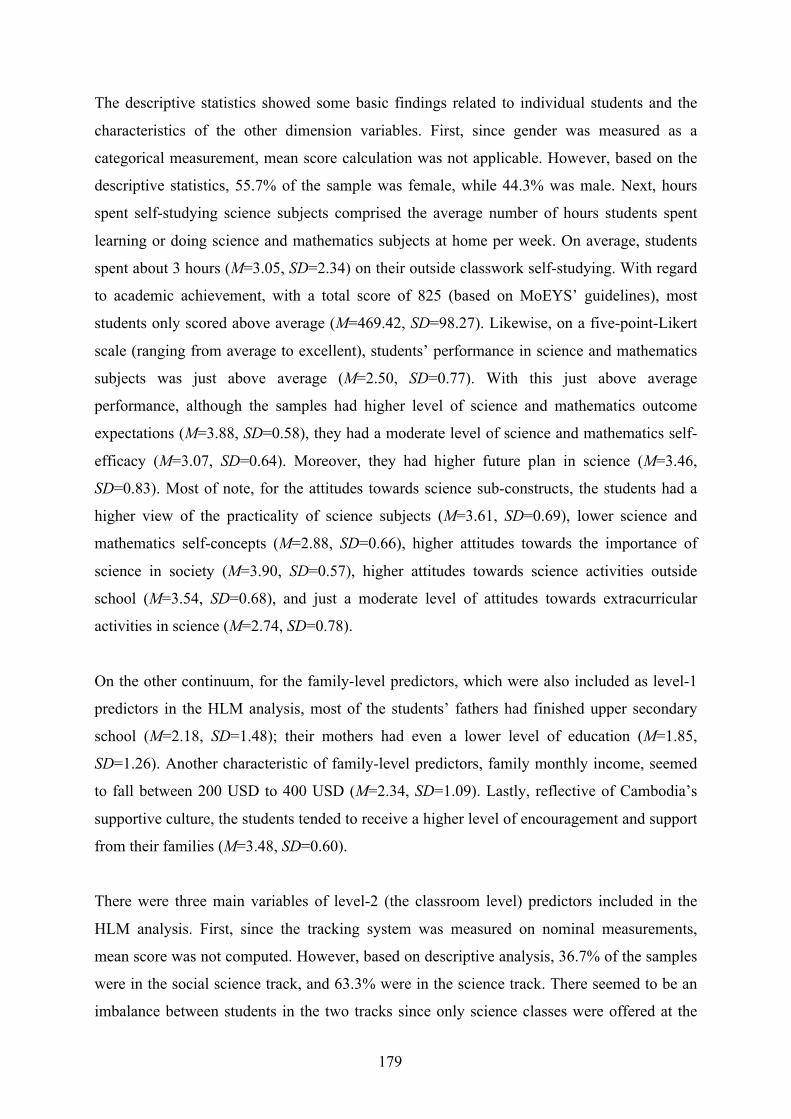
179
The descriptive statistics showed some basic findings related to individual students and the
characteristics of the other dimension variables. First, since gender was measured as a
categorical measurement, mean score calculation was not applicable. However, based on the
descriptive statistics, 55.7% of the sample was female, while 44.3% was male. Next, hours
spent self-studying science subjects comprised the average number of hours students spent
learning or doing science and mathematics subjects at home per week. On average, students
spent about 3 hours (M=3.05, SD=2.34) on their outside classwork self-studying. With regard
to academic achievement, with a total score of 825 (based on MoEYS’ guidelines), most
students only scored above average (M=469.42, SD=98.27). Likewise, on a five-point-Likert
scale (ranging from average to excellent), students’ performance in science and mathematics
subjects was just above average (M=2.50, SD=0.77). With this just above average
performance, although the samples had higher level of science and mathematics outcome
expectations (M=3.88, SD=0.58), they had a moderate level of science and mathematics self-
efficacy (M=3.07, SD=0.64). Moreover, they had higher future plan in science (M=3.46,
SD=0.83). Most of note, for the attitudes towards science sub-constructs, the students had a
higher view of the practicality of science subjects (M=3.61, SD=0.69), lower science and
mathematics self-concepts (M=2.88, SD=0.66), higher attitudes towards the importance of
science in society (M=3.90, SD=0.57), higher attitudes towards science activities outside
school (M=3.54, SD=0.68), and just a moderate level of attitudes towards extracurricular
activities in science (M=2.74, SD=0.78).
On the other continuum, for the family-level predictors, which were also included as level-1
predictors in the HLM analysis, most of the students’ fathers had finished upper secondary
school (M=2.18, SD=1.48); their mothers had even a lower level of education (M=1.85,
SD=1.26). Another characteristic of family-level predictors, family monthly income, seemed
to fall between 200 USD to 400 USD (M=2.34, SD=1.09). Lastly, reflective of Cambodia’s
supportive culture, the students tended to receive a higher level of encouragement and support
from their families (M=3.48, SD=0.60).
There were three main variables of level-2 (the classroom level) predictors included in the
HLM analysis. First, since the tracking system was measured on nominal measurements,
mean score was not computed. However, based on descriptive analysis, 36.7% of the samples
were in the social science track, and 63.3% were in the science track. There seemed to be an
imbalance between students in the two tracks since only science classes were offered at the
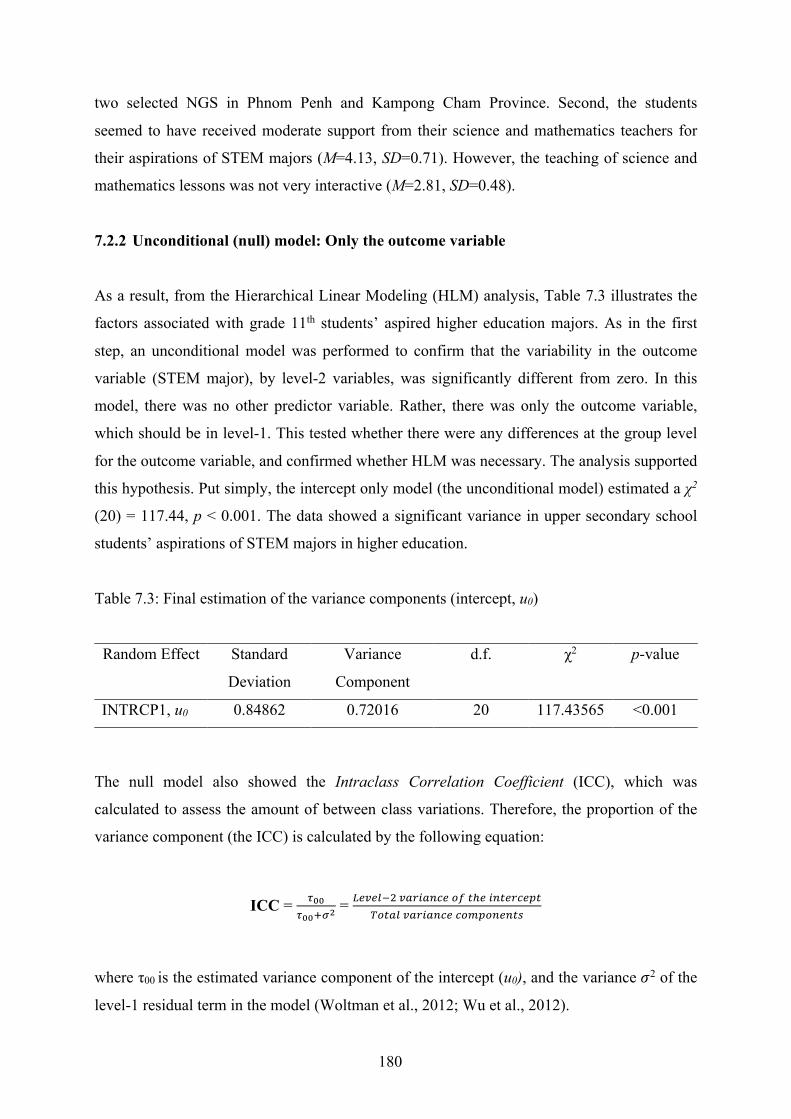
180
two selected NGS in Phnom Penh and Kampong Cham Province. Second, the students
seemed to have received moderate support from their science and mathematics teachers for
their aspirations of STEM majors (M=4.13, SD=0.71). However, the teaching of science and
mathematics lessons was not very interactive (M=2.81, SD=0.48).
7.2.2 Unconditional (null) model: Only the outcome variable
As a result, from the Hierarchical Linear Modeling (HLM) analysis, Table 7.3 illustrates the
factors associated with grade 11th students’ aspired higher education majors. As in the first
step, an unconditional model was performed to confirm that the variability in the outcome
variable (STEM major), by level-2 variables, was significantly different from zero. In this
model, there was no other predictor variable. Rather, there was only the outcome variable,
which should be in level-1. This tested whether there were any differences at the group level
for the outcome variable, and confirmed whether HLM was necessary. The analysis supported
this hypothesis. Put simply, the intercept only model (the unconditional model) estimated a χ2
(20) = 117.44, p < 0.001. The data showed a significant variance in upper secondary school
students’ aspirations of STEM majors in higher education.
Table 7.3: Final estimation of the variance components (intercept, u0)
Random Effect Standard
Deviation
Variance
Component
d.f. χ2 p-value
INTRCP1, u0 0.84862 0.72016 20 117.43565 <0.001
The null model also showed the Intraclass Correlation Coefficient (ICC), which was
calculated to assess the amount of between class variations. Therefore, the proportion of the
variance component (the ICC) is calculated by the following equation:
ICC = !!!!!!"#"
= $%&%'()&+,-+./%0123%-.2%,/%42502+'&+,-+./%/0640.%.27
where τ00 is the estimated variance component of the intercept (u0), and the variance !2 of the
level-1 residual term in the model (Woltman et al., 2012; Wu et al., 2012).
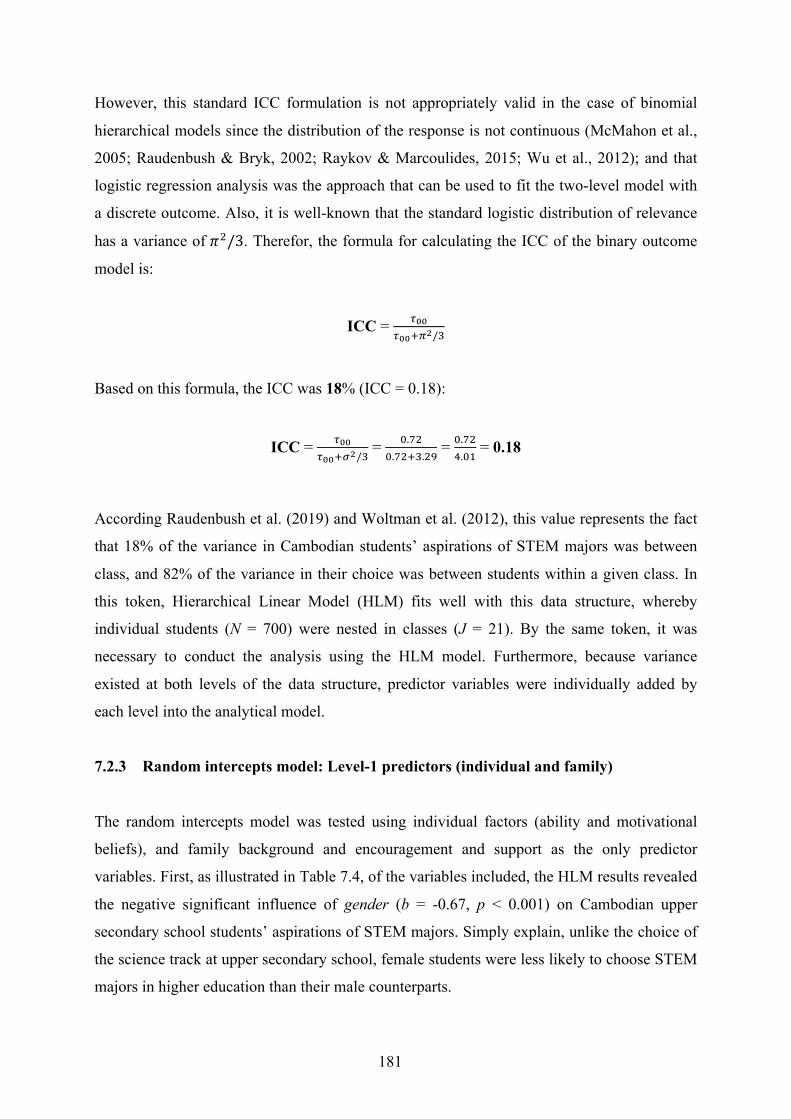
181
However, this standard ICC formulation is not appropriately valid in the case of binomial
hierarchical models since the distribution of the response is not continuous (McMahon et al.,
2005; Raudenbush & Bryk, 2002; Raykov & Marcoulides, 2015; Wu et al., 2012); and that
logistic regression analysis was the approach that can be used to fit the two-level model with
a discrete outcome. Also, it is well-known that the standard logistic distribution of relevance
has a variance of ")/3. Therefor, the formula for calculating the ICC of the binary outcome
model is:
ICC = !!!!!!"8"/:
Based on this formula, the ICC was 18% (ICC = 0.18):
ICC = !!!!!!"#"/:
= ;.=);.=)":.)> = ;.=)?.;@ = 0.18
According Raudenbush et al. (2019) and Woltman et al. (2012), this value represents the fact
that 18% of the variance in Cambodian students’ aspirations of STEM majors was between
class, and 82% of the variance in their choice was between students within a given class. In
this token, Hierarchical Linear Model (HLM) fits well with this data structure, whereby
individual students (N = 700) were nested in classes (J = 21). By the same token, it was
necessary to conduct the analysis using the HLM model. Furthermore, because variance
existed at both levels of the data structure, predictor variables were individually added by
each level into the analytical model.
7.2.3 Random intercepts model: Level-1 predictors (individual and family)
The random intercepts model was tested using individual factors (ability and motivational
beliefs), and family background and encouragement and support as the only predictor
variables. First, as illustrated in Table 7.4, of the variables included, the HLM results revealed
the negative significant influence of gender (b = -0.67, p < 0.001) on Cambodian upper
secondary school students’ aspirations of STEM majors. Simply explain, unlike the choice of
the science track at upper secondary school, female students were less likely to choose STEM
majors in higher education than their male counterparts.
182
Within the category of gender, the students (25%) commented on their perceptions of gender
in relation to their perceived characteristics of a STEM career. One girl commented, “My aunt
urged me to choose law and said this major is good for women”. Another girl highlighted, “I
chose accounting because of the working environment; I can work in an airconditioned
room”. The third female students remarked, “I feel that my parents will not advise their
children, females like me, to major in STEM-related, as they believe I will be lonely because
these majors are male-dominated”. In short, the qualitative findings revealed that female
students were less likely to choose STEM majors not because of their academic achievement,
but due to the influence of their family members and their perceived characteristics of STEM
majors, as well as of STEM careers.
Second, the model also pointed out to the influence of academic achievement (b = 0.36, p <
0.05) on Cambodian upper secondary school students’ aspirations of STEM majors in higher
education. Students who had higher academic achievement were more likely to choose to a
STEM major in higher education. Statistically, the odds of students’ aspirations of STEM
majors increase by 1.44 times if academic achievement increases in one unit. The
predictability was significant (p<0.05).
In the category of academic preparedness, the students (84%) mentioned that they aspired to
major in a STEM-related field because they had a strong academic background. Students in
the science track who aspired to major in STEM highlighted the influence of academic
achievement. Stronger academic achievement influenced them to take STEM because such
majors required students to be competent in science and/or mathematics subjects. For
example, one student mentioned, “For higher education, I will choose biological engineering
because my achievement is good, especially in mathematics, biology, and chemistry”.
Another girl who chose physics said, “I have been good at physics since I was in grade 7th”.
From attitudes towards science perspective, future plan in science was also one of the most
significant predictors of students’ aspirations of STEM majors in higher education (b = 1.17,
p < 0.001). Students who have a clearer future plan in science are more likely to choose
STEM related majors when they are transitioning from upper secondary school to higher
education by a factor of 3.32 times higher than their lower counterparts. Thus, having higher
future plan in science leads students to have strong aspirations of STEM related majors in
higher education.
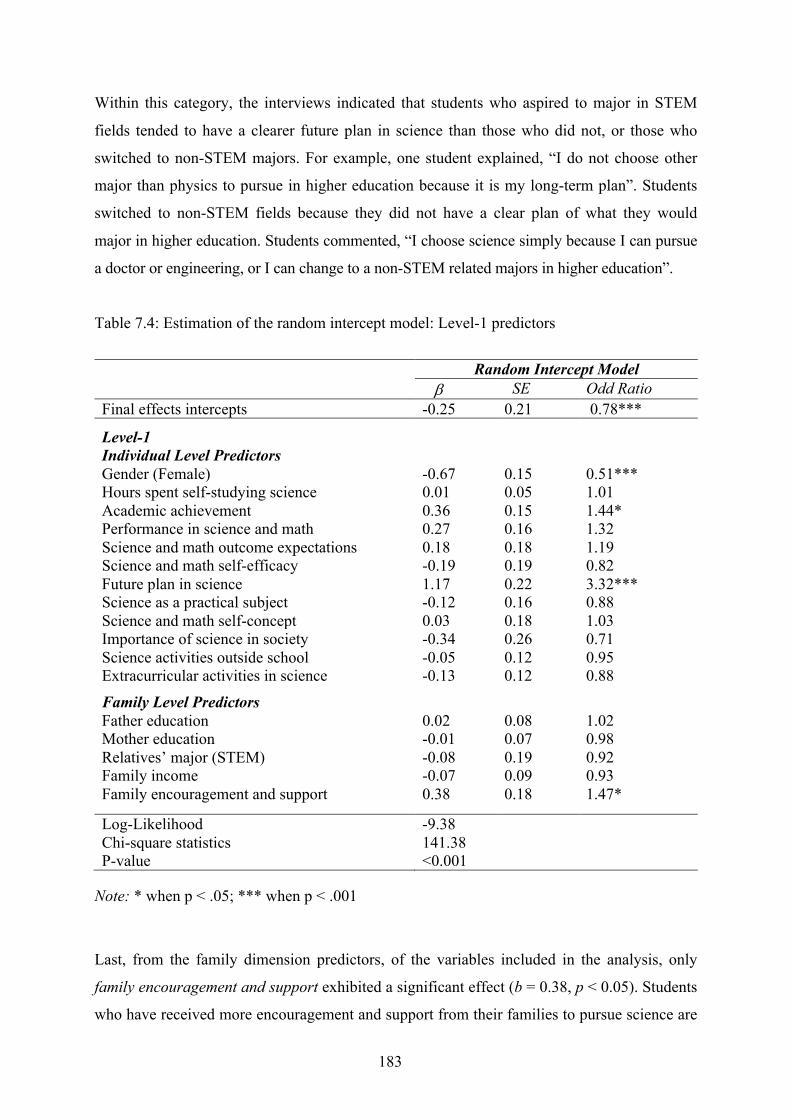
183
Within this category, the interviews indicated that students who aspired to major in STEM
fields tended to have a clearer future plan in science than those who did not, or those who
switched to non-STEM majors. For example, one student explained, “I do not choose other
major than physics to pursue in higher education because it is my long-term plan”. Students
switched to non-STEM fields because they did not have a clear plan of what they would
major in higher education. Students commented, “I choose science simply because I can pursue
a doctor or engineering, or I can change to a non-STEM related majors in higher education”.
Table 7.4: Estimation of the random intercept model: Level-1 predictors
Random Intercept Model
b SE Odd Ratio Final effects intercepts -0.25 0.21 0.78***
Level-1 Individual Level Predictors
Gender (Female) -0.67 0.15 0.51*** Hours spent self-studying science 0.01 0.05 1.01 Academic achievement 0.36 0.15 1.44* Performance in science and math 0.27 0.16 1.32 Science and math outcome expectations 0.18 0.18 1.19 Science and math self-efficacy -0.19 0.19 0.82 Future plan in science 1.17 0.22 3.32*** Science as a practical subject -0.12 0.16 0.88 Science and math self-concept 0.03 0.18 1.03 Importance of science in society -0.34 0.26 0.71 Science activities outside school -0.05 0.12 0.95 Extracurricular activities in science -0.13 0.12 0.88 Family Level Predictors Father education 0.02 0.08 1.02 Mother education -0.01 0.07 0.98 Relatives’ major (STEM) -0.08 0.19 0.92 Family income -0.07 0.09 0.93 Family encouragement and support 0.38 0.18 1.47*
Log-Likelihood -9.38 Chi-square statistics 141.38 P-value <0.001
Note: * when p < .05; *** when p < .001 Last, from the family dimension predictors, of the variables included in the analysis, only
family encouragement and support exhibited a significant effect (b = 0.38, p < 0.05). Students
who have received more encouragement and support from their families to pursue science are
184
more likely to choose STEM majors by a factor of 1.47 times higher when transitioning from
upper secondary school to higher education. Therefore, the random intercepts model revealed
that individual ability and motivational belief (including gender, academic achievement, and
future plan in science) and family/social encouragement had significant, predictive roles in
aspirations of STEM majors among Cambodian upper secondary school students.
Within this category, the qualitative data signalled that the students (64%) would be more
likely to choose STEM majors if they had greater family encouragement and support in
science. The respondents referred to their parents playing a role in their STEM-oriented goals.
They explained that STEM majors tended to require more time and money. Therefore,
stronger support from one’s family enables students to choose a STEM majors. One
representative student who switched from non-STEM to STEM expressed the following:
I changed because of family encouragement and support. At first, I thought that my
family could not support me, and I did not know if my parents would allow me to
pursue science or not. One day they asked me what I wanted to study at university; I
told them that I wanted to study marketing. Then they said “No, if you want to go to
university, please go into the health sciences and we will support you”. Then I
followed their advice.
7.2.4 The means-as-outcomes model: Level-2 predictors
Next, the means-as-outcomes model added tracking and classroom experience and support as
level-2 predictor variables, while holding the individual ability and motivational beliefs and
family background and encouragement variables constant. Surprisingly, tracking system
(science versus social science)—which was hypothesized to have significant predictability in
one’s choice of STEM majors—did not have any significant influence on Cambodian upper
secondary school students’ aspirations of STEM major in higher education (b = 0.74, p >
0.05). To reiterate, the students’ choice of STEM major was not associated with their science
track placement at the upper secondary school level.
Follow-up interviews further discovered that, within the final theme, the tracking system of
the science track in traditional schools and NGS and the social science track, did not play
much of a role in the students’ aspirations of STEM majors. Most of the science track
interviewees (48%) tended to switch to non-STEM majors at a considerable rate. Students
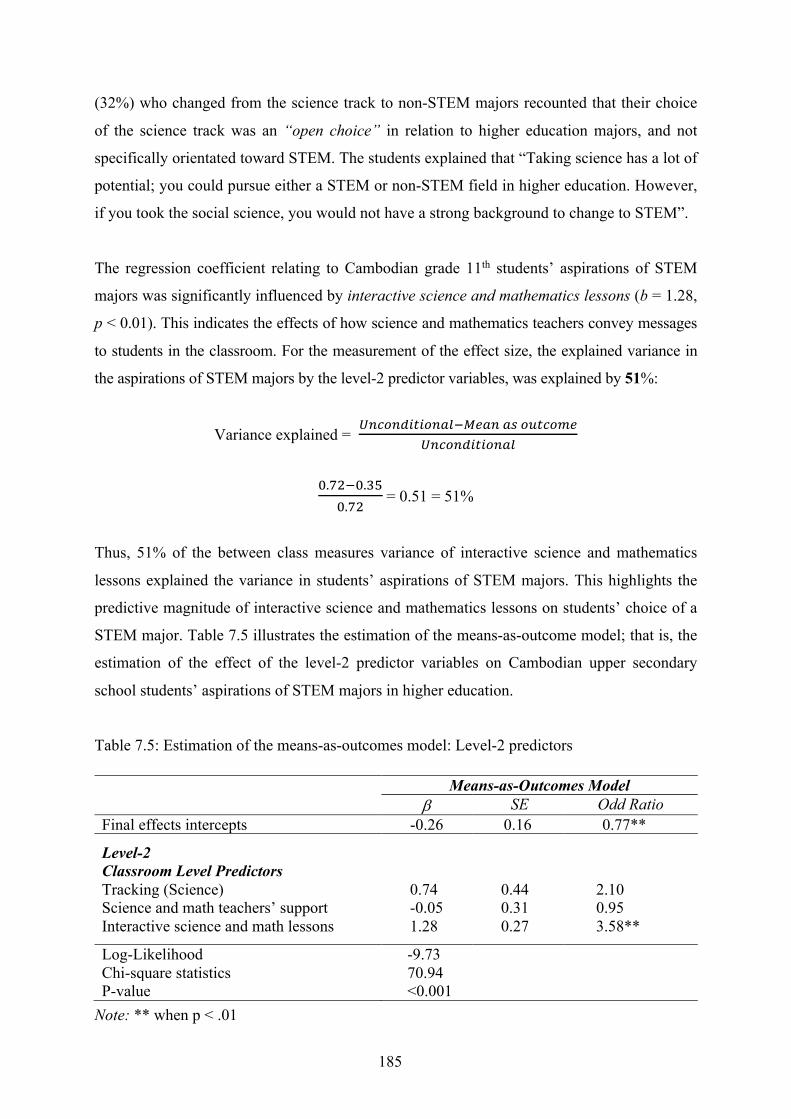
185
(32%) who changed from the science track to non-STEM majors recounted that their choice
of the science track was an “open choice” in relation to higher education majors, and not
specifically orientated toward STEM. The students explained that “Taking science has a lot of
potential; you could pursue either a STEM or non-STEM field in higher education. However,
if you took the social science, you would not have a strong background to change to STEM”.
The regression coefficient relating to Cambodian grade 11th students’ aspirations of STEM
majors was significantly influenced by interactive science and mathematics lessons (b = 1.28,
p < 0.01). This indicates the effects of how science and mathematics teachers convey messages
to students in the classroom. For the measurement of the effect size, the explained variance in
the aspirations of STEM majors by the level-2 predictor variables, was explained by 51%:
Variance explained = !"#$"%&'&$"()*+,("(.$/'#$0,!"#$"%&'&$"()
!.#$%!.&'!.#$ = 0.51 = 51%
Thus, 51% of the between class measures variance of interactive science and mathematics
lessons explained the variance in students’ aspirations of STEM majors. This highlights the
predictive magnitude of interactive science and mathematics lessons on students’ choice of a
STEM major. Table 7.5 illustrates the estimation of the means-as-outcome model; that is, the
estimation of the effect of the level-2 predictor variables on Cambodian upper secondary
school students’ aspirations of STEM majors in higher education.
Table 7.5: Estimation of the means-as-outcomes model: Level-2 predictors
Means-as-Outcomes Model b SE Odd Ratio
Final effects intercepts -0.26 0.16 0.77**
Level-2 Classroom Level Predictors
Tracking (Science) 0.74 0.44 2.10 Science and math teachers’ support -0.05 0.31 0.95 Interactive science and math lessons 1.28 0.27 3.58**
Log-Likelihood -9.73 Chi-square statistics 70.94 P-value <0.001
Note: ** when p < .01
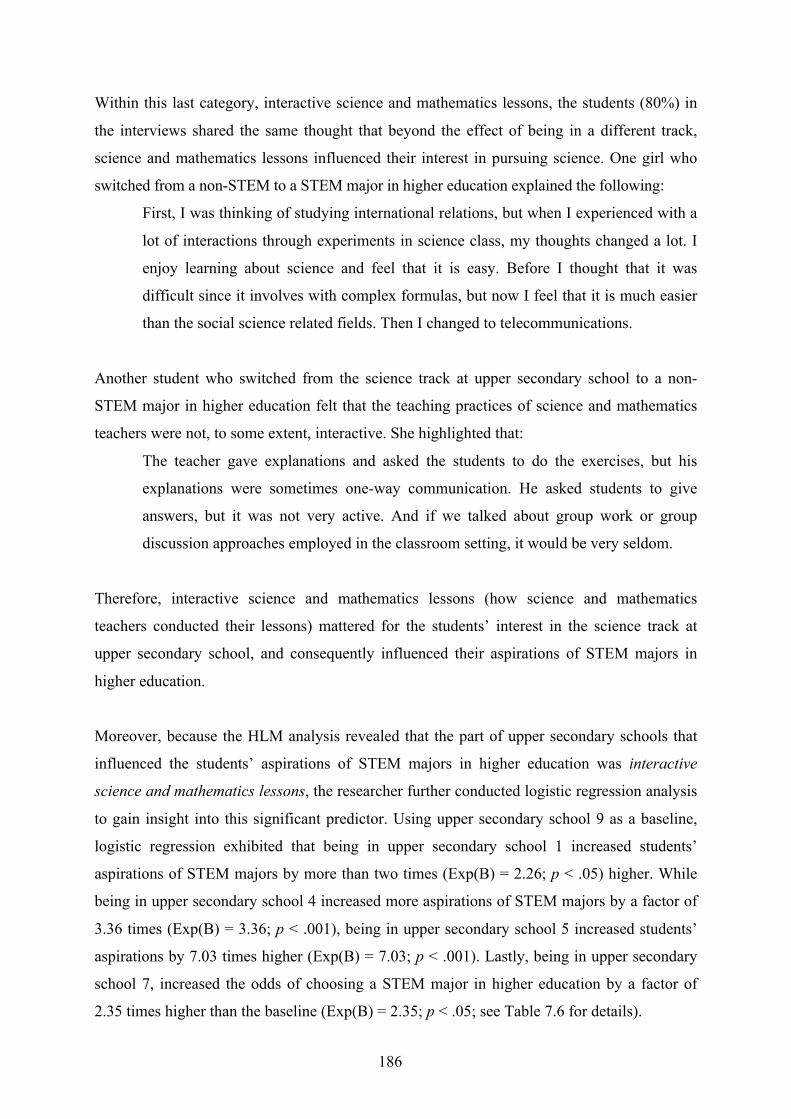
186
Within this last category, interactive science and mathematics lessons, the students (80%) in
the interviews shared the same thought that beyond the effect of being in a different track,
science and mathematics lessons influenced their interest in pursuing science. One girl who
switched from a non-STEM to a STEM major in higher education explained the following:
First, I was thinking of studying international relations, but when I experienced with a
lot of interactions through experiments in science class, my thoughts changed a lot. I
enjoy learning about science and feel that it is easy. Before I thought that it was
difficult since it involves with complex formulas, but now I feel that it is much easier
than the social science related fields. Then I changed to telecommunications.
Another student who switched from the science track at upper secondary school to a non-
STEM major in higher education felt that the teaching practices of science and mathematics
teachers were not, to some extent, interactive. She highlighted that:
The teacher gave explanations and asked the students to do the exercises, but his
explanations were sometimes one-way communication. He asked students to give
answers, but it was not very active. And if we talked about group work or group
discussion approaches employed in the classroom setting, it would be very seldom.
Therefore, interactive science and mathematics lessons (how science and mathematics
teachers conducted their lessons) mattered for the students’ interest in the science track at
upper secondary school, and consequently influenced their aspirations of STEM majors in
higher education.
Moreover, because the HLM analysis revealed that the part of upper secondary schools that
influenced the students’ aspirations of STEM majors in higher education was interactive
science and mathematics lessons, the researcher further conducted logistic regression analysis
to gain insight into this significant predictor. Using upper secondary school 9 as a baseline,
logistic regression exhibited that being in upper secondary school 1 increased students’
aspirations of STEM majors by more than two times (Exp(B) = 2.26; p < .05) higher. While
being in upper secondary school 4 increased more aspirations of STEM majors by a factor of
3.36 times (Exp(B) = 3.36; p < .001), being in upper secondary school 5 increased students’
aspirations by 7.03 times higher (Exp(B) = 7.03; p < .001). Lastly, being in upper secondary
school 7, increased the odds of choosing a STEM major in higher education by a factor of
2.35 times higher than the baseline (Exp(B) = 2.35; p < .05; see Table 7.6 for details).
187
Table 7.6: The influence of upper secondary school on students’ aspirations of STEM majors
School ID B(SE) 95.0% C.I. for EXP(B)
Lower Exp(B) Upper Constant -.225(.076)*** .798 Upper secondary school 1 .82(.34)* 1.17 2.26 4.36 Upper secondary school 2 .33(.37) 0.67 1.40 2.90 Upper secondary school 3 -.18(.38) 0.41 0.85 1.76 Upper secondary school 4 1.21(.33)*** 1.74 3.36 6.48 Upper secondary school 5 1.95(.41)*** 3.13 7.03 15.78 Upper secondary school 6 .27(.37) 0.63 1.30 2.69 Upper secondary school 7 .85(.35)* 1.18 2.35 4.65 Upper secondary school 8 .43(.33) 0.80 1.54 2.96 Cox & Snell R Square Nagelkerke R Square
.092
.123
Note: * when p < .05; *** when p < .001
Descriptive statistics also revealed that upper secondary school 4, upper secondary school 5,
and upper secondary school 7 had a higher mean score for interactive science and
mathematics lessons (M = 2.98, SD = .52; M = 2.98, SD = .45; and M = 3.00, SD = .47),
respectively than other schools. Therefore, it could be concluded the more interactive science
and mathematics lessons are, the more likely the students are to choose a STEM major.
7.2.5 The random intercepts and slopes model: Mixed-level predictors
Finally, the study conducted the random intercepts and slopes (level-1 and level-2 variables)
model, with all predictor variables included to examine if there was any interaction between
predictor variables from the individual and family dimension (level-1) and the classroom
dimension (level-2) on Cambodian upper secondary school students’ aspirations of STEM
majors in higher education.
As illustrated in Table 7.7, there was cross-level interaction between predictor variables at the
individual and family and classroom levels. It was revealed that gender remained to be a
negative significant predictor of students’ aspirations of STEM majors in higher education,
but the magnitude seemed lower (b = -0.75, p < 0.001). Statistically, the odds ratio decreased
from 0.51 to 0.47. This means that by including the level-2 variables, female students tended
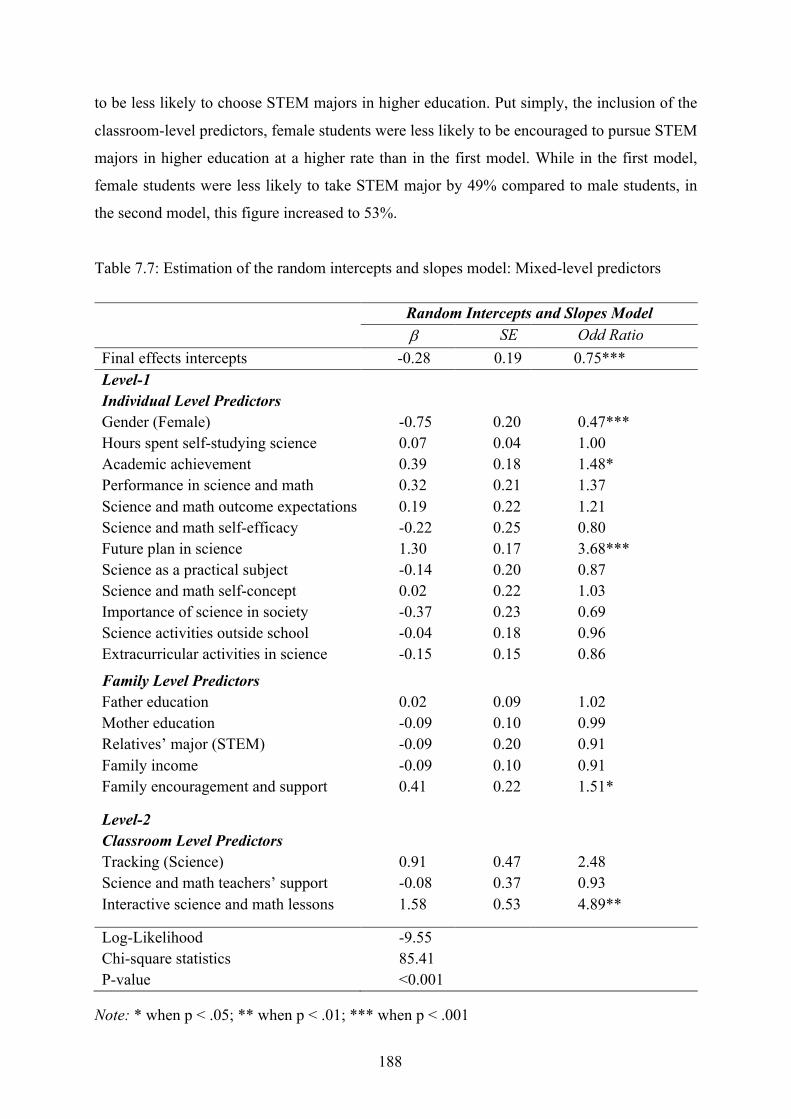
188
to be less likely to choose STEM majors in higher education. Put simply, the inclusion of the
classroom-level predictors, female students were less likely to be encouraged to pursue STEM
majors in higher education at a higher rate than in the first model. While in the first model,
female students were less likely to take STEM major by 49% compared to male students, in
the second model, this figure increased to 53%.
Table 7.7: Estimation of the random intercepts and slopes model: Mixed-level predictors Random Intercepts and Slopes Model
b SE Odd Ratio Final effects intercepts -0.28 0.19 0.75*** Level-1 Individual Level Predictors
Gender (Female) -0.75 0.20 0.47*** Hours spent self-studying science 0.07 0.04 1.00 Academic achievement 0.39 0.18 1.48* Performance in science and math 0.32 0.21 1.37 Science and math outcome expectations 0.19 0.22 1.21 Science and math self-efficacy -0.22 0.25 0.80 Future plan in science 1.30 0.17 3.68*** Science as a practical subject -0.14 0.20 0.87 Science and math self-concept 0.02 0.22 1.03 Importance of science in society -0.37 0.23 0.69 Science activities outside school -0.04 0.18 0.96 Extracurricular activities in science -0.15 0.15 0.86
Family Level Predictors Father education 0.02 0.09 1.02 Mother education -0.09 0.10 0.99 Relatives’ major (STEM) -0.09 0.20 0.91 Family income -0.09 0.10 0.91 Family encouragement and support 0.41 0.22 1.51*
Level-2 Classroom Level Predictors
Tracking (Science) 0.91 0.47 2.48 Science and math teachers’ support -0.08 0.37 0.93 Interactive science and math lessons 1.58 0.53 4.89**
Log-Likelihood -9.55 Chi-square statistics 85.41 P-value <0.001
Note: * when p < .05; ** when p < .01; *** when p < .001
189
More interestingly, other level-1 predictors, including grade 11th academic achievement (b =
0.39, p < 0.05), future plan in science (b = 1.30, p < 0.001), family encouragement and
support (b = 0.41, p < 0.05), and interactive science and mathematics lessons (b = 1.58, p <
0.01), remained to be the predictors accounting for the increasing odds of Cambodian upper
secondary school students’ aspirations of STEM majors in higher education. The odds of each
variable also increased in the random intercepts and slopes model accordingly. The odds ratio
for academic achievement increased from 1.44 to 1.48, future plan in science increased from
3.32 to 3.68, and family encouragement and support increased from 1.47 to 1.51, from the
random intercepts (level-1) model to the random intercepts and slopes model (mixed-level),
respectively.
Most notable is the effect of interactive science and mathematics lessons, for which the odds
increased from 3.58 to 4.89, with p < 0.01, when level-1 and level-2 predictors were included.
Therefore, considering the individual, family, and classroom-level variables, students take the
interactive science and mathematics lessons they have experienced at upper secondary school
into account when deciding on their aspirations of STEM majors in higher education. Table
7.8 presents a holistic view of the result of HLM analysis when all individual characteristics
and family background (level-1) and classroom-level dimensions of upper secondary school
supports (level-2) were included in the model.
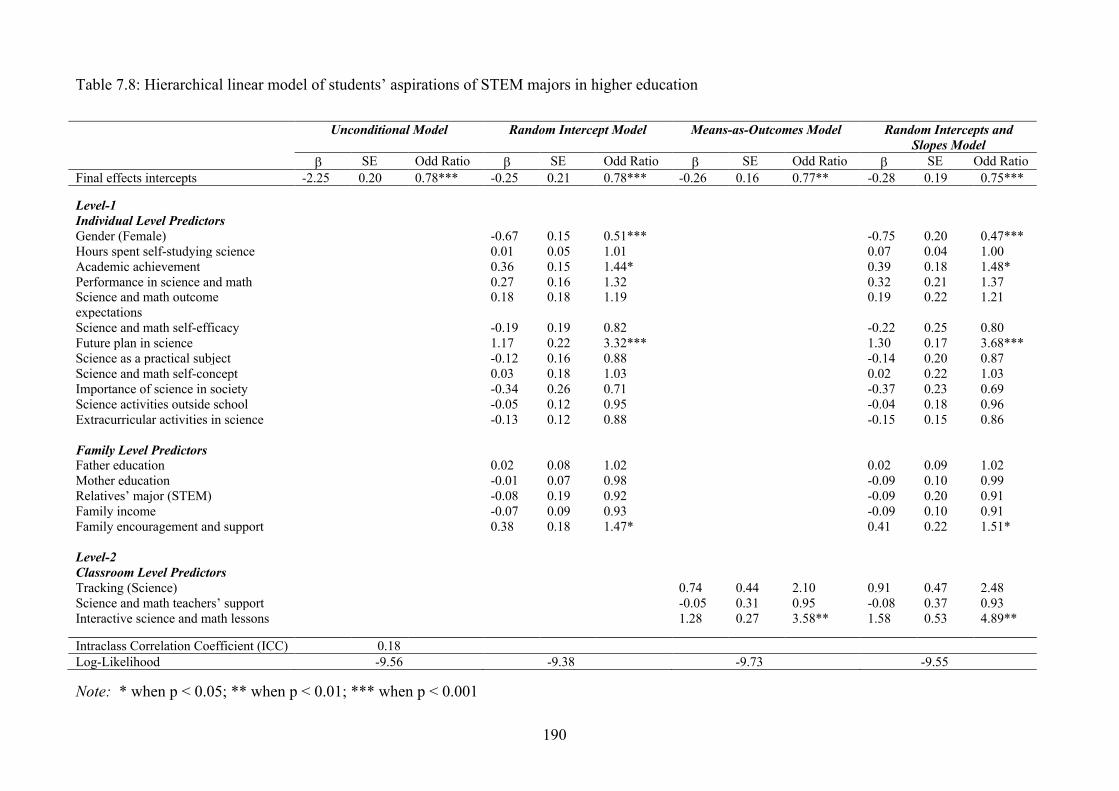
190
Table 7.8: Hierarchical linear model of students’ aspirations of STEM majors in higher education Unconditional Model Random Intercept Model Means-as-Outcomes Model Random Intercepts and
Slopes Model b SE Odd Ratio b SE Odd Ratio b SE Odd Ratio b SE Odd Ratio
Final effects intercepts -2.25 0.20 0.78*** -0.25 0.21 0.78*** -0.26 0.16 0.77** -0.28 0.19 0.75***
Level-1 Individual Level Predictors
Gender (Female) -0.67 0.15 0.51*** -0.75 0.20 0.47*** Hours spent self-studying science 0.01 0.05 1.01 0.07 0.04 1.00 Academic achievement 0.36 0.15 1.44* 0.39 0.18 1.48* Performance in science and math 0.27 0.16 1.32 0.32 0.21 1.37 Science and math outcome expectations
0.18 0.18 1.19 0.19 0.22 1.21
Science and math self-efficacy -0.19 0.19 0.82 -0.22 0.25 0.80 Future plan in science 1.17 0.22 3.32*** 1.30 0.17 3.68*** Science as a practical subject -0.12 0.16 0.88 -0.14 0.20 0.87 Science and math self-concept 0.03 0.18 1.03 0.02 0.22 1.03 Importance of science in society -0.34 0.26 0.71 -0.37 0.23 0.69 Science activities outside school -0.05 0.12 0.95 -0.04 0.18 0.96 Extracurricular activities in science -0.13 0.12 0.88 -0.15 0.15 0.86
Family Level Predictors Father education 0.02 0.08 1.02 0.02 0.09 1.02 Mother education -0.01 0.07 0.98 -0.09 0.10 0.99 Relatives’ major (STEM) -0.08 0.19 0.92 -0.09 0.20 0.91 Family income -0.07 0.09 0.93 -0.09 0.10 0.91 Family encouragement and support 0.38 0.18 1.47* 0.41 0.22 1.51* Level-2 Classroom Level Predictors
Tracking (Science) 0.74 0.44 2.10 0.91 0.47 2.48 Science and math teachers’ support -0.05 0.31 0.95 -0.08 0.37 0.93 Interactive science and math lessons 1.28 0.27 3.58** 1.58 0.53 4.89** Intraclass Correlation Coefficient (ICC) 0.18 Log-Likelihood -9.56 -9.38 -9.73 -9.55 Note: * when p < 0.05; ** when p < 0.01; *** when p < 0.001
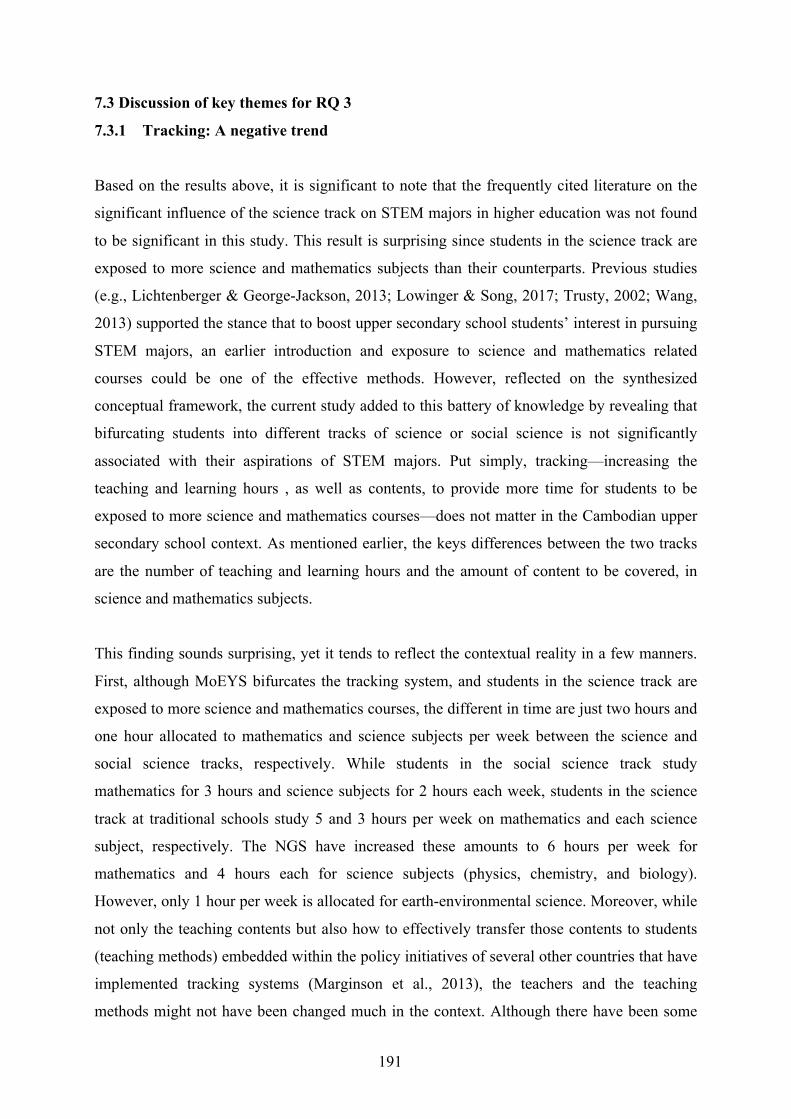
191
7.3 Discussion of key themes for RQ 3
7.3.1 Tracking: A negative trend
Based on the results above, it is significant to note that the frequently cited literature on the
significant influence of the science track on STEM majors in higher education was not found
to be significant in this study. This result is surprising since students in the science track are
exposed to more science and mathematics subjects than their counterparts. Previous studies
(e.g., Lichtenberger & George-Jackson, 2013; Lowinger & Song, 2017; Trusty, 2002; Wang,
2013) supported the stance that to boost upper secondary school students’ interest in pursuing
STEM majors, an earlier introduction and exposure to science and mathematics related
courses could be one of the effective methods. However, reflected on the synthesized
conceptual framework, the current study added to this battery of knowledge by revealing that
bifurcating students into different tracks of science or social science is not significantly
associated with their aspirations of STEM majors. Put simply, tracking—increasing the
teaching and learning hours , as well as contents, to provide more time for students to be
exposed to more science and mathematics courses—does not matter in the Cambodian upper
secondary school context. As mentioned earlier, the keys differences between the two tracks
are the number of teaching and learning hours and the amount of content to be covered, in
science and mathematics subjects.
This finding sounds surprising, yet it tends to reflect the contextual reality in a few manners.
First, although MoEYS bifurcates the tracking system, and students in the science track are
exposed to more science and mathematics courses, the different in time are just two hours and
one hour allocated to mathematics and science subjects per week between the science and
social science tracks, respectively. While students in the social science track study
mathematics for 3 hours and science subjects for 2 hours each week, students in the science
track at traditional schools study 5 and 3 hours per week on mathematics and each science
subject, respectively. The NGS have increased these amounts to 6 hours per week for
mathematics and 4 hours each for science subjects (physics, chemistry, and biology).
However, only 1 hour per week is allocated for earth-environmental science. Moreover, while
not only the teaching contents but also how to effectively transfer those contents to students
(teaching methods) embedded within the policy initiatives of several other countries that have
implemented tracking systems (Marginson et al., 2013), the teachers and the teaching
methods might not have been changed much in the context. Although there have been some
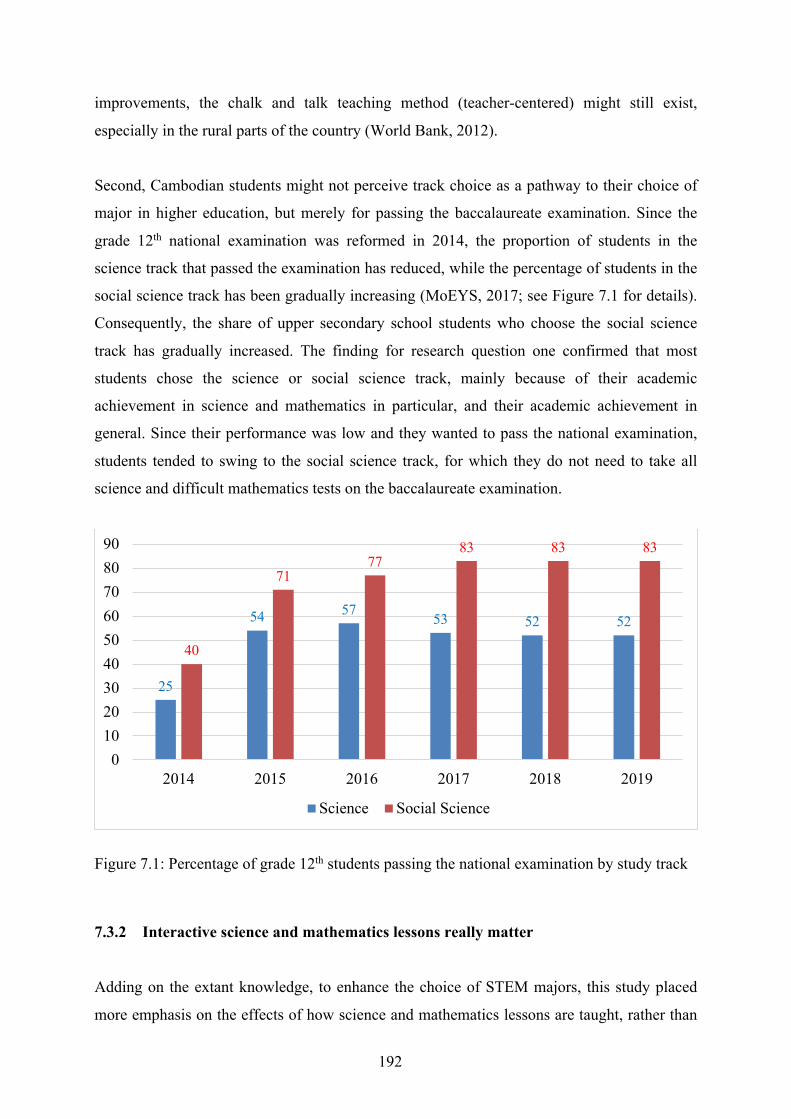
192
improvements, the chalk and talk teaching method (teacher-centered) might still exist,
especially in the rural parts of the country (World Bank, 2012).
Second, Cambodian students might not perceive track choice as a pathway to their choice of
major in higher education, but merely for passing the baccalaureate examination. Since the
grade 12th national examination was reformed in 2014, the proportion of students in the
science track that passed the examination has reduced, while the percentage of students in the
social science track has been gradually increasing (MoEYS, 2017; see Figure 7.1 for details).
Consequently, the share of upper secondary school students who choose the social science
track has gradually increased. The finding for research question one confirmed that most
students chose the science or social science track, mainly because of their academic
achievement in science and mathematics in particular, and their academic achievement in
general. Since their performance was low and they wanted to pass the national examination,
students tended to swing to the social science track, for which they do not need to take all
science and difficult mathematics tests on the baccalaureate examination.
Figure 7.1: Percentage of grade 12th students passing the national examination by study track
7.3.2 Interactive science and mathematics lessons really matter
Adding on the extant knowledge, to enhance the choice of STEM majors, this study placed
more emphasis on the effects of how science and mathematics lessons are taught, rather than
25
54 57 53 52 52
40
7177
83 83 83
0102030405060708090
2014 2015 2016 2017 2018 2019
Science Social Science
193
solely on bifurcating students into science and social science classes (e.g., differentiating the
number of hours spent studying and the focus of the content). The current findings aligned
well with the conceptual framework, which stipulates that an individual’s intention to enroll
in a certain field of study (in this case, choosing a STEM major) is the consequence of the
sequential cumulative effects of numerous learning experiences that students have gained
during science and mathematics classes (Krumboltz, 1979; 1990; Maltese & Tai, 2011; Lent
et al., 2002; Wang, 2013, 2017). Thus, given that there are a few differences between the
science and social science tracks, the tracking system does not influence the choice of STEM
or non-STEM majors in higher education if the teaching methods in science and mathematics
classes does not change, maybe, to the ones that foster interactions between teachers and
students.
As it is said that “poor teachers explain, excellent teachers elicit”, the interactive lessons of
science and mathematics accommodates enabling conditions to elicit ideas, and to inspire
students’ interests in the subject matter and trigger their intention to engage in related fields.
Engaging students in active learning—pedagogical approaches that truly engage students
intellectually and involve thinking, problem-solving, questioning, or analysing information—
could improve their performance and lead them to pursue STEM (e.g., Graham et al., 2013;
Lopatto, 2007; Wang & Lee, 2019). More exposure to science and mathematics content at
upper secondary school might be important, but the most important thing is how interactive
the science and mathematics content (discussed among teachers and students) is in the
classroom setting. This finding was supported by what has been found that a learning process
that is active or interactive (or student-centered pedagogies, such as collaborative learning)
could increase students’ uptake in STEM (e.g., Erdogan & Stuessy, 2015; Graham et al.,
2013; Simon et al., 2015).
7.3.3 The gender gap still exists in STEM in higher education
Gender plays a key role in priorities when choosing one’s academic major, particularly in
STEM related (Eam et al., 2019; Eng & Szmodis, 2015; Evans, Chen, & Hudes, 2020; Kao &
Shimizu, 2019; Kwak, 1993; Mattoo, 2013; Shim & Paik, 2014). Gender continues to be
influential, with women less likely to pursue STEM than men. Consistently, this study
discovered that the Cambodian upper secondary school female students who participated in
this study were not likely to choose STEM majors in higher education. The effect was even
194
more serious when classroom dimension variables were included. This finding might be
explained by what Wiswall et al. (2014) suggested: that STEM majors are characterized as a
“chilly environment” where females can feel unwelcome, and might see that STEM majors
and careers as male-dominated fields. This result might extend the battery of knowledge on
the relationship between gender and academic aspirations of STEM majors as it reflects the
cultural reality of a developing context like Cambodia. Gender stereotypes still exert a
significant influence on the decision-making process. As Eam et al. (2019) remarked, gender-
based stereotypes make it difficult for female university students to see themselves as
pursuing science or STEM majors since most of the general public (including parents) holds
the culturally embedded perceptions that STEM fields conflict with being a woman and a
scientist or engineer. Another reason might be the lack of teacher role models. Some teachers
have a biased belief in female inferiority in mathematics and seemed to give lower scores to
female students (Lowinger & Song, 2017). This might have long-term effects on female’s
attitudes towards mathematics and their aspirations of STEM majors.
7.3.4 Academic achievement still matters
Another of this study’s key findings also corroborates the findings from both Western and
non-Western contexts is the positive correlation between students’ academic achievement—
self-observation generalisation—in grade 11th and their aspirations of STEM majors at
university. Similar results have been found in the Cambodian literature by Eng and Szmodis
(2015), Kao and Shimizu (2019), and Eam et al. (2019) and in the other context, for example,
Lowinger and Song (2017), Shim and Paik (2014), and Wang (2013). Together, these
researchers have claimed that science and mathematics achievement play a significant role in
one’s choice of STEM majors in higher education. Further, this study confirmed that not only
academic achievement in science and mathematics, but also overall academic achievement at
the pre-university level could influence students’ interest and positive attitudes towards
STEM majors at the university level. Moreover, the findings support the four conceptual
models that were employed in the current study, in which personal input (derived from
academic achievement and attitudinal variables) has a significant influence (e.g., Wang &
Lee, 2019; Lent et al., 2002). This is not surprising as STEM majors seem to be demanding,
and students might need high academic achievement, especially prior to entering university
(Eam et al., 2019; Kao & Shimizu, 2019). This finding might cause Cambodian students to
believe that STEM is just for “the brightest” group of students. From this perspective, it is
195
clear that to orientate the students towards STEM majors, the negative influences of myths
and misconceptions should be addressed (Eam et al., 2019).
7.3.5 Attitudes towards science matter
Of the students’ motivational attributes (attitudes towards science and mathematics, science
and mathematics self-efficacy, and future plan in science), this study posited that future plan
in science significantly influenced their choice of STEM major. This eflects the importance of
student’s motivational beliefs regarding their academic majors and future careers (Han et al.,
2002; Shim & Paik, 2014; Wang, 2013). Those who had a clear plan in science at upper
secondary school tended to have a higher probability of choosing a STEM major in higher
education. This motivational belief might be one of the consequences of the academic
achievement. A significant regression equation was found (F (1, 694) = 57.04, p<.001), with
an R2 = .08). Put simply, those who had stronger academic achievement tended to have a
clearer plan for their future majors or clearer career prospects in science. This study further
highlighted the importance of higher scores for future plan in science and STEM majors in
higher education. This might represent a logical understanding that students who have higher
academic achievement tend to have clearer future plan in science and are more likely to
choose STEM majors. Those who have long-term academic plan are better prepared in
science and mathematics so as to take on challenging fields of study such as STEM. The
follow-up interviews also highlighted that when the students had a clear plan to pursue
science in higher education, they tended to choose the science track, in which they could
study and enhance their science and mathematics competence, and as consequent, ignited
their aspirations of STEM majors.
7.3.6 The role of family encouragement and support in science
This study also justified that parents played a significant albeit role in students’ choice of
college major. Family encouragement and support exert significant influence on students’
important life decisions, including their choice of academic majors, especially in science
(Simpkins et al., 2015; Miller & Kimmel, 2012). Because of their culture, Cambodian students
are prone to parental advice. This is particularly important when choosing one’s majors, as
parents are one of their main sources of academic and financial support (Bieri Buschor et al.,
2014). Asian parents—especially those from low socio-economic status families—expect
196
their children to choose STEM majors (Lowinger & Song, 2017), as they believe that STEM
majors will lead them directly to the workforce, potentially reducing the opportunity costs
associated with attending college, and offering high returns (Lichtenberger & George-
Jackson, 2013; Shim & Paik, 2014). Contextually, most of the parents seemed to perceive that
enrolling in a STEM majors might lead to permanent career pathways (i.e., to become a
science teacher).
7.4 Concluding remarks
With the aim to investigate the effects of the tracking system and the other multi-dimensional
variables on Cambodian upper secondary school students’ aspirations of STEM majors
through a multilevel analysis, from the data and available evidence discussed above, this
study revealed that the total variation in the aspirations of STEM majors could be accounted
for by which class each student was in. First, based on the classroom dimension, it was
discovered that course-taking behaviour between the science and social science track at upper
secondary school of Cambodia did not have any significant influence on the students’ choice
of STEM major; rather, their decision was influenced by how interactive science and
mathematics lessons in different classes of each respective track were conducted. Moreover,
from the individual and family dimensions, gender, academic achievement, future plan in
science, and family encouragement and support played significant functions in Cambodian
upper secondary school students’ aspirations of STEM majors in higher education. Among
these significant variables, from a theoretical and practical perspective, it is worthy to note
that interactive science and mathematics lessons (active learning experiences) and future plan
in science were the strongest predictors of Cambodian upper secondary school students’
aspirations of STEM majors in higher education. In conclusion, it was not merely on what the
tracking was but on how interactive science and mathematics lessons were conducted was
found to be crucial for enhancing students’ aspirations of STEM majors.
197
CHAPTER EIGHT: OVERALL DISCUSSION, CONCLUSION, AND
IMPLICATIONS
The current study was conducted to answer the three research questions using an explanatory
sequential mixed method approaches with repeated cross-sectional design. Consequently, the
study conducted three main analyses for the three specific research questions. Analyzed the
data wave by wave, the current study, therefore produced a considerable number of findings,
yet they all boiled down to achieving one ultimate purpose: to understand students’ choice of
the science track, and the effects of tracking and the other multi-dimensional factors that
influenced Cambodian upper secondary school students to transition from the science track to
STEM majors in higher education. In this vein, this chapter first offers a brief summary of the
key conclusions to each specific research question. Second, the chapter provides an overall
discussion of the primary results for the main objective of the current study: the effects of
tracking and other factors that influence Cambodian upper secondary school students’
aspirations of STEM majors. The last part of the chapter is more practical in the way that it
envisions some possible strategic implications towards promoting Cambodian upper
secondary school students to transition from the science track into a STEM major in higher
education.
8.1 Summary of all key findings for each specific question
The main purpose of the current study was to comprehend the students’ choice of the science
track at upper secondary school and the factors that correlated with their aspirations of STEM
majors in higher education. To deeply understand the issues surrounding the aforementioned
main purpose, the current study attempted to answer three specific research questions. The
results could be concluded as follows:
• responding to Research Question 1 on Cambodian upper secondary school students’
choice of the science track, the study found that of the individual factors, performance
in science subjects, attitudes towards science, and future plan to major in STEM
affected students’ choice of the science track. Moreover, students’ engagement in their
academic pursuits by spending more time self-studying at home—particularly science
and mathematics subjects (chemistry and mathematics)—signified their likelihood of
choosing the science track among Cambodian students. Reflecting on the cultural
influence of family on academic choices, family encouragement and support
198
(especially families with more educated mothers) contributed to the variance
explaining students’ choice of the science track.
• responding to Research Question 2 on the trends and patterns of time-varying
covariates, the study exhibited that the students scored highly on science and
mathematics outcome expectations, science as a practical subject, and the importance
of science in society. However, they scored at a moderate level on mathematics self-
efficacy, science and mathematics self-concepts, interest in science at school, science
activities outside school, extracurricular activities in science, future plan in science,
support from science and mathematics teachers, and interactive science and
mathematics lessons. There was no significant difference between males and females
for most constructs. Notwithstanding, there was a significant difference between
schools and study track. Simply said, schools in Kampong Cham tended to have a
higher mean score on most of the constructs compared to schools in Phnom Penh and
Battambang. Students from NGS tended to have higher scores than students from the
other tracks. Across one academic year span, some constructs exhibited an increasing
trend, while the others showed a decreasing trend. This varied according to the
covariates of gender, school location, and study track.
• responding to Research Question 3, the main research question, on the effects of the
tracking system and other variables on Cambodian upper secondary school students’
aspirations of STEM majors in higher education, current study revealed that, based on
the classroom dimension, course-taking behaviour between the science and social
science tracks at upper secondary school in Cambodia did not have any significant
influence on the students’ choice of STEM majors. Rather, the students’ aspirations
were influenced by how interactive science and mathematics lessons in different
classes of each respective track were conducted. Moreover, from the individual and
family dimensions, gender, academic achievement, future plan in science, and family
encouragement and support played significant roles in students’ aspirations of STEM
majors in higher education. This finding highlights the importance of not merely
bifurcating upper secondary school students into different science or social science
classes, but of how science and mathematics lessons (interactive lessons) in each
respective track are conducted, of the individual attitudinal perspective, and of
encouragement and support from one’s family and school.
199
8.2 Discussion of key themes responding to the main research objective
Overall, in response to the main objective that sought to understand Cambodian upper
secondary school students’ track choice and its effect on students’ aspirations of STEM
majors in higher education, the study deduced that academic achievement and attitudinal
variables contributed to the students’ choice of the science track. Since a different track
choice had small effects on enhancing students’ academic achievement, as well as interactive
science and mathematics subjects and attitudinal constructs, students were not likely to
transition from the science track to STEM majors in higher education.
However, to draw a sound conclusion, the following questions should be discussed in relation
to the context and empirical evidence. First, how truthful and reliable are these conclusions in
the current context of Cambodian upper secondary school? How do the current findings fit
into the literature and theoretical models on students’ choice of STEM majors? How do these
findings respond to the problem stated? What kinds of implications can be drawn from the
study? The section that follows, therefore, closely examines and verifies these major
questions.
8.2.1 The claims explaining science track choice among Cambodian students
Upper secondary school years have been considered as a critical period for attracting students
to science-related majors in higher education and careers. For decades, concerns have
increased among policy makers and researchers with respect to the decline in students’
interest in science and their decision to study science worldwide. Therefore, this current study
contributes to the scarce of knowledge particularly in the developing context, regarding the
claims underlying the cause of the decline in students’ interest in science. Based on statistical
findings, corresponds to the study’s main objective, the study argues that one’s choice of
track between science and the social science at upper secondary school is significantly
influenced by academic performance in science and mathematics, attitudes towards science
(science as a practical subject and interest in science at school), and family encouragement
and support.
First, according to the results, a one-unit increase in performance in science subjects generates
a change in students’ choice of the science track by a factor of 2.81. This implies the
200
significant effect of performance in science and mathematics on students’ choice to the
science track. The findings confirm what research has revealed in the other contexts: students’
performance in science and mathematics, as well as overall academic performance, explains
students’ choice of track (Ayalon & Yogev, 1997; Dustmann, 2004; Paik & Shim, 2013).
Students with high academic achievement are more likely to choose the science track over the
humanities/social science. Although the students’ choice of track is primarily based on
individual preferences rather than academic performance, students in the science track
generally have higher positive academic performance than their counterparts (Chen, 2013;
Kinyota, 2013; Kwak, 1993; Li & Kuan, 2018; Myeong & Crawley, 1993; Paik & Shim, 2013).
Contextually, although students in the science and social science tracks take the same
subjects, the focus is different. While the science track focuses on science and mathematics
subjects, the social science track focuses on Khmer literature and social science subjects.
Also, since students in the science track need to take science and mathematics subjects in the
baccalaureate examination, those who chose the science track perceived themselves as having
higher performance in these subjects, as well as their academic achievement. On the other
continuum, those with lower performance in these subjects tended to switch from the science
to the social science track, since they believed that it would be easy to get a “passing” grade
on the examination. The qualitative interviews also support the conclusion that most students
swing from the science track due to their perceived low performance in science and
mathematics subjects. The students witnessed that the share of students in the science track
who passed the examination in recent academic years was lower than that of students in the
social science track.
Second, for the construct of attitudes towards science, the results exhibited that a one-unit
increase in science as a practical subject produces a change in Cambodian upper secondary
school students’ choice of the science track by a factor of 2.07, and a one-unit increase in
interest in science activities at school generates a change by a factor of 2.05 in one’s choice of
the science track. This finding is in line with the finding that science track members have
higher positive scores for mathematics, science and general science self-concepts, and
attitudes measures (Kinyota, 2013; Myeong & Crawley, 1993). For example, in one study,
interest, appreciation, and self-confidence decreased for students who did not choose physics,
while they did not for students who chose physics. Students’ attitudes towards physics
influenced their choice of subject (Stokking, 2000).
201
This finding posited to the stance that among the factors that had been lessening or swinging
students from science was the lessening of their attitudes towards science and future
participation in science. The present study’s statistical findings revealed that the students had
a low rating scale for attitudes towards science sub-constructs. In this regard, the declining
trend of Cambodian upper secondary school students’ interest in science might be explained
by the low attitudes towards science. That said, why do attitudes towards science matter? The
qualitative interviews explained that students did not like science, as it is hard and complex.
Most of the students interviewed argued that to do well in science, they needed to work hard
and spend a considerable amount of time and money on “private classes” to strengthen their
abilities. However, because they were “lazy” and they had a financial burden, the students
tended to recount their attitudes towards science when choosing a track.
Third, from the family dimension, it was revealed that a one-unit increase in family
encouragement and support in science generates a change in students’ choice of the science
track by a factor of 1.61. Parents’ influence was stronger for the science track than for the
social science track. If parents favour the social science track, they might not force their
children to comply with their wishes. However, if parents favour the science track, they might
be more determined for their children to choose the science track (Myeong & Crawley, 1993).
Consistent with prior studies (e.g., Simpkins et al., 2015; Shin et al., 2015), the current study
revealed that family environment tended to be a significant untapped resource of support for
students.
For example, parents’ provision of enriching experiences at home, such as playing
mathematics games, hobbies, science activities, and encouragement to take science and
complete science homework for example, were central to students’ interest in science,
knowledge, and skills. Family encouragement culture is a motivating factor in students’
persistence to study science, since it is related to the quality of family interactions, which are
intrinsically focused on or emphasize mastery goals. The encouragement and support in this
manner, from the follow-up interviews, showed that not only spiritual encouragement and
social networks, but also financial and physical support, from one’s family are important.
Further, students in the science track stressed that they needed to take private classes in
science and mathematics subjects. As mentioned earlier, students in the science track have to
take mathematics and all science subjects on the examination. To strengthen their academic
competence, they need to take private tutoring. However, students in the social science track
202
do not spend much on private tutoring, as they take only social science subjects, which are
based on rote learning. Thus, students in the science track need more financial support from
their families than students in the social science track.
While the purpose of bifurcating track choice is to guide students toward the science and
social science track in higher education, future plan in science was not a significant predictor
in their decision-making process. This result is surprising, yet reflects the qualitative results in
a few perspectives. First, some respondents reported that when choosing a track, they do not
receive any orientation on what the consequences of that choice are. For example, even
though about 80% of the respondents said that they have received information on their track
choice, the information did not cover what kind of major to pursue when choosing a particular
track at upper secondary school.
Though according to MoEYS (2004), students should be oriented on their academic and
career track, the interviewees mentioned that they did not make a well-informed choice
regarding their selected track at upper secondary school, since they did not receive much
advice on majors in higher education, which would be the consequence of track selection.
From a second perspective, some students felt that choosing the science track would merely
provide them an open pathway/open choice for selecting a major in higher education. Simply
said, the students chose the science track because they wanted to build their background
competence so that they could choose to study either the science-related or social science-
related fields upon entering higher education. However, if they choose the social science
track, they might pursue the social science-related field in higher education. In addition,
unclear future plan (or even blind choice) is also a big concern among Cambodian students.
As explained, students had lower future plan let alone a clear plan in science. Their track
choice of science or the social science was merely for their short-term goals of passing the
grade 12th national examination.
8.2.2 The effects of different tracks on time-varying covariates
For decades, studies have investigated the various effects of science-focused schools on
students’ learning outcomes, compared to their counterparts in traditional or non-science-
focused schools. Studies found that science-focused schools have a significant effects on
students’ learning outcomes (Judson, 2014; Tofel-Grehl & Callahan, 2014; Wiswall et al.,
203
2014). The section below discusses how choosing different tracks enhanced the constructs
that influenced the students’ choice of track (elaborated in the first section) and predicted their
aspirations of STEM majors (addressed in the later section).
First, from academic achievement perspective, different track had a small effect (Cohen’s d
=.25) on performance in science and mathematics subjects, which varied significantly
between students in NGS, in the science track, and in the social science track. The finding is
consistent with the general characteristics of the so-called STEM-focused schools, whose
students outperformed their counterparts in traditional schools on mathematics and reading
tests (Becker & Park, 2011; Bicer et al., 2015; Bicer et al., 2018; Han et al., 2016; Judson,
2014; Mean et al., 2016; Morrison et al., 2015; Scott, 2012). Moreover, the examination of
estimated marginal means indicated that while performance in science and mathematics
among students in the social science and science tracks exhibited a slight increase, students
from NGS showed a slight decrease in their performance from grades 10th to 11th. This is
interesting and reflects the conditions of NGS. Students in NGS need to take more
mathematics and science classes with inquiry or project-based instruction, which could
enhance their performance in the subject. Moreover, students in NGS have higher science and
mathematics self-efficacy than students in the traditional schools.
Second, different tracks also had a small effect (Cohen’s d =.07) on science as a practical
subject (a construct of attitudes towards science) from observations 1 to 2. The estimated
marginal means indicated a slight decrease in the perceived practical work in science class
among students in the NGS and in the science track. This finding is in line with other studies
(e.g., Chonkaew et al., 2016; George, 2006; OECD, 2016; Simpson & Oliver, 1990) that
found that attitudes towards science generally declined throughout middle and high school.
This phenomenon might, in part, be due to a lack of teachers’ knowledge regarding science
lab implementation. Teachers are not aware of STEM concept (MoEYS, 2018h). Although
recent advancements in teacher training facilities have started to incorporate professional
development for pre-service teachers, limited science equipment and resources are available
at all upper secondary schools (Eng & Szmodis, 2015; CDRI, 2015). The qualitative
interviews highlighted the concerning issue of the less frequent of science experiments in
science classes in Cambodia’s upper secondary school. The respondents further explained that
there are only a few experiments, mainly in chemistry subject. Sometimes the room (a
resource center in the so-called resource schools) in which the students can conduct
204
experiments is not available. The availability of equipment is also a big concern. Students
said that sometimes, they cannot carry out experiments because they do not have enough
equipment to match with the lessons.
Third, different track had a negative effect on enhancing students future plan in science but a
medium, negative trajectory in the second observation. Simply put, despite choosing the
science track at upper secondary school, students’ interest in pursuing science in higher
education is decreasing. This is surprising, as students who are exposed to more science and
mathematics classes are more likely to have higher participation in science or STEM in higher
education. However, this study found a contrasting trend. Being in the science track and
exposed to more science and mathematics lessons tended to reduce students’ future plan in
science. The estimated marginal means revealed an even more unusual trend. Students in the
science track as well as students in NGS exhibited a negative trajectory for future plan in
science. This is even more alarming, since NGS are aimed to also promote students’ interest
in STEM majors in higher education. Their future plans in science also indicated a negative
trajectory.
Next, different tracks had different effects on perceived interactive science and mathematics
lessons. The estimated marginal means signalled that students in NGS outperformed students
in the science and social science tracks in both the first and second observations. However,
there was a decreasing trend for students in NGS, while the trend remained stable for students
in the science and social science tracks. This finding also confirmed that attending a STEM-
focused school enhanced interactive science and mathematics lessons compared to
counterpart schools. Teachers in STEM-focused schools are encouraged to implement
interactive teaching and learning methods in the classrooms, including project-based learning,
inquiry-based learning involving STEM teaching, and real-world STEM experiences (Bicer et
al., 2015; Mean et al., 2016). Seemingly, inquiry and thinking are highly valued and discussed
in specialized STEM schools, but inquiry-based learning as a form of pedagogy varies greatly
in implementation across schools and disciplines. Teachers and students developed strong
social interactions through group work, small school relationships, and peer teaching and
learning, leading to higher learning outcomes in STEM-focused schools (Morrison et al.,
2015). By contrast, the declining trend in the second observation may have been due to the
fact that most teachers still employ traditional teaching method of teacher-centered (Sar,
2014; World Bank, 2012). Students might also be familiar with the interactive instruction and
205
rated relatively modest in second observation. The qualitative results highlighted that science
and mathematics teachers mostly use one-way teaching in traditional school, as in the
example where a student explained that a teacher provided some explanations and asked the
students to do practice exercises in the coursebook. Also, there was little time where students
discussed the applicability of the content in a real-life context. Mostly, the lessons were
exercise driven. Furthermore, there was no interaction effect between the tracking system and
the two observations for interactive science and mathematics lessons.
Last, of the contextual support in the STEM transfer model (family encouragement and
support) students from different tracks also perceived different levels of support and
encouragement from their families in pursuing science. Students from NGS had more support
than those in the science and social science tracks. The estimated marginal means also
indicated that NGS students tended to have higher encouragement and support from their
families than students in the science and social science tracks in both the first and second
observations. This finding reflects the context of NGS and the science track in a few manners.
First, according to NGS guidelines (as it becomes autonomous), students need to pay a
contribution fee to support the school’s operation. Thus, family plays a big role in providing
financial support to students. Second, strong encouragement and support from one’s family is
needed since students spend both time and money to participate in extracurricular activities in
science (such as science fairs and science competitions) as well as to study full-time and to
complete projects. Students in NGS participated in more extracurricular activities in science
than students in the science and social science tracks (F = 31.29, p < .001, Eta square = .08).
8.2.3 What matters most in students’ aspirations of STEM majors
The effects of tracking on students’ choice of major in general and on STEM in particular has
also been a quest among researchers for decades. In contributing to the debate on the effects
of different tracks and other multi-dimensional factors on students’ choice of STEM majors,
the findings from the current study could be explained as follows.
First, the study posited that there was no association between tracking between science and
the social science on students’ aspirations of STEM majors in higher education. Students in
the science track were not mainly orientated toward STEM majors, but tended to switch to
non-STEM majors. Current findings contradict the results of prior studies (e.g., Kinyota,
206
2013; Li & Kuan, 2018; Myeong & Crawley, 1993; Paik & Shim, 2013; Shim & Paik, 2014).
However, it was also confirmed recent studies (e.g., Darolia et al., 2019; Maltese & Tai, 2011;
Wiswall et al., 2014). This finding sounds surprising, yet reflects the contextual reality in a
few manners. First, although the ministry bifurcated the tracking system, and students in the
science track are exposed to more science and mathematics courses, there are just two-hour
and one-hour differences allocated to mathematics and each science subjects per week
between the science and social science tracks, respectively. Moreover, while not only
teaching contents but also how to effectively transfer those contents to students (teaching
methods) is embedded in the policy initiatives of the several countries that have tracking
systems (Marginson et al., 2013). As such, the teachers and teaching methods might not
change much in the context involved. Inquiry is not used by primary (MoEYS, 2019b) and
traditional upper secondary school science teachers, who tend to be more teacher-centered
(Sar, 2014; World Bank, 2012). Most of note, based on the partial eta-squared effect size
presented in the patterns of time-varying covariates, choosing a different track had a small
effect on enhancing the constructs of the STEM transfer model. Statistically speaking, the
effect size ranged from a partial eta square of .02 to .22, which indicated small to medium
effects. More seriously, across the two observations, tracking did not have any significant
impact on interactive science and mathematics lessons. This means that the level of
interactive science and mathematics lessons was not significantly different regardless of the
tracks—science and the social science track—the students attended F(1,697) = .706, p > 0.05.
Second, as discussed in the chapter on Finding III, academic achievement was among the
most influential factors influencing students’ aspirations of post-secondary STEM majors.
Statistical findings revealed that a one-unit change in academic achievement generates a
factor of 1.44 in the students’ aspirations of STEM majors in higher education. This implies
that students who have achieved well in general (and in science and mathematics in
particular) are more likely to choose STEM. Statistically speaking, the performance of the
students who were more likely to choose STEM was higher (M = 2.79) than those who chose
a non-STEM major (M = 2.28; t = -8.99, p < 0.001). This finding also confirmed that students
tend to pursue STEM majors if they believe that math and/or science is among their high-
achieving subjects (Eng & Szmodis, 2015). However, from the trends of the time-varying
covariates, the mean score of academic achievement among Cambodian students was just
average (M = 2.50). Specifically, the trends also revealed that there was variation in science
and mathematics performance across schools and study tracks. However, since different
207
tracks had small effects on enhancing the students’ academic performance in general, and
science and mathematics in particular (t = -6.71, p < 0.001, ES = .25 [small effect]), the
probability of students transitioning from the science track to STEM majors in higher
education was also low.
Third, the effect of interactive science and mathematics lessons on students’ aspirations of
STEM majors is critical. Students’ perceptions of science instruction (what teachers
performed in the classroom) significantly influenced their attitudes towards science, which in
turn influenced their academic achievement. Since science instructions that included regular
laboratory experience engaged students in the learning process of active or interactive (or
student-centered) pedagogies, which had a positive significant influence on the students’
attitudes towards, and their achievement in science (Freedman, 1997), as well as their uptake
in STEM majors (Erdogan & Stuessy, 2015; Graham et al., 2013; Simon et al., 2015).
From investigating the effect of tracking on interactive science and mathematics lessons, it
was revealed that Cambodian upper secondary school students only perceived an average
level of interaction during their science and mathematics classes; this level did not change
across the two observations as a function of study track. During the follow-up discussion, the
respondents (especially those from traditional upper secondary schools) reported that their
science and mathematics teachers usually employed a one-way (teacher-centered) method
where teachers merely explain the lesson, and ask students to do the follow-up exercises in
the course book. There were some exceptions in the NGS, where students experienced the
project-based or problem-based learning method, yet this was in small scale. Thus far, there
are only 11 NGS across the country, among which 7 are at the upper secondary school level.
Fourth, based on the family dimension, the effect of family encouragement and support also
significantly influenced Cambodian students’ aspirations of STEM majors in post-secondary
education. This finding corroborates the stance that students have higher interests in STEM if
they perceived their parents to value STEM disciplines (Eng & Szmodis, 2015). Parents
played an important role in students’ interest in STEM education, and parents’ support
seemed to have a greater influence on STEM interests compared to that of teachers’ support
in science. There was an influence of parental encouragement of science and mathematics
during the secondary school years. This was particularly influential for highly educated
parents. When children of highly educated parents cannot understand concepts or problems,
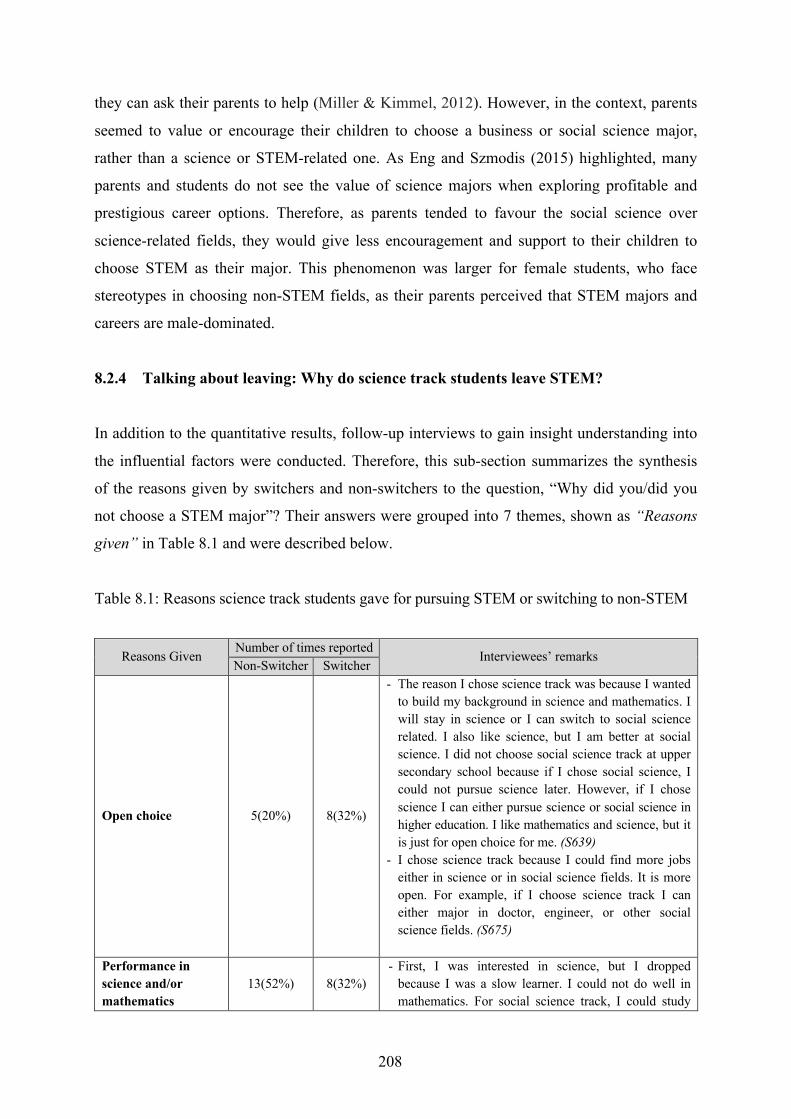
208
they can ask their parents to help (Miller & Kimmel, 2012). However, in the context, parents
seemed to value or encourage their children to choose a business or social science major,
rather than a science or STEM-related one. As Eng and Szmodis (2015) highlighted, many
parents and students do not see the value of science majors when exploring profitable and
prestigious career options. Therefore, as parents tended to favour the social science over
science-related fields, they would give less encouragement and support to their children to
choose STEM as their major. This phenomenon was larger for female students, who face
stereotypes in choosing non-STEM fields, as their parents perceived that STEM majors and
careers are male-dominated.
8.2.4 Talking about leaving: Why do science track students leave STEM?
In addition to the quantitative results, follow-up interviews to gain insight understanding into
the influential factors were conducted. Therefore, this sub-section summarizes the synthesis
of the reasons given by switchers and non-switchers to the question, “Why did you/did you
not choose a STEM major”? Their answers were grouped into 7 themes, shown as “Reasons
given” in Table 8.1 and were described below.
Table 8.1: Reasons science track students gave for pursuing STEM or switching to non-STEM
Reasons Given
Number of times reported Interviewees’ remarks
Non-Switcher Switcher
Open choice 5(20%) 8(32%)
- The reason I chose science track was because I wanted
to build my background in science and mathematics. I
will stay in science or I can switch to social science
related. I also like science, but I am better at social
science. I did not choose social science track at upper
secondary school because if I chose social science, I
could not pursue science later. However, if I chose
science I can either pursue science or social science in
higher education. I like mathematics and science, but it
is just for open choice for me. (S639) - I chose science track because I could find more jobs
either in science or in social science fields. It is more
open. For example, if I choose science track I can
either major in doctor, engineer, or other social
science fields. (S675)
Performance in science and/or mathematics
13(52%) 8(32%)
- First, I was interested in science, but I dropped
because I was a slow learner. I could not do well in
mathematics. For social science track, I could study
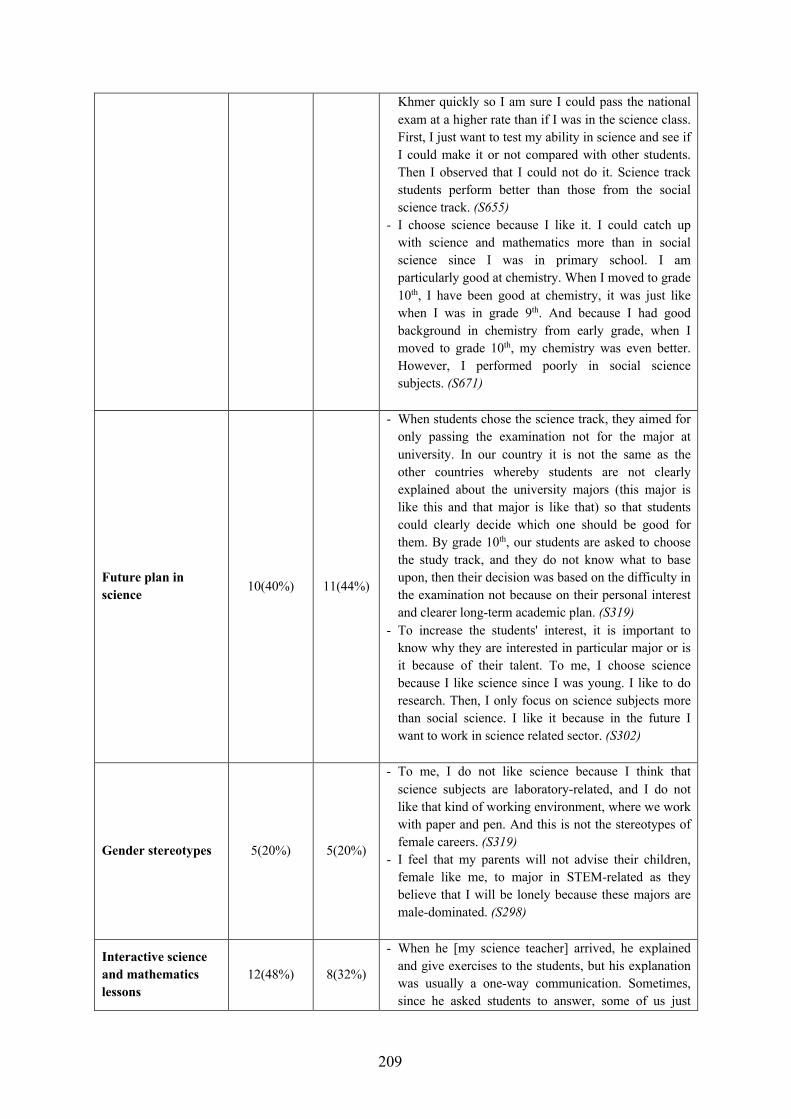
209
Khmer quickly so I am sure I could pass the national
exam at a higher rate than if I was in the science class.
First, I just want to test my ability in science and see if
I could make it or not compared with other students.
Then I observed that I could not do it. Science track
students perform better than those from the social
science track. (S655) - I choose science because I like it. I could catch up
with science and mathematics more than in social
science since I was in primary school. I am
particularly good at chemistry. When I moved to grade
10th, I have been good at chemistry, it was just like
when I was in grade 9th. And because I had good
background in chemistry from early grade, when I
moved to grade 10th, my chemistry was even better.
However, I performed poorly in social science
subjects. (S671)
Future plan in science 10(40%) 11(44%)
- When students chose the science track, they aimed for
only passing the examination not for the major at
university. In our country it is not the same as the
other countries whereby students are not clearly
explained about the university majors (this major is
like this and that major is like that) so that students
could clearly decide which one should be good for
them. By grade 10th, our students are asked to choose
the study track, and they do not know what to base
upon, then their decision was based on the difficulty in
the examination not because on their personal interest
and clearer long-term academic plan. (S319) - To increase the students' interest, it is important to
know why they are interested in particular major or is
it because of their talent. To me, I choose science
because I like science since I was young. I like to do
research. Then, I only focus on science subjects more
than social science. I like it because in the future I
want to work in science related sector. (S302)
Gender stereotypes 5(20%) 5(20%)
- To me, I do not like science because I think that
science subjects are laboratory-related, and I do not
like that kind of working environment, where we work
with paper and pen. And this is not the stereotypes of
female careers. (S319) - I feel that my parents will not advise their children,
female like me, to major in STEM-related as they
believe that I will be lonely because these majors are
male-dominated. (S298)
Interactive science and mathematics lessons
12(48%) 8(32%)
- When he [my science teacher] arrived, he explained
and give exercises to the students, but his explanation
was usually a one-way communication. Sometimes,
since he asked students to answer, some of us just
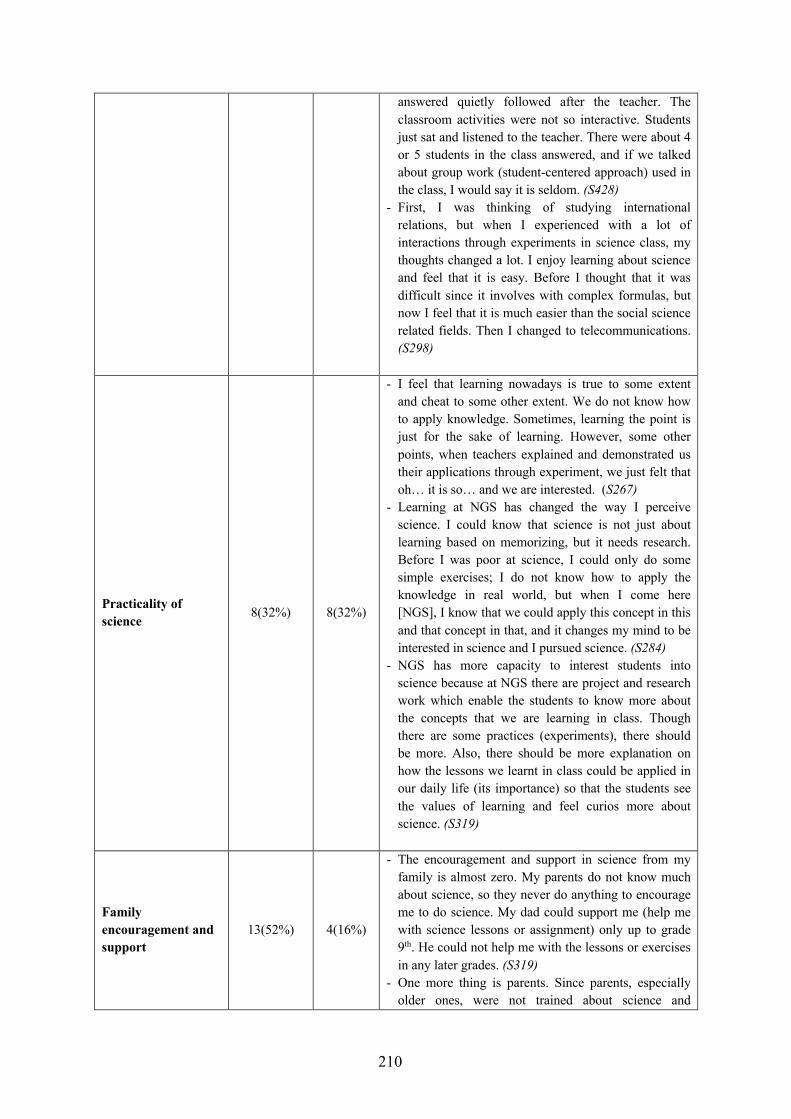
210
answered quietly followed after the teacher. The
classroom activities were not so interactive. Students
just sat and listened to the teacher. There were about 4
or 5 students in the class answered, and if we talked
about group work (student-centered approach) used in
the class, I would say it is seldom. (S428) - First, I was thinking of studying international
relations, but when I experienced with a lot of
interactions through experiments in science class, my
thoughts changed a lot. I enjoy learning about science
and feel that it is easy. Before I thought that it was
difficult since it involves with complex formulas, but
now I feel that it is much easier than the social science
related fields. Then I changed to telecommunications.
(S298)
Practicality of science 8(32%) 8(32%)
- I feel that learning nowadays is true to some extent
and cheat to some other extent. We do not know how
to apply knowledge. Sometimes, learning the point is
just for the sake of learning. However, some other
points, when teachers explained and demonstrated us
their applications through experiment, we just felt that
oh… it is so… and we are interested. (S267) - Learning at NGS has changed the way I perceive
science. I could know that science is not just about
learning based on memorizing, but it needs research.
Before I was poor at science, I could only do some
simple exercises; I do not know how to apply the
knowledge in real world, but when I come here
[NGS], I know that we could apply this concept in this
and that concept in that, and it changes my mind to be
interested in science and I pursued science. (S284) - NGS has more capacity to interest students into
science because at NGS there are project and research
work which enable the students to know more about
the concepts that we are learning in class. Though
there are some practices (experiments), there should
be more. Also, there should be more explanation on
how the lessons we learnt in class could be applied in
our daily life (its importance) so that the students see
the values of learning and feel curios more about
science. (S319)
Family encouragement and support
13(52%) 4(16%)
- The encouragement and support in science from my
family is almost zero. My parents do not know much
about science, so they never do anything to encourage
me to do science. My dad could support me (help me
with science lessons or assignment) only up to grade
9th. He could not help me with the lessons or exercises
in any later grades. (S319) - One more thing is parents. Since parents, especially
older ones, were not trained about science and
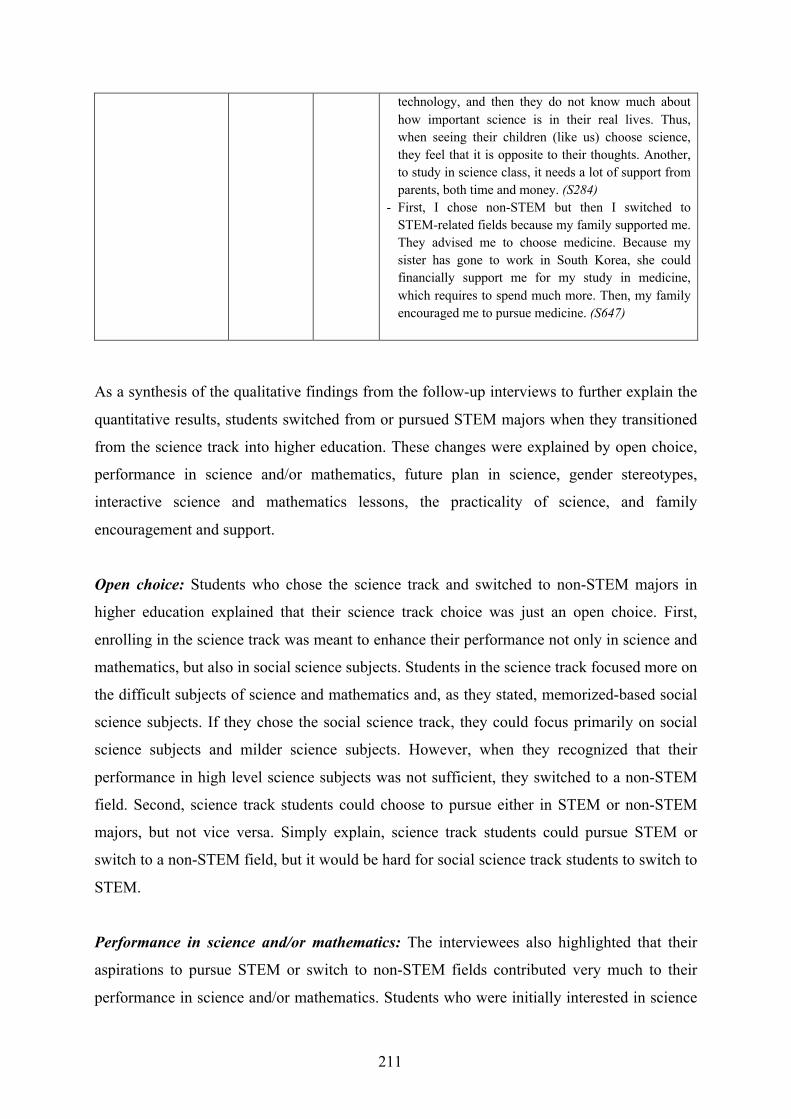
211
technology, and then they do not know much about
how important science is in their real lives. Thus,
when seeing their children (like us) choose science,
they feel that it is opposite to their thoughts. Another,
to study in science class, it needs a lot of support from
parents, both time and money. (S284) - First, I chose non-STEM but then I switched to
STEM-related fields because my family supported me.
They advised me to choose medicine. Because my
sister has gone to work in South Korea, she could
financially support me for my study in medicine,
which requires to spend much more. Then, my family
encouraged me to pursue medicine. (S647)
As a synthesis of the qualitative findings from the follow-up interviews to further explain the
quantitative results, students switched from or pursued STEM majors when they transitioned
from the science track into higher education. These changes were explained by open choice,
performance in science and/or mathematics, future plan in science, gender stereotypes,
interactive science and mathematics lessons, the practicality of science, and family
encouragement and support.
Open choice: Students who chose the science track and switched to non-STEM majors in
higher education explained that their science track choice was just an open choice. First,
enrolling in the science track was meant to enhance their performance not only in science and
mathematics, but also in social science subjects. Students in the science track focused more on
the difficult subjects of science and mathematics and, as they stated, memorized-based social
science subjects. If they chose the social science track, they could focus primarily on social
science subjects and milder science subjects. However, when they recognized that their
performance in high level science subjects was not sufficient, they switched to a non-STEM
field. Second, science track students could choose to pursue either in STEM or non-STEM
majors, but not vice versa. Simply explain, science track students could pursue STEM or
switch to a non-STEM field, but it would be hard for social science track students to switch to
STEM.
Performance in science and/or mathematics: The interviewees also highlighted that their
aspirations to pursue STEM or switch to non-STEM fields contributed very much to their
performance in science and/or mathematics. Students who were initially interested in science
212
majors and decided to switch to non-science fields acknowledged that their upper secondary
school mathematics and/or science performance was not adequate. In the very early stages,
they expressed that they would not even pass these subjects on the strict national examination.
In contrast, science track students who perceived that their performance in science and
mathematics was adequate to not only pass the national examination, but also to pursue
science-related majors in higher education, would pursue STEM. This perceived performance
triggered their interest in science and as a result their desire to pursue STEM. However, some
students tended to have lower performance in science and/or mathematics (M = 2.5, SD =
.77), and hence, most of them switched to non-STEM fields.
Future plan in science: Non-switchers explained that their clear plan in science from early
grades contributed to their choice of a STEM major. Let us examine two perspectives. First,
the development of future plan in science stems from personal interest in science. Students
expressed that their early interest shaped their plan for their major and career. Second, based
on their plan, they tried to enhance their academic performance in science and mathematics
subjects. Since this was grounded in their interests, their performance in these subjects was
better than those who did not have the same level of interest. Consistently, under this theme,
switchers from STEM majors described the uninformed choice as an explaining factor. They
were not informed about the association between the science track choice and their plan for
higher education. Thus, many non-switchers had built their choice of a STEM major on a
long-standing aspiration and had expanded their knowledge and experiences in pursuit of
these goals. Yet, leaving STEM might be caused by the negative trajectory of students’ future
plan in science from the first to the second observations (t = 4.14, p < 0.001).
Gender stereotypes: Female switchers reported that their choices were mainly based on two
reasons. First, the characteristics of STEM majors. Most female students perceived that
STEM careers are laboratory-related and did not like the perceived outside office environment
surrounded by males. This is supported by the term “chilly environment” where females feel
unwelcome. Second, following in their family’s footsteps was reported to be the norm,
especially for women. Switchers raised that their parents often viewed science-based majors
as difficult for daughters. Being in science requires a lot of difficult science subjects at school
and on the examination. Also, the working environment is inconvenient for females, as STEM
careers are perceived to be male-dominated. However, it is interesting to note that female
students who could discuss all of these issues with their parents and could ensure that they
213
have strong self-efficacy to take science or STEM majors tended to pursue their personal
interest, rather than be influenced by their parents.
Interactive science and mathematics lessons: Upper secondary school teachers of science
and mathematics were influential in students’ choice of STEM from several perspectives, one
of which was their method of developing a strong interest in science and mathematics. Under
this theme, several switchers from STEM explained that they could not understand their
teacher’s explanations. They tended to use more teacher-centered methodology. As a
consequence, the students tended to have low performance in the subject and switch to non-
STEM fields. In contrast, non-switchers explained that their teachers had more capacity to
interest the students in science by employing experiments, group work, research,
presentations, and other interactive activities that can enhance the students’ interest and
curiosity to know more about the concepts they are learning about in class. However, as
discovered in this study, the level of interactive science and mathematics lessons was not
significantly different between the science and social science tracks across one academic year
span (F = .35, p > 0.05). This might contribute to the trend of students leaving the science
track and STEM major.
The practicality of science: Non-switchers explained that their interest in science was ignited
by visualizing its real application in society. Students could know that science is not just
about learning by memorizing but needs research. It is not just about the ability to do simple
exercises, but applying knowledge in the real world, which changed their minds such that
they became interested in science and wished to pursue it. Because the school (NGS) has the
equipment, teachers can conduct experiments and the students can see that science is
practical, realistic, and they learn it. When students can visualize its application, it inspired
them, and they became more curious. In contrast, switchers reported that when they only
learnt the theory; they were not sure whether what the teacher was talking about was true or
not. Contextually, it was found that, overall, there was no significant increase in the sub-
construct of science as a practical subject from the first observation to the second observation
(t = -1.90, p > .05).
Family encouragement and support: Under this theme, non-switchers commonly stated that
they chose STEM partially because their parents or relatives work in STEM fields. Such
networks might provide students with emotional support that they would have a secured
214
career in the future. This is supported by the concept of khsae (string or network in Khmer) by
Poeu (2017). Support for a family career trend was thus mentioned by upper students who
stayed in STEM. Second, it was explained that to do well in science, students need both
financial and academic support from their families. In the beginning, they need to spend more
time and money on private classes in science and mathematics subjects to enhance their
academic performance. In the later stages, they need to spend more time and money when
taking science-related majors in higher education. Moreover, parents can help students with
homework or assignments in science subjects. However, students, especially females, tend to
have less encouragement and support to pursue science.
8.3 Conclusion
The present study was conducted in response to the declining trend of science track students
and the association between the science track at upper secondary school with students’
aspirations of STEM majors in higher education, and the limited number of graduates in this
field to feed the labour market demand for the Royal Government of Cambodia’s new trend
of economic development during Industrial 4.0. Conceptually, the study contributes to the
lack of knowledge, particularly in the developing contexts. While procedurally answering the
three specific research questions, the current study’ ultimate purpose was to objectively
comprehend the relationship between Cambodian upper secondary school students’ aspirations
of STEM majors in higher education and other multi-dimensional factors that explain their
aspirations. Several conclusions can be drawn based on the data analyzed and the results
discussed. One of the conclusions was that individual academic ability and attitudinal
variables and family encouragement and support play crucial roles in students’ choice of the
science track at upper secondary school and their aspirations of STEM majors in higher
education. Another conclusion was that attending in a different track at the upper secondary
level has an influence (yet with a small effect) on enhancing students’ transition into STEM
majors in post-secondary education. A third conclusion was that tracking into science or the
social science at upper secondary school does not have any significant association with the
students’ aspirations of STEM majors in higher education, but their aspirations are influenced
by how interactive science and mathematics lessons are conducted in each study track.
First, individual ability and attitudinal variables and family encouragement and support play
crucial roles in students’ choice of the science track at upper secondary school and their
215
aspirations of STEM majors in higher education. Students’ performance in science subjects
and attitudes towards science (the practicality of science subjects [facts and fun] and self-
interest in science at school) influence students’ choice of science track. Students’
engagement in their academic pursuits by spending more time self-studying at home
(particularly in chemistry and mathematics) signifies the likelihood of choosing the science
track. From the family dimension, reflecting the cultural influence of one’s family on
students’ choice of science track, in terms of family encouragement and support in science,
the unique cultural influence in Asian families (especially with higher educated mothers)
contributes to the variance explaining students’ choice of the science track. As Miller and
Kimmel (2012) indicated, this influence is higher for students with better educated parents,
who might help their children with homework or tasks that students do not understand or
cannot complete. The results contribute to the knowledge that the worrisome declining trend
of Cambodian students in the science track is due not only to individual academic ability and
attitudinal variables, but also to cultural influence from one’s family and the conditions of
upper secondary school.
Second, attending in science track in traditional upper secondary schools and NGS or the
social science track has an influence (yet with small effects) on enhancing the constructs that
influence students’ choice of track; this could encourage students to transition into a STEM
major in higher education. Students tended to value the importance of science and technology
in society but had low future plan to participate in science. This was very critical, as when
they moved up through the grade levels (the difference between the first and second
observations), their future plan to participate in science orbited in a negative trajectory. A
closer examination indicated the possible effect of their performance in science and
mathematics and their self-concept in doing science. Further, it is crucial to note that students
chose the social science track were directed to only pass the national examination since they
did not have to take science subjects for the examination. Some students from the science
track in both traditional schools and NGS uncovered that their science track choice was just
for an “open choice” for them. Simply put, they did not make any well-informed decisions on
what to pursue in higher education when choosing each track to study. They choose science
because it provided them with more choices of majors in higher education. In this regard, as
attending in different track had a small effect in igniting students’ interest to pursue science in
the future, it might lead them to swing from science in higher education. The trend is more
considerate for female students. As they move up through the grade levels, the effect becomes
216
more of a disadvantage for them. Therefore, although there were some effects of different
tracks across one academic year, the effects were small (effect size ranging from a partial eta-
squared =.01 to .10). The effect was in a negative trajectory, particularly for future
participation in science. More critically, there was no effect on interactive science and
mathematics lessons.
Third, tracking into science or the social science at upper secondary school did not have any
significant association with students’ aspirations of STEM majors in higher education, but the
aspirations were influenced by how interactive science and mathematics lessons were
conducted in each track. From the HLM analysis, this study found that the total variation in
choice of STEM majors can be accounted for by which class each student was in. Practices in
different classes would have different effects on students’ aspirations. This study also
provides insight whereby variables from the individual and family dimensions continued to
contribute to the students’ aspirations of STEM majors. From a theoretical and practical
angle, the interactive science and mathematics lessons, clearer future plan in science, stronger
family encouragement and support in science, and academic achievement were the strongest
predictors of Cambodian upper secondary school students’ aspirations of STEM majors.
Interactive science and mathematics lessons encompassing inquiry and problem-based
teaching practices evoked the students’ curiosity about science.
Clearer future plan in science provides a good foundation for the students to build their
competence and to prepare to take more science. With clearer plan, students might be more
prepared to achieve their plans, which could be impacted by the effect of the family
engagement and support for children’s academic endeavour. As Mullen (2011) indicated,
parents might be an untapped resource for students not only in economic terms, but also for
the sociocultural aspects of doing well in science at upper secondary school and their
transition into STEM in higher education. Overall, these findings, although not conclusive,
rather indicative—suggest that a higher level of interaction between teachers and students
during science and mathematics lessons could enhance the students’ academic achievement
in, and attitudes towards science, and ignite their interest in STEM. This evidence
underscores the need for science and mathematics teachers to change the norms of teaching,
and to be aware of their role in providing support and encouragement for students to follow in
their footsteps.
217
All in all, individual ability and attitudinal variables largely contributed to the students’
choice of the science track. However, since participating in different tracks for one academic
year had a small effect on enhancing students’ academic achievement, as well as interactive
science and mathematics subjects and individual attitudinal constructs, tracking was not
significantly associated with Cambodian upper secondary school students’ aspirations of
STEM majors in higher education. Instead, the aspirations of STEM majors were significantly
influenced by how interactive science and mathematics lessons were conducted in each track.
8.4 Implications
Current study has also thrown practical implications for increasing the likelihood of students
choosing the science track, as well as the effect of science track on enhancing students’
aspirations of STEM majors in higher education. First, to increase the probability of students
choosing science in the school environment, science and mathematics teachers can learn
practical lessons about how to attract individual students to science track. Teachers need to
realize that, in addition to boosting students’ academic performance through their teaching
practices, one of their ultimate missions is to inspire and enhance students (especially
females) such that they improve their science self-concept. Science and mathematics teachers
must not only convey scientific knowledge to students, but also put in time and effort to
model and inspire them to pursue science through addressing personal beliefs associated with
choosing science and the culture of discussing its importance. Also, because the practicality
of science subjects matters in science track choice, the most significant change is framing the
presentation of the material to make science and mathematics lessons (especially from early
grades onward) more practical, interactive, and realistic for students. Furthermore, teachers
should make science and mathematics learning active. Since there are limited resources,
“active” in this concept might not only imply doing more experiments, but also engaging
students in a mixed learning activity where they can actively investigate the world around
them. This process should start in the early grades. This could be done by strengthening
students’ academic performance and practical work in science. Also, it is critical to provide
guidance on track choice selections at upper secondary school and how it affects one’s future
major and career.
Students need to have clearer plans and stronger self-concepts in taking science. They should
receive guidance on how their decision related to their future major as early as possible.
218
Instead of having low self-concepts in science and mathematics, students should have a well-
informed plan for their academic endeavour and believe in themselves. This highlights the
crucial significance of family cultural influence. First, parents could engage in many school-
related tasks to enhance their children’s science performance and to motivate them to take
science classes. This process does not require parents to be experts in science to help their
children complete homework or to earn high scores in school. Rather, they could simply
ensure that their children have enough financial support, time, and physical space to complete
their homework and projects, as well as to self-study science and mathematics, and talk to
them about how their science class are going. Other meaningful activities include creating a
home environment for watching science shows, bringing children to museums or exposing
them to natural phenomena, and talking about current events linked to the importance of
doing well in science. These would be effective ways to inspire students, enhance their
attitude, and interest them in taking science course at school. Interventions should also take
parents’ education into consideration. Also, any policy initiative to increase the share of
enrolment in the science track should take geographic differences into consideration. Priority
should be given more to schools in the rural parts of the country. This could be done by
increasing not only the quantity but also the quality of science teaching, as well as other
enabling conditions and support.
Second, it is necessary to reinforce upper secondary schools to be effective in increasing the
level of constructs in the STEM transfer model, which can ultimately lead to higher levels of
participation among student as STEM majors in higher education. First, the teaching
approaches are the norms of the school (problem-based or inquiry-based methods) that create
opportunities for students to engage in classroom activities. Perhaps such approaches can be
implemented and supported not only in traditional schools, but also enhanced by NGS to
strengthen students’ academic outcomes and participation in STEM. Therefore, science
educators (especially at the upper secondary school level) should emphasize the practical
application of science. More efforts should be put into students learning from the primary to
secondary levels; the emphasis should be on the application of knowledge and skills in real-
life situations, particularly in terms of reading and mathematics problem-solving skills, rather
than simply the content of textbooks. Teachers should require students to understand the
contents and to be able to practically apply it to real-life situations and work scenarios.
219
Moreover, extending the practice of NGS or the teaching practices of its kind in enhancing
students’ attitudes towards (and engagement in) science and mathematics should also be an
effective measure in promoting the constructs and encouraging students’ trajectories in
science towards the STEM nexus. Therefore, the plan to expand the scope to 100 NGS by
2022, and the resource upper secondary school with more active or interactive pedagogies,
should be given high priority. In addition, science and mathematics teachers should play an
important role (apart from their delivering interactive science and mathematics lessons); they
should be role models in fostering students’ attitudes towards (and supporting their interests
in) science, helping them to learn both inside and outside the classrooms to increase their
future participation in science. Also, the implementation of extracurricular activities should be
made applicable nationwide and throughout the academic year. Moreover, family
encouragement and support should play a critical role. Some meaningful activities would be
creating a science environment outside school such as watching science shows, bringing
students to museums or exposing them to natural phenomena, and talking about current
events regarding the importance of doing well in science.
Third, the results of this study make a convincing case for enhancing students’ learning
experiences and academic achievement at upper secondary school in order to increase their
enrolment and participation in STEM majors in higher education in Cambodia. First,
optimizing learning experiences related to teaching science and mathematics should focus on
providing a learning environment with a high level of interaction to push for cognitive
activation. Put simply, increasing only teaching hours in the current science track would be
misguided, and might not ignite inspiring learning experiences without considering more
interactive teaching methods that involve inquiry-based and project-based teaching. Broadly
speaking, changes to the intensive margins for improvement might include recruiting more
qualified teachers, modifying student and teacher incentives, and improving teaching facilities
and instructional materials that nurture an interactive learning atmosphere for science and
mathematics. Noting these challenges, the lack of effects in expanding course access
(documented in this study) suggests that for the Cambodian upper secondary school science
track to be more effective in promoting students’ STEM interest and success, the norms of
upper secondary school instruction in science and mathematics classes (especially of the
science track in traditional school) will need to be reconsidered and enhanced.
220
The process leading to entrance into STEM fields is complex, as it involves numerous
influences of individual, psychological, contextual, and social factors. Together, they shape,
develop, and sustain the students’ interest, and eventually turning it into an actual choice.
Also, since freedom of choice without guidance and information could mislead students to
insufficiently prepare for some majors, more attention should be given to providing relevant
information about higher education majors and STEM careers, especially among the
underrepresented groups. Thus, explaining how track choice in general, and science track
choice in particular, is associated with future majors and career prospects should be given
special attention by the extant (or to be developed) career counseling office so that students
could have enough information to make a well-informed, rather than an uninformed or blind
decision. This will encourage students to have a better-informed, long-term future plan in
general and in science in particular.
Relevant information about college majors and careers in STEM, targeted specifically toward
underrepresented female subgroups should be considered. At the upper secondary school-
level science track, females represents a higher proportion (53%). However, their science
identity seemed shaded out when choosing STEM majors in higher education (approximately
17%). Thus, special priority should be given to enhance female competence and self-efficacy
beliefs relating science and mathematics, so as to foster an early sense of identity as future
scientists throughout the transition from secondary school to post-secondary education to
work. Science teachers could also enhance parents’ preconceptions and gender stereotypes
relating to mathematics by raising their awareness of these processes. Again, the delivery of
the aforementioned implications should be equitable for all vulnerable groups so that they
could accumulate inspiring science learning experiences and pursue STEM majors in higher
education.
8.5 Further studies
With its limitations, the current study has also thrown some implications for further study so
as to elucidate the full landscape of students’ decision to transition from upper secondary
school to STEM in higher education in Cambodia. First, to gain a deeper insight into students’
choices, a pragmatic investigation is crucial. Due to time constraints, the current study could
only examine the issue based on students’ aspirations of STEM majors in higher education.
Thus, future study, in employing the mixed methods longitudinal designs (the present study’s
221
original design, which was redesigned due to the problem of data collection being interrupted
by the Covid-19 pandemic), would provide an insightful understanding of the issue by
scrutinizing students’ final choice of major in higher education and utilizing the standardized
science and mathematics scores. The analysis of the results should consider the type of HEIs
(public, private, prestigious, etc.). Moreover, the study could follow up with students to
identify who will stay in STEM for their final choice of major, and those who will switch to
non-STEM. This future study could not only shed light on students’ final choice, but also
their retention in STEM in higher education.
Based on a longitudinal design, another study should investigate the performance of students
who stay in STEM and those in non-STEM fields and their returns/investments to higher
education across students from different types of upper secondary school (NGS and
traditional schools). This would provide an evidence-based policy to enhance students’
interest in STEM majors and to revisit some practices of traditional and new generation upper
secondary schools. Actual classroom observation data on science and mathematics teachers
teaching practice should be used. Additionally, understanding the full landscape of the
changes in time-varying covariates at the end of grade 12th would also be meaningful.
Last, experimental design study is crucial for examining the significant predictors of students’
choice of STEM majors. For example, a quantitative study on the effects of implementing
interactive teaching methods for science and mathematics lessons, or a study on promoting
students’ self-efficacy and outcome expectations in science and mathematics through
experimental interventions in relation to students’ interest in STEM, and finally their choice
of STEM majors, would also be practical.
222
REFERENCES Adelman, C. (1999). Women and men of the engineering path: A model for analysis of
undergraduate careers. Washington D.C. National institute of science education. Almeida, M.J., Leite, M.S., & Woolnough, B.E. (1998). Factors affecting students’ choice of
science and engineering in Portugal. Research Report, 1-10. Anwer, M., Iqbal, H. M., & Harrison, C. (2012). Students’ attitude towards science: A case of
Pakistan. Pakistan Journal of Social and Clinical Psychology, 9(2), 3-9. Arnold, J. (2004). The congruence problem in John Holland's theory of vocational
decisions. Journal of Occupational and Organizational Psychology, 77(1), 95-113. Arslan, Y. (2016). Determinants of the choice of high school track in Turkey [Unpublished
master’s thesis]. Institute of Social Science. Asian Development Bank [ADB]. (2011). Improving instructional quality: Focus on faculty
development [Study Report]. Higher Education in Dynamic Asia. Asian Development Bank-International Labour Organization [ADB-ILO]. (2015). Cambodia:
Addressing the skills gap. Mandaluyong City, Philippines: Asian Development Bank. Awan, R. U. N., Sarwar, M., Naz, A., & Noreen, G. (2011). Attitudes toward science among
school students of different nations: a review study. Journal of College Teaching and Learning, 8(2), 43-50.
Ayalon, H., & Yogev, A. (1997). Students, schools, and enrollment in science and humanity courses in Israeli secondary education. Educational Evaluation and Policy Analysis, 19(4), 339-353.
Ayres, D. M. (1999). The Khmer Rouge and education: beyond the discourse of destruction. History of Education, 28(2), 205-218.
Ayres, D. M. (2000). Tradition, modernity, and the development of education in Cambodia. Comparative Education Review, 44(4), 440-463.
Bagozii, R. B., & Burkrant, R. E. (1979). Attitude organization and the attitude behavior relationship. Journal of Personality and Social Psychology, 37, 913-929.
Bandura, A. (1986). Social foundations of thought and action. Englewood Cliffs, NJ, 1986. Bandura, A. (2010). Self‐efficacy. The Corsini Encyclopedia of Psychology, 1-3. Baran, M., & Maskan, A. (2011). The effect of project-based learning on pre-service physics
teachers electrostatic achievements. Cypriot Journal of Educational Sciences, 5(4), 243–257.
Barmby, P., Kind, P. M., & Jones, K. (2008). Examining changing attitudes in secondary school science. International Journal of Science Education, 30(8), 1075-1093.
Becker, H. J. (1986). Instructional uses of school computers: Reports from the 1985 national survey, 1985 [Report No. ED 274.319]. Baltimore, MD: Center for Social Organisation of School.
Becker, K., Park, K. (2011). Effects of integrative approaches among science, technology, engineering, and mathematics (STEM) subjects on students' learning: A preliminary meta-analysis. Journal of STEM Education: Innovations & Research, 12(5–6), 23–36.
223
Betz, N. E., & Hackett, G. (1983). The relationship of mathematics self-efficacy expectations to the selection of science-based college majors. Journal of Vocational behavior, 23(3), 329-345.
Bicer, A., Capraro, R. M., Capraro, M. M. (2018). Hispanic students’ mathematics achievement in the context of their high school types as STEM and non-STEM schools. International Journal of Mathematical Education in Science and Technology, 49(5), 705–720.
Bicer, A., Navruz B., Capraro, R. M., Capraro. M. M., Oner, T. A, Boedeker, P. (2015) STEM schools vs. non-STEM schools: Comparing students' mathematics growth rate on high-stakes test performance. International Journal of New Trends in Education and Their Implications, 6(1), 138–150.
Bieri Buschor, C., Berweger, S., Keck Frei, A., & Kappler, C. (2014). Majoring in STEM—What accounts for women's career decision making? A mixed methods study. The Journal of Educational Research, 107(3), 167-176.
Blaug, M. (1976). The empirical status of human capital theory: A slightly jaundiced survey. Journal of Economic Literature, 14(3), 827-855.
Bleeker, M.M., & Jacobs, J.E. (2004). Achievement in math and science: Do mother’s beliefs matter 12 years later. Journal of Educational Psychology, 96(1), 97-109.
Bonous, H. (2000). Pathways to success: affirming opportunities for science, mathematics and engineering majors. The Journal of Negro Education, 69(1/2), 92-111.
Bottia, M. C., Stearns, E., Mickelson, R. A., Moller, S., & Valentino, L. (2015). Growing the roots of STEM majors: Female math and science high school faculty and the participation of students in STEM. Economics of Education Review, 45, 14-27.
Brand, J. E., & Xie, Y. (2010). Who benefits most from college? Evidence from negative selection in heterogeneous economic returns to higher education. American Sociological Review, 75(2), 273-302.
Breakwell, G. M., & Beardsell, S. (2016). Gender, parental and peer influences upon science attitudes and activities. Public Understanding of Science, 1(2), 183-197.
Breiner et al. (2012). What is STEM? A discussion about conceptions of STEM in education and partnerships. School Science and Mathematics, 112(1), 3-11.
British Embassy. (2016). STEM career of the future. British Embassy. Phnom Penh, Kingdom of Cambodia.
Brown, P. (1995). Cultural capital and social exclusion: Some observations on recent trends in education, employment and the labour market. Work, Employment and Society, 9 (1), 29-51.
Brown, P. (1997) Cultural capital and social exclusion: Some observations on recent trends in education, employment and the labour market, in Halsey, A. H. et al. Education: Culture, economy and society, Oxford: Oxford University Press.
Brown, S. A. (1976). Attitude goals in secondary school science. University of Stirling. Department of Education.
Bryman, A. (2016). Social research methods. Oxford university press. Bucher, R. (1979). Social structural constraints in career decision making occupational
hurdles. In A. M. Mitchell, G. B. Jones, & J. D. Krumboltz (Eds.), Social learning and career decision making (pp. 116-133). Cranston, RI: Carroll Press.
224
Cambodia Development Resource Institute [CDRI]. (2015). Cambodia education 2015: Employment and empowerment? Phnom Penh, Kingdom of Cambodia.
Cambodia Development Resource Institute [CDRI]. (2018). Cambodia development research forum (DRF) symposium 2018: Post-secondary education development through multi-stakeholder engagement. Phnom Penh, Kingdom of Cambodia.
Cambodian Federation of Employers and Business Association [CAMFEBA]. (2008). Youth and employment: Bridging the gap. A study about youth and employer perspective on education, skills, opportunities and the future. Youth Employment and social dialogue project YEP Project.
Center for Research and Development Strategy [CRDS]. (2015). Current status on science and technology in ASEAN countries. Oversea Research Report. Japan Science and Technology Agency
Chen, X., (2013). STEM Attrition: College Students' Paths into and out of STEM Fields. Statistical Analysis Report. NCES 2014-001. National Center for Education Statistics.
Chen, X., & Soldner, M. (2014). STEM attrition: College students’ path into and out of STEM field. National Center of Education Statistics.
Chen, X., & Weko, T., (2009). States in brief: Students who study science, technology, engineering, and mathematics (STEM) in postsecondary education. National Center for Education Statistics. U.S. Department of Education.
Chey, C. O., & Khieu, V. (2017). Cognitive domain, level of difficulty and topic distribution of the science stream in the national exit examination in Cambodia. Cambodia Education Review, 1(1), 33-48.
Chhinh, S., Edwards Jr. B., Williams, H.J., & Yu, K. (2015) In Hawkins, N.J. and Jacob, W.J. (Eds). The political economy of schooling in Cambodia. Issues of quality and equity. introduction. Palgrave Machillan, 3-11.
Chonkaew, P., Sukhummek, B., Faikhamta, C. (2016). Development of analytical thinking ability and attitudes towards science learning of grade-11 students through science technology engineering and mathematics (STEM education) in the study of stoichiometry. Chemistry Education Research and Practice, 17(4), 842–861.
Clayton, T., & Yuok, N. (1997). Cambodia. In Gerard, P. & Grace, M. (Ed), Asian higher education (pp. 21-36). Westport, Conn.: Greenwood Press.
Cohen, J. (1988). Statistical power analysis for the behavioral science (2nd Eds). Hillsdale, NJ: Lawrence Earlbaum Association.
Cohen, L. M. L., & Morrison, K. (2007). Research methods in education 6th edition. London: Rouledge.
Conrad, S., Canetto, S. S., MacPhee, D., & Farro, S. (2009). What attracts high-achieving socioeconomically disadvantaged students to the physical sciences and engineering? College Student Journal, 43(4), 1359.
Crawley, F. E., & Black, C. B. (1992). Causal modeling of secondary science students' intentions to enroll in physics. Journal of Research in Science Teaching, 29(6), 585-599.
Creswell, J. W., & Creswell, J. D. (2018). Research design: Qualitative, quantitative, and mixed methods approaches. Sage publications.
225
Creswell, J. W., & Poth, C. N. (2018). Qualitative inquiry and research design: Choosing among five approaches. Sage publications.
Crisp, G., Nora, A., & Taggart, A., (2009). Student characteristics, pre-college, college, and environmental factors as predictors of majoring in and earning a STEM degree: An analysis of students attending a Hispanic serving institution. American Educational Research Journal, 46(4), 924-942.
Dainton, F. S. (1968). The Dainton Report: An inquiry into the flow of candidates into science and technology.
Darolia, R., Koedel, C., Main, J. B., Ndashimye, J. F., & Yan, J. (2018). High School Course Access and Postsecondary STEM Enrollment and Attainment. Educational Evaluation and Policy Analysis, 42(1), 22-45.
DeBoer, G.F. (1987). Predicting continue participation in college chemistry for men and women. Journal of Research in Science Teaching, 24(6), 527-538.
DesJardins, S. L., Dundar, H., & Hendel, D. D. (1999). Modeling the college application decision process in a land-grant university. Economics of Education Review, 18, 117-132.
Dick, T.P., & Rallis, S.F. (1991). Factors influences on high school students’ career choices. Journal for Research in Mathematics Education, 22(4), 281-292.
Dom, V., & Yi, G. (2018). Gender and Subject Choice: An Empirical Study on Undergraduate Students' Majors in Phnom Penh. Online Submission, 7(1), 40-47.
Durdyev, S., & Ihtiyar, A. (2019). Structural equation model of factors influencing students to major in architecture, engineering, and construction. Journal of Professional Issues in Engineering Education and Practice, 145(2), 1-8.
Dustmann, C. (2004). Parental background, secondary school track choice, and wages. Oxford Economic Papers, 56(2), 209-230.
Dustmann, C., Puhani, P. A., & Schönberg, U. (2017). The long‐term effects of early track choice. The Economic Journal, 127(603), 1348-1380.
Eam, P., Keo, B., Leng, P., Song, S., & Khieng, S. (2019). Correlates of STEM major choice: a quantitative look at Cambodian university freshmen. Research in Science & Technological Education, ahead-of-printing, 1-19.
Eccles, E. (1994). College majors choice and change in the gender wage gap. Contemporary Economic Policy, 12, 47-66.
Ekmekci, A., Sahin, A., & Waxman, H. (2019). Factors Affecting Students’ STEM Choice and Persistence: A Synthesis of Research and Findings from the Second Year of a Longitudinal High School STEM Tracking Study. In STEM Education 2.0 (pp. 279-304). Brill Sense.
Eng, S., & Szmodis, W. (2016). Stem Learning Achievement among Cambodian Middle School Students: An Examination of Gender and Psychosocial Factors. In Annual Review of Comparative and International Education 2015 (pp. 279-305). Emerald Group Publishing Limited.
Engle, J., & Tinto, V. (2008). Beyond access: College success for low income, first generation students. Washington, DC: Pell Institute.
English, L. D. (2016). STEM education K-12: Perspectives on integration. International Journal of STEM Education, 3(1), 3.
226
Erdogan, N., & Stuessy, C. L. (2015). Modeling successful STEM high schools in the United States: An ecology framework. International Journal of Education in Mathematics, Science and Technology, 3(1), 77-92.
Evans, C. A., Chen, R., & Hudes, R. P. (2020). Understanding Determinants for STEM Major Choice Among Students Beginning Community College. Community College Review, 48(3), 227-251.
Field, A. (2009). Discopering statistics using SPSS (3rd Ed). Sage publication. Fleming, L., Engerman, K., & Griffin, A. (2005). Persistence in engineering education:
Experiences of first year students at a historically black university. In Proceedings of the 2005 American Society for Engineering Education Annual Conference & Exposition, American Society for Engineering Education (pp. 1-7).
Forsthuber, B., Motiejunaite, A., & de Almeida Coutinho, A. S. (2011). Science education in Europe: national policies, practices and research. Education, Audiovisual and Culture Executive Agency, European Commission.
Fouad, N. A., & Smith, P. L. (1996). A test of a social cognitive model for middle school students: Math and science. Journal of Counseling Psychology, 43(3), 338-346.
Fouad, N. A., Smith, P. L., & Enochs, L. (1997). Reliability and validity evidence for the middle school self-efficacy scale. Measurement and Evaluation in Counseling and Development, 30(1), 17-31.
Francis, L. J., & Greer, J. E. (1999). Measuring attitude towards science among secondary school students: The affective domain. Research in Science & Technological Education, 17(2), 219-226.
Fraser, B. J. (1981). TOSRA: Test of science-related attitudes: Handbook. Australian Council for Educational Research.
Freedman, M. P. (1997). Relationship among laboratory instruction, attitude toward science, and achievement in science knowledge. Journal of Research in Science Teaching: The Official Journal of the National Association for Research in Science Teaching, 34(4), 343-357.
Freeman, B.; Marginson, S. & Tytler, R. (Eds.). (2015). The age of STEM: Educational policy and practice across the world in science, technology, engineering and mathematics. Routledge.
Fritz, C. O., Morris, P. E., & Richler, J. J. (2012). Effect size estimates: current use, calculations, and interpretation. Journal of experimental psychology: General, 141(1), 2-18.
Furnham, A. (2001). Vocational preference and P-O fit: reflections on Holland’s theory of vocational choice, Applied Psychology: An International Review, 50(1), 5-29.
Gamoran, A. (1992). The variable effects of high school tracking. American Sociological Review, 812-828.
Gardner, P. L. (1975). Attitudes to science: A review. Studies in Science Education, 2(1975), 1-44.
Gaskell, P.J., Mclaren, A., Oberg, A., & Eyre, L. (1993). The 1990 British Columbia Mathematics Assessment: Gender issue in choice of mathematics and science. Gender And Education-Abingdon, 6, 220-220.
George, C.E. (2012). Generation me: Influence of students’ choice of major. Project STEP-UP. University of Illinois at Urbana-Champaign.
227
George, R. (2000). Measuring change in students' attitudes toward science over time: An application of latent variable growth modeling. Journal of Science Education and Technology, 9(3), 213-225.
George, R. (2006). A cross‐domain analysis of change in students’ attitudes toward science and attitudes about the utility of science. International Journal of Science Education, 28(6), 571-589.
Germann, P. J. (1988). Development of the attitude toward science in school assessment and its use to investigate the relationship between science achievement and attitude toward science in school. Journal of Research in Science Teaching, 25(8), 689-703.
Gibson, H. L., & Chase, C. (2002). Longitudinal impact of an inquiry‐based science program on middle school students' attitudes toward science. Science Education, 86(5), 693-705.
Goyette, K. A., & Mullen, A. L. (2006). Who study the arts and sciences? Social background and the choice and consequences of undergraduate field of study. The Journal of Higher Education, 77(3), 497-538.
Graham, M. J., Frederick, J., Byars-Winston, A., Hunter, A. B., & Handelsman, J. (2013). Increasing persistence of college students in STEM. Science, 341(6153), 1455-1456.
Grandy, J. (1992). Graduate enrollment decisions of undergraduate science and engineering majors: A survey of GRE test takers [GRE Board Report No. 85-01P]. Princeton.
Green, M. (2007). Science and engineering degrees: 1966-2004. Virginia: National Science Foundation, pp. 1-72. Science Resources Statistics.
Guba, E. G. (1990). The paradigm dialog. In Alternative paradigms conference, Mar, 1989, Indiana U, school of education, San Francisco, CA, US. Sage Publications, Inc.
Gunderson, E. A., Ramirez, G., Levine, S. C., & Beilock, S. L. (2012). The role of parents and teachers in the development of gender-related math attitudes. Sex Roles, 66(3-4), 153-166.
Hacieminoglu, E. (2016). Elementary School Students' Attitude toward Science and Related Variables. International Journal of Environmental and Science Education, 11(2), 35-52.
Hackett, C. (1985). Role of mathematics self-efficacy in the choice of math-related majors of college women and men: a path analysis. Journal of Counseling Psychology, 31(1), 47-56.
Hackett, G., & Betz, N. E. (1981). A self-efficacy approach to the career development of women. Journal of Vocational Behavior, 18(3), 326-339.
Haladyna, T., Olsen, R., & Shaughnessy, J. (1982). Relations of student, teacher, and learning environment variables to attitudes toward science. Science Education, 66(5), 671-687.
Hammrich, P. (1998). Promoting females’ success in science. Journal of Supervision and Curriculum Development, 1(4), 20-24.
Han, S., & Buchmann, C. (2016). Aligning science achievement and STEM expectations for college success: A Comparative study of curricular standardization. RSF: The Russell Sage Foundation Journal of the Social Sciences, 2(1), 192-211.
Handley, H. M., & Morse, L. W. (1984). Two‐year study relating adolescents' self‐concept and gender role perceptions to achievement and attitudes toward science. Journal of Research in Science Teaching, 21(6), 599-607.
228
Hanushek, E. A., & Wößmann, L. (2006). Does educational tracking affect performance and inequality? Differences‐in‐differences evidence across countries. The Economic Journal, 116(510), C63-C76.
Harwell, E. (2012). An analysis of parent occupation and student choice in STEM majors. Project STEP-UP. University of Illinois at Urbana-Champaign.
Heaverlo, C. (2011). STEM development: A study of 6th-12th grade girls' interest and confidence in mathematics and science (Unpublished doctoral dissertation), Iowa State University, United States of America.
Hechter, M., & Kanazawa, S. (1997). Sociological rational choice theory. Annual Review of Sociology, 23(1), 191-214.
Hill, N. E., & Tyson, D. F. (2009). Parental involvement in middle school: a meta-analytic assessment of the strategies that promote achievement. Developmental Psychology, 45(3), 740.
Hodson, D., & Freeman, P. (1983). The effect of primary science on interest in science: some research problems. Research in Science & Technological Education, 1(1), 109-118.
Hogan, R., & Blake, R. (1999). John Holland's vocational typology and personality theory. Journal of Vocational Behavior, 55(1), 41-56.
Holland, J. L. (1959). A theory of vocational choice. Journal of Counseling Psychology, 6(1), 35-45.
Holland, J. L. (1966). The psychology of vocational choice: A theory of personality types and model environments. Waltham, MA: Blaisdell.
Holmegaard, H. T., Madsen, L. M., & Ulriksen, L. (2014). To choose or not to choose science: Constructions of desirable identities among young people considering a STEM higher education programme. International Journal of Science Education, 36(2), 186-215.
Hossler, D., Braxton, J., & Coopersmith, G. (1989). Understanding student college choice. Higher education: Handbook of theory and research, 5, 231-288.
Hu, N.B. (1996). Effects of college students’ perception of labor market variables and conditions on their choice of academic majors. Eric 1996 Annual Forum Paper.
Huang, G., Taddese, N., Walter, E. (2000). Entry and persistence of women and minorities in college science and engineering education. [Research and Development Report ED444872], ERIC.
Ishikawa, M., Fuji. S., & Moehle, A. (2013). STEM country comparison: Japan. Retrieved May 01, 2018, from https://acola.org.au/wp/stem-consultants-reports/.
Ito, T. A., & McPherson, E. (2018). Factors influencing high school students’ interest in pSTEM. Frontiers in Psychology, 9, 1-13.
Ivankova, N. V., & Stick, S. L. (2007). Students’ persistence in a distributed doctoral program in educational leadership in higher education: A mixed methods study. Research in Higher Education, 48(1), 93-135.
Japan International Cooperation Agency [JICA]. (2016). Data collection survey on human resource development for industrialization in the education sector in the Kingdom of Cambodia. Final Report [HM-JR-16-042], JICA, Kingdom of Cambodia.
Jone, G., Howe, A., & Rua, M. (2000). Gender differences in students’ experiences, interests, and attitude towards science and scientists. Science Education, 84(1), 180-192.
229
Judson, E. (2014). Effects of transferring to STEM-focused charter and magnet schools on student achievement. The Journal of Educational Research, 107(4), 255–266.
Kaing. S. (2016). How can STEM education help stimulate economic growth in Cambodia. (Unpublished Master’s Thesis). Vrije Universiteit, Brussel.
Kao, S. (2019a). Cambodian Upper Secondary School Students' Attitudes towards Science: Trends and Patterns. Journal of International Development and Cooperation, 26(1), 15-27.
Kao, S. (2019b). Family socioeconomic status and students’ choice of STEM majors. International Journal of Comparative Education and Development, 22(1), 49-65.
Kao, S., & Shimizu, K. (2019). Factors affecting students’ choice of science and engineering majors in higher education of Cambodia. International Journal of Curriculum Development and Practice, 21(1), 69-82.
Kelly, A. (1988). Option choice for girls and boys. Research in Science and Technology Education, 6(1), 5-23.
Kerr, S. P., Pekkarinen, T. & Uusitalo, R. (2013). School tracking and development of cognitive skills. Journal of Labor Economics, 31(3), 577–602.
Keselman, A. (2003). Supporting inquiry learning by promoting normative understanding of multivariable causality. Journal of Research in Science Teaching, 40(9), 898–921.
Kienzl, G. S., & Trent, W. T. (2009). Underrepresented undergraduates in STEM: From matriculation to degree completion at large, research-intensive public universities.
Kier, M. W., Blanchard, M. R., Osborne, J. W., & Albert, J. L. (2014). The development of the STEM career interest survey (STEM-CIS). Research in Science Education, 44(3), 461-481.
Kind, P. M., Jones, K., & Barmby, P. (2007). Developing attitude towards science measure. International Journal of Science Education, 29(7), 871-893.
Kinyota, M. (2013). Students’ perceptions of factors influencing choice of science streams in Tanzania secondary schools (Master’s thesis). Available from Master's Capstone Projects (166).
Koballa Jr, T. R. (1988). The determinants of female junior high school students' intentions to enroll in elective physical science courses in high school: Testing the applicability of the theory of reasoned action. Journal of Research in Science Teaching, 25(6), 479-492.
Krumboltz, J.D. (1979). A social learning theory of career decision making. In A. M. Mitchell, G. B. Jones, & J.D. Krumboltz (Eds). Social learning and career decision making (pp.19-49). Cranston, RI: Carroll Press.
Kwak, Y. (1993). A study of academic high school female students’ choice of major fields of study. The Study of Sociology of Education, 3(1), 79-106.
Lapan, R.T., Boggs, K.R. & Morrill, W.H. (1989). Self-efficacy as a mediator of investigative and realistic general occupational themes on the strong-Campbell interest inventory. Journal of Counseling Psychology, 31, 356-362.
Lavy, V., & Sand, E. (2015). On the origins of gender human capital gaps: Short and long term consequences of teachers’ stereotypical biases [Report No. w20909]. National Bureau of Economic Research.
Lee, J. (2009). Universals and specifics of math self-concept, math self-efficacy, and math anxiety across 41 PISA 2003 participating countries. Learning and Individual Differences, 19(3), 355-365.
230
Lee, O., & Luykx, A. (2006). Science education and student diversity: Synthesis and research agenda. Cambridge University Press.
Lee, S. W., Min, S., & Mamerow, G. P. (2015). Pygmalion in the classroom and the home: Expectation’s role in the pipeline to STEMM. Teachers College Record, 117(9), 1-36.
Lee, V. E. (1987). Identifying Potential Scientists and Engineers: An Analysis of the High School-College Transition. Report 2: Multivariate Analysis of the High School Class of 1982 [Technical Report ED308063]. ERIC.
Leech, N., Barrett, K., & Morgan, G. A. (2005). SPSS for intermediate statistics: Use and interpretation (2nd ed). Lawrence Erlbaum Associates, Inc., Publishers
Lent, R. W., Brown, S. D., & Hackett, G. (1994). Toward a unifying social cognitive theory of career and academic interest, choice, and performance. Journal of Vocational Behavior, 45, 79-122.
Lent, R. W., Brown, S. D., & Hackett, G. (2002). Social cognitive career theory. Career Choice and Development, 4, 255-311.
Lent, R. W., Lopez Jr, A. M., Lopez, F. G., & Sheu, H. B. (2008). Social cognitive career theory and the prediction of interests and choice goals in the computing disciplines. Journal of Vocational Behavior, 73(1), 52-62.
Lent, R. W., Sheu, H. B., Miller, M. J., Cusick, M. E., Penn, L. T., & Truong, N. N. (2018). Predictors of science, technology, engineering, and mathematics choice options: A meta-analytic path analysis of the social–cognitive choice model by gender and race/ethnicity. Journal of Counseling Psychology, 65(1), 17-35.
Lent, R.W., Lopez, F.G., & Bieschke, K.J. (1991). Mathematics self-efficacy: Sources and relation to science based career choice. Journal of Counseling Psychology, 38(4), 424-430.
Lent, R.W., Lopez, F.G., & Bieschke, K.J. (1993). Predicting mathematics-related choice and success behaviors: Test of an expanded social cognitive model. Journal of Vocational Behavior, 42(2), 223-236.
Lent, R.W., Sheu, H.B., Singley, D., Schmidt, J.A., Schmidt, L.C., & Gloster, C.S. (2008). Longitudinal relations of self-efficacy to outcome expectations, interests, and major choice goals in engineering students. Journal of Vocational Behavior, 73(2), 328-335.
Leong, F. T. L., Austin, J. T., Sekaran, U., & Komarraju, M. (1998). An evaluation of the cross-cultural validity of Holland’s theory: Career choices by workers in India. Journal of Vocational Behavior, 52(3), 441-455.
Leppel, K., Williams, M. L., & Waldauer, C. (2001). The impact of parental occupation and socioeconomic status on choice of college major. Journal of Family and Economic Issues, 22(4), 373-394.
Leslie, L.L., McClure, G.T., & Oaxaca, C.L. (1998). Women and minorities in science and engineering: A life sequence analysis. The Journal of Higher Education, 69(3), 239-276.
LeTendre, G. K., Hofer, B. K., & Shimizu, H. (2003). What is tracking? Cultural expectations in the United States, Germany, and Japan. American Educational Research Journal, 40(1), 43-89.
Li, X., & Kuan, P. Y. (2018). The effect of single-sex schooling on high school girls’ curriculum tracking selection in Taiwan. International Sociological Association, 302-303.
231
Lichtenberger, E., & George-Jackson, C. (2013). Predicting High School Students' Interest in Majoring in a STEM Field: Insight into High School Students' Postsecondary Plans. Journal of Career and Technical Education, 28(1), 19-38.
Lincoln, Y. S., Lynham, S. A., & Guba, E. G. (2011). Paradigmatic controversies, contradictions, and emerging confluences, revisited. The Sage Handbook of Qualitative Research, 4, 97-128.
Lindner, J.R. et al. (2004) Students’ belief about science and sources of influence affecting science career choice. NACTA Journal, 1-7.
Lopatto, D. (2007). Undergraduate research experiences support science career decisions and active learning. CBE—Life Sciences Education, 6(4), 297-306.
Lowinger, R., & Song, H. A. (2017). Factors Associated with Asian American Students’ Choice of STEM Major. Journal of Student Affairs Research and Practice, 54(4), 415-428.
Lucas, S. R. (1999). Tracking inequality: Stratification and mobility in American high schools. Sociology of education series. Teachers College Press, 1234 Amsterdam Avenue, New York, NY 10027.
Ma, Y. (2009). Family socioeconomic status, parental involvement, and college major choices: gender, race/ethnic, and nativity patters. Social Perspectives, 55, 211-234.
Mak, N. (2012). Cambodia higher education: Challenges, opportunities and future directions. A paper presented at policy roundtable on higher education and vocational training in Cambodia, 30 August 2012. Phnom Penh, Kingdom of Cambodia.
Malecki, C. K., & Demaray, M. K. (2002). Measuring perceived social support: Development of the child and adolescent social support scale (CASSS). Psychology in the Schools, 39(1), 1-18.
Malecki, C. K., Demaray, M. K., & Elliott, S. N. (2003). A working manual on the development of the child and adolescent social support scale (2000) (Unpublished manuscript). Northern Illinois University.
Maltese, A. V., & Tai, R. H. (2011). Pipeline persistence: examining the association of educational experiences with earned degrees in STEM among US students. Science Education, 95(5), 877-907.
Maltlese, A.V.; Lung, F. D.; Potvin, G., & Hochbein, C.D. (2013). STEM education in the United States. Retrieved May 01, 2018, from https://acola.org.au/wp/stem-consultants- reports/.
Marginson, S.; Tytler, R.; Freeman, B., & Roberts, K. (2013). STEM: Country comparisons: International comparisons of science, technology, engineering, and mathematics (STEM) education [Final report]. Australian Council of Learned Academies, Melbourne, Vic.
Matsui, T., Matsui, K., & Ohnishi, R. (1990). Mechanism underlying math self-efficacy learning of college students. Journal of Vocational Behavior, 37, 225-238.
Mau, W. C. J., & Li, J. (2018). Factors influencing STEM career aspirations of underrepresented high school students. The Career Development Quarterly, 66(3), 246-258.
McGuire, W. J. (1985). Attitude and attitude change. In G. Lindzey, & E. Aronson (Eds.) Handbook of Social Psychology (pp. 233-345). New York, NY: Random House.
McMahon, J. M., Pouget, E. R., & Tortu, S. (2006). A guide for multilevel modeling of dyadic data with binary outcomes using SAS PROC NLMIXED. Computational statistics & data analysis, 50(12), 3663-3680.
232
Means, B., Wang, H., Wei, X., Iwatani, E., & Peters, V. (2018). Broadening participation in STEM college majors: Effects of attending a STEM-focused high school. AERA Open, 4(4), 1-17.
Means, B., Wang, H., Young, V., Peters, V. L., Lynch, S. J. (2016). STEM‐focused high schools as a strategy for enhancing readiness for postsecondary STEM programs. Journal of Research in Science Teaching, 53(5), 709–736.
Meece, J.L., Parsons, J.E., Kaczala, C.M., Goff, S.B., & Fatterman, R. (1982). Sex difference in math achievement: toward a model of academic choice. Psychological Bulletin, 91, 324-348.
Menis, J. (1989). Attitude towards school, chemistry students and science among upper secondary chemistry students in the United States, Research in Science and Technological Education, 7(2), 183-190.
Mertens, D. M. (2014). Research and evaluation in education and psychology: Integrating diversity with quantitative, qualitative, and mixed methods. Sage publications.
Midgley, C., Maehr, M. L., Hruda, L. Z., Anderman, E., Anderman, L., Freeman, K. E., & Urdan, T. (2000). Manual for the patterns of adaptive learning scales. Ann Arbor: University of Michigan.
Miller, J. D., & Kimmel, L. G. (2012). Pathways to a STEMM profession. Peabody Journal of Education, 87(1), 26-45.
Ministry of Education, Youth and Sport [MoEYS]. (2002). Regulation on admission into higher education system. Phnom Penh, Kingdom of Cambodia.
Ministry of Education, Youth and Sport [MoEYS]. (2004). Policy for curriculum development 2005-2009. Phnom Penh, Kingdom of Cambodia.
Ministry of Education, Youth and Sport [MoEYS]. (2006). Core curriculum for basic general education. Department of pedagogical research, Phnom Penh, Kingdom of Cambodia.
Ministry of Education, Youth and Sport [MoEYS], (2009). Announcement 09 dated on 10 July, 2009 on subject required in entrance examination into foundation year program for first year of Bachelor’s degree. Phnom Penh, Kingdom of Cambodia.
Ministry of Education, Youth and Sport [MoEYS]. (2010). Announcement No. 23 on the implementation of new curriculum at upper secondary education. Phnom Penh, Kingdom of Cambodia.
Ministry of Education, Youth and Sport [MoEYS]. (2010). Guidelines on the implementation of curriculum at upper secondary education: grades 11 and 12. Phnom Penh, Kingdom of Cambodia.
Ministry of Education, Youth and Sport [MoEYS]. (2014a). Higher education vision 2020–2030. Department of Higher Education, Phnom Penh, Kingdom of Cambodia.
Ministry of Education, Youth and Sport [MoEYS]. (2014b) Results of upper secondary school completion examination 1980–2013. Phnom Penh: Ministry of Education, Youth and Sport, Kingdom of Cambodia.
Ministry of Education, Youth and Sport [MoEYS]. (2014c). Announcement No. 97 dated 31 December 2014 on the temporary suspension of license issuance of accounting, banking, and finance majors in higher education. Phnom Penh, Kingdom of Cambodia.
Ministry of Education, Youth and Sport [MoEYS]. (2015). Tracer study: Follow-up report. Phnom Penh, Kingdom of Cambodia.
233
Ministry of Education, Youth and Sport [MoEYS]. (2016a). Policy on science, technology, engineering and mathematics (STEM) education. Phnom Penh, Kingdom of Cambodia.
Ministry of Education, Youth and Sport [MoEYS]. (2016b). Statistic of higher education enrollment. Department of Higher Education, Phnom Penh, Kingdom of Cambodia.
Ministry of Education, Youth and Sport [MoEYS]. (2016c). Policy on new generation school. Phnom Penh, Kingdom of Cambodia.
Ministry of Education, Youth and Sport [MoEYS]. (2017). Statistic of enrolment in science and social track at general education. Department of general education, Phnom Penh, Kingdom of Cambodia.
Ministry of Education, Youth and Sport [MoEYS]. (2018a). Achievement in education sector from 1998 to 2018. Phnom Penh, Kingdom of Cambodia.
Ministry of Education, Youth and Sport [MoEYS]. (2018b). Announcement No.11 on the implementation of Baccalaureate examination for academic year 2017–18. Phnom Penh, Kingdom of Cambodia.
Ministry of Education, Youth and Sport [MoEYS]. (2018c). Resource school document Phnom Penh, Kingdom of Cambodia.
Ministry of Education, Youth and Sport [MoEYS]. (2018d). The STEM brochure. Phnom Penh, Kingdom of Cambodia.
Ministry of Education, Youth and Sport [MoEYS]. (2018e). Operational policy guidelines for new generation schools. Phnom Penh, Kingdom of Cambodia.
Ministry of Education, Youth and Sport [MoEYS]. (2018f). Announcement on government scholarship selection for the academic year 2019-2020. Phnom Penh, Kingdom of Cambodia.
Ministry of Education, Youth and Sport [MoEYS]. (2018g). Education in Cambodia: Findings from Cambodia’s experience in PISA for Development. Phnom Penh: Author.
Ministry of Education, Youth and Sport [MoEYS]. (2018h). Education congress document on achievement of MoEYS in 2016-2017 and direction for 2017-2018. (Report), Institute of Technology of Cambodia, Kingdom of Cambodia.
Ministry of Education, Youth and Sport [MoEYS]. (2019a). Education strategic plan 2019–2023. Phnom Penh, Kingdom of Cambodia.
Ministry of Education, Youth and Sport [MoEYS]. (2019b). Education congress report on the achievement for the academic Year 2018-2019 and direction for 2019-2020. (Report), MoEYS, Phnom Penh, Kingdom of Cambodia.
Ministry of Education, Youth and Sport [MoEYS]. (2019c). Education statistic compiled by Department of General Education. Phnom Penh, Kingdom of Cambodia.
Ministry of Education, Youth and Sport [MoEYS]. (2019d). Education statistic compiled by Department of Higher Education. Phnom Penh, Kingdom of Cambodia.
Ministry of Education, Youth and Sport [MoEYS]. (2019e). Announcement number 10 on the implementation of Prakas 154 dated on 29 January 2019 on planning and implementing of upper secondary school national examination for the academic year 2018-2019. Phnom Pend, Kingdom of Cambodia.
Ministry of Education, Youth and Sport [MoEYS]. (2019f). Statistics on students passing the Baccalaureate examination in 2019. Phnom Penh, Kingdom of Cambodia.
234
Ministry of Education, Youth and Sport [MoEYS]. (2020a). Actional operation plan 2020. Phnom Penh, Kingdom of Cambodia.
Ministry of Education, Youth and Sport [MoEYS]. (2020b). Announcement number 44 on the implementation of Prakas 154 dated on 29 January 2019 on planning and implementing of lower secondary school national examination for the academic year 2019-2020. Phnom Penh, Kingdom of Cambodia.
Ministry of Education, Youth and Sport [MoEYS]. (2020c). Guidebook on higher education institutions and academic majors selection. Phnom Penh, Kingdom of Cambodia.
Ministry of Education, Youth and Sport [MoEYS]. (2020d). Education congress report on the achievement in 2018-2019 and direction for 2019-2020. Phnom Penh, Kingdom of Cambodia.
Mitchell, P. T. (2016). Undergraduate motivations for choosing a science, technology, engineering, or mathematics (STEM) major. University of Tennessee Honors Thesis Projects.
Moakler Jr, M. W., & Kim, M. M. (2014). College major choice in STEM: Revisiting confidence and demographic factors. The Career Development Quarterly, 62(2), 128-142.
Montmarquette, C., Cannings, K., & Mahseredjian, S. (2002). How do young people choose college majors?. Economics of Education Review, 21(6), 543-556.
Morrison, J., Roth, McDuffie, A., French, B. (2015). Identifying key components of teaching and learning in a STEM school. School Science and Mathematics, 115(5), 244–255.
Mullen, A. L. (2011). Degrees of inequality: Culture, class, and gender in American higher education. JHU Press.
Myeong, J, O., & Crawley, F., E. (1991). Predicting and understanding Korean high school students’ science track choice: Testing the theory of reasoned action by structural equation modeling [Technical Report No. 143]. ERIC.
Myeong, J. O., & Crawley, F. E. (1993). Predicting and understanding Korean high school students' science track choice: Testing the theory of reasoned action by structural equation modeling. Journal of Research in Science Teaching, 30(4), 381-400.
National Center for Education Statistics [NCES]. (2020). Classification of institutional program (CIP). Retrieved December 10, 2019, from https://nces.ed.gov/ipeds/cipcode/ searchresults.aspx?y=56&cf=90495.
National Employment Agency [NEA]. (2018). Cambodia job outlook 2018. Phnom Penh, Kingdom of Cambodia.
National Research Council [NRC]. (2000). Inquiry and the national science education standards: A guide for teaching and learning. National Academies Press.
Nauta, M. M., & Epperson, D. L. (2003). A longitudinal examination of the social-cognitive model applied to high school girls' choices of nontraditional college majors and aspirations. Journal of Counseling Psychology, 50(4), 448-457.
Navarro, R. L., Flores, L. Y., & Worthington, R. L. (2007). Mexican American middle school students' goal intentions in mathematics and science: A test of social cognitive career theory. Journal of Counseling Psychology, 54(3), 320-335.
Nicholls, G.M., Wolfe, H., Besterfield-Sacre, M., Shuman, L.J., & Larpkiattaworn, S. (2007). A method for identifying variables for predicting STEM enrollment. Journal of Engineering Education, 696(1), 33-44.
235
Niu, L. (2013). Choosing an undergraduate stem major: Family socioeconomic status, individual, and institutional factors. (Unpublished doctor dissertation). University of Florida, USA.
Niu, L. (2017). Family socioeconomic status and choice of stem major in college: An analysis of a national sample. College Student Journal, 51(2), 298-312.
Nix, S., Perez-Felkner, L., & Thomas, K. (2015). Perceived mathematical ability under challenge: a longitudinal perspective on sex segregation among STEM degree fields. Frontiers in Psychology, 2015(6), 1-19.
Nosek, B.A., & Smyth, F.L. (2011). Implicit social cognitions predict sex differences in math engagement and achievement. American Educational Research Journal, 48(5), 1125-1156.
Nugent, G., Barker, B., & Welch, G., Grandgenett, N., Wu, C., & Nelson, C. (2015). A model of STEM learning and career orientation based on social cognitive theory. International Journal of Science Education, 37(7), 1067-1088.
Oakes, J. (1986). Keeping track, part 1: The policy and practice of curriculum inequality. Phi Delta Kappan, 68(1), 12-17.
Oakes, J. (1990). Multiplying inequalities: The effects of race, social class, and tracking on opportunities to learn mathematics and science [Technical Report]. ERIC.
Olaniyan, D. A., & Okemakinde, T. (2008). Human capital theory: Implications for educational development. Pakistan Journal of Social Sciences, 5(5), 479-483.
Oliveira, E. & Roberts, K. (2013). Literature review: STEM education in France. Retrieved May 21, 2018, from https://acola.org.au/wp/PDF/SAF02 Consultants/ Consultant%20 Report%20-%20France.pdf.
Organization for Economic Co-operation and Development [OCDE]. (2004). Learning for Tomorrow’s World: First Results from PISA 2003. OECD Publishing.
Organization for Economic Cooperation and Development [OECD]. (2016), "Students' attitudes towards science and expectations of science–related careers", in PISA 2015 Results (Volume I): Excellence and Equity in Education, OECD Publishing, Paris, https://doi.org/10.1787/9789264266490-7-en.
Organization for Economic Cooperation and Development [OECD]. (2017). Database on Education at a glance. Retrieved Mary 30, 2018, from https://stats.oecd.org/ Index. aspx? datasetcode=EAG_ENRL_MOBILES_FIELDS.
Ormerod, M. B., & Duckworth, D. (1975). Pupils' attitudes to science: A review of research. Windsor, Berks: NFER Pub.
Osborne, J., Simon, S., & Collins, S. (2003). Attitudes towards science: A review of the literature and its implications. International Journal of Science Education, 25(9), 1049-1079.
Owens, E. W., Shelton, A. J., Bloom, C. M., & Cavil, J. K. (2012). The significance of HBCUs to the production of STEM graduates: Answering the call. Educational Foundations, 26, 33-47.
Paik, S., & Shim, W. J. (2013). Tracking and college major choices in academic high schools in South Korea. The Asia-Pacific Education Researcher, 22(4), 721-730.
Palmer, R. T., Maramba, D. C., & Dancy, T. E. (2011). A qualitative investigation of factors promoting the retention and persistence of students of color in STEM. The Journal of Negro Education, 80(4), 491-504.
236
Papanastasiou, C., & Papanastasiou, E. C. (2004). Major influences on attitudes toward science. Educational Research and Evaluation, 10(3), 239-257.
Pen, S. (2011). Factor affecting high school students’ aspiration on choice of major at post-secondary education (Unpublished Master’s Thesis). Nagoya University, Japan.
Peou, C. (2017). On Cambodian higher education and skills mismatch: Young people choosing university majors in a context of risk and uncertainty. Journal of Education and Work, 30(1), 26-38.
Pike, G. R. (2006). Students’ personality types, intended majors, and college expectations: Further evidence concerning psychological and sociological interpretations of Holland’s theory. Research in Higher Education, 47(7), 801-822.
Pit, C., & Ford, D. (2004). Cambodian higher education: Mixed visions. Asian universities: Historical perspectives and contemporary challenges, Altbach P & Umakoshi T (eds), The Johns Hopkins University Press: Baltimore, MA. pp. 333-362.
Porter, S.R., & Umbach, P.D. (2006). College major choice: An analysis of Person-Environment Fit. Research in Higher Education, 47(4), 429-449.
Potvin, P., Hasni, A., Sy, O., & Riopel, M. (2018). Two crucial years of science and technology Schooling: A longitudinal study of the major influences on and interactions between self-concept, interest, and the intention to pursue S&T. Research in Science Education, 1-23, https://doi.org/10.1007/s11165-018-9751-6.
Rakow, S. J., & Bermudez, A. B. (1993). Science is" ciencia": Meeting the needs of Hispanic American students. Science Education, 77(6), 669-683.
Rask, K. (2010). Attrition in STEM fields at a liberal arts college: The importance of grades and pre-collegiate preferences. Economics of Education Review, 29(6), 892-900.
Raudenbush, S. W., Bryk, A. S., Cheong, Y. F., Congdon, R., & Du Toit, M. (2019). HLM 8: Hierarchical Linear and Nonlinear Modeling. Scientific Software International. Inc., Lincolnwood, IL.
Raykov, T. (2011). Intraclass correlation coefficients in hierarchical designs: Evaluation using latent variable modeling. Structural Equation Modeling, 18(1), 73-90.
Riegle-Crumb, C., & King, B. (2010). Questioning a white male advantage in STEM: Examining disparities in college major by gender and race/ethnicity. Educational Researcher, 39(9), 656-664.
Riegle-Crumb, C., King, B., Grodsky, E., & Muller, C. (2012). The more things change, the more they stay the same? Prior achievement fails to explain gender inequality in entry into STEM college majors over time. American Educational Research Journal, 49(6), 1048-1073.
Royal Government of Cambodia [RGC]. (2007). Education law. Phnom Penh, Kingdom of Cambodia.
Royal Government of Cambodia [RGC]. (2013). Cambodia’s national science and technology master plan for growth and quality of life. Phnom Penh, Kingdom of Cambodia.
Royal Government of Cambodia [RGC]. (2015). Cambodia industrial development policy 2015–2025. “Market orientation and enabling environment for industrial development.” Phnom Penh, Kingdom of Cambodia.
Royal Government of Cambodia [RGC]. (2017). National technical vocational education and training policy 2017-2025. Ministry of Labour and Vocational Training, Phnom Penh, Kingdom of Cambodia.
237
Royal Government of Cambodia [RGC]. (2018).“Rectangular strategy” for growth, employment, equity, and efficiency phase IV. Phnom Penh, Kingdom of Cambodia.
Royal Government of Cambodia [RGC]. (2019a). National strategic development plan updated 2014–2018: For growth, employment, equity and efficiency to reach the Cambodian millennium development goal. Phnom Penh, Kingdom of Cambodia.
Royal Government of Cambodia [RGC]. (2019b). National policy on science, technology, and innovation 2020-2030. Phnom Penh, Kingdom of Cambodia.
Ruse, P., & Xu, Y. (2018). Original Paper Secondary School Variables in Predicting Technology, Engineering, Mathematics (TEM) Major Choice. Children and Teenagers, 1(1), 49-62.
Sahin, A. (2013). STEM clubs and science fair competitions: Effects on post-secondary matriculation. Journal of STEM Education, 14(1), 5–11.
Sahin, A., Ekmekci, A., & Waxman, H. C. (2017). The relationships among high school STEM learning experiences, expectations, and mathematics and science efficacy and the likelihood of majoring in STEM in college. International Journal of Science Education, 39(11), 1549-1572.
Sahin, A., Gulacar, O., & Stuessy, C. (2015). High school students’ perceptions of the effects of international science Olympiad on their STEM career aspirations and twenty-first century skill development. Research in Science Education, 45(6), 785-805.
Sam, K. (2020). New generation school management. Power point presentation during MoEYS 2020 education congress, Phnom Penh, Kingdom of Cambodia.
Sam, R., Zain, A. N. M., & Jamil, H. (2012). Cambodia’s higher education development in historical perspectives (1863-2012). International Journal of Learning and Development, 2(2), 224-241.
Sam, V. (2018). Unemployment duration and educational mismatches: An empirical investigation among graduates in Cambodia. Economics Bulletin, 38(3), 1554-1565.
Sanders, M. (2009). STEM, STEM education, STEMmania. The Technology Teacher, 20-26. Sar M (2014) Science teachers’ perception on teacher center and inquiry-based approach at
upper secondary level in Cambodia [unpublished master thesis]. Hiroshima University, Japan.
Sawilowsky, S (2009). New effect size rules of thumb. Journal of Modern Applied Statistical Methods. 8(2): 467-474.
Sax, L. J., Kanny, M. A., Riggers-Piehl, T. A., Whang, H., & Paulson, L. N. (2015). “But I’m not good at math”: The changing salience of mathematical self-concept in shaping women’s and men’s STEM aspirations. Research in Higher Education, 56(8), 813-842.
Sax, L.J. (1996). The impact of college on post-college commitment to science careers: Gender differences in a nine-year follow-up of college freshmen. (Research Report). ERIC, Higher Education Research Institute.
Scantlebury, K., Boone, W., Kahle, J. B., & Fraser, B. J. (2001). Design, validation, and use of an evaluation instrument for monitoring systemic reform. Journal of Research in Science Teaching: The Official Journal of the National Association for Research in Science Teaching, 38(6), 646-662.
238
Scott, A.B., Mallinckrodt, B. (2005). Parental emotional support, science self-efficacy, and choice of science majors in undergraduate women. The Career Development Quarterly, 53, 263-273.
Scott, C. E. (2012). An investigation of science, technology, engineering and mathematics (STEM) focused high schools in the US. Journal of STEM Education: Innovations and Research, 13(5), 30–39.
Scott, J. (2000). Rational choice theory. Understanding contemporary society: Theories of the present, 129.
Selema, T. (2010). Who is joining physics and why? Factors affecting the choice of physics among Ethiopian university students. International Journal of Environmental & Science Education, 5(3), 319-340.
Sen, V., & Ros, S. (2013). Anatomy of higher education governance in Cambodia. Phnom Penh, Kingdom of Cambodia.
Serin, O., & Mohammadzadeh, B. (2008). The relationship between primary school students’ attitudes towards science and their science achievement (sampling: Izmir). Journal of Educational Sciences, 2(6), 68-75.
Seymour, E., & Hewitt, N. (1997). Talking about Leaving: Why do undergraduates leave the science? Boulder, CO: Westview Press. USA.
Shaw, E. J., & Barbuti, S. (2010). Patterns of persistence in intended college major with a focus on STEM majors. NACADA Journal, 30(2), 19–34.
Shim, W. J., & Paik, S. (2014). The effects of high school track choice on students’ postsecondary enrollment and majors in South Korea. Asia Pacific Education Review, 15(4), 573-583.
Shin, J., Lee, H., McCarthy-Donovan, A., Hwang, H., Yim, S., & Seo, E. (2015). Home and motivational factors related to science-career pursuit: Gender differences and gender similarities. International Journal of Science Education, 37(9), 1478-1503.
Shin, S., Lee, J. K., & Ha, M. (2017). Influence of career motivation on science learning in Korean high-school students. EURASIA Journal of Mathematics Science and Technology Education, 13(5), 1517-1538.
Shin, S., Rachmatullah, A., Ha, M., & Lee, J. K. (2018). A longitudinal trajectory of science learning motivation in Korean high school students. Journal of Baltic Science Education, 17(4), 674-687.
Shumow, L., & Schmidt, J. A. (2013). Academic grades and motivation in high school science classrooms among male and female students: Associations with teachers’ characteristics, beliefs and practices. Journal of Education Research, 7(1), 53-71.
Sianou-Kyrgiou, E. (2010). Stratification in higher education, choice and social inequalities in Greece. Higher Education Quarterly, 64(1). 22-40.
Siegel, M. A., & Ranney, M. A. (2003). Developing the changes in attitude about the relevance of science (CARS) questionnaire and assessing two high school science classes. Journal of Research in Science Teaching: The Official Journal of the National Association for Research in Science Teaching, 40(8), 757-775.
Simpson, J.C. (2001). Segregated differences by subject: Racial different in factors affecting academic major between European Americans, Asian Americans, and African, Hispanic, and Native Americans. Journal of Higher Education, 72(1), 63-100.
239
Simon, R. A., Aulls, M. W., Dedic, H., Hubbard, K., & Hall, N. C. (2015). Exploring student persistence in STEM programs: a motivational model. Canadian Journal of Education, 38(1), 1-27.
Simpkins, S. D., Price, C. D., & Garcia, K. (2015). Parental support and high school students' motivation in biology, chemistry, and physics: Understanding differences among Latino and Caucasian boys and girls. Journal of Research in Science Teaching, 52(10), 1386-1407.
Simpson, R. D., & Oliver, J. (1990). A summary of major influences on attitude toward and achievement in science among adolescent students. Science Education, 74(1), 1-18.
Slife, B. D., & Williams, R. N. (1995). What's behind the research?: Discovering hidden assumptions in the behavioral sciences. Sage publication.
Smallbone, T., & Quinton, S. (2004). Increasing business students’ confidence in questioning the validity and reliability of their research. Electronic Journal of Business Research Methods, 2(2), 153-162.
Smart, J. C. (1985). Holland environments as reinforcement systems. Research in Higher Education, 23(3), 279-292.
Smart, J. C., Feldman, K. A., & Ethington, C. A. (2000). Academic disciplines: Holland's theory and the study of college students and faculty. Vanderbilt University Press.
Song, C., & Glick, J.E. (2004). College attendance and choice of college majors among Asian-American students. Social Science Quarterly, 85(5), 1401-1421.
Sonnert, G. (2009). Parents who influence their children to become scientists: Effects of gender and parental education. Social Study of Science, 39(6), 927-941.
Stearns, E., Bottía, M. C., Davalos, E., Mickelson, R. A., Moller, S., & Valentino, L. (2016). Demographic characteristics of high school math and science teachers and girls’ success in STEM. Social Problems, 63(1), 87-110.
Steffens, M. C., Jelenec, P., & Noack, P. (2010). On the leaky math pipeline: Comparing implicit math-gender stereotypes and math withdrawal in female and male children and adolescents. Journal of Educational Psychology, 102(4), 947.
Stein, R. S. (2012). Choosing science: a mixed-methods study of factors predicting Latino and Latina high school students' decisions to pursue science degrees (Doctoral dissertation, Education). San Diego State University, California, United States of America.
Stokking, K. M. (2000). Predicting the choice of physics in secondary education. International Journal of Science Education, 22(12), 1261-1283.
Strayhorn, T. L. (2015). Factors Influencing Black Males' Preparation for College and Success in STEM Majors: A Mixed Methods Study. Western Journal of Black Studies, 39(1), 45-64.
Sweetland, S. R. (1996). Human capital theory: Foundations of a field of inquiry. Review of Educational Research, 66(3), 341-359.
Tan, L. M., & Laswad, F. (2009). Understanding students' choice of academic majors: A longitudinal analysis. Accounting Education: An International Journal, 18(3), 233-253.
Tenenbaum, H. R., & Leaper, C. (2003). Parent-child conversations about science: The socialization of gender inequities? Developmental Psychology, 39(1), 34-47.
Tofel-Grehl, C., Callahan, C. M. (2014). STEM high school communities: Common and differing features. Journal of Advanced Academics, 25(3), 237–271.
240
Tomei, A.; Dawson, E., & Dillon, J. (2013). A study of science, technology, engineering and mathematics education in United Kingdom [Report], Retrieved May 01, 2018, from https://acola.org.au/wp/stem-consultants- reports/.
Trusty, J. (2002). Effects of high school course‐taking and other variables on choice of science and mathematics college majors. Journal of Counseling & Development, 80(4), 464-474.
Trusty, J., Robinson, C., Plata, M., & Ng, K. (2000). Effects of gender, SES and early academic performance on postsecondary educational choice. Journal of Counseling & Development, 78(4), 463-472.
Turner, S.L., Steward, J.C., & Lapan, R.T. (2004). Family factors associated with sixth grade adolescents’ math and science career interests. The Career Development Quarterly, 53, 41-52.
Ulicna, D., & Royale, R. (2015). Does the EU need more STEM graduates? (Report No. 120/01). Luxembourg, Danish Technological Institute.
Un, L. (2012). A comparative study of education and development in Cambodia and Uganda from their civil wars to the present, (Doctoral dissertation), University of Amsterdam.
Un, L., & Sok, S. (2016). Higher education governance in Cambodia. Education Research Council, Ministry of Education, Youth and Sport.
Un, L., & Sok, S. (2018). Higher education systems and institutions, Cambodia. Higher Education, 70-80.
UNESCO National Education Support Strategy [UNESS]. (2010). UNESCO educational support strategies. UNESCO, Phnom Penh, Kingdom of Cambodia.
UNESCO. (2014). World TVET database Cambodia. UNESCO-UNEVOC International Centre for Technical and Vocational Education and Training, Germany.
Unfried, A., Faber, M., Stanhope, D. S., & Wiebe, E. (2015). The development and validation of a measure of student attitudes toward science, technology, engineering, and math (S-STEM). Journal of Psychoeducational Assessment, 33(7), 622-639.
Usher, E. L., & Pajares, F. (2009). Sources of self-efficacy in mathematics: A validation study. Contemporary Educational Psychology, 34(1), 89-101.
Van der Merwe, A. (2010). Does human capital theory account for individual higher education choice?. International Business & Economics Research Journal (IBER), 9(6), 81-94.
Ventura, F. (1992). Gender, science choice and achievement: a Maltese perspective. School Science Review, 14(4), 445-461.
Vooren, M., Haelermans, C., Groot, W., & van den Brink, H. M. (2019). Does high school achievement predict success and enrolment in STEM higher education? An analysis using longitudinal Dutch register data. [Report]. 1-30.
Wang, X. (2013). Why students choose STEM majors: Motivation, high school learning, and postsecondary context of support. American Educational Research Journal, 50(5), 1081-1121.
Wang, X. (2017). Upward transfer in STEM fields of study: A new conceptual framework and survey instrument for institutional research. New Directions for Institutional Research, 170, 49-60.
241
Wang, X., & Lee, S. Y. (2019). Investigating the psychometric properties of a new survey instrument measuring factors related to upward transfer in STEM fields. The Review of Higher Education, 42(2), 339-384.
Wang, Z. (1995). Factors affecting students career choice of science and engineering (Unpublished Master’s thesis). The University of British Columbia.
Ware, N. C., & Lee, V. E. (1988). Sex differences in choice of college science majors. American Educational Research Journal, 25(4), 593-614.
Ware, N. C., Steckler, N. A., & Leserman, J. (1985). Undergraduate women: Who chooses a science major?. The Journal of Higher Education, 56(1), 73-84.
Wei, X., Christiano, E. R., Jennifer, W. Y., Blackorby, J., Shattuck, P., & Newman, L. A. (2014). Postsecondary pathways and persistence for STEM versus non-STEM majors: Among college students with an autism spectrum disorder. Journal of Autism and Developmental Disorders, 44(5), 1159-1167.
Weinburgh, M. (1995). Gender differences in student attitudes toward science: A meta‐analysis of the literature from 1970 to 1991. Journal of Research in science Teaching, 32(4), 387-398.
Weinrib, J. & Jones, G. (2013). Canada’s approach to Science, Technology, Engineering and Mathematics (STEM): Context, policy, strategy and programs.
Welch, W. W. (1985). Research in science education: Review and recommendations. Science Education, 69(3), 421-48.
Well, R.L., & Gaus, D. (1991). Study of Kentucky middle school students’ knowledge of career options [Documentary Reproduction Service No. ED 351515]. ERIC.
Westrick, P., Radunzel, J., & Bassiri, D. (2018). Leaning into STEM: Predicting STEM Major Choice Using Measures of Academic Tilt and Measured Interest Tilt. [ACT Research & Policy. Technical Brief]. ACT, Inc.
Williamson, K., Given, L., & Scifleet, P. (2018). Qualitative data analysis. In K. Williamson & G. Johanson (Eds.), Research methods: Information, systems, and contexts (2nd ed., pp. 417-439). Tilde University Press.
Wiswall, M., Stiefel, L., Schwartz, A. E., Boccardo, J. (2014). Does attending a STEM high school improve student performance? Evidence from New York City. Economics of Education Review, 40, 93–105.
Woessmann, L. (2009). International evidence on school tracking: A review. CESifo DICE Report, 7(1), 26-34.
Woltman, H., Feldstain, A., MacKay, J. C., & Rocchi, M. (2012). An introduction to hierarchical linear modeling. Tutorials in Quantitative Methods for Psychology, 8(1), 52-69.
Woolnough, B. E. (1994a). Factors affecting students' choice of science and engineering. International Journal of Science Education, 16(6), 659-676.
Woolnough, B. E., Guo, Y., Leite, M. S., Almeida, M. J. D., Ryu, T., Wang, Z., & Young, D. (1997). Factors affecting student choice of career in science and engineering: Parallel studies in Australia, Canada, China, England, Japan and Portugal. Research in Science & Technological Education, 15(1), 105-121.
Woolnough, B.E. (1994b). Effective science teaching. Open University Press. World Bank (2012). Putting higher education to work: Skills and research for growth in East
Asia. World Bank, Washington, DC.
242
World Bank (November 2020). Employment to population ratio for Cambodia [SLEMPTOTLSPZSKHM], retrieved from FRED, Federal Reserve Bank of St. Louis; https://fred.stlouisfed.org/series/SLEMPTOTLSPZSKHM, November 22, 2020.
World Economic Forum [WEF]. (2018). “Employment Trend”. Retrieved February 10, 2019 from http://reports.weforum.org/future-of-jobs-2016/employment-trends/.
Wu, S., Crespi, C. M., & Wong, W. K. (2012). Comparison of methods for estimating the intraclass correlation coefficient for binary responses in cancer prevention cluster randomized trials. Contemporary Clinical Trials, 33(5), 869-880.
Xie, Y., Fang, M., & Shauman, K. (2015). STEM education. Annual Review of Sociology, 41, 331-357.
Yara, P. O. (2009). Students attitude towards mathematics and academic achievement in some selected secondary schools in Southwestern Nigeria. European Journal of Scientific Research, 36(3), 336-341.
Ye, R., Wells, R. R., Talkmitt, S., & Ren, H. (1998). Student Attitudes toward Science Learning: A Cross-National Study of American and Chinese Secondary School Students [Research Report]. ERIC.
Young, J. R., Ortiz, N., & Young, J. L. (2017). STEMulating interest: A meta-analysis of the effects of out-of-school time on student STEM interest. International Journal of Education in Mathematics Science and Technology, 5(1), 62-74.
Zacharia, Z., & Barton, A. C. (2004). Urban middle-school students' attitudes toward a defined science. Science Education, 88(2), 197-222.
Zeng Z, Yao J, Gu H, Przybylki R (2018) A meta-analysis on the effects of STEM education on students’ abilities. Science Insight Education Frontiers, 1(1), 3-16.
Zhou, S. N., Zeng, H., Xu, S. R., Chen, L. C., & Xiao, H. (2019). Exploring changes in primary students’ attitudes towards science, technology, engineering and mathematics (STEM) across genders and grade levels. Journal of Baltic Science Education, 18(3), 466.
Zuniga, K., Olson, J.K., & Winter, M. (2005). Science education for rural Latino/a students: Course placement and success in science. Journal of Research in Science Teaching, 42(4), 376-402.
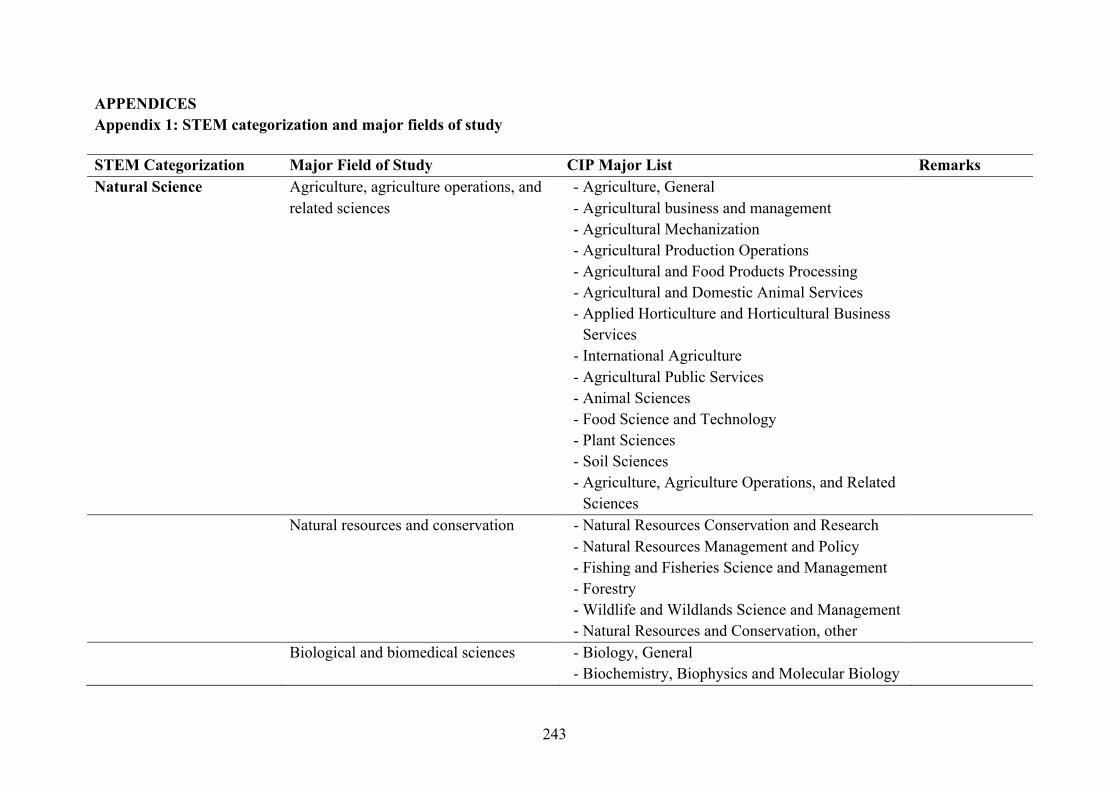
243
APPENDICES Appendix 1: STEM categorization and major fields of study STEM Categorization Major Field of Study CIP Major List Remarks Natural Science Agriculture, agriculture operations, and
related sciences - Agriculture, General - Agricultural business and management - Agricultural Mechanization - Agricultural Production Operations - Agricultural and Food Products Processing - Agricultural and Domestic Animal Services - Applied Horticulture and Horticultural Business
Services - International Agriculture - Agricultural Public Services - Animal Sciences - Food Science and Technology - Plant Sciences - Soil Sciences - Agriculture, Agriculture Operations, and Related
Sciences
Natural resources and conservation - Natural Resources Conservation and Research - Natural Resources Management and Policy - Fishing and Fisheries Science and Management - Forestry - Wildlife and Wildlands Science and Management - Natural Resources and Conservation, other
Biological and biomedical sciences - Biology, General - Biochemistry, Biophysics and Molecular Biology
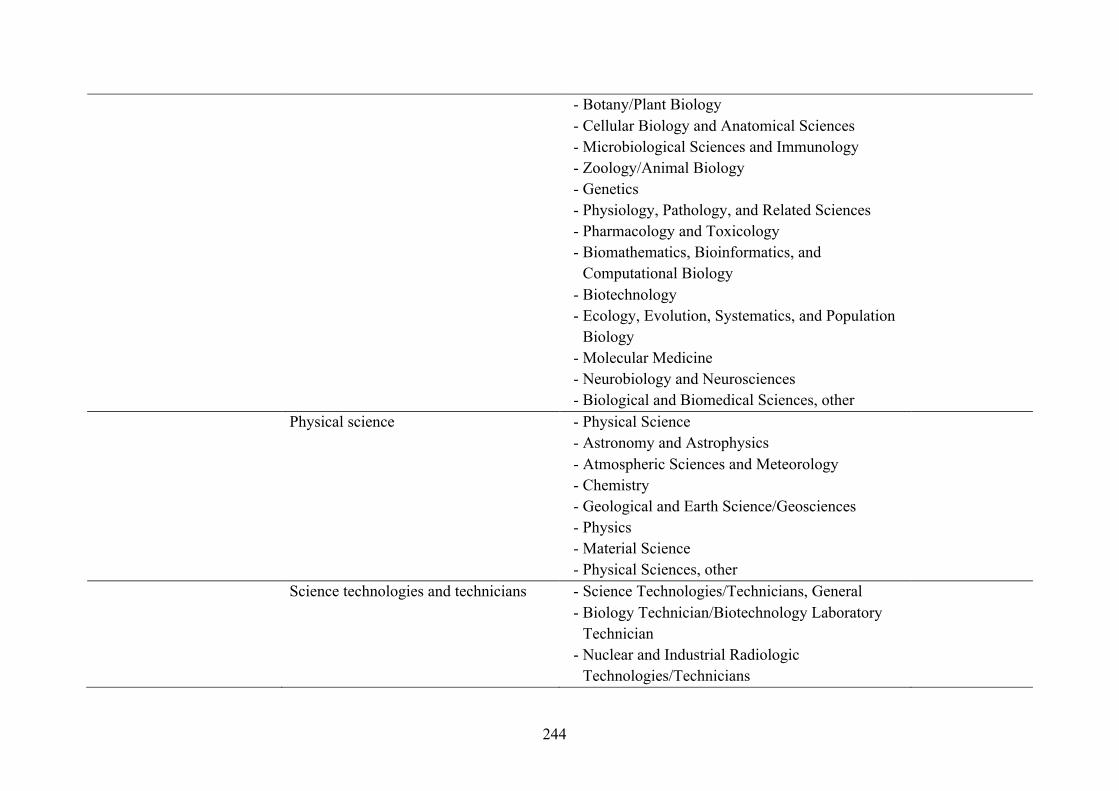
244
- Botany/Plant Biology - Cellular Biology and Anatomical Sciences - Microbiological Sciences and Immunology - Zoology/Animal Biology - Genetics - Physiology, Pathology, and Related Sciences - Pharmacology and Toxicology - Biomathematics, Bioinformatics, and
Computational Biology - Biotechnology - Ecology, Evolution, Systematics, and Population
Biology - Molecular Medicine - Neurobiology and Neurosciences - Biological and Biomedical Sciences, other
Physical science - Physical Science - Astronomy and Astrophysics - Atmospheric Sciences and Meteorology - Chemistry - Geological and Earth Science/Geosciences - Physics - Material Science - Physical Sciences, other
Science technologies and technicians - Science Technologies/Technicians, General - Biology Technician/Biotechnology Laboratory
Technician - Nuclear and Industrial Radiologic
Technologies/Technicians
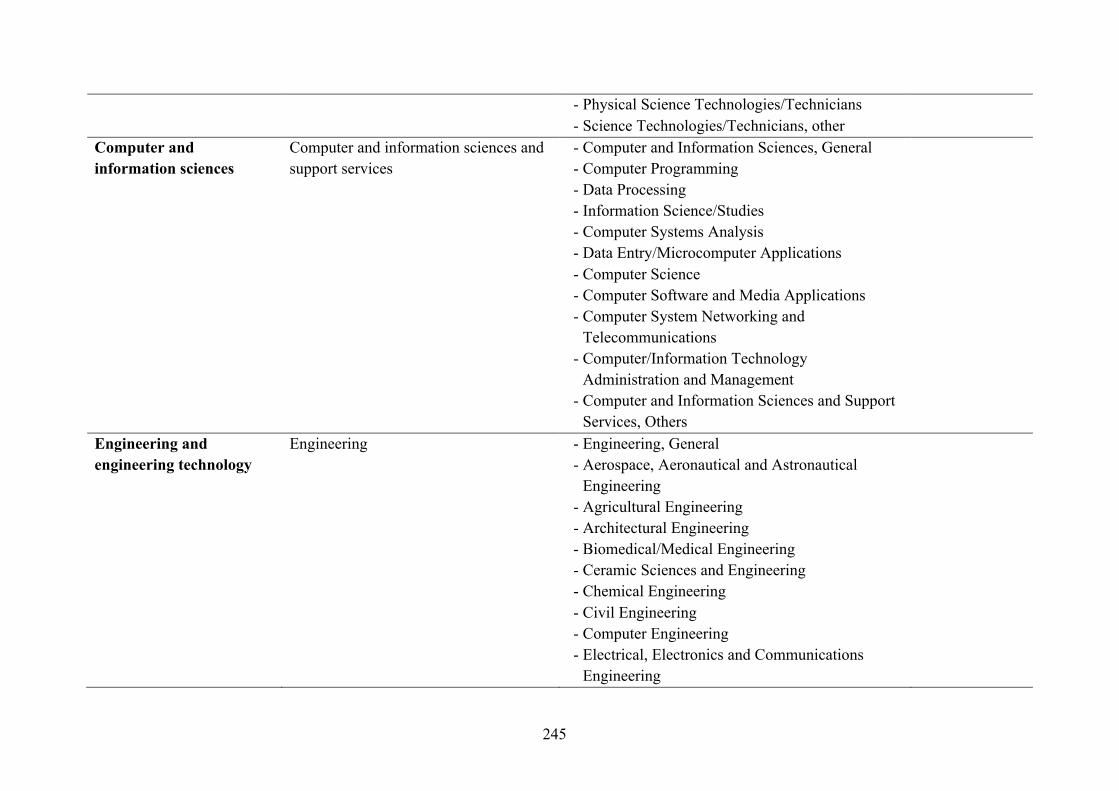
245
- Physical Science Technologies/Technicians - Science Technologies/Technicians, other
Computer and information sciences
Computer and information sciences and support services
- Computer and Information Sciences, General - Computer Programming - Data Processing - Information Science/Studies - Computer Systems Analysis - Data Entry/Microcomputer Applications - Computer Science - Computer Software and Media Applications - Computer System Networking and
Telecommunications - Computer/Information Technology
Administration and Management - Computer and Information Sciences and Support
Services, Others
Engineering and engineering technology
Engineering - Engineering, General - Aerospace, Aeronautical and Astronautical
Engineering - Agricultural Engineering - Architectural Engineering - Biomedical/Medical Engineering - Ceramic Sciences and Engineering - Chemical Engineering - Civil Engineering - Computer Engineering - Electrical, Electronics and Communications
Engineering
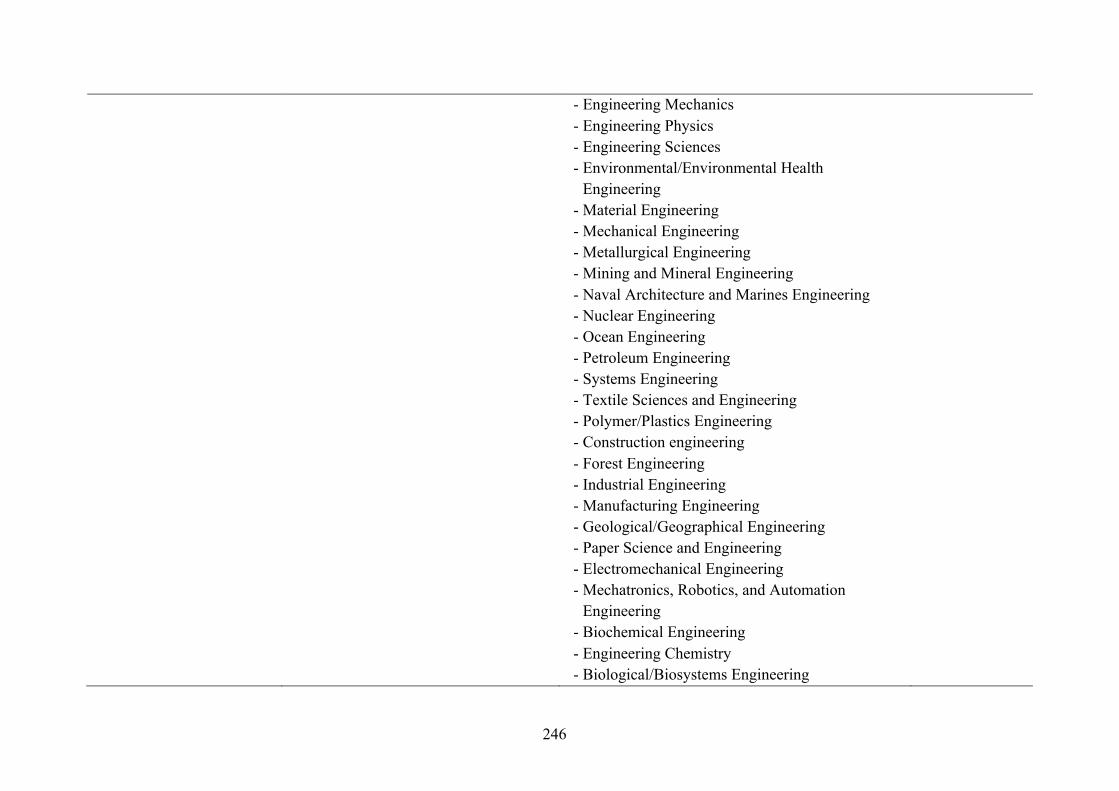
246
- Engineering Mechanics - Engineering Physics - Engineering Sciences - Environmental/Environmental Health
Engineering - Material Engineering - Mechanical Engineering - Metallurgical Engineering - Mining and Mineral Engineering - Naval Architecture and Marines Engineering - Nuclear Engineering - Ocean Engineering - Petroleum Engineering - Systems Engineering - Textile Sciences and Engineering - Polymer/Plastics Engineering - Construction engineering - Forest Engineering - Industrial Engineering - Manufacturing Engineering - Geological/Geographical Engineering - Paper Science and Engineering - Electromechanical Engineering - Mechatronics, Robotics, and Automation
Engineering - Biochemical Engineering - Engineering Chemistry - Biological/Biosystems Engineering

247
- Engineering, Others Engineering technologies and
engineering-related fields - Engineering Technology, General - Architectural Engineering
Technologies/Technicians - Civil Engineering Technologies/Technicians - Electrical Engineering Technologies/Technicians - Electromechanical Instrumentation and
Maintenances Technologies - Environmental Control Technologies - Industrial Production Technologies - Quality Control and Safety Technologies - Mechanical Engineering Related Technologies - Mining and Petroleum Technologies - Construction Engineering Technologies - Drafting/Design Engineering Technologies - Nanotechnology
Mathematics Mathematics and statistics - Mathematics - Statistics - Practical Statistics Management - Practical Mathematics - Mathematics and Statistics, Other
Source: Synthesis of National Center for Education Statistics [NCES] (2020), Ministry of Education, Youth and Sport (2020), and extant literature on STEM majors in higher education.
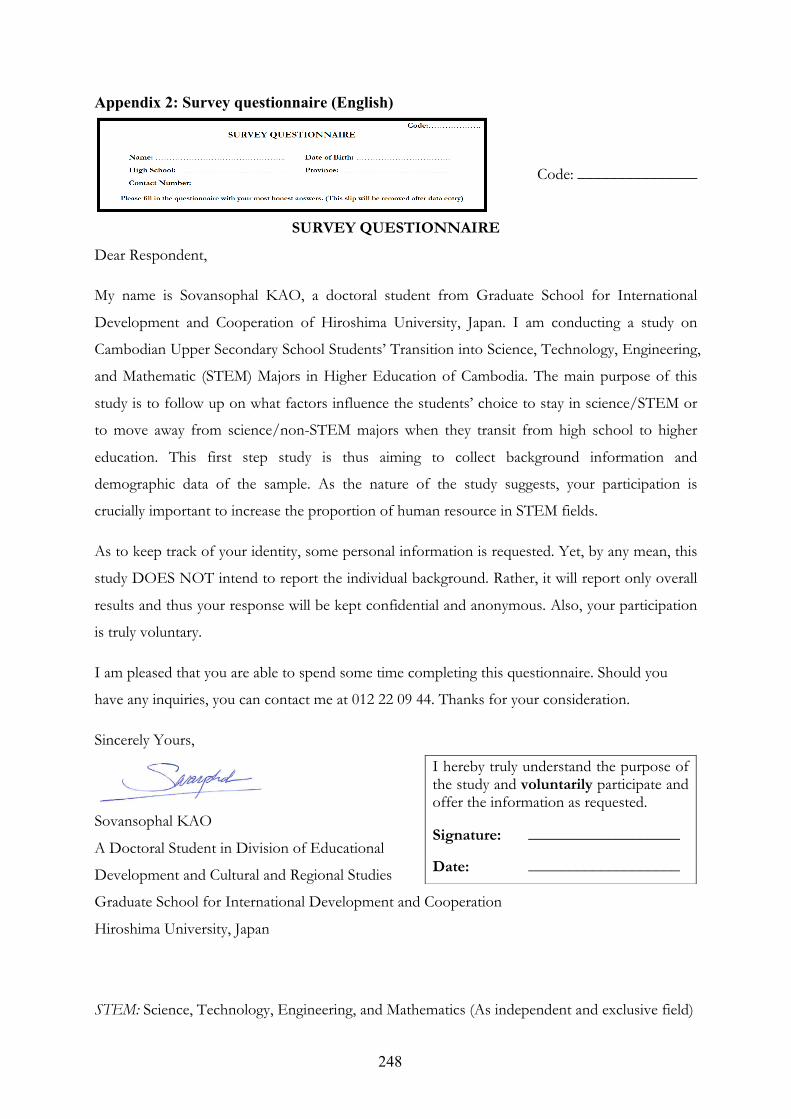
248
Appendix 2: Survey questionnaire (English)
Code: _______________
SURVEY QUESTIONNAIRE
Dear Respondent,
My name is Sovansophal KAO, a doctoral student from Graduate School for International
Development and Cooperation of Hiroshima University, Japan. I am conducting a study on
Cambodian Upper Secondary School Students’ Transition into Science, Technology, Engineering,
and Mathematic (STEM) Majors in Higher Education of Cambodia. The main purpose of this
study is to follow up on what factors influence the students’ choice to stay in science/STEM or
to move away from science/non-STEM majors when they transit from high school to higher
education. This first step study is thus aiming to collect background information and
demographic data of the sample. As the nature of the study suggests, your participation is
crucially important to increase the proportion of human resource in STEM fields.
As to keep track of your identity, some personal information is requested. Yet, by any mean, this
study DOES NOT intend to report the individual background. Rather, it will report only overall
results and thus your response will be kept confidential and anonymous. Also, your participation
is truly voluntary.
I am pleased that you are able to spend some time completing this questionnaire. Should you
have any inquiries, you can contact me at 012 22 09 44. Thanks for your consideration.
Sincerely Yours,
Sovansophal KAO
A Doctoral Student in Division of Educational
Development and Cultural and Regional Studies
Graduate School for International Development and Cooperation
Hiroshima University, Japan
STEM: Science, Technology, Engineering, and Mathematics (As independent and exclusive field)
I hereby truly understand the purpose of
the study and voluntarily participate and
offer the information as requested. Signature: ___________________ Date: ___________________
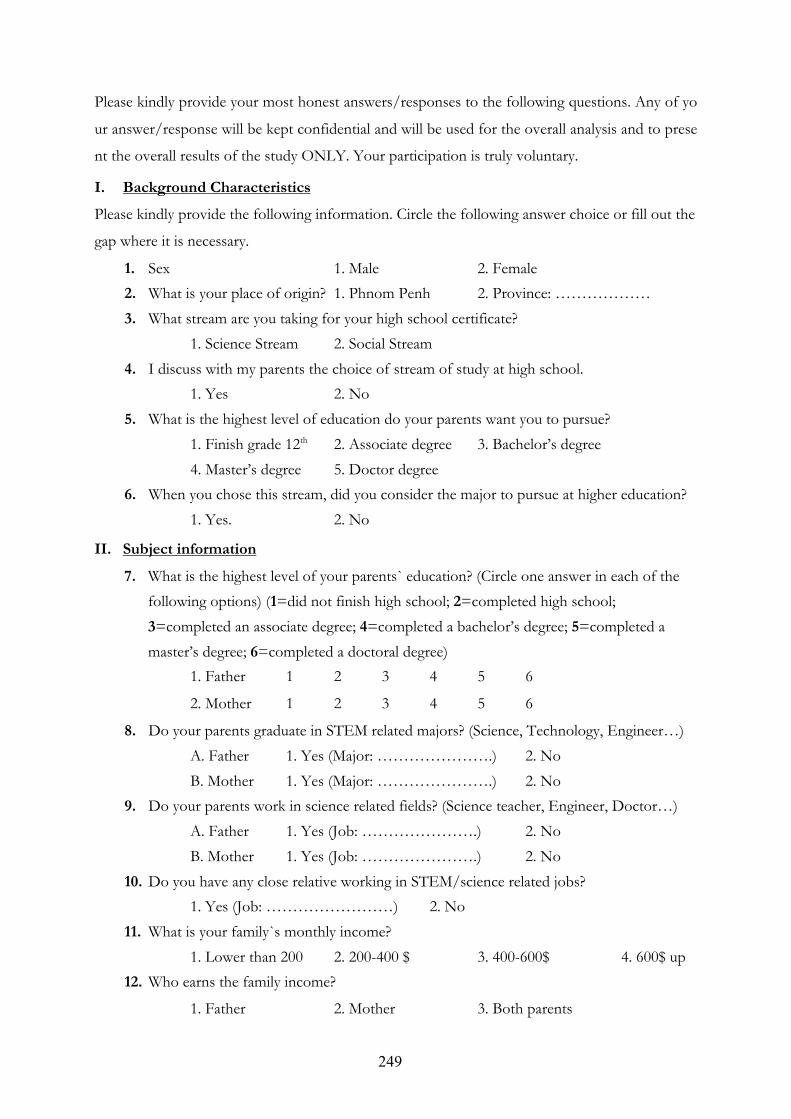
249
Please kindly provide your most honest answers/responses to the following questions. Any of yo
ur answer/response will be kept confidential and will be used for the overall analysis and to prese
nt the overall results of the study ONLY. Your participation is truly voluntary.
I. Background Characteristics
Please kindly provide the following information. Circle the following answer choice or fill out the
gap where it is necessary.
1. Sex 1. Male 2. Female
2. What is your place of origin? 1. Phnom Penh 2. Province: ………………
3. What stream are you taking for your high school certificate?
1. Science Stream 2. Social Stream
4. I discuss with my parents the choice of stream of study at high school.
1. Yes 2. No
5. What is the highest level of education do your parents want you to pursue?
1. Finish grade 12th 2. Associate degree 3. Bachelor’s degree
4. Master’s degree 5. Doctor degree
6. When you chose this stream, did you consider the major to pursue at higher education?
1. Yes. 2. No
II. Subject information
7. What is the highest level of your parents` education? (Circle one answer in each of the
following options) (1=did not finish high school; 2=completed high school;
3=completed an associate degree; 4=completed a bachelor’s degree; 5=completed a
master’s degree; 6=completed a doctoral degree)
1. Father 1 2 3 4 5 6
2. Mother 1 2 3 4 5 6
8. Do your parents graduate in STEM related majors? (Science, Technology, Engineer…)
A. Father 1. Yes (Major: ………………….) 2. No
B. Mother 1. Yes (Major: ………………….) 2. No
9. Do your parents work in science related fields? (Science teacher, Engineer, Doctor…)
A. Father 1. Yes (Job: ………………….) 2. No
B. Mother 1. Yes (Job: ………………….) 2. No
10. Do you have any close relative working in STEM/science related jobs?
1. Yes (Job: ……………………) 2. No
11. What is your family`s monthly income?
1. Lower than 200 2. 200-400 $ 3. 400-600$ 4. 600$ up
12. Who earns the family income?
1. Father 2. Mother 3. Both parents
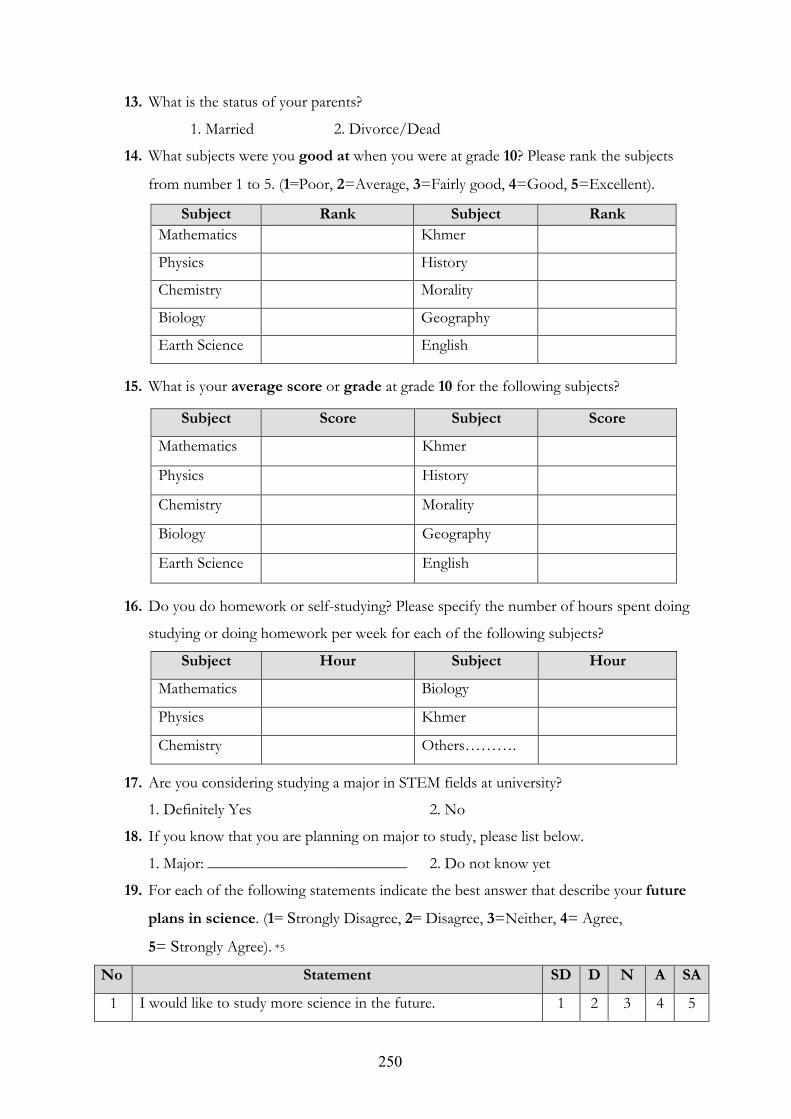
250
13. What is the status of your parents?
1. Married 2. Divorce/Dead
14. What subjects were you good at when you were at grade 10? Please rank the subjects
from number 1 to 5. (1=Poor, 2=Average, 3=Fairly good, 4=Good, 5=Excellent).
Subject Rank Subject Rank Mathematics Khmer
Physics History
Chemistry Morality
Biology Geography
Earth Science English
15. What is your average score or grade at grade 10 for the following subjects?
Subject Score Subject Score
Mathematics Khmer
Physics History
Chemistry Morality
Biology Geography
Earth Science English
16. Do you do homework or self-studying? Please specify the number of hours spent doing
studying or doing homework per week for each of the following subjects?
Subject Hour Subject Hour
Mathematics Biology
Physics Khmer
Chemistry Others……….
17. Are you considering studying a major in STEM fields at university?
1. Definitely Yes 2. No
18. If you know that you are planning on major to study, please list below.
1. Major: _________________________ 2. Do not know yet
19. For each of the following statements indicate the best answer that describe your future
plans in science. (1= Strongly Disagree, 2= Disagree, 3=Neither, 4= Agree,
5= Strongly Agree). *5
No Statement SD D N A SA
1 I would like to study more science in the future. 1 2 3 4 5
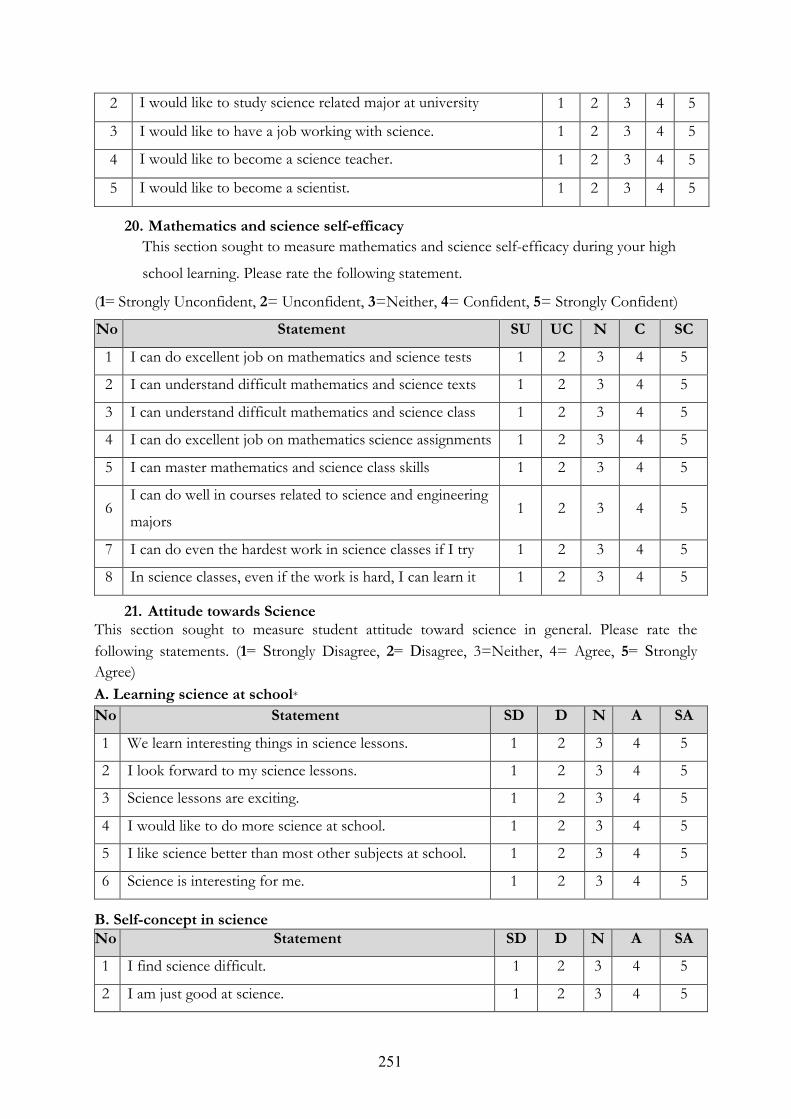
251
2 I would like to study science related major at university 1 2 3 4 5
3 I would like to have a job working with science. 1 2 3 4 5
4 I would like to become a science teacher. 1 2 3 4 5
5 I would like to become a scientist. 1 2 3 4 5
20. Mathematics and science self-efficacy This section sought to measure mathematics and science self-efficacy during your high
school learning. Please rate the following statement.
(1= Strongly Unconfident, 2= Unconfident, 3=Neither, 4= Confident, 5= Strongly Confident)
No Statement SU UC N C SC
1 I can do excellent job on mathematics and science tests 1 2 3 4 5
2 I can understand difficult mathematics and science texts 1 2 3 4 5
3 I can understand difficult mathematics and science class 1 2 3 4 5
4 I can do excellent job on mathematics science assignments 1 2 3 4 5
5 I can master mathematics and science class skills 1 2 3 4 5
6 I can do well in courses related to science and engineering
majors 1 2 3 4 5
7 I can do even the hardest work in science classes if I try 1 2 3 4 5
8 In science classes, even if the work is hard, I can learn it 1 2 3 4 5
21. Attitude towards Science This section sought to measure student attitude toward science in general. Please rate the
following statements. (1= Strongly Disagree, 2= Disagree, 3=Neither, 4= Agree, 5= Strongly
Agree)
A. Learning science at school* No Statement SD D N A SA
1 We learn interesting things in science lessons. 1 2 3 4 5
2 I look forward to my science lessons. 1 2 3 4 5
3 Science lessons are exciting. 1 2 3 4 5
4 I would like to do more science at school. 1 2 3 4 5
5 I like science better than most other subjects at school. 1 2 3 4 5
6 Science is interesting for me. 1 2 3 4 5
B. Self-concept in science No Statement SD D N A SA
1 I find science difficult. 1 2 3 4 5
2 I am just good at science. 1 2 3 4 5
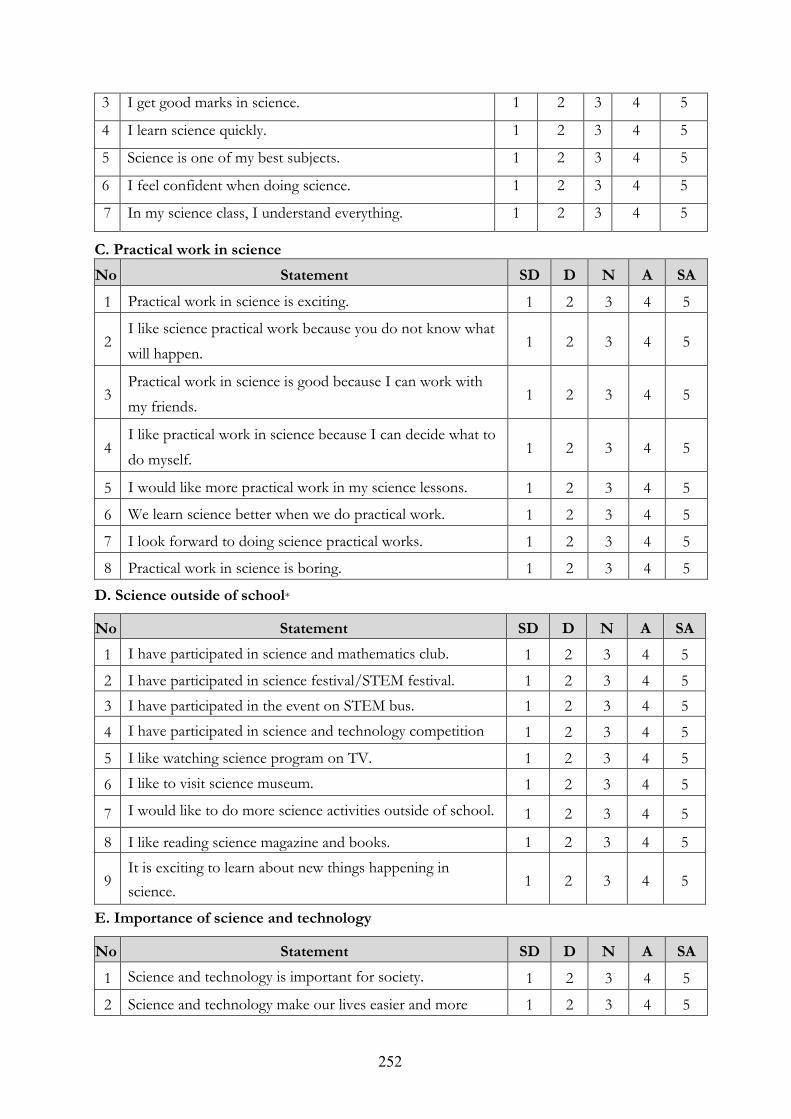
252
3 I get good marks in science. 1 2 3 4 5
4 I learn science quickly. 1 2 3 4 5
5 Science is one of my best subjects. 1 2 3 4 5
6 I feel confident when doing science. 1 2 3 4 5
7 In my science class, I understand everything. 1 2 3 4 5
C. Practical work in science No Statement SD D N A SA
1 Practical work in science is exciting. 1 2 3 4 5
2 I like science practical work because you do not know what
will happen. 1 2 3 4 5
3 Practical work in science is good because I can work with
my friends. 1 2 3 4 5
4 I like practical work in science because I can decide what to
do myself. 1 2 3 4 5
5 I would like more practical work in my science lessons. 1 2 3 4 5
6 We learn science better when we do practical work. 1 2 3 4 5
7 I look forward to doing science practical works. 1 2 3 4 5
8 Practical work in science is boring. 1 2 3 4 5
D. Science outside of school*
No Statement SD D N A SA
1 I have participated in science and mathematics club. 1 2 3 4 5
2 I have participated in science festival/STEM festival. 1 2 3 4 5
3 I have participated in the event on STEM bus. 1 2 3 4 5
4 I have participated in science and technology competition 1 2 3 4 5
5 I like watching science program on TV. 1 2 3 4 5
6 I like to visit science museum. 1 2 3 4 5
7 I would like to do more science activities outside of school. 1 2 3 4 5
8 I like reading science magazine and books. 1 2 3 4 5
9 It is exciting to learn about new things happening in
science. 1 2 3 4 5
E. Importance of science and technology
No Statement SD D N A SA
1 Science and technology is important for society. 1 2 3 4 5
2 Science and technology make our lives easier and more 1 2 3 4 5
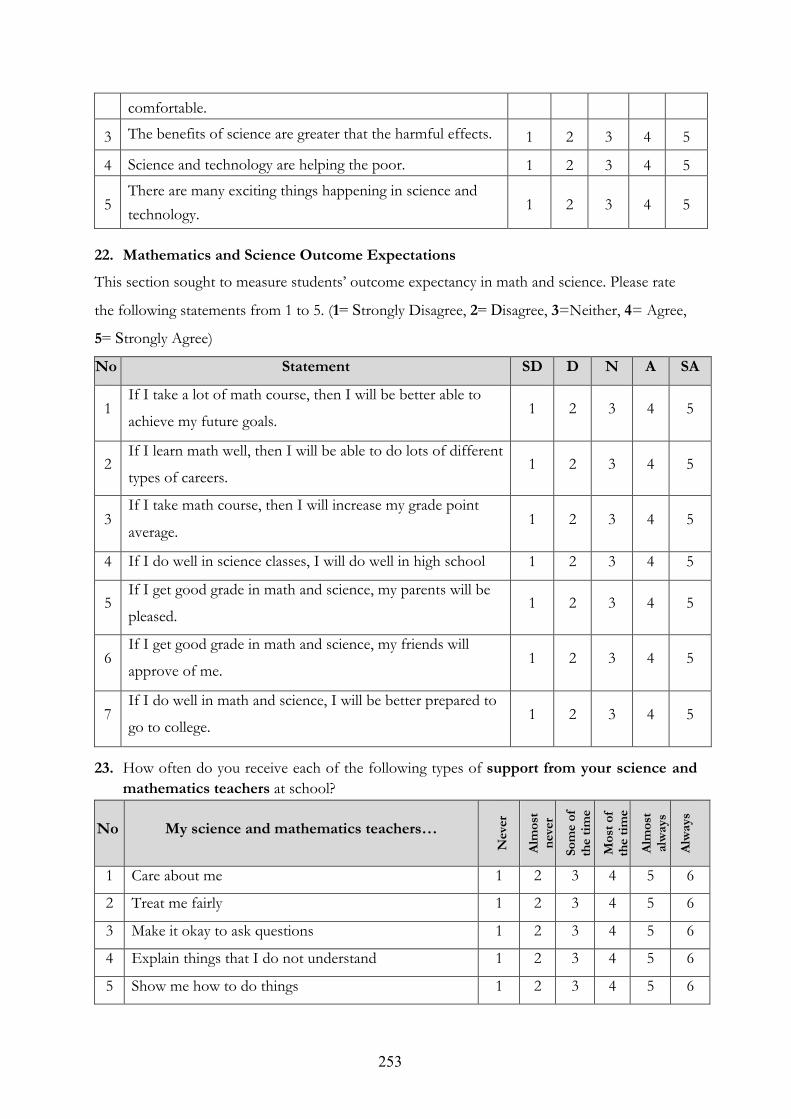
253
comfortable.
3 The benefits of science are greater that the harmful effects. 1 2 3 4 5
4 Science and technology are helping the poor. 1 2 3 4 5
5 There are many exciting things happening in science and
technology. 1 2 3 4 5
22. Mathematics and Science Outcome Expectations
This section sought to measure students’ outcome expectancy in math and science. Please rate
the following statements from 1 to 5. (1= Strongly Disagree, 2= Disagree, 3=Neither, 4= Agree,
5= Strongly Agree)
No Statement SD D N A SA
1 If I take a lot of math course, then I will be better able to
achieve my future goals. 1 2 3 4 5
2 If I learn math well, then I will be able to do lots of different
types of careers. 1 2 3 4 5
3 If I take math course, then I will increase my grade point
average. 1 2 3 4 5
4 If I do well in science classes, I will do well in high school 1 2 3 4 5
5 If I get good grade in math and science, my parents will be
pleased. 1 2 3 4 5
6 If I get good grade in math and science, my friends will
approve of me. 1 2 3 4 5
7 If I do well in math and science, I will be better prepared to
go to college. 1 2 3 4 5
23. How often do you receive each of the following types of support from your science and mathematics teachers at school?
No My science and mathematics teachers…
Nev
er
Alm
ost
neve
r So
me
of
the
time
Mos
t of
the
time
Alm
ost
alw
ays
Alw
ays
1 Care about me 1 2 3 4 5 6
2 Treat me fairly 1 2 3 4 5 6
3 Make it okay to ask questions 1 2 3 4 5 6
4 Explain things that I do not understand 1 2 3 4 5 6
5 Show me how to do things 1 2 3 4 5 6
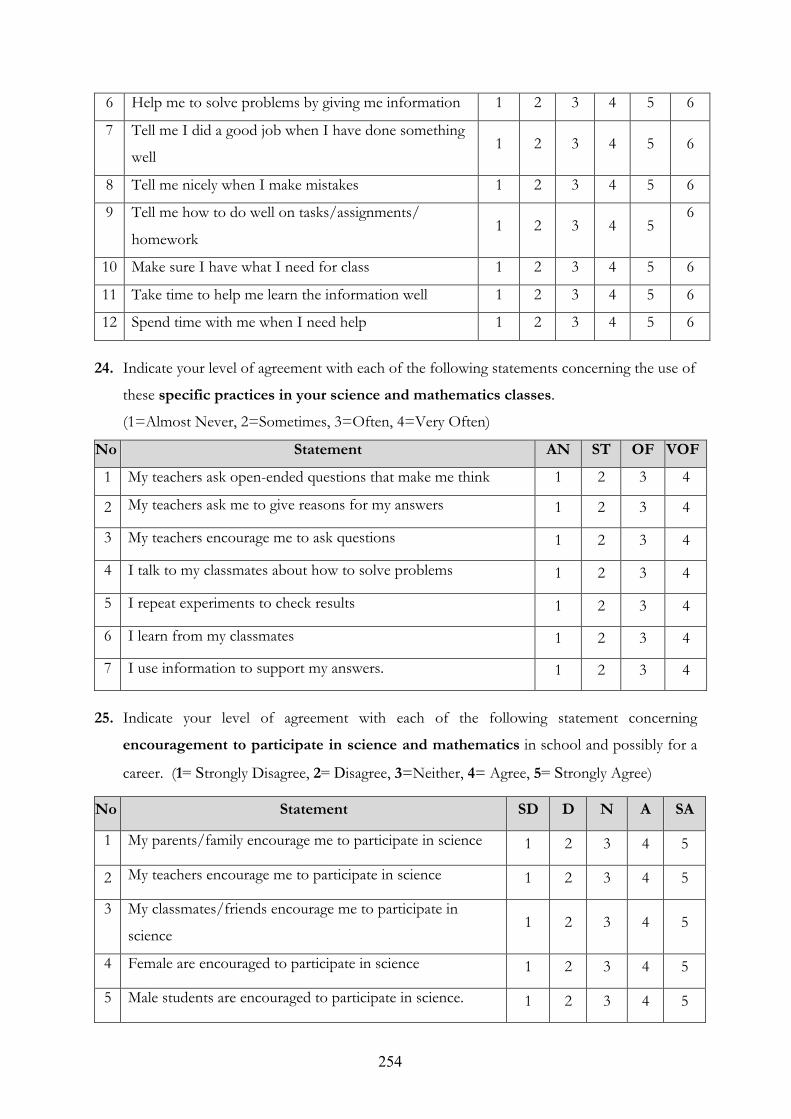
254
6 Help me to solve problems by giving me information 1 2 3 4 5 6
7 Tell me I did a good job when I have done something
well 1 2 3 4 5 6
8 Tell me nicely when I make mistakes 1 2 3 4 5 6
9 Tell me how to do well on tasks/assignments/
homework 1 2 3 4 5
6
10 Make sure I have what I need for class 1 2 3 4 5 6
11 Take time to help me learn the information well 1 2 3 4 5 6
12 Spend time with me when I need help 1 2 3 4 5 6
24. Indicate your level of agreement with each of the following statements concerning the use of
these specific practices in your science and mathematics classes.
(1=Almost Never, 2=Sometimes, 3=Often, 4=Very Often)
No Statement AN ST OF VOF
1 My teachers ask open-ended questions that make me think 1 2 3 4
2 My teachers ask me to give reasons for my answers 1 2 3 4
3 My teachers encourage me to ask questions 1 2 3 4
4 I talk to my classmates about how to solve problems 1 2 3 4
5 I repeat experiments to check results 1 2 3 4
6 I learn from my classmates 1 2 3 4
7 I use information to support my answers. 1 2 3 4
25. Indicate your level of agreement with each of the following statement concerning
encouragement to participate in science and mathematics in school and possibly for a
career. (1= Strongly Disagree, 2= Disagree, 3=Neither, 4= Agree, 5= Strongly Agree)
No Statement SD D N A SA
1 My parents/family encourage me to participate in science 1 2 3 4 5
2 My teachers encourage me to participate in science 1 2 3 4 5
3 My classmates/friends encourage me to participate in
science 1 2 3 4 5
4 Female are encouraged to participate in science 1 2 3 4 5
5 Male students are encouraged to participate in science. 1 2 3 4 5
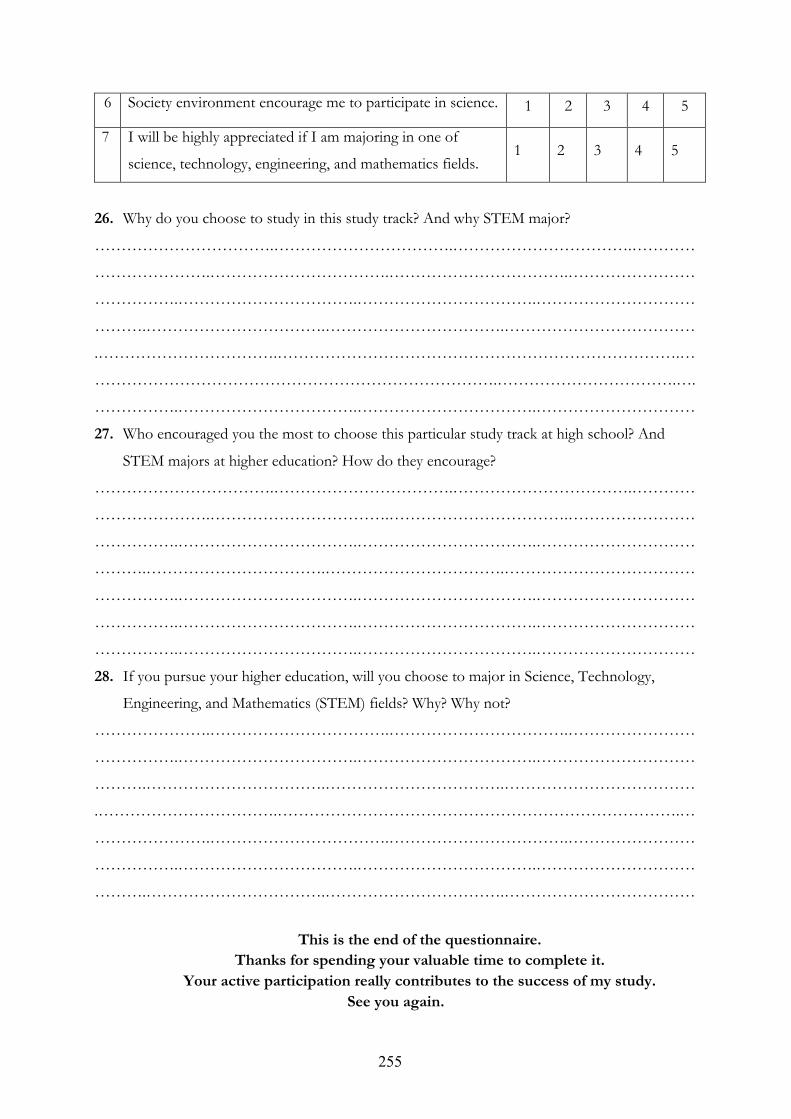
255
6 Society environment encourage me to participate in science. 1 2 3 4 5
7 I will be highly appreciated if I am majoring in one of
science, technology, engineering, and mathematics fields. 1 2 3 4 5
26. Why do you choose to study in this study track? And why STEM major?
…………………………….…………………………….…………………………….…………
………………….…………………………….…………………………….……………………
…………….…………………………….…………………………….…………………………
……….…………………………….…………………………….………………………………
.…………………………….………………………………………………………………….…
………………………………………………………………….…………………………….….
…………….…………………………….…………………………….…………………………
27. Who encouraged you the most to choose this particular study track at high school? And
STEM majors at higher education? How do they encourage?
…………………………….…………………………….…………………………….…………
………………….…………………………….…………………………….……………………
…………….…………………………….…………………………….…………………………
……….…………………………….…………………………….………………………………
…………….…………………………….…………………………….…………………………
…………….…………………………….…………………………….…………………………
…………….…………………………….…………………………….…………………………
28. If you pursue your higher education, will you choose to major in Science, Technology,
Engineering, and Mathematics (STEM) fields? Why? Why not?
………………….…………………………….…………………………….……………………
…………….…………………………….…………………………….…………………………
……….…………………………….…………………………….………………………………
.…………………………….………………………………………………………………….…
………………….…………………………….…………………………….……………………
…………….…………………………….…………………………….…………………………
……….…………………………….…………………………….………………………………
This is the end of the questionnaire.
Thanks for spending your valuable time to complete it. Your active participation really contributes to the success of my study.
See you again.
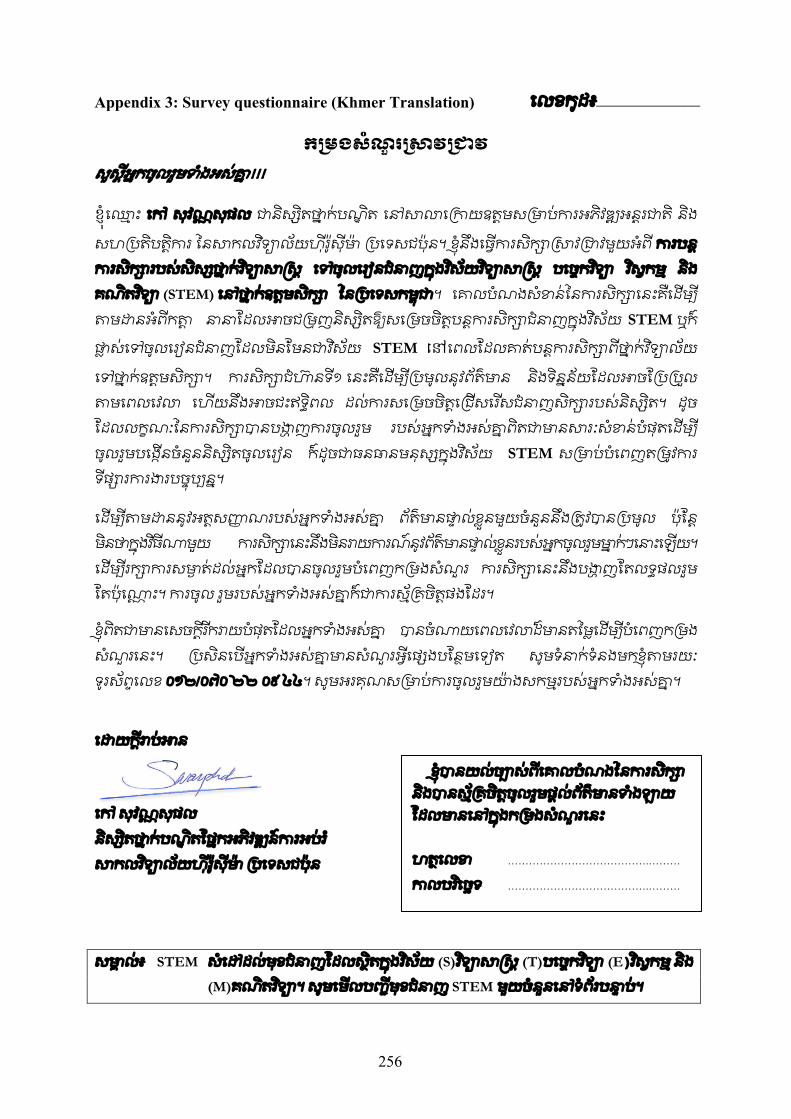
256
Appendix 3: Survey questionnaire (Khmer Translation)
កមងសណ(រសវជវ សសអកចលរមទងអសគ23!!!
ខញេឈ63ះ េក សវណសផល ជនស3Aតថ23កបណEត េនសលេកយឧតមសមបករអភវឌ3Pអនរជត នង
សហបតបតករ ៃនសកលវSទ3UលយហរWសមX3 បេទសជបន។ ខនងេធើករសក3cសវជវមយអព ករបន ករសក3cរបសសស3Aថ23កវSទ3Uសeស េទចលេរៀនជនញកងវSសយវSទ3Uសeស បេចកវSទ3U វSសកម នង គណតវSទ3U (STEM) េនថ23កឧតមសក3c ៃនបេទសកមជ។ េគលបណងសខនៃនករសក3cេនះគេដើម3q តមដនអពកតt3 ននែដលអចជមញនស3Aតឱ3xសេមចចតបនករសក3cជនញកងវSសយ STEM ឬក
ផ|3សេទចលេរៀនជនញែដលមនែមនជវSសយ STEM េនេពលែដលគតបនករសក3cពថ23កវSទ3Uលយ
េទថ23កឧតមសក3c។ ករសក3cជហ~3នទ១ េនះគេដើម3qបមលនវពតមន នងទននយែដលអចែបបÅល តមេពលេវល េហើយនងអចជះឥទពល ដលករសេមចចតេជើសេរÑសជនញសក3cរបសនស3Aត។ ដច ែដលលកណៈៃនករសក3cបនបងâ3ញករចលរម របសអកទងអសគ23ពតជមនសរៈសខនបផតេដើម3q ចលរមបេងើនចនននស3Aតចលេរៀន កដចជធនធនមនស3AកងវSសយ STEM សមបបេពញតមåវករ ទផ3cរករងរបចប3qន។
េដើម3qតមដននវអតសçé3ណរបសអកទងអសគ23 ពតមនផè3លខëនមយចនននងតåវបនបមល បែន មនថកងវSធណមយ ករសក3cេនះនងមនរយករណនវពតមនផè3លខëនរបសអកចលរមម23កៗេនះេឡើយ។ េដើម3qរក3cករសមó3តដលអកែដលបនចលរមបេពញកមងសណòរ ករសក3cេនះនងបងâ3ញែតលទផលរម ែតបេណô3ះ។ ករចល រមរបសអកទងអសគ23កជករសគចតផងែដរ។
ខពតជមនេសចករÑករយបផតែដលអកទងអសគ23 បនចណយេពលេវលដមនតៃមេដើម3qបេពញកមង សណòរេនះ។ បសនេបើអកទងអសគ23មនសណòរអេផ3Aងបែនមេទៀត សមទនកទនងមកខតមរយៈ ទរសពេលខ ០១២/០៧០ ២២ ០៩ ៤៤។ សមអរគណសមបករចលរមយX3ងសកមរបសអកទងអសគ23។
េដយករបអន
េក សវណសផល នស3Aតថ23កបណEតែផកអភវឌ3Pនករអបរ¢ សកលវSទ3UលយហរWសមX3 បេទសជបន
សម£3ល៖ STEM សេដដលមខជនញែដលសតកងវSសយ (S)វSទ3Uសeស (T)បេចកវSទ3U (E)វSសកម នង
(M)គណតវSទ3U។ សមេមើលប¶មខជនញ STEM មយចននេនទពរបនè3ប។
េលខកដ៖_____________
__ _______________..…
ខបនយលច3®សពេគលបណងៃនករសក3c នងបនសគចតចលរមផលពតមនទងឡយ ែដលមនេនកងកមងសណòរេនះ ហតេលខ ………………………………….……… កលបរSេចទ ………………………………….………
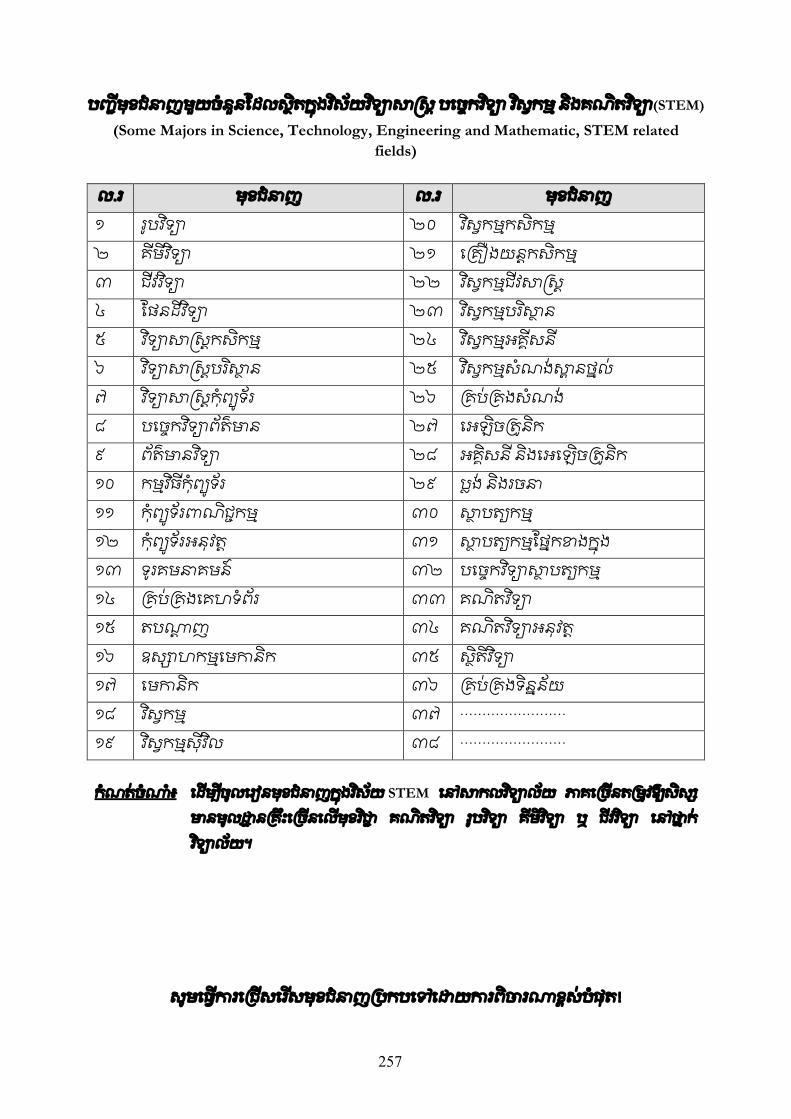
257
ប"មខជនញមយចននែដលសតក9ងវ<សយវ<ទ?@សBស បេចកវ<ទ?@ វ<សកម នងគណតវ<ទ?@(STEM) (Some Majors in Science, Technology, Engineering and Mathematic, STEM related
fields)
ល.រ មខជនញ ល.រ មខជនញ ១ របវ<ទ?@ ២០ វ<សកមកសកម ២ គមវ<ទ?@ ២១ េគឿងយនកសកម ៣ ជវវ<ទ?@ ២២ វ<សកមជវសBស ៤ ែផនដវ<ទ?@ ២៣ វ<សកមបរ<សT?ន ៥ វ<ទ?@សBសកសកម ២៤ វ<សកមអគសន ៦ វ<ទ?@សBសបរ<សT?ន ២៥ វ<សកមសណងសZ?នថល ៧ វ<ទ?@សBសកព? _ទរ ២៦ គបគងសណង ៨ បេចកវ<ទ?@ពតមន ២៧ េអឡចតdនក ៩ ពតមនវ<ទ?@ ២៨ អគសន នងេអេឡ ចតdនក ១០ កមវ<ធកព? _ទរ ២៩ បង នងរចន ១១ កព? _ទរពណជកម ៣០ សT?បត?^កម ១២ កព? _ទរអនវត ៣១ សT?បត?^កមែផកខងក9ង ១៣ ទរគមនគមន ៣២ បេចកវ<ទ?@សT?បត?^កម ១៤ គបគងេគហទពរ ៣៣ គណតវ<ទ?@ ១៥ តបណm?ញ ៣៤ គណតវ<ទ?@អនវត ១៦ ឧស?oហកមេមកនក ៣៥ សតវ<ទ?@ ១៧ េមកនក ៣៦ គបគងទននយ ១៨ វ<សកម ៣៧ ……………………
១៩ វ<សកមសវ<ល ៣៨ ……………………
កណតចណ៖ េដើម3qចលេរៀនមខជនញកងវSសយ STEM េនសកលវSទ3Uលយ ភគេចើនតមåវឱ3xសស3A មនមលដ3នគះេចើនេលើមខវSជ≠3 គណតវSទ3U របវSទ3U គមវSទ3U ឬ ជវវSទ3U េនថ23ក វSទ3Uលយ។
សមេធើករេជើសេរrសមខជនញបកបេទេដយករពចរណខសបផត!
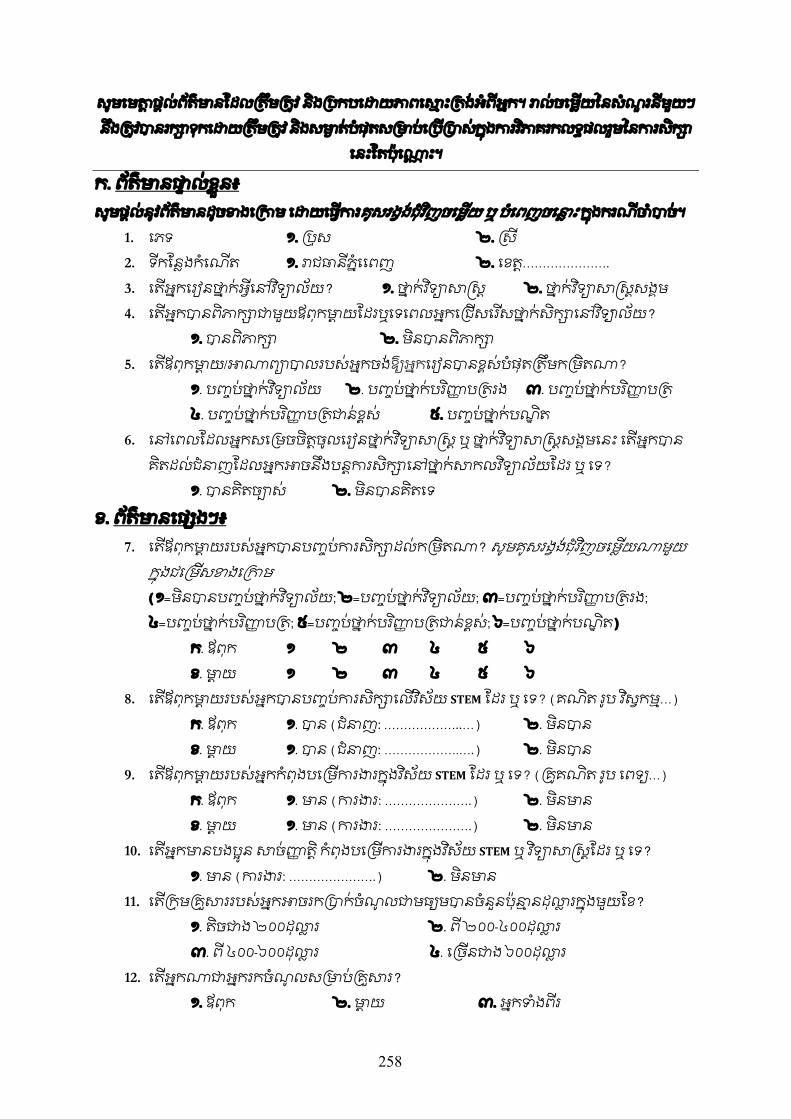
258
សមេមតt3ផលពតមនែដលតមតåវ នងបកបេដយភពេស63ះតងអពអក។ រលចេមើយៃនសណòរនមយៗ នងតåវបនរក3cទកេដយតមតåវ នងសមó3តបផតសមបេបើបសកងករវSភគរកលទផលរមៃនករសក3c
េនះែតបេណô3ះ។
ក. ពតមនផ/0លខ3ន៖ សមផលនវពតមនដចខងេកម េដយេធើករគសរងងជវSញចេមើយ ឬ បេពញចេន|3ះ កងករណចបច។
1. េភទ ១. បស ២. ស 2. ទកែនងកេណើត ១. រជធនភេ េពញ ២. េខត…………………. 3. េតើអកេរៀនថ23កអេនវSទ3Uលយ? ១. ថ23កវSទ3Uសeស ២. ថ23កវSទ3Uសeសសងម 4. េតើអកបនពភក3cជមយឪពកមt3យែដរឬេទេពលអកេជើសេរÑសថ23កសក3cេនវSទ 3x ាលយ?
១. បនពភក3c ២. មនបនពភក3c 5. េតើឪពកមt3យ/អណព3Uបលរបសអកចងឱ3xអកេរៀនបនខសបផតតមកមតណ?
១. ប¶បថ23កវSទ3Uលយ ២. ប¶បថ23កបរSçé3បតរង ៣. ប¶បថ23កបរSçé3បត ៤. ប¶បថ23កបរSçé3បតជនខស ៥. ប¶បថ23កបណEត
6. េនេពលែដលអកសេមចចតចលេរៀនថ23កវSទ3Uសeស ឬ ថ23កវSទ3Uសeសសងមេនះ េតើអកបន គតដលជនញែដលអកអចនងបនករសក3cេនថ23កសកលវSទ3Uលយែដរ ឬ េទ?
១. បនគតច3®ស ២. មនបនគតេទ
ខ. ពតមនេផ05ងៗ៖ 7. េតើឪពកមt3យរបសអកបនប¶បករសក3cដលកមតណ? សមគសរងងជវSញចេមើយណមយ
កងជេមើសខងេកម (១=មនបនប¶បថ23កវSទ3Uលយ; ២=ប¶បថ23កវSទ3Uលយ; ៣=ប¶បថ23កបរSçé3បតរង; ៤=ប¶បថ23កបរSçé3បត; ៥=ប¶បថ23កបរSçé3បតជនខស; ៦=ប¶បថ23កបណEត)
ក. ឪពក ១ ២ ៣ ៤ ៥ ៦ ខ. មt3យ ១ ២ ៣ ៤ ៥ ៦
8. េតើឪពកមt3យរបសអកបនប¶បករសក3cេលើវSសយ STEM ែដរ ឬ េទ? (គណត រប វSសកម…) ក. ឪពក ១. បន (ជនញ: ………………..…) ២. មនបន ខ. មt3យ ១. បន (ជនញ: ……………….….) ២. មនបន
9. េតើឪពកមt3យរបសអកកពងបេមើករងរកងវSសយ STEM ែដរ ឬ េទ? (គåគណត រប េពទ3x…) ក. ឪពក ១. មន (ករងរ: ………………….) ២. មនមន ខ. មt3យ ១. មន (ករងរ: ………………….) ២. មនមន
10. េតើអកមនបងប∑ន សចçé3ត កពងបេមើករងរកងវSសយ STEM ឬ វSទ3Uសeសែដរ ឬ េទ? ១. មន (ករងរ: ………………….) ២. មនមន
11. េតើកមគÅសររបសអកអចរកបកចណ∏លជមធ3xមបនចននបន63នដល|3រកងមយែខ? ១. តចជង ២០០ដល|3រ ២. ព ២០០-៤០០ដល|3រ ៣. ព ៤០០-៦០០ដល|3រ ៤. េចើនជង ៦០០ដល|3រ
12. េតើអកណជអករកចណ∏លសមបគÅសរ? ១. ឪពក ២. មtយ ៣. អកទងពរ
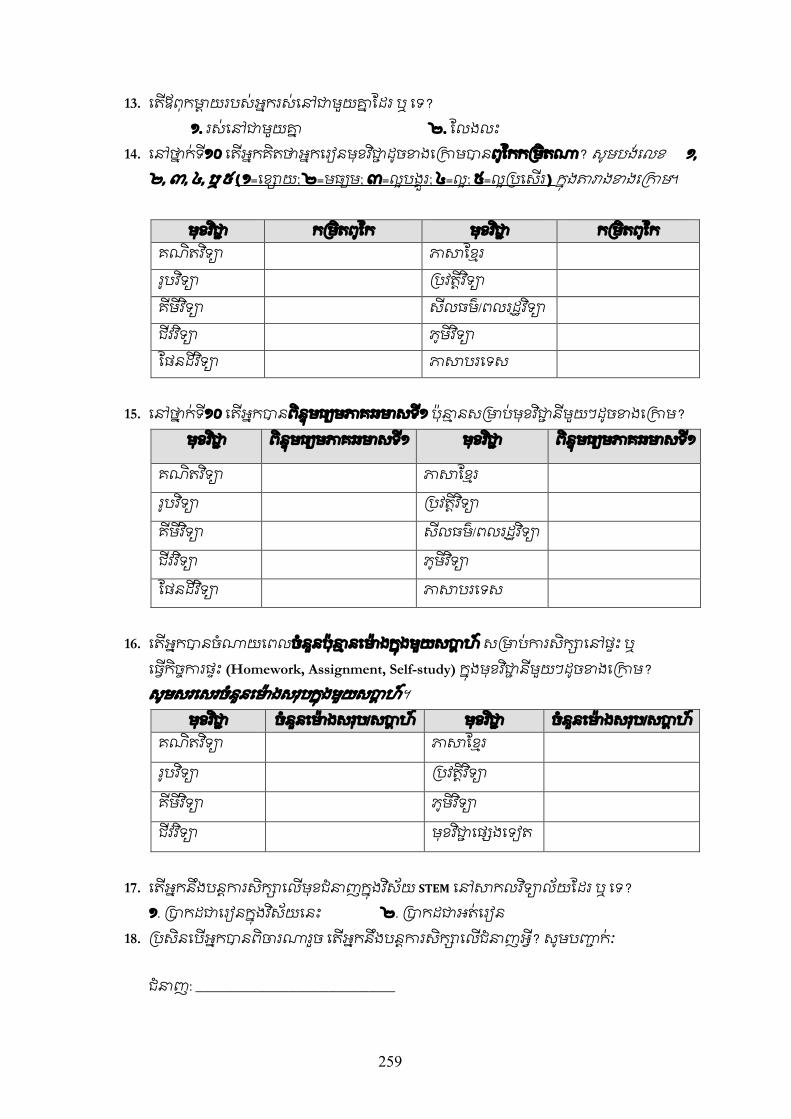
259
13. េតើឪពកមt3យរបសអករសេនជមយគ23ែដរ ឬ េទ? ១. រសេនជមយគ23 ២. ែលងលះ
14. េនថ23កទ១០ េតើអកគតថអកេរៀនមខវSជ≠3ដចខងេកមបនពែកកមតណ? សមបងេលខ ១, ២, ៣, ៤, ឬ ៥ (១=េខ3cយ; ២=មធ3xម; ៣=លបងëរ; ៤=ល; ៥=លបេសើរ) កងតរងខងេកម។
មខវSជ≠3 កមតពែក មខវSជ≠3 កមតពែក គណតវSទ3U ភសែខរ របវSទ3U បវតវSទ3U គមវSទ3U សលធម/ពលរដវSទ3U ជវវSទ3U ភមវSទ3U ែផនដវSទ3U ភសបរេទស
15. េនថ23កទ១០ េតើអកបនពនមធ3xមភគឆមសទ១ បន63នសមបមខវSជ≠3នមយៗដចខងេកម?
មខវSជ≠3 ពនមធ3xមភគឆមសទ១ មខវSជ≠3 ពនមធ3xមភគឆមសទ១
គណតវSទ3U ភសែខរ
របវSទ3U បវតវSទ3U
គមវSទ3U សលធម/ពលរដវSទ3U
ជវវSទ3U ភមវSទ3U
ែផនដវSទ3U ភសបរេទស
16. េតើអកបនចណយេពលចននបន63នេមX3ងកងមយសបt3ហ សមបករសក3cេនផះ ឬ
េធើកចករផះ (Homework, Assignment, Self-study) កងមខវSជ≠3នមយៗដចខងេកម? សមសរេសរចននេមX3ងសរបកងមយសបt3ហ។
មខវSជ≠3 ចននេមX3ងសរប/សបt3ហ មខវSជ≠3 ចននេមX3ងសរប/សបt3ហ គណតវSទ3U ភសែខរ
របវSទ3U បវតវSទ3U
គមវSទ3U ភមវSទ3U
ជវវSទ3U មខវSជ≠3េផ3Aងេទៀត
17. េតើអកនងបនករសក3cេលើមខជនញកងវSសយ STEM េនសកលវSទ3Uលយែដរ ឬ េទ?
១. បកដជេរៀនកងវSសយេនះ ២. បកដជអតេរៀន 18. បសនេបើអកបនពចរណរច េតើអកនងបនករសក3cេលើជនញអ? សមបç≠3កៈ
ជនញ: _____________________________________________
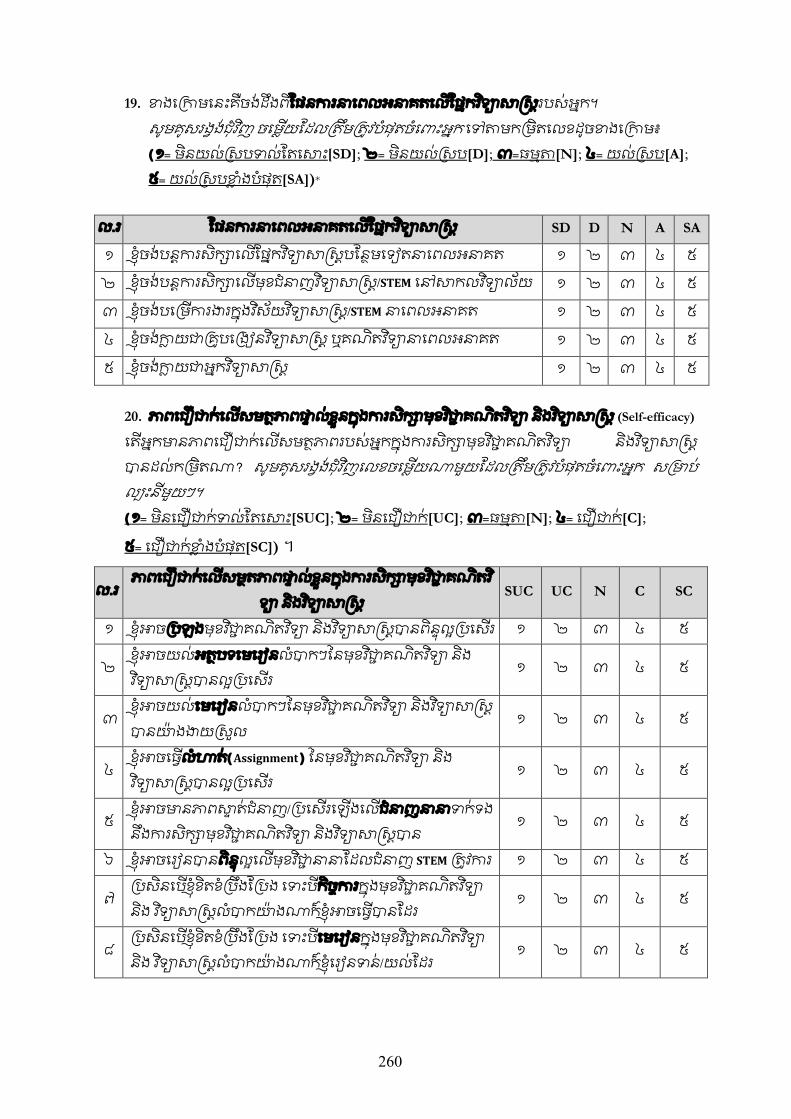
260
19. ខងេកមេនះគចងដងពែផនករនេពលអនគតេលើែផកវSទ3Uសeសរបសអក។ សមគសរងងជវSញ ចេមើយែដលតមតåវបផតចេពះអក េទតមកមតេលខដចខងេកម៖
(១= មនយលសបទលែតេសះ[SD]; ២= មនយលសប[D]; ៣=ធមត[N]; ៤= យលសប[A];
៥= យលសបខ|3ងបផត[SA])*
ល.រ ែផនករនេពលអនគតេលើែផកវSទ3Uសeស SD D N A SA
១ ខចងបនករសក3cេលើែផកវSទ3Uសeសបែនមេទៀតនេពលអនគត ១ ២ ៣ ៤ ៥
២ ខចងបនករសក3cេលើមខជនញវSទ3Uសeស/STEM េនសកលវSទ3Uលយ ១ ២ ៣ ៤ ៥
៣ ខចងបេមើករងរកងវSសយវSទ3Uសeស/STEM នេពលអនគត ១ ២ ៣ ៤ ៥
៤ ខចងក|3យជគåបេងៀនវSទ3Uសeស ឬគណតវSទ3Uនេពលអនគត ១ ២ ៣ ៤ ៥
៥ ខចងក|3យជអកវSទ3Uសeស ១ ២ ៣ ៤ ៥
20. ភពេជឿជកេលើសមតភពផè3លខëនកងករសក3cមខវSជ≠3គណតវSទ3U នងវSទ3Uសeស (Self-efficacy)
េតើអកមនភពេជឿជកេលើសមតភពរបសអកកងករសក3cមខវSជ≠3គណតវSទ3U នងវSទ3Uសeស បនដលកមតណ? សមគសរងងជវSញេលខចេមើយណមយែដលតមតåវបផតចេពះអក សមប ល3qះនមយៗ។ (១= មនេជឿជកទលែតេសះ[SUC]; ២= មនេជឿជក[UC]; ៣=ធមត[N]; ៤= េជឿជក[C];
៥= េជឿជកខ|3ងបផត[SC]) ។
ល.រ ភពេជឿជកេលើសមតភពផè3លខëនកងករសក3cមខវSជ≠3គណតវS
ទ3U នងវSទ3Uសeស SUC UC N C SC
១ ខអចបឡងមខវSជ≠3គណតវSទ3U នងវSទ3Uសeសបនពនលបេសើរ ១ ២ ៣ ៤ ៥
២ ខអចយលអតបទេមេរៀនលបកៗៃនមខវSជ≠3គណតវSទ3U នង វSទ3Uសeសបនលបេសើរ
១ ២ ៣ ៤ ៥
៣ ខអចយលេមេរៀនលបកៗៃនមខវSជ≠3គណតវSទ3U នងវSទ3Uសeស បនយX3ងងយសល
១ ២ ៣ ៤ ៥
៤ ខអចេធើលហត(Assignment) ៃនមខវSជ≠3គណតវSទ3U នង វSទ3Uសeសបនលបេសើរ
១ ២ ៣ ៤ ៥
៥ ខអចមនភពសè3តជនញ/បេសើរេឡើងេលើជនញននទកទង នងករសក3cមខវSជ≠3គណតវSទ3U នងវSទ3Uសeសបន
១ ២ ៣ ៤ ៥
៦ ខអចេរៀនបនពនលេលើមខវSជ≠3ននែដលជនញ STEM តåវករ ១ ២ ៣ ៤ ៥
៧ បសនេបើខខតខបងែបង េទះបកចករកងមខវSជ≠3គណតវSទ3U នង វSទ3UសeសលបកយX3ងណកខអចេធើបនែដរ
១ ២ ៣ ៤ ៥
៨ បសនេបើខខតខបងែបង េទះបេមេរៀនកងមខវSជ≠3គណតវSទ3U នង វSទ3UសeសលបកយX3ងណកខេរៀនទន/យលែដរ
១ ២ ៣ ៤ ៥
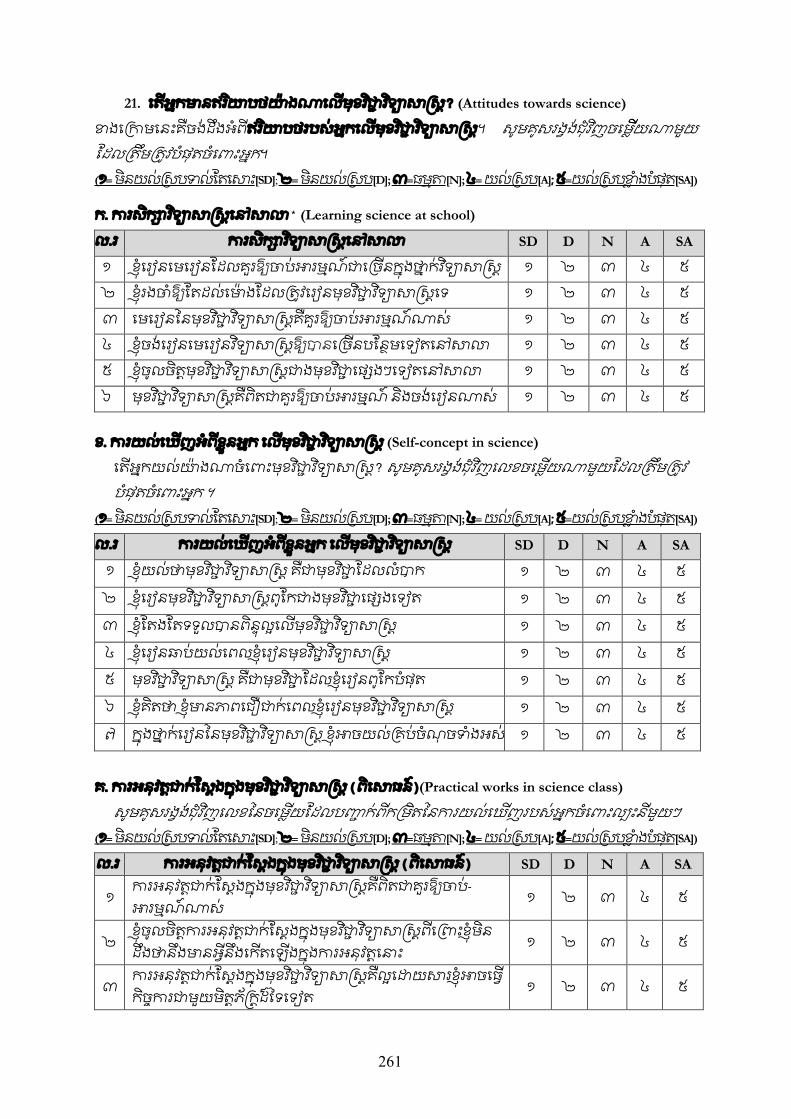
261
21. េតើអកមនឥរSយបថយX3ងណេលើមខវSជ≠3វSទ3Uសeស? (Attitudes towards science)
ខងេកមេនះគចងដងអពឥរSយបថរបសអកេលើមខវSជ≠3វSទ3Uសeស។ សមគសរងងជវSញចេមើ យណមយ ែដលតមតåវបផតចេពះអក។ (១= មនយលសបទលែតេសះ[SD]; ២= មនយលសប[D]; ៣=ធមត[N]; ៤= យលសប[A]; ៥=យលសបខ|3ងបផត[SA])
ក. ករសក3cវSទ3Uសeសេនសល* (Learning science at school)
ល.រ ករសក3cវSទ3Uសeសេនសល SD D N A SA
១ ខេរៀនេមេរៀនែដលគរឱ3xចបអរមណជេចើនកងថ23កវSទ3Uសeស ១ ២ ៣ ៤ ៥ ២ ខរងចឱ3xែតដលេមX3ងែដលតåវេរៀនមខវSជ≠3វSទ3Uសeសេទ ១ ២ ៣ ៤ ៥ ៣ េមេរៀនៃនមខវSជ≠3វSទ3Uសeសគគរឱ3xចបអរមណណស ១ ២ ៣ ៤ ៥ ៤ ខចងេរៀនេមេរៀនវSទ3Uសeសឱ3xបនេចើនបែនមេទៀតេនសល ១ ២ ៣ ៤ ៥ ៥ ខចលចតមខវSជ≠3វSទ3UសeសជងមខវSជ≠3េផ3Aងៗេទៀតេនសល ១ ២ ៣ ៤ ៥ ៦ មខវSជ≠3វSទ3Uសeសគពតជគរឱ3xចបអរមណ នងចងេរៀនណស ១ ២ ៣ ៤ ៥
ខ. ករយលេឃើញអពខëនអក េលើមខវSជ≠3វSទ3Uសeស (Self-concept in science)
េតើអកយលយX3ងណចេពះមខវSជ≠3វSទ3Uសeស? សមគសរងងជវSញេលខចេមើយណមយែដលតមតåវ បផតចេពះអក ។
(១= មនយលសបទលែតេសះ[SD]; ២= មនយលសប[D]; ៣=ធមត[N]; ៤= យលសប[A]; ៥=យលសបខ|3ងបផត[SA])
ល.រ ករយលេឃើញអពខëនអក េលើមខវSជ≠3វSទ3Uសeស SD D N A SA
១ ខយលថមខវSជ≠3វSទ3Uសeស គជមខវSជ≠3ែដលលបក ១ ២ ៣ ៤ ៥ ២ ខេរៀនមខវSជ≠3វSទ3UសeសពែកជងមខវSជ≠3េផ3Aងេទៀត ១ ២ ៣ ៤ ៥ ៣ ខែតងែតទទលបនពនលេលើមខវSជ≠3វSទ3Uសeស ១ ២ ៣ ៤ ៥ ៤ ខេរៀនឆបយលេពលខេរៀនមខវSជ≠3វSទ3Uសeស ១ ២ ៣ ៤ ៥ ៥ មខវSជ≠3វSទ3Uសeស គជមខវSជ≠3ែដលខេរៀនពែកបផត ១ ២ ៣ ៤ ៥ ៦ ខគតថ ខមនភពេជឿជកេពលខេរៀនមខវSជ≠3វSទ3Uសeស ១ ២ ៣ ៤ ៥ ៧ កងថ23កេរៀនៃនមខវSជ≠3វSទ3Uសeស ខអចយលគបចណ¡ចទងអស ១ ២ ៣ ៤ ៥
គ. ករអនវតជកែសងកងមខវSជ≠3វSទ3Uសeស (ពេសធន)(Practical works in science class)
សមគសរងងជវSញេលខៃនចេមើយែដលបç≠3កពកមតៃនករយលេឃើញរបសអកចេពះល3qះនមយៗ (១= មនយលសបទលែតេសះ[SD]; ២= មនយលសប[D]; ៣=ធមត[N]; ៤= យលសប[A]; ៥=យលសបខ|3ងបផត[SA])
ល.រ ករអនវតជកែសងកងមខវSជ≠3វSទ3Uសeស (ពេសធន) SD D N A SA
១ ករអនវតជកែសងកងមខវSជ≠3វSទ3Uសeសគពតជគរឱ3xចប- អរមណណស ១ ២ ៣ ៤ ៥
២ ខចលចតករអនវតជកែសងកងមខវSជ≠3វSទ3Uសeសពេពះខមន ដងថនងមនអនងេកើតេឡើងកងករអនវតេនះ ១ ២ ៣ ៤ ៥
៣ ករអនវតជកែសងកងមខវSជ≠3វSទ3Uសeសគលេដយសរខអចេធើ កចករជមយមតភeកដៃទេទៀត ១ ២ ៣ ៤ ៥
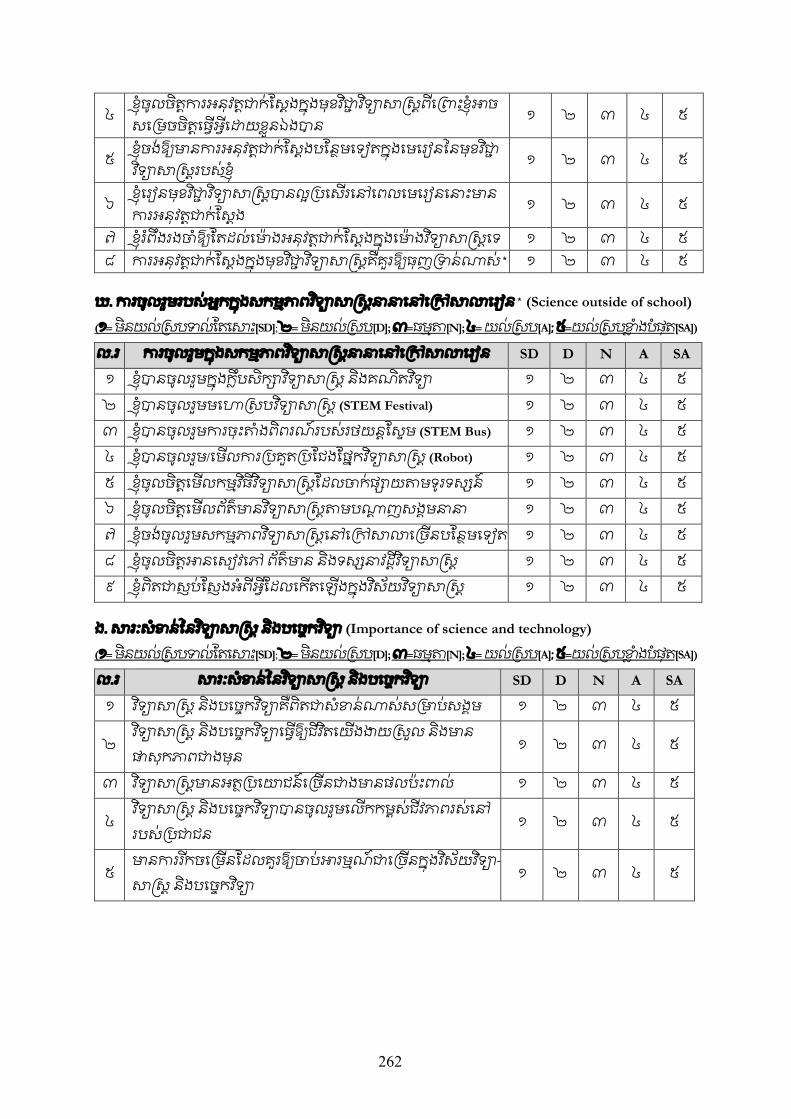
262
៤ ខចលចតករអនវតជកែសងកងមខវSជ≠3វSទ3Uសeសពេពះខអច សេមចចតេធើអេដយខëនឯងបន ១ ២ ៣ ៤ ៥
៥ ខចងឱ3xមនករអនវតជកែសងបែនមេទៀតកងេមេរៀនៃនមខវSជ≠3 វSទ3Uសeសរបសខ ១ ២ ៣ ៤ ៥
៦ ខេរៀនមខវSជ≠3វSទ3Uសeសបនលបេសើរេនេពលេមេរៀនេនះមន ករអនវតជកែសង
១ ២ ៣ ៤ ៥
៧ ខរ¢ពងរងចឱ3xែតដលេមX3ងអនវតជកែសងកងេមX3ងវSទ3Uសeសេទ ១ ២ ៣ ៤ ៥ ៨ ករអនវតជកែសងកងមខវSជ≠3វSទ3Uសeសគគរឱ3xធញទនណស* ១ ២ ៣ ៤ ៥
ឃ. ករចលរមរបសអកកងសកមភពវSទ3Uសeសននេនេកសលេរៀន* (Science outside of school)
(១= មនយលសបទលែតេសះ[SD]; ២= មនយលសប[D]; ៣=ធមត[N]; ៤= យលសប[A]; ៥=យលសបខ|3ងបផត[SA])
ល.រ ករចលរមកងសកមភពវSទ3Uសeសននេនេកសលេរៀន SD D N A SA
១ ខបនចលរមកងកបសក3cវSទ3Uសeស នងគណតវSទ3U ១ ២ ៣ ៤ ៥ ២ ខបនចលរមមេហសបវSទ3Uសeស (STEM Festival) ១ ២ ៣ ៤ ៥ ៣ ខបនចលរមករចះតងពពរណរបសរថយនែសម (STEM Bus) ១ ២ ៣ ៤ ៥ ៤ ខបនចលរម/េមើលករបគតបែជងែផកវSទ3Uសeស (Robot) ១ ២ ៣ ៤ ៥ ៥ ខចលចតេមើលកមវSធវSទ3Uសeសែដលចកផ3cយតមទរទស3Aន ១ ២ ៣ ៤ ៥ ៦ ខចលចតេមើលពតមនវSទ3Uសeសតមបណ√3ញសងមនន ១ ២ ៣ ៤ ៥ ៧ ខចងចលរមសកមភពវSទ3Uសeសេនេកសលេចើនបែនមេទៀត ១ ២ ៣ ៤ ៥ ៨ ខចលចតអនេសៀវេភ ពតមន នងទស3AនវដវSទ3Uសeស ១ ២ ៣ ៤ ៥ ៩ ខពតជសបែសងអពអែដលេកើតេឡើងកងវSសយវSទ3Uសeស ១ ២ ៣ ៤ ៥
ង. សរៈសខនៃនវSទ3Uសeស នងបេចកវSទ3U (Importance of science and technology)
(១= មនយលសបទលែតេសះ[SD]; ២= មនយលសប[D]; ៣=ធមត[N]; ៤= យលសប[A]; ៥=យលសបខ|3ងបផត[SA])
ល.រ សរៈសខនៃនវSទ3Uសeស នងបេចកវSទ3U SD D N A SA
១ វSទ3Uសeស នងបេចកវSទ3Uគពតជសខនណសសមបសងម ១ ២ ៣ ៤ ៥
២ វSទ3Uសeស នងបេចកវSទ3Uេធើឱ3xជវSតេយើងងយសល នងមន ផសកភពជងមន
១ ២ ៣ ៤ ៥
៣ វSទ3Uសeសមនអតបេយជនេចើនជងមនផលបះពល ១ ២ ៣ ៤ ៥
៤ វSទ3Uសeស នងបេចកវSទ3Uបនចលរមេលើកកមសជវភពរសេន របសបជជន
១ ២ ៣ ៤ ៥
៥ មនកររÑកចេមើនែដលគរឱ3xចបអរមណជេចើនកងវSសយវSទ3U- សeស នងបេចកវSទ3U
១ ២ ៣ ៤ ៥
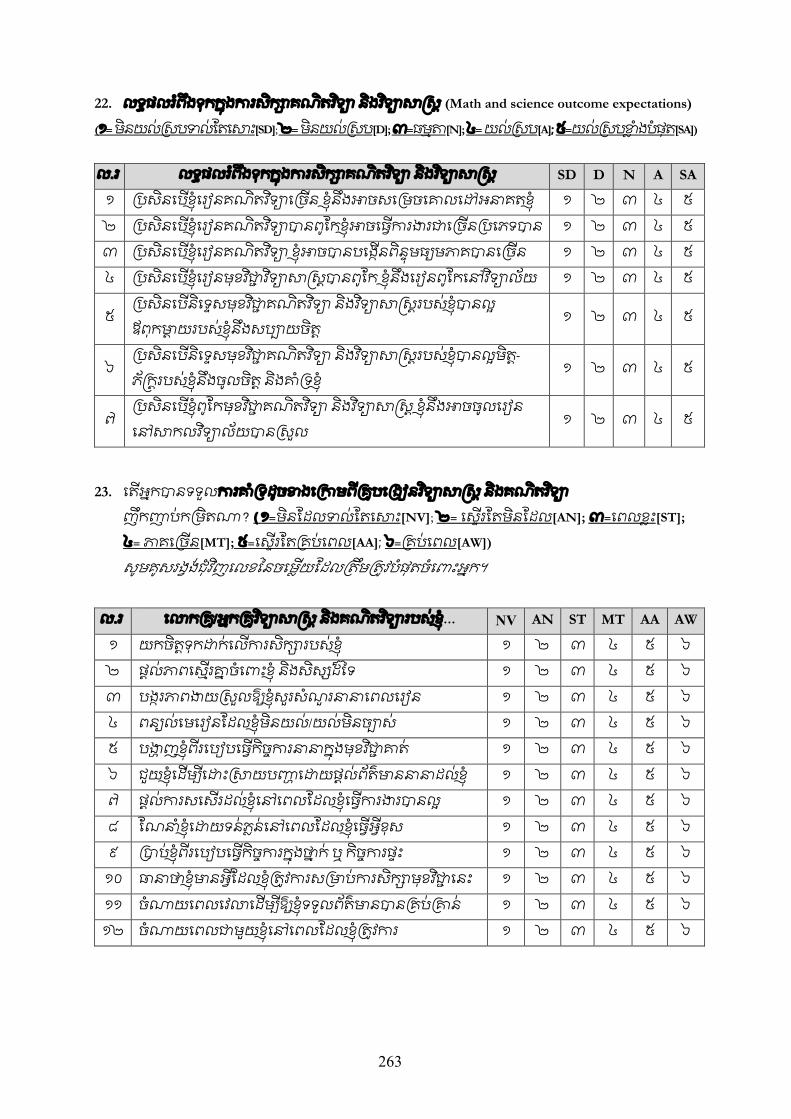
263
22. លទផលរ¢ពងទកកងករសក3cគណតវSទ3U នងវSទ3Uសeស (Math and science outcome expectations)
(១= មនយលសបទលែតេសះ[SD]; ២= មនយលសប[D]; ៣=ធមត[N]; ៤= យលសប[A]; ៥=យលសបខ|3ងបផត[SA])
ល.រ លទផលរ¢ពងទកកងករសក3cគណតវSទ3U នងវSទ3Uសeស SD D N A SA
១ បសនេបើខេរៀនគណតវSទ3Uេចើន ខនងអចសេមចេគលេដអនគតខ ១ ២ ៣ ៤ ៥ ២ បសនេបើខេរៀនគណតវSទ3Uបនពែកខអចេធើករងរជេចើនបេភទបន ១ ២ ៣ ៤ ៥ ៣ បសនេបើខេរៀនគណតវSទ3U ខអចបនបេងើនពនមធ3xមភគបនេចើន ១ ២ ៣ ៤ ៥ ៤ បសនេបើខេរៀនមខវSជ≠3វSទ3Uសeសបនពែក ខនងេរៀនពែកេនវSទ3Uលយ ១ ២ ៣ ៤ ៥
៥ បសនេបើនេទសមខវSជ≠3គណតវSទ3U នងវSទ3Uសeសរបសខបនល ឪពកមt3យរបសខនងសប3®យចត
១ ២ ៣ ៤ ៥
៦ បសនេបើនេទសមខវSជ≠3គណតវSទ3U នងវSទ3Uសeសរបសខបនលមត- ភeករបសខនងចលចត នងគទខ
១ ២ ៣ ៤ ៥
៧ បសនេបើខពែកមខវSជ≠3គណតវSទ3U នងវSទ3Uសeស ខនងអចចលេរៀន េនសកលវSទ3Uលយបនសល
១ ២ ៣ ៤ ៥
23. េតើអកបនទទលករគទដចខងេកមពគåបេងៀនវSទ3Uសeស នងគណតវSទ3U ញកញបកមតណ? (១=មនែដលទលែតេសះ[NV]; ២= េសើរែតមនែដល[AN]; ៣=េពលខះ[ST];
៤= ភគេចើន[MT]; ៥=េសើរែតគបេពល[AA]; ៦=គបេពល[AW])
សមគសរងងជវSញេលខៃនចេមើយែដលតមតåវបផតចេពះអក។
ល.រ េលកគå/អកគåវSទ3Uសeស នងគណតវSទ3Uរបសខ… NV AN ST MT AA AW
១ យកចតទកដកេលើករសក3cរបសខ ១ ២ ៣ ៤ ៥ ៦ ២ ផលភពេសើរគ23ចេពះខ នងសស3Aដៃ ទ ១ ២ ៣ ៤ ៥ ៦ ៣ បងរភពងយសលឱ3xខសរសណòរននេពលេរៀន ១ ២ ៣ ៤ ៥ ៦ ៤ ពន3xលេមេរៀនែដលខមនយល/យលមនច3®ស ១ ២ ៣ ៤ ៥ ៦ ៥ បងâ3ញខពរេបៀបេធើកចករននកងមខវSជ≠3គត ១ ២ ៣ ៤ ៥ ៦ ៦ ជយខេដើម3qេដះសយបçâ3េដយផលពតមនននដលខ ១ ២ ៣ ៤ ៥ ៦ ៧ ផលករសេសើរដលខេនេពលែដលខេធើករងរបនល ១ ២ ៣ ៤ ៥ ៦ ៨ ែណនខេដយទនភនេនេពលែដលខេធើអខស ១ ២ ៣ ៤ ៥ ៦ ៩ បបខពរេបៀបេធើកចករកងថ23ក ឬ កចករផះ ១ ២ ៣ ៤ ៥ ៦ ១០ ធនថខមនអែដលខតåវករសមបករសក3cមខវSជ≠3េនះ ១ ២ ៣ ៤ ៥ ៦ ១១ ចណយេពលេវលេដើម3qឱ3xខទទលពតមនបនគបគន ១ ២ ៣ ៤ ៥ ៦ ១២ ចណយេពលជមយខេនេពលែដលខតåវករ ១ ២ ៣ ៤ ៥ ៦
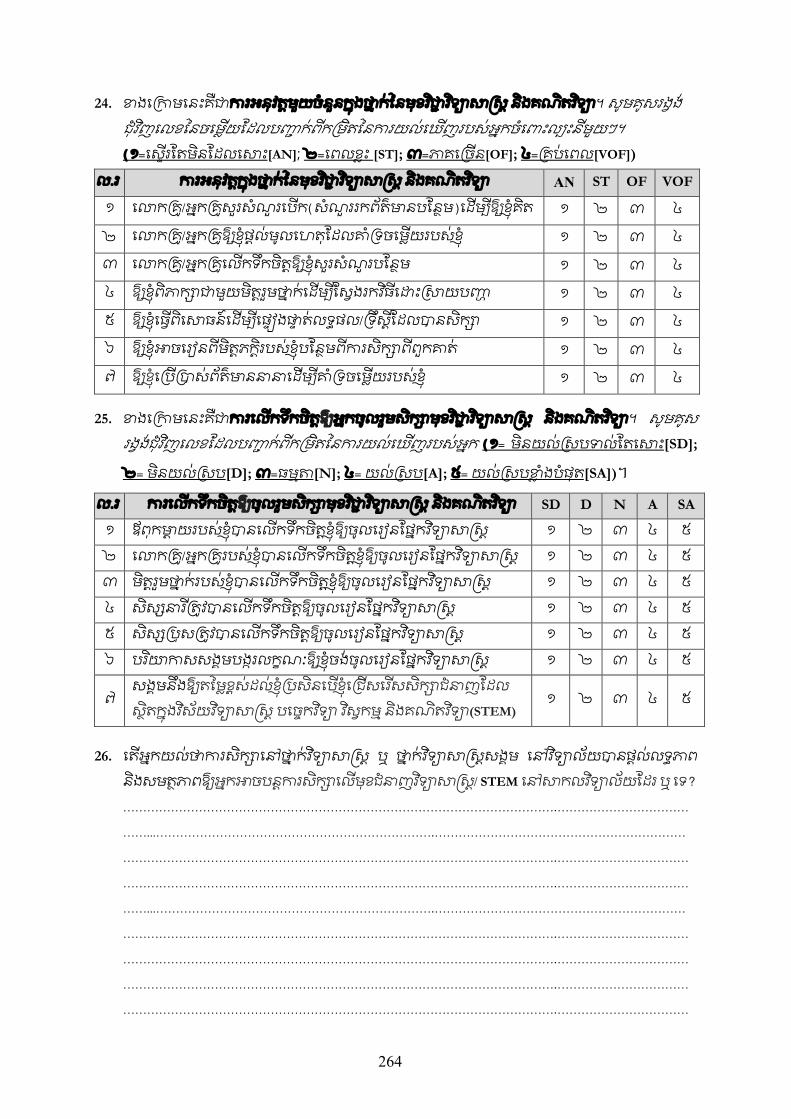
264
24. ខងេកមេនះគជករអនវតមយចននកងថ23កៃនមខវSជ≠3វSទ3Uសeស នងគណតវSទ3U។ សមគសរងង ជវSញេលខៃនចេមើយែដលបç≠3កពកមតៃនករយលេឃើញរបសអកចេពះល3qះនមយៗ។ (១=េសើរែតមនែដលេសះ[AN]; ២=េពលខះ [ST]; ៣=ភគេចើន[OF]; ៤=គបេពល[VOF])
ល.រ ករអនវតកងថ23កៃនមខវSជ≠3វSទ3Uសeស នងគណតវSទ3U AN ST OF VOF
១ េលកគå/អកគåសរសណòរេបើក(សណòររកពតមនបែនម)េដើម3qឱ3xខគត ១ ២ ៣ ៤
២ េលកគå/អកគåឱ3xខផលមលេហតែដលគទចេមើយរបសខ ១ ២ ៣ ៤ ៣ េលកគå/អកគåេលើកទកចតឱ3xខសរសណòរបែនម ១ ២ ៣ ៤ ៤ ឱ3xខពភក3cជមយមតរមថ23កេដើម3qែសងរកវSធេដះសយបçâ3 ១ ២ ៣ ៤ ៥ ឱ3xខេធើពេសធនេដើម3qេផ∆ងផè3តលទផល/ទសែដលបនសក3c ១ ២ ៣ ៤ ៦ ឱ3xខអចេរៀនពមតភករបសខបែនមពករសក3cពពកគត ១ ២ ៣ ៤ ៧ ឱ3xខេបើបសពតមនននេដើម3qគទចេមើយរបសខ ១ ២ ៣ ៤
25. ខងេកមេនះគជករេលើកទកចតឱ3xអកចលរមសក3cមខវSជ≠3វSទ3Uសeស នងគណតវSទ3U។ សមគស រងងជវSញេលខែដលបç≠3កពកមតៃនករយលេឃើញរបសអក (១= មនយលសបទលែតេសះ[SD];
២= មនយលសប[D]; ៣=ធមត[N]; ៤= យលសប[A]; ៥= យលសបខ|3ងបផត[SA])។
ល.រ ករេលើកទកចតឱ3xចលរមសក3cមខវSជ≠3វSទ3Uសeស នងគណតវSទ3U SD D N A SA
១ ឪពកមt3យរបសខបនេលើកទកចតខឱ3xចលេរៀនែផកវSទ3Uសeស ១ ២ ៣ ៤ ៥ ២ េលកគå/អកគåរបសខបនេលើកទកចតខឱ3xចលេរៀនែផកវSទ3Uសeស ១ ២ ៣ ៤ ៥ ៣ មតរមថ23ករបសខបនេលើកទកចតខឱ3xចលេរៀនែផកវSទ3Uសeស ១ ២ ៣ ៤ ៥ ៤ សស3AនរÑតåវបនេលើកទកចតឱ3xចលេរៀនែផកវSទ3Uសeស ១ ២ ៣ ៤ ៥ ៥ សស3Aបសតåវបនេលើកទកចតឱ3xចលេរៀនែផកវSទ3Uសeស ១ ២ ៣ ៤ ៥ ៦ បរSយកសសងមបងរលកណៈឱ3xខចងចលេរៀនែផកវSទ3Uសeស ១ ២ ៣ ៤ ៥
៧ សងមនងឱ3xតៃមខសដលខបសនេបើខេជើសេរÑសសក3cជនញែដល សតកងវSសយវSទ3Uសeស បេចកវSទ3U វSសកម នងគណតវSទ3U(STEM)
១ ២ ៣ ៤ ៥
26. េតើអកយលថករសក3cេនថ23កវSទ3Uសeស ឬ ថ23កវSទ3Uសeសសងម េនវSទ3Uលយបនផលលទភព
នងសមតភពឱ3xអកអចបនករសក3cេលើមខជនញវSទ3Uសeស/ STEM េនសកលវSទ3Uលយែដរ ឬ េទ? ……………………………………………………………………………………………….……………………………
……...…………………………………………………………….………………………………………………………
……………………………………………………………………………………………….……………………………
……………………………………………………………………………………………….……………………………
……...…………………………………………………………….………………………………………………………
……………………………………………………………………………………………….……………………………
……………………………………………………………………………………………….……………………………
……………………………………………………………………………………………….……………………………
……………………………………………………………………………………………….……………………………
265
27. េតើអកគតថបរSយកសេនជ វSញអក (កមគÅសរ វSទ3Uលយ នងកតt3េផ3Aងៗេទៀត) បនជមញ ទកចត ឬ បង«3កទកចតអកកងករចងបនករសក3cេលើជនញកងវSសយវSទ3Uសeស បេចកវSទ3U វSសកម នងគណតវSទ3U (STEM) កមតណ?
……………………………………………………………………………………………….……………………………
……...…………………………………………………………….………………………………………………………
…………………...…………………….…………………………………………………………………………………
……………………………………………………………………………………………….……………………………
……………………………………………………………………………………………….……………………………
……………………………………………………………………………………………….……………………………
……………………………………………………………………………………………….……………………………
……………………………………………………………………………………………….……………………………
……………………………………………………………………………………………….……………………………
28. បសនេបើអកបនករសក3cេទកមតឧតមសក3c េតើអកនងបនករសក3cេលើជនញកងវSសយវSទ3U-
សeស បេចកវSទ3U វSសកម នងគណតវSទ3U (STEM) ែដរ ឬ េទ? េហតអ?
……...…………………………………………………………….………………………………………………………
……...…………………………………………………………….………………………………………………………
……...…………………………………………………………….………………………………………………………
……...…………………………………………………………….………………………………………………………
……………………………………………………………………………………………….……………………………
……………………………………………………………………………………………….……………………………
……………………………………………………………………………………………….……………………………
……………………………………………………………………………………………….……………………………
……………………………………………………………………………………………….……………………………
……………………………………………………………………………………………….……………………………
……………………………………………………………………………………………….……………………………
……………………………………………………………………………………………….……………………………
សមអរគណចេពះករចលរមយ23ងសកមរបសអកទងអសគ<3ក=ងករសក3?េនះ ករចលរមមយេនះពតជមនសរៈសខន នងបនចលរមចែណកយ23ងេចើនបផតក=ងករសក3?សវជវមយេនះ។
ជនពរអកទងអសគ<3ទទលបននវេជគជយក=ងករសក3? នងជវSតករងរនេពលអនគត។
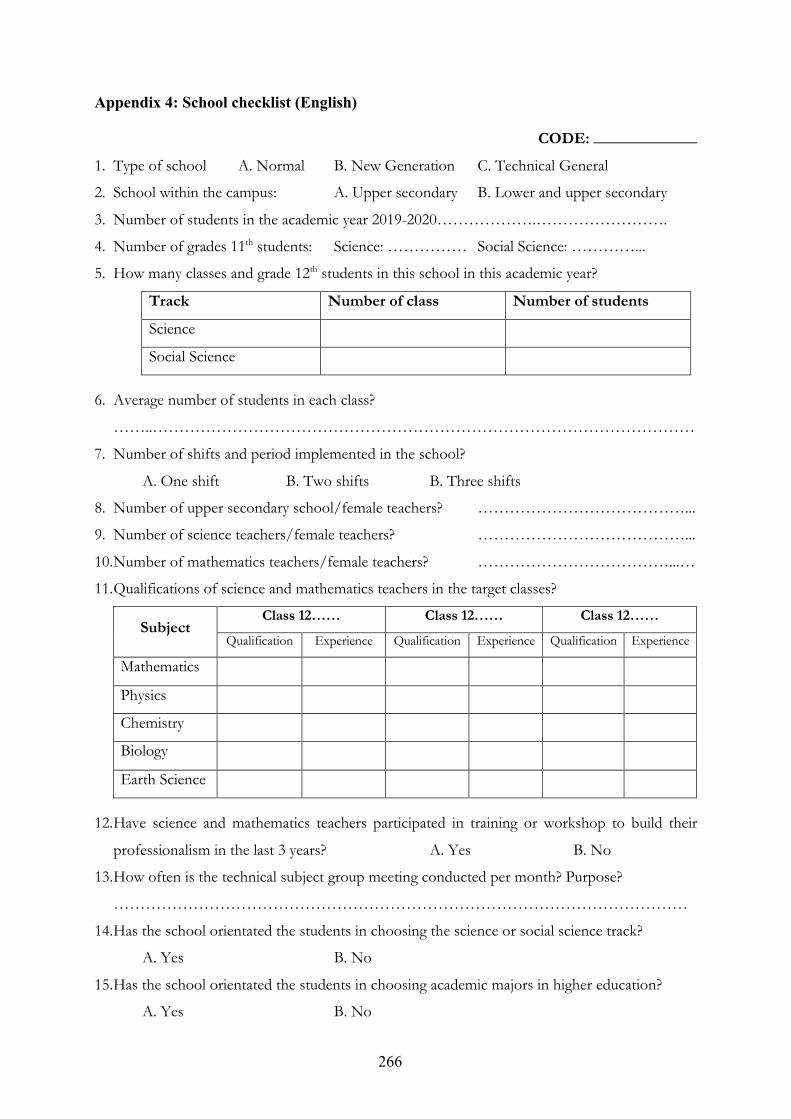
266
Appendix 4: School checklist (English)
CODE: _____________
1. Type of school A. Normal B. New Generation C. Technical General
2. School within the campus: A. Upper secondary B. Lower and upper secondary
3. Number of students in the academic year 2019-2020……………….…………………….
4. Number of grades 11th students: Science: …………… Social Science: …………...
5. How many classes and grade 12th students in this school in this academic year?
Track Number of class Number of students
Science
Social Science
6. Average number of students in each class?
……..…………………………………………………………………………………………
7. Number of shifts and period implemented in the school?
A. One shift B. Two shifts B. Three shifts
8. Number of upper secondary school/female teachers? …………………………………...
9. Number of science teachers/female teachers? …………………………………...
10. Number of mathematics teachers/female teachers? ………………………………...…
11. Qualifications of science and mathematics teachers in the target classes?
Subject Class 12…… Class 12…… Class 12……
Qualification Experience Qualification Experience Qualification Experience
Mathematics
Physics
Chemistry
Biology
Earth Science
12. Have science and mathematics teachers participated in training or workshop to build their
professionalism in the last 3 years? A. Yes B. No
13. How often is the technical subject group meeting conducted per month? Purpose?
………………………………………………………………………………………………
14. Has the school orientated the students in choosing the science or social science track?
A. Yes B. No
15. Has the school orientated the students in choosing academic majors in higher education?
A. Yes B. No
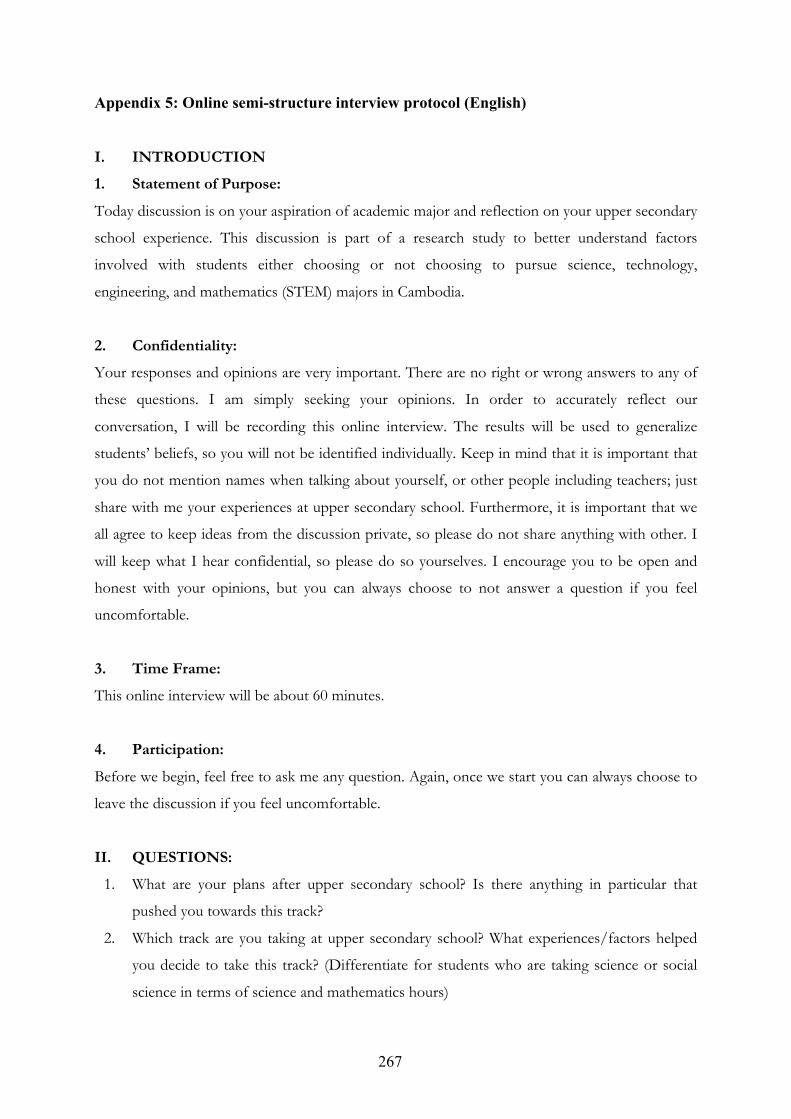
267
Appendix 5: Online semi-structure interview protocol (English)
I. INTRODUCTION
1. Statement of Purpose:
Today discussion is on your aspiration of academic major and reflection on your upper secondary
school experience. This discussion is part of a research study to better understand factors
involved with students either choosing or not choosing to pursue science, technology,
engineering, and mathematics (STEM) majors in Cambodia.
2. Confidentiality:
Your responses and opinions are very important. There are no right or wrong answers to any of
these questions. I am simply seeking your opinions. In order to accurately reflect our
conversation, I will be recording this online interview. The results will be used to generalize
students’ beliefs, so you will not be identified individually. Keep in mind that it is important that
you do not mention names when talking about yourself, or other people including teachers; just
share with me your experiences at upper secondary school. Furthermore, it is important that we
all agree to keep ideas from the discussion private, so please do not share anything with other. I
will keep what I hear confidential, so please do so yourselves. I encourage you to be open and
honest with your opinions, but you can always choose to not answer a question if you feel
uncomfortable.
3. Time Frame:
This online interview will be about 60 minutes.
4. Participation:
Before we begin, feel free to ask me any question. Again, once we start you can always choose to
leave the discussion if you feel uncomfortable.
II. QUESTIONS:
1. What are your plans after upper secondary school? Is there anything in particular that
pushed you towards this track?
2. Which track are you taking at upper secondary school? What experiences/factors helped
you decide to take this track? (Differentiate for students who are taking science or social
science in terms of science and mathematics hours)
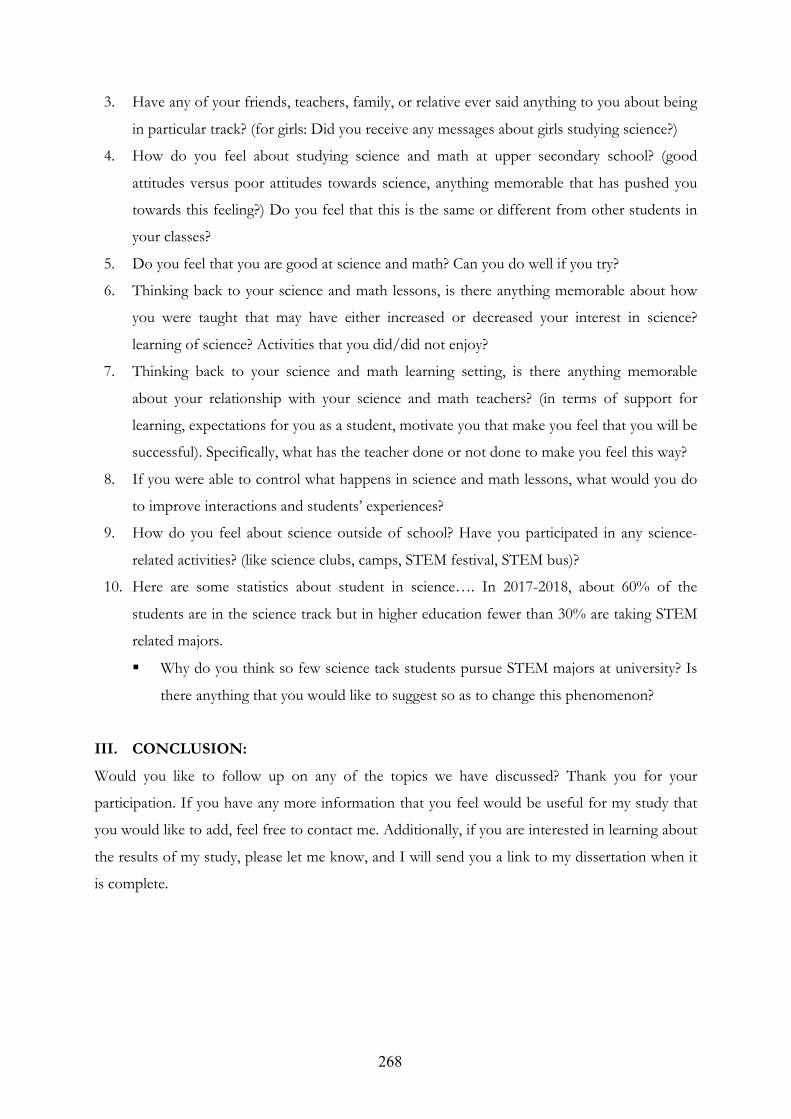
268
3. Have any of your friends, teachers, family, or relative ever said anything to you about being
in particular track? (for girls: Did you receive any messages about girls studying science?)
4. How do you feel about studying science and math at upper secondary school? (good
attitudes versus poor attitudes towards science, anything memorable that has pushed you
towards this feeling?) Do you feel that this is the same or different from other students in
your classes?
5. Do you feel that you are good at science and math? Can you do well if you try?
6. Thinking back to your science and math lessons, is there anything memorable about how
you were taught that may have either increased or decreased your interest in science?
learning of science? Activities that you did/did not enjoy?
7. Thinking back to your science and math learning setting, is there anything memorable
about your relationship with your science and math teachers? (in terms of support for
learning, expectations for you as a student, motivate you that make you feel that you will be
successful). Specifically, what has the teacher done or not done to make you feel this way?
8. If you were able to control what happens in science and math lessons, what would you do
to improve interactions and students’ experiences?
9. How do you feel about science outside of school? Have you participated in any science-
related activities? (like science clubs, camps, STEM festival, STEM bus)?
10. Here are some statistics about student in science…. In 2017-2018, about 60% of the
students are in the science track but in higher education fewer than 30% are taking STEM
related majors.
§ Why do you think so few science tack students pursue STEM majors at university? Is
there anything that you would like to suggest so as to change this phenomenon?
III. CONCLUSION:
Would you like to follow up on any of the topics we have discussed? Thank you for your
participation. If you have any more information that you feel would be useful for my study that
you would like to add, feel free to contact me. Additionally, if you are interested in learning about
the results of my study, please let me know, and I will send you a link to my dissertation when it
is complete.
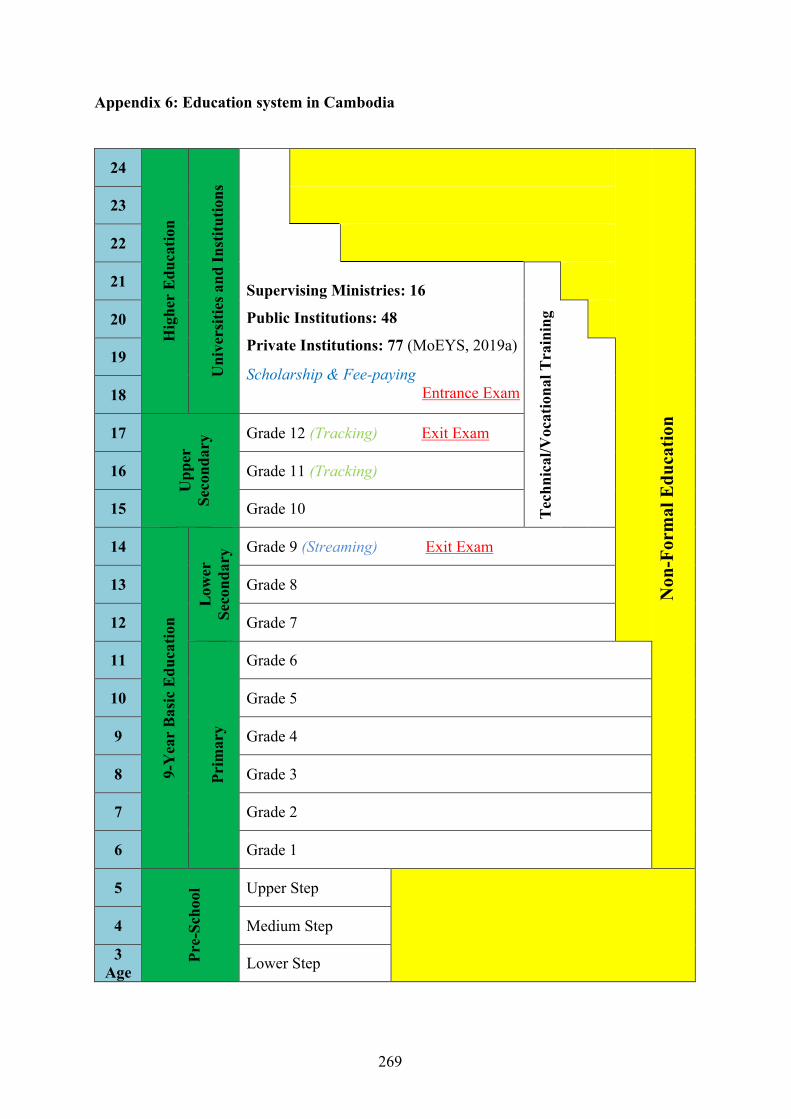
269
Appendix 6: Education system in Cambodia
24 H
ighe
r E
duca
tion
Uni
vers
ities
and
Inst
itutio
ns
Non
-For
mal
Edu
cat io
n
23
22
21 Supervising Ministries: 16
Public Institutions: 48
Private Institutions: 77 (MoEYS, 2019a)
Scholarship & Fee-paying
Entrance Exam
Tech
nica
l/Voc
atio
nal T
rain
ing
20
19
18
17
Upp
er
Seco
ndar
y Grade 12 (Tracking) Exit Exam
16 Grade 11 (Tracking)
15 Grade 10
14
9-Y
ear
Basic
Edu
catio
n
Low
er
Seco
ndar
y Grade 9 (Streaming) Exit Exam
13 Grade 8
12 Grade 7
11
Prim
ary
Grade 6
10 Grade 5
9 Grade 4
8 Grade 3
7 Grade 2
6 Grade 1
5
Pre-
Scho
ol Upper Step
4 Medium Step
3 Age Lower Step
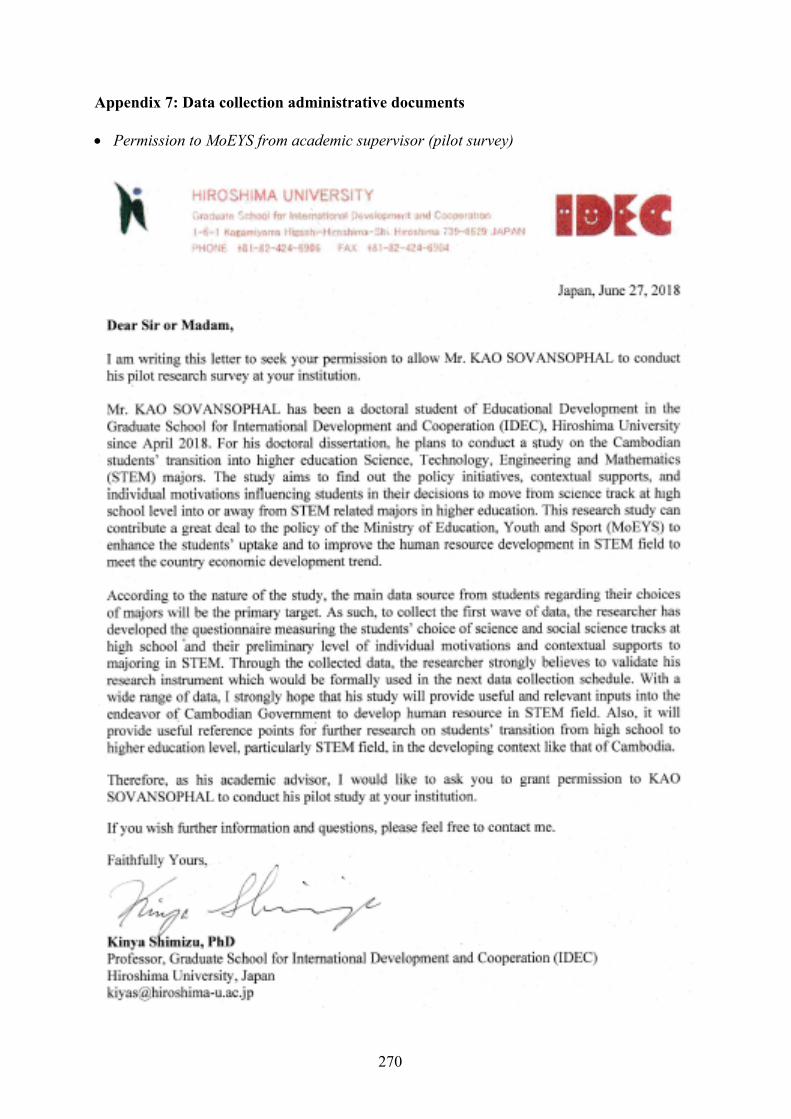
270
Appendix 7: Data collection administrative documents • Permission to MoEYS from academic supervisor (pilot survey)
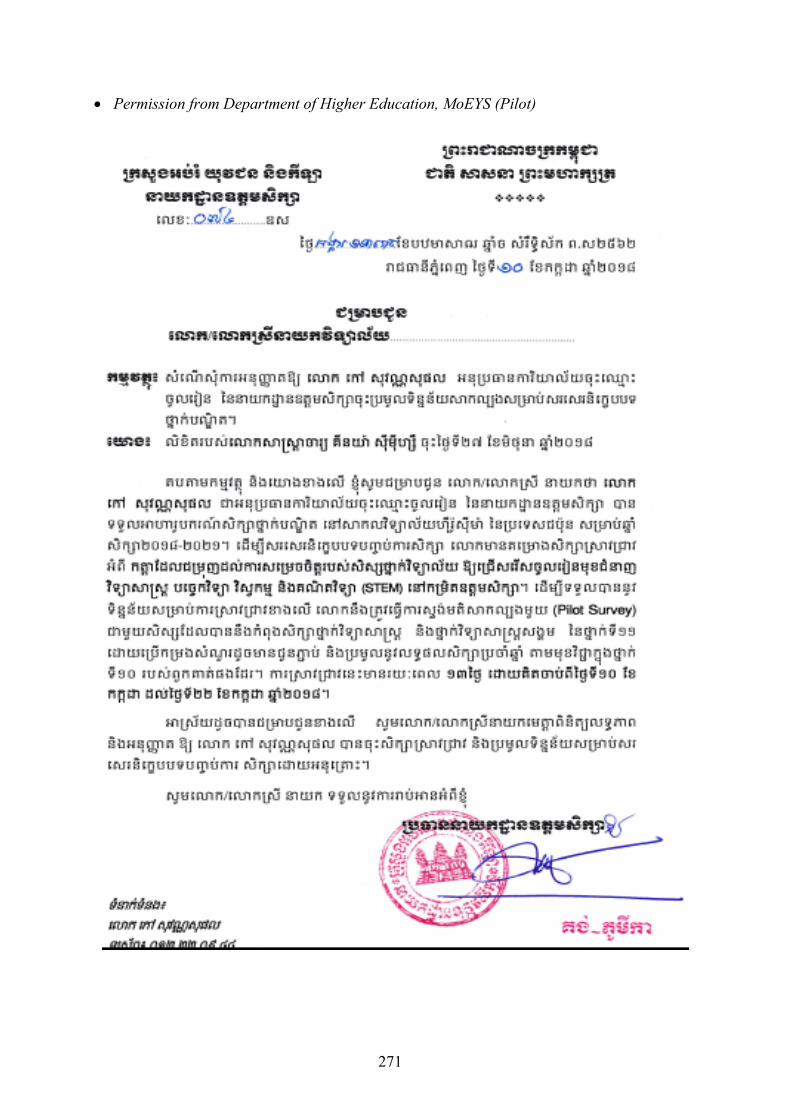
271
• Permission from Department of Higher Education, MoEYS (Pilot)
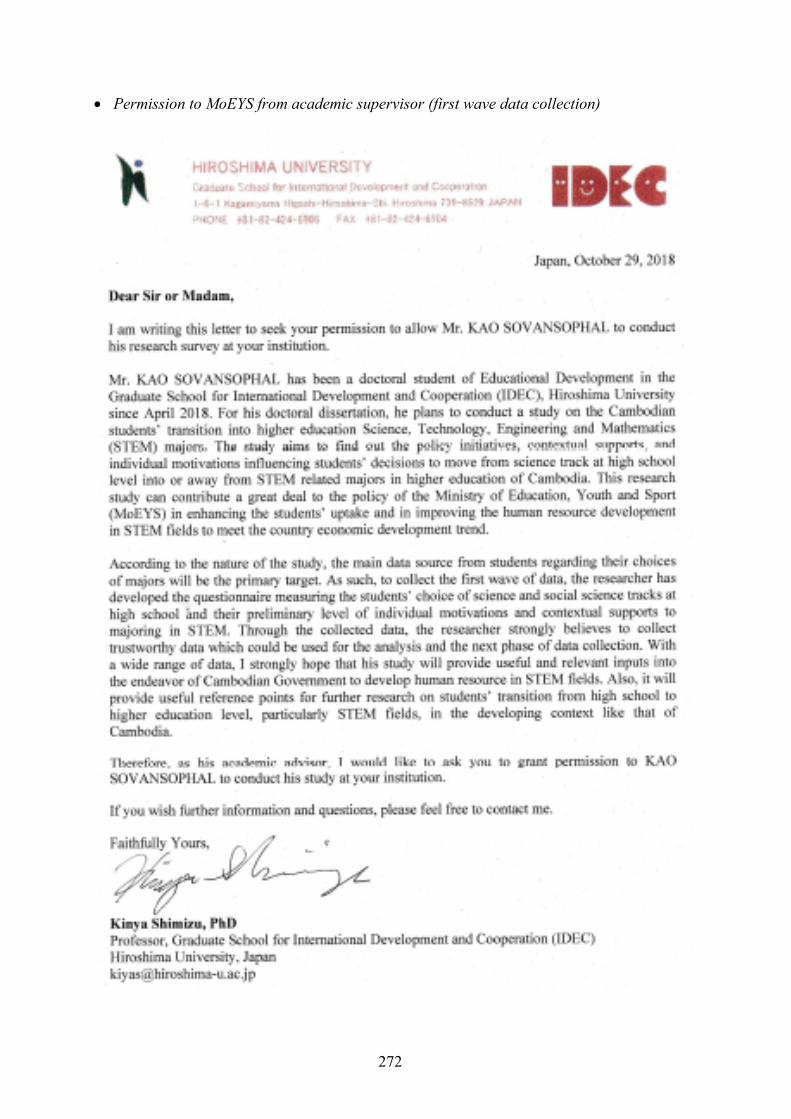
272
• Permission to MoEYS from academic supervisor (first wave data collection)
273
• Permission from Department of Higher Education, MoEYS (first wave data collection)
274
• Permission to MoEYS from academic supervisor (second wave data collection)
275
• Permission from Department of Higher Education, MoEYS (second wave data collection)
276
• Permission to MoEYS from academic supervisor (field research check)
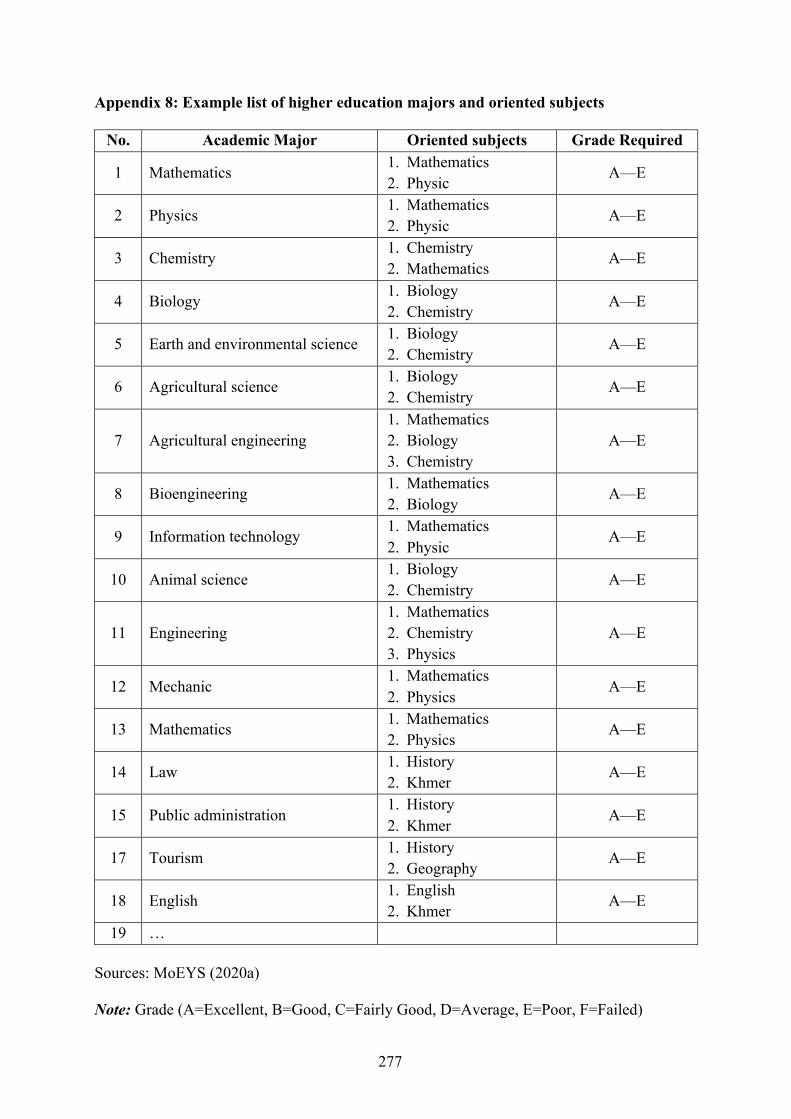
277
Appendix 8: Example list of higher education majors and oriented subjects
No. Academic Major Oriented subjects Grade Required
1 Mathematics 1. Mathematics
2. Physic A—E
2 Physics 1. Mathematics
2. Physic A—E
3 Chemistry 1. Chemistry
2. Mathematics A—E
4 Biology 1. Biology
2. Chemistry A—E
5 Earth and environmental science 1. Biology
2. Chemistry A—E
6 Agricultural science 1. Biology
2. Chemistry A—E
7 Agricultural engineering
1. Mathematics
2. Biology
3. Chemistry
A—E
8 Bioengineering 1. Mathematics
2. Biology A—E
9 Information technology 1. Mathematics
2. Physic A—E
10 Animal science 1. Biology
2. Chemistry A—E
11 Engineering
1. Mathematics
2. Chemistry
3. Physics
A—E
12 Mechanic 1. Mathematics
2. Physics A—E
13 Mathematics 1. Mathematics
2. Physics A—E
14 Law 1. History
2. Khmer A—E
15 Public administration 1. History
2. Khmer A—E
17 Tourism 1. History
2. Geography A—E
18 English 1. English
2. Khmer A—E
19 …
Sources: MoEYS (2020a)
Note: Grade (A=Excellent, B=Good, C=Fairly Good, D=Average, E=Poor, F=Failed)
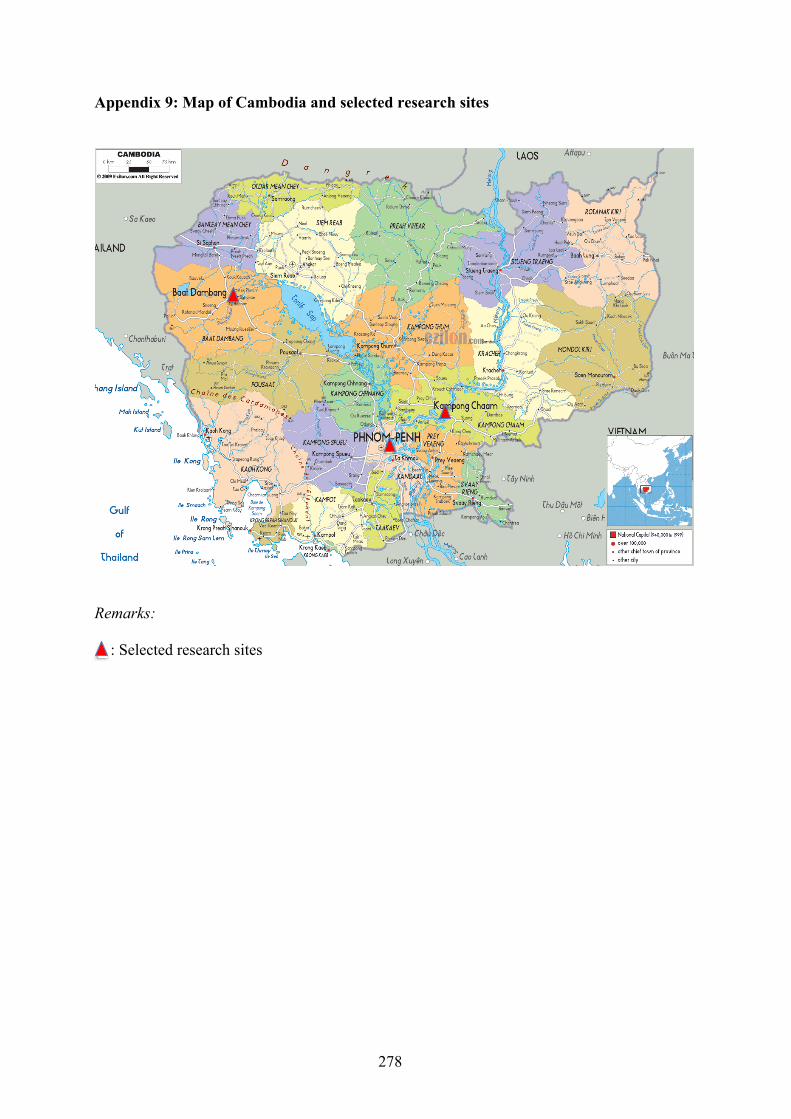
278
Appendix 9: Map of Cambodia and selected research sites
Remarks:
: Selected research sites
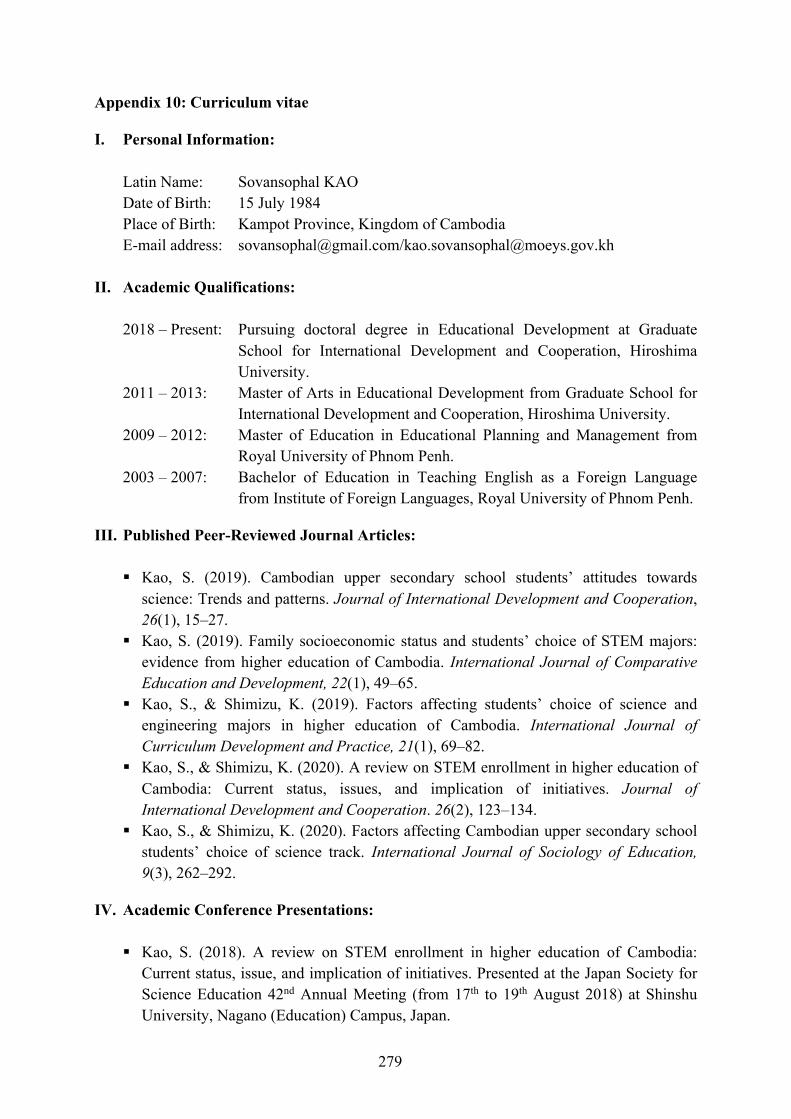
279
Appendix 10: Curriculum vitae
I. Personal Information: Latin Name: Sovansophal KAO Date of Birth: 15 July 1984
Place of Birth: Kampot Province, Kingdom of Cambodia
E-mail address: [email protected]/[email protected]
II. Academic Qualifications: 2018 – Present: Pursuing doctoral degree in Educational Development at Graduate
School for International Development and Cooperation, Hiroshima
University.
2011 – 2013: Master of Arts in Educational Development from Graduate School for
International Development and Cooperation, Hiroshima University.
2009 – 2012: Master of Education in Educational Planning and Management from
Royal University of Phnom Penh.
2003 – 2007: Bachelor of Education in Teaching English as a Foreign Language
from Institute of Foreign Languages, Royal University of Phnom Penh.
III. Published Peer-Reviewed Journal Articles:
§ Kao, S. (2019). Cambodian upper secondary school students’ attitudes towards
science: Trends and patterns. Journal of International Development and Cooperation,
26(1), 15–27.
§ Kao, S. (2019). Family socioeconomic status and students’ choice of STEM majors:
evidence from higher education of Cambodia. International Journal of Comparative Education and Development, 22(1), 49–65.
§ Kao, S., & Shimizu, K. (2019). Factors affecting students’ choice of science and
engineering majors in higher education of Cambodia. International Journal of Curriculum Development and Practice, 21(1), 69–82.
§ Kao, S., & Shimizu, K. (2020). A review on STEM enrollment in higher education of
Cambodia: Current status, issues, and implication of initiatives. Journal of International Development and Cooperation. 26(2), 123–134.
§ Kao, S., & Shimizu, K. (2020). Factors affecting Cambodian upper secondary school
students’ choice of science track. International Journal of Sociology of Education, 9(3), 262–292.
IV. Academic Conference Presentations:
§ Kao, S. (2018). A review on STEM enrollment in higher education of Cambodia:
Current status, issue, and implication of initiatives. Presented at the Japan Society for
Science Education 42nd Annual Meeting (from 17th to 19th August 2018) at Shinshu
University, Nagano (Education) Campus, Japan.
280
§ Kao, S. (2018). Factors affecting students’ choice of science and engineering majors in
higher education of Cambodia. Presented at the 44th National congress of the Japanese
Society of Teacher Education (from 8th to 9th September 2018) at Nippon Sport
Science University (Setagaya Campus), Japan.
§ Kao, S. (2018). Individual characteristics and choice of science and engineering
majors in higher education of Cambodia. Presented at the 19th International
Conference of Educational Research (from 17th to 19th October 2018) at Seoul
National University (Hoam Faculty House), South Korea.
§ Kao, S. (2019). Cambodian upper secondary school students’ attitudes towards
sciences: Trends and patterns. Presented at the Japan Society for Science Education
43rd Annual Meeting (from 23rd to 25th August 2019) at Utsunomiya University, Japan.
§ Kao, S. (2019). Factors affecting Cambodian upper secondary school students’ choice
of science track. Presented at the 6th JASID Western Japan Research Meeting (on 27th
August 2019) at Kyushu University, Japan.
§ Kao, S. (2019). Factors affecting Cambodian upper secondary school students’ choice
of science track. Presented at the 45th National congress of the Japanese Society of
Teacher Education (from 13th to 14th October 2019) at Aichi University of Education,
Japan.
§ Kao, S. (2020). STEM education and longitudinal methods in education research.
Presented at the Environmental and Science Education Webinar Series (ESEWS) #1
(conducted online on May 29th, 2020), Universitas Negeri Semarang, Indonesia.
§ Kao, S. (2020). Effects of tracking and other variables on Cambodian upper secondary
school students’ aspirations of STEM majors: Multilevel analysis. Presented at the 7th
JASID Western Japan Research Meeting (conducted online on 21st August 2020),
Hiroshima University, Japan.
V. Academic Award:
December 18, 2019: Hiroshima University Excellent Student Award