Embed Size (px)
Citation preview

Doctoral Dissertation
Climate Change Resilience and Vulnerability of Farmers in Nepal
SHRESTHA SUMAN LAL
Graduate School for International Development and Cooperation
Hiroshima University
September 2014

Climate Change Resilience and Vulnerability of Farmers in Nepal
D112194
SHRESTHA SUMAN LAL
A Dissertation Submitted to
the Graduate School for International Development and Cooperation
of Hiroshima University in Partial Fulfillment
of the Requirement for the Degree of
Doctor of Philosophy in International Cooperation Studies
September 2014

i
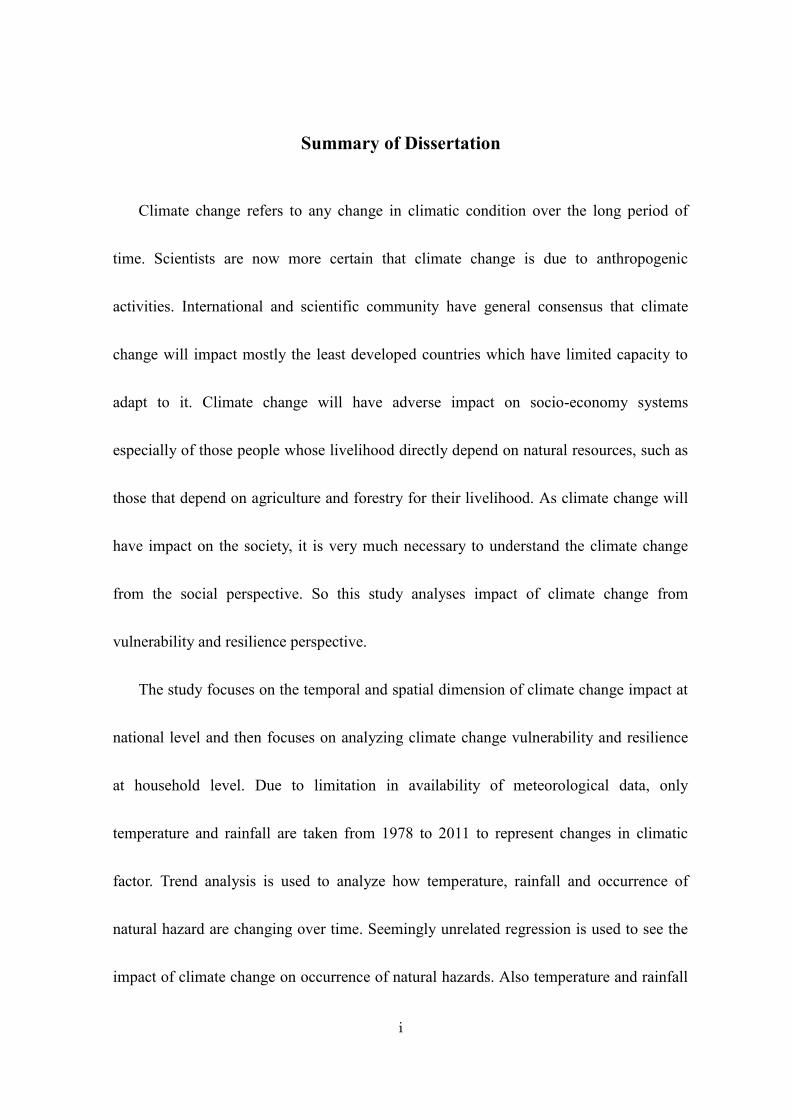
Summary of Dissertation
Climate change refers to any change in climatic condition over the long period of
time. Scientists are now more certain that climate change is due to anthropogenic
activities. International and scientific community have general consensus that climate
change will impact mostly the least developed countries which have limited capacity to
adapt to it. Climate change will have adverse impact on socio-economy systems
especially of those people whose livelihood directly depend on natural resources, such as
those that depend on agriculture and forestry for their livelihood. As climate change will
have impact on the society, it is very much necessary to understand the climate change
from the social perspective. So this study analyses impact of climate change from
vulnerability and resilience perspective.
The study focuses on the temporal and spatial dimension of climate change impact at
national level and then focuses on analyzing climate change vulnerability and resilience
at household level. Due to limitation in availability of meteorological data, only
temperature and rainfall are taken from 1978 to 2011 to represent changes in climatic
factor. Trend analysis is used to analyze how temperature, rainfall and occurrence of
natural hazard are changing over time. Seemingly unrelated regression is used to see the
impact of climate change on occurrence of natural hazards. Also temperature and rainfall

ii
data are interpolated using ArcGIS for trend analysis. Further, trend analysis of climate
extremes using daily rainfall data from 202 to 2011 is used to see the variability in the
climate. The result shows that there has been increasing temperature trend while rainfall
is in decreasing trend and erratic in nature. The analysis shows that rainfall is increasing
in the monsoon season especially in August increasing the probability of occurrence of
natural disasters. The change in the climatic pattern has exacerbated the occurrence of
natural hazards in the country which is also increasing rapidly. Also, climate extremes are
in increasing trend over the period of 2002 to 2011 exacerbating occurrence of natural
hazard. Landslide and flooding is found to be two most disastrous natural hazards in
Nepal with flooding being most destructive of all. Hence seemingly unrelated regression
analysis is used to analyse impact of climate change on occurrence of flooding. The result
shows that increasing temperature will significantly increase the occurrence of heatwave.
Similarly any increase in rainfall, especially in the monsoon season will significantly
increase the occurrence of flooding while decrease in rainfall will increase occurrence of
natural hazards like forest fire and drought.
As climate change impact is location specific, analysing impact of climate change
from spatial perspective is important in Nepal where topography plays a major role. So,
the study analyses and produces maps to show district wise climate change vulnerability

iii
in Nepal. The study uses interpolated temperature and rainfall data for mapping district
wise change temperature, rainfall and natural hazard. Vulnerability is measured as
function of exposure, sensitivity and adaptive capacity as stated by Intergovernmental
Panel on Climate Change Fourth Assessment Report. Principal component analysis is
used to give weights to the indicator since using expert judgment and giving equal
weights has limitation of cognitive biases and being too subjective. The result shows that
adaptive capacity plays an important role in determining the overall vulnerability of an
area. The occurrence of natural hazards further exacerbates the exposure and will increase
the vulnerability. The result is found to follow the pattern of district wise vulnerability
according to NAPA by showing western part of the country comparatively more
vulnerable than eastern part. But, the result is also able to show the difference in the
vulnerability of district more properly. For example, Kathmandu district is found to be
least vulnerable as it has high adaptive capacity while the result of NAPA shows it being
most vulnerable.
Climate change is a global phenomenon but its impact will be felt at local level. The
least developed countries can do little about mitigation so have to adapt to the climate
change. Hence the study analyses the households’ adaptation practices and their
perception to climate change. Further, the study also analyses impact of climate change

iv
from vulnerability and resilience perspective at household level. The analysis uses the
Heckman Selection Model for understanding the factors affecting households’ perception
and their adaptation. Also temperature and rainfall of household is analysed using the
interpolated data. Resilience is analysed as the function of ability to absorb shocks and
vulnerability. Further, determinant of resilience is analysed using multiple regression
analysis. The result shows that most of the households does not know the term climate
change but has perceived some changes in climate. Households are more sensitive to
notice changes in the rainfall than change in temperature. They have been adapting to
these changes through reactive adaptation practices that they are practicing traditionally.
Eighteen different adaptation practices are identified in the study area mainly for
conservation of soil and water. It is seen that majority of the farmers adopt practices like
agroforestry, conservation of water by building water tanks and rain water harvesting.
The adaptation practices like prioritizing livestock is least favoured among households as
there has been decrease in the availability of grass in forest. The result of Heckman
Selection Model shows that there is correlation between perception of farmers and their
adoption of adaptation practices. The result shows that information source has positive
influence on households to perceive any changes in the climatic change. Households’
adoption of adaptation practices are significantly influenced by their possession of assets

v
as well as the infrastructure present in the area.
The analysis shows that adaptive capacity and exposure is the major contributor for
determining the households’ vulnerability. Jhyaku has the highest vulnerability compare
to Nalang and Dalchowki which is mainly attributed to lack of adaptive capacity as well
as frequent occurrence of natural disasters. The factors like infrastructure contributed
mainly to vulnerability. However, vulnerable households are also seen to be practicing
more adaptation practices to cope with it. Thus the results points out that the households
are not just mere sufferer but also have capability to overcome the adverse impacts.
Further, the analysis shows that most of households belong to the group of low to
moderate resilience which can be mainly attributed to addition of new challenges from
climate change. Also, the result shows that access to extension service center, possession
of livestock and higher number of crops planted played are significant factors
determining the resilience of the households.
Overall the study indicated temperature is rising and rainfall is erratic in Nepal which
has increased the occurrence of natural hazards. So, mitigation of natural hazards like
landslide and flood should be given prioritization. In addition to flood and landslide, there
is need to give emphasis on the mitigation of the forest fire as it has been increasing
steadily and also damaging the livelihood options in the rural areas. Also, there is need to

vi
improve climatic data management to capture micro-climatic variation of the area. This
could help in reducing the casualties from natural hazards by providing early warning as
well as in adaptation. Infrastructure being a significant factor for determining the
vulnerability, its development should be given more prioritization. Developmental
programs and policies should give more emphasis on the vulnerable area and households
by capturing their capability to adaptation. Further, households should not just be seen as
sufferer but also their capability to cope with changing condition should be understood.
Additionally, climate change has added new challenges to households by reducing their
resilience. So, climate change policy and developmental programs should focus on
improving the households’ resilience and decreasing their vulnerability.
This dissertation is divided into eight chapters. Chapter one, two and three deals with
introduction and conceptualization where as other chapters deal with analytic analysis.
Chapter four analyses the impact of climate change from temporal aspect by analysing
climatic trend and its relationship with natural hazard at national level. Chapter five deals
with spatial impact of climate change by analysing vulnerability at national level. Chapter
six and seven analyses the adaptation practices, vulnerability and resilience at the
household level. Finally the study is concluded in chapter eight with some
recommendation.

vii
Acknowledgements
Contribution and assistance were received from quite a few numbers of individuals
and organizations. With adoration, glory and praises, I would like to extend my sincere
gratitude and thanks to all of those who contributed to this study.
I express my heartiest gratitude and sincerity to my major academic advisor
Professor Keshav Lall Maharjan for his guidance during my study period in many phases
of field research, data analysis and manuscript preparation. His encouragement,
constructive comments, suggestions and guidance have inspired and motivated me to
make this study, grasping the scientific issues and field reality. My sincere thank goes to
my advisors, Professor Akimasa Fujiwara, Professor Shinji Kaneko, Associate Professor
Kensuke Kawamura and Associate Professor Koki Seki for their valuable comments and
suggestions on my study.
I would like to extend my heartfelt gratitude to the Ministry of Education, Culture,
Sports, Science, and Technology (MEXT) of Government of Japan that awarded me
Monbukagakusho scholarship to pursue my study in Japan. I would also like to thank
Global Environment Leader (GEL) and Young Researcher Program for providing
research grant for this study. I also appreciate the staffs of IDEC, Hiroshima University,
who were very helpful and always ready to provide necessary assistance.

viii
My colleagues helped me for whom I have high regards especially to my lab-mates
and seminar colleagues who have given me constructive comments that helped me to
build my research. I especially convey my appreciation to Mr. Zakaria Amidu Issahaku
for his suggestions, support and cooperation.
I wish to thank my friends, enumerators who assisted me during my field survey in
study village development committee. I would also like to extend my thanks to all the
informants who consented to participate in my survey and provided me with the required
information.
Finally, I would like to take this opportunity to express my love to my father
Surya Lal Shrestha, my mother Mrs. Urmila Shrestha, my wife Pragya Shrestha and my
sisters, Ms. Sharmila Shrestha, Ms. Pramila Shrestha Bajracharya, and Ms. Neetu
Shrestha for their encouragement, support and love. Without their support, this work
would not have been accomplished.
I would also like to express my gratitude and acknowledgement to all those who
have contributed to this work and whose names are not listed.
Suman Lal Shrestha
August 1, 2011
ix
Table of Contents Summary of Dissertation ...................................................................................................... i Acknowledgements ........................................................................................................... vii List of Tables ..................................................................................................................... xii List of Figures ................................................................................................................... xiii Abbreviations/Acronym ................................................................................................... xiv Chapter I .............................................................................................................................. 1 1. Introduction .................................................................................................................. 1
1.1 Background ................................................................................................................ 1 1.2 Statement of Problem ................................................................................................. 6 1.3 Rationale .................................................................................................................... 9 1.4 Objective .................................................................................................................. 11 1.5 Limitation of the study ............................................................................................. 11
Chapter II ........................................................................................................................... 14 2. Literature Review ....................................................................................................... 14
2.1 Climate Change and its impact in Nepal .................................................................. 14 2.1.1 Climate Change in Nepal ................................................................................... 14 2.1.2 Impact of climate Change in Nepal ................................................................... 16
2.2 Adaptation to climate change ................................................................................... 20 2.2.1 Importance of Traditional and Local Knowledge in Adaptation ....................... 22 2.2.2 Adaptation practices in Nepal ............................................................................ 24
2.3 Vulnerability and Resilience .................................................................................... 25 2.3.1 Vulnerability ...................................................................................................... 25 2.3.2 Resilience .......................................................................................................... 26
2.4 People’s Perception to Climate Change ................................................................... 27 2.4.1 Importance of perception of climate change ..................................................... 27 2.4.2 Perception towards natural hazard risk .............................................................. 28 2.4.3 Relationship between perception of climate change and socio-economic status .................................................................................................................................... 29
2.4 Climate Change Policy and Programs ..................................................................... 31 2.4.1 Climate Change in International Regime .......................................................... 31 2.4.2 Climate Change Initiative in Nepal ................................................................... 33 2.4.3 National Adaptation Programme of Action ....................................................... 35 2.4.4 Climate Change Policy ...................................................................................... 37 2.4.5 Local Adaptation Plan for Action ...................................................................... 41 2.4.6 Foreign assistance in Nepal ............................................................................... 43

x
Chapter III.......................................................................................................................... 49 3. Research Design and Study Area ............................................................................... 49
3.1 Introduction .............................................................................................................. 49 3.2 Conceptual Framework ............................................................................................ 49 3.3 Components of Framework and relationship between them .................................... 51 3.4 Study Area ................................................................................................................ 53
Chapter IV ......................................................................................................................... 59 4. Climate Change and Natural Hazards ........................................................................ 59
4.1 Introduction .............................................................................................................. 59 4.2 Methodology ............................................................................................................ 65 4.3 Result and Discussion .............................................................................................. 68
4.3.1 Trend analysis of temperature and rainfall ........................................................ 68 4.3.2 Occurrence of climatic extremes ....................................................................... 72 4.3.3 Occurrence of Natural Hazards ......................................................................... 76 4.3.4 Casualties due to natural hazards....................................................................... 79 4.3.5 Effect of climatic variable on natural hazards ................................................... 81
4.4 Conclusion ............................................................................................................... 84 Chapter V ........................................................................................................................... 86 5. Climate Change Vulnerability in Nepal ...................................................................... 86
5.1 Introduction .............................................................................................................. 86 5.2 Methodology ............................................................................................................ 92 5.3 Result and Discussion ............................................................................................ 101
5.3.1 Results of Climate Variables Interpolation and occurrence of natural disaster .................................................................................................................................. 101 5.3.2 Vulnerability to Climate Change in Nepal ...................................................... 103
5.4 Conclusion ............................................................................................................. 110 Chapter VI ....................................................................................................................... 112 6. Adaptation to Climate Change ................................................................................. 112
6.1 Introduction ............................................................................................................ 112 6.2 Methodology .......................................................................................................... 115
6.2.1Empirical model and model variables .............................................................. 116 6.3 Study Area and household characteristics .............................................................. 120 6.4 Result and discussion ............................................................................................. 125
6.4.1 Climatic trend of study households ................................................................. 125 6.4.2 Perception of Climate Change ......................................................................... 128 6.4.3 Adaptation practices in the Study Area............................................................ 132

xi
6.4.4 Socio-economic Factors Affecting Adaptation to Climate Change ................. 133 6.4 Conclusion ............................................................................................................. 137
Chapter VII ...................................................................................................................... 139 7. Climate Change Vulnerability and Resilience of Farmers ....................................... 139
7.1 Introduction ............................................................................................................ 139 7.1.1 Relation between Resilience and Vulnerability ............................................... 140 7.1.2 Importance of assessing vulnerability and resilience at local level ................. 143 7.1.3 Vulnerability to climate change in Nepal ........................................................ 145
7.2 Methodology .......................................................................................................... 147 7.3 Result and Discussion ............................................................................................ 151
7.3.1 Vulnerability and Resilience of Farmers ......................................................... 151 7.3.2 Determinants of Resilience .............................................................................. 157
7.4 Conclusion ............................................................................................................. 159 Chapter VIII ..................................................................................................................... 161 8. Conclusion and Recommendation ............................................................................ 161 References ....................................................................................................................... 169 Annex I ............................................................................................................................ 183 Annex II ........................................................................................................................... 185 Annex III ......................................................................................................................... 187 Annex IV ......................................................................................................................... 189 Annex V ........................................................................................................................... 191 Annex VI ......................................................................................................................... 192 Annex VII ........................................................................................................................ 194 Annex VIII ....................................................................................................................... 196 Annex IX ......................................................................................................................... 199

xii
List of Tables Table 2.1 Climate Change in Nepal ............................................................................ 16
Table 2.2 Climate change impact and adaptation practices ........................................ 24
Table 2.3 UNFCCC Conference of Parties events ..................................................... 31
Table 2.4 Current climate change projects in Nepal ................................................... 44
Table 3.1 Vulnerability level of the study districts ..................................................... 54
Table 4.1 Rainfall Indices ........................................................................................... 66
Table 4.2 Temperature and rainfall coefficient for each month .................................. 72
Table 4.3 Occurence of natural hazard according to season ....................................... 78
Table 4.4 Natural hazards and casualties/damages caused by it from 1978 to 2011 .. 81
Table 4.5 Result of SUR between climate variables and natural hazards .................. 81
Table 4.6 Result of SUR between occurrence of flood and seasonal climatic variables ............................................................................................................................ 83
Table 5.1 Indicators of Vulnerability .......................................................................... 99
Table 5.2 Weight of variables from PCA .................................................................. 104
Table 5.3 Categorizing different districts according to exposure ............................. 105
Table 5.4 Categorizing different districts according to Sensitivity .......................... 107
Table 5.5 Categorizing different districts according to Adaptive Capacity .............. 108
Table 5.6 Categorizing different districts according to Vulnerability ...................... 109
Table 6.1 Variables selected for models ................................................................... 120
Table 6.2 Socio-economic characteristics of the households ................................... 123
Table 6.3 Household perception of Climate Change Impacts .................................. 131
Table 6.4 Result of Heckman Selection model ......................................................... 135
Table 7.1 Indicators for Vulnerability ....................................................................... 148
Table 7.2 PCA score of indicators for vulnerability ................................................. 152
Table 7.3 Determinants of Resilience ....................................................................... 158
xiii
List of Figures Figure 3.1 Conceptual frame work of study ............................................................... 52
Figure 3.2 Map of Nepal showing study districts ....................................................... 57
Figure 3.3 Map of Dolakha (a), Dhading (b) and Lalitpur (c) district with VDC (highlited) ........................................................................................................... 58
Figure 4.1 Temperature and rainfall trend of Nepal from 1978-2011 ........................ 69
Figure 4.2 Seasonal temperature trend of Nepal from 1978-2011 ............................. 69
Figure 4.3 Rainfall trend of Nepal from 1978-2011 ................................................... 70
Figure 4.4 Seasonal rainfall trend of Nepal from 1978-2011 ..................................... 71
Figure 4.5 Trend analysis of dry days (a) and wet days (b) from 2002 to 2011 ......... 74
Figure 4.6 Trend analysis of average rainfall and extreme rainfall days for pre-monsoon (a), monsoon (b), post-monsoon (c) and winter (d) ...................... 75
Figure 4.7 Trend of natural hazard occurrence from 1978 to 2011 ............................ 76
Figure 4.8 Different types of natural hazard trend ..................................................... 77
Figure 4.9 Occurrence of natural hazards (a) and casualties (b,c and d) of Nepal from 1978-2011 ........................................................................................................... 80
Figure 5.1 Map of Nepal showing temperature trend ............................................... 102
Figure 5.2 Map of Nepal showing rainfall trend ...................................................... 102
Figure 5.3 Map of Nepal showing natural hazard trend ........................................... 102
Figure 5.4 Principal component having Eigenvalue more than 1............................. 104
Figure 6.1 Temperature and rainfall trend of Jhyaku (a), Nalang (b) and Dalchowki (c) .......................................................................................................................... 126
Figure 6.2 Rainfall trend of Jhyaku (a), Nalang (b) and Dalchowki (c) from 2001-2011 .......................................................................................................................... 127
Figure 6.3 Perception of people to temperature (a) and rainfall (b) in study area .... 130
Figure 6.4 Adaptation practices adopted by households .......................................... 133
Figure 7.1 Principal component having Eigenvalue more than 1............................. 151
Figure 7.2 Vulnerability of households according to different categorizes .............. 153
Figure 7.3 Percentage of Households in different category of vulnerability ............ 154
Figure 7.4 Adaptive capacity, exposure, sensitivity and Vulnerability of households according to study VDC ................................................................................... 154
Figure 7.5 Category wise household vulnerability of Jhyaku (a), Nalang (b), Dalchowki (c) ................................................................................................... 156
Figure 7.7.6 Adaptation index according to vulnerable groups ................................ 156
Figure 7.7 Households according to resilience category .......................................... 157

xiv
Abbreviations/Acronym
˚C degree centigrade
BAP Bali Action Plan
BAPA Buenos Aires Plan of Action
CDM Clean Development Mechanism
COP Conference of Parties
GCM General Circulation Model
GDP Gross Domestic Product
GEF Global Environment Fund
GIS Geographic Information System
GLOF Glacial Lake Outburst Flood
HDI Human Development Index
HHH Household Head
H.R High Resilience
H.V High Vulnerable
ICCA Initiative for Climate Change Adaptation
IPCC Intergovernmental Panel on Climate Change
km kilometre
LAPA Local Adaptation Plan for Action
LDC Least Developed Countries
LDCF Least Developed Countries Fund
LULUCF Land Use, Land Use Change and Forestry
L.R Low Resilience
LSU Livestock Unit

xv
L.V Low Vulnerable
m meter
masl: mean above sea level
mm millimeter
MCCICC Multistakeholder Climate Change Initiative Coordination Committee
M.R Moderate Resilience
M.V Moderate Vulnerable
NAPA National Adaptation Program of Action
NCCC National Climate Change Committee
NCCKMC Nepal Climate Change Knowledge Management Centre
NCSA National Capacity Self-Assessment
NGO Non-Governmental Organization
NMS Nepal Meteorological Service
NRs. Nepalese Rupees
NSTs National Study Teams
PC1 First Principal Component
PCA Principal Component Analysis
RCM Regional Circulation Model
REDD Reducing emission from forest deforestation and forest degradation
SAR Second Assessment Report
SCCF Special Climate Change Fund
SNC Second National Communication
SUR Seemingly Unrelated Regression
TWGs Thematic working groups

xvi
UN United Nation
UNDP United Nation Development Programme
VDC Village Developmental Committee
WMO World Meteorological Organization
UNFCCC United Nations Framework Convention on Climate Change
V.H.R. Very High Resilience
V.H.V Very High Vulnerable
V.L.R Very Low Resilience
V.L.V Very High Resilience

1
Chapter I
1. Introduction
1.1 Background
People face potential disasters from number of sources which are natural as well as
man-made. People have continued to live through these disasters by adapting to changes
and building resilience. It has been established that climate change is one of the major
environmental challenges that people are facing. Climate change has been defined
differently by different institutions and scholars. The Intergovernmental Panel on Climate
Change (IPCC) defines the climate change as
“Climate change refers to a statistically significant variation in either the mean state
of the climate or in its variability, persisting for an extended period (typically decades or
longer). Climate change may be due to natural internal processes or external forcings, or
to persistent anthropogenic changes in the composition of the atmosphere or in land use”
(IPCC, 2001).
According to United Nations Framework Convention on Climate Change (UNFCCC)
article 1.2. climate change is defined as “change of climate which is attributed directly or
indirectly to human activity that alters the composition of the global atmosphere and
which is in addition to natural climate variability observed over comparable time periods”

2
(UN, 1992).
Climate change will effect positively as well as adversely, The article 1.1 of
UNFCCC states that
“Adverse effect of climate change” means changes in the physical environment or
biota resulting from climate change which have significant deleterious effects on the
composition, resilience or productivity of natural and managed ecosystems or on the
operation of socio-economic systems or on human health and welfare” (UN, 1992).
Climate change will have adverse impact on socio-economy systems especially of
those people whose livelihood directly depend on natural resources, such as those that
depend on agriculture and forestry for their livelihood. Socio-economic effects of climate
change arise from interactions between climate and society and how these in turn affect
both natural and managed environments. As climate change will have impact on the
society and the social well-being of the humans it is very much necessary to understand
the climate change from the social perspective. Further, climate change occurs globally
but its impact will differ according to the region and sector. The direct impact of the
climate change is usually context specific to a local scale (Kassam, Baumflek, Ruelle, &
Wilson, 2011). So understanding impact of climate change especially at local context,
analysis of vulnerability and resilience are very important (Kassam, Baumflek, Ruelle, &

3
Wilson, 2011).
According to the Fourth Assessment Report, the IPCC defines the vulnerability as
“degree to which a system is susceptible to, or unable to cope with, adverse effects of
climate change, including climate variability and extremes. Vulnerability is a function of
the character, magnitude, and rate of climate variation to which a system is exposed, its
sensitivity, and its adaptive capacity" (Barker, et al., 2007).
The analysis of impact of climate change only from the perspective of vulnerability
may only represent humans as passive victims of climate change only and will not
incorporate their innovativeness and their resilience towards climate change (Kassam,
Baumflek, Ruelle, & Wilson, 2011). So it becomes very necessary to look at the impact
of climate change from the perspective of resilience also.
Resilience is defined as “ability of a social or ecological system to absorb
disturbances while retaining the same basic structure and ways of functioning, the
capacity for selforganisation, and the capacity to adapt to stress and change” in The
Fourth Assessment Report of IPCC (Baede, Linden, & Verbruggen, 2007).
Vulnerability and resilience is interlinked and cannot be viewed differently. The
human knowledge and their practices within their communities can reduce their
vulnerabilities to adverse impact of climate change which are their resilient qualities

4
(Kassam, Baumflek, Ruelle, & Wilson, 2011). For example community that knows to
build homes that can withstand rare flood events, for instance, is less vulnerable to
increases in the frequency and intensity of flooding resulting from climate change
(Kassam, Baumflek, Ruelle, & Wilson, 2011).
Adaptation to the climate change has been focused by many scholars since 1990s
(IHDP, 2009). The strategy in climate change normally focuses on the mitigation and
adaptation. The IPCC defines mitigation as
"Technological change and substitution that reduce resource inputs and emissions
per unit of output. Although several social, economic and technological policies would
produce an emission reduction, with respect to Climate Change, mitigation means
implementing policies to reduce greenhouse gas emissions and enhance sinks.” Whereas
adaptation is defined as "Initiatives and measures to reduce the vulnerability of natural
and human systems against actual or expected climate change effects" (Baede, Linden, &
Verbruggen, 2007).
This shows that mitigation generally addresses the cause of climate change whereas
adaptation deals with the effect.
According to the Resilience Alliance (2002) resilience has three distinct
characteristics, i.e., system capacity to undergo change and still be in the same state, have

5
capability of self-organization and have ability to build and increase capacity of learning
and adaptation. Further, resilience can be viewed as layered concept which ranges from
individual to household, community, ethnic group and global level (Jordan, 2009).
Further, resilience is recognized as complex, context specific, and highly dynamic in
nature (Schwarz, et al., 2011). The resilience of the community or household will increase
its adaptation potential and will help to lessen the impact from climate change. Also, the
resilient community or household that are resilient are less vulnerable to the climate
change, i.e., they are less prone to suffer the same magnitude as the non-resilient group
from the climate change (Speranza, 2010).
In addition to this, effects of climate change will vary according to region and is very
hard job to predict it, but the societies that are already suffering severe development stress
will be the most heavily effected and in particular, the most vulnerable sections of those
societies (Jordan, 2009). So, climate change will have negative impact on the people
living in the least developed countries that have little resources. Further, many of the
communities in these countries can do little about the mitigation and must adapt to the
local impact of climate change (Kassam, Baumflek, Ruelle, & Wilson, 2011).
Nepal is a one of the least developed countries with annual GDP per capita of NRs.
57,726 (US$1 = NRs. 82) as of April 2012 (CBS, 2012). It has population of 26,494,504

6
having growth rate of 1.35% since 2001 with majority of people living in rural areas
(CBS, 2012). According to national census of 2011 only 17% of people live in urban area,
that is, 58 municipalities (CBS, 2012). Agriculture is the main livelihood option in rural
area that contributes 31.75% in 2011 of the country’s gross domestic product GDP (WB,
2013). Further, agriculture is mainly subsistence in nature and farmers mainly rely on
rain-fed agricultural system with irrigation covering only 27.42% of the total agricultural
land in Nepal as of 2008 (WB, 2013). In addition to this, irrigation is mainly the small
type managed by farmers’ community itself (Bhandari & Pokharel, 1999). Agriculture
provides employment opportunities to 66% of population (DoA, 2014) indicating that
majority of people are dependent on agriculture which is mainly rain-fed in nature and
thus climate change will have more effects on them. As Nepal lack economic resources to
deal with climate change, it is very essential to understand the farmers’ resilience and
vulnerability. Thus, this study deals with farmers’ resilience and vulnerability to the
climate change in Nepal.
1.2 Statement of Problem
Climate change will have an effect on all sectors like water, agriculture, energy and
so on. The impact of climate change differs according to sectors and will be felt at local
level. Climate change will put more stress on sectors like agriculture and forestry which
7
are more dependent on the natural resources and climatic factors. The impact of climate
change does not depend on the biophysical characteristics only but also depends on the
society and how they interact with the climate. As agriculture is one of the sectors that
will be impacted adversely more, farmers with limited financial resources and farming
systems with few adaptive technological opportunities available to limit or reverse
adverse climate change are more vulnerable towards it (IPCC, 2007). The IPCC Second
Assessment Report states that socio-economic systems “typically are more vulnerable in
developing countries where economic and institutional circumstances are less favourable”
(IPCC, 1996) and also continues that vulnerability is highest where there is “the greatest
sensitivity to climate change and the least adaptability.” IPCC (2007) states that climate
change is directly affecting the livelihood of the people especially in the developing
countries more so in least developed countries through increasing variability and
uncertainty of the condition. Also with climate change the climate related hazards are
becoming more frequent and intense which increases the tragedies due to death, injuries
and disease that ultimately affect the livelihood of the people (Cannon & Muller-Mahn,
2010). These raises the question of how people can be more resilient to the climate
change so that they become less vulnerable to the natural hazards with increase in their
adaptive capacity as well as focusing on the mitigation options for climate change.

8
Nepal though being rich in biodiversity, is one of the poorest countries in the world
with the majority of the people dependent on agriculture and mostly living in the rural
areas. As agriculture is one of the sectors that are more dependent on climatic factor,
people in the rural settings are more prone to impact from any changes in the climate. The
change in agricultural production due to climate change will have an effect on rural
communities both economically as well as socially, especially to those who have little
adaptive capabilities. In addition to this, Nepal being mountainous country is prone to
natural hazards like landslides and flood, and climate change will further exacerbate the
frequency and intensity of these natural hazards. So, climate change will further add to
the vulnerability of farmers especially in the countries like Nepal where people have less
economical capabilities to deal with it.
Climate change will further impact different localities differently especially in Nepal,
where there are many small pockets of areas that shows different climatic trend (Practical
Action, 2009). In Nepal as different localities have different climatic trend, the adaptation
practices, vulnerabilities and resilience of the people in these localities also differs.
Further within the community, people that have less capability for adapting to climate
change will be more vulnerable and hardest hit by its impact. Also, for any intervention in
the local area it is important to have knowledge regarding how the communities react to

9
changing environmental condition and how resilient they are. But, there are limited
studies on climate change impact on local regions in Nepal.
1.3 Rationale
Nepal being least developed country has to adapt to climate change and also has to
pursue its development needs. It is important to understand the impact of climate change
according to sector and region and also how these sectors and regions react with such
changes. Further, vulnerability, resilience and adaptation strategy of different people
differs according to the region and their socio-economic condition. So, there is need of
studying the needs, impact, vulnerabilities, and resilience at the local level that will help
for any policy implementation as stressed by different researches.
After the Fourth Assessment Report of IPCC, the focus of the researches has been
shifted to climate change mitigation and adaptation which brings in researches on
vulnerabilities of the specific places that have centered on analysis of human welfare
(Ibarraran, Malone, & Brenkert, 2008). Focusing only on the vulnerability can give
wrong impression that communities are only mere victims of climate change but may not
account communities capacity to be resilient to these changes (Kassam, Baumflek, Ruelle,
& Wilson, 2011). There are semantic differences between resilience and vulnerability

10
(Cutter, et al., 2008) where vulnerability is the function of exposure, sensitivity and their
coping capacity. Whereas in case of resilience it is the ability of the system to respond
and cope with the disaster, events and also the adative measure after the post event and
how they in turn can reorganize, turn and learn fom the disaster itself (Cutter, et al., 2008).
In addition to this adaptive capacity is ability of system to change, lessen the effect and
cope with disturbances (Brooks, Adger, & Kelly, 2005) while mitigation is any action
taken to avoid the risk of damage (Godschalk, 2003). Therefore, the identification and
characterization of impact of climate change from the perspective of vulnerability and
resilience of different regions, sectors, and communities is a concern for addressing
climate change. Without taking into all these into consideration the local issues and their
reaction to climate change impact will not be properly addressed. But these types of
researches are lacking focusing on local areas especially in the least developed countries.
Also, IPCC has stressed that the priorities should be given for advancing understanding of
potential consequences of climate change for human society and the natural world, as
well as to support analyses of possible responses (IPCC, 2001). This emphasizes need for
research from perspective of vulnerability and resilience in Nepal since it is more
vulnerable to climate change. The research should also focus on climate change impact in
relation to natural hazards and how local communities interact with it. Thus this research

11
will tries to study the resilience and vulnerability to climate change and their relationship
to climate change in Nepal.
1.4 Objective
General objective:
Analyze the resilience and vulnerability of households to climate change of Nepal.
Specific Objective
Analyse relationship between climatic variables and natural hazards
Map district wise vulnerability of Nepal
Analyze factors affecting households perception of and adaptation to climate change
Determine the households vulnerability and resilience to climate change
Study the determinants of resilience to climate change
1.5 Limitation of the study
The study limitations have been grouped in the three major categories as follows:
1. Lack of data: Nepal is mountainous country, and its climatic condition is largely
affected by its topography. Therefore, it is necessary to establish more number of

12
metrological stations to capture data to reflect variations according to the topography
of the country. Unfortunately, Nepal has not yet been able to establish required
number of metrological stations to capture the climatic data representing its
topography. It has limited technical and financial resources to establish necessary
infrastructure and facilities to collect numerical data and conduct researches and
modeling related to climatic change. Given the country's available infrastructure and
facilities, collecting metrological data, the study is able to use the data collected over
34-year period from the stations established at limited and scattered areas, which do
not capture the micro-climatic variations appropriately.
2. Data reporting: In Nepal, proper collection and management of natural hazards data
started only from 1990s onwards. The remoteness of the areas and poor information
& communication systems in the past limited the data availability and in some cases
did not receive exact information about natural hazards. The data were often distorted
and there were no proper means to verify those reports. In general, the reports about
natural hazards are different in the recent years compared to the past due to the
development of information and communication systems. In the recent years,
information about natural hazards is accurate, and easy to verify. In absence of proper
information and communication system in the past, the study used natural hazards
13
data that are reported in the national daily, local newspapers and other various reports.
Further, natural hazards reported by the households may not actually represent
occurrence of all natural hazard, as information is basically collected form selected
memories, which could have been biased. There is a high possibility that some of the
cases, which are reported by the households, might have selective memory biases
(remembering or not remembering events that occurred in some point in time).
3. Use of cases study: Only one VDCs from each districts are chosen as the case study
due to limitation of time and resources..

14
Chapter II
2. Literature Review
2.1 Climate Change and its impact in Nepal
2.1.1 Climate Change in Nepal
Climate change is a serious global issue which demands prompt response as shown
by numerous scientific evidences (Stern, 2006). Climate change has both beneficial as
well as detrimental effect, but mostly negative, as shown by many research findings.
Climate change will exacerbate the problems of natural hazards like drought, flood,
tornadoes etc. The degree of impact of these hazards varies according to its geography,
environment and its capacity to cope with these hazards. The intensity of impact will be
higher for Nepal as it has little capacity to cope with it and thus will be more vulnerable
to climate change.
In Nepal the first systematic and regular monitoring system was established in 1965
in the name of Nepal Meteorological Service (NMS) with the help of United Nation
Development Programme (UNDP) and World Meteorological Organization (WMO)
(Mool, Bajracharya, & Joshi, 2001). According to the analysis of temperature trend done
by Shrestha et al. (1999) for 1971-1994, temperature trend was different according to the
geographical area and seasons in Nepal. The warming was slow in the low-elevation Tarai

15
with annual average of 0.04 ºC/yr than in north high mountains with annual average of
0.08 ºC/yr (Shrestha et al. 1999). In case of seasonal difference the highest one was in
post-monsoon season (October-November) at 0.08ºC/yr while lowest warming rate was
for pre-monsoon season (March-May) at 0.03ºC/yr (Shrestha et al., 1999). Similarly, the
trend analysis done by the Practical Action found that for the period of 1976-2005 the
maximum temperature was increasing at 0.05 ºC/yr while minimum temperature was
increasing at 0.03 ºC/yr (Practical Action, 2009). Also the maximum temperature was
found to be in decreasing trend in Tarai region during winter season which was mainly
due to cold waves resulting foggy conditions (Practical Action, 2009). According to
Practical Action (2009) in Nepal due to high inter annual variation in rainfall there was no
significant trend observed over the years. However, the rainfall trend was increasing at
average annual rainfall of 4 mm/year over the period of 1976-2005 (Practical Action,
2009). Also there were some small pockets of area that has decreasing rainfall trend over
the period of 1976-2005 (Practical Action, 2009). Similarly, the pre-monsoon, monsoon,
post monsoon and winter seasons average rainfall was increasing at 9mm/year, 30
mm/year, 7 mm/year and 2.8 mm/year respectively except few pockets area where it was
in decreasing trend (Practical Action, 2009).
There are limited number of studies that have projected temperature and precipitation

16
by General Circulation Model (GCM) / Regional Circulation Model (RCM) in Nepal but
confidence in projection is low as they are biased (NCVST, 2009). The study done by
Agrawala et al. (2003) using GCM estimates that by 2100 both temperature and
precipitation will increase as shown in Table 2.1.
Table 2.1 Climate Change in Nepal Year Mean temperature increase (ºC) Mean precipitation increase (mm) Annual Winter Summer Annual Winter Summer Baseline average
1433 73 894
2030 1.2 (0.27) 1.3 (0.4) 1.1 (0.2) 71.6 (3.8) 0.6 (9.9) 81.4 (7.1) 2050 1.7 (0.39) 1.8 (0.58) 1.6 (0.29) 104.6 (5.6) 0.9 (14.4) 117.1 (10.3) 2100 3.0 (0.67) 3.2 (1.00) 2.9 (0.51) 180.6 (9.7) 1.5 (25.0) 204.7(17.9) Source: Agrawala, et al., 2003
Note: Figures in parenthesis indicate standard deviation.
2.1.2 Impact of climate Change in Nepal
As Nepal is covered mostly by fragile mountains, climate change will further
exacerbate the occurrence of natural hazards like floods and landslides and will affect the
various sectors. According to the National Adaptation Programme of Action, climate
change will impact mainly the agriculture, water resources, climate-induced disasters,
forests and biodiversity, health, and urban settlement and infrastructure in Nepal (MoE,
2010).
17
According to the Maharjan, Joshi and Piya (2011) effect of climate change in
agriculture will mostly be adverse as it is highly dependent on weather condition due to
extreme rainfall. The variability in rainfall will have severe negative impact in agriculture
especially in least developed countries like Nepal where agriculture is primarily rain-fed
and farmers are mainly subsistence in nature. According to Regmi (2007), in 2005, there
was 2% and 3.3% decrease paddy and wheat production as country experienced drought.
Also, paddy decreased by 27-39% in Eastern Tarai in 2006 due to drought (Regmi, 2007).
There was significant reduction in the yield of winter crops due to severe sky overcast
condition in particularly Nepal and the Indo-Gangetic plains of India that lies south of
mountain region between 1990 to 2000 (Shrestha, 2007). According to MoPE (2004),
there was Yield reduction in 1997/98 ranged from 11% to 38% compared to the average
of the preceding 10 years (MoPE, 2004). Sharma and Shakya (2006) state that changes in
water availability in the monsoon, pre-monsoon and the post-monsoon season and
shifting of the hydrograph have a direct impact on Nepalese agriculture. According to
Maharjan, Joshi and Piya (2011) the rise in temperature will impact agriculture as there
will be increase in incidence of pests and diseases and decreasing physiological
performance. The study done by Joshi, Maharjan and Piya (2011) to see effect of climatic
variables on the yield of the major food crops of Nepal using the multivariate regression

18
model showed that the increase in wheat and barley yield is contributed by the current
climatic trends whereas increased summer rainfall and temperature suppressed the growth
of yield of maize and millet. Also, in the case of change in yield of potato the positive
impact of increased summer rainfall and increased minimum temperature is surpassed by
negative impact of increased maximum temperature (Joshi, Maharjan, & Piya, 2011). In
the study done by Malla (2008) on climate change and its impact on Nepalese agriculture
taking into account only the biological factors it was found that enriched CO2 has shown
positive impact on yield of major crops in all geographical zones. Malla (2008) also
emphasized that increase in temperature and CO2 levels also may have hidden-hunger
problem in human by lowering essential nutrients contents in food crops. According to
Alam and Regmi (2004), due to rising temperature in Nepal there could be longer drier
phases during dry season and higher chances of flooding and landslides during rainy
seasons that will subsequently impacts agriculture and livelihoods. The food production
in Nepal from 2006-2009 has been significantly affected by extreme events that include
droughts and floods (Hobbs, 2009).
The study by Shrestha, Maharjan and Joshi (2012) analyses the relationship of
climate variable and yield of food crops in Makwanpur and Ilam district of Nepal. It
analyses the trend of climatic variables and yield of major food crops of Nepal from 1978

19
to 2008 and analyses how climatic variables are affecting yield of major food crops using
regression analysis. The study shows that in both the districts, the maximum temperature
trend is increasing for summer and winter seasons while minimum temperature was found
to be increasing in Makwanpur district but decreasing in Ilam district. Similar trends were
found in the case of rainfall in both districts where it was found to be increasing in
summer and decreasing in winter seasons. The trend analysis for yield of major crops
showed that in Makwanpur district, the yield of paddy and maize was decreasing while
other crops like millet, potato, wheat and barley was increasing. Similarly in the case of
Ilam district, except yield of maize and millet, yield of other food crops was found to be
in increasing trend. The potato was found to be rapidly increasing in both districts, which
is mainly due to management practices such as use of improved seeds and fertilizers. The
study showed the effect of climate change on yield of major food crops except paddy in
Makwanpur district had adverse impact. In case of Ilam, except maize and potato, climate
change had negative impact on all the food crops.
According to LFP (2009) Nepal forestry ecosystem distribution will shift due to the
climate change and Himalayan forest are expected to be most vulnerable as increased
temperature will cause decreased soil moisture causing drought resistant trees or
grassland replacing current forest. Also the recent forest fire in Nepal which was

20
unusually for the long time raised the issue of climate change impact on the forest of
Nepal. Further according to the MoPE (2004) under doubling of CO2 tropical wet forest
and rain forest will disappear and cool temperate forest will move into warm temperate
forest. According to Thakur (2009) Uttis (Alnus nepalensis) in Ilam district is severely
affected by defoliating insect outbreak (Scarabaeidae coleopteran) which according to
local resident was related mostly to temperature rise and decrease rainfall due to shorter
hibernation period.
2.2 Adaptation to climate change
There are many uncertainties regarding the impact of climate change though there are
studies regarding future change in precipitation and temperature. Changes in rainfall
pattern are likely to lead to severe water shortages and/or flooding. The increase in
temperature and irregularities in the precipitation pattern will have impact on
environment and socio-economic sectors like agriculture, forestry, water resources, health
etc. (UNFCCC, 2007). The impacts of climate change are expected to become more
intense in the near future (Harley, Horrocks, Hodgson, & Minnen, 2008). To cope with
the uncertain future, societies need to cope with the change, which is adaptation
(UNFCCC, 2007). Despite of strict stabilizing greenhouse gas mitigations measures,

21
impacts of climate change are likely to be large for which all countries need to adapt to it
(Harley, Horrocks, Hodgson, & Minnen, 2008). For adapting to climate change,
appropriate measures for lessening its impact should be prioritized mainly by adjusting to
it and making changes that includes the developing technological options, behaviour
changes, better management of natural resources, improved risk management etc.
(UNFCCC, 2007). A major challenge for dealing with climate change is to determine
how, where and in what form the projected impacts will occur which is complicated by a
number of factors such as relationship between changes in climatic variables, impacts and
system response and many others which are not clear (Harley, Horrocks, Hodgson, &
Minnen, 2008). After the publication of IPCC Third Assessment Report in 2001, there
has been substantial work done on the adaptive capacity to climate change. Initially many
of the studies focused on adaptive capacity at national level (Adger & Vincent, 2005;
Adger et al., 2004; Brooks, Adger, & Kelly, 2005) which purpose was to identify the
countries with lowest adaptive capacity. Later on few studies focused on subnational level
(Nelson, et al., 2009; Gbetibouo & Ringler, 2009) which tried to identify the regional
variations within the country.

22
2.2.1 Importance of Traditional and Local Knowledge in Adaptation
Traditional Knowledge
The policy makers, planners and managers rely heavily on the scientific knowledge to
inform decisions as it provides important insights and shapes the world we live in today
(MacKendrick, 2009) and often neglect traditional and local knowledge. Gilligan et al.
(2006) state that though scientific knowledge has numerous benefits it is not free from
flaws and is subject to certain limitations (cited by MacKendrick, 2009). Traditional
ecological and local knowledge gives important insight in understanding environmental
and social change (Riewe and Oakes 2006 cited by MacKendrick, 2009). According to
Berkes, Colding, & Folke (2000) traditional ecological knowledge is “a cumulative body
of knowledge, practice, and belief, evolving by adaptive processes and handed down
through generations by cultural transmission, about the relationship of living beings
(including humans) with one another and with their environment.” Traditional ecological
knowledge emphasizes knowledge accumulated over a long time about an area or species
(Gilchrist, Mallory, & Merkel, 2005). It is based on tradition and passed from generation
to generation (Gilligan et al. 2006 cited by MacKendrick, 2009). So, in responding to the
impacts of climate change already occurring, as well as preparing for and mitigating those
projected for the future, requires integrating different knowledge systems and decision
23
making processes in order to improve understanding of the issue and manage risk
(Gilligan et al. 2006 cited by MacKendrick, 2009). Further, Gilchrist, Mallory & Merkel
(2005) emphasizes that in case of lack of scientific information and data, other knowledge
system provides insight for decision making. Also, traditional knowledge is vital in
providing a human viewpoint about environmental management and change beside
scientific knowledge (Gilligan et al. 2006 cited by MacKendrick, 2009).
Local Knowledge
According to the MacKendrick (2009) local knowledge is different from traditional
ecological knowledge in timescale and it provides important insight to addressing climate
change. Local knowledge is “acquired more recently over the lifetime of individual”
instead of through oral history and offers a mixture of current experience with the land
and traditions passed down through generations (Gilchrist, Mallory, & Merkel, 2005).
Local knowledge adds up to the traditional ecological knowledge due to influencing
factors like technology and other current factors (Mallory et al. 2006 cited by
MacKendrick, 2009). Local knowledge provides information that can be useful in
environmental decision making, as a compliment to scientific knowledge, particularly in
areas where extensive scientific knowledge may not exist (Gilchrist, Mallory, & Merkel,

24
2005). Integrating local knowledge into scientific research offers opportunity to benefit
the groups of people who hold it by engaging them in projects and assisting them in
developing the end-products (Riewe and Oakes 2006 cited by MacKendrick, 2009).
2.2.2 Adaptation practices in Nepal
Agriculture is the main source of livelihood in Nepal. The major threats by climate
change in Nepal seems to be disturbance of livelihood which is mainly by natural
disasters like flood and landslide, decrease in water sources, long drought period, increase
in plant diseases and decrease in productivity.
Table 2.2 Climate change impact and adaptation practices Impact Local Adaptation measures Landslides Stonewalls
Afforestation Food security Skill development for alternative income activities
Market facility Drought Local irrigation canal (Kulo)
Adoption of drought resistant cultivars Appearance of mosquitoes and other harmful insects and related disease
Mosquito nets
Decrease in agriculture production Adoption of high yielding varieties Develop skill for alternative livelihood Cultivation of cash crops (Cardimom)
Incidence of plant diseases Local pesticides Synthetic pesticides Disease resistant varieties
Incidence of animal disease Veterinary facility

25
The changes in different sector due to climate change has forced people to find
measures in securing their livelihoods by adapting knowingly and unknowingly to these
changes (Sharma & Dahal, 2011). According to Sharma and Dahal (2011), few of the
adaptation practices adapted by the people in Shankhuwasabha district to the impact of
climate change are shown in Table 2.2. The adaptation practices mention in Table 2.2
adopted by the people of Sankhuwasabha may not all be the response of the climate
change but may be response to both climate change as well as to the development factor
occurring in the area.
2.3 Vulnerability and Resilience
2.3.1 Vulnerability
Many definition of vulnerability is found in the literatures. Kelly and Adger (2000)
defines the vulnerability as “ability or inability of individuals or social groupings to
respond to, in the sense of cope with, recover from, or adapt to, any external stress placed
on their livelihoods and well-being”. According to the Fourth Assessment Report, the
IPCC defines the vulnerability as “degree to which a system is susceptible to, or unable to
cope with, adverse effects of climate change, including climate variability and extremes.
Vulnerability is a function of the character, magnitude, and rate of climate variation to

26
which a system is exposed, its sensitivity, and its adaptive capacity” (Barker, et al., 2007).
In this context the vulnerability is taken as described by the IPCC. Further, vulnerability
concept is a powerful analytical tool that describes states of susceptibility to harm,
powerlessness, and marginality of both physical and social systems, and it is a guiding
analysis for enhancing well-being by reducing the risk (Adger, 2006). So for
understanding the vulnerability to climate change we need to understand multi-scale and
interdisciplinary issues.
2.3.2 Resilience
The concept of resilience is a complex and multi-interpretable which has contested
definitions and relevance (Jordan, 2009). Resilience in general sense means the system
ability to deal with stresses and disturbances and also maintaining its basic structure and
ways of functioning, capacity for self-organisation, and capacity to learn and adapt to
change (Speranza, 2010). So, resilience is about managing the changes and adapting to
the test of current and future climate risks (Speranza, 2010). According to the Fourth
Assessment Report of IPCC, resilience is defined as “ability of a social or ecological
system to absorb disturbances while retaining the same basic structure and ways of
functioning, the capacity for selforganisation, and the capacity to adapt to stress and

27
change” (Baede, Linden, & Verbruggen, 2007). Further, Adger (2000) differentiates
resilience as social and ecological. The social resilience result due to social, political and
environmental changes and it is the ability of groups or communities to cope with
external stresses and disturbances. While ecological resilience is the characteristic of
ecosystems to maintain themselves in the face of disturbance (Adger, 2000). According to
the Resilience Alliance (2002) resilience has three distinct characteristics, i.e., system
capacity to undergo change and still be in the same state, have capability of
self-organization and have ability to build and increase capacity of learning and
adaptation. Further, resilience can be viewed as layered concept which ranges from
individual to household, community, ethnic group and global level (Jordan, 2009).
2.4 People’s Perception to Climate Change
2.4.1 Importance of perception of climate change
Perception can be stated as the process by which individual notices and understand
the environmental stimuli. Also human perception do not just solely respond to the
environmental stimuli but go beyond the information present in the environment and pay
selective attention to some aspects of environment and ignore others elements that are
relevant to people (Carpenter, Bauer, & Erdogan, 2009). So, perception plays an

28
important part in the human for any action towards the change in the environment.
According to the Speranza (2010) awareness and perception of a problem, shapes action
or inaction for climate change problems. In light with this Gbetibouo (2009) states that
farmers having access to extension services are likely to perceive changes in the climate
as extension services provides information about climate and weather. This emphasizes
the perception of the people changes with the different services and the immediate need
or risks.
2.4.2 Perception towards natural hazard risk
According to the Wachinger & Renn (2010) risks perception process involves
collecting, selecting and interpreting signals about uncertain impacts of events, activities
or technologies. He also states that perception may differ depending on the type of risk,
the risk context, the personality of the individual, and the social context (Wachinger &
Renn, 2010). Further he adds that people evaluate risk according to their subjective
perception which is governed by psychological mechanisms for processing uncertainty,
intuitive heuristics for reaching generalisations and conclusions and additional contextual
characteristics (Wachinger & Renn, 2010). Poumadere, Mays, LeMer, & Blong (2005)
state that the societal and contextual aspects are linked with the perception of disaster

29
impacts. There are literatures indicating that perception about the impacts of disaster
depended on many factors. The study done by Medina, Iglesias, & Mateos (2007) about
risk perception among organic farmers in Spain indicated that risk perception depended
on many variables such as type of culture, the zone of cultivation etc. Further Wachinger
& Renn (2010) state that wider social, economic and political contexts at local, regional
and national levels are important factors that influence risk perception.
This emphasizes the importance of perception in order to know how people react to
the certain risks and cope with the distresses. Also in the study done by Kalinda (2011), it
states that the smallholder farmers’ perceptions related to floods and droughts were
significantly related with adoption of conservation agriculture. Also Kalinda (2011)
suggests that there should be inclusion of climate change communication which helps to
exchange the climatic information so farmers can relate to conservation agriculture as an
adaptation strategy to climate change.
2.4.3 Relationship between perception of climate change and socio-economic status
The people adapt to the changing environment when they perceive changes in the
area which is mainly related to their individual beliefs and practices. The study by Bang
(2008) shows that socioeconomic and cultural factor guides the risk perception of the

30
people. Bayard and Jolly (2007) states that the socio-economic condition may have
influence on the individual beliefs and attitudes. Diekmann and Franzen (1999) argued
that in richer countries there is higher willingness to give priority to environment and thus
environmental behaviors are positively correlated with per capita gross national product.
In contrast to this there are different literatures that contradict this notion and states that
poor people are highly concerned about environmental degradation. The different studies
(Brechin & Kempton, 1994; Dunlap, Gallup Jr., & Gallup, 1993) shows that people in
both developing and developed countries are concerned about the environmental
degradation. Also in the study by Dunlap, Gallup Jr., & Gallup, (1993) and Brechin and
Kempton (1994) states that despite the resource limitation and distribution of the poor in
the developing world, there is strong inclination for improving the environment. In
another study by Tarrant and Cordell (1997) found that there is higher correlations
between attitude and behavior for low-income than the high-income individuals. Further,
Vogel (1996) proposes that farmers whose livelihood is harsher may have more
knowledge about environmental problems. So, it can be said that the perception of the
people depends on various factors like social, cultural and economic which is location
specific in nature.

31
2.4 Climate Change Policy and Programs
2.4.1 Climate Change in International Regime
Climate change has been actively on discussion as one of the major challenges for
human since 1990s. The United Nations Framework on Climate Change is an
international treaty joined by different countries to limit the increase in global
temperature rise, deal with resulting climate change and cope with whatever the impacts.
Table 2.3 UNFCCC Conference of Parties events Date Event Place Main outcomes/Comments 1995 COP-1 Berlin, Germany Berlin Mandate adopted to develop a Protocol
on emission reduction. 1996 COP-2 Geneva,
Switzerland Geneva ministerial Declaration supporting climate change science endorsing IPCC second assessment report
1997 COP-3 Kyoto, Japan Kyoto Protocol adopted 1998 COP-4 Buenos Aires,
Argentina Buenos Aires Plan of Action (BAPA) on negotiation to prepare the Kyoto Protocol to come into force
1999 COP-5 Bonn, Germany Progress on rules and guidelines for Kyoto market-based mechanisms
2000 COP-6 Hague, Netherland Final decisions on BAPA; negotiation failed to conclude and COP-6 suspended
2001 COP-6 COP-7
Bonn, Germany; Marrakesh, Morocco
Bonn Agreements adopted on final details of BAPA, apart from land use, land use change and forestry (LULUCF). Established three new fund: Special Climate Change Fund, Least Developed Country Fund, Adaptation Fund Marrakesh Accord to the Bonn Agreements adopted
2002 COP-8 New Delhi, India Delhi declaration on climate change and sustainable development adopted

32
2003 COP-9 Milan, Italy Decisions on LULUCF adopted, final piece of BAPA negotiation completed
2004 COP-10 Buenos Aires, Argentina
Adaptation was equally featured as mitigation (also known as adaptation COP)
2005 COP-11 Montreal, Canada Finally adopted the Marrakesh accords, which enable operation of special climate change fund (SCCF), least developed countries fund (LDCF), adaptation fund
2006 COP-12 Nairobi, Kenya Conference made little measurable progress. 2007 COP-13 Bali, Indonesia Roadmap for post-2012 climate regime was
agreed, comprising the Bali Action Plan (BAP) 2008 COP-14 Poznan, Poland Focused on paving road from Bali to
Copenhagen, details on operationalization of Adaptation Fund discussed
2009 COP-15 Copenhagen, Denmark
Copenhagen accord drafted. Later submitted emission reduction pledges or mitigation action pledges
2010 COP-16 Cancun, Mexico Cancun Agreement was drafted. Agreed to establish the Green Climate Fund for developing countries and also Cancun adaptation framework, reducing emission from forest deforestation and forest degradation (REDD) plus mechanism and Technology mechanism.
2011 COP-17 Durban, South Africa
Durban platform for enhanced action accepted and also agreed on formation of National Adaptation Plan
2012 COP-18 Doha, Qatar Doha Amendment to the Kyoto Protocol was adopted. Agreed to look at the possibility of looking into mechanism for Loss and Damage in future.
2013 COP-19 Warsaw, Poland Decision on advancing Durban platform, Green-Climate Fund, and Long-term finance, Warsaw Framework for REDD+ and the Warsaw International Mechanism for Loss and Damage
Source: Compiled from UNFCCC (2014) and Kashyap (2009).

33
In May 1992 UNFCCC was adopted and entered into effect in March 1994. Kyoto
Protocol was adopted in 1997 as a result of negotiation in response to strengthen the
UNFCCC which they realized was not enough for emission reduction. Now in Kyoto
Protocol there are 192 countries and 195 countries in the UNFCCC (UNFCCC, 2014).
The Conference of Parties (COP) event and the key elements are described in Table 2.3.
2.4.2 Climate Change Initiative in Nepal
Nepal has been member of UNFCCC since its beginning. Nepal signed the UNFCCC
in Rio de Janerio in 1992 and later ratified the convention on May 1994 and came into
force in 31st July 1994 (MoPE, 2004). Nepal prepared Initial National Communication
report based on COP2 guidelines and setup National Climate Change Committee (NCCC)
and four separate National Study Teams (NSTs) to prepare country response to climate
change (MoPE, 2004). Nepal has been participating in the COP meetings regularly but
was not been able to raise national issue effectively in international arena due to initial
lower priority to climate change issue, lack of awareness, and inadequate capacity for
climate negotiation (ADAPT-Nepal, 2014). Role of Nepal since COP-17 has been more
active as they made a submission in National Adaptation Plan, organized side event on
Mountain Initiative and also opted for LDC coordinator in the UNFCCC process for the

34
year 2013 and 2014 (MoE, 2012). In January 2013, Nepal became chair for Least
Developed Countries (LDC) Group at United Nation (UN) Climate Change negotiation.
One of the major challenges for Nepal is implementation of Rio convention for which
government began process of assessing institutional and individual capacity (MoEST,
2008) and prepared National Capacity Self-Assessment (NCSA) for Global Environment
Management in 2008. Nepal also developed National Adaptation Programme of Action
(NAPA) in 2010 and climate change policy in 2011 and now also is making Local
Adaptation Plan for Action (LAPA). The focus of NCSA project was identifying the
priority issues for action and capacity needs within thematic area of biodiversity
conservation, combating climate change and combating land degradation. For the
preparation of NCSA three thematic working groups were formed based on working area
with the help of Global Environment Fund (GEF) and UNDP (MoEST, 2008). The major
outcome of NCSA project is that it was able to bring representative from different
concerned authorities together (MoEST, 2008). It also pointed out the strength, weakness,
opportunity and threat in the capacity to address biodiversity conservation, adapt to and
mitigate impacts of climate change and to combat land degradation.

35
2.4.3 National Adaptation Programme of Action
Nepal prepared NAPA in 2010 as a requirement of UNFCCC for accessing the LDC
Fund for most urgent and immediate adaptation needs. NAPA was developed with three
components namely preparation and dissemination of NAPA document, development of
Nepal Climate Change Knowledge Management Centre (NCCKMC) and
Multistakeholder Climate Change Initiative Coordination Committee (MCCICC). For
preparation of NAPA US$ 1,325,000 was allocated of which US$ 250,000 was used for
preparation and dissemination of NAPA document and remaining amount was used for
other two purposes (GoN & UNDP, 2008). NAPA process was signed on November 14,
2008 but the process began only from May 2009 and completed in September 2010 (GoN
& UNDP, 2008; MoE, n.d.). NAPA is strategic tool that assess climate vulnerability and
identifies the immediate needs to adaptation and was formed by consultative process
(MoE, 2010). For the preparation of NAPA six thematic working groups (TWGs) were
formed and were led by line ministries. The TWGs identified the nine integrated project
as urgent and immediate national adaptation priority which are as follows (MoE, 2010):
1. Promoting community-based adaptation through integrated management of
agriculture, water, forest and biodiversity.
2. Building and enhancing adaptive capacity of vulnerable communities through
36
improved system and access to service for agricultural development.
3. Community-based disaster management for facilitating climate adaptation.
4. Glacial Lake Outburst Flood (GLOF) monitoring and disaster risk reduction.
5. Forest and ecosystem management in supporting climate-led adaptation innovations.
6. Adapting to climate challenges in public health.
7. Ecosystem management for climate adaptation.
8. Empowering vulnerable communities through sustainable management of water
resource and clean energy supply.
9. Promoting climate-smart urban settlements.
NAPA is the first comprehensive climate change dedicated government document
(HELVETAS, 2011). NAPA tried to link the governmental policies and communities
needs by identification of need to prepare LAPA. NAPA was successful in generating
discussion on immediate needs for adaptation to climate change but also has some gaps.
NAPA prioritized the adaptation program for natural hazards by focusing on its
management and need for monitoring Glacial lake outburst flood (GLOF). NAPA was
also successful in emphasizing the need for better data management but has not raised
issue of extensive research requirements on climate change. NAPA has prioritized on
infrastructure from the view point of adaptation to natural hazards but has not thought

37
from the view point of increasing resilience. It does not clarify on the implementation
strategy of the adaptation and fails to identify implementation partner but only identifies
communities as major beneficiaries. Further, it seems to identify the communities more
from the perspective of sufferer but does not consider increasing community capabilities
for adaptation. Also NAPA fails to acknowledge private sector as one of the important
partner for implementing adaptation technologies. The broader criticisms of the NAPA
document seems that its process is mainly dominated by centre level government
agencies, national NGOs, donor organizations representatives and relevant UN agencies
(HELVETAS, 2011). This raises the question of participation of stakeholders at
community level and their subsequent needs.
2.4.4 Climate Change Policy
In the past climate change was addressed in 2003 sustainable development agenda for
Nepal and 2001 millennium development goals. Nepal being signatory to UNFCCC for
implementing the convention between 2007 and 2009 initiated projects like NCSA, Clean
Development Mechanism (CDM) project approval, NAPA, second national
communication (SNC), and strengthening capacity for managing climate change and
environment (GoN, 2011). In this regard, on March of 2011 Government of Nepal

38
formulated Nepal climate change policy 2011 in need to address the urgent response to
climate change and in response to international climate regime (HELVETAS, 2011).
In the climate change policy first three sections deals with Nepal initiatives and
efforts in the international climate change regime. The fourth section deals with the
problems and challenges from climate change while fifth section gives the reasons for
formation of climate change policy, its vision and mission. The sixth section deals with
vision, mission and goals of climate change policies. The vision of the climate change
policy (GoN, 2011) is
“This policy envisions a country spared from the adverse impacts of climate
change, by considering climate justice, through the pursuit of environmental
conservation, human development, and sustainable development—all contributing
toward a prosperous society.”
Further, main goal of climate change policy is to improve the livelihood by mitigating
and adapting to the adverse impact of climate change. For achieving the main goal it
gives the quantitative targets with timeline which are as follows:
1. Establishment of climate change center
2. Initiation of LAPA
3. Preparation of national strategy for carbon trade

39
4. Formulation and implementation of low carbon economic development
5. Assessment of losses and benefits from climate change
6. Promotion of climate adaptation
7. Development of reliable impact forecasting system
In accordance to the goals, section seven describes the objectives of climate change.
Further, section eight deals with various policies in detail to meet the desired policy
objectives which are as follows:
1. Climate adaptation and disaster risk reduction;
2. Low carbon development and climate resilience;
3. Access to financial resources and utilization;
4. Capacity building, peoples’ participation and empowerment;
5. Study and Research;
6. Technology development, transfer and utilization; and
7. Climate-friendly natural resources management.
Section nine of climate policy deals with the strategy and working policies, while
later sections deal with institutional structure, financial aspect, legal aspect, monitoring
and evaluation, plans and risks.
In climate change policies local communities are seen as the major stakeholders for

40
adaptation and mitigation. Also, it is mentioned that local communities are entitled to
80% of the climate fund but its modality of implementation is still not clear and is in
discussion. The policy also stresses on lack of the scientific researches and fact regarding
the impact of climate change. The policy governs the immediate activities listed in NAPA
document and also recognizes natural hazards management as immediate need. The
policy also stresses upon development of infrastructure along with adaptation. There are
few gaps that exist in the climate change policy especially in its implementation part. Till
April 2014 there has not been any separate laws and regulation for facilitating in the
implementation of climate change policies. Climate change policy fails to give detail
about working procedure in the community though it gives some implementing strategy
and working policy in section 9 (HELVETAS, 2011). The policy defines Ministry of
Environment as the coordinating organization at functional level but does not talk about
coordination with other ministries since Ministry of Environment does not have local
organization at district and village level. Also policy fails to recognize the implementing
partner at the ground level. Though it recognizes the risks associated with the
implementation of policy, it does not talk about managing those risks. Though the policy
documents are for implementing the climate change adaptation programs that are directed
towards local community, there is information gap regarding climate change policy at

41
local level. The policy also sees the people from the view point of sufferer but does not
stresses on possibility of enhancing their local resources and knowledge. The few
programs that have been implemented go in different direction undermining the focus of
climate change programs. Thus looking from these perspectives, the policy documents
seem to be driven from top to bottom and do not seem much accountability at local level
along with significant gap in the implementation.
2.4.5 Local Adaptation Plan for Action
From the recommendation of NAPA document 2010 and with the view of supporting
implementation of adaptation fund to local level Nepal Government has developed
national framework for LAPA (GoN, 2011b). According to GoN (2011b) LAPA
framework basically supports integration of climate resilience into local to national
development planning process and outcomes. This is insured by bottom-up, inclusive,
responsive and flexible approach. Basically the purpose of LAPA can be described as
follows (MoE, n.d.):
1. Enable communities to understand climate change and engage them in developing
adaptation priorities.
2. Implementing climate-resilient plans.

42
3. Informing sectoral programmes and catalysing integrated approaches between
various sectors and sub-sectors.
LAPA framework has identified VDC and municipalities as the appropriate unit for
integrating climate resilient local-to-national development planning process (GoN,
2011b). It has been piloted in 10 districts and made 70 LAPA as of February 2014 that
includes 69 VDC and 1 municipality. LAPA process involved seven steps for integrating
climate change resilience into local-to-national planning process (GoN, 2011b).
1. Climate change sensitization
2. Climate vulnerability and adaptation assessment
3. Prioritization of adaptation options
4. Developing Local Adaptation Plans for Action
5. Integrating Local Adaptation Plans for Action into planning processes
6. Implementing Local Adaptation Plans for Action
7. Assessing progress of Local Adaptation Plans for Action
Each of these steps involves activities at the local level where it went down to VDCs
and ward level for integrating climate change resilience in the development planning
(HELVETAS, 2011). LAPA documents are inclusive, comprehensive and community
centric but there implementation is still questionable as there has not been much progress

43
after the formation of 70 LAPAs. Further, there has been addition of new dimension from
many developmental organizations by making community based adaptation plan. This
community based adaptation plan has focused communities more but has also added
challenges of how it is going to be integrated in LAPA.
2.4.6 Foreign assistance in Nepal
Nepal started to receive the foreign assistance since 1952 after joining Colombo Plan
Cooperative, Economic and Social Development in Asia and Pacific (Bista, 2006).
Foreign aid has been a vital component in the development of socio-economic
development and representing on average around 6.57% of total GDP till 2009 and
around 26% of total budget in the fiscal year 2010/11 (Foreign Aid Coordination Division,
n.d.; Bhattarai & Sharma, 2013). Nepal has received most of the foreign aid from 1975
till 2009 in the sector of transportation, power and communication followed by
agriculture and social service (Bhattarai & Sharma, 2013). But recently there has been
increase in the proportion of donor grant in the field of climate change in Nepal. Nepal
started to receive foreign aid from 2007 onwards. It received around 20.7% proportion of
donor grant in 2007/2008 which increased to 40.4% in 2011/2012 (Regmi & Bhandari,
2012). Currently, there are 13 projects that have disbursed the financing in support of
climate change programs in Nepal (Table 2.4).

44
Table 2.4 Current climate change projects in Nepal Project Title Donors Commitment
US $ Disbursed
US $ Capacity Building for Strategic Planning for Municipal Solid Waste Management including understanding of Climate Change and CDM
United Nations Human Settlements Programme
90,624 63,437
Strengthening Capacity for Managing Climate Change and the Environment
Asian Development Bank
1,275,000 1,125,407
Improved capability to respond to increased risk of natural disasters related to climate change
Finland 645,245 691,592
Nepal Climate Change Support Programme
European Union, DFID
16,571,528 4,820,467
Cities and Climate Change Initiatives United Nations Human Settlements Programme
26,000 9,441
REDD-Forestry and Climate Change World Bank Trust Funds
3,400,000 1,422,912
Enhancing Capacities for Climate Change Adaptation and Disaster Risk Management for Sustainable Livelihoods in the Agriculture Sector
United Nations Development Programme
103,890 241,385
Initiative for Climate Change Adaptation (ICCA)
U.S. Agency for International Development
2,000,000 750,000
Multilateral climate change mitigation WorldBank AusAid 1,430,930 1,430,930 Capacity Development for Mainstreaming Climate Change Risk Management in Development
Asian Development Bank
7,163,000 881,023
South Asia Water Initiative - Climate Change and Water
AusAid 101,276 101,276
NCCSP MoSTE, DFID 4,299,623 1,635,417 NCCSP: Building Climate Resilience in Nepal
DFID, European Union
22,564,557 11,041,158
Source: (MoF, 2014)

45
Understanding importance of climate change impact, Nepal government has taken
initiatives to address it by allocating 10.3% of its budget in the year 2013/14 (IIED, 2014).
Besides these there has been US$ 236.62 from the international source for the period of
2009-2012 (IIED, 2014). The foreign assistance in Nepal is implemented by different
developmental organizations by taking non-governmental organization, community based
organizations and governmental bodies as their implementation partners. The
developmental organization is working basically focusing on two aspects:
Nature focused
Community focused
Nature focused programs mainly focuses on the knowledge generation and disaster
risk reduction programs. The nature focused programs are also aimed at maintaining the
ecosystems and natural resource management for the betterment of the communities.
Communities focused programs mainly focuses on improvement of livelihood and
dissemination of information regarding climate change to the people. For implementation
of the climate change adaptation programs organizations are mainly taking three
approaches
Ecosystem based approach
Community based approach

46
Integrated approach
Ecosystem based approach
The ecosystem based approach give priority for using biodiversity and ecosystem
services for helping people to adapt to climate change. In Nepal management of water
resources, disaster risk management, REDD, forestry management and wetland programs
are the common programs which is implemented from ecosystem based approach. This
approach is mainly delivered by knowledge generation like researches, capacity
development and conservation activities.
Community based approach
The community based approach gives priority for strengthening the communities by
improving their livelihood and building on local practices for adapting to climate change.
The programs such as Nepal climate change support program, initiatives for climate
change adaptation, increasing resilience of communities to cope with climate change and
so on. The community based approach depends mainly on how the community group
organize themselves to adapt to climate change (Bryan & Behrman, 2013).

47
Integrated approach
In integrated approach both the ecosystem as well as community based approach are
taken together. In Nepal programs like Hariyo Ban uses this approach. This approach
takes into account both preservation of ecosystem and strengthening the communities,
since without participation of communities ecosystem cannot be preserved.
With these approaches different developmental, non-governmental and governmental
organizations are implementing different programs. For example the pilot program for
climate resilience which looks into different aspect like natural hazards management,
climate data management, watershed management, involving private sectors for
adaptation, mainstreaming climate change in development and so on. These programs are
being prioritized by the developmental organizations based on the adaptation programs
identified by the NAPA and climate change policy. Further, with issue of climate change
getting more recognized internationally, the developmental organizations are planning
more and more programs incorporating the climate change issues. Further there has been
shift on development of infrastructure to reduce vulnerability as well as adaptation by the
international donors. There has been improving coordination among the donor
organizations and government agencies but still there exists some gaps such as
Lack of coordination between government agencies has been one of the major
48
problems for implementation of adaptation organization1.
The developmental organization blames government of not having the capacity for
adaptation program where as government authorities think too much bureaucracy
while working with the donor organization.
Though the focus of climate change programs is adaptation, but different
developmental organization are implemented differently.
Development organization sees that there has been lessening interest in the
governmental agencies for climate change.

49
Chapter III
3. Research Design and Study Area
3.1 Introduction
This chapter describes the conceptual framework for analysing the vulnerability and
resilience of farmers in Rural Nepal. The concept is developed based on the existing
literatures and IPCC Fourth Assessment Report definition of vulnerability. Also, this
chapter highlights the study area and methodology for gathering the data.
3.2 Conceptual Framework
There are basically three conceptual approaches for assessment of vulnerability
(Deressa, Hassan, & Ringler, 2008).
1. Socio-economic approach: The socio-economic approach mainly focus on
socioeconomic and political variations within the society, but not environmental
factors, so it basically tries to identify the adaptive capacity of the individual and
communities based on their characteristics (Deressa, Hassan, & Ringler, 2008).
2. Biophysical approach: The biophysical approach basically tries to capture the
damage done by environmental factors on the social and biological systems and
mainly focuses on the physical damages like change in yield, income, etc. (Deressa,

50
Hassan, & Ringler, 2008).
3. Integrated assessment approach: The integrated assessment approach combines both
the approaches, socioeconomic and biophysical approaches (Deressa, Hassan, &
Ringler, 2008). Though the integrated approach tries to correct the limitations of the
other two approaches, it has its own weakness as there is no standard process of
combining socioeconomic and environmental indicators, and also this approach does
not account for dynamism in vulnerability (Deressa, Hassan, & Ringler, 2008).
This study adopts the integrated assessment approach and uses the indicator method
to assess the vulnerability and resilience of farmers in Rural Nepal. The main issue in this
research is what are the factors that determining the vulnerability and resilience at both
district as well as household level? This study tries to identify the different factors that are
determinant for climate change vulnerability and resilience of farmers. First the study
tries to identify the determinant factors of vulnerability at national level (district) and
finally also looks at the factors effecting vulnerability and resilience at local level
(household).

51
3.3 Components of Framework and relationship between them
There are numerous conceptual models, frameworks, and assessment techniques that
have been developed to understand vulnerability and resilience both theoretically and
from point of application (Cutter, et al., 2008). According to IPCC vulnerability can be
explained by exposure, sensitivity and adaptive capacity. Exposure to climate change is
change in temperature and rainfall pattern in the area over the years and also occurrence
of natural hazards. With increase in exposure, i.e., increase in the change in temperature
and rainfall and also increase in the occurrence of natural hazards the people will be more
vulnerable to climate change, especially farmers as their livelihood depends on it.
Sensitivity increases the effect of exposure on the people and will have more negative
impact on them. Sensitivity will include the factors like casualties and damaged caused
by the natural hazards as well as human and environmental factors that makes them more
susceptible to the natural hazards and climate variability. The combined effect of
exposure and sensitivity will increase the vulnerability while adaptive capacity will
decrease it. Ford et al. (2006) suggest while defining adaptive capacity based on resource
and risk management decision is influenced by human system like social, economic,
cultural, experience and so on. Adaptive capacity includes the factors like buffering
capacity, self-organization and capacity of learning and adaptation which will improve

52
their capacity of adaptation. The buffering capacity includes the variables like
demography, wealth, infrastructure, and livelihood options, while self-organization will
include institute and information. The capacity of learning means the management and
openness for learning which will be given by their perception to climate change.
Sensitivity
(Natural hazard casualties,
human and environmental
characteristics)
Exposure
(Change in
temperature/precipitation;
frequency of natural disaster)
Ability to
recover
(Adaptation
practices)
Buffer Capacity
(Demography,
Wealth,
Infrastructure,
Livelihood
option)
Self
organization
(Institution,
information)
Capacity of
learning
(Perception of
climate change)
Resi
lien
ce
Vu
lnera
bil
ity
Ad
ap
tive
Cap
aci
ty
Figure 3.1 Conceptual frame work of study

53
The households that have more wealth and better excess to the infrastructure like road,
health post and have diverse livelihood option can accommodate changes in the climatic
variables. Further, the institution like micro-credit, access to technology and information
and their perception to climate change will further enhance the household’s ability of
adaptation. The adaptive capacity will decrease the vulnerability due to the combined
effect of exposure and sensitivity and also increases the resilience of the households to
climate change as a whole. Adaptive capacity is the major factor contributing to resilience
of famers to climate change but also resilience is governed by the factors like their
capacity to absorb shocks. Furthermore, vulnerability and resilience depends on the
geographic as well as social condition, so indicators of vulnerability and resilience will
also change based on it as well as unit of study, i.e., national level or local level study.
3.4 Study Area
Government of Nepal in 2010 did analysis of vulnerability of Nepal at district level
and produced NAPA by overlying climate risk/exposure maps, sensitivity maps, and
adaptive capacity maps. According to NAPA vulnerability of different districts of Nepal
were generally classified into five different categories namely:

54
1) Very High Vulnerable
2) High Vulnerable
3) Moderate Vulnerable
4) Low Vulnerable
5) Very low vulnerable
Based on this NAPA classified vulnerability on different scenarios such as natural
hazards like landslides, flood, GLOF and drought, socio-economic, forest and others and
also overall vulnerability. Study districts are selected based on vulnerability and also
accessibility of the area. The study districts are presented in Table 3.1
Table 3.1 Vulnerability level of the study districts Very High Vulnerable High Vulnerable Low Vulnerable Vulnerability Dolakha Dhading Lalitpur
Dolakha District
Dolakha district lies in the central developmental region and mountainous district of
Nepal. The district extends from 27˚28” to 28˚ North latitude and 85˚50” to 86˚32” East
longitude. The elevation ranges from 732 masl to 7148 masl. The district is surrounded
by China in the north, Ramechhap and Kavrepalanchok district in south, Ramechhap and
Solukhumbu district in the east, and Sindhupalchok district in the west. The mean annual
temperature of the district is 8˚C with annual mean rainfall of 2043.5mm. The district

55
covers 2191 square kilometre with agricultural land of 56683ha (DDCDolakha, 2013).
The population of district is 186,557 with population density of 85 (CBS, 2012).
Dhading District
Dhading district lies in the central developmental region and one of the least
developed districts among hilly districts of Nepal (DDCDhading, 2003). The district
extends from 27˚40” to 28˚14” North latitude and 84˚ to 85˚1” East longitude. The
elevation ranges from 488 masl to 7409 masl (DDCDhading, 2003). The district is
surrounded by Gorkha district in the west, Kathmandu and Nuwakot district in the east,
Makwanpur and Chitwan district in the south and Rasuwa district in north and also has
border with China. It has total area of 192,487ha (DDCDhading, 2003). The district
climate ranges from sub-tropical zone below 1000 masl to alpine zone above 3000 masl.
The average annual rainfall is 2121.2 mm (DDCDhading, 2003). The population of
Dhading district as of 2010 is 336,067 with population density of 174.

56
Lalitpur District
Lalitpur district lies in the central developmental region and is situated between 27˚22”
to 28˚50” North latitude and 85˚14” to 85˚26” East longitude. The elevation ranges from
457 masl to 2831 masl. One-third of the district lies within Kathmandu valley where as
two-third are hilly remote areas. The district is surrounded by Kathmandu district in south,
Bhaktapur district in north, Kavrepalanchok district in east and Makwanpur districts in
west. The Lalitpur district covers 385 square kilometres. Lalitpur district has 152.16
kilometre of agricultural land. The district has sub-tropical to cool temperate climate and
mean annual maximum temperature is 23.6˚C and mean annual minimum temperature is
10.7 ˚C and mean annual rainfall is 1232.6mm (DDCLalitpur, 2013). The population of
district is 468,132 as of 2010 having population density of 1216 (CBS, 2012).

57
Figure 3.2 Map of Nepal showing study districts
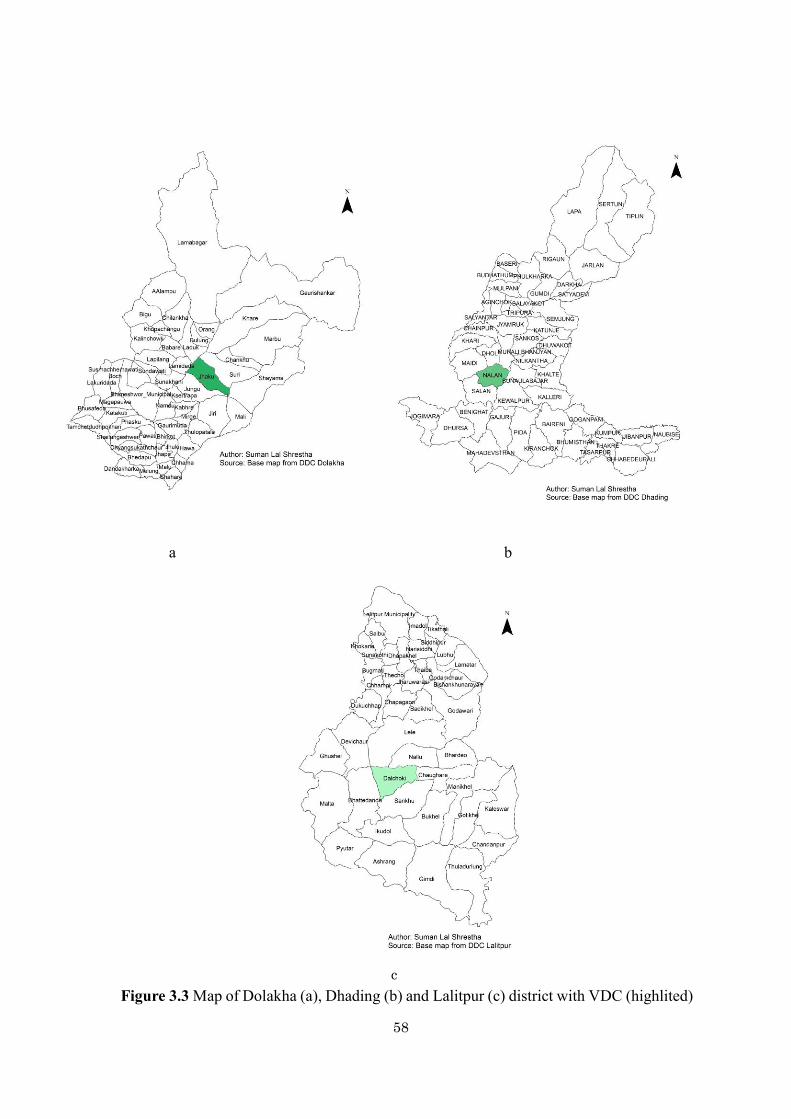
58
a b
c
Figure 3.3 Map of Dolakha (a), Dhading (b) and Lalitpur (c) district with VDC (highlited)

59
Chapter IV
4. Climate Change and Natural Hazards
4.1 Introduction
Climate is becoming more erratic in nature globally with increasing global
temperature. Climate change will not just affect the average temperature but also increase
the weather-related climatic hazards (Przyborski, 2013). Natural hazards is the physical
phenomena which occurs naturally and is caused by rapid or slow onset events which can
be geophysical, hydrological, climatological, meterological, or biological (IFRC, 2013).
There are growing evidences on changing natural cycles and variation in global climate
system and also strong evidences that these changes are unusual and do not fit into
natural pattern (Anderson, 2006). The changing climatic pattern will increase the
possibility of extreme climatic events like heatwave, coldwave, flooding and other
climate related natural hazards. According to Heltberg, Siegel, & Jorgensen (2008) there
is growing evidence that natural hazards related to climate are increasing in frequency
and intensity. It has been predicted that with climate change there is large range of
consequences, some of long term like sea level rise while some have immediate impacts
such as flooding (Anderson, 2006). The combination of increased temperatures,
decreased equator-versus-pole temperature difference, and increased humidity might have

60
impact on increasing intense cycles of droughts and floods as more precipitation falls in a
single large storm than series of small ones (Przyborski, 2013). These natural hazards are
the principal cause of the hazards that results in the casualties to human life and damages
to the economic property. In the fifth assessment report of IPCC hazard is defined as
“occurrence of a natural or human- induced physical event that may cause loss of life,
injury, or other health impacts, as well as damage and loss to property, infrastructure,
livelihoods, service provision, and environmental resources” (Lavell, et al., 2012). The
natural hazard and its impact will differ according to country and further will be location
specific. As stated by Lal, Singh, & Holland (2009) geographic condition is very
important determinant to which country is exposed to different type of natural hazard.
Nepal being mountainous country is characterized by rugged topography with high
relief, complex geological feature, and concentrated rainfall (Pradhan, 2007). Nepal is
one of the hazardous areas in world as its mountains are young and fragile with steep
slopes and experiences heavy monsoon rainfall (Pradhan, 2007). Nepal regularly
experiences the natural hazards such as floods, landslides, intense rains, hailstorms,
droughts, and coldwaves and heatwaves (MoAC, 2011) which are in increasing trend with
climate change. The increasing trend of natural hazard like floods, the characteristics like
high local level vulnerability that is associated with poverty levels, depleted natural

61
resources, fragile land and infrastructure and increasing intensive risk as urbanization, has
increased the impacts from these natural hazards (Practical Action, 2010). Nepal is ranked
30th globally in terms of water-induced hazards such as landslide and flood (MoHA,
2009). In Nepal the high intensity rainfall during the monsoon makes the country highly
vulnerable to water induced natural hazards like flood and landslides (MoAC, 2011).
Flooding is frequent in monsoon season in Nepal and drought is also not uncommon in
some areas of Nepal with prolonged breaks in summer monsoon (MoAC, 2011).
According to United Nations Nepal Information Platform (2013) the natural hazard in
Nepal is increasing with global climate change further exacerbating the vulnerability of
Nepalese people. According to Khanal, Shrestha, & Ghimire (2007) in the context of
increasing global warming phenomenon there will consequent increase in the intensity of
the extreme events. There has been increase in the recent undesired climatic events like
increase in the frequency of extreme events flooding, landslides, droughts, heat stress, hot
winds, cold waves, hailstones, and snowfall (Prasai, 2010). In Nepal from 1971 to 2007
more than 50,000 people were reported injured, 3,000 people missing and more than five
million people affected by natural hazards (UNISDR, 2009). Floods and landslides are
the most overwhelming natural hazards accounting for most loss of life and livelihoods
that regularly affect Nepal, and claimed about 211 lives on average annually between

62
1998 and 2008 (MoHA, 2009). For example the flood of 1993 in the central region of
Nepal caused deaths of around 1336 people (Pradhan, 2007). Also huge landslides in
Durbang about 200 km west of Kathmandu in the year 1988 killed 109 people and in only
half the monsoon period (June 10 to August 15) in the year 2009 killed 50 people (Dahal,
2012). Besides flood and landslides there are other natural hazards that have significant
impact like drought and hailstorm. Also extreme events of coldwaves and heatwaves
affected number of people lives. In 2007 southern plains were reported to record
temperature around 12˚C below normal and same year in February Kathmandu received
its first snowfall in 63 years (Prasai, 2010). In 1997/1998 winter cold reduced the winter
crop yield by 11-38% compared to the average of the preceding 10 years (Prasai, 2010).
In addition to this, hills that accounts for 56.2% of total land mass of Nepal accounted for
highest number of hazard event from 1900 to 2005 (Aryal, 2012).
Nepal ranks fourth on the list of ‘extreme risk from climate change over the next 30
year out of 16 countries globally (UN, 2012). The hydrological, meteorological and
glaciological data from Nepal Himalayas shows that Nepal Himalayas is changing faster
than the global average. According to Maharjan, Joshi and Piya (2011) analysis of data
from 1976 to 2005 shows that temperature in Nepal has increased by 1.6°C. The warming
trend in Nepal is more distinct in autumn and winter and mostly rainfall is in monsoonal

63
season, June to September, around which 80% of rainfall occurs and there is very low
rainfall during December to February (MoPE, 2004). The trend analysis done by Practical
action (2009) found that average temperature of Nepal was increasing at 0.04ºC per year.
According to Practical Action (2009) in Nepal due to high inter annual variation in
rainfall there is no significant trend observed over the years. Also there were some small
pockets of area that has decreasing rainfall trend over the period of 1976-2005 (Practical
Action, 2009). The impact of climate change in Nepal will differ according to region as
well as sector.
World is now more warm than it was for the past two millennia (Jones & Mann,
2004). With increasing global climate and increasing extreme weather there is need to
link climate change and the extreme weather. According to Anderson (2006) establishing
link between weather extremes and climate change has now become a pressing and
political concern and understanding the science to establish it very important especially if
political decisions are based on it. As Nepal is vulnerable to natural hazard, it is important
to analyse the climatic pattern and trend of natural hazard and their relationship with each
other in order for proper management of natural hazards. Climatic variables are the major
determinants for occurrence of natural hazards. Any change in climatic variable due to
climate change will increase the occurrence of natural hazards. But still the effect of

64
climate change on occurrence of natural hazard, in empirical equations, is still very
unclear. The effect of climate change on occurrence of natural hazard in Nepal is still yet
to be established. There are very few literatures that try to see empirical relationship
between natural hazards and climatic variables in Nepal like Dahal & Hasegawa (2008)
which studies rainfall threshold for landslides in Nepal. Many of the literature regarding
natural hazard like landslides mainly focuses on the loss of life and wealth, physical
properties of landslides, and recommendation of environmental friendly preventive
measures (Dahal & Hasegawa, 2008). In addition, whatever the source of hazards
occurrence might be their impacts include loss of life, injury to persons, damage to
property and destruction of assets (Lal, Singh, & Holland, 2009). So, there is need of
analysing effect of climate change in with the impact of natural hazard also. This paper
first tries to analyse trend of climatic variable like temperature and rainfall and
occurrence of natural hazards and their impacts such as casualties and damages over the
period of 1978 to 2011. Also the paper tries to analyse effect of climatic variables on
occurrence of natural hazards and their impacts.

65
4.2 Methodology
The study uses the climatic data taken from department of hydrology and
meteorology of Nepal for the period of 1978 to 2011. The natural hazard data were taken
from DesInventar (Disaster Information Management System) for the period of 1978 to
2011. The DesInventar collects the data from various sources like newspapers, disaster
review series from 1993 to 2002. The total number of natural hazards and the casualties
and damages caused by it taken for the study may not be the actual representative of all
the natural hazards but only the reported cases during the study period. The climatic data
are analysed annually as well as seasonally. In regards to climate change, annual average
rainfall and temperature trend gives the overall characteristics of changing climatic
pattern while change in trend of temporal standard deviation gives the variation over the
area as well as time. It is also important to analyse the seasonal trend as it shows
occurrence of more extreme weather pattern of the study area. Nepal season is divided
into four season namely: Pre Monsoon (Mar.-May), Summer Monsoon (Jun – Sep), Post
Monsoon (Oct.-Nov.) and Winter (Dec – Feb) (Kansakar, Hannah, Gerrard, & Rees,
2004).
The monthly temperature and rainfall trend of Nepal is analysed from 1978-2011 to
see the overall temperature and rainfall pattern, while daily average rainfall is analysed

66
from 2002 to 2011 to see relationship with the climate extremes. For seeing the climate
extreme rainfall indices are used as shown in Table 4.1.
Table 4.1 Rainfall Indices Indicator Indicator definition Units
Number of heavy rainfall days
Annual count when precipitation ≥ 10mm Days
Number of very heavy rainfall days
Annual count when precipitation ≥ 20mm Days
Consecutive dry days Maximum number of consecutive days when rainfall < 1mm
Days
Consecutive wet days Maximum number of consecutive days when rainfall ≥ 1mm
Days
Source: Zhang, et al. (2011)
Further, linking climate change and extreme weather is important but establishing it is
complicated. According to Anderson (2006) there are three main ways of linking:
1. Empirical (by comparing current data of natural hazard with historical record),
2. Theoretical (through simulation using such as GCMs and RCMs).
3. Indirect proxy – examining data on damage from extreme events, including the
frequently cited rise in insurance claims.
Every method has its own advantages and disadvantages, in the empirical method the
data quality and quantity changes over the time (Anderson, 2006). He also stated that
theoretical methods are not suited well for examining the specific geographical location.
Further, he added that measurement of impacts are complex since the amount of insured

67
property keeps changing and element of chance in the location damaging event and
infrequent repetition to allow comparison is simply difficult to use them as evidence. As
climate change make specific event more likely it might have happened under unchanged
circumstances, so linking between natural hazard and climate change will thus have to
refer to statistically significant trend (Anderson, 2006). So this study uses the empirical
method by taking historical data trend to see effect of climatic variable on natural hazard.
In order to see the effect of climatic variable on natural hazard, trend analysis and
seemingly unrelated regression (SUR) analysis is used. The climatic variables like
average rainfall and temperature and temporal standard deviation are taken. Similarly,
natural hazards like flood, landslides, storm, snowstorm, heatwave, coldwave, forest fire,
and drought are taken. Also the number of people died, number of house
affected/destroyed, number of people injured and area of crop land affected by these
natural hazards are used for analysis. SUR analysis is used as it is expected that the
equations for prediction will be interrelated. SUR estimator developed by Zellner (1962)
is useful for estimating models with submodels more than 1 dependent variables that
allow for different regression matrices in each equation and account for contemporaneous
correlation. To simplify, all equations are stacked into a single equation and can be
written as:

68
𝑌 = 𝑋𝛽 + 𝑈 ………… 4.1
Where Y= (Y’1, Y’2,….,Y’n) is a vector of all stacked dependent variable
X is a block diagonal design matrix
𝛽 = (𝛽’1,𝛽’2, …𝛽’n) is a vector of the stacked coefficient vectors of all equations
𝑈=(𝑈’1,𝑈’2,…𝑈′n) is a vector of the stacked error vectors of all equation.
4.3 Result and Discussion
4.3.1 Trend analysis of temperature and rainfall
The 91 available temperature stations of Nepal are taken for the yearly as well as
seasonal analysis. Figure 4.1 shows the average temperature trend of Nepal from 1978 to
2011 and is seen to be increasing with the coefficient of 0.046 and R2 value of 0.615. The
increasing temperature trend is similar to the analysis done by Practical Action (2009).
This shows that temperature trend in Nepal is increasing faster than global temperature
trend. Further trend analysis of temporal standard deviation for the period of 1975 to 2011
shows that it is in decreasing order though not significantly indicating that temperature in
higher cold places like higher altitude is increasing faster.
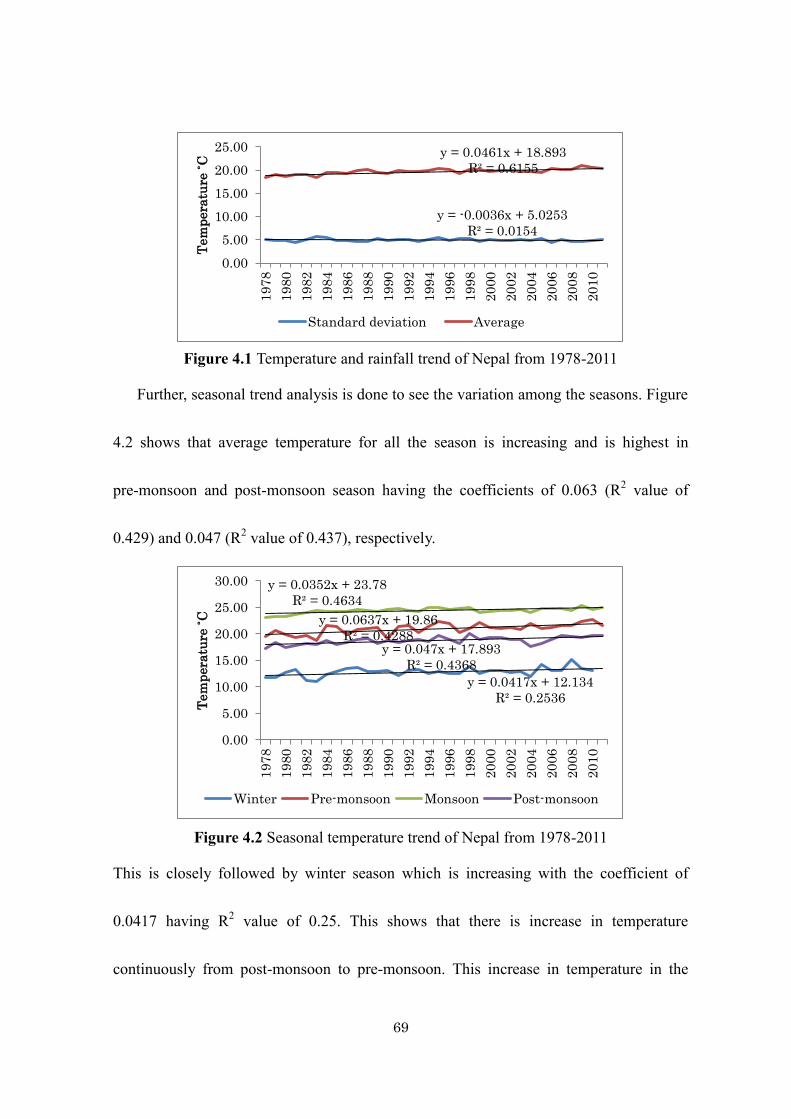
69
Figure 4.1 Temperature and rainfall trend of Nepal from 1978-2011
Further, seasonal trend analysis is done to see the variation among the seasons. Figure
4.2 shows that average temperature for all the season is increasing and is highest in
pre-monsoon and post-monsoon season having the coefficients of 0.063 (R2 value of
0.429) and 0.047 (R2 value of 0.437), respectively.
Figure 4.2 Seasonal temperature trend of Nepal from 1978-2011
This is closely followed by winter season which is increasing with the coefficient of
0.0417 having R2 value of 0.25. This shows that there is increase in temperature
continuously from post-monsoon to pre-monsoon. This increase in temperature in the
y = -0.0036x + 5.0253
R² = 0.0154
y = 0.0461x + 18.893
R² = 0.6155
0.00
5.00
10.00
15.00
20.00
25.00
19
78
19
80
19
82
19
84
19
86
19
88
19
90
19
92
19
94
19
96
19
98
20
00
20
02
20
04
20
06
20
08
20
10
Tem
pera
ture
˚C
Standard deviation Average
y = 0.0417x + 12.134
R² = 0.2536
y = 0.0637x + 19.86
R² = 0.4288
y = 0.0352x + 23.78
R² = 0.4634
y = 0.047x + 17.893
R² = 0.4368
0.00
5.00
10.00
15.00
20.00
25.00
30.00
19
78
19
80
19
82
19
84
19
86
19
88
19
90
19
92
19
94
19
96
19
98
20
00
20
02
20
04
20
06
20
08
20
10
Tem
pera
ture
˚C
Winter Pre-monsoon Monsoon Post-monsoon

70
drier period (winter) will make natural hazards like drought more severe.
The monthly average rainfall trend was analysed using the available data of 234
rainfall stations of Nepal. In Figure 4.3, rainfall has no significant trend but is seen to be
slightly decreasing with coefficient of -0.027 having R2 value of 0.0006. Rainfall is seen
to be very erratic in nature with some years having very low rainfall and the immediate
following years having high rainfall as seen in year from 2004 to 2006 where rainfall is
very low but suddenly increases in 2007. The continued lesser amount of rainfall for
consecutive years can be associated with the hazards like drought that have significant
impact on the farmers, where people depend mostly on rain-fed agriculture. Additionally,
standard deviation trend for rainfall is analysed from 1978 to 2011 and it is seen to be in
increasing trend having coefficient of 0.216 and R2 value of 0.019. Though standard
deviation trend is not significant, it indicates that rainfall is getting more erratic in nature.
Figure 4.3 Rainfall trend of Nepal from 1978-2011
The seasonal monthly average rainfall trend is analysed for the period of 1978 to
y = 0.216x + 158.23
R² = 0.0189
y = -0.0278x + 144.33
R² = 0.0006
0.00
50.00
100.00
150.00
200.00
19
78
19
80
19
82
19
84
19
86
19
88
19
90
19
92
19
94
19
96
19
98
20
00
20
02
20
04
20
06
20
08
20
10
Standard deviation Average

71
2011. Figure 4.4 shows that there is no significant rainfall trend in all the season, but it
shows the direction of rainfall. Rainfall is slightly increasing in monsoon season with
coefficients of 0.188, while is decreasing in pre-monsoon, post-monsoon and winter
season with coefficients of -0.04, -0.11 and -0.25, respectively. The increase in rainfall in
monsoon season during which it already receives around 80% of total rainfall indicates
that rainfall intensity is increasing over the short period. The decreasing rainfall in the
pre-monsoon, post-monsoon and winter along with increase in the temperature in same
season indicates that drier periods are getting more severe. This increase of rainfall in the
monsoon season and decrease in winter season both could increase the probability of
increasing natural hazards like flooding in monsoon season and drought in winter season.
Figure 4.4 Seasonal rainfall trend of Nepal from 1978-2011
y = -0.2494x + 27.769
R² = 0.0544
y = -0.0433x + 74.408
R² = 0.0008
y = -0.1133x + 37.48
R² = 0.003
y = 0.1878x + 337.77
R² = 0.0037
0.00
50.00
100.00
150.00
200.00
250.00
300.00
350.00
400.00
450.00
0.00
20.00
40.00
60.00
80.00
100.00
120.00
19
78
19
80
19
82
19
84
19
86
19
88
19
90
19
92
19
94
19
96
19
98
20
00
20
02
20
04
20
06
20
08
20
10
Ra
infa
ll (
mm
)
Ra
infa
ll (
mm
)
Winter Pre-monsoon Post-Monsoon Monsoon

72
4.3.2 Occurrence of climatic extremes
Nepal being prone to different kinds of natural hazards which is season specific,
it is very important to analyse the climatic variability. So, month wise temperature and
rainfall trend for the period of 1978 to 2011 is analysed. The analysis shows that
temperature is increasing in all the months with the fastest in March having the
coefficient of 0.08 (R2 value of 0.38) followed by February with the coefficient of 0.07
(R2 value of 0.27). The least increasing trend is in December with the coefficient of 0.02
(Annex I). Further, standard deviation trend for temperature is found to be in decreasing
order for all the months though not significant (Table 4.2).
Table 4.2 Temperature and rainfall coefficient for each month Jan Feb Mar Apr May Jun Jul Aug Sep Oct Nov Dec
Avg.
temp
Trend
coeff 0.04 0.07 0.08 0.06 0.05 0.03 0.04 0.03 0.04 0.05 0.05 0.02
R²
value 0.16 0.27 0.38 0.24 0.28 0.20 0.38 0.38 0.47 0.33 0.34 0.04
SD
coeff -0.02 -0.02 -0.03 -0.04 -0.06 -0.02 -0.01 -0.02 -0.02 -0.01 -0.03 -0.02
R²
value 0.11 0.02 0.19 0.16 0.52 0.13 0.04 0.19 0.16 0.07 0.10 0.06
Avg.
rainfall
Trend
Coeff -0.20 0.17 -0.16 0.09 0.39 0.35 -0.42 1.58 -0.76 -0.06 -0.17 -0.69
R²
value 0.01 0.01 0.07 0.00 0.02 0.00 0.01 0.09 0.02 0.00 0.19 0.11
SD
coeff -0.16 0.06 -0.33 0.13 0.05 -0.02 0.00 0.03 -0.68 0.33 0.02 -0.23
R²
value 0.02 0.00 0.09 0.02 0.00 0.00 0.00 0.00 0.07 0.02 0.00 0.12

73
Rainfall analysis shows that there is no significant trend in all the months but the
direction in which month rainfall is mostly decreasing while increasing in few months. It
is seen that rainfall is decreasing in January, March, July, September, October, November
and December while it is increasing in February, April, May, June and August. The
continuous decrease in rainfall from September to January indicates that drier periods are
getting drier in nature. Further, during monsoon season there is decrease in rainfall in July
while high increase in the month of August. This shows that rainfall is getting more
extreme in nature and there is high probability of occurrence of flood in the August and
drought in July.
In addition to this, extreme rainfall trend for 2002 to 2011 are analysed using the
daily average data. It is seen that number of total dry days in a year has been increasing
with coefficient of 1.97 with R2 value of 0.32 and consecutive dry days are increasing
with coefficient of 1.03 and R2 value of 0.12 (Figure 4.5a). Further, it is seen that
consecutive wet days are decreasing over the same period with coefficient of -0.43 and R2
value of 0.004 (Figure 4.5b). Also, the average daily rainfall over these continuous wet
days is increasing with coefficient of 0.043 and R2 value of 0.007 (Figure 4.5b). This
trend analysis shows that overall rainfall is getting more extreme in nature, i.e, drought is

74
becoming more severe and frequent, and rainfall is getting more intense over the short
period of time.
a b Figure 4.5 Trend analysis of dry days (a) and wet days (b) from 2002 to 2011
Further, number of days of extreme rainfall trend according to season is analysed
using daily average rainfall for period of 2002 to 2011 (Figure 4.6). The analysis shows
that in pre-monsoon season average rainfall is decreasing with the coefficient of -0.045
while dry periods are increasing with the coefficient of 0.727. In pre-monsoon season
heavy rainfall is decreasing with the coefficient of -0.236 indicating that it is getting drier.
This decrease in the average rainfall as well as increase in the dry periods in pre-monsoon
season, exacerbates the problem of water shortage. In monsoon season the average
rainfall, heavy rainfall, very heavy rainfall and dry periods is increasing with coefficient
of 0.004, 0.97, 0.16, and 0.24, respectively.
y = 1.0303x + 37.133
R² = 0.122
y = 1.9758x + 155.73
R² = 0.3245
0
20
40
60
80
100
120
140
160
180
200
Da
ys
Year
Consecutive dry days Dry days
y = -0.4364x + 134.6 R² = 0.0041
y = 0.0433x + 11.661 R² = 0.007
0
2
4
6
8
10
12
14
16
0
20
40
60
80
100
120
140
160
180
Rai
nfal
l mm
Day
s
Year Consecutive wet days Average rain

75
a b
c d Figure 4.6 Trend analysis of average rainfall and extreme rainfall days for pre-monsoon (a), monsoon (b), post-monsoon (c) and winter (d)
Since most of the rainfall comes in monsoon season, the increase in daily average rainfall
and increase in the intensity of heavy and very heavy rainfall increases the probability of
natural hazards occurrence like flood and landslide. In case of post-monsoon season the
average daily rainfall and very heavy rainfall is increasing with coefficient of 0.004 and
0.05, respectively; while dry period and heavy rainfall is decreasing with the coefficients of
y = -0.2364x + 4
R² = 0.0852
y = 0.7273x + 33.4
R² = 0.1663
y = -0.0453x + 2.8509
R² = 0.077
0
1
2
3
4
0
10
20
30
40
50
60
Ra
infa
ll m
m
Da
ys
Year Pre-monsoon Heavy Pre-monsoon Very Heavy
Pre-monsoon Dry Pre-monsoon Average
y = 0.9758x + 42.733
R² = 0.1096
y = 0.1636x + 15.8
R² = 0.0061
y = 0.2424x - 0.1333
R² = 0.2755
y = 0.0046x + 12.115
R² = 1E-04
0
3
6
9
12
15
0
10
20
30
40
50
60
70
Ra
infa
ll m
m
Da
ys
Year Monsoon Heavy Monsoon Very Heavy
Monsoon Dry Monsoon Average
y = -0.0485x + 0.6667
R² = 0.0441
y = 0.0545x + 0.2
R² = 0.0234
y = -0.1636x + 47.8
R² = 0.0192
y = 0.0044x + 1.144
R² = 0.0006
0
1
2
3
0
10
20
30
40
50
60
Ra
infa
ll m
m
Da
ys
Year
Post-Monsoon Heavy Post-Monsoon Very Heavy
Post-Monsoon Dry Post-Monsoon Average
y = -0.1167x + 1.8056
R² = 0.0602
y = 0.8667x + 77.556
R² = 0.1604
y = -0.0753x + 0.9767
R² = 0.2192
0
1
2
0
10
20
30
40
50
60
70
80
90
100
Ra
infa
ll m
m
Da
ys
Year Winter Heavy Winter Very Heavy
Winter Dry Winter Average

76
-0.16 and -0.045, respectively. The increase in the average rainfall can be attributed to
increase in very heavy rainfall and is more disastrous as it will increase the occurrence of
flood and landslides. In winter season the average rainfall and heavy rainfall is decreasing
with the coefficients of -0.07 and -0.12, respectively, but dry period is increasing with the
coefficient of 0.86. As winter season is normally dry, increasing trend of dry period will
further exacerbated occurrence of drought. Figure 4.8 also shows that the climatic extreme
are increasing especially in the last few years. It is seen that with increasing natural hazards
there is also increase in the casualties and damages caused by them.
4.3.3 Occurrence of Natural Hazards
Figure 4.7 Trend of natural hazard occurrence from 1978 to 2011
The analysis shows that natural hazard is increasing for the period of 1978 to 2011
having coefficient of 17.32 with R2 value of 0.537 (Figure 4.7). The frequency of natural
y = 17.342x - 34328 R² = 0.5368
0
100
200
300
400
500
600
700
800
900
1000
1978
1980
1982
1984
1986
1988
1990
1992
1994
1996
1998
2000
2002
2004
2006
2008
2010
Num
ber
Year Frequency

77
hazard occurrence seems to be increasing very rapidly since 1990s. The occurrence of the
natural hazard in 1993, 2001 and 2002 is high compared to other years indicating that
return period of natural hazards is getting shorter.
a b
c d
Figure 4.8 Different types of natural hazard trend
Further, trend of occurrence of different type of natural hazard are analysed in Figure
4.8. Flood and landslides are increasing very rapidly with coefficient of 5.367 and 5.236,
respectively. It is seen that in 1993 there is huge number of flood and landslide and also
in 2001 and 2002 (Figure 4.8.a). Also there is increase in the occurrence of natural
hazards especially from 1990s onwards (Figure 4.8). Further, incidence of coldwave has
y = 5.3672x + 0.6631 R² = 0.328
y = 5.2365x - 11.551 R² = 0.3181
050
100150200250300350400450
1978
1980
1982
1984
1986
1988
1990
1992
1994
1996
1998
2000
2002
2004
2006
2008
2010
Num
ber
Year
Flood Landslide
y = 1.7937x - 18.155 R² = 0.3709
y = 0.7837x + 3.3155 R² = 0.2032
y = 2.5647x - 13.294 R² = 0.6038
020406080
100120140160
1978
1980
1982
1984
1986
1988
1990
1992
1994
1996
1998
2000
2002
2004
2006
2008
2010
Num
ber
Year
Coldwave Hailstorm Thunderstorm
y = 0.4507x - 3.6524 R² = 0.2663
y = 0.1346x + 1.4385 R² = 0.028
y = 0.1186x - 0.8984 R² = 0.3409
05
1015202530354045
1978
1980
1982
1984
1986
1988
1990
1992
1994
1996
1998
2000
2002
2004
2006
2008
2010
Num
ber
Year Forest Fire Drought Heatwave
y = 0.3592x - 0.5508 R² = 0.2506
y = 0.4333x - 2.2299 R² = 0.3048
y = 0.0956x + 1.6203 R² = 0.0282 0
510152025303540
1978
1980
1982
1984
1986
1988
1990
1992
1994
1996
1998
2000
2002
2004
2006
2008
2010
Num
ber
Year Heavy Rains Snow storm Storm

78
been increasing sharply from 2002 onwards (Figure 4.8.b). There has been increase in the
number of heavy rains that caused the casualties and damages since 2000 (Figure 4.8.d).
The trend shows that occurrence of natural hazards is highest for flood and landslide.
Also it is seen that hailstorm, coldwave, forest fire, drought and heavy rains that causes
damages are also occurring frequently. Mostly flood and landslide occurs in monsoon
season when there is high rainfall in Nepal followed by post-monsoon season (Table 4.3).
In winter season there is high occurrence of coldwave and snowstorm while in
pre-monsoon season there is high occurrence of forestfire, hailstorm, heatwave, storm and
thunderstorm (Table 4.3).
Table 4.3 Occurence of natural hazard according to season Natural Hazard Pre-monsoon Monsoon Post-monsoon Winter Coldwave 3(6) 3(6) 19(18) 355(50) Drought 14(21) 107(47) 3(9) 5(9) Forest fire 122(47) 5(9) 0(0) 15(21) Flood 68(56) 3039(100) 99(50) 9(18) Hailstorm 420(88) 32(35) 95(65) 31(41) Heatwave 15(26) 24(24) 0(0) 1(3) Heavy rain 22(32) 137(71) 25(32) 11(21) Landslide 72(65) 2519(100) 81(74) 45(47) Storm 95(50) 14(29) 3(6) 0(0) Snowstom 24(35) 2(6) 11(24) 145(62) Thunderstorm 523(94) 472(91) 25(35) 54(44) Note: Figures in parenthesis shows the occurrence percentage1 of natural hazards over the period of
1978 to 2011.
1 Occurrence percentage=(No. of years X natural hazard occurred in different season)
(Total No. of years) x 100

79
While in monsoon season there is high occurrence of drought, flood, landslide and heavy
rain. Also, there is increase in the occurrence of forest fire in pre-monsoon season from
2000 onwards. Further, occurrence of drought in monsoon season is high which may be
due to significant increase in the heavy rainfall and decrease in consecutive wet days in
monsoon.
4.3.4 Casualties due to natural hazards
Figure 7 shows the trend of casualties and damages caused by natural hazards for the
period of 1978 to 2011. The trend analysis shows that all the casualties and damages
caused by the natural hazards are increasing rapidly. The deaths caused by the natural
hazards are increasing with coefficient of 7.94 having R2 value of 0.097 (Figure 4.9a).
The injured person by natural hazards are increasing with coefficient of 9.996 having R2
value of 0.68 (Figure 4.9b). While, houses destroyed have great yearly variation and are
increasing with coefficient of 140.6 and R2 value of 0.0825 (Figure 4.9c). Further, crops
damaged by natural hazards are also increasing with coefficient of 1254.4 and R2 value of
0.12 (Figure 4.9d). The analysis shows that injuries due to natural hazards are increasing
very rapidly while there is large variation in the numbers of houses destroyed/damaged by
the natural hazards.

80
Landslide and flood are the two major natural hazards followed by hailstorm and
coldwave over the period of 1978 to 2011(Table 4.4). Further, landslide and flooding is
causing maximum casualties and damages among all the natural hazards. Casualties and
damages caused by coldwave are increasing rapidly over the period of 1978 to 2011
(Table 4.4). Flooding is seen as the most destructive natural hazards event that
destroys/damages the houses. Drought is also causing significant damages to crops.
y = 7.9477x - 15576
R² = 0.0973
0
200
400
600
800
1000
1200
1400
16001978
1980
1982
1984
1986
1988
1990
1992
1994
1996
1998
2000
2002
2004
2006
2008
2010
Num
ber
Year
Deaths
y = 9.996x - 19804 R² = 0.6817
-100
0
100
200
300
400
500
1978
1980
1982
1984
1986
1988
1990
1992
1994
1996
1998
2000
2002
2004
2006
2008
2010
Num
ber
Year Injured
y = 140.6x - 277189
R² = 0.0825
1
10
100
1000
10000
100000
1978
1980
1982
1984
1986
1988
1990
1992
1994
1996
1998
2000
2002
2004
2006
2008
2010
Nu
mber
Year
Houses Destroyed
y = 1254.4x + 3587.5 R² = 0.1241
020000400006000080000
100000120000140000160000180000
1978
1981
1984
1987
1990
1993
1996
1999
2002
2005
2008
2011
Are
a ha
.
Year Damages in crops Ha.
Figure 4.9 Occurrence of natural hazards (a) and casualties (b,c and d) of Nepal from 1978-2011
a b
c d

81
Table 4.4 Natural hazards and casualties/damages caused by it from 1978 to 2011 Natural Hazards
Frequency Deaths Injured Houses Destroyed/Affected
Damages in crops Ha.
Cold wave 450 596 83 0 20906.5 Drought 129 0 0 0 392353.00 Flood 3216 3157 502 87180 218175.00 Forest Fire 143 61 55 15914 38629.41 Hailstorm 580 32 88 207 132372.40 Heat wave 40 41 20 0 0.00 Landslide 2723 4359 1499 19261 182037.00 Heavy Rains 194 57 40 743 69966.60 Snow Storm 182 89 46 168 1900.00 Storm 112 43 269 1021 87.00 Thunderstorm 1074 1011 1925 291 2.00
4.3.5 Effect of climatic variable on natural hazards
Table 4.5 Result of SUR between climate variables and natural hazards V. Cold-
wave Flood
Forest Fire
Drou-ght
Hail- storm
Land- slide
Thunder- storm
Heat- wave
Heavy- rain
Snowstorm
Storm
1 2.04 ***
5.81 ***
0.28 *
0.12
1.29 ***
5.48 ***
2.62 ***
0.07 *
0.47 ***
0.65 ***
0.09
2 -0.04
1.61 *
-0.18 **
-0.39 ***
0.05
1.58
-0.31
0.00
0.12
0.00
0.04
3 -8.08
-12.50
5.29
0.03
-16.80 **
-6.00
-2.38
1.73 *
-3.64
-7.28 **
0.12
4 -3879.35
-11474.30
-642.37 -175.0
9 -2231.
41 -10961
.45 -5108.08 -165.21 -884.39
-1149.81
-191.51
Note: V. Variables, 1 year, 2 Average annual rainfall, 3 Average annual temperature, 4 constant. * Significant at 10%, ** Significant at 5%, *** Significant at 1%

82
SUR analysis is used to analyse the effect of climatic variables on natural hazards.
Time trend is included as additional explanatory variable to capture change in dependent
variables over time. It is found that coldwave, flood, forest fire, hailstorm, landslide,
thunderstorm, heavy rain and snowstorm are increasing significantly with the coefficient
of 2.04, 5.81, 0.28, 1.29, 5.48, 2.62, 0.07, 0.47, and 0.64, respectively (Table 4.5). The
result shows that flood and landslide are increasing fastest for the period of 1978 to 2011.
The analysis shows that increase in rainfall will significantly increase the flood with the
coefficient of 1.61, while decrease in rainfall will significantly increase forest fire and
drought having the coefficient of -0.18 and -0.39, respectively (Table 4.5). With increase
in temperature there will be significant increase in the heatwave having the coefficient of
1.73, while decrease in temperature will significantly increase hailstorm and snowstorm
with the coefficient of -16.80 and -7.28, respectively (Table 4. 5).
Flooding is the major natural hazard affecting life of people in Nepal as shown by
Table 4.3 and 4.4. Analysis shows that pre-monsoon and monsoon flooding are correlated
to each other. So, SUR analysis is used to see the effect of climatic variables on
occurrence of pre-monsoon and monsoon flooding. The analysis shows that pre-monsoon
and monsoon flood are increasing significantly over the period of 1978 to 2011 with the
coefficients of 0.149 and 6.365, respectively (Table 4.6).
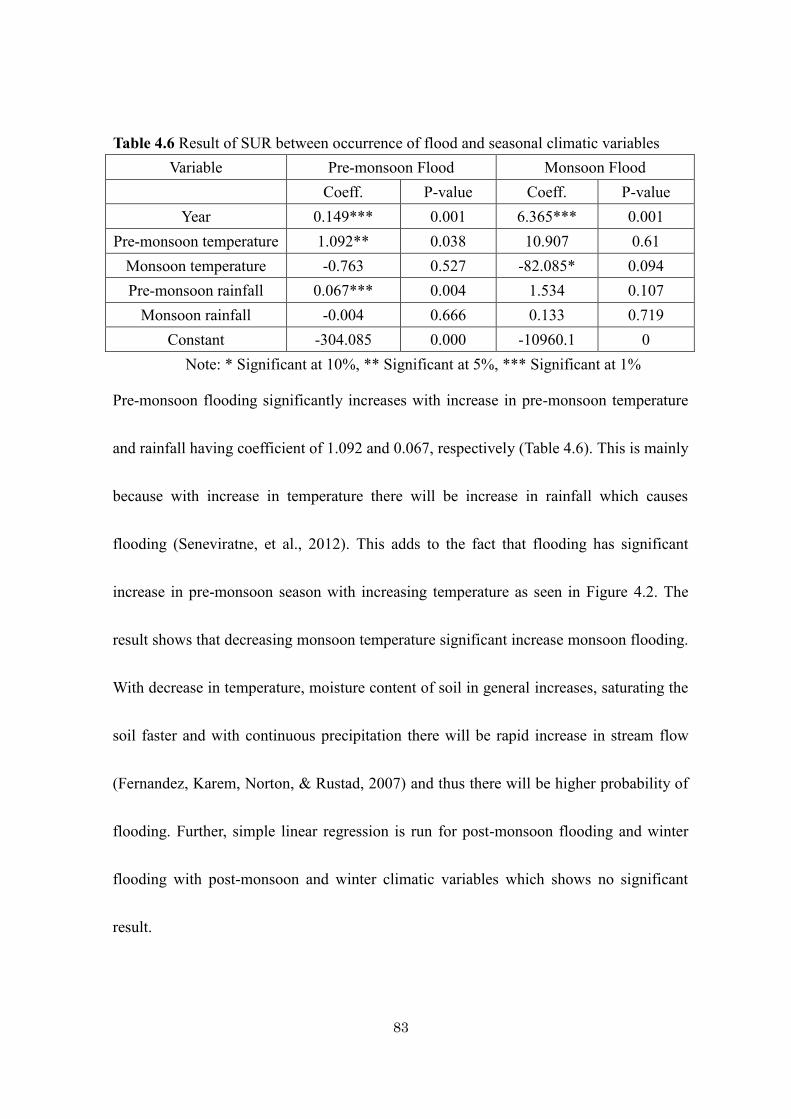
83
Table 4.6 Result of SUR between occurrence of flood and seasonal climatic variables Variable Pre-monsoon Flood Monsoon Flood
Coeff. P-value Coeff. P-value Year 0.149*** 0.001 6.365*** 0.001
Pre-monsoon temperature 1.092** 0.038 10.907 0.61 Monsoon temperature -0.763 0.527 -82.085* 0.094 Pre-monsoon rainfall 0.067*** 0.004 1.534 0.107
Monsoon rainfall -0.004 0.666 0.133 0.719 Constant -304.085 0.000 -10960.1 0
Note: * Significant at 10%, ** Significant at 5%, *** Significant at 1%
Pre-monsoon flooding significantly increases with increase in pre-monsoon temperature
and rainfall having coefficient of 1.092 and 0.067, respectively (Table 4.6). This is mainly
because with increase in temperature there will be increase in rainfall which causes
flooding (Seneviratne, et al., 2012). This adds to the fact that flooding has significant
increase in pre-monsoon season with increasing temperature as seen in Figure 4.2. The
result shows that decreasing monsoon temperature significant increase monsoon flooding.
With decrease in temperature, moisture content of soil in general increases, saturating the
soil faster and with continuous precipitation there will be rapid increase in stream flow
(Fernandez, Karem, Norton, & Rustad, 2007) and thus there will be higher probability of
flooding. Further, simple linear regression is run for post-monsoon flooding and winter
flooding with post-monsoon and winter climatic variables which shows no significant
result.

84
4.4 Conclusion
The average temperature of Nepal over the period of 1978 to 2011 is rising while
rainfall is decreasing. The seasonal trend shows that temperature is increasing in all
season while rainfall is increasing in monsoon season and decreasing in pre-monsoon,
post-monsoon and winter season. In Nepal there is increase in extreme weather pattern as
shown by increasing trend of natural hazards. Flooding and landslides are causing most
casualties and damages which have the highest increasing trend and occur throughout the
year. There has been increase in extreme weather pattern such as increasing trend of
heavy and very heavy rainfall and increase in dry periods. SUR analysis is used to see the
effect of climatic variables on the occurrence of different types of natural hazards. The
analysis shows that natural hazards are increasing significantly over the period of 1978 to
2011. It shows that any change in rainfall and temperature significantly increase natural
hazards like flood, forest fire, drought, heatwave, hailstorm and snow storm. Further,
SUR analysis is used for understanding effect of seasonal climatic variables on
occurrence of flooding. The analysis showed the flooding is increasing significantly in
pre-monsoon and monsoon season. Also, with increase in temperature and rainfall of
pre-monsoon, there is significant increase in flooding while any decrease in monsoon
temperature significantly increases the flood. Thus climatic variables significantly affect

85
occurrence of natural hazards. This emphasizes with climate change there is further need
to understand the relationship between climatic variables and occurrence of natural
hazards, so that local communities can better understand the later and increase their
resilience. Understanding seasonal pattern of temperature and rainfall might be helpful
for understanding future natural hazards pattern which might be useful in better
management of natural hazards. Future study should focus on analysing local temperature
and rainfall pattern and the associated natural hazards. This will help in reducing
uncertainty related to natural hazards so that local communities can prepare for it.

86
Chapter V
5. Climate Change Vulnerability in Nepal
5.1 Introduction
The anthropogenic climate change is predicted to have negative impact on least
developed countries where livelihood of most people dependent on natural resources
(Heltberg & Bonch-Osmolovskiy, 2011). The impact of climate change will not just
depend on the biophysical characteristics but will also depend on the society and how
they interact with the climate. The IPCC Second Assessment Report (SAR) states that
socio-economic systems “typically are more vulnerable in developing countries where
economic and institutional circumstances are less favourable” (IPCC, 1996). Also SAR
describes that vulnerability is highest where there is “the greatest sensitivity to climate
change and the least adaptability.” Further in the Fourth Assessment Report, the IPCC
defines the vulnerability as “degree to which a system is susceptible to, or unable to cope
with, adverse effects of climate change, including climate variability and extremes”. After
the Fourth Assessment Report of IPCC, the focus of the researches has been to mitigation
and adaptation to climate change which brings in researches on vulnerabilities of the
specific places that have centered on analysis of human welfare (Ibarraran, Malone, &
Brenkert, 2008).

87
Kelly and Adger (2000) defines the vulnerability as “ability or inability of individuals
or social groupings to respond to, in the sense of cope with, recover from, or adapt to, any
external stress placed on their livelihoods and well-being”. Vulnerability is a function of
the character, magnitude, and rate of climate variation to which a system is exposed, its
sensitivity, and its adaptive capacity (Barker, et al., 2007). There are numerous conceptual
models, framework and assessment techniques that have been developed to understand it
better both theoretically and practically (Cutter, et al., 2008). According to Adger (2006),
“The concept of vulnerability has been a powerful analytical tool for describing states of
susceptibility to harm, powerlessness, and marginality of both physical and social systems,
and for guiding normative analysis of actions to enhance well-being through reduction of
risk”. This paper conceptualizes the vulnerability as a function of exposure, sensitivity
and adaptive capacity as per the definition of IPCC.
Exposure can be explained as the degree of climate stress upon a particular unit of
analysis (Comer, et al., 2012). Further, exposure can be defined as the experiences of
disturbances in the internal and external system (Abson, Dougill , & Stringer, 2012).
Sensitivity refers to the responsiveness of a system to climate hazards (Preston &
Stafford-Smith, 2009). Sensitivity may vary considerably from one system, sector or
population to another. Sensitivity, according to Gallopin (2003), is the degree to which a

88
system is changed or affected by an internal or external disturbance or set of disturbances.
The measure that shows the responsiveness of a system to climatic influences is shaped
by both socio-economic and ecological conditions and determines the degree to which a
group will be affected by environmental stress (SEI, 2004). According to the IPCC (2001),
sensitivity is to what extent the system is affected either adversely or positively by the
climatic stimuli. Adaptive capacity refers to the ability of a system in a way that makes it
better prepared to manage its exposure and/or sensitivity to climatic influences (Preston
and Stafford-Smith, 2009). Capacity is often measured in terms of resource availability.
The institutional and governance networks that exist to deploy those resources are also
essential, and any number of socio-political barriers may exist that impede successful
adaptation (Deressa, Hassan, & Ringler, 2009). Adaptive capacity is a significant factor in
characterizing vulnerability. According to Brooks (2003), the adaptive capacity of a
system or society generally reflects its ability to modify its characteristics or behaviour to
better cope with existing or anticipated external stresses, and also changes in external
conditions. IPCC (2001) describes adaptive capacity of a system, region, or community
as its potential or ability to adapt with the effects or impacts of climate change (including
climate variability and extremes). Also, adaptive capacity is context-specific and varies
from country to country, community to community, among social groups and individuals,
89
and over time (IPCC, 2001).
Climate change vulnerability of the household, community, region, or country is very
much related to the social and economic development (Gbetibouo & Ringler, 2009).
Further, the vulnerability to climate change varies from one place to another depending
upon different factors like its exposure, sensitivity and adaptive capacity. The study done
by Gbetitouo & Ringler (2009) calculated vulnerability as the net effect of sensitivity and
exposure on adaptive capacity in South Africa and shows that vulnerability is
characterized by the combination of medium-level risk exposure and medium to high
levels of social vulnerability. In addition to this, O’Brien et al. (2004) stressed that
institutional support can help in adapting to climate change. Deressa, Hassan & Ringler
(2009) analysed the household vulnerability to climate change in the Nile basin of
Ethiopia using econometric approach and shows that farmers’ vulnerability is highly
sensitive to their minimum per day income requirement (poverty line) and
agro-ecological setting. This emphasizes that there is need for identification and
characterization of climate change impact from the perspective of vulnerability. Also,
IPCC has stressed that priorities should be given for advancing understanding of potential
consequences of climate change for human society and the natural world, as well as to
support analyses of possible responses (IPCC, 2001). Further for increasing resilience and
90
adapting to climate change, it is important to understand the nature of vulnerability and
reflect it in various development strategies formulated at different levels (UNDP, 2010).
Furthermore, it is imperative to address the issue of climate change vulnerability at all
levels of decision-making through different policies and measures for increasing
resilience to climate change. In addition to this, the impact of climate change will be felt
at the local level and mapping climate change vulnerability will facilitate in conveying
the information about vulnerability and adaptive response to concerned authorities by
down-scaling global climate change to local level (Benjamin, Emma, & Richard, 2011).
Identifying and mapping the vulnerable area is one of the important steps in developing
climate resilient development plans and strategies for making society resilient in the face
of climate change (UNDP, 2010). Further, there has been increase in the importance of
spatially-explicit vulnerability assessments as instrument for environmental policy
formulation and development debates (Metzger & Schroter, 2006). Also, spatial
information regarding climate change will help in spatial planning taking into account the
future changes in environment and social context (NRC, 2007).
In Nepal there have been very few studies done regarding climate change
vulnerability. Few of the studies on vulnerability focuses on the local region, society and
household such as Khatiwoda (2011) which indicates that the vulnerability of Tharu

91
communities in Kailali district have increased due to extreme events, especially floods. In
addition to this, NAPA by the government of Nepal categorized vulnerability according to
districts. NAPA categorized districts like Kathmandu, Bhaktapur, Dolakha as most
vulnerable while districts like Ilam, Banke, Palpa are termed as least vulnerable districts
(MoE, 2010). NAPA uses the expert judgment to give weights to the indicators and also
gives equal weightage to exposure, sensitivity and adaptive capacity in vulnerability
analysis. The use of expert judgment to give the weights may not properly determine the
climate change vulnerability as using the expert judgment may have biases due to
cognitive limitations (Kirkebøen, 2009). Vulnerability analysis will be clearer and sound
if both socio-economic and biophysical indicators are used (Johnson, Stanforth, Lulla, &
Luber, 2012). While it is difficult for policymaker to indicate vulnerability according to
area by taking large number of discrete indicators, there is significant value to capture
multiple aspects of climate change vulnerability in smaller number of aggregate indices
by spatially-explicit measures (Abson, Dougill, & Stringer, 2012). So, this chapter
identifies district wise climate change vulnerability of Nepal using both socio-economic
and biophysical indicators. Further, it uses Principal Component Analysis (PCA) to give
weights to the indicators of climate change vulnerability to lessen the biases that may
arise due to cognitive limitations. Also, the chapter maps climate change vulnerability
92
using Geographic Information System (GIS) to provide visual spatial information of
climate change vulnerable districts in Nepal.
5.2 Methodology
Nepal is one of the least developed countries whose livelihood mostly dependent on
natural resource. According to Maplecroft climate change vulnerability index 2011, Nepal
is the fourth extremely vulnerable country in the world (Maplecroft, 2011). Nepal is
generally mountainous with steep topography. Its terrain can be divided into three parts,
namely; Tarai - southern plain region, Hills - mid hilly region and Mountains - northern
high mountains. Its climate varies from tropical in the south to alpine in the north. The
country climate is mainly influenced by Himalayan mountain range and South Asian
monsoon (NCVST, 2009). There has been increasing trend in the occurrence of natural
hazards since 1990s onwards in Nepal (Aryal, 2012) which will further increase the
climate change vulnerability. Further, Nepal is susceptible to geological and
climate-related disasters due to its topography, which is further exacerbated by lack of
effective response mechanisms and strategies to deal with them (WB, 2011). It has low
literacy rate (53%), hunger (30-40% of the Nepalese suffered from hunger in 2007), and
widespread poverty (WB, 2011). Nepal ranks 157th out of 187 countries in world in terms

93
of human development index (HDI) (Budden, Collins, Rahman, & Salinas, 2012) with
districts from eastern and central part having higher HDI than western part of Nepal.
Furthermore, districts from western part of Nepal are mostly ranked at the bottom of
Socioeconomic and Infrastructure Development Index (CBS, 2003). This indicates that
there is development disparity among the districts in Nepal emphasizing need for
analysing climate change vulnerability according to districts.
Sub-national level analysis of climate change vulnerability is important as they play
important role for implementation of adaptation programs (UNDP, 2010). In this chapter
districts are taken as sub-national level for analysis of climate change vulnerability. The
study uses the raw climatic data taken from department of hydrology and meteorology of
Nepal for the period of 1978 to 2011. Natural disaster data are taken from DesInventar for
the period of 1978 to 2011. The total number of natural hazards and the casualties and
damages caused by them, taken for the study may not be the actual representative of all
the natural hazards but only the reported cases in newspaper and disaster review report.
Socio-Economic data are collected from various sources such as National Population and
Housing Census 2011 (CBS, 2012), Annual Report Department of Health Services
2010/2011 (MoHP, 2012), Statistical Information on Nepalese Agriculture 2011/12
(MoAD, 2012) and Statistics of Strategic Road Networks 2011/12 (DoR, 2012)

94
The study uses the integrated assessment approach using indicator to analyse
vulnerability. For quantifying the vulnerability, the integrated assessment approach using
indicator is one of the most common methods. According to IPCC Fourth Assessment
Report vulnerability may be formulated as:
Vulnerability2 = Exposure + Sensitivity – Adaptive Capacity
A higher adaptive capacity is associated with the lower vulnerability while a higher
exposure and sensitivity is associated with higher vulnerability. The vulnerability
indicators were standardized to ensure indicators are comparable (Vincent, 2004). The
values of each variable are normalized to the range of values in the data set by applying
the following general formula:
=( )
……..5.1
After standardizing, weight is attached to the vulnerability indicators using PCA.
PCA is a technique used to extract few orthogonal linear combinations of variables which
most successfully capture information from a set of variables (Gbetibouo & Ringler,
2009). According to Gbetibouo & Ringler (2009), PCA is explained as following.
In this case set of N-variables (X*1j to X*Nj) represents the N-variables (indicators) of
each households. PCA normalizes each variable by its mean and standard deviation, i.e,
2 The study measures the relative vulnerability between different districts of Nepal

95
X1j = (X*1j – X*1)/s*1, where X*1 is the mean of X*1j across households and s*1 is its
standard deviation. The selected variables are expressed as linear combinations of a set of
underlying components for each household j:
X1j = 𝛽11 A1j + 𝛽12A2j + … + 𝛽1NANj
j= 1 … J
XNj = 𝛽N1A1j + 𝛽N2A2j + … + 𝛽NNANj , ……………. 5.2
where ,
A is the component
𝛽 is coefficient of each variable on each component. PCA solves the problem of
indeterminacy by linear combination of variables with maximum variance (normally the
first principal component W1j) followed by second linear combination of variables
orthogonal to the first with maximal remaining variance, and so on. Technically, the
procedure solves the equation
(R –λnI) vn = 0 for λn and vn,
Where, R is the matrix of correlations between the scaled variables (X)
vn is the vector of coefficients on the nth component for each variable.
Solving the equation yields the following
R (the characteristic roots ),

96
λn (also known as eigenvalues)
vn (associated eigenvectors),
The vns is scaled to total variance to make the final set of estimates, which is done to
achieve determinacy of the problem. The system is inverted to get the scoring factors
from the model as implied by Equation 2 that gives set of estimates for each of the
A-principal components:
A1j = f11 X1j + f12 X2j +… +f1N XNj
j = 1 … J
ANj = fN1 X1j + fN2 X2j +… +fNN XNj ………….. (5.3)
Where, f is the factor score
There are number of ways that can be used for retaining principal component score.
According to Filmer & Pritchett (2001), the first principal component defines the linear
index of all the variables from a set of variables which captures the largest amount of
information common to all the variables. While according to Sharma (1996) principal
component to be retained from PCA is based on the Kaiser’s rule of thumb that is
Eigenvalues of component should be more than 1. This will help to capture the highest
variability in the data. Further, the heaviest loading of principal component expressed in
terms of the variables, is an index for each household which will capture largest amount

97
of information (Abson, Dougill , & Stringer, 2012). Further, Principal component score is
based on the following expression:
A1j = f11 (X*1j – X*1)/(s*1) + … + f1N (X*Nj – X*N)/(s*N) …………. (5.4)
Climate Change Vulnerability Indicators
Exposure
Exposure is represented by either long-term changes in climate conditions or changes
in climate variability (O’Brien, et al., 2004). Further, communities are often exposed to
natural calamities through natural climate variability which does not relate to the future
changes in the climate system. Still, climate change may change the nature of those
hazards, potentially increasing future exposure (Preston & Stafford-Smith, 2009).
According to the IPCC (2001), exposure can be interpreted as, nature and extent of
changes a region is exposed to/from the region’s climate variables. Furthermore, exposure
can be expressed as direct threat and changes in the climatic variables of the area like
temperature, precipitation and extreme weather events (Gbetibouo & Ringler, 2009).
Sensitivity
Sensitivity to climate change depends on both the impact from natural phenomenon

98
as well as the social factors. According to Deressa, Hassan, & Ringler (2008), people that
suffer more from the impacts of natural hazards will be more sensitive to climate change.
Also, people that are more dependent on the natural resource for their livelihood are more
sensitive to climate change (Marshall, Fenton, Marshall, & Sutton, 2007). For example
people using fuel wood will be affected more if there is decrease in forest resources as
consequences of climate change. Further, sensitivity to climate change also depends on
human factors like household head, (HHH) disabled people and population density.
According to Gbetibouo & Ringler (2009) in the area with high population density, large
number of people will be exposed to risks which will need larger assistance.
Adaptive Capacity
Adaptive capacity is determined by different factors like social, infrastructure, wealth,
and information. People that have better excess to the information regarding the climate
will be better prepared and can better adapt to any changes that may befall (Marshall, et
al., 2010). Availability of wealth (remittance and houses in the area) can increase the
adaptive capacity of the people as it provides flexibility to change (Marshall, et al., 2010;
Deressa, Hassan, & Ringler, 2008). Similarly, the infrastructure like health institutes, road
network, school, irrigation, electricity and drinking water plays important role in

99
increasing the adaptive capacity which facilitate in resources availability (Deressa,
Hassan, & Ringler, 2008; Marshall, et al., 2010; Nhemachena & Hassan, 2007).
Table 5.1 Indicators of Vulnerability Vulnerability components
Determinants of Vulnerability
Description of indicators Unit of measurement
Expected sign
Adaptive Capacity
Social Literacy Dependency Ratio
Number Percentage
+ -
Infrastructure Health Institute School Road Irrigation Electricity Drinking Water
Number Number Kilometer Area Number Number
+ + + + + +
Wealth House Away population
Number Number
+ +
Information Radio Number +
Sensitivity
Human Disable Population Population density Female household head
Number Number Number
+ + +
Ecological Use Fuelwood Number + Shocks due to Natural hazards
Death Injured Houses damaged/destroyed Crop damaged
Number Number Number Hectare
+ + + +
Exposure
Climatic Variables
Change in temperature Change in rainfall
Coefficient Coefficient
+ +
Natural Hazards Frequency of natural hazards Number +
Social capital like literacy rate increases the adaptive capacity and decreases the
vulnerability by increasing people’s ability to cope with adverse effects (Gbetibouo &
Ringler, 2009) while lesser dependency ratio in the household will increase its adaptive

100
capacity (Barr, Fankhauser, & Hamilton, 2010).
GIS being a powerful tool that can store, manage, analyse, manipulate and present
spatial data, it is very useful for presenting data in a placed-based format and helps in
identification of highly vulnerable area (UNDP, 2010). ArcGIS software is used in this
study to map climate change vulnerability of Nepal. The yearly average temperature and
rainfall is analysed using data from 91 and 234 stations, respectively, from 1978 to 2011.
All the districts do not have the sufficient number of temperature and rainfall stations to
represent its temperature and rainfall. So, interpolation by Kriging method is used to
represent each districts temperature and rainfall. Kriging method in general is based on
spatial dependence which is based on generalized least square regression method and
allows for knowing spatial dependence between known points (Goovaerts, 2000) The
kriging takes into account spatial autocorrelation which is calculated into semivariance,
and plotted against distance in semivariogram for optimal prediction (Park, 2009). The
semivariance is calculated as
( ) = ⁄ ( ) ( ) ……………………….. 5.5
Where, ( ) is semivariance between two known points ( ) n ( ) with
distance . After interpolation of temperature and rainfall data for each year, they are
converted to the point data, which later is averaged to get the data of whole districts.

101
Coefficient from simple linear regression is used to represent change in temperature and
rainfall for each district in vulnerability analysis. After analysing the vulnerability, GIS is
used for mapping it according to different districts of Nepal.
5.3 Result and Discussion
5.3.1 Results of Climate Variables Interpolation and occurrence of natural disaster
The Figure 5.1 shows the change in temperature in 75 districts of Nepal. The analysis
shows that increasing temperature trend is highest in the eastern districts of the country
and some western districts like Manang and Mustang. The mean temperature trend is
increasing the fastest in Mustang district with the coefficient of 0.195 while it is
increasing slowly in Dang district with the coefficient of 0.002. In few districts like
Kailali, Banke and Bardia the mean temperature trend is also in decreasing trend and is
decreasing fastest in Banke district with the coefficient of -0.038.
Figure 5.2 shows the change of rainfall trend in different districts of Nepal. The
highest increasing trend of rainfall is in the eastern districts and some western hilly
districts. The rainfall is in decreasing trend in Tarai districts which is taken as the food
basket for the country.

102
Figure 5.1 Map of Nepal showing temperature trend
Figure 5.2 Map of Nepal showing rainfall trend
Figure 5.3 Map of Nepal showing natural hazard trend

103
The decrease in rainfall is very much harmful for agriculture sector, especially when
farming is mainly rain-fed in nature. The highest increase in rainfall trend is noticed in
Mustang district with the coefficient of 0.83, while the least increasing trend is for
Syangja district with the coefficient of 0.005. Further, the highest decreasing trend of
rainfall was noticed in Dang district with coefficient of -0.931.
Figure5.3 shows the change in trend of Natural hazards, which is highest in the
central part of country mainly and is lowest in some higher mountain district like Dolpa
and Mugu. Generally the increasing trend is higher in eastern districts of the country than
the western districts. The highest increasing trend is found in Dhading district with the
coefficient of 0.945 while the least increasing trend is found in Lalitpur district with the
coefficient of 0.024. Overall, the natural hazards are in increasing trend all over the
country.
5.3.2 Vulnerability to Climate Change in Nepal
Table 5.2 shows the weight of the variable for adaptive capacity, sensitivity and
exposure from PCA. PCA shows six components having Eigen value greater than 1 and
accounting for 81.99% of total variance. The first principal component (PC1) has the
highest variance around 44% (Figure 5.4).

104
Figure 5.4 Principal component having Eigenvalue more than 1
Table 5.2 Weight of variables from PCA
Component Variables Weight Component Variables Weight
Adaptive Capacity
Health 0.2024
Sensitivity
Disability 0.2865
Literacy 0.3049 Fuel Wood 0.2815
Road 0.5266 Population density
0.2365
Irrigation 0.2818 Female Household Head
0.2917
Drinking Water 0.3091 Deaths 0.3581
Electricity 0.2935 Injured 0.5953
Radio 0.2940 Houses destroyed 0.4777
House 0.3067 Crop damaged 0.3301
Away population 0.2801
Exposure Frequency 0.3973
Dependency ratio 0.4095 Temperature 0.3673
School 0.2779 Rainfall 0.6953
The heaviest loading from PCA is used as weight for the variables. It is seen that
adaptive capacity can be categorised as income and infrastructure, education, road and
0.00
5.00
10.00
15.00
20.00
25.00
30.00
35.00
40.00
45.00
50.00
PC1 PC2 PC3 PC4 PC5 PC6
Va
riab
ilit
y %

105
agricultural facilities. Similarly, sensitivity can be categorised as casualties, physical
damage, environmental and social. While exposure can be categorised as climate
extremes due to rainfall, increasing temperature and natural hazards. Further the principal
component scores are shown in Table 5.2.
Exposure
The exposure is highest in Mustang and Dhading district with the score of 1.01 and
0.89, respectively while is lowest in Syangja and Sarlahi district with the score of 0.14
and 0.17, respectively.
Table 5.3 Categorizing different districts according to exposure Very Low (Below-0.31)
Syangja, Sarlahi, Baglung, Chitwan, Mugu, Palpa, Lalitpur, Kanchanpur, Dolpa, Lamjung, Rautahat, Bajhang, Tanahu, Doti, Jumla, Bajura, Humla, Terhathum, Solukhumbu, Nawalparasi, Gulmi, Dhanusha, Panchthar
Low (0.31- -0.48)
Achham, Dadeldhura, Siraha, Kavrepalanchok, Dhankuta, Ilam, Bhojpur, Gorkha, Baitadi, Bara, Taplejung, Kalikot, Darchula, Makwanpur, Sankhuwasabha, Okhaldhunga, Parbat, Bhaktapur, Kathmandu, Mahottari, Jhapa, Sindhupalchok, Rupandehi, Parsa, Morang, Kailali, Jajarkot
Moderate (0.48 - 0.66)
Kaski, Sindhuli, Rasuwa, Myagdi, Khotang, Surkhet, Rukhum, Rolpa, Dailekh, Sunsari, Udayapur, Saptari, Kapilbastu, Pyuthan, Dolakha
High (0.66 - 0.83)
Arghakhanchi, Manang, Bardiya, Nuwakot, Salyan, Ramechhap, Banke, Dang
Very High Above 0.83
Dhading, Mustang
Kathmandu being the capital of the country has the low exposure, while study districts
106
like Lalitpur has very low exposure and Dolakha has moderate exposure (Table 5.3).
Exposure is high especially in the Southern Tarai districts, which is mainly in the western
part because of high occurrence of natural hazards (Annex VII). Also, exposure is highest
in Mustang and Dhading district which is mainly due to high change in rainfall and high
occurrence of natural hazards. Further, exposure is high especially in western districts
like Bardiya, Banke, and Dang (Table 5.3).
Sensitivity
Sensitivity is very high in Kailali, Dhading, Jhapa and Sunsari district with the score
of 1.55, 1.49, 1.31, and 1.30, respectively which is mainly due to high population density
as well as high number of casualties due to natural hazards. Sensitivity is very low in
Manang, Mustang, Mugu and Dolpa districts with score of 0.25, 0.28, 0.32, and 0.34
respectively mainly due to low population density. Kathmandu having high population
density has the high sensitivity. The study district like Lalitpur has very low sensitivity
and Dolakha has low sensitivity (Table 5.4). The sensitivity is mostly low in the
mountainous district while moderate to high in Tarai districts (Annex VII). Further,
sensitivity is high in the Central and Tarai districts where there is high population density.

107
Table 5.4 Categorizing different districts according to Sensitivity Very Low (Below 0.51)
Manang, Mustang, Mugu, Dolpa, Humla, Rasuwa, Myagdi, Solukhumbu, Sindhuli, Jumla, Darchula, Terhathum, Arghakhanchi, Taplejung, Panchthar, Lalitpur, Okhaldhunga, Dadeldhura, Kalikot
Low (0.51- 0.77)
Bhojpur, Sankhuwasabha, Salyan, Bhaktapur, Bajura, Lamjung, Parbat, Sindhupalchok, Rolpa, Nuwakot, Jajarkot, Achham, Doti, Kapilbastu, Parsa, Bajhang, Dolakha, Surkhet, Banke, Palpa, Rautahat, Pyuthan, Ilam, Baglung, Baitadi, Syangja, Kanchanpur, Gorkha, Dhankuta, Gulmi, Bardiya, Sarlahi, Rukhum, Rupandehi, Khotang
Moderate (0.77 - 1.03)
Ramechhap, Bara, Tanahu, Kavrepalanchok, Udayapur, Siraha, Dailekh, Dang, Kaski, Chitwan, Dhanusha, Saptari
High (1.03 - 1.29)
Morang, Mahottari, Makwanpur, Nawalparasi, Kathmandu
Very High 1.29-Above
Sunsari, Jhapa, Dhading, Kailali
Adaptive Capacity
The adaptive capacity of Kathmandu districts is highest with the score of 2.98 while
that of Mugu is the least with the score of 0.17 followed by Humla and Dolpa with the
score of 0.25 and 0.27 respectively (Table 5.5). Most of the districts have very low to low
adaptive capacity. Comparatively, Tarai districts have higher adaptive capacity than
mountainous districts (Annex VII). The adaptive capacity is highest in Kathmandu and
some district like Jhapa, Morang, and Rupandehi as these districts have high economic
transaction of and also has good infrastructure facilities. The reasons for mountainous
districts to have less adaptive capacity are their topography as well as lack of

108
infrastructure facilities. Further, it is also seen that adaptive capacity is high in those area
where sensitivity is also high. This is mainly because with increase in population density,
there will be development in infrastructure and other facilities to meet their demands.
Table 5.5 Categorizing different districts according to Adaptive Capacity Value District Very Low (Below 0.73)
Mugu, Humla, Dolpa, Bajura, Kalikot, Rasuwa, Jumla, Bajhang, Jajarkot, Solukhumbu, Darchula, Myagdi, Manang, Dadeldhura, Achham, Okhaldhunga, Taplejung, Rolpa, Ramechhap
Low (0.73 - 1.29)
Rukhum, Doti, Pyuthan, Terhathum, Parbat, Mustang, Sankhuwasabha, Bhojpur, Salyan, Lamjung, Parsa, Baitadi, Dolakha, Dhankuta, Khotang, Dailekh, Rautahat, Arghakhanchi, Panchthar, Dhading, Nuwakot, Sindhupalchok, Gorkha, Udayapur, Baglung, Gulmi, Bhaktapur, Mahottari, Sindhuli, Bara, Palpa, Kanchanpur, Tanahu, Surkhet, Kapilbastu, Syangja, Siraha, Bardiya, Banke, Kavrepalanchok
Moderate (1.29- 1.86)
Lalitpur, Ilam, Sarlahi, Makwanpur, Saptari, Dhanusha, Kaski, Nawalparasi, Dang, Chitwan, Sunsari, Kailali
High (1.86- 2.42)
Rupandehi, Morang, Jhapa
Very High 2.42 Above
Kathmandu
Vulnerability
Vulnerability to climate change is found to be the highest in western part of the
country, especially in mountainous districts. Also vulnerability is high in some of the
central districts where there is high exposure and low adaptive capacity. The highest
vulnerable district is Dhading with score of 1.36 while the lowest is found to be in

109
Kathmandu with score of -1.28 (Table 5.6). Districts like Ramechhap, Jajarkot, Rukhum,
and Kalikot are found to have high vulnerability with score of 0.77, 0.57, 0.54, and 0.52,
respectively (Table 5.6). Dhading is very highly vulnerable because it has very high
exposure and sensitivity and low adaptive capacity. Further, majority of the districts that
have very low adaptive capacity and high exposure like Ramechhap, Jajorkot, Kalikot,
Bajura have high vulnerability.
Table 5.6 Categorizing different districts according to Vulnerability Value District Very Low (Below -0.75)
Kathmandu
Low (-0.75 - -0.23)
Lalitpur, Rupandehi, Chitwan, Morang, Sarlahi, Syangja, Ilam, Palpa, Dhanusha, Sindhuli, Kanchanpur, Jhapa, Baglung, Panchthar
Moderate (-0.23-0.30)
Tanahu, Kaski, Nawalparasi, Bhaktapur, Gulmi, Kavrepalanchok, Terhathum, Rautahat, Siraha, Lamjung, Surkhet, Bara, Gorkha, Dang, Sindhupalchok, Kapilbastu, Bhojpur, Saptari, Solukhumbu, Dhankuta, Sunsari, Sankhuwasabha, Arghakhanchi, Baitadi, Makwanpur, Doti, Bardiya, Taplejung, Dadeldhura, Banke, Parbat, Okhaldhunga, Parsa, Jumla, Kailali, Darchula, Nuwakot, Myagdi, Manang, Achham
High (0.30 - 0.83)
Dolpa, Khotang, Udayapur, Dolakha, Mugu, Humla, Salyan, Mahottari, Bajhang, Rasuwa, Rolpa, Mustang, Dailekh, Bajura, Pyuthan, Kalikot, Rukhum, Jajarkot, Ramechhap
Very High (0.83 Above)
Dhading
Further, vulnerability is less especially in those districts where there is high adaptive
capacity like Kathmandu, Rupandehi and Morang. Also, it is seen that vulnerability is
high in the western mountainous district (Annex VII) which is mainly due to their low
110
adaptive capability. Further, Lalitpur has low vulnerability while Dolakha has high
vulnerability. This result showing the western part of Nepal being more vulnerable is in
line with the NAPA report, but the analysis also shows the contrary result in case of
Kathmandu as having very low vulnerability. This is mainly due to high adaptive capacity
of Kathmandu district. Further, PCA gives weighted index value and reduces congnitive
and subjective biases which is limitation in case of NAPA report.
5.4 Conclusion
As the effect of climate change is more pronounced in Nepal, understanding
vulnerability to climate change needs to be well understood before introducing any
development and adaptation intervention. Since the local authorities play important role
in the implementation of strategies for adapting to climate change, this study analyses and
produces maps to show district wise climate change vulnerability in Nepal. Results of this
study show that climate change vulnerability in Nepal depends mainly on adaptive
capacity. It is also seen that natural hazards increases the overall vulnerability. It is
observed that western districts are more vulnerable because of low adaptive capacity and
higher natural hazards. Especially, districts like Jajarkot, Rukhum and Kalikot from west
have the high climate change vulnerability mainly due to low adaptive capacity. In
111
addition, districts like Dhading, where there is high occurrence of natural hazards has the
highest vulnerability. So, in order to enhance resilience to climate change in Nepal, it is
necessary to prioritize measures which increases adaptive capacity but mitigates natural
hazards. For that, it is necessary to map vulnerability using more robust indicators
denoting land-use change and topography through the use of satellite images. It is also
imperative to understand the disparity of climate change vulnerability even within a
district in order to identify social groups, communities, and households who are prone to
adverse impact of climate change.

112
Chapter VI
6. Adaptation to Climate Change
6.1 Introduction
Climate change is a serious global issue which demands prompt response as shown
by numerous scientific evidences (Stern, 2006). Agriculture is one of the sector that is
seriously affected by climate change, especially in the least developed countries where it
is the main livelihood option for vast majority of the people. Any change in weather
pattern such as rainfall, temperature and associated natural hazards will have detrimental
impact on agriculture. Climate change will affect yield of crops, which will threaten food
security and livelihood of the people. Nepal is a sub-tropical and mountainous country
where majority of people live in rural areas and are highly vulnerable to climate change.
Around 74% of Nepal population engaged in agriculture as their main occupation (MoAC,
2011). Agriculture accounts for about one-third of the gross domestic product (WB, 2011).
It is mostly subsistence in nature due to its rain-fed nature, low yield of major crops and
rapidly increasing population (Joshi, Maharjan, & Piya, 2011). Some of the major factors
that contribute to low yield include soil degradation (caused by over grazing and
deforestation), poor complementary services (extension, credit, marketing, and

113
infrastructure) and climatic factors (Devereux, 2000; Alene, 2003; Yirga, 2007).
There are many uncertainties regarding the impact of climate change though there are
studies regarding future change in precipitation and temperature. The increase in
temperature and irregularities in the precipitation pattern will have impact on
environment and socio-economic sectors, like agriculture, forestry, water resources,
health and so on (UNFCCC, 2007). The impacts of climate change are expected to
become more intense in the near future making it more uncertain under business as usual
scenario (Harley, Horrocks, Hodgson, & Minnen, 2008). To cope with the uncertain
future, societies need to cope with these changes (UNFCCC, 2007). Further, Harley,
Horrocks, Hodgson, & Minnen (2008) states that despite strict stabilizing greenhouse gas
mitigations measures, impacts of climate change are likely to be substantial for which
countries needs to adapt. Fussel (2007) reasoned that since climate change is mainly
anthropogenic, adaptation should be emphasized. He also emphasized that there is a need
to focus on adaptation as it can be done at local or national level without being dependent
on others’ actions like emission reduction or mitigation that will take several decades for
its impact.
According to Maddison (2007) adaptation to climate change has two-steps, firstly the
farmers have to perceive that there is climate change and secondly they need to act

114
through adaptation. There are studies that have tried to see perception and adaptation to
climate change separately. The study done by Admassie & Adenew (2007) in Ethiopia
gave information on people’s perception of climate change and the adaptation strategies.
Also, there have been few researches that have tried to see perception of people to climate
change in Nepal and explore adaptive measures to climate change. According to Sharma
and Dahal (2011) climate change has forced people to find measures in securing their
livelihoods by adapting knowingly and unknowingly to these changes. This study
identified the adaptation measures adopted by farmers but did not identify the factors
affecting it. Study done by Piya, Maharjan, & Joshi (2012) showed different factors like
access to information and extension services which played important role in determining
the perception of communities to climate change. The study identified the different
factors that affect the perception of the communities but did not consider the factors that
determine the adaptation to climate change. Majority of the study in Nepal either analyses
how the perception of climate change are formed or how they adapt to climate change but
do not consider the factors affecting adaptation of those people that perceive the changes.
So the objective of this study is to identify the factors that influence the farmers’
perception of climate change and their adaptation to climate change.

115
6.2 Methodology
There are number of ways for measuring the factors affecting the farmers’ perception
of climate change and their adaptation. In case of analysis of agricultural technology
adoption, Probit and Logit models are the most commonly used, and binary method is
used when choices are two and multivariate method is used when choices are more than
two (Deressa, Hassan, & Ringler, 2011). For example, Nhemachena & Hassan (2007)
employed the multivariate Probit model to analyse factors influencing the choice of
climate change adaptation options in Southern Africa. Deressa et al. (2009) used the
multinomial Logit model to analyse factors that affect the choice of adaptation methods
in the Nile basin of Ethiopia. Piya, Maharjan, & Joshi (2012) used the Probit model to
analyze the factors affecting the community perception of climate change in Chepang
community of Nepal.
When adoption of a new technology is done through the farmer’s choice which is
more than one step, models with two-step regressions are used for correcting selection
bias created during the decision-making processes (Deressa, Hassan, & Ringler, 2011).
For correcting the sample biases they used Heckman Probit Selection model to analyse
factors affecting perception of and adaptation to climate change. Also, Yirga (2007) and
Kaliba, Verkuijl, & Mwangi (2000) used Heckman’s Selection model to analyse the

116
processes of agricultural technology adoption and the intensity of agricultural input use.
6.2.1Empirical model and model variables
According to different literatures it is found that household ability to notice changes
in climate will facilitate adaptation (Nhemachena and Hassan, 2007). According to
Deressa, Hassan, & Ringler (2011) adaptation is sub-sample to perception of climate
change and that adaptation may not be non-random and not necessarily different from the
first thus creating a sample selection bias. For correcting the sample bias Heckman
Selection model which consists of two equations is used. The first equation is the
selection which selects those people that perceive the climate change and second equation
is outcome equation which analyses determinants of adaptation strategies. Using
maximum likelihood method two equations are simultaneously run as it is more efficient
than two-step procedure (Khanal, 2012). To separate these two equations information
listen regarding weather is used as an identifier in the selection equation. According to
Heckman (1979) maximum likelihood procedure assumes that there is an underlying
relationship which has latent equation as:
Y1∗ = βX + U1 ∙∙ ∙ ∙ ∙ ∙ ∙ ∙ ∙ ∙ ∙ ∙ ∙ ∙ ∙ ∙ ∙ ∙ ∙ ∙ (6.1)
Y2∗ = γZ + U2 ∙ ∙ ∙ ∙ ∙ ∙ ∙ ∙ ∙ ∙ ∙ ∙ ∙ ∙ ∙ ∙ ∙ ∙ ∙ ∙ (6.2)

117
Where, X and Z are the vectors for independent variables, U1 andU2 are errors. The
dependent variable Y1∗ is observed only if the observation Y2∗ is observed. Here,
Equation 2 is whether a farmer has perceived climate change or not. The outcome model
(Equation 1) represents the farmers who have adapted to climate change and is
conditional that climate change has been perceived by the same farmers.
In selection equation of Heckman Selection model farmers’ perception of climate
change is the dependent variable while socio-economic variables are independent
variables. Similarly, in case of outcome equation adaptation index, i.e. adaptation
practices adopted by the farmers, is the dependent variable while socio-economic
variables are independent variables. The weighted adaptation index is created using
Principal Component Analysis (PCA) based on number of adaptation practices they
choose for adapting to climate change. Description of the people perception to climate
change and adaptation practices will be elaborated in the next section. Twelve
socio-economic variables are taken as explanatory variables in this model and additional
one variable is used as selection variables. These explanatory variables are based on
literature review and characteristics of the locality.
Different studies show that socio-economic and demographic factors affect farmers’
perception of climate change and their decision for adoption of new technology for

118
adaptation. Studies by Sampei & Aoyagi-Usui (2009) and Akter & Bennett (2009) shows
that people who have exposure to mass media have higher probability of being aware
regarding climate change damages. The factors like higher income level, gender and
membership of groups have positive impact on individual perception regarding climate
change (Semenza, et al., 2008; Leiserowitz, 2006). According to Maddison (2007) and
Gbetibouo (2009) factors like education, extension service have positive impact on
perception of climate change. Piya, Maharjan, & Joshi (2012) showed that access to
information and extension services played important role in facilitating the perception of
climate change. Also, Hassan & Nhemachena (2008) indicated that factors like access to
markets, extension service, credit service and information about adaptation to climate
change influences adaptation. The availability of services like extension and inputs will
increase the adoption of adaptation strategies as well as help to perceive climate change
(Maddison, 2007; Hassan & Nhemachena, 2008; Deressa, et al., 2009; Below, et al.,
2012). In this study, distance to market, livestock service centers and road is taken as
proxy for the availability of services and inputs which is hypothesized to improve farmers’
perception of climate change and adoption of adaptation practices. According to Piya
Maharjan, & Joshi (2012) formal education will reduces the ability to perceive the
climate change. The impact of household age (taken as proxy for experience) and

119
education on farmers’ perception of climate change and their adaptation has a mixed
result with literature showing both positive as well as negative result (Nhemachena and
Hassan 2007; Hassan and Nhemachena 2008; Deressa et al. 2009). In this study, it is
hypothesized that household head age (proxy for experience) and education are likely to
help in perceiving climate changes and adaptation. Further, impact of livestock
possession, landholding and total income, which is taken as proxy for asset, influences
the farmers’ perception of climate change and adaptation positively (Gbetibouo 2009;
Below et al. 2012). In this study, it is hypothesized that households with higher assets are
likely to have more information on climate change and are better able to adapt to various
adaptation practices. The information sources like listening to information regarding
climate will have positive influence on farmers’ perception of climate change (Hassan
and Nhemachena 2008; Deressa et al. 2009, Gbetibouo 2009). Further, access to micro
credit facilities such as credit and saving will facilitates in adaptation as well as
perception by enabling investments as well as providing information (Hassan and
Nhemachena 2008; Deressa et al. 2009, Gbetibouo 2009; Below et al. 2012). The variable
listening information on radio regarding climate information is taken as identifier in
selection variable. It is expected that if the people listen to information regarding climate
they will perceive climate change more.

120
Table 6.1 Variables selected for models Variables Mean Expected sign Adaptation Perception
Dependent
Adaptation Index
Perception
Independent
Gender (male 1, female 0) 0.7 +/- +/-
Age (years, continuous) 50.6 + +
Livestock (LSU, continuous) 1.7 + +
Landholding (hectare, continuous 0.8 + +
Education (schooling year, continuous) 2.2 +/- +/-
Irrigation Land (hectare, continuous) 0.3 + -
Total Income (NRs, continuous) 151778.9 + +
Distance to Road (hour, continuous) 0.7 - -
Distance to Market (hour, continuous) 1.7 - -
Distance to Livestock Service(hour, continuous) 1.7 - -
Distance to drinking water (hr, continuous) 0.2 - +
Micro credit facility (dummy; if has loan/saving 1 otherwise 0)
0.8 + +
Listen to climate information (dummy; if hear 1 otherwise 0)
0.5 +
6.3 Study Area and household characteristics
Household survey is conducted in Jhyaku, Nalang, and Dalchowki village
development committee (VDC) of three districts Dolakha, Dhading and Lalitpur,
respectively, in two phases, first in September and October of 2012 and second in
December and January of 2012/2013. First phase of survey is conducted to get the
socio-economic status of the household while second phase is conducted to get the

121
perception of climate change and their adaptation. The three VDCs are chosen based on
occurrence of natural hazards and vulnerability by discussion with the local authority of
the respective districts as well as accessibility from Kathmandu.
Jhyaku VDC
Jhyaku VDC lies in the Dolakha district towards 50 kilometre North from the district
headquarter Charikot and 2.5 hour walk from Singhati market. The VDC is surrounded by
Suri and Shyama in the east, Laduk and Lamidada in the west, Suri in the north and Jugu
in the south. The district extends from 27˚40” to 27˚44” North latitude and 86˚10” and
86˚15” East longitude with elevation ranges from 1200 masl to 3000 masl. The VDC
covers 3134ha of land and nearest market is Singhati and Maipokhari. The temperature of
the VDC varies according to altitude with mean minimum temperature ranges from 0˚C
to 3 ˚C while mean maximum temperature ranges from 20˚C to 22˚C with annual mean
rainfall of 2000mm (VDCJhyaku, 2012). There are 8067 people residing in 1876
households in VDC with male population of 3674 and female population of 4393 (CBS,
2012).

122
Nalang VDC
Nalang VDC lies in Dhading district and one of the most prone VDC to natural
hazards in the district. The VDC is surrounded by Maidi, Dhola and Muralibhanjyang in
the north, Muralibhanjyang and Sunaulabazar in the east, Kampur and Salang in the south
and Salang and Maidi in the west. The elevation of district ranges from 550 masl to 1200
masl. The VDC covers 1234ha of total land and Dhading bazaar is the nearest market
place. The VDC has seasonal motorable road across all the wards and farming is the
primary occupation in the area. The population of VDC is 8067 residing in 1876
households having male population of 3574 and female population of 4393 as of 2010
(CBS, 2012).
Dalchowki VDC
Dalchowki VDC lies in central part of Lalitpur district covering 630ha of land and is
bordered by Lele and Nallu VDC in north, Chaughare and Sakhu in the east, Sakhu in the
south and Bhattedada in the west. The nearest market is Lele, Chapagaun and Patan city.
The population of the VDC as of 2010 is 1167 living under 269 households with 537
male and 630 female (CBS, 2012). The VDC altitude ranges from 1200 masl to 2300

123
masl. Development of gravelled road across the wards of VDC has gained some
momentum recently but all the parts of the VDC are still not connected by the motorable
roads. Farming is the primary occupation in the area.
Socio-Economic Characteristics of Households
In total 195 households (Jhyaku 64, Nalang 64, Dalchowki 67) are surveyed in three
VDCs.
Table 6.2 Socio-economic characteristics of the households Socio-Economic Variable Jhyaku Nalang Dalchowki
Age of HH (Years) 54.67 48.75 48.37 Livestock (LSU) 1.87 1.58 1.72 Total landholding (ha) 1.32 0.73 0.50 Education of HH (Years) 2.11 1.63 2.69 Irrigated landholding (ha) 0.57 0.32 0.004 Total Income (NRs.) 63995 141887 245081 Time taken to reach road (hr) 1.59 0.17 0.44 Time taken to reach market (hr) 2.24 0.54 2.36 Time taken to reach livestock service center (hr) 2.39 0.75 2.00 Time taken to reach drinking water (hr) 0.23 0.21 0.08 Time taken to reach school (hr) 0.27 0.27 0.48 Time taken to reach health post (hr) 1.13 0.55 0.81 Time taken to reach agricultural service center (hr) 2.35 1.02 1.75 Non-farm income (NRs.) 61023 126815 137805
Source: Field survey 2012
Jhyaku being the largest VDC among three study area has the largest landholding per
household compared to Nalang and Dalchowki. Education of household head is very low
124
in all the VDC. Among three VDCs education is higher in Dalchowki though not much
different. Similarly, the total income and non-farm income is higher in case of Dalchowki
followed by Nalang and Jhyaku. Further, Nalang being more low lying VDC has better
infrastructure facility compared to other two VDCs as seen by time taken to reach the
facility. Among three VDC time taken to reach the infrastructure like road, agricultural
service center is highest in Jyanku due to its topographical as well as being remote than
other two VDCs. Dalchowki though is near to capital city Kathmandu has less
infrastructure development than Nalang which is mainly due to it topography. Further, in
all the VDCs there are no agricultural or livestock service center and much of the
information is provided through non-governmental organization working in their
respective areas. Household uses the agricultural and livestock service center facility
from nearby area, but very limited services are provided by them. In all the three VDCs
there are farmers’ group and mothers’ group which are helping them by providing
micro-credit facilities. Further all the VDCs have community forest group users which
are protecting the forest in their respective areas.

125
6.4 Result and discussion
6.4.1 Climatic trend of study households
It is important to understand the actual climate trend in the study area and how
farmers perceive these changes. As there are no meteorological stations in the study area
ArcGIS is used for determining the temperature and rainfall of each household. Kriging
method is used for interpolation of temperature and rainfall data from 1978 to 2011.
Kriging method in general is based on spatial dependence which is based on generalized
least square regression method and allows for knowing spatial dependence between
known points (Goovaerts, 2000).
Figure 6.1 shows that temperature in all the VDCs are increasing rapidly while
rainfall is in decreasing trend. The temperature is increasing fastest in Jhyaku with the
coefficient of 0.08 while it is increasing at 0.0505 and 0.0506 in Nalang and Dalchowki,
respectively. Rainfall is found to be very erratic in nature in all the VDC and is found to
be decreasing fastest in Nalang followed by Jhyaku and Dalchowki with the coefficient of
-0.56, -0.32, and -0.07, respectively. The trend analysis shows that all the households are
experiencing increase in the climatic extremes as rainfall is erratic in nature with
increasing temperature.

126
a
b
c
Figure 6.1 Temperature and rainfall trend of Jhyaku (a), Nalang (b) and Dalchowki (c)
y = 0.0826x + 16.839
R² = 0.2701
y = -0.3177x + 162.56
R² = 0.0334
0
50
100
150
200
0
5
10
15
20
25
19
78
19
80
19
82
19
84
19
86
19
88
19
90
19
92
19
94
19
96
19
98
20
00
20
02
20
04
20
06
20
08
20
10
Ra
infa
ll m
m
Tem
pera
ture
ºC
Temperature Rainfall
y = 0.0505x + 18.91
R² = 0.3726
y = -0.5576x + 182.19
R² = 0.0562
0
50
100
150
200
250
16
17
18
19
20
21
22
19
78
19
80
19
82
19
84
19
86
19
88
19
90
19
92
19
94
19
96
19
98
20
00
20
02
20
04
20
06
20
08
20
10
Ra
infa
ll m
m
Tem
pera
ture
ºC
Temperature Rainfall
y = 0.0506x + 18.075
R² = 0.2684
y = -0.0715x + 137.56
R² = 0.0009
0
50
100
150
200
250
15
16
17
18
19
20
21
19
78
19
80
19
82
19
84
19
86
19
88
19
90
19
92
19
94
19
96
19
98
20
00
20
02
20
04
20
06
20
08
20
10
Ra
ifall
mm
Tem
pera
ture
ºC
Temperature Rainfall

127
a
b
c
Figure 6.2 Rainfall trend of Jhyaku (a), Nalang (b) and Dalchowki (c) from 2001-2011
y = 0.1168x + 18.183
R² = 0.3701
y = -1.7298x + 163.22
R² = 0.0812
0
50
100
150
200
16.5
17
17.5
18
18.5
19
19.5
20
20.5
21
Ra
infa
ll m
m
Tem
pera
ture
ºC
Temperature Rainfall
y = 0.1341x + 19.427
R² = 0.5251
y = -5.2196x + 196.45
R² = 0.5151
0
50
100
150
200
250
18.5
19
19.5
20
20.5
21
21.5
22
Ra
infa
ll m
m
Tem
pera
ture
ºC
Temperature Rainfall
y = 0.1444x + 18.444
R² = 0.4952
y = -5.327x + 167.35
R² = 0.3415
0
50
100
150
200
250
17
17.5
18
18.5
19
19.5
20
20.5
21
Ra
infa
ll m
m
Tem
pera
ture
ºC
Temperature Rainfall

128
Further study also analyses the temperature and rainfall trend for the past 10 years
(2001 to 2011) in order to see if there is any change in the recent climatic pattern which
might influence the people perception. The study uses the interpolated temperature and
rainfall data of households. The analysis shows households are experiencing increase in
temperature in all the VDC (Figure 6.2). Temperature is increasing fastest in Dalchowki
with the coefficient of 0.14 (R2 value of 0.49) followed by Nalang with the coefficient of
0.13 (R2 value of 0.53) and Jhyaku with the coefficient of 0.12 (R2 value of 0.37).
Similarly rainfall is decreasing fastest in Dalchowki with the coefficient of -5.33 (R2
value of 0.34 followed by Nalang with the coefficient of -5.22 (R2 value of 0.53) and
Jhyaku with the coefficient of -1.73 (R2 value of 0.08). The direction of increase in
temperature and decrease in rainfall is similar to the long term change for all the VDCs.
Further in Dalchowki, temperature is increasing fastest for the last 10 years compared to
other two VDC. Similarly, rainfall is also found to be decreasing fastest in Dalchowki for
the last 10 years.
6.4.2 Perception of Climate Change
Out of 195 surveyed households around 58% of household indicated that temperature
is rising, while around 39% stated there is no change and around 2% indicated decrease in

129
temperature. In addition to this, around 72% indicated that there is decrease in rainfall,
while around 25% stated that there is no change in rainfall and 3% indicated increase in
rainfall in the study area. This shows that majority of the households’ perception
regarding temperature and rainfall are in line with the temperature and rainfall trend of
the area as revealed by the data of local observation of meterological and hydrological
station.
In case of Jhyaku VDC, 58% indicated that there is increase in temperature while
42% indicated no change in temperature. Also 63% indicated decrease in rainfall, 34%
stated no change in rainfall and 3% indicated increase in rainfall. In case of Nalang VDC,
28% stated increase in temperature, while 67% indicated no change and 5% indicated
decrease in temperature. In addition to this, 25% indicated increase in rainfall, 6%
indicated no change in rainfall and 69% stated decrease in rainfall. In case of Dalchowki
VDC, 88% indicated increase in temperature, 10% indicated no change and 1% indicated
decrease in temperature. Further, 88% reported decrease in rainfall, while 12% indicated
no change in rainfall. As temperature and rainfall is increasing fastest in the last 10 years,
higher numbers of households in Dalchowki are able to perceive changes in temperature
and rainfall in line with the trend. The results showed that households are more able to
grasp changes in rainfall than temperature as majority of people are able to perceive

130
changes in rainfall in line with the actual trend as agriculture is mainly rain-fed in nature
and their main livelihood option. This finding can be said to be in line with the similar
findings by Piya, Maharjan and Joshi (2012).
a b
Figure 6.3 Perception of people to temperature (a) and rainfall (b) in study area
Households also identified some of the impacts due to change in the current climatic
pattern as shown in Table 6.2. The 53.8% of households in the study VDCs states that
monsoon is coming late which is affecting their agriculture season. Further, 80% of
households states that there has been decrease in winter rainfall, especially in Dalchowki
(94%), and also there has been increase in the drought. In addition to this, 58.5%
households also states that there has been increase in the mosquito in the area, especially
in Nalang (79.7%). The 49.7% of the households in study area indicate that plantation
day has been changed especially of maize by one month (from end of March to beginning
0102030405060708090
100
Perc
en
tage
Increase No Change Decrease
0
20
40
60
80
100
Perc
en
tage
Increase No change Decrease
Source: Field Survey 2013

131
of May). The change in plantation day of maize has decreased the production of maize in
the study area. Further 26.7% of households states that there has been change in the
flowering day few plants like mustard and plump. The change in flowering period will
increase the incidence of pest infestation and will impact the agricultural production.
There has been increase in the incidence of crop disease especially in vegetables as stated
by 37.9% of the households. According to 54.4% of the households, there has been
decrease in the availability of forest grass. In addition to decrease in the availability of
grass, there has also been incidence of invasion from new species like Ageratina
adenophora especially in Nalang VDC which they mainly attribute to increasing
temperature. Additionally, the people also identified that there has been gradual decrease
in the availability of water resources in the area which they attributes to both increase in
temperature as well as deforestation.
Table 6.3 Household perception of Climate Change Impacts
Events
Jyanku Nalang Dalchowki Total
Yes No Don't
know Yes No
Don't
know Yes No
Don't
know Yes No
Don't
know
Late Monsoon 28.1 71.9 0.0 50.0 46.9 3.1 82.1 17.9 0.0 53.8 45.1 1.0
Decreased Winter rain 82.8 10.9 6.3 62.5 20.3 17.2 94.0 0.0 6.0 80.0 10.3 9.7
Increased Mosquito 42.2 51.6 6.3 79.7 9.4 10.9 53.7 25.4 20.9 58.5 28.7 12.8
Change in plantation day 35.9 64.1 0.0 45.3 54.7 0.0 67.2 32.8 0.0 49.7 50.3 0.0
Change in Flowering day 29.7 70.3 0.0 21.9 78.1 0.0 28.4 71.6 0.0 26.7 73.3 0.0
Increase in Disease 34.4 65.6 0.0 43.8 54.7 1.6 35.8 64.2 0.0 37.9 61.5 0.5
Decrease in forest grass 59.4 40.6 0.0 56.3 42.2 1.6 47.8 25.4 26.9 54.4 35.9 9.7
Source: Field Survey 2013
132
6.4.3 Adaptation practices in the Study Area
This section of paper deals with the various adaptation practices that households are
adopting in their farming activities. Since the mid hills are prone to natural hazards like
landslides, soil conservation practice is a must (Piya, Maharjan & Joshi, 2012). Also
climate change will have significant impact on water resources, so water conservation
practices are a must for adapting to climate change as also identified by the households.
Based on these two adaptation practices, surveyed households identified 18 different
types of adaptation practices. It is seen that around 90% of the households are adopting at
least one of the adaptation practices and around 10% of households did not have any
adaptation practices. The 18 different adaptation practices are categorized into 9 different
adaptation practices in this study. The most common practice that most of the households
implemented is agroforestry (74%), since there has been decrease in the availability of
grass in the forest as well as for prevention against soil erosion. Followed by this few of
the adaptation practices that households implemented are soil conservation (64%) by
planting legumes and covering soil from erosion, water conservation (61%) by building
water tank, rain water harvesting. The reason for high number of households practicing
water conservation practices is mainly due to scarcity of water due to erratic rainfall and
increase temperature. It is seen that prioritizing livestock (11%) and drought resistant

133
crop (10%) are the least favoured adaptation practices as there has been decrease in the
availability of grass in the forest.
Figure 6.4 Adaptation practices adopted by households
Most of the adaptation practices identified by the households are traditional practices
which are in response to changes in their daily life due to climatic and non-climatic
factors. Further these practices are based on local knowledge and are event specific in
nature. The common barriers for adoption of adaptation practices identified by the
households are lack of knowledge, financial sources and water resources.
6.4.4 Socio-economic Factors Affecting Adaptation to Climate Change
For determining the factors affecting perception of and adaptation to climate change
Heckman Selection model is run for its appropriateness and the result indicated that the
Likelihood test of independence of error terms is accepted (Wald Χ2 4.55, with p = 0.033).
01020304050607080
Adop
tion
Perc
enta
ge
Source: Field Survey 2013

134
Also, the likelihood function of Heckman selection model is significant (Wald Χ2 19.12,
with p = 0.095) indicating high explanatory power.
The result from the regression analysis shows that explanatory variables like
landholding, time taken to reach market significantly explains the adoption of adaptation
practices as expected except time taken to reach the livestock service. The increase in the
unit landholding size will significantly increase the adoption probability of adaptation
practices by 0.173 (Table 6.2). The result is in line with the argument that with increase
in the possession of assets like landholding, there will be higher adoption probability of
adaptation practices as they will have better assess to resources (Gbetibouo 2009; Below
et al. 2012). Further, unit decrease in time taken to reach the market will increase the
adoption probability of adaptation practices by 0.130 (Table 6.2). With decrease in time
taken to reach the market the farmers will have more access to market which will increase
the adoption probability of adaptation practices. This finding is similar to Hassan &
Nhemachena (2008) which states that with increase in access to market, farmers will have
more accessibility of inputs and information which will help in adoption of adaptation
practices. Also with improvement in the market farmers can diversify their livelihood
strategies and also able to increase their income source (IFAD, 2003). With diverse
livelihood option and increase income, farmers will have more financial resources which
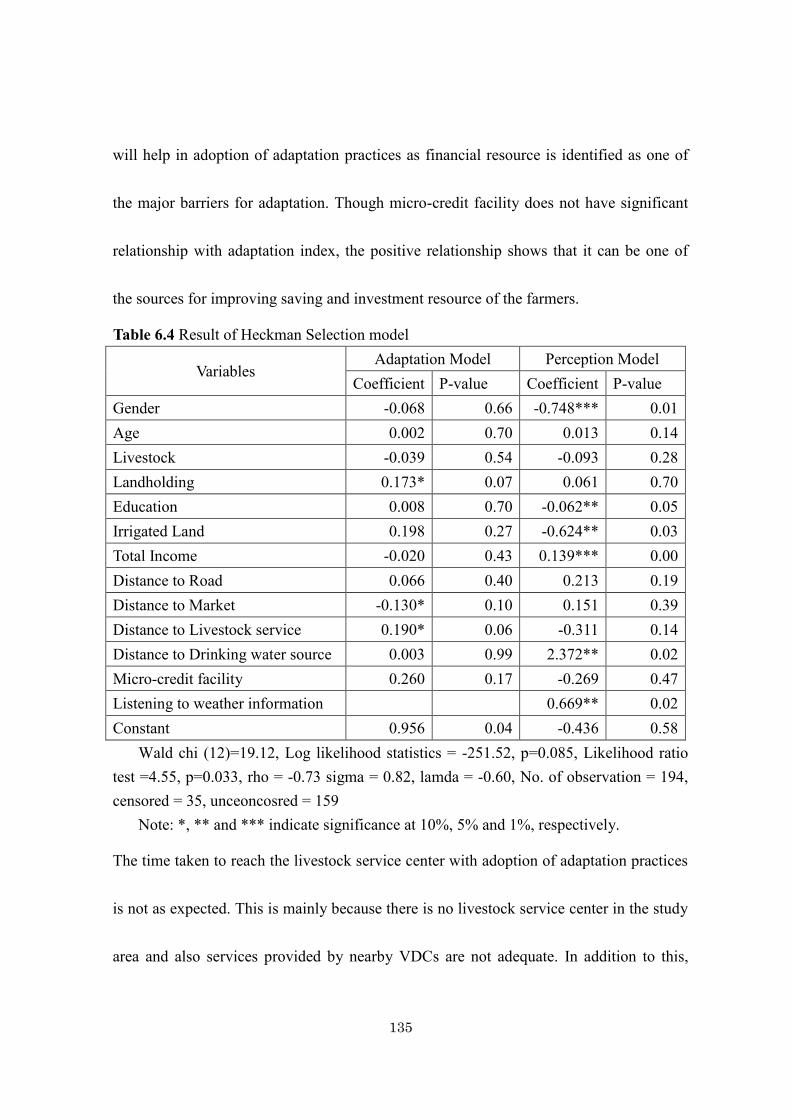
135
will help in adoption of adaptation practices as financial resource is identified as one of
the major barriers for adaptation. Though micro-credit facility does not have significant
relationship with adaptation index, the positive relationship shows that it can be one of
the sources for improving saving and investment resource of the farmers.
Table 6.4 Result of Heckman Selection model
Variables Adaptation Model Perception Model
Coefficient P-value Coefficient P-value Gender -0.068 0.66 -0.748*** 0.01 Age 0.002 0.70 0.013 0.14 Livestock -0.039 0.54 -0.093 0.28 Landholding 0.173* 0.07 0.061 0.70 Education 0.008 0.70 -0.062** 0.05 Irrigated Land 0.198 0.27 -0.624** 0.03 Total Income -0.020 0.43 0.139*** 0.00 Distance to Road 0.066 0.40 0.213 0.19 Distance to Market -0.130* 0.10 0.151 0.39 Distance to Livestock service 0.190* 0.06 -0.311 0.14 Distance to Drinking water source 0.003 0.99 2.372** 0.02 Micro-credit facility 0.260 0.17 -0.269 0.47 Listening to weather information 0.669** 0.02 Constant 0.956 0.04 -0.436 0.58
Wald chi (12)=19.12, Log likelihood statistics = -251.52, p=0.085, Likelihood ratio test =4.55, p=0.033, rho = -0.73 sigma = 0.82, lamda = -0.60, No. of observation = 194, censored = 35, unceoncosred = 159
Note: *, ** and *** indicate significance at 10%, 5% and 1%, respectively.
The time taken to reach the livestock service center with adoption of adaptation practices
is not as expected. This is mainly because there is no livestock service center in the study
area and also services provided by nearby VDCs are not adequate. In addition to this,

136
there are non-governmental organizations (NGOs) working in agriculture and livestock
services which provide information and knowledge for adaptation in the study areas. As
expected time taken to reach drinking water source, information heard about weather in
radio and female are significantly more likely to perceive changes in climate having
coefficients of 2.372, 0.669 and -0.748, respectively (Table 6.2). Listening to weather
related information plays important role for farmers to perceive the change in the climate,
as seen in case of Deressa et al. (2009) and Deressa, Hassan, & Ringler (2011). The result
also indicates that female will perceive change in climate more than male. This is mainly
due to the fact that female are responsible for household chores like fetching the drinking
water especially in rural area of Nepal. So, if there is water scarcity due to changing
climate they need to travel far and will perceive change in climate better. Also with
increase in the time taken to reach the drinking water source, the probability of perceiving
climate change increases. As expected farmers having facility of irrigation will perceive
less about the climate change (having coefficient of -0.613). As farmers have irrigation
facilities they will be more resilient to climate change and hence will care less about it
which is in line with the study done by Gbetibouo (2009). Further, as expected any unit
increase in the income of farmers will increase the probability of farmers perceiving
climate change by 0.138 which is in line with Semenza, et al. (2008). With increase in the
137
income level farmers will have more access to information, inputs and resources for
adopting new adaptation practices. In contrary to the expected result education has
negative relation with the perception of climate change (having coefficient of -0.061).
This may be because with increase in education level people will have more opportunity
to work in different sectors and have diverse livelihood strategies, so they will pay less
attention to climate (Piya, Maharjan, & Joshi, 2012).
6.4 Conclusion
Understanding the actual climatic condition and the perception of farmers in the area
is important as they have to adapt to the changing condition. The temperature is in
increasing trend where as rainfall is in decreasing trend in the study area. Farmers are
more sensitive to notice change in the rainfall than change in temperature. Eighteen
different adaptation practices (categorised to nine) are identified which are being
practised by farmer to adapt to climate change. It is seen that majority of the farmers
adopt locally available practices like agroforestry and soil conservation strategy to
prevent against natural hazards like landslide, soil erosion. Also another important
adaptation strategy that farmers are adapting more is conservation of water by building
water tanks and rain water harvesting to cope with water stress during the dry season.
The study uses the Heckman Selection method for analysing the factors guiding the

138
farmers’ perception of climate change and their adaptation. The analysis shows that for
farmers to adapt to climate change they first need to perceive the change. The result
indicated that listening to weather information, time taken to reach drinking water source,
female, total income have positive relationship with the farmers’ perception of climate
change. Farmers’ adaptation practices are determined by the factors like landholding and
time taken to reach market. This result indicated number of measures to be considered
while planning any adaptation program in the area like investing for increasing the
income and other assets, developing access to market. Also, there is need to raise the
awareness of farmers to climate change by providing information regarding the climate
for them to perceive the change which will help in adoption of adaptation practices.
Finally for farmers to adapt to climate change, developmental plans along with the
information and awareness regarding climate change should be emphasized.

139
Chapter VII
7. Climate Change Vulnerability and Resilience of Farmers
7.1 Introduction
Climate change is posing challenges to human as well as natural system especially in
the least developed countries. The impact of climate change differs according to different
regions and environmental condition. The developing countries are more vulnerable to
climate change as they lack resources for adaptation (UNFCCC, 2007). Vulnerability is
not only dependable on the effect of climatic stress but also on socio-economic structure,
which mainly contributes to adaptive capacity and sensitivity (Tesso, Emana, & Ketema,
2012). There has been number of studies regarding vulnerability in different sectors such
as water, agriculture and taking different aspect such as socio-economic, environmental
and so on. To understanding local level vulnerability, there is need to take account the
household level vulnerability which will help to tackle climate change problems by better
understanding their needs (Tesso, Emana, & Ketema, 2012). On the other hand resilience
to climate change is important issue to understand the farmers’ ability to deal with the
climatic stresses and disturbances. The study uses the integrated assessment approach
which combines both socio-economic vulnerability as well as biophysical vulnerability.
There are different methods and practices for combining socioeconomic and

140
environmental indicators. For first instance it is considered that all indicators of
vulnerability has equal importance and thus equal weight (Cutter, et al., 2008). The
second approach includes using different weights for different indicators. This approach
includes different methods like expert judgment, PCA and so on. Principal component
analysis is used in this study as it identifies the similarities and differences in the data
(Smith, 2002). The analysis of vulnerability to climate change in this research is based on
integrated assessment method taking into consideration of both soico-economic and
environmental aspect.
7.1.1 Relation between Resilience and Vulnerability
Resilience and vulnerability are very much interlinked with each other in context of
climate change. As climate change is overlying and interacts with non-climatic factors,
taking its impact as starting point of analysis has serious limitations (Speranza, 2010).
This is mainly due to the fact that the impact of climate change is uncertain, with GCM
sending confusing signals and treating mainly the symptoms and not the cause, especially
by focusing just the impact (Speranza, 2010). So, for measuring the impact of climate
change another approach has to be taken, i.e., vulnerability and resilience approach. So
for this we need to understand the relationship between vulnerability and resilience.

141
According to Turner II (2010) in coupled human-environment systems resilience and
vulnerability at its fundamental level constitute different but complimentary framing. The
vulnerability tries to identify the most affected negatively of system to disturbances while
resilience tries to identify the characteristics that make systems more robust to
disturbances (Turner II, 2010). Further in coupled human-environment systems
framework, resilience is employed as coping capacity in vulnerability research (Turner II,
et al., 2003), whereas according to Folke et al. (2002) resilience views vulnerability as an
antonym for its label. In addition to this, Adger (2006) states that vulnerability and
resilience “have common elements of interest - the shocks and stresses experienced by
the social-ecological system, the response of the system, and the capacity for adaptive
action.” He recognizes three features of social-ecological systems: biological and
biophysical processes of natural systems; rules and institutions of social systems; and
knowledge, experience, and ethics that bond the social to the natural system. Further, he
states that elements of socio-ecological resilience, “the ability to absorb the shocks, the
autonomy of self-organisation and the ability to adapt both in advance and in reaction to
shocks,” will impact vulnerability. According to Folke (2006) resilience considers
adaptation, learning, and self-organization and provides adaptive capacity. Also Folke
(2006) implies that beyond adaptation resilience also considers responding to a current

142
situation, transformation that implies improving social-ecological systems through
adaptive governance. Further resilience and vulnerability also has some differences as
given by Speranza (2010):
Resilience factors
- Moderating impacts and outcomes
– Protective factors and processes
Resilience approach
– Reflecting strengths
– Recognising capacities and competencies (actors as competent social agents)
– Reflecting sustained competence / functioning
Vulnerability factors
– Exacerbating impacts and outcomes
– Fostering exposure (risks)
Vulnerability approach
– Emphasises problems or deficits
– Emphasises dependencies on others for survival and development
As there are some differences among the factors and approach, it becomes very
important to consider both in climate change researches. Also, the literature on

143
vulnerability and resilience can give insights which are very important for adaptation and
mitigation to climate change.
7.1.2 Importance of assessing vulnerability and resilience at local level
It is important to assess vulnerability and resilience at local level as impact of climate
change will be felt at local level. The assessment of climate change impact at local level
offers opportunity to understand how any change in ecosystem has an effect on human
communities culturally, socially, economically, and politically (Duerden, 2004). Duerden
(2004) describes that human activity will change with their experience of climate change
impact felt at local level. In addition to this Smit and Wandel (Smit & Wandel, 2006)
describe that human takes action and strategies to reduce vulnerability at the local level or
'community scale'. Further, Duerden (2004) states that “While many prognoses about
change are made on a large scale, human activity is highly localized, and impacts and
responses will be conditioned by local geography and a range of endogenous factors,
including demographic trends, economic complexity, and experience with 'change' in a
broad sense”. Also, according to Adger (2006) communities recognize risk or
vulnerability in terms of their specific cultural, economic, social, environmental, and
political characteristics.

144
Understanding and assessing vulnerability and resilience from the multi-sector view
and combining them is very important for any policy intervention or planning for the
adaptation to climate change impact in the local level. According to Wesche and
Armitage (2006) communities offer understanding of change in environment based on
multiple knowledge systems, including local and traditional knowledge, and how these
have impact on their ability to adapt to changes (cited by MacKendrick, 2009). Ford and
Smit (2004) describe how indigenous communities of the Arctic that follow traditional
lifestyles have been shown to be disproportionately vulnerable to climate change;
however, they have also been shown to possess considerable capacity, or adaptability, to
address climate change. “Studies that are highly localized can identify community
specific concerns that may be overlooked in regional scale analyses and serve as a
valuable tool for local empowerment and information exchange” (Duerden and Beasley,
2006 cited by MacKendrick, 2009). Also, it is important to understand impact of climate
change at local level due to social differentiation (Ford, Smit, Wandel, & MacDonald,
2006) since the ones that can use resource more efficiently can adapt more to the climate
change and be more resilient.

145
7.1.3 Vulnerability to climate change in Nepal
There are very limited literatures that have focused on understanding local level
vulnerability to climate change in Nepal. The study done by Piya, Maharjan & Joshi
(2012) states that vulnerability mainly dependent on the adaptive capacity. Similarly,
according to Lama and Devkota (2009) adaptive capacity plays crucial role in
categorizing the vulnerability of the community or area.
Cases of Chitlang and Namsaling
Vulnerability of Chitlang of Makwanpur district and Namsaling of Ilam district is
assessed for conceptualizing how vulnerability differs according to region and community.
The objective of this vulnerability assessment is to conceptualize difference in
vulnerability of farmers to climate change according to different area and also understand
how farmers perceive changes in climate. The study uses the indicator method and
assesses based on IPCC definition of vulnerability. The study uses PCA to give weights to
the indicators. The assessment of vulnerability in both the study area showed that poorest
people are the most vulnerable group and as income increases the vulnerability decreases.
Further, it is seen that in Chitlang, vulnerability is high due to higher extreme climate
since geography of the district is quite fragile and is prone to floods and landslides. The

146
assessment of vulnerability shows that the adaptive capacity of the different regions
depends on different socio-economic variables. In the case of Chitlang, the income from
agriculture, landholding, livestock holding and irrigation played a major part in
adaptation. While in the case of Namsaling VDC, reach to infrastructure such as roads,
health facilities, schools, markets, agricultural services and livestock services played
major role in adaptation and their overall vulnerability.
For understanding vulnerability, it is very imperative to acknowledge the perception
of households as it determines the adaptation process. It is observed that the majority of
households do not have any knowledge regarding the term climate change in both VDCs.
But, when asked about how temperature and precipitation are changing in the area farmer
do feel some changes on it. In Chitlang, majority of surveyed households do not feel any
changes in temperature of summer and winter. But in Namsaling majority of households
perceive increase in summer and winter temperature. This difference in perception of two
VDCs may be due to households in Namsaling are dependent on farming only while in
case of Chitlang they have prospect for other livelihood opportunities being closer to
Kathmandu. Further, in Chitlang households perceive that winter temperature has
decreased which they attributed to change in micro-climate due to the effect of the
Kulekhani hydropower dam. Similarly, regarding perception of changes in rainfall half of

147
the surveyed households do not notice any changes in Chitlang while in Namsaling only
majority perceived changes in rainfall pattern. This difference may be due to availability
of better irrigation facility in Chitlang than Namsaling. In addition to this, households in
study area noticed change in harvesting period of maize which has shifted around one
month late. Also farmers noticed change in ripening of fruits 15 days earlier along with
broom grass which also ripened earlier. Further, households started to notice mosquitoes
in the higher altitude where they were not seen previously.
7.2 Methodology
Resilience and vulnerability is interlined with each other and can be embedded in one
another. This means ones component can be embedded into another. So there is need to
understand how changes in the climate will have an impact for which we need to consider
vulnerabilities. Resilience means reducing the vulnerabilities but it also adds other
dimensions of time and dealing with uncertainties (Gitz & Meybeck, 2012). According to
IPCC Fourth Assessment Report vulnerability may be formulated as:
Vulnerability3 = Exposure + Sensitivity – Adaptive Capacity ………7.1
In this study adaptation practices adopted by the farmers are taken as the ability to
3 The study measures the relative vulnerability among households in the study area.

148
absorb shocks which they have been practicing for long period. Further vulnerability to
climate change will cover the aspect of self-organization and adaptive capacity. Hence
resilience is measured as:
Resilience Index = Ability to absorb shocks – Vulnerability ……………7.2
PCA is used to give weights to the indicators. To ensure that high index values
indicate high vulnerability in all cases, we reverse the index values by using [1 – index
value] for indicators hypothesized to increase vulnerability. The indicators of
vulnerability are taken from literature review and shown in Table 7.1.
Table 7.1 Indicators for Vulnerability Vulnerability components
Vulnerability Determinants
Indicators Description Measurement Unit
Remarks
Adaptive Capacity
Buffering Capacity
Wealth Land holding Radio/mobile holding Livestock ownership Agricultural cash income Non-agricultural cash income Total Income Irrigated landholding Human Capital Dependency ratio Education Infrastructure Time taken to reach
Hectare (ha) Number LSU4 Rupees Rupees Rupees Hectare Highest Education of HHH Hour
Higher the value lesser the vulnerability
4 Livestock Unit (LSU); conversion factor: cattle (0.5), buffalo (0.5), sheep and goats
(0.10), pigs (0.20) and poultry (0.01). Source: FAO (2005)

149
facilities (road, health post, agriculture services, livestock services, agrovet, market)
Lesser the time taken to reach to these services lesser the vulnerability.
Self organization
Saving No. of Crops
Rupees Number
Higher the self capacity lower the vulnerability
Capacity to learn
Perception to climate change
If notices changes vulnerability decreases
Sensitivity Extreme climate
Frequency of natural disasters Land damaged due to natural hazard Agricultural production damaged due to natural hazard Livestock killed due to natural hazard
Coefficient from trend analysis
Higher the frequency and casualties from natural disaster higher the vulnerability
Exposure Change in climate
Annual change of temperature Annual change of precipitation
Coefficient from trend analysis
Higher the annual change of temperature and precipitation higher the vulnerability
Households were classified into five different groups depending upon vulnerability
for descriptive analysis as:
1. Very High Vulnerable (V.H.V)
2. High Vulnerable (H.V.)
3. Moderate Vulnerable (M.V.)
4. Low Vulnerable (L.V)

150
5. Very low vulnerable (V.L.V)
Further resilience of household is analysed as a function of absorption of shock and
vulnerability. The absorption of shock is taken as function of adaptation index. The
adaptation index implies how they are adapting to the current changes after they have
absorbed the shocks of natural hazards. Also, households were classified into five
different classes based on their resilience as:
1. Very High Resilience (V.H.R)
2. High Resilience (H.R.)
3. Moderate Resilience (M.R.)
4. High Resilience (H.R.)
5. Very High Resilience (V.H.R.)
Determinants of Resilience
Multiple regression analsyis is used to identify the determinants of households’
resilience to climate change.
Yj = α + 𝛽1X1j + ………..+ 𝛽 kXkj + Uj …………………….7.3
Yj is the level of resilience. The Xij are the explanatory variables for resilience while
𝛽 are the coefficient of the explanatory variables and α is the constant and Uj error term.

151
7.3 Result and Discussion
7.3.1 Vulnerability and Resilience of Farmers
The integrated vulnerability assessment approach here focused on both the social as
well as climatic factors. As individual differ from each other from perspective of both
being affected by climate change as well as socio-economic factors, their vulnerability
also differs from households to households. The PCA analysis for vulnerability shows
that nine components having Eigen value greater than 1 and accounting for around 67%
of the total variance (Figure7.1). The heaviest loading from these nine components are
used to give weights to the variables for vulnerability analysis.
Figure 7.1 Principal component having Eigenvalue more than 1
Further based on the nine principal component scores adaptive capacity can be
categorized as infrastructure, income, resources and information, education, asset
possession and agricultural diversification, institution, school, perception. Similarly
sensitivity can be categorized as sensitivity due to damages to resources and sensitivity
0
0.02
0.04
0.06
0.08
0.1
0.12
0.14
0.16
0.18
0.2
PC1 PC2 PC3 PC4 PC5 PC6 PC7 PC8 PC9
Va
riab
ilit
y %

152
due to food security. Further, exposure can be categorized as climatic extremes due to
rainfall, and increasing natural hazards with temperature.
Table 7.2 PCA score of indicators for vulnerability Variables Vulnerability
PCA Score Education (No. of years of education of HHH) 0.4494 Livestock (LSU) 0.3154 Irrigated Land (Hectare) 0.3698 Total Landholding (Hectare) 0.3394 Mobile (Yes/No) 0.3181 Radio (Yes/No) 0.5235 Total saving (NRs.) 0.4746 Off-farm Income (NRs.) 0.179 Total Income (NRs.) 0.3238 Agricultural income (NRs.) 0.3929 Time taken to reach road (Hour) 0.3194 Time taken to reach water source (Hour) 0.417 Time taken to reach school (Hour) 0.4973 Time taken to reach health service (Hour) 0.3869 Time taken to reach agriculture Service centre (Hour) 0.3645 Time taken to reach livestock service centre (Hour) 0.3634 Time taken to reach agrovet centre (Hour) 0.3412 Time taken to reach market (Hour) 0.3083 Dependency ratio 0.2148 Climate change perception (Yes/No) 0.1526 No. of Crops (Number) 0.3118 Temperature (Coefficient) 0.059 Rainfall (Coefficient) 0.403 Frequency of Natural hazard (Total number) 0.1581 Damage to Land (Hectare) 0.2873 Damage to agricultural production (Kg) 0.6242 Livestock lost (LSU) 0.162

153
Figure 7.2 Vulnerability of households according to different categorizes
After obtaining the weight from PCA vulnerability is calculated as the function of
exposure, sensitivity and adaptive capacity. From PCA it is seen that infrastructure like
school and water resources and saving played an important role in increasing the
household adaptive capacity as it has higher weights. Further, the study categorized the
households into five different groups according to their vulnerability (Figure 7.2). The
analysis shows that vulnerability mainly dependent on the adaptive capacity of the
households as well as their exposure (Figure 7.2).
In addition to this, the analysis shows that around 22% of households have relatively
very low vulnerability while only one household belongs to very highly vulnerable in the
study area (Figure 7.3). The majority of households are in the group ranging from low
vulnerability to moderate vulnerability.
-2.50
-2.00
-1.50
-1.00
-0.50
0.00
0.50
1.00
1.50
2.00
2.50
3.00
V.H.V H.V M.V L.V V.L.V
Adaptation Sensitivity Exposure Vulnerability

154
Figure 7.3 Percentage of Households in different category of vulnerability
Figure 7.4 Adaptive capacity, exposure, sensitivity and Vulnerability of households according to study VDC
In Figure 7.4, it is seen that vulnerability is highest for Jhyaku since it has the lowest
adaptive capacity and high exposure. Nalang has the lowest vulnerability as it has the
highest adaptive capacity and the lowest exposure (Figure 7.4). Vulnerability of
0.51
7.69
30.77
38.97
22.05
V.H.V H.V M.V L.V V.L.V
-5
-4
-3
-2
-1
0
1
2
3
4
5
Jyanku Nalang Dalchowki
Adaptation Sensitivity Exposure Vulnerability

155
Dalchowki lies between Jhyaku and Nalang as it has moderate adaptive capacity and
highest exposure VDCs (Figure 7.4). This further adds to the earlier finding that
vulnerability is determined mainly by adaptive capacity, while exposure also plays a
crucial role.
In addition to this, households are classified according to vulnerability in each VDC.
In Nalang there are no households that fall in the category of very high vulnerable and
high vulnerable while in Dalchowki there are no households that fall in cateogory of very
very high vulnerability (7.5). The analysis shows that with increasing vulnerability there
is steady decrease in adaptive capacity in all the VDCs while exposure also plays an
important role.
The adaptation index is classified according to different vulnerable groups. It is seen
that adaptation index is the highest for households that have modearate vulnerability and
increases slightly with decerasing vulnerability. This indicates that housholds adaptation
practices are helping farmers to decrease their vulnerability (Figure 7.6). As most of the
households are mainly practicing the traditional adaptation practices, with additional
burden of climate change they might not be able to cope in the future.
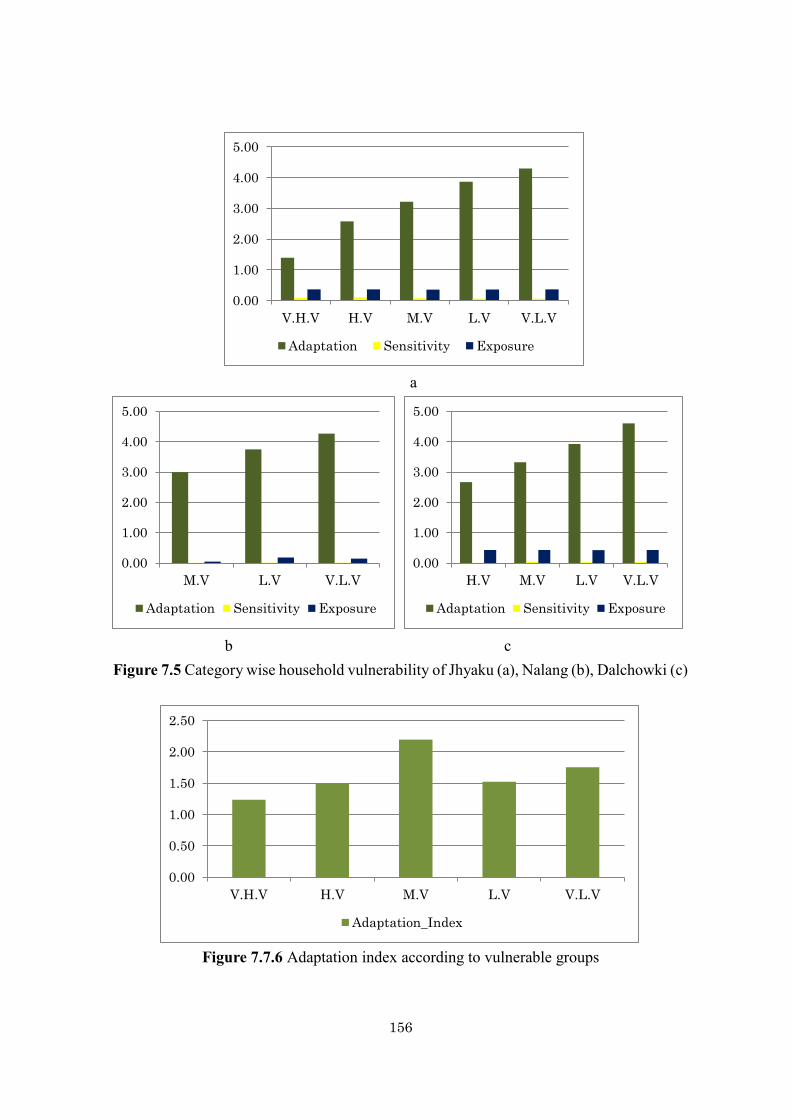
156
a
b c
Figure 7.5 Category wise household vulnerability of Jhyaku (a), Nalang (b), Dalchowki (c)
Figure 7.7.6 Adaptation index according to vulnerable groups
0.00
1.00
2.00
3.00
4.00
5.00
V.H.V H.V M.V L.V V.L.V
Adaptation Sensitivity Exposure
0.00
1.00
2.00
3.00
4.00
5.00
M.V L.V V.L.V
Adaptation Sensitivity Exposure
0.00
1.00
2.00
3.00
4.00
5.00
H.V M.V L.V V.L.V
Adaptation Sensitivity Exposure
0.00
0.50
1.00
1.50
2.00
2.50
V.H.V H.V M.V L.V V.L.V
Adaptation_Index
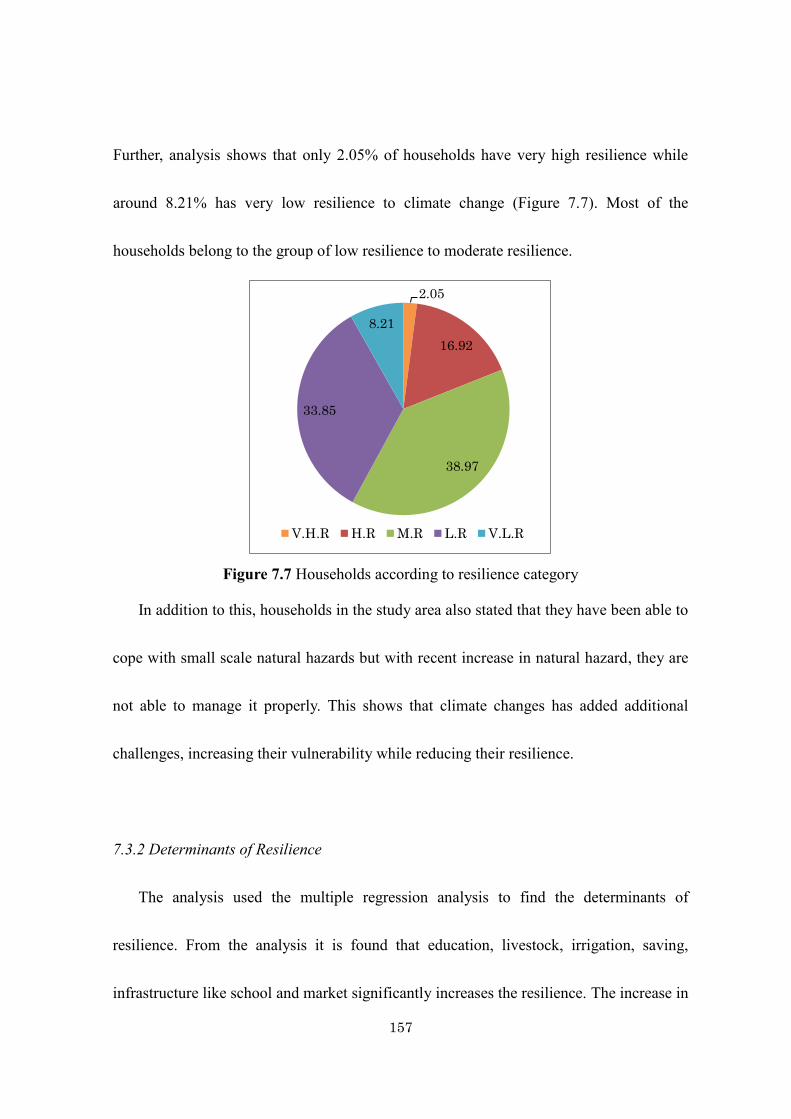
157
Further, analysis shows that only 2.05% of households have very high resilience while
around 8.21% has very low resilience to climate change (Figure 7.7). Most of the
households belong to the group of low resilience to moderate resilience.
Figure 7.7 Households according to resilience category
In addition to this, households in the study area also stated that they have been able to
cope with small scale natural hazards but with recent increase in natural hazard, they are
not able to manage it properly. This shows that climate changes has added additional
challenges, increasing their vulnerability while reducing their resilience.
7.3.2 Determinants of Resilience
The analysis used the multiple regression analysis to find the determinants of
resilience. From the analysis it is found that education, livestock, irrigation, saving,
infrastructure like school and market significantly increases the resilience. The increase in
2.05
16.92
38.97
33.85
8.21
V.H.R H.R M.R L.R V.L.R
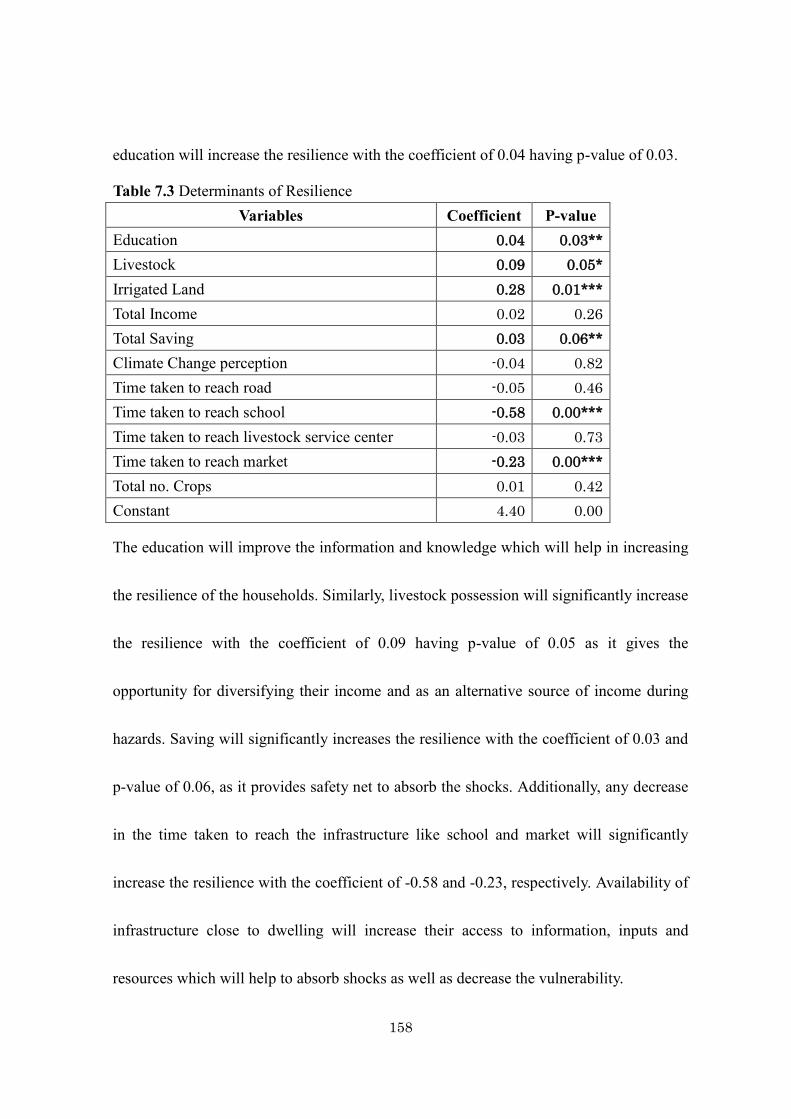
158
education will increase the resilience with the coefficient of 0.04 having p-value of 0.03.
Table 7.3 Determinants of Resilience Variables Coefficient P-value
Education 0.04 0.03**
Livestock 0.09 0.05*
Irrigated Land 0.28 0.01***
Total Income 0.02 0.26
Total Saving 0.03 0.06**
Climate Change perception -0.04 0.82
Time taken to reach road -0.05 0.46
Time taken to reach school -0.58 0.00***
Time taken to reach livestock service center -0.03 0.73
Time taken to reach market -0.23 0.00***
Total no. Crops 0.01 0.42
Constant 4.40 0.00
The education will improve the information and knowledge which will help in increasing
the resilience of the households. Similarly, livestock possession will significantly increase
the resilience with the coefficient of 0.09 having p-value of 0.05 as it gives the
opportunity for diversifying their income and as an alternative source of income during
hazards. Saving will significantly increases the resilience with the coefficient of 0.03 and
p-value of 0.06, as it provides safety net to absorb the shocks. Additionally, any decrease
in the time taken to reach the infrastructure like school and market will significantly
increase the resilience with the coefficient of -0.58 and -0.23, respectively. Availability of
infrastructure close to dwelling will increase their access to information, inputs and
resources which will help to absorb shocks as well as decrease the vulnerability.

159
7.4 Conclusion
The vulnerability of the households is determined mainly by adaptive capacity as it is
observed that vulnerability increases especially with decrease in adaptive capacity.
Exposure is also important factor in determining overall vulnerability. In addition to this,
geographic factors are crucial factors determining the overall vulnerability as impacts of
natural hazards and climatic factors differ according to area. This is particularly seen in
Jhyaku whose majority of households are more vulnerable than in Nalang and Dalchowki.
Further, vulnerability also differs within the same geographic location due to adaptive
capacity which is mainly contributed by the socio-economic condition as well as
exposure to natural hazards. It is found that adaptation practices is highest for moderately
vulnerable households, indicating that households are able to overcome negative affect of
hazards to some extend by using traditional adaptation practices. Also with increase in
vulnerability, adaptation index decreases slightly. This indicates that climate change has
added additional challenges to households by increasing their vulnerability and affecting
their ability to cope with it.
Similarly, resilience mainly depends on the socio-economic condition and also on the
geographic location. The resilience is significantly impacted by their education, livestock,
irrigation, saving, and infrastructure. Resilience significantly increases with increase in

160
the saving which acts as safety net to absorb shocks as well as increase resources and
inputs availability. Further, infrastructure plays crucial role in increasing the resilience as
it will increase their reach to information as well as inputs. Further livestock possession
will help households to diversify their income as well as to absorb shocks.
Finally the analysis shows that analysing only from the perspective of vulnerability
will only show the households as mere sufferer but will not capture their capability.
Further understand from resilience point of view will also capture their capability to
observe those shocks. This emphasizes that for planning any development or adaptation
program there is need to understand households’ vulnerability as well as their resilience
for better planning and implementation.

161
Chapter VIII
8. Conclusion and Recommendation
Climate change has been pressing issue in the world since 1990s onwards. With the
increase in global temperature, there has been number of researches on its science and
impact. According to IPCC Fifth Assessment report, scientists are 95% certain that
climate change has been primarily due to the anthropogenic activities. Also in
international and scientific community there is general consensus that climate change will
impact mostly the least developed countries which have limited capacity to adapt to it.
Understanding the climate change at country level and planning for adaptation at local
level has been a challenging issue as climate change impacts differ from sector wise as
well as location wise. So, there is need to understand the climate change impact from the
country as well as adaptation characteristics at the local level. Nepal being least
developed country is facing challenges from the climate change in different sectors
especially agriculture, water resource and energy, climate induced disaster, forestry and
biodiversity, public health and urban settlements, and infrastructure as identified by
NAPA. As climate change will impact different sectors differently, it is very difficult to
assess impact of climate change on all the sectors in one research. So, this study assesses
the impact of climate change from the point of natural hazards and households’

162
vulnerability and resilience.
Analysis shows that there has been increase in temperature trend from 1978 to 2011,
while rainfall is in decreasing trend and erratic in nature. This change in climatic pattern
has further exacerbated the occurrence of natural hazards in the country. The study shows
that natural hazards have been increasing rapidly for the period of 1978 to 2011. The
increase in natural hazards will further increase the vulnerability of people. Further,
establishing the empirical relationship between the occurrences of natural hazards with
climatic variable is very important for mitigating the impacts of natural hazards. It is seen
that increasing temperature trend will significantly increase the occurrence of heatwave.
Also, increasing rainfall especially in the monsoon season will significantly increase the
occurrence of flooding while decrease in rainfall will increase occurrence of natural
hazards like forest fire and drought. As rainfall has been erratic in nature with some years
experiencing sudden increase while some years experiencing very low rainfall, there is
increase in natural hazards like flood, forest fire and drought. Furthermore, it is seen that
pre-monsoon temperature and rainfall will significantly increase the occurrence of
pre-monsoon flood while decrease in temperature in monsoon season will increase the
monsoon flood. Also, it is found that flood and landslides are the two major natural
hazards that have been occurring over the whole country. There has been increase in other

163
natural hazards also like forest fire which has been one of the major issues for the people
but has not been given proper consideration in climate change adaptation programs. This
change in climatic variable and increase in the natural hazard will directly impact the
households’ livelihood by mainly affecting agriculture sector as it is mostly rain-fed in
nature.
As climate change impact is more pronounced in Nepal, understanding climate
change vulnerability is important before any development and adaptation intervention.
Also it is important to understand vulnerability from the perspective of location, since
local authorities are responsible for implementing any development and adaptation
strategies to climate change. So, this study analyses and produces maps to show district
wise climate change vulnerability in Nepal. In the study it is seen that adaptive capacity
plays an important role in determining the overall vulnerability of an area. The
occurrence of natural hazards further exacerbates the exposure and will increase the
vulnerability. The result is found to follow the pattern of district wise vulnerability
according to NAPA by showing western part of the country comparatively more
vulnerable than eastern part. But, the result also shows the difference in the vulnerability
of district more properly. Kathmandu district is found to be least vulnerable district as it
has high adaptive capacity while the result of NAPA shows it has most vulnerable. This is

164
mainly due to the factors giving equal weights to exposure, sensitivity and adaptive
capacity and cognitive errors due to expert judgment. Further in this study, this limitation
is refuted by giving weights using PCA.
In addition to this, the study focused on the understanding the perspective of the
households to climate change. It is seen that households perceive the changes in the
climatic factor but are not aware of climate change terminology. Households are more
sensitive to notice change in the rainfall than change in temperature. They have been
adapting to these changes through reactive adaptation practices that they are practicing
traditionally. Eighteen different adaptation practices are identified which are being
practised by farmer to adapt to climate change. It is seen that majority of the farmers
adopt locally available practices like agroforestry and soil conservation strategy to
prevent against natural hazards like landslide and soil erosion. Also another important
adaptation strategy that farmers are adapting more is conservation of water by building
water tanks and rain water harvesting to cope with water stress during the dry season. The
adaptation practices like prioritizing livestock is least favoured among households as
there has been decrease in the availability of grass in forest. Further the study uses
Heckman Selection method for analysing the factors guiding the farmers’ perception of
climate change and their adaptation. The analysis shows there is correlation between

165
perception of farmers and their adoption of adaptation practices. It is seen that
information source is important factors for households to perceive any changes in the
climatic change. Further, households that are more dependent on climatic factors or
whose daily lives are dependent on natural resources perceive more changes in climate.
Furthermore, it is seen that households’ adoption of adaptation practices are determined
by their possession of assets as well as the infrastructure present in the area.
For proper implementation of policy and programs, understanding the local
vulnerability and resilience is important as climate change will impact locally. So,
households’ vulnerability and resilience is analysed. PCA is used to give weights to the
indicator. The result shows that households’ vulnerability to climate change is determined
especially by adaptive capacity and exposure. It is seen that Jhyaku has the highest
vulnerability in compare to other two areas which is mainly attributed to lack of adaptive
capacity as well as frequent occurrence of natural disasters. In addition, the haphazard
constructions of road without giving proper consideration of climate change impact have
increases the occurrence of natural hazards. This shows that there is need of proper
planning for investing in any infrastructure developmental programs as infrastructure
plays important role in increasing adaptive capacity of the households. For example,
preparing the area specific vulnerability assessment of infrastructure and vulnerability

166
reduction measures before implementation increase the resilience as well as reduces the
vulnerability due to infrastructure. Further, it is also seen that those households that are
more affected by the natural hazards are practicing more adaptation practices to cope with
the changes. This emphasizes that households are not just mere sufferer but they also
have capability to overcome the adverse impacts. But, the analysis also shows that most
of households have low to moderate resilience. This is mainly due to addition of new
challenges from climate change like increase in the frequency of natural disaster and
erratic weather pattern due to which households are not being able to cope with it. In
addition to this, resilience of households is significantly determined by the access to
market, school as it provide informations to adapt to climate change. Also possession of
livestock, irrigation facilities and education significantly affect the resilience as they
provide resources, opportunity for livelihood diversification and alternative income
source to adapt to climate change.
Overall the study indicated that management of natural hazards like landslide and
flood should be given priority to decrease the casualties caused by changing climatic
pattern. In addition to flood and landslide, there is need to give emphasis on the
mitigation of the forest fire as it has been increasing steadily and also damaging the
livelihood options in the rural areas. As impact of climate change differs according to area,
167
there is need to improve the climatic data management for better understanding of impact
of climate change in pocket area. Also more focused should be provided for improving
the information and knowledge about impact of climate change on social systems at both
the district as well as community level. Along with this more emphasis should be given to
western part of the country and also increasing the adaptive capacity to reduce
vulnerability of an area. Further, steps for identification of potential impact of climate
change from the view point of households concerns should be given priority. For example,
need for raising the awareness regarding impact of climate change, conservation of water
resources, diversification of income source, prevention of natural hazards, providing
technical and financial support and so on. One of way to increase the awareness could be
incorporate the information regarding climate change in the education system itself. As
vulnerability of the households is found to be dependent more on the accessibility to
infrastructure, there is need to invest more for its development. Also the developmental
programs should also incorporate the impact of climate change before planning and
implementation. In addition to this, there is need to understand the local level adaptation
capability and their practices for planning and implementation of any climate change
policy and programs. For example, mapping the indigenous knowledge about drainage of
the rain water during the monsoon season will help in reducing the casualties due to
168
flooding and subsequent landslide. The resilience analysis further emphasizes this point
as it shows that those moderately vulnerable households are practicing more adaptation
practices. This shows that climate change has added new challenges to households. So we
need to understand the local knowledge which will aid in adaptation to climate change
and if possible replicate the knowledge in other areas.

169
References
Abson, D. J., Dougill , A. J., & Stringer, L. C. (2012). Using Principal Component Analysis
for information-rich socio-ecological vulnerability mapping in Southern Africa.
Applied Geography, 1-10.
ADAPT-Nepal. (2014, 2 4). Status Paper for COP15/CMP5 to UNFCCC and KP. Retrieved
from adaptnepal Association for development of environment and people in
transition: http://www.adaptnepal.org.np/home.php?id=33
Adger, W. N. (2000). Social and ecological resilience: are they related? Progress in Human
Geography, 24(3), 347-364.
Adger, W. N. (2006). Vulnerability. Global Environmental Change, 16(3), 268-281.
doi:10.1016/j.gloenvcha.2006.02.006
Adger, W. N., & Vincent, K. (2005). Uncertainty in Adaptive Capacity. C.R. Geoscience,
337, 399-410.
Adger, W. N., Brooks, N., Bentham, G., Agnew, M., & Eriksen, S. (2004). New Indicators
of Vulnerability and Adaptive Capacity. Norwich: Tyndall Centre for Climate
Change Research.
Admassie, A., & Adenew, B. (2007). Stakeholders’ Perceptions of Climate Change and
Adaptation Strategies in Ethiopia. Addis Ababa, Ethiopia: Ethiopians Economic
Association.
Agrawala, S., Raksakulthai, V., Aalst, M. v., Larsen, P., Smith, J., & Reynolds, J. (2003).
Development and Climate change in Nepal: Focus on Water Resources and
Hydropower. Paris, France: Organisation for Economic Co-operation and
Development.
Akter, S., & Bennett, J. (2009). Household perceptions of climate change and preferences
for mitigation action: the case of the Carbon Pollution Reduction Scheme in
Australia. Canberra, Australia: Australian National University: Environmental
Economics Research Hub Research Reports No. 19. Retrieved from http://www.
crawford.anu.edu.au/research_units/eerh/pdf/EERH_RR19. pdf
Alam, M., & Regmi, B. R. (2004). Adverse Impacts of Climate Change on Development of
Nepal: Integrating Adaptation into Policies and Activities. Dhaka, Bangladesh:
Bangladesh Centre for Advanced Studies.
Alene, A. D. (2003). Improved production technology and efficiency of small holder
farmers in Ethiopia: extended parametric and non-parametric approaches to
production efficiency analysis. PhD Thesis. South Africa: University of Pretoria.
Anderson, J. (2006). Climate Change and Natural Disasters : Scientific evidence of a

170
possible relation between recent natural disasters and climate change. Brussels:
European Parliament.
Aryal, K. R. (2012). The history of disaster incidents and impacts in nepal 1900-2005.
International journal disaster risk science, 3(3), 147-154.
Baede, A. P., Linden, P. v., & Verbruggen, A. (. (2007). Annex II: Glossary, In Climate
Change 2007: Synthesis Report. Geneva, Switzerland: IPCC.
Bang, H. N. (2008). Social vulnerability and risk perception to natural hazards in
cameroon two decades after the lake Nyos gas disaster: What future prospect for
the displaced disaster victims? Summer Academy for Social Vulnerability.
Barker, T., Bashmakov, I., Bernstein, L., Bogner, J. E., Bosch, P., Dave, R., . . . Zhou, D.
(2007). Technical Summary. In: Climate Change 2007: Mitigation. Contribution of
Working Group III to the Fourth Assessment Report of the Intergovernmental
Panel on Climate Change. (O. R. B. Metz, Ed.) Cambridge, United Kingdom and
New York, NY, USA: Cambridge University Press.
Barr, R., Fankhauser, S., & Hamilton, K. (2010). Adaptation investments: a resource
allocation framework. Mitigation and Adaptation Strategies for Global Change,
15, 843–858.
Bayard, B., & Jolly, C. (2007). Environmental behavior structure and socio-economic
conditions of hillside farmers: A multiple-group structural equation modeling
approach. Ecological Economics, 62(3-4), 433-440.
doi:10.1016/j.ecolecon.2006.07.004
Below, T. B., Mutabazi, K. D., Kirschke, D., Franke, C., Sieber, S., Siebert, R., &
Tscherning, K. (2012). Can farmers’ adaptation to climate change be explained by
socio-economic household-level variables? Global Environmental Change, 22,
223-235.
Benjamin, P. L., Emma, Y. J., & Richard, M. W. (2011). Putting vulnerability to climate
change on the map: a review of approaches, benefits, and risks. Sustainability
Science. doi:10.1007/s11625-011-0129-1
Berkes, F., Colding, J., & Folke, C. (2000). Rediscovery of traditional ecological knowledge
as adaptive management. Ecological Applications, 10(5), 1251-1262.
Bhandari, R. P., & Pokharel, D. R. (1999). Modernization of farmer-managed irrigation
systems in Nepal: process and learning. Retrieved from
http://www.fao.org/docrep/003/x6626e/x6626e00.htm
Bhattarai, B., & Sharma, K. (2013). Aid, Policy and Growth: The Case of Nepal. Journal
of Economic Issues, 47(4), 895-910.
Bista, R. (2006). Foreign aid policy and its growth effect in Nepal. EconoQuantum, 3(1),

171
109-141.
Brechin, S. R., & Kempton, W. (1994). Global environmentalism: a challenge to the
post-materialism thesis. Social Science Quarterly, 75(2), 245-269.
Brooks, N. (2003). Vulnerability, risk and adaptation: A conceptual framework. Norwich:
Tyndall Centre for Climate Change Research. Working Paper 38.
Brooks, N., Adger, N. W., & Kelly, M. P. (2005). The determinants of vulnerability and
adaptive capacity at the. Global Environmental Change, 15, 151-163.
Bryan, E., & Behrman, J. (2013). Community–based adaptation to climate change: A
theoretical framework, overview of key issues and discussion of gender
differentiated priorities and participation. CAPRi Working Paper No. 109.
Washington, D.C.: International Food Policy Research Institute.
Budden, J., Collins, Z., Rahman, T., & Salinas, R. (2012). Nepal development reportn
2012. Kathmandu, Nepal: Government of Nepal.
Cannon, T., & Muller-Mahn, D. (2010). Vulnerability , resilience and development
discourses. Natural Hazards, 621-635. doi:10.1007/s11069-010-9499-4
Carpenter, M., Bauer, T., & Erdogan, B. (2009). Principles of Management.
CBS. (2003). Districts of Nepal. Indicators of development. Kathmandu, Nepal: Central
Bureau of Statistics (CBS).
CBS. (2012). National population and housing census 2011 (National Report).
Kathmandu, Nepal: National planning commission secretariat, Central Bureau of
Statistics (CBS).
Comer, P. J., Young, B., Schulz, K., Kittel, G., Unnasch, B., Braun, D., . . . Hak, J. (2012).
Climate Change Vulnerability and Adaptation Strategies for Natural
Communities: Piloting methods in the Mojave and Sonoran deserts. Arlington,
VA: Report to the U.S. Fish and Wildlife Service. NatureServe.
Cutter, S. L., Barnes, L., Berry, M., Burton, C., Evans, E., Tate, E., & Webb, J. (2008). A
place-based model for understanding community resilience to natural disasters.
Global Environmental Change, 18(4), 598-606.
doi:10.1016/j.gloenvcha.2008.07.013
Dahal, R. K. (2012). Rainfall-induced landslides in Nepal. International journal of Japan
erosion control engineering, 5(1), 1-8.
Dahal, R. K., & Hasegawa, S. (2008). Representative rainfall thresholds for landslides in
the Nepal Himalaya. Geomorphology, 100, 429-443.
DDCDhading. (2003). Dhading in map. Accessibility, natural resources application,
service centres & poverty map. Dhading: Office of district development committee,
dhading (DDCdhading).

172
DDCDolakha. (2013). District data information. Retrieved 11 19, 2013, from District
Development Committee, Dolakha (DDCDolakha):
http://www.ddcdolakha.gov.np/page.php?nav=2
DDCLalitpur. (2013). District profile. Retrieved 11 19, 2013, from District development
committee, Lalitpur (DDClalitpur):
http://www.ddclalitpur.gov.np/index.php?page=aboutus_content
Deressa, T. T., Hassan, R. M., & Ringler, C. (2008). Measuring Ethiopian farmers'
vulnerability to climate change across regional states. IFPRI.
Deressa, T. T., Hassan, R. M., & Ringler, C. (2009). Assessing household vulnerability to
climate change. The case of farmers in the nile basin of ethiopia. Washington DC:
International Food Policy Research Institute.: IFPRI Discussion Paper 00935.
Deressa, T. T., Hassan, R. M., & Ringler, C. (2011). Perception of and adaptation to
climate change by farmers in the Nile basin of Ethiopia. Journal of Agricultural
Science, 23-31.
Deressa, T. T., Hassan, R. M., Ringler, C., Alemu, T., & Yesur, M. (2009). Determinants of
farmers’ choice of adaptation methods to climate change in the Nile Basin of
Ethiopia. Global Environmental Change, 19, 248-255.
Devereux, S. (2000). Food Security in Ethiopia: A Discussion Paper for DFID. Sussex: UK:
Institue for Development Studies.
Diekmann, A., & Franzen, A. (1999). The wealth of nations and environmental concern.
Environment and Behavior, 31(4), 540-549.
DoA. (2014). Department of Agriculture (DoA). Retrieved 07 20, 2014, from
http://www.doanepal.gov.np/index.php
DoR. (2012). Statistics of strategic road network. Kathmandu, Nepal: Department of
Road (DoR), Government of Nepal.
Duerden, F. (2004). Translating climate change impacts at the community level. Arctic,
57(2), 204-212.
Dunlap, R. E., Gallup Jr., G. H., & Gallup, A. M. (1993). Of global concern: results of the
health of the planet survey. Environment, 35(9), 6-17.
FAO. (2005). Livestock sector brief: Nepal. Rome: Food and Agriculture Organization
(FAO).
Fernandez, I. J., Karem, J. E., Norton, S. A., & Rustad, L. E. (2007). Temperature, soil
moisture, and streamflow at the Bear Brook watershed in Maine (BBWM). Orono:
Marine Agricultural & Forest Experiment Station, University of Maine.
Filmer, D., & Pritchett, L. H. (2001). Estimating wealth effects without expenditure
data––or tears: An application to educational enrolments in States of India.

173
Demography, 38(1).
Folke, C. (2006). Resilience : The emergence of a perspective for social – ecological
systems analyses. Global Environmental Change, 16, 253-267.
doi:10.1016/j.gloenvcha.2006.04.002
Folke, C., Carpenter, S., Elmqvist, T., Gunderson, L., Holling, C., Walker, B., . . . Svedin,
U. (2002). Resilience and Sustainable Development: Building Adaptive Capacity
in a World of Transformations. Stockholm: The Environmental Advisory Council
to the Swedish Government.
Ford, J. D., & Smit, B. (2004). A framework for assessing the vulnerability of communities
in the Canadian Arctic to risks associated with climate change. Arctic, 57(4),
389-400.
Ford, J. D., Smit, B., Wandel, J., & MacDonald, J. (2006). Vulnerability to climate change
in Igloolik, Nunavut: what we can learn from the past and present. Polar Record,
42(221), 127-138. doi:10.1017/S0032247406005122
Foreign Aid Coordination Division. (n.d.). Foreign Aid in Nepal (FY 2010-11). Ministry of
Finance, Government of Nepal.
Fussel, H. (2007). Vulnerability: a generally applicable conceptual framework for climate
change research. Global Environmental Change, 17(2), 155-167.
Gallopin, G. C. (2003). A systemic synthesis of the relations between vulnerability, hazard,
exposure and impact, aimed at policy identification. In Economic Commission for
Latin American and the Caribbean (ECLAC). Handbook for Estimating the
Socio-Economic and Environmental Effects of Disasters (pp. 2-5). Mexico, D.F.:
ECLAC, LC/MEX/G.S.
Gbetibouo, G. A. (2009). Understanding farmers' perceptions and adaptations to climate
change and variability: the case of the Limpopo Basin, South Africa. Washington
D.C.: International Food Policy Research Institute.
Gbetibouo, G. A., & Ringler, C. (2009). Mapping South African farming sector
vulnerability to climate change and variability: Discussion paper. IFPRI.
Gilchrist, G., Mallory, M., & Merkel, F. (2005). Can local ecological knowledge contribute
to wildlife management? Case studies of migratory birds. Ecology and Society,
10(1), 20.
Gitz, V., & Meybeck, A. (2012). Risks, vulnerabilities and resilience in a context of climate
change. Rome, FAO: In FAO/OECD. Building resilience for adaptation to climate
change in the agriculture sector. Proceedings of a Joint FAO/OECD Workshop.
Godschalk, D. R. (2003). Urban Hazard Mitigation: Creating Resilient Cities. Natural
Hazard Review, 4. doi:10.1061/~ASCE!1527-6988~2003!4:3~136!

174
GoN & UNDP. (2008). Climate change enabling Activity. Kathmandu, Nepal: Government
of Nepal (GoN), United Nations Development Programme (UNDP).
GoN. (2011). Climate Change Policy 2011. Government of Nepal (GoN).
GoN. (2011b). National farmework on local adaptation plans for action. Kathmandu,
Nepal: Government of Nepal (GoN), Ministry of Science, Technology and
Environment.
Goovaerts, P. (2000). Geostatistical approaches for incorporating elevation into the
spatial interpolation of rainfall. Journal of Hydrology, 228, 113-129.
Harley, M., Horrocks, L., Hodgson, N., & Minnen, J. v. (2008). Climate Change
Vulnerability and Adaptation Indicators. European Topic Centre on Air and
Climate Change.
Hassan, R., & Nhemachena, C. (2008). Determinants of African farmers’ strategies for
adapting to climate change: Multinomial choice analysis. African Journal of
Agricultural and Resource Economics, 2(1), 83-104.
Heckman, J. J. (1979). Sample selection bias as a specification error. Econometrica, 47(1),
153-161.
Heltberg, R., & Bonch-Osmolovskiy, M. (2011). Mapping Vulnerability to Climate Change.
Washington, DC, USA: The World Bank.
Heltberg, R., Siegel, P. B., & Jorgensen, S. L. (2008). Addressing human vulnerability to
climate change: Toward a ‘no-regrets’. Global Environmental Change(19), 89-99.
HELVETAS. (2011). Nepal's climate change policies and plans: Local communities'
perspective. Environment and Climate, 1.
Hobbs, C. (2009). The Cost of Coping. A collision of Crises and the Impact of Sustained
Food Security Deterioration in Nepal. Kathmandu, Nepal: United Nation World
Food Programme.
Ibarraran, M. E., Malone, E. L., & Brenkert, A. L. (2008). Climate Change Vulnerability
and Resilience: Current Status and Trends for Mexico. Richland, Washington:
Pacific Northwest National Laboratory.
IFAD. (2003). Promoting market access for the rural poor in order to achieve the
millenium development goals. Roundtable discussion paper for the Twenty-Fifth
Anniversary Session of IFAD’s Governing Council.
IFRC. (2013). Types of disasters: Definition of hazard. Retrieved 10 16, 2013, from
International Federation of Red Cross and Red Crescent Societies (IFRC):
http://www.ifrc.org/en/what-we-do/disaster-management/about-disasters/definitio
n-of-hazard/
IHDP. (2009). International Human Dimensions Programme on Global Environment

175
Change. Retrieved from http://www.ihdp.unu.edu/article/adaptation
IIED. (2014). Climate change financing in Nepal. Briefing. Retrieved from
http://pubs.iied.org/17229IIED
IPCC. (1996). Climate Change 1995 Impacts, Adaptations and Mitigation of Climate
Change: Scientific-Technical Analyses. (R. T. Watson, M. C. Zinyowera, & R. H.
Moss, Eds.) New York NY, USA, Melbourne, Australia: Cambridge University
Press.
IPCC. (2001). Climate change 2001: Impacts, adaptation and vulnerability. Contribution
of working group II to the Third Assessment REport of the Intergovernmental
Panel on Climate Change. UK: Cambridge University Press.
IPCC. (2007). Climate Change 2007: Impacts, Adaptation and Vulnerability. Contribution
of working group II to the Fourth Assessment Report of the Intergovernmental
Panel on Climate Change. In M. L. Parry, O. F. Canziani, J. P. Palutikof, P. J. Van
Der Linden, & C. E. Hanson.
Johnson, D. P., Stanforth, A., Lulla, V., & Luber, G. (2012). Developing an applied extreme
heat vulnerability index utilizing socioeconomic and environmental data. Applied
Geography, 23-31.
Jones, P. D., & Mann, M. E. (2004). Climate over past millennia. Reviews of Geophysics,
42(2).
Jordan, J. (2009). Rethinking community resilience to climate change: Does a social
capital lens help? Current Crises and New Opportunities. Coleraine: Development
studies association. Retrieved from
http://www.devstud.org.uk/aqadmin/media/uploads/4ab779da220b7_1-jordan-dsa
09.pdf
Joshi, N. P., Maharjan, K. L., & Piya, L. (2011). Effects of Climate Variables on Yield of
Major Food-Crops in Nepal - A Time Series Analysis. Journal of Contemporary
India Studies: Space and Society, 19-26.
Kaliba, A. R., Verkuijl, H., & Mwangi, W. (2000). Factors affecting adoption of improved
seeds and use of inorganic fertilizers for maize production in the intermedi- ate
and lowland zones of Tanzania. Journal of Agricultural and Applied Economics, 32,
35-48.
Kalinda, T. H. (2011). Smallholder farmers' perceptions of climate change and
conservation agriculture: evidence from Zambia. Journal of Sustainable
Development, 4(4), 73-85.
Kansakar, S. R., Hannah, D. M., Gerrard, J., & Rees, G. (2004). Spatial pattern in the
precipitation regime of nepal. International Journal of Climatology(24),

176
1645-1659.
Kashyap, P. (2009). Exploring the UK government's climate change adapatation support
for developing countries. Master thesis. University of Manchester.
Kassam, K.-A. S., Baumflek, M., Ruelle, M., & Wilson, N. (2011). Human Ecology of
Vulnerability, Resilience and Adaptation: Case Studies of Climate Change from
High Latitudes and Altitudes. In J. Blanco, & H. Kheradmand (Eds.), Climate
Change - Socioeconomic Effects. InTech.
Kelly, P. M., & Adger, W. N. (2000). Theory and practice in assessing vulnerability to
climate change and facilitating adaptation. Climatic Change, 47, 325–352.
Khanal, N. P. (2012). Sustainability of community-based rice seed production: A case
study in the tarai region of Nepal. Hiroshima University.
Khanal, N. R., Shrestha, M., & Ghimire, M. L. (2007). Preparing for flood disaster.
Mapping and assessing hazard in the Ratu watershed, Nepal. Kathmandu, Nepal:
ICIMOD.
Khatiwoda, S. (2011). Vulnerability assessment of indigenous people’s livelihoods due to
climate change in Darakh V.D.C of Kailali district. Master. Pokhara University.
Kirkebøen, G. (2009). Decision behaviour – Improving expert judgement. In T. William, K.
Sunnevag, & K. Samset, Making essential choices with scant information.
Front-end decision making in major projects (pp. 169-194). New York:
Palgrave-Macmillan. Retrieved from
http://www.concept.ntnu.no/attachments/058_Kirkebooen%20%20-%20Expert%20
judgement.pdf
Lal, P. N., Singh, R., & Holland, P. (2009). Relationship Between Natural Disasters And
Poverty: A Fiji Case Study. SOPAC.
Lama, S., & Devkota, B. (2009). Vulnerability of mountain communities to climate change
and adaptation strategies. The Journal of Agriculture and Environment, 10.
Lavell, A., Oppenheimer, M., Diop, C., Hess, J., Lempert, R., Li, J., . . . Myeong, S. (2012).
Climate change: new dimensions in disaster risk, exposure, vulnerability, and
resilience. In C. B. Field, V. Barros, T. F. Stocker, D. Qin, D. J. Dokken, K. L.
Ebi, . . . P. M. Midgley (Eds.), Managing the Risks of Extreme Events and
Disasters to Advance Climate Change Adaptation (pp. 25-64). A Special Report of
Working Groups I and II of the. Cambridge, UK, and New York, NY, USA:
Cambridge University PRess.
Leiserowitz, A. (2006). Climate change risk perception and policy: The role of affect,
imaginary, and values. Climatic Change, 77, 45-72.
LFP. (2009). Impacts of Climate Change on Forests and Livelihoods: Issues and Options

177
for Nepal. Kathmandu, Nepal: Livelihoods and Forestry Programme (LFP).
MacKendrick, K. (2009). Climate change adaptation planning for cultural and natural
resource resilience: a look at planning for climate change in two native nations in
the pacific northwest U.S. University of Oregon.
Maddison, D. (2007). The Perception of and Adaptation to Climate Change in Africa.
South Africa: The World Bank.
Maharjan, K. L. (2003). Peasantry in Nepal A study on subsistence farmers and their
activities pertaining to food security (Vol. Special publication). Hiroshima
University.
Maharjan, K. L., Joshi, N. P., & Piya, L. (2011). Sources of Climate Change, its Impact,
and Mitigation Issues in Nepal. International Conference on Climate Chagne,
Livelihoods and Food Security. Jaipur, India: Institude of Development Studies.
Malla, G. (2008). Climate Change and its Impact on Nepalese Agriculture. The Journal of
Agriculture and Environment, 9, 62-71.
Maplecroft. (2011). Maplecroft Global Risk Analytics. Retrieved 11 13, 2011, from
http://maplecroft.com/about/news/ccvi.html
Marshall, N. A., Fenton, D. M., Marshall, P. A., & Sutton, S. G. (2007). How resource
dependency can influence social resilience within a primary resource industry.
Rural Sociology, 73(3), 359-390.
Marshall, N. A., Marshall, P. A., Tamelander, J., Obura, D., Malleret-King, D., & Cinner,
J. E. (2010). A framework for social adaptation to climate change. Gland,
Switzerland: IUCN (International Union for Conservation of Nature).
Medina, F., Iglesias, A., & Mateos, C. (2007). Risk management, vulnerability, and risk
perception of organic farmers in Spain. Berlin, Germany. Retrieved from
http://ageconsearch.umn.edu/bitstream/9274/1/sp07me01.pdf
Metzger, M. J., & Schroter, D. (2006). Towards a spatially explicit and quantitative
vulnerability assessment of environmental change in Europe. Regional
Environmental Change, 6, 201-216. doi:10.1007/s10113-006-0020-2
MoAC. (2011). Climate change adaptation and disaster risk management in agriculture.
Priority framework for action 2011-2020. Kathmandu, Nepal: Ministry of
Agriculture and Cooperatives (MoAC), Government of Nepal.
MoAD. (2012). Statistical information on Nepalese agriculture 2011/2012. Kathmandu,
Nepal: Ministry of Agricultural Development (MoAD), Government of Nepal.
MoE. (2010). National Adaptation Programme of Action (NAPA) to Climate Change.
Kathmandu, Nepal: Ministry of Environment (MoE), Government of Nepal.
MoE. (2012). Climate Change negotiation. Ministry of Nepal (MoE), Nepal.

178
MoE. (n.d.). Adaptation to climate change. NAPA to LAPA. Ministry of Environment
(MoE), Nepal.
MoEST. (2008). National capacity self-assessment for global environment management.
Kathmandu, Nepal: Ministry of Environment, Science and Technology (MoEST),
Government of Nepal.
MoF. (2014). Foreign Aid in Nepal. (M. o. (MoF), Producer) Retrieved 04 22, 2014, from
http://portal.mof.gov.np/projects-search?donors=all&primarysectors=all&location
s=all&keywords=climate%20change
MoHA. (2009). National strategy for disaster risk management, 2009. Kathmandu,
Nepal: Ministry of Home Affairs (MoHA) Government of Nepal.
MoHP. (2012). Annual report Department of Health Services 2067/2068 (2010/2011).
Kathmandu, Nepal: Ministry of Health and Population (MoPH), Government of
Nepal.
Mool, P. K., Bajracharya, S. R., & Joshi, S. P. (2001). Inventory of Glaciers, Glacial Lakes
and Glacial Lake Outburst Floods. Monitoring and Early Warning Systems in the
Hindu Kush-Himalayan Region Nepal. Kathmandu, Nepal: International Centre
for Integrated Mountain Development.
MoPE. (2004). Initial national communication to the Conference of the Parties of the
United Nations Framework Convention on Climate Change. Kathmandu:
Ministry of Population and Environment (MoPE), Government of Nepal.
NCVST. (2009). Vulnerabilities through the eyes of the vulnerable: Climate change
induced uncertainities and Nepal's development predicaments. CO, USA:
Institute for Social and Environmental Transition-Nepal (ISET-N), Nepal Climate
Vulnerability Study Team (NCVST).
Nelson, G. C., Rosegrant, M. W., Koo, J., Robertson, R., Sulser, T., Zhu, T., . . . Lee, D.
(2009). Climate change impact on agriculture and costs of adaptation. IFPRI.
Washington D.C.: International Food Policy Research Institute (IFPRI).
doi:http://dx.doi.org/10.2499/0896295354
Nhemachena, C., & Hassan, R. (2007). Micro-Level Analysis of Farmers’ Adaptation to
Climate Change in Southern Africa. IFPRI Discussion Paper No. 714. Washington,
DC: International Food Policy Research Institute.
NRC. (2007). Analysis of global change assessment. Lessons learned. National Research
Council (NRC). Washington, DC: The National Academies Press.
O’Brien, K., Leichenko, R., Kelkar, U., Venema, H., Aandahl, G., Tompkins, H., . . . West,
J. (2004). Mapping vulnerability to multiple stressors: climate change
andglobalization in India. Global Environmental Change, 14, 303-313.

179
Park, S. (2009). Estimating Air Temperature over Mountainous Terrain by Combining
Hypertemporal Satellite LST Data and Multivariate Geostatistical Methods.
Journal of the Korean Geographical Society, 44(2), 105-121.
Piya, L., Maharjan, K. L., & Joshi, N. P. (2012). Perceptions and Realities of Climate
Change among the Chepang Communities in Rural Mid-Hills of Nepal. Journal of
Contemporary India Studies: Space and Society, 2, 35-50.
Poumadere, M., Mays, C., LeMer, S., & Blong, R. (2005). The 2003 heat wave in France:
Dangerous climate change here and now. Risk Analysis, 25(6), 1483-1494.
Practical Action. (2009). Temporal and Spatial Variability of Climate change over Nepal
(1976-2005). Kathmandu, Nepal: Practical Action.
Practical Action. (2010). Understanding disaster management in practice with reference
to Nepal. Kathmandu, Nepal: Practical Action.
Pradhan, B. K. (2007). Disaster preparedness for natural hazards: Current status in
Nepal. Kathmandu, Nepal: ICMOD.
Prasai, B. K. (2010). National issue paper on the agriculture sector (adaptation).
Kathmandu, Nepal: United Nation Development Programme (UNDP).
Preston, B., & Stafford-Smith, M. (2009). Framing vulnerability and adaptive capacity
assessment: Discussion paper. CSIRO Climate Adaptation Flagship Working
paper No. 2. Retrieved from
http://www.csiro.au/org/ClimateAdaptationFlagship.html
Przyborski, P. (2013). The Impact of Climate Change on Natural Disasters. Retrieved 08
10, 2013, from Earth Observatory:
http://earthobservatory.nasa.gov/Features/RisingCost/rising_cost5.php
Regmi, B. R., & Bhandari, D. (2012). Climate Change Governance and Funding Dilemma
in Nepal. TMC Academic Journal, 7(1), 40-55.
Regmi, H. R. (2007). Effect of Unusual Weather on Cereal Crop Production and
Household Food Security. The Journal of Agriculture and Environment, 8.
Resilience Alliance. (2002). The Resilience Alliance. Retrieved from
http://www.resalliance.org/index.php/resilience
Sampei, Y., & Aoyagi-Usui, M. (2009). Mass-media coverage, its influence on public
awareness of climate-change issues, and implications for Japan’s national
campaign to reduce greenhouse gas emissions. Global Environmental Change, 19,
203-212.
Schwarz, A.-M., Be´ne´, C., Bennett, G., Boso, D., Hilly, Z., Paul, C., . . . Andrew, N. (2011).
Vulnerability and resilience of remote rural communities to shocks and global
changes: Empirical analysis from Solomon Islands. Global Environmental
180
Change(21), 1128-1140. doi:10.1016/j.gloenvcha.2011.04.011
SEI. (2004). Choosing methods in assessments of vulnerable food systems. Stockholm:
Stockholm Environment Institute (SEI) Briefing Note.
Semenza, J. C., Hall, D. E., Wilson, D. J., Bontempo, B. D., Sailor, D. J., & George, L. A.
(2008). Public Perception of Climate Change Voluntary Mitigation and Barriers to
Behavior Change. American Journal of Preventive Medicine, 35(5), 479-487.
Seneviratne, S. I., Nicholls, N., Easterling, D., Goodess, C. M., Kanae, S., Kossin, J., . . .
Zhang, X. (2012). Changes in Climate Extremes and their Impacts on the Natural
Physical Environment. In C. B. Field, V. Barros, T. F. Stocker, Q. Dahe, D. J.
Dokken, K. L. Ebi, . . . P. M. Midgley, Managing the Risks of Extreme Events and
Disasters to Advance Climate Change Adaptation (pp. 109-230). NY, USA: A
Special Report of Working Groups I and II of the Intergovernmental Panel on
Climate. Cambridge University Press, Cambridge, UK, and New York.
Sharma, M., & Dahal, S. (2011). Assessment of impacts of climate change and local
adaptation measures in agriculture sector and livelihoods of indigenous
community in high hills of Sankhuwasabha district. Rampur, Chitwan: Institute
of agriculture and animal science.
Sharma, R. H., & Shakya, N. M. (2006). Hydrological Changes and its Impact on Water
Resources of Bagmati Watershed, Nepal. Journal of Hydrology, 327(3-4), 315-322.
Sharma, S. (1996). Applied Multivariate Techniques. New York, USA: John Wiley & Sons,
Inc.
Shrestha, A. B., Wake, C. P., Mayewski, P. A., & Dibb, J. E. (1999). Maximum
Temperature Trends in the Himalaya and its Vicinity: An Analysis Based on
Temperature REcords from Nepal for the Period 1971-94. Journal of Climate,
2775-2786.
Shrestha, R. K. (2007). Impact of climate change on crop water use and productivity: A
case study of Bagmati River basin, Nepal. Delft: UNESCO-IHE Institude for
water education, Master.
Shrestha, S. L., Maharjan, K. L., & Joshi, N. P. (2012). Relationship between Climate
Variables and Yield of Food Crops in Nepal: Cases of Makwanpur and Ilam
District. Journal of International Development and Cooperation, 18, 37-54.
Smit, B., & Wandel, J. (2006). Adaptation, adaptive capacity and vulnerability. Global
Environmental Change, 16(3), 282-292. doi:10.1016/j.gloenvcha.2006.03.008
Smith, L. I. (2002). A tutorial on Principal Components Analysis.
Speranza, C. I. (2010). Resilient Adaptation to Climate Change in African Agriculture.
Bonn: Deutsches Institut für Entwicklungspolitik gGmbH. Retrieved from

181
http://www.adaptationlearning.net/sites/default/files/Studies%2054.pdf
Stern, N. (2006). Review: The Economics of Climate Change. U.K.: H.M. Treasury.
Tarrant, M. A., & Cordell, H. K. (1997). The effect of respondent characteristics on
general environmental attitude-behavior correspondence. Environment and
Behavior, 29, 618-637. doi:10.1177/0013916597295002
Tesso, G., Emana, B., & Ketema, M. (2012). Analysis of vulnerability and resilience to
climate change induced shocks in North Shewa, Ethiopia. Journal of Agricultural
Science, 3(6), 871-888. Retrieved from http://dx.doi.org/10.4236/as.2012.36106
Thakur, M. (2009). Implication of Climate Change on Forest Ecosystems Case Study of
Insect Outbreaks in Alnus Nepalensis in Ilam District of Nepal.
Turner II, B. L. (2010). Vulnerability and resilience: Coalescing or paralleling approaches
for sustainability science? Global Environmental Change, 20(4), 570-576.
doi:10.1016/j.gloenvcha.2010.07.003
Turner II, B. L., Kasperson, R. E., Matson, P. A., McCarthy, J. J., Corell, R. W.,
Christensen, L., . . . Schiller, A. (2003). A framework for vulnerability analysis in
sustainability science. Proceedings of the National Academy of Sciences of the
United States of America, 100, pp. 8074-9.
UN. (1992). United nations framework convention on climate change. United Nation
(UN). Retrieved from
http://unfccc.int/files/essential_background/background_publications_htmlpdf/ap
plication/pdf/conveng.pdf
UN. (2012). United Nations development assistance framework for Nepal 2013-2017.
United Nations Country Team Nepal, United Nations (UN).
UNDP. (2010). Mapping climate change vulnerability and impact scenarios A guidebook
for sub-national planners. United Nations Development Programme (UNDP).
UNFCCC. (2007). Climate Change: Impacts, Vulnerabilities and Adaptation in
Developing Countries. Bonn, Germany: United Nations Framework Convention
on Climate Change.
UNFCCC. (2014). Background on the UNFCCC: The international response to climate
change. Retrieved 2 3, 2013, from United Nations Framework Convention on
Climate Change: http://unfccc.int/essential_background/items/6031.php
UNISDR. (2009). Nepal country report: Global assessment of risk: ISDR Global
assessment report on poverty and disaster risk. Geneva: UN International
Strategy for Disaster Reduction.
United Nations Nepal Information Platform. (2013, 08 11). People from areas vulnerable
to climate change and natural disaster. Retrieved from

182
http://un.org.np/oneun/undaf/climatechange
VDCJyanku. (2012). Village Development Committee Profile. Dolakha: Village
Development Committee, Jyanku (VDCJyanku) Unpublished.
Vincent, K. (2004). Creating an index of social vulnerability to climate change for Africa.
University of East Anglia. Norwich, U.K.: Tydall Centre for Climate Change
Research.
Vogel, S. (1996). Farmers' environmental attitudes and behavior. A case study of Austria.
Environment and Behavior, 28(5), 591-613.
Wachinger, G., & Renn, O. (2010). Risk Perception and Natural Hazards. DIALOGIK
Non-Profit Institute for Communication and Cooperative Research. Suttgart:
CapHaz-Net WP3. Retrieved from
http://caphaz-net.org/outcomes-results/CapHaz-Net_WP3_Risk-Perception.pdf
WB. (2011). Climate Risk and Adaptation Country Profile: Vulnerability, risk reduction,
and adaptation to climate change Nepal. Washington, DC, USA: The World Bank
(WB).
WB. (2013). NPL_Country_MetaData. Retrieved 4 20, 2013, from
http://data.worldbank.org/country/nepal
Yirga, C. T. (2007). The dynamics of soil degradation and incentives for optimal
management in Central Highlands of Ethiopia. PhD Thesis. South Africa:
Department of Agricultural Economics, Extension and Rural Development,
University of Pretoria.
Zellner, A. (1962). An efficient method of estimating seemingly unrelated regressions and
tests for aggregation bias. Journal of the American Statistical Association, 57(298),
348-368.
Zhang, X., Alexander, L., Hegerl, G. C., Jones, P., Tank, A. K., Peterson, T. C., . . . Zwiers,
F. W. (2011). Indices for monitoring changes in extremes based on daily
temperature and precipitation data. WIREs Clim Change. doi:10.1002/wcc.147

183
Annex I
y = 0.0379x + 10.98
R² = 0.1602
y = -0.0183x + 2.1704
R² = 0.106
0
5
10
1519
78
19
81
19
84
19
87
19
90
19
93
19
96
19
99
20
02
20
05
20
08
20
11
Tem
pera
ture
˚C
January
Average Standard deviation
y = 0.072x + 12.329
R² = 0.272
y = -0.0157x + 2.6816
R² = 0.0208
0
5
10
15
20
19
78
19
81
19
84
19
87
19
90
19
93
19
96
19
99
20
02
20
05
20
08
20
11
Tem
pera
ture
˚C
February
Average Standard deviation
y = 0.0836x + 16.306
R² = 0.3841
y = -0.0319x + 3.0347
R² = 0.1889
0
5
10
15
20
25
19
78
19
81
19
84
19
87
19
90
19
93
19
96
19
99
20
02
20
05
20
08
20
11
Tem
pera
ture
˚C
March
Average Standard deviation
y = 0.0581x + 20.575
R² = 0.2417
y = -0.0409x + 3.6671
R² = 0.1646
0
5
10
15
20
25
19
78
19
81
19
84
19
87
19
90
19
93
19
96
19
99
20
02
20
05
20
08
20
11
Tem
pera
ture
˚C
April
Average Standard deviation
y = 0.0493x + 22.698
R² = 0.276
y = -0.0623x + 3.9484
R² = 0.5209
0
5
10
15
20
25
30
19
78
19
81
19
84
19
87
19
90
19
93
19
96
19
99
20
02
20
05
20
08
20
11
Tem
pera
ture
˚C
May
Average Standard deviation
y = 0.0309x + 24.321
R² = 0.1973
y = -0.024x + 2.8095
R² = 0.1272
0
5
10
15
20
25
30
19
78
19
81
19
84
19
87
19
90
19
93
19
96
19
99
20
02
20
05
20
08
20
11
Tem
pera
ture
˚C
June
Average Standard deviation

184
Month wise average temperature and standard deviation trend from 1978 to 2011
y = 0.0386x + 23.916
R² = 0.3799
y = -0.0119x + 2.1876
R² = 0.0422
0
5
10
15
20
25
30
19
78
19
81
19
84
19
87
19
90
19
93
19
96
19
99
20
02
20
05
20
08
20
11
Tem
pera
ture
˚C
July
Average Standard deviation
y = 0.0292x + 24.053
R² = 0.3839
y = -0.0204x + 2.2552
R² = 0.1922
0
5
10
15
20
25
30
19
78
19
81
19
84
19
87
19
90
19
93
19
96
19
99
20
02
20
05
20
08
20
11
Tem
pera
ture
˚C
August
Average Standard deviation
y = 0.0421x + 22.83
R² = 0.4722
y = -0.0181x + 2.3147
R² = 0.1559
0
5
10
15
20
25
30
19
78
19
81
19
84
19
87
19
90
19
93
19
96
19
99
20
02
20
05
20
08
20
11
Tem
pera
ture
˚C
September
Average Standard deviation
y = 0.045x + 19.959
R² = 0.3272
y = -0.0137x + 2.4929
R² = 0.0683
0
5
10
15
20
25
19
78
19
81
19
84
19
87
19
90
19
93
19
96
19
99
20
02
20
05
20
08
20
11
Tem
pera
ture
˚C
October
Average Standard deviation
y = 0.049x + 15.826
R² = 0.3387
y = -0.0258x + 2.8398
R² = 0.1033
0
5
10
15
20
19
78
19
81
19
84
19
87
19
90
19
93
19
96
19
99
20
02
20
05
20
08
20
11
Tem
pera
ture
˚C
November
Average Standard deviation
y = 0.0171x + 12.927
R² = 0.0444
y = -0.0187x + 2.3752
R² = 0.0561
0
2
4
6
8
10
12
14
16
18
19
78
19
81
19
84
19
87
19
90
19
93
19
96
19
99
20
02
20
05
20
08
20
11
Tem
pera
ture
˚C
December
Average Standard deviation
Source: Raw data from Department of Hydrology and Meterology
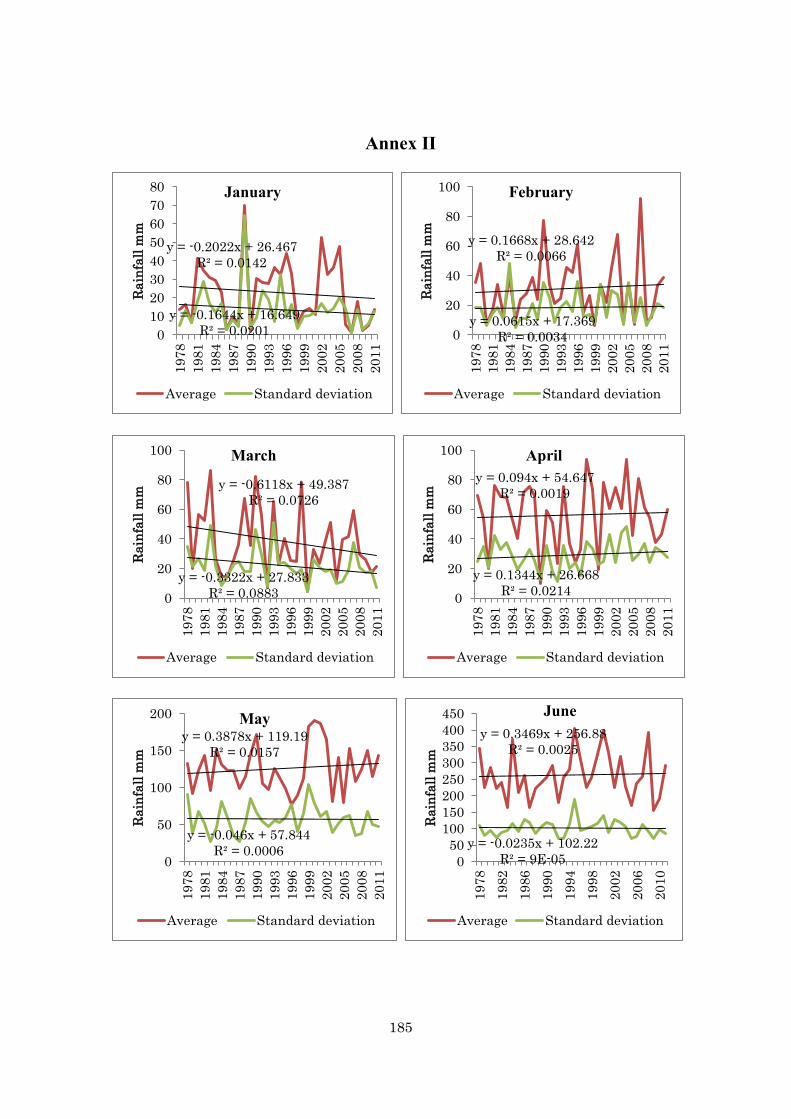
185
Annex II
y = -0.2022x + 26.467
R² = 0.0142
y = -0.1644x + 16.649
R² = 0.0201 0
10
20
30
40
50
60
70
8019
78
19
81
19
84
19
87
19
90
19
93
19
96
19
99
20
02
20
05
20
08
20
11
Ra
infa
ll m
m
January
Average Standard deviation
y = 0.1668x + 28.642
R² = 0.0066
y = 0.0615x + 17.369
R² = 0.0034 0
20
40
60
80
100
19
78
19
81
19
84
19
87
19
90
19
93
19
96
19
99
20
02
20
05
20
08
20
11
Ra
infa
ll m
m
February
Average Standard deviation
y = -0.6118x + 49.387
R² = 0.0726
y = -0.3322x + 27.833
R² = 0.0883 0
20
40
60
80
100
19
78
19
81
19
84
19
87
19
90
19
93
19
96
19
99
20
02
20
05
20
08
20
11
Ra
infa
ll m
m
March
Average Standard deviation
y = 0.094x + 54.647
R² = 0.0019
y = 0.1344x + 26.668
R² = 0.0214 0
20
40
60
80
100
19
78
19
81
19
84
19
87
19
90
19
93
19
96
19
99
20
02
20
05
20
08
20
11
Ra
infa
ll m
m
April
Average Standard deviation
y = 0.3878x + 119.19
R² = 0.0157
y = -0.046x + 57.844
R² = 0.0006 0
50
100
150
200
19
78
19
81
19
84
19
87
19
90
19
93
19
96
19
99
20
02
20
05
20
08
20
11
Ra
infa
ll m
m
May
Average Standard deviation
y = 0.3469x + 256.88
R² = 0.0025
y = -0.0235x + 102.22
R² = 9E-05 0
50
100
150
200
250
300
350
400
450
19
78
19
82
19
86
19
90
19
94
19
98
20
02
20
06
20
10
Ra
infa
ll m
m
June
Average Standard deviation
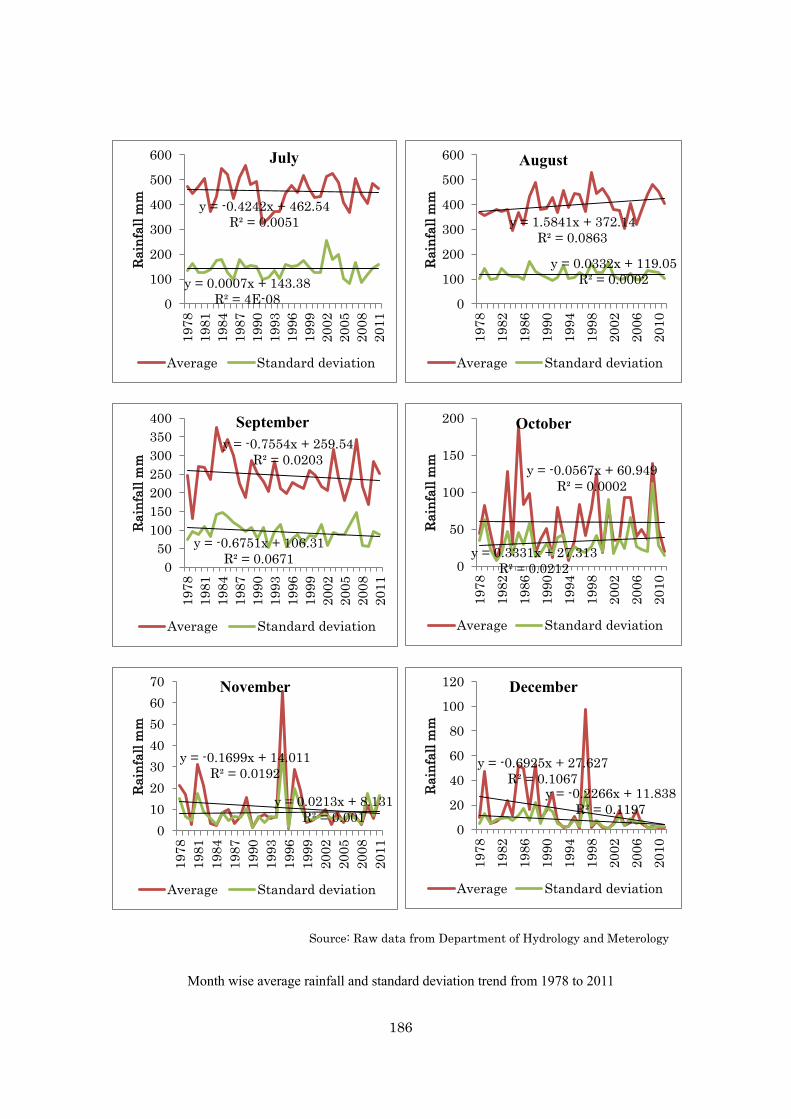
186
Month wise average rainfall and standard deviation trend from 1978 to 2011
y = -0.4242x + 462.54
R² = 0.0051
y = 0.0007x + 143.38
R² = 4E-08 0
100
200
300
400
500
600
19
78
19
81
19
84
19
87
19
90
19
93
19
96
19
99
20
02
20
05
20
08
20
11
Ra
infa
ll m
m
July
Average Standard deviation
y = 1.5841x + 372.14
R² = 0.0863
y = 0.0332x + 119.05
R² = 0.0002
0
100
200
300
400
500
600
19
78
19
82
19
86
19
90
19
94
19
98
20
02
20
06
20
10
Ra
infa
ll m
m
August
Average Standard deviation
y = -0.7554x + 259.54
R² = 0.0203
y = -0.6751x + 106.31
R² = 0.0671 0
50
100
150
200
250
300
350
400
19
78
19
81
19
84
19
87
19
90
19
93
19
96
19
99
20
02
20
05
20
08
20
11
Ra
infa
ll m
m
September
Average Standard deviation
y = -0.0567x + 60.949
R² = 0.0002
y = 0.3331x + 27.313
R² = 0.0212 0
50
100
150
200
19
78
19
82
19
86
19
90
19
94
19
98
20
02
20
06
20
10
Ra
infa
ll m
m
October
Average Standard deviation
y = -0.1699x + 14.011
R² = 0.0192
y = 0.0213x + 8.131
R² = 0.001 0
10
20
30
40
50
60
70
19
78
19
81
19
84
19
87
19
90
19
93
19
96
19
99
20
02
20
05
20
08
20
11
Ra
infa
ll m
m
November
Average Standard deviation
y = -0.6925x + 27.627
R² = 0.1067 y = -0.2266x + 11.838
R² = 0.1197
0
20
40
60
80
100
120
19
78
19
82
19
86
19
90
19
94
19
98
20
02
20
06
20
10
Ra
infa
ll m
m
December
Average Standard deviation
Source: Raw data from Department of Hydrology and Meterology

187
Annex III
Definition of natural hazards as given by http://desinventar.org Coldwave
Drop of atmospheric average temperature well above the averages of a region, with effects on human populations, crops, properties and services. Drought
Unusually dry season, without rain or with rain deficit. As a whole, these are long periods (months, years, and even decades) typical in limited continental areas or on regional scales. Flood
Water that overflows river-bed levels ("riverine flood") and runs slowly on small areas or vast regions in usually long duration periods (one or more days). Forest fire
The event includes all open-air fires in rural areas, natural forests, plains, etc. Hailstorm
Precipitation of hail. Frozen raindrops of varying sizes that fall violently in the form of hard pellets. Heatwave
Rise of atmospheric average temperature well above the averages of a region, with effects on human populations, crops, properties and services. Landslide
All mass movements other than surface erosion of a hillside. This event includes terms such as precipitation of earth, settling, horizontal land thrust, rock falls, (slow or quick) detachment of soil masses or rocks on watersheds or hillsides. Rains
Precipitation. Includes punctual, persistent or torrential rain, or rain exceeding the rainfall averages of a specific region; also, unusual long rain periods. Rain includes terms such as downpour, cloudburst, heavy shower, deluge, etc.

188
Storm Heavy rain accompanied by strong winds and/or electric discharges (lightning).
Snowstorm
Anomalous fall and accumulation of snow, especially when it occurs in zones not subject to seasonal changes. This term refers to events where precipitation exceeds the average multi-annual values, causing especially serious effects. Thunderstorm
Occurrence of atmospheric static discharges (lightning) with effects on people, cattle, domestic properties, infrastructure (power networks, for example, causing blackouts), and the environment. It is different from “storm” in that thunderstorms are not accompanied by rain and gusty winds. The key differentiator is that damage is caused explicitly by lightning.

189
Annex IV Seemingly unrelated regression between climatic variable and natural hazard Equation Obs Parms RMSE R-sq chi2 P Coldwave 34 3 22.79 0.38 20.64 0.00
Flood 34 3 72.29 0.38 20.99 0.00
Forest fire 34 3 6.74 0.38 21.02 0.00
Drought 34 3 5.94 0.43 25.95 0.00
Hailstorm 34 3 14.34 0.29 14.09 0.00
Landslide 34 3 72.38 0.37 19.85 0.00
Thunderstorm 34 3 19.99 0.62 55.25 0.00
Heatwave 34 3 1.53 0.41 23.54 0.00
Rains 34 3 5.75 0.33 16.90 0.00
Snowstorm 34 3 6.05 0.38 21.13 0.00
Storm 34 3 5.49 0.04 1.27 0.74

190
Result of Effect of climate variables on occurrence of natural hazards
Varia
bles
Coldwave Flood Forest Fire Drought Hailstorm Landslide Thunderstor
m Heatwave Heavy rain Snowstorm Storm
Coeff. P-val
ue
Coef
f.
P-val
ue
Coef
f.
P-val
ue
Coef
f.
P-val
ue
Coef
f.
P-val
ue
Coef
f.
P-val
ue
Coef
f.
P-val
ue
Coef
f.
P-val
ue
Coef
f.
P-val
ue
Coef
f.
P-val
ue
Coef
f.
P-val
ue
Year 2.04 0.00 5.81 0.00 0.28 0.09 0.12 0.42 1.29 0.00 5.48 0.00 2.62 0.00 0.07 0.08 0.47 0.00 0.65 0.00 0.09 0.49
Rainf
all -0.04 0.90 1.61 0.10
-0.18
0.05 -0.3
9 0.00 0.05 0.78 1.58 0.11
-0.31
0.24 0.00 0.88 0.12 0.11 0.00 0.96 0.04 0.60
Temp
eratur
e
-8.08 0.54 -12.
50 0.77 5.29 0.18 0.03 0.99
-16.80
0.04 -6.0
0 0.89
-2.38
0.84 1.73 0.05 -3.6
4 0.28
-7.28
0.04 0.12 0.97
Const
ant
-3879.35
0.00 -11474.3
0 0.00
-642.37
0.02 -175
.09 0.48
-2231.41
0.00 -10961.4
5 0.00
-5108.08
0.00 -165
.21 0.01
-884.39
0.00 -1149.81
0.00 -191
.51 0.41

191
Annex V
Seemingly unrelated regression between seasonal flood and climatic variables
Equation Obs
Parms RMSE R-sq chi2 P
Pre-monsoon flood 34 5 1.61 0.60 50.57 0
Monsoon Flood 34 5 65.33 0.46 29.10 0
House destroyed/affected 33 9 3893.215 0.362 18.72 0.0277 Crop Damaged (ha) 33 9 27780.02 0.3858 20.73 0.0139
Relationship between climate variables and casualties and damages caused by natural hazards
Variables Pre-monsoon flood Monsoon Flood
Coefficient P-value Coefficient P-Value Year 0.149 0.001 6.36 0.00
Pre-monsoon rainfall 1.092 0.038 10.91 0.61 Pre-monsoon temperature -0.763 0.527 -82.09 0.09 Monsoon rainfall 0.067 0.004 1.53 0.11 Monsoon temperature -0.004 0.666 0.13 0.72 Constant -304.085 0.000 -10960.10 0.00

192
Annex VI Number of observation = 75 Number of components = 22 Trace = 22 Rotation: (unrotated = principal) Rho = 1
Principal Component analysis of Nepal
Component Eigenvalue Difference Proportion Cumulative Comp1 9.77 6.74 0.44 0.44 Comp2 3.03 1.40 0.14 0.58 Comp3 1.63 0.33 0.07 0.66 Comp4 1.31 0.03 0.06 0.72 Comp5 1.28 0.27 0.06 0.77 Comp6 1.01 0.32 0.05 0.82 Comp7 0.69 0.02 0.03 0.85 Comp8 0.67 0.07 0.03 0.88 Comp9 0.61 0.06 0.03 0.91 Comp10 0.54 0.16 0.02 0.93 Comp11 0.39 0.06 0.02 0.95 Comp12 0.33 0.13 0.02 0.97 Comp13 0.20 0.04 0.01 0.98 Comp14 0.16 0.05 0.01 0.98 Comp15 0.12 0.02 0.01 0.99 Comp16 0.09 0.01 0.00 0.99 Comp17 0.09 0.05 0.00 1.00 Comp18 0.03 0.02 0.00 1.00 Comp19 0.02 0.01 0.00 1.00 Comp20 0.01 0.01 0.00 1.00 Comp21 0.00 0.00 0.00 1.00 Comp22 0.00 . 0.00 1.00

193
Principal component having Eigenvalue more than 1 of Nepal Variable Comp1 Comp2 Comp3 Comp4 Comp5 Comp6 Adaptive capacity Health Institute 0.20 0.18 -0.21 0.03 -0.10 -0.18 Drinking water 0.31 -0.05 -0.08 -0.12 0.03 0.02 Electricity 0.29 -0.18 0.00 -0.13 -0.04 0.10 Radio 0.29 -0.18 0.04 -0.05 -0.09 0.09 House 0.31 -0.10 -0.07 -0.12 -0.02 0.07 Away population 0.28 -0.02 -0.02 -0.01 -0.03 -0.14 School 0.28 -0.02 0.05 0.10 -0.25 -0.03 Literacy 0.16 -0.28 0.30 0.27 0.14 -0.28
Road 0.19 0.13 0.05 0.53 0.07 0.03 Dependency ratio 0.13 -0.31 0.27 0.06 0.41 -0.06 Irrigation 0.20 0.21 -0.24 -0.12 0.28 -0.23 Sensitivity Disable population 0.29 0.13 -0.10 0.07 -0.06 -0.05 Female household head 0.29 -0.17 0.04 -0.02 -0.07 0.07 Injured 0.05 0.19 0.60 0.17 -0.29 0.11
Use Fuelwood 0.22 0.28 -0.06 0.28 0.01 -0.25 House damaged/destroyed
0.12 0.23 -0.01 -0.19 0.48 0.12
Crop damaged 0.11 0.29 0.10 -0.12 0.33 -0.05
Population density 0.20 -0.30 -0.02 -0.26 -0.07 0.24 Death 0.10 0.25 0.27 -0.33 -0.01 0.36
Exposure Frequency 0.10 0.40 0.36 -0.12 -0.03 0.05
Temperature -0.12 -0.21 0.31 -0.04 0.37 -0.15 Rainfall 0.03 0.00 -0.20 0.46 0.27 0.70

194
Annex VII
Map of Nepal showing exposure due to climate change
Map of Nepal showing sensitivity to climate change

195
Map of Nepal showing adaptive capacity to climate change
Map of Nepal showing vulnerability due to climate change

196
Annex VIII
Vulnerability Index Value and Relative Rank Districts Adaptation Sensitivity Exposure Vulnerability Rank Achham 0.67 0.62 0.31 0.26 21
Arghakhanchi 0.99 0.44 0.66 0.11 38
Baglung 1.13 0.67 0.17 -0.29 62
Baitadi 0.93 0.67 0.37 0.12 37
Bajhang 0.48 0.63 0.25 0.40 12
Bajura 0.30 0.55 0.26 0.50 7
Banke 1.27 0.64 0.78 0.15 31
Bara 1.20 0.77 0.38 -0.05 49
Bardiya 1.25 0.71 0.67 0.13 34
Bhaktapur 1.13 0.54 0.41 -0.18 57
Bhojpur 0.84 0.52 0.37 0.05 44
Chitawan 1.71 0.93 0.18 -0.60 72
Dadeldhura 0.66 0.49 0.32 0.15 32
Dailekh 0.96 0.86 0.58 0.48 8
Dang 1.69 0.88 0.79 -0.01 47
Darchula 0.58 0.41 0.38 0.22 25
Dhading 1.02 1.49 0.89 1.36 1
Dhankuta 0.94 0.70 0.33 0.09 41
Dhanusha 1.54 0.93 0.30 -0.30 66
Dolakha 0.93 0.63 0.64 0.34 17
Dolpa 0.27 0.34 0.23 0.31 20
Doti 0.75 0.62 0.25 0.12 35
Gorkha 1.08 0.69 0.37 -0.01 48
Gulmi 1.13 0.71 0.29 -0.13 56
Humla 0.25 0.36 0.26 0.37 15
Ilam 1.39 0.67 0.33 -0.38 68
Jajarkot 0.50 0.59 0.48 0.57 3
Jhapa 2.06 1.31 0.46 -0.29 63
Jumla 0.43 0.38 0.26 0.21 27
Kailali 1.82 1.55 0.48 0.21 26
Kalikot 0.36 0.51 0.38 0.52 5
Kanchanpur 1.22 0.69 0.22 -0.30 64

197
Kapilbastu 1.23 0.63 0.62 0.02 45
Kaski 1.55 0.88 0.49 -0.19 59
Kathmandu 2.98 1.25 0.45 -1.28 75
Kavrepalanchok 1.28 0.83 0.33 -0.11 55
Khotang 0.96 0.76 0.53 0.33 19
Lalitpur 1.37 0.48 0.22 -0.68 74
Lamjung 0.86 0.56 0.24 -0.06 51
Mahottari 1.15 1.10 0.45 0.40 13
Makwanpur 1.41 1.14 0.40 0.12 36
Manang 0.65 0.25 0.66 0.26 22
Morang 2.05 1.05 0.48 -0.52 71
Mugu 0.17 0.32 0.20 0.35 16
Mustang 0.81 0.28 1.01 0.47 9
Myagdi 0.60 0.36 0.49 0.25 23
Nawalparasi 1.61 1.14 0.29 -0.18 58
Nuwakot 1.04 0.59 0.69 0.23 24
Okhaldhunga 0.69 0.49 0.40 0.20 29
Palpa 1.20 0.65 0.21 -0.34 67
Panchthar 1.02 0.47 0.31 -0.23 61
Parbat 0.81 0.56 0.41 0.17 30
Parsa 0.91 0.63 0.48 0.20 28
Pyuthan 0.78 0.66 0.63 0.51 6
Ramechhap 0.72 0.77 0.73 0.77 2
Rasuwa 0.41 0.36 0.49 0.44 11
Rautahat 0.98 0.66 0.25 -0.08 53
Rolpa 0.72 0.58 0.58 0.44 10
Rukhum 0.74 0.73 0.55 0.54 4
Rupandehi 1.86 0.74 0.47 -0.65 73
Salyan 0.84 0.53 0.69 0.37 14
Sankhuwasabha 0.82 0.52 0.40 0.11 39
Saptari 1.50 0.96 0.61 0.07 43
Sarlahi 1.40 0.71 0.17 -0.52 70
Sindhuli 1.15 0.37 0.49 -0.30 65
Sindhupalchok 1.06 0.58 0.46 -0.01 46
Siraha 1.25 0.85 0.32 -0.08 52

198
Solukhumbu 0.56 0.37 0.28 0.09 42
Sunsari 1.80 1.30 0.59 0.10 40
Surkhet 1.23 0.64 0.53 -0.06 50
Syangja 1.24 0.68 0.14 -0.43 69
Tanahu 1.22 0.77 0.25 -0.20 60
Taplejung 0.69 0.45 0.38 0.14 33
Terhathum 0.79 0.42 0.27 -0.10 54
Udayapur 1.12 0.85 0.61 0.34 18

199
Annex IX Number of observation = 195 Number of comp. = 27 Trace = 27 Rotation: (unrotated = principal) Rho = 1 Principal Component analysis of Households Component Eigenvalue Difference Proportion Cumulative Comp1 4.99 1.59 0.19 0.19 Comp2 3.41 1.25 0.13 0.31 Comp3 2.15 0.54 0.08 0.39 Comp4 1.62 0.27 0.06 0.45 Comp5 1.35 0.06 0.05 0.50 Comp6 1.29 0.13 0.05 0.55 Comp7 1.15 0.02 0.04 0.59 Comp8 1.13 0.13 0.04 0.63 Comp9 1.01 0.07 0.04 0.67 Comp10 0.93 0.06 0.03 0.70 Comp11 0.87 0.06 0.03 0.74 Comp12 0.81 0.03 0.03 0.77 Comp13 0.78 0.06 0.03 0.80 Comp14 0.72 0.04 0.03 0.82 Comp15 0.68 0.06 0.03 0.85 Comp16 0.62 0.10 0.02 0.87 Comp17 0.52 0.03 0.02 0.89 Comp18 0.49 0.03 0.02 0.91 Comp19 0.46 0.04 0.02 0.93 Comp20 0.42 0.03 0.02 0.94 Comp21 0.38 0.05 0.01 0.96 Comp22 0.33 0.03 0.01 0.97 Comp23 0.30 0.06 0.01 0.98 Comp24 0.24 0.05 0.01 0.99 Comp25 0.19 0.06 0.01 0.99 Comp26 0.14 0.14 0.01 1.00 Comp27 0.00 . 0.00 1.00

200
Principal component having Eigenvalue more than 1 for households Variable Comp1 Comp2 Comp3 Comp4 Comp5 Comp6 Comp7 Comp8 Comp9 Adaptive capacity Road 0.32 0.04 0.09 0.06 0.12 0.03 0.23 0.04 0.18 Agricultural service 0.36 -0.13 -0.03 0.05 0.04 0.03 -0.08 -0.08 -0.09 Livestock service 0.36 -0.21 -0.01 0.01 0.04 0.03 -0.12 -0.03 -0.01 Agrovet 0.34 -0.20 0.04 0.02 0.07 0.03 -0.03 -0.01 -0.02 Market 0.31 -0.26 0.04 -0.01 0.00 0.01 -0.13 0.09 -0.11
Off-farm income 0.12 0.18 0.17 -0.64 -0.15 -0.11 0.00 0.04 -0.05 Total Income 0.14 0.32 0.19 -0.51 -0.12 -0.02 0.00 -0.01 -0.06 Agricultural Income 0.08 0.39 0.09 0.17 0.04 0.17 -0.01 -0.12 -0.03
Irrigated -0.10 -0.24 0.37 -0.03 -0.18 0.13 0.08 -0.24 -0.01 Total Land -0.13 -0.18 0.34 0.04 -0.24 0.19 0.13 -0.29 -0.02 Mobile 0.05 0.12 0.32 0.21 -0.01 -0.44 -0.22 0.05 -0.06 Dependency ratio 0.07 0.10 0.21 0.19 -0.12 -0.47 -0.03 0.12 -0.34
Education 0.01 0.09 0.23 -0.06 0.45 -0.14 -0.23 -0.28 0.30 Livestock -0.02 0.04 0.30 0.24 -0.27 0.32 -0.02 0.10 -0.32 Drinking water 0.03 0.14 0.10 -0.02 0.39 0.42 0.01 0.15 -0.19 No. of Crops 0.09 0.22 0.23 0.10 -0.05 0.31 -0.42 0.15 -0.01
Total Saving 0.04 0.21 0.08 0.24 0.16 -0.15 0.47 -0.03 -0.12 Health 0.26 -0.05 0.16 0.05 0.16 0.08 0.39 -0.03 0.17
School 0.01 -0.18 0.14 -0.14 0.04 -0.06 0.37 0.50 -0.15

201
Radio 0.02 -0.01 0.32 0.11 -0.23 -0.11 0.09 -0.04 0.52 Climate change perception 0.05 0.14 -0.31 0.06 -0.41 0.02 0.12 -0.06 0.15
Sensitivity Damage to land -0.23 -0.08 0.07 0.00 0.29 -0.17 -0.07 0.05 -0.07 Livestock lost -0.19 -0.06 0.15 -0.15 0.16 0.11 0.15 0.05 0.09 Damage to agricultural production -0.05 0.06 0.04 0.10 -0.10 0.05 -0.11 0.62 0.43
Exposure Rainfall -0.13 0.40 -0.01 0.09 0.09 0.07 0.14 -0.06 0.00
Temperature -0.32 -0.19 0.06 -0.07 0.05 -0.03 0.00 -0.01 -0.15 Frequency of natural hazard -0.23 -0.19 0.16 -0.03 0.11 0.04 -0.11 0.13 0.11