Embed Size (px)
Citation preview
Szent István University
Doctoral School of Management and Business Administration
Thesis of Doctoral (PhD) Dissertation
DYNAMIC CAPABILITIES AND GROWTH OF SMALL AND MEDIUM SIZED
ENTERPRISES -
A STUDY AMONG COMPANIES IN NORTH RHINE-WESTPHALIA (GERMANY)
JÜRGEN FONGER
Gödöllő
2017

2
Szent István University
Doctoral School of Management and Business Administration
Head: Prof. Dr. József Lehota, DSc.
Professor, Dr. of Science (MTA)
Szent István University, Gödöllö
Supervisor: Dr. József Poor DSc.
Professor, Dr. of Science (MTA)
Szent István University, Gödöllő
Discipline: Management and Business Administration
…………………………. ……………………….
Approval of the School Leader Approval of the Supervisor

TABLE OF CONTENTS
1. INTRODUCTION ..................................................................................................................... 4
1.1 Relevance and Significance of the Topic ................................................................................... 4
1.2 Research Objectives .................................................................................................................... 5
2. MATERIAL AND METHODS ...................................................................................................... 10
2.1 Hypotheses ................................................................................................................................. 10
2.2 The Empirical Research ........................................................................................................... 11
2.3 The Methods of Empirical Research ....................................................................................... 13
3. RESULTS ......................................................................................................................................... 14
3.1 Descriptive Data ........................................................................................................................ 14
3.2 Testing of the Hypotheses ......................................................................................................... 18
3.3 Discussion of the Results ........................................................................................................... 20
4. CONCLUSIONS AND FINDINGS................................................................................................ 22
5. References ........................................................................................................................................ 25
6. List of publications related to the dissertation .............................................................................. 27

4
1. INTRODUCTION
1.1 Relevance and Significance of the Topic
The important role played by small and medium enterprises (SMEs) in economic and social
development of many countries has continued to grow in recent decades, largely determined by
the high weight in the business, and its decisive contribution to economic growth, job creation
and global competitiveness of the economy as a whole. What has led to the growth of these
SMEs occupies an important position in the economic agendas of public administrations and
social agents.
While the growth of SMEs has been a topic of continuing interest especially in times of crises,
given that the economic climate has caused to sharpen some of the weaknesses of these
businesses. These weaknesses can be noted by a low productivity, difficulties in obtaining capital
or credit, access to new technologies, innovation and talent recruitment, which have directly
influenced their competitiveness and consequently in the decreased ability to generate wealth and
employment. As an example, in the case of the Spanish economy, the destruction of SMEs
amounted to 51,769 firms in 2011 (-1.6% reduction from 2010), causing a drop of -5.47% in the
total number of employees, which meant a reduction of 404,000 jobs.
On the other hand, interest in the growth of SMEs not only manifests from a macroeconomic
point of view. From the business world, this has been an objective of most companies, taking into
account an indicator of current and future competitiveness, reflected in the value of their market.
Simultaneously, it has been found that growth brings additional doses of strength and confidence
to these businesses that directly affect their long-term survival. In view of these considerations,
boost growth and a higher level of entrepreneurship in the small business sector is an issue that
occurs as a challenge and a necessity, and therefore demands a broader understanding of the
factors that help or hinder this growth, facing government policies and entrepreneurial efforts. In
this regard, the study of the growth of SMEs is an issue that has been in the focus of several
surveys. Several studies within this area demonstrate that main macroeconomic benefits were not
produced, as one might assume, by the major companies but by SMEs, attracting the interest of
researchers in the business context, as an object of practical study. Expanding the basic research
line e.g. of Birch (1989), a large number of studies made valuable contributions, both theoretical
and empirical, from different knowledge areas such as Business Administration, Psychology, or
Economy.
Despite the large number of studies, a detailed analysis of the most recent literature shows that
even there is no consensus as to which factors have bigger influences on the growth and how they
exert this influence (Davidsson, 2010). This lack of consensus may be due to large parts to the

5
multidisciplinary nature of the phenomenon, which has caused a high degree of fragmentation in
literature and makes comparative analyses between studies difficult.
From the external point of view, the relationship of the growth environment has been studied
from different theoretical points of view, mainly from the perspective of the Economy of
Organizations and Strategic Adaptation. Most research results highlight the role of the sector and
its characteristic structural and external factors associated with growth (Wiklund et al., 2009).
1.2 Research Objectives
The resilience and good performance of the German economy during the last decade has its roots
to a great extent in a strong and stable SME segment. Often referred to as the “backbone of the
German economy”, the German SME with its longstanding record of high employment and
productivity, increasingly raises interest abroad, where decision makers are keen to learn from the
German model (BMWi, 2013: p. 2). Obviously, there are specific factors unique to the German
SME which account for its success and superior performance as well as its stabilizing role in the
German economy. To analyse these factors in further detail, this section takes a closer look at the
peculiarities and good practices of the SME segment in Germany.
To provide a broader view and to finish this chapter, a definition of SME in the United States is
added. Following the OECD definition”Small and medium-sized enterprises (SMEs) are non-
subsidiary, independent firms which employ less than a given number of employees. The United
States considers SMEs to include firms with fewer than 500 employees. Small firms are generally
those with fewer than 50 employees, while micro-enterprises have at most 10, or in some cases 5,
workers. Financial assets are also used to define SMEs.” (OECD, 2005: p. 17).
Like in other European countries, the SME segment in Germany is an extremely important
segment of the economy and comprises a high share of the total number of German enterprises.

6
Size* Enterprises
Turnover
Employees
(subject to social
security contributions)
Number
Share
In € 1000
Share
Number
Share
Micro 3,237,878
90.0
544,077,967
10.9
3,915,319
15,6
Small 278,459
7.7
583,988,226
11.7
4,717,064
18.7
Medium 64,137
1.8
752,035,727
15.1
5,221,382
20.7
SME 3,580,510
99.5
1,880,101,920
37.8
13,853,765
55.1
Large 16,738
0.5
3,098,835,582
62.2
11,311,521
44.9
Total 3,597,248
100.0
4,978,937,502
100.0
25,165,286
100.0
Table 1: Quantity of Enterprises of Different Size in the German Economy (20091).
* As defined by the European Commission
Source: Günterberg, 2012: p. 16
As Table 1 reveals, there are approximately 3.6 million small and medium-sized enterprises in
Germany compared to a good 16,000 large companies. The vast majority of these SME in turn
are micro-enterprises with up to 9 employees and an annual business volume of less than 2
Million €.
1 Latest available data

7
Figure 1: Significance of SME in the German Economy (IfM Definition, 2014).
* Subject to social insurance contribution
Source: IfM, 2014.
According to Figure 1, 99.6% of all companies in Germany are SMEs, compared to the EU
average of 99.8%. Furthermore, SMEs employ about 60% of the German workforce and educate
83% of the apprentices in Germany. The training provided in this segment contributes decisively
to the comparatively low level of youth unemployment in Germany (BMWi, 2013: p. 3). As one
might expect, the shares of turnover and value added contribution lack somewhat behind, but
SMEs still account for nearly 36% of the total turnover and contribute 55% to the value added.
Figure 2: Sectoral Distribution of SMEs (Number of Enterprises).
Source: Tchouvakhina, 20132: p.4.
2 Latest available data

8
Figure 2 first reveals that about three-fourth of the German SMEs belong to the service sector. On
the other hand, however, there are a greater number of larger SMEs in the manufacturing
industry, employing a significant share of the workforce and accounting for a great deal of
revenues in the sector. Hence, though most of the SMEs belong to the service sector in Germany
as well, the industry sector continues to play an important role in the SME segment (Ziegenbalg
et al., 2010: p. 14; Tchouvakhina/Schwartz, 2013: p. 2; BMWi, 2103: p. 7). One out of five
German SME employees works in the industrial sector, significantly more than in other major
industrialized countries (see Figure 2).
Since German SMEs tend to finance their investment with own resources, they are also in a good
bargaining position in negotiations with banks and are rather likely to get favourable credit terms
(Lehnfeld, 2013: p. 2). Between 2002 and 2013, the equity ratio increased by more than 8
percentage points within the SME segment (KfW, 2013: p. 2). This positive trend applies to
SMEs of all sizes and segments, in manufacturing, crafts, trade, and construction (DSGV, 2012:
p. 5). However, larger SMEs on average have a higher equity ratio compared to smaller
enterprises (see Figure 3).
Figure 3: Equity Ratio in German SME Segment by Employment Size Classes 2002-2012.
Source: KfW, 20133: p. 2.
3 Latest available data???

9
As already mentioned, about 80% of apprentices in Germany learn their profession in SMEs of
the German SMEs. As a consequence, SMEs contribute to a great deal to the comparatively low
rate of unemployment among young people in Germany, which is currently about 5% in
Germany compared to more than 18% on EU level (German Federal employment services, 2016).

10
2. MATERIAL AND METHODS
2.1 Hypotheses
The following table depicts the established Hypotheses to be tested:
H1: The systemic integration of a SME's ability to detect opportunities and take
advantages to exploit and continuously approve its resources base has a positive
influence on the growth of small and medium sized enterprises.
H 2: Intellectual capital has a positive influence on growth.
H 3: The greater the availability of financial capital, the greater is the growth of
SMEs.
H 4: The growth attitude taken by the management directly influences SME growth
in a positive way.
H 5: The dynamism of environment has a direct negative influence on SME growth.
H 6: International market orientation has a positive influence on growth.
Table 2: Hypotheses
Figure 4 summarizes the established conceptual model for the research fieldwork by using the
hypotheses above:
Figure 4: Hypotheses and conceptual model.
Source: Own elaboration

11
2.2 The Empirical Research
The study focuses on small and medium sized enterprises of the manufacturing sector in North
Rhine-Westphalia with a labour force ranging from 10 to 250 employees, potentially a number of
about 3,900 enterprises. The randomly chosen companies were listed in the Chambers of Crafts
and the Chamber of Trade indexes. To check for comprehensibility and suitability of the
questions, a pre-test was conducted during summer 2015 by questionnaires with 30 randomly
chosen SMEs. During this pre-test the questionnaire’s usability was confirmed. By another 73
questionnaires with companies from September 2015 until the end of 2015, overall 103
questionnaires, results were generated and used for the hypotheses testing. The meaning of the
SME for the economy in general has been described in chapter one and fostered the decision to
focus on SMEs. Additionally, the focus on SMEs had been in the centre of the author's PhD
studies which focussed on SMEs from different perspectives and as a result obtained from this
several publications obtained (e.g. Fonger, J. (2016); Reich, M., Fonger, J. (2013)).
By a pre-test with 30 companies during the summer of 2015 and by another 73 CEOs of SMEs
from September 2015 until the end of 2015 the results were finally collected. This led to a
number of overall 103 interviews, i.e. 103 completely filled out, valid responses. The data
gathered includes the turnovers for 2014. Caused by the German tax system, which gives the
companies typically a two-year time frame to establish and finalise their return of tax
applications. From this point of view, the data is still relatively up-to-date; especially as there is
no more current data available. Additionally, and even more important, the focus of the research
is set on the development of the companies by testing the period of growth during a three year
time frame, namely from 2012 to 2014. In this regard, the tendencies and general assumptions are
about to be tested.
Following Chang, the questionnaire and the setting was established in a way that allowed
separating the independent from the dependent variables (Chang et al., 2010: pp. 178-182) in
order to avoid common-method variance. Concrete, the questions for the number of employees
and the development of the turnover were separated from each other. In all cases, the
questionnaires were filled in as described above, during the attendance of the author.
In the questionnaires, the respondents evaluated several statements in six different categories
using a 5-point Likert scale from 1 “fully disagree” or, respectively, “insufficient” and 5
“completely agree” or, respectively, “fully satisfactory”. The following table shows these
categories and the given statements to which the respondents had to reply to:

12
Category Statement
1. Dynamic Capability
The company explores the
business environment to the
assessment of:
a. Relevant new technologies
b. Changed consumption trends and customer needs
c. New markets to conquer
d. Potential business models to max out chances
e. Effectiveness of company function due to documented
processes within the units
2. Intellectual Capital
a. Level of employees and their competencies
b. Training hours above average
c. Work of employees towards product and process
development
3. Available Financial
Resources
Effect of the availability of financial resources during the
last three years on the firm’s development
4. Management Attitude
towards Growth
a. Importance of growth
b. Sales growths as main criteria for decisions
c. Dependence of survivability on sales growth
5. Dynamics of the
Environment
a. Change of marketing strategy in order to keep up
b. Frequency of production technologies within the branch
c. Transparency of competitors and their activities
6. International Level Whether or not the company was active outside of its own
country
Table 3: Categories and Statements of the questionnaire (2015)
Source: own elaboration

13
2.3 The Methods of Empirical Research
The questionnaire method is a quantitative research approach which allows the testing of the
hypotheses by standard multilinearity methods, especially principal components analysis. The
questions were structured or half-structured, the SME as the objectives coincidence with my
research field and my research and publication so far. Following the data collected by the survey,
the procedure was divided into two steps: First, the data set was analysed basically, in order to
check “technically” with regard to the testing of the results concerning the consistency or the
reliability, the entire data was taking into account. It is insofar necessary, as the explanatory
power needs to base on an empirically proved data set. Second, the results of the survey led to a
split data set. In the context of the hypotheses to be tested, a further investigation concerning the
SME with negative growth made no sense, because their correlation with the underlying items led
to a loss instead to growth. As they were SMEs with a positive growth and with a negative
growth, only the ones with positive growth were usable for further analysis. In this sense, they
would have been rejected from this survey because they are not part of the potential group of
SMEs in North Rhine-Westphalia with growth. But it seemed appropriate, in order to get a
complete documentation of the results and for a realistic representation of the survey, to collect
data for those SMEs with negative growth, too. A decision not to use the data by simply not
collecting the results would have been an irregular approach. Furthermore, it would be an
interesting challenge for further research to do a more or less similar survey in order to find out
whether there are similar results or e.g. totally contrary ones. The letter result would make
perfectly sense: By this it is proved that the assumptions and items which established the
hypotheses were correct to test growth, if they are not confirmed, it would necessarily lead to loss
instead of growth. However, this would be a different approach and it would require a bigger
database to be reliable, especially to allow deductive statistics. For these reasons, the further
analysis only used the data of the companies with (positive) growth.
For further multilinearity analysis, the items were taken into account for the factor analysis. As a
first step, an exploratory factor analysis is conducted (Backhaus et al., 2003), subjected to the aim
to confirm the postulated scales. Followed by the internal consistency check of the scales by
using Cronbach's alpha, the reliability is analysed (Häder, 2006). Thereafter, the scales in
multiple linear regressions will be done as well as a linear regression to the assumptions and
injuries (see Backhaus et al., 2003). Then, the models with structural breaks and the impacts of
structural changes on the estimates in the linear model are described. Similar effects on a linear
model such as structural breaks have influential observations; such influential cases will be
responded, too.

14
3. RESULTS
3.1 Descriptive Data
The figures below show the distribution of companies (in total and percentage) according to their
individual sales growth and the development of growth in EUR. The SMEs are presented
individually, depending on their positive or negative growth. The figures are self-explaining by
their titles:
Figure 5: Number of SMEs with positive growth in %.
Source: Own elaboration
Figure 6: Number of SMEs with negative growth in %.
Source: Own elaboration

15
Figure 7: Sales in million EUR for SMEs with positive and negative growth.
Source: Own elaboration
The table below summarizes the results by the means of the answers and the corresponding
hypotheses and gives an overview about the number of items at the same time. During the testing
of the hypotheses, the used items were denoted as (in the order of the hypotheses 1 to 6) DC1-DC
5, Int_Cap1-3, Financial_cap, Attid_Growths 1-3, Dynamic_Enviroment 1-3, and International.
Table 4: Summary and means of the questionnaire Source: Own elaboration
Below, the distribution of answers to the six main categories “Dynamic Capabilities”,
“Intellectual Capital”, “Available Financial Resources”, “Management Attitude towards
Growth”, “Dynamic of the Environment” and “International Level” are displayed.

16
Figure 8: Overall distribution of answers to the 5-question category “Dynamic Capabilities”.
Source: Own elaboration
Figure 9: Overall distribution of answers to the 3-question category “Intellectual Capital”.
Source: Own elaboration
Figure 10: Distribution of answers to: “Available Financial Resources” - Effect of the
Availability of financial resources during the last 3 years on the firm’s development.
Source: Own elaboration

17
Figure 11: Overall distribution of answers to the 3-question category “Management Attitude
towards Growth”.
Source: Own elaboration
Figure 12: Overall distribution of answers to the 3-question category “Dynamic of the
Environment”.
Source: Own elaboration
Figure 13: Distribution of answers to: “International level” - Whether or not the company was
active outside of its own country.
Source: Own elaboration
18
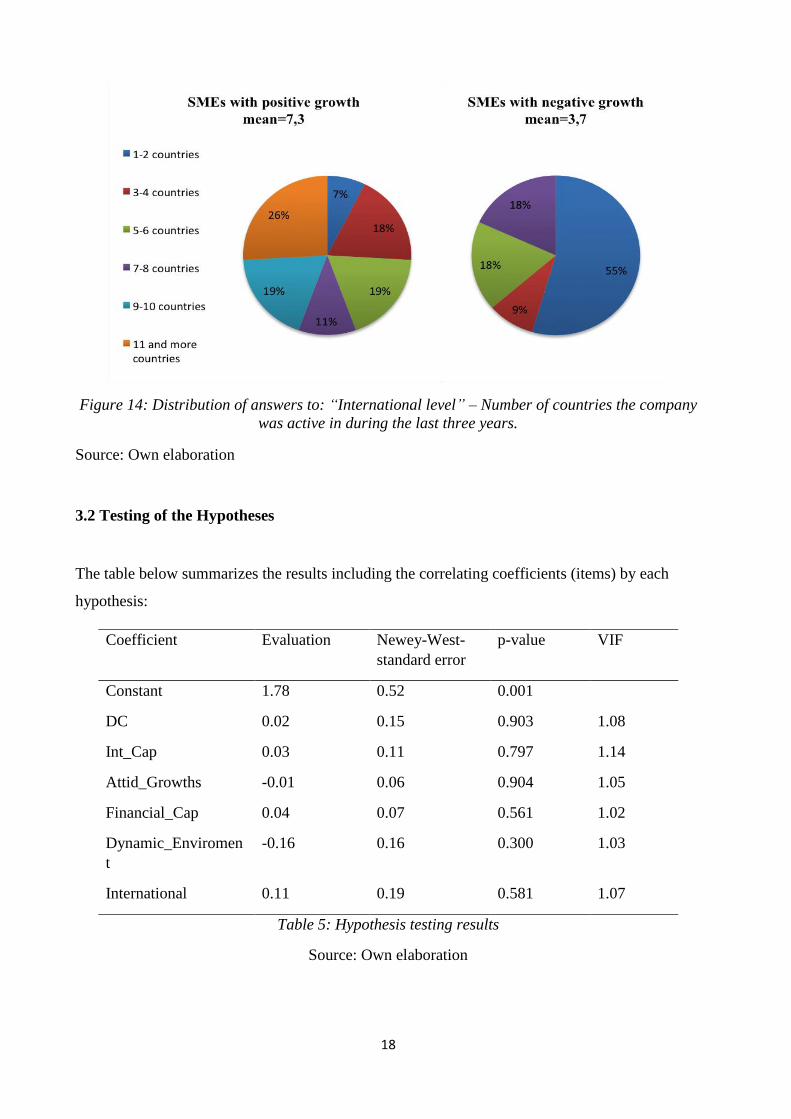
Figure 14: Distribution of answers to: “International level” – Number of countries the company
was active in during the last three years.
Source: Own elaboration
3.2 Testing of the Hypotheses
The table below summarizes the results including the correlating coefficients (items) by each
hypothesis:
Coefficient Evaluation Newey-West-
standard error
p-value VIF
Constant 1.78 0.52 0.001
DC 0.02 0.15 0.903 1.08
Int_Cap 0.03 0.11 0.797 1.14
Attid_Growths -0.01 0.06 0.904 1.05
Financial_Cap 0.04 0.07 0.561 1.02
Dynamic_Enviromen
t
-0.16 0.16 0.300 1.03
International 0.11 0.19 0.581 1.07
Table 5: Hypothesis testing results
Source: Own elaboration

19
Exploratory factor analysis:
In an exploratory factor analysis, the data must be checked firstly for their suitability for that
process. This is done through the Bartlett's test of correlation and the Kaiser-Meyer-Olkin
criterion. Here, the "measure of sampling adequacy" (short: MSA) is regarded as a key figure. In
literature, there is not one special, all-purpose method to test whether the items are sufficiently
correlated and whether they are suitable for an exploratory factor analysis. Therefore, it is
recommended to find several criteria for testing the correlations consulted. Furthermore, in
literature, there are no uniform guidelines for the decision of how many of the indicators must
meet certain criteria. This is another reason why it is recommended to check the suitability with a
variety of methods. If the majority of the criteria relates to the correlation established, one can
assume that there is an adequacy of the data. First, the procedure for Bartlett's test is described.
That provides the Bartlett test where a p-value is lower than the significance level so that a
significant correlation between the items can be found. Furthermore, an MSA can be calculated
for each individual item. The MSA is a quality measure, which represents information about the
togetherness of the items and which is a measure of the suitability of items for factor analysis.
The MSA can take values between 0 and 1. Items with values below 0.5 should be excluded from
the factor analysis. The higher the MSA, the more it is a tribute for the suitability of the item.
These recommended guidelines are stressed in the current literature. The table below shows the
standard values with the associated "value" which are specified in the table below.
MSA Suitability
≥ 0,9 "amazing"
≥ 0,8 "meritorious"
≥ 0,7 "pretty good"
≥ 0,6 "mediocre"
≥ 0,5 "miserably"
< 0,5 "intolerable"
Table 6: MSA.
Source: own elaboration

20
H1: Confirmed: The systemic integration of a SME's ability to detect opportunities and
take advantages to exploit and continuously approve its resources base and has a
positive influence on the growth of small and medium sized enterprises.
H 2: Confirmed: The intellectual capital within the companies has a positive influence on
growth.
H 3: Confirmed: The availability of financial capital and growth correlate positively.
H 4: Rejected: The growth attitude taken by the management directly influences SME
growth in a positive way.
H 5: Confirmed: The dynamism of the environment has a direct negative influence on
SME growth.
H 6: Confirmed: The international market orientation has a positive influence on growth.
Table 7: Results summary
Source: Own elaboration
3.3 Discussion of the Results
This researches addresses to fill a gap between the largely explored theoretical insights on
dynamic capabilities and field work results. The influence of Dynamic Capabilities on business
growth has been largely explored theoretically in the literature, but there are quite few empirical
studies. A questionnaire was elaborated on the basis of existing knowledge within the research
plan. This questionnaire was be pre-tested on a reduced sample of SMEs and after that finally
agreed and conducted.
The main objective of the thesis is to determine the main factors underlying the growth of SMEs
in Germany during a five year window. A conceptual model was developed in order to establish
the relationships between intellectual capital variables, financial capital variables and dynamic
capabilities with business growth. The relevant number of companies for a survey was identified.
The data gathered by this survey provides the results of the questionnaires containing a time-
frame of three years, between 2012 and 2014. At first glimpse this period might be considered as
not up-to-date. However, the background for this special timeframe can be explained by the fact
that valid data for German SME is usually available at the end of the following year due to tax
regulations. This means that results for 2014 are still relatively current as the data was conducted

21
during the field work at the end of 2015. The most important focus and aim of this research was
to show the development of the growth with regard to the dynamic capabilities. For this purpose
the chosen time frame was constructive. Two further general considerations should be
highlighted:
Firstly, the results of this research can be at least partly transferred for SME in entire Germany.
As described in the previous chapter the area of North-Rhine Westphalia is often used for
nationwide forecasts. The special meaning of SME within this sector and area for the German
economy is largely recognised. North-Rhine-Westphalia in general and especially the Rhine-
Ruhr area is therefore used to establish forecasts to be applied to Germany (e.g. BMWi, 2014).
Although the results are limited since the companies are all situated in one area they can at least
partly be applied to Germany and to a certain degree to companies within Europe. To get better
results a study with a larger number of nation- wide companies would lead to more valid data.
Secondly, the attitude towards growth was evaluated by the questionnaires of the current
Managers, which might not be the same persons two years ago. Therefore the results might
include a gap between the attitude of the current and former Mangers, if they were not identical.
Notwithstanding, the current attitude is reflected by the questionnaire results and further
compared with the development of growth which matches with the aim of this field work as
latterly described.

22
4. CONCLUSIONS AND FINDINGS
Summarized, all hypotheses were verified except for Hypothesis 4 “The growth attitude taken by
the management directly influences SME growth in a positive way” which was rejected. As
described in the previous chapter, the testing of the remaining hypotheses led to distinct, positive
results. By this chapter, the earlier insights are summarized to allow an overview of the entire
testing results. Before that, another interesting finding in addition to hypothesis number six,
concerning the international orientation of the companies, which is more of a descriptive nature:
Those companies with a positive growth are having an international relation with almost two
times more companies than the ones with a negative growth. So to have a higher number of
clients and customers on an international level leads by trend to a higher chance to generate
growth. An expansion of the potential customers beyond the borders is an appropriate approach
to generate growth.
Hypothesis one can be considered confirmed. It is indicated by the coefficients i.e. items DC
which show positive algebraic signs (Table 23). The correlation between the dynamic capabilities
within the companies and growth was proved. This means especially, that the ability to
implement a successful sensing and seizing of the environment and to react properly by adapting
the range of products or services. In this meaning, it also leads to the conclusion that dynamic of
the environment and the markets demand quick and adequate reactions of the companies.
Hypothesis two can be considered confirmed. The intellectual capital of the companies is a
meaningful element to generate growth. It is an overall requirement to implement necessary
developments to be equal with the demands of the markets and wit the customers’ needs which
finally leads to growth. Thus, not only the outcome with relation to technical progress or product
extensions is supported by a certain intellectual capital. Furthermore, the creativity and tendency
towards innovation is only possible with a certain intellectual capital.
Hypothesis three can be considered confirmed. Although it might seem trivial, it is worth
checking the financial framework and conditions in order to generate growth. Especially start-ups
in the IT sector could become successful with a relatively small capital-base by placing new
products and services. However, away from these phenomenons, the companies of this study
need a regular financial base if to generate growth.
Hypothesis four is not confirmed. The coefficients of attitude to growth have a corresponding
negative algebraic sign to the respective hypothesis. This is the technical background of this
insight and it does not allow a distinct confirmation of the hypothesis. Among several theoretical

23
explanation possibilities, one assumption is that the effect on the growth is in fact less important
than expected. This would mean that a company would grow more or less independent from the
manager’s or owner’s intention. So in a way, success would lead to growth if the dynamic and
financial capabilities, the processes and product and the environment and so on are established
successfully and following the demand of the markets. Growth would be a “function” of a
successful management.
Hypothesis five is confirmed. The dynamism of the environment leads to a direct negative
influence on growth. The higher the environmental dynamic is, the more it forces the entire
company to react, reorganize, reassemble and develop its entire range of products and services. In
this sense, it is laterally reversed to the dynamic capabilities checked by hypothesis one. A highly
dynamic environment can overburden the dynamic capabilities and, even if they are established
and organized, influence growth directly negative.
Hypothesis six is also confirmed. An international orientation of the SMEs within this study led
to positive growth. It is therefore important, as the SMEs in the manufacturing sector were
traditionally considered as the work bench for the big industries, in particular the coal mining and
steel sector in North Rhine-Westphalia as described in the first chapters. The confirmation of this
hypothesis shows that the internationalization of SMEs can be found in any sector and region and
constraints the changing structures, summarized by the term globalisation.
The size of the sample for this research was not big enough to allow conclusions for SMEs in
entire Germany. The structure environments of SME vary too much from each other to allow
general insights without a responding number of participating companies. However, restricted in
terms of the samples size, this explorative study allows following scientific findings:
1. I could show that there is a correlation between the elements of the dynamic capabilities
approach and growth among the tested companies.
Analysing the responses of the companies, I could add the results of a field study to the largely
existing theoretical insights. I was able to show that growth and dynamic capabilities bridged the
gap partly between theoretical assumptions and tested results.
2. With this research, the importance of the dynamic abilities for success of the companies was
proved: I was able to show that companies need to establish dynamic capabilities in order to
generate growth. Solely good products and or services are not sufficient to generate growth.

24
3. In my research, I explored that an international orientation correlates positively with growth.
This insight goes hand in hand with contemporary scientific assumption.
Due to fieldwork results, I could show that an international orientation is a part of a promising
approach for German SMEs to generate growth.
4. I examined the interactions between the environment and the companies which are surrounded
by it:
Based on the answers to the questionnaire, I could show that a dynamic environment has a direct
negative influence on growth.
5. I also highlighted that financial capabilities are needed in order to have a certain degree of
freedom to generate growth:
This also is a very important finding since it proves that a certain amount of financial capital is
needed to become or keep being a successful company. This assumption might seem like a
bromide, however, it stresses that basic economic adoptions are still relevant.
6. Finally, I could show that there a risk-avoiding tendency of German SME as a cultural pattern
and not only an element for the German Mittelstand phenomenon (the latter finding leads to a
strong recommendation towards the Management members especially in the light of the fast
changing frameworks caused by the globalisation or the demographic change to find a new
approach and to accept risk in a reasonable extent).

25
5. References
BACKHAUS, K., ERICHSON, B. WULFF, P. AND WIVES, R. (2003): Multivariate Analysis.
An Application-Oriented Introduction, 10th edition, Springer, Berlin.
BMWi – GERMAN MINISTRY OF ECONOMIES AND TECHNOLOGY (2013): German
SME: Engine of the German Economy. Federal Ministry of Economics and Technology, Public
Relations Division, Berlin.
CHANG ET AL. (2010): Common Method Variance in International Business Research. Journal
of International Business Studies, Vol. 41, No. 2, pp. 178-184.
DAVIDSSON ET AL. (2010): Small Foundations and Trends in Entrepreneurship, Vol. 6, pp.
69-166.
DSGV – GERMAN BANK AND CREDIT INSTITUTIONS (2012): Diagnose SME 2012:
German SMEs – Stable even in Difficult Times, Berlin.
GERMAN DEVELOPMENT LOAN COOPERATION (Bank für Wiederaufbau), KfW (2013):
Profile: The SME Sector in Germany. KfW Bank-Group, Frankfurt, Germany.
GERMAN PUBLIC EMPLOYMENT SERVICE (2016): The Youth Unemployment in Germany
and Europe. Statistical Report and Background. Nürnberg/Germany.
FONGER, J. (2016): Dynamic Capabilities and Growth of German Small and Medium Sized
Companies, Journal of Business and Economics, Vol. 10, p. 1743-1754.
HÄDER, M. (2006): Empirical Social Research. An Introduction, 1st edition, Germany.
LEHNFELD, M. (2013): SME in Germany: Well Financed, Innovative, Export-Oriented.
Germany Trade & Invest, Berlin.
OECD (2005): SME and Entrepreneurship Outlook: OECD, p. 17, Paris.
REICH, M., FONGER, J. (2013). Corporate Integration Management / Disability Management
Strain or Chance for German SME, pp. 72-79.
TCHOUVAKHINA, M., SCHWARTZ, M. (2013): Diversity is Crucial: How the SME Sector in
Germany Compares with Others in Europe. KFW Economic Research, Focus on Economics, No.
24, July 2, 2013.
WIKLUND, J., PATZELT, H., SHEPHERD, D. A. (2009): Building an Integrative Model of
Small Business Growth. In: Small Business Economics, Vol. 32, pp. 351-374.

26
ZIEGENBALG, C., MUNTEANU, O., WELCK, H., SEIDEL, K. (2010): Comprehensive
Analysis of Programmes and Initiatives in Germany that Assist the Collaboration between
Science and SME. Report conducted for the European Commission MaPEer SME, December
2010.

27
6. List of publications related to the dissertation
Conference Proceedings:
1.) Reich, M., Fonger, J. (2012). The Challenges for the Human Resource Management in
German Small and Medium Sized Enterprises (SME) in Connection With the
Demographic Change, pp. 177-182, ISBN 978-963-269-319-4.
2.) Fonger, J., Reich, M. (2012). New Public Management - Impacts of a Controlling System
Implementation and the Framework Conditions, pp.60-64, ISBN 978-963-269-319-4.
3.) Fonger, J., Reich, M. (2012). The Support of Integration into the German Labour Market for
People with Disabilities, pp. 55-59, ISBN 978-963-269-319-4.
4.) Reich, M., Fonger, J. (2013). Corporate Integration Management / Disability Management
Strain or Chance for German SME, pp. 72-79, ISBN 978-80-552-1026-1.
5.) Reich, M., Fonger, J. (2015). The Integration of Disabled People into the German Labour
Market - How the Workplace Health Management Is Able to Complement the Existing
Tools, pp. 248-254, ISBN 978-963-269-492-4.
Monographs:
1.) Reich, M., Fonger, J. (2012). The Impacts of the Demographic Change for the Human
Resource Strategies of German Small and Medium Sized Enterprises, pp. 87-97, ISBN
978-963-269-327-9.
Journals:
1.) Reich, M., Czeglédi, C., Fonger, J. (2015). Expectations of Employees on the Effects of the
Workplace Health Management as a Part of an Internal Diversity Management - An
Explorative Study, Business Trends, Vol. 5 (2), p. 49-58, ISSN 1805-0603.
2.) Czeglédi, C., Reich, M., Fonger, J. (2015). Workplace Health Management as a Diversity
Management Tool, American International Journal of Social Science, Vol. 4 (5), p. 192-
198, ISSN 2325-4149 (Print), ISSN 2325-4165 (Online).
3.) Czeglédi, C., Fonger, J., Reich, M. (2016). EU Policies to Support Small and Medium Sized
Enterprises and the German Mittelstand, Scientific Journal of the Babeş-Bolyai University
of Cluj-Napoca, Romania “Managerial Challenges of the Contemporary Society” Vol. 8
(1), p. 103-109, ISSN 2069-4229.
4.) Fonger, J., Reich, M. (2016). The Integration of Disabled People into the German Labour
Market - How the Workplace Health Management Is Able to Complement the Existing
Tools, Journal of Business and Economics, USA, Vol. 7 (1), p. 148-154, ISSN 2155-7950.
5.) Fonger, J. (2016): Dynamic Capabilities and Growth of German Small and Medium Sized
Companies, Journal of Business and Economics, Vol. 10, p. 1743-1754 ISSN 2155-7950.