Embed Size (px)
Citation preview
i
Doctoral Thesis
Investigating the efficacy of Cognitive Bias Modification for Interpretation and the Maudsley
Review Training Programme on social anxiety and reasoning biases in individuals with
persecutory delusions: a single case series.
James Hurley
Primary supervisor: Dr Jo Hodgekins
Submission date: 1st July, 2014
Word count: 36,940
Thesis submitted in part fulfilment of the degree of
Doctoral Programme in Clinical Psychology
University of East Anglia
© This copy of the thesis has been supplied on condition that anyone who consults it is
understood to recognise that its copyright rests with the author and that use of any
information derived there from must be in accordance with current UK Copyright Law.
In addition, any quotation or extract must include full attribution.
ii
Abstract
The Threat Anticipation Model (Freeman, 2007) implicates social anxiety and reasoning
biases in the formation and maintenance of persecutory delusions. Computerised packages,
such as Cognitive Bias Modification for Interpretation (CBM-I) have been shown to improve
social anxiety in psychosis (Turner et al., 2011). Similarly, the Maudsley Review Training
Programme (MRTP) has improved reasoning biases associated with delusions (Waller et al.,
2011). This study examined the use of both of these treatment packages in people with
persecutory delusions. It was hypothesised that CBM-I would reduce social anxiety, but not
reasoning biases and that the MRTP would reduce reasoning biases, but not social anxiety. It
was also hypothesised that both packages would reduce paranoia. A single case series design
with twelve participants from Early Intervention and Recovery services in Norfolk was used.
Measures of social anxiety, paranoia and reasoning biases were taken during baseline,
package and one-month follow up. Data were analysed according to Kazdin’s (2010) criteria
and were inspected for clinical and reliable change. Complimentary analyses were also
performed using Simulation Modeling Analysis (Borckardt, 2006) and inferential statistics.
Results indicated mixed support for the first hypothesis and moderate support for all other
study hypotheses. Paranoia reduced in line with reductions in social anxiety and/or reasoning
biases in eight cases. In two cases, no improvement in social anxiety or reasoning biases
corresponded with lack of improvement in paranoia. The remaining two cases contradicted
any relationship between improved social anxiety, reasoning biases and paranoia. These
findings support the Threat Anticipation Model (Freeman, 2007), suggesting that social
anxiety and reasoning biases are distinct mechanisms in the formation of paranoia that have
unique aetiology and treatment responses. Computerised therapy may help people who are
unwilling to engage with services and reduce cost of provision.
iii
Acknowledgements
My sincerest gratitude must first go out to Dr Jo Hodgekins, whose expertise, tireless
patience and hard work made this project what it is. I learned so much from her during this
process. I am very grateful to Dr Helen Waller and Dr Suzanne Jolley for kind permission to
use the reasoning package and for helpful suggestions. Similarly, I am indebted to Dr Ruth
Turner, for allowing me to use her CBM-I scenarios. I would like to thank Prof David
Fowler for helping me to develop his original idea and for helpful comments. I would also
like to thank Prof David Peck for invaluable advice about single case series methodology and
statistical testing.
A big thanks to my ClinPsyD Cohort for being supportive of each other – in particular to
Liam McNally, who shared many an interesting discussion as to how to get the best out of
our data.
Thanks to my friends and family for everything – particularly Dina, who greatly helped with
advice, support and a great deal of patience while I was under a lot of stress.
I would like to say a big thank you to the professionals in Kings Lynn Early Intervention and
Recovery services for field supervision and assistance with recruitment.
Finally, I owe a huge debt of gratitude to the twelve research participants who were so
generous with their time, energy and motivation. I hope for those who found the study to be
helpful to them that it still is so. Their courage and humour in the face of great adversity
inspires me.
iv
Contents
Abstract .............................................................................................................................. ii
Acknowledgements ............................................................................................................ iii
Contents……………………………………………………………………………………iv
List of tables........................................................................................................................ xv
List of figures.......................................................................................................................xix
Chapter 1: Introduction …………………………………………………………………. 1
1.1 Overview…………………………………………………………………….... 1
1.2 Introduction to psychosis and focus on persecutory delusions……………….. 1
1.3 Definition and prevalence of persecutory delusions………………………….. 1
1.4 Cognitive models of persecutory delusions………………………………….... 3
1.4.1 The Threat Anticipation Model (Freeman, Garety, Kuipers, Fowler,
Bebbington, 2002; Freeman, 2007)………………………………………………. 3
1.4.1.1 Affective processes – depression and negative schematic
beliefs………………………………………………………………………3
1.4.1.2 Emotional processes – anxiety……………………………..4
1.4.1.3 Reasoning biases………………………………………….. 6
1.4.1.4 Anomalous experiences…………………………….………8
1.4.1.5 Summary of the Threat Anticipation Model
(Freeman, 2007)…………………………………………………... 9
1.4.2 Cognitive models based on motivational theory…………………… 10
1.5 Summary and conclusion…………………………………………………….. 12
1.6 Systematic review of the efficacy of cognitive behavioural
therapies in treating persecutory delusions......................................................................... 12
1.6.1 Overview…………………………………………………………… 12
v
1.6.2 Search strategy…………………………………………………….. 12
1.6.3 Inclusion criteria…………………………………………………… 13
1.6.4 Evaluation of case studies…………………………………………. 21
1.6.5 Evaluation of group Studies……………………………………….. 24
1.6.6 Discussion…………………………………………………………. 29
1.6.6.1 Methodological issues regarding
the studies reviewed……………………………………………………… 29
1.6.6.2 Theoretical and clinical implications…………………….. 31
1.6.7 Conclusion…………………………………………………………. 32
1.7 Rationale for the current study………………………………………………. 33
1.7.1 Targeting social anxiety: cognitive bias modification
for interpretation (CBM-I)………………………………………………….……. 34
1.7.2 Targeting reasoning biases: the Maudsley Review Training
Programme (MRTP; Waller, Freeman, Jolley, Dunn and Garety, 2011)……….…... 36
1.7.3 The rationale for hypothesising differential effects of CBM-I
and the MRTP on social anxiety and reasoning biases………………..…………. 36
1.7.4 Research hypotheses……………………………………….………. 37
Chapter 2: Methods………………………………………………………….…………. 38
2.1 Participants……………………………………………………….…………... 38
2.2. Design…………………………………………………………..……………. 39
2.2.1 Measures……………………………………………………………...40
vi
2.2.1.1 The National Adult Reading Test
(NART; Nelson, 1982)……………………………………………..…….. 40
2.2.1.2 The PSYRATS-B (Haddock et al., 1999)…………..……. 40
2.2.1.3 The Social Interaction Anxiety Scale (SIAS;
Mattick & Clarke, 1998)………………………………………..………… 41
2.2.1.4 The Green et al., Paranoid Thoughts Scale (GPTS;
Green et al., 2007)……………………..…………………………..………. 41
2.2.1.5 The 85:15 and 60:40 Beads Tasks (Garety et al., 2005;
Dudley, Young, John & Over, 1997)………………………………..……... 42
2.2.1.6 Possibility of being Mistaken (PBM) and Reaction to
Hypothetical Contradiction (RTHC) items from the Maudsley
Assessment of Delusions Schedule (MADS; Wessely et al., 1993)…..….. 43
2.2.1.7 Explanations of Experiences Assessment
(EoE; Freeman et al., 2004)………………………………..……………… 43
2.2.1.8 Idiographic ratings of anxiety, conviction
and paranoia……………………………………………..………………… 44
2.2.1.9 Anecdotal qualitative observations from participants........... 44
2.3 Experimental manipulations…………………………………..………………. 44
2.3.1 Text-based CBM-I for social anxiety in psychosis,
vii
Turner et al. (2011)………………………………………………..……………...…. 44
2.3.2 The Maudsley Review Training Programme; the MRTP –
Waller et al. (2011)……………………………………………..………………...…. 46
2.3.3 Equipment…………………………………………..……………..….. 47
2.4 Procedure…………………………………………………..………………...….. 48
2.4.1 Ethical approval, consent and randomisation………..………….....….. 48
2.4.2 Assessment……………………………………..……………………... 50
2.4.3 Baseline period…………………………………..……………………. 50
2.5 Data analysis plan……………………………………….…………………….... 52
2.5.1 Hypothesis one: In comparison to baseline, five sessions of CBM-I will
reduce levels of social anxiety, but will not improve reasoning …………………... 53
2.5.2 Hypothesis two: In comparison to baseline, five sessions of CBM-I will
correspondingly reduce levels of severity of paranoia ……………………………... 53
2.5.3 Hypothesis three: In comparison to baseline, five sessions of the
Maudsley Review Training Programme (MRTP) will improve reasoning, but will not
improve anxiety …………………………………………………………………...... 54
2.5.4 Hypothesis four: In comparison to baseline, five sessions of MRTP will
result in a corresponding reduction in
paranoia……………………………………………………………………………... 54
2.5.5 Statistical analysis……………………………………………………...54
viii
Chapter 3: Results…………………………………………….………………………….... 57
3.1 Overview…………………………………………………………………………57
3.2. Data presentation and analysis…………………………………………………. 57
3.2.1 Visual inspection……………………………………………………… 57
3.2.2 Calculation of clinical and reliable change indices…………………… 59
3.2.2.1 Clinical change……………………………………………… 59
3.2.2.2 Reliable change………………………………………………59
3.2.3 Participant information…………………………………………………60
3.3 Participant 1………………………………………………………………………63
3.3.1 Social anxiety data……………………………………………………..63
3.3.2 Conviction data…………………………………………………….......64
3.3.3 Paranoia data…………………………………………………………...65
3.3.4 Reasoning data………………………………………………...……….66
3.3.5 Participant summary……………………………………..…………….67
3.4 Participant 2………………………………………………………..…………….68
3.4.1 Social anxiety data………………………………………………..……68
3.4.2 Conviction data……………………………………………………..….69
3.4.3 Paranoia data……………………………………………………..……70
ix
3.4.4 Reasoning data………………………………………………………....71
3.4.5 Participant 2 summary…………………………………………..……..72
3.5 Participant 3………………………………………………………………..…….73
3.5.1 Social anxiety data………………………………………………..……73
3.5.2 Conviction data……………………………………………………..….74
3.5.3 Paranoia data………………………………………………….…..……75
3.5.4 Reasoning data………………………………………………...……….76
3.5.5 Participant 3 summary……………………………………….…………77
3.6 Participant 4…………………………………………………………….………..78
3.6.1 Social anxiety data……………………………………….…………….78
3.6.2 Conviction data………………………………………….……………..79
3.6.3 Paranoia data……………………………………………….…………..80
3.6.4 Reasoning data…………………………………………………………81
3.6.5 Participant 4 summary……………………………………………….…82
3.7 Participant 5…………………………………………………………….………..83
3.7.1 Social anxiety data……………………………………….…………….83
3.7.2 Conviction data…………………………………………….…………..84
3.7.3 Paranoia data……………………………………………….…………..85

x
3.7.4 Reasoning data……………………………………………….………...86
3.7.5 Participant 5 summary…………………………………….……………87
3.8 Participant 6………………………………………………………….…………..88
3.8.1 Social anxiety data……………………………………………………..88
3.8.2 Conviction data…………………………………………...……………89
3.8.3 Paranoia data…………………………………………………..………90
3.7.4 Reasoning data…………………………………………………...…….91
3.8.5 Participant 6 summary………………………………………………….92
3.9 Participant 7……………………………………………………………………....93
3.9.1 Social anxiety data……………………………………………………..93
3.9.2 Conviction data………………………………………………...………94
3.9.3 Paranoia data…………………………………………………..……….95
3.9.4 Reasoning data…………………………………………………..……..96
3.9.5 Participant 7 summary…………………………………………...……..97
3.10 Participant 8……………………………………………………………………..98
3.10.1 Social anxiety data……………………………………………...…….98
3.10.2 Conviction data……………………………………………………….99
3.10.3 Paranoia data………………………………………………………..100
xi
3.10.4 Reasoning data………………………………………………………101
3.10.5 Participant 8 summary……………………………………………….102
3.11 Participant 9……………………………………………………………………103
3.11.1 Social anxiety data…………………………………………………..103
3.11.2 Conviction data……………………………………………………...104
3.11.3 Paranoia data………………………………………………………...105
3.11.4 Reasoning data……………………………………………………...106
3.11.5 Participant 9 summary………………………………………………107
3.12 Participant 10…………………………………………………………………108
3.12.1 Social anxiety data………………………………………………….108
3.12.2 Conviction data……………………………………………………..109
3.12.3 Paranoia data………………………………………………………..110
3.12.4 Reasoning data………………………………………………………111
3.12.5 Participant 10 summary……………………………………………..112
3.13 Participant 11…………………………………………………………………113
3.13.1 Social anxiety data………………………………………………….113
3.13.2 Conviction data……………………………………………………..114
3.13.3 Paranoia data………………………………………………………..115
xii
3.13.4 Reasoning data………………………………………………………116
3.13.5 Participant 11 summary……………………………………………………..117
3.14 Participant 12…………………………………………………………………118
3.14.1 Social anxiety data………………………………………………….118
3.14.2 Conviction data……………………………………………………...119
3.12.3 Paranoia data………………………………………………………120
3.14.4 Reasoning data……………………………………………………..121
3.14.5 Participant 12 summary……………………………………………122
3.15 Hypothesis one: In comparison to baseline, five sessions of CBM-I will reduce
levels of social anxiety, but will not improve reasoning …………………………………123
3.16 Hypothesis two: In comparison to baseline, five sessions of CBM-I will
correspondingly reduce levels of severity of paranoia…………………………………….125
3.17 Hypothesis three: In comparison to baseline, five sessions of the Maudsley
Review Training Programme (MRTP) will improve reasoning, but will not improve
anxiety………………………………………………………………………………………126
3.18 Hypothesis four: In comparison to baseline, five sessions of MRTP will result in a
corresponding reduction in paranoia………………………………………………………..130
3.19 Relationship between social anxiety, reasoning biases and paranoia…………132
3.20 Chapter conclusion…………………………………………………………….136
Chapter 4: Discussion……………………………………………………………………..138
xiii
4.1 Chapter overview…………………………………………………………….....138
4.2 Aims…………………………………………………………………………….138
4.3 Summary of results……………………………………………………………..138
4.3.1 Hypothesis one: In comparison to baseline, five sessions of CBM-I will
reduce levels of social anxiety, but will not improve reasoning …………………...139
4.3.2 Hypothesis two: In comparison to baseline, five sessions of CBM-I will
correspondingly reduce levels of severity of paranoia…………………………….140
4.3.3 Hypothesis three: In comparison to baseline, five sessions of the
Maudsley Review Training Programme (MRTP) will improve reasoning, but will not
improve anxiety …………………………………………………………………...141
4.3.4 Hypothesis four: In comparison to baseline, five sessions of MRTP will
result in a corresponding reduction in
paranoia……………………………………………………………………………..142
4.3.5 The relationship between baseline characteristics and response...........143
4.3.6 The relationship between social anxiety, reasoning biases and
paranoia……………………………………………………………………………..143
4.4 Theoretical implications ………………………………………………..144
4.4.1 Social anxiety…………………………………………………………144
4.4.2 Interpretation biases and reasoning biases as distinct ………………..145
4.4.3 Support for the Threat Anticipation Model (Freeman, 2007)………..146
4.5 Clinical implications……………………………………………………………149
xiv
4.6 Limitations of the study ………………………………………………………...151
4.6.1 Study design ………………………………………………………….151
4.6.2 Discrepancy between idiographic and standardised ratings …………152
4.6.3 Interpretation bias ……………………………………………………154
4.6.4 Statistical analyses …………………………………………………...154
4.6.5 Anomalous experiences……………………………………………….155
4.6.6 Qualitative observations………………………………………………155
4.7 Advantages of the study………………………………………………………...155
4.8 Further research…………………………………………………………………156
4.9 Conclusion………………………………………………………………………158
References………………………………………………………………………………….159
Appendices…………………………………………………………………………………176
xv
List of Tables
Table 1.1 Studies reporting on the efficacy of differing cognitive behavioural therapies for
persecutory delusions, displayed in chronological order…………………………………….16
Table 3.1 Criteria for data evaluation in single-case series designs…………………….……57
Table 3.2 Clinical and demographic characteristics of participants……………………..…...61
Table 3.3 The content of the study participants’ delusions and initial conviction………..….62
Table 3.4 Results of visual inspection of social anxiety data in figure 3.1……………….….64
Table 3.5 Results of visual inspection of paranoia and conviction data in figures 3.2 and
3.3…………………………………………………………………………………………….66
Table 3.6 Standardised measures for participant 1 ……………………………………….…66
Table 3.7 Results of visual inspection of social anxiety data in figure 3.4………………..…69
Table 3.8 Results of visual inspection of paranoia and conviction data in figures 3.5 and
3.6………………………………………………………………………………………….…71
Table 3.9 Standardised measures for participant 2…………………………………………..71
Table 3.10 Results of visual inspection of social anxiety data in figure 3.7…………………74
Table 3.11 Results of visual inspection of paranoia and conviction data in figures 3.8 and
3.9…………………………………………………………………………………………….76
Table 3.12 Standardised measures for participant 3…………………………………………76
Table 3.13 Results of visual inspection of social anxiety data in figure 3.10………………..79
Table 3.14 Results of visual inspection of paranoia and conviction data in figures 3.11 and
3.12…………………………………………………………………………………………...81
xvi
Table 3.15 Standardised measures for participant 4…………………………………………81
Table 3.16 Results of visual inspection of social anxiety data in figure 3.13……………..…84
Table 3.17 Results of visual inspection of paranoia and conviction data in figures 3.14 and
3.15……………………………………………………………………………………...……86
Table 3.18 Standardised measures for participant 5…………………………………………86
Table 3.19 Results of visual inspection of social anxiety data in figure 3.16……………..…89
Table 3.20 Results of visual inspection of paranoia and conviction data in figures 3.17 and
3.18…………………………………………………………………………………...………91
Table 3.21 Standardised measures for participant 6…………………………………………91
Table 3.22 Results of visual inspection of social anxiety data in figure 3.19…………..……94
Table 3.23 Results of visual inspection of paranoia and conviction data in figures 3.20 and
3.21…………………………………………………………………………………...………96
Table 3.24 Standardised measures for participant 7…………………………………………96
Table 3.25 Results of visual inspection of social anxiety data in figure 3.22…………..……99
Table 3.26 Results of visual inspection of conviction and paranoia data in figures 3.23 and
3.24……………………………………………………………………………………....…101
Table 3.27 Standardised measures for participant 8………………………………………..101
Table 3.28 Results of visual inspection of social anxiety data in figure 3.25………………104
Table 3.29 Results of visual inspection of paranoia and conviction data in figures 3.26 and
3.27…………………………………………………………………………………….……106
xvii
Table 3.30 Standardised measures for participant 9…………………………………….…106
Table 3.31 Results of visual inspection of social anxiety data in figure 3.28………..….…109
Table 3.32 Results of visual inspection of conviction and paranoia data in figures 3.29 and
3.30…………………………………………………………………………………………111
Table 3.33 Standardised measures for participant 10…………………………………...…111
Table 3.34 Results of visual inspection of social anxiety data in figure 3.31…………...…114
Table 3.35 Results of visual inspection of paranoia and conviction data in figures 3.32 and
3.33……………………………………………………………………………………...…116
Table 3.36 Standardised measures for participant 11………………………………………116
Table 3.37 Results of visual inspection of social anxiety data in figure 3.34………………119
Table 3.38 Results of visual inspection of paranoia and conviction data in figures 3.35 and
3.36…………………………………………………………………………………….……121
Table 3.39 Standardised measures for participant 12………………………………………121
Table 3.40 Collated data on differential effects of CBM-I on social anxiety per
participant………………………………………………………………………………...…123
Table 3.41 Collated data on effect of CBM-I on paranoia per participant…………….……125
Table 3.42 Collated data on differential effects of the MRTP on reasoning biases per
participant……………………………………………………………………………...……127
Table 3.43 Frequency table for JTC and PBM data………………………………….……..128
Table 3.44 Frequency table for RTHC codes………………………………………….……129
Table 3.45 Collated data on effects of the MRTP on paranoia per participant…………..…131
xviii
Table 3.46 Relationships between improved social anxiety, improved reasoning biases and
paranoia……………………………………………………………………………….…….133
Table 3.47 Relationships between improved social anxiety, improved reasoning biases and
paranoia, according to package……………………………………………………......…....134
Table 3.48 Baseline variables that distinguish participants who benefitted from either or both
packages.................................................................................................................................135
xix
List of Figures
Figure 1.1 the Threat Anticipation Model (Freeman, 2007)………………………………….6
Figure 1.2 PRISMA diagram of systematic literature review ……………………….………15
Figure 2.1 Outline of four conditions to which participants were randomised…………...….40
Figure 2.2 Recruitment flowchart……………………………………………………...…….50
Figure 2.3 Participant flow diagram………………………………………………………….52
Figure 3.1 Participant 1 idiographic and standardised social anxiety scores………………...63
Figure 3.2 Participant 1 idiographic conviction scores……………………………………....64
Figure 3.3 Participant 1 idiographic and standardised paranoia scores……………………...65
Figure 3.4 Participant 2 idiographic and standardised social anxiety scores………………...68
Figure 3.5 Participant 2 idiographic conviction scores………………………………………69
Figure 3.6 Participant 2 idiographic and standardised paranoia ratings……………………..70
Figure 3.7 Participant 3 idiographic and standardised social anxiety scores…………….…..73
Figure 3.8 Participant 3 idiographic conviction scores………………………………………74
Figure 3.9 Participant three idiographic and standardised paranoia scores………………….75
Figure 3.10 Participant 4 idiographic and standardised social anxiety scores……………….78
Figure 3.11 Participant 4 idiographic conviction scores……………………………………..79
Figure 3.12 Participant 4 idiographic and standardised paranoia scores…………………….80
Figure 3.13 Participant 5 idiographic and standardised social anxiety scores……………….83
Figure 3.14 Participant 5 idiographic conviction scores……………………………….…….84
xx
Figure 3.15 Participant 5 idiographic and standardised paranoia scores…………………….85
Figure 3.16 Participant 6 idiographic and standardised social anxiety scores……………….88
Figure 3.17 Participant 6 idiographic conviction scores……………………………………..89
Figure 3.18 Participant 6 idiographic and standardised paranoia scores…………………….90
Figure 3.19 Participant 7 idiographic and standardised social anxiety scores…………….…93
Figure 3.20 Participant 7 idiographic conviction scores……………………………….…….94
Figure 3.21 Participant 7 idiographic and standardised paranoia scores…………...….…….95
Figure 3.22 Participant 8 idiographic and standardised social anxiety scores…………….…98
Figure 3.23 Participant 8 idiographic conviction scores………………………………..……99
Figure 3.24 Participant 8 idiographic and standardised paranoia scores…………………...100
Figure 3.25 Participant 9 idiographic and standardised social anxiety scores……………...103
Figure 3.26 Participant 9 idiographic conviction scores across all conditions…………..…104
Figure 3.27 Participant 9 idiographic and standardised paranoia scores………………...…105
Figure 3.28 Participant 10 idiographic and standardised social anxiety scores……….……108
Figure 3.29 participant 10 idiographic conviction scores…………………………….…….109
Figure 3.30 participant 10 idiographic and standardised paranoia scores…………………..110
Figure 3.31 Participant 11 idiographic and standardised social anxiety scores……….……113
Figure 3.32 Participant 11 idiographic conviction scores…………………………….…….114
Figure 3.33 Participant 11 idiographic and standardised paranoia scores………………….115
Figure 3.34 Participant 12 idiographic and standardised social anxiety scores…………….118
Figure 3.35 Participant 12 idiographic conviction scores…………………………………..119

xxi
Figure 3.36 Participant 12 idiographic and standardised paranoia scores…………..…….120
1
Introduction
1.1 Overview
This thesis will focus on investigating whether Cognitive Bias Modification for
Interpretation (CBM-I) and the Maudsley Review Training Programme (MRTP) affect social
anxiety and reasoning biases in a differential manner within a sample of individuals with
persecutory delusions. This chapter will begin with a brief introduction to psychosis and the
potential advantages of targeting single symptoms in psychosis. A psychological
understanding of persecutory delusions will be described using three influential models, each
of which will be briefly evaluated. The literature regarding cognitive behavioural treatments
for persecutory delusions will be reviewed. Finally, the rationale for this thesis will be
outlined.
1.2 Introduction to psychosis and focus on persecutory delusions
Psychosis is an umbrella term for various clinical presentations, mainly characterised
by distorted thinking and perception. Psychosis comprises positive symptoms, such as
hallucinations and delusions, and negative symptoms, e.g., anhedonia and alogia (ICD-10,
WHO, 2010). This thesis will focus specifically on persecutory delusions, defined as firmly
held threat beliefs that other people, groups or entities are deliberately causing psychological
or physical harm, which are unfounded, resistant to change, preoccupying and distressing to
the individual concerned (Freeman, 2007).
1.3 Definition and prevalence of persecutory delusions
Freeman and Garety (2000) proposed criteria which focus more on the form of the
delusion, rather than specific themes. The criteria are: (a) belief that harm is presently being
inflicted upon the individual, or that harm is imminent, and (b) belief that the persecutor has
the intention to inflict harm on the individual. These criteria will be adopted for the purpose
of the current study. What constitutes harm is also clarified: any harm – whether
2
psychological (e.g., irritation or humiliation) or physical (e.g., poisoning or cutting out parts
of organs) – should be considered persecutory in nature. Only beliefs about harm being
inflicted are considered persecutory; thereby addressing the potential over inclusiveness of
ideas of reference (e.g., government agencies monitoring phone calls, but without any
intention to cause distress), as well as of persecution in research samples.
After ideas of reference, delusions of persecution are the second most common
symptom encountered in psychosis (Andreasen et al. 1991; Freeman, 2007). In a study of
1,136 acutely hospitalised patients, 4.4% experienced at least one persecutory delusion,
which represented 78.4% of the 328 people in that sample with a delusion (Appelbaum,
Robbins & Roth, 1999). Sartorius et al. (1986) found that almost 50% of their international
sample of individuals with signs of schizophrenia (N=1379) experienced persecutory
delusions. Persecutory delusions can also be found among individuals with various
diagnoses other than schizophrenia; 44% of a sample of 136 people with unipolar depressive
psychosis experienced persecutory delusions (Frangos, Athanassenas, Tsitourides,
Psilolignos & Katsanou, 1983). They are also prevalent in bipolar disorder, with one review
estimating a frequency of 28% in the manic phase (Goodwin & Jamison, 1990).
The majority of current studies that have examined efficacy of cognitive therapies
have done so using samples comprising a range of differing psychotic experiences, or
delusions of varying subtypes (e.g., Freeman et al., 1998). Although useful, multi-symptom
research does little to identify specific mechanisms of change or improvement because the
symptom profiles of the psychoses are heterogeneous (Garety et al., 2008). It may be a
reason why effect sizes of cognitive behavioural therapy (CBT) for psychosis are estimated at
small to moderate (Wykes, Steel, Everitt & Tarrier, 2008; Jauhar, McKenna, Radua, Fung,
Salvador & Laws, 2014). As a result, there has been a move towards a single-symptom
approach to both research and clinical work (Garety et al., 2008), which should improve
3
clarity of what is being examined, increase confidence in the evidence, and enhance
understanding of the specific components of therapy which are most effective.
Having explored the merits of clearly defining persecutory delusions, and single-
symptom research in psychosis, the next section will examine cognitive models of threat
beliefs. This thesis will focus on the Threat Anticipation Model (Freeman, 2007), which will
inform the research questions and hypotheses.
1.4 Cognitive models of persecutory delusions
There are many cognitive models of persecutory delusions to explain their onset and
maintenance. Most of them fall into two different perspectives; the first approaches
persecutory delusions from the writings of Maher (1974), which are characterised by
experiences that drive a search for meaning by the individual. The second perspective stems
from motivational theory.
1.4.1 The Threat Anticipation Model (Freeman, Garety, Kuipers, Fowler,
Bebbington, 2002; Freeman, 2007). The Threat Anticipation Model (Freeman, 2007)
proposes that persecutory delusions arise due to an interaction between vulnerability and
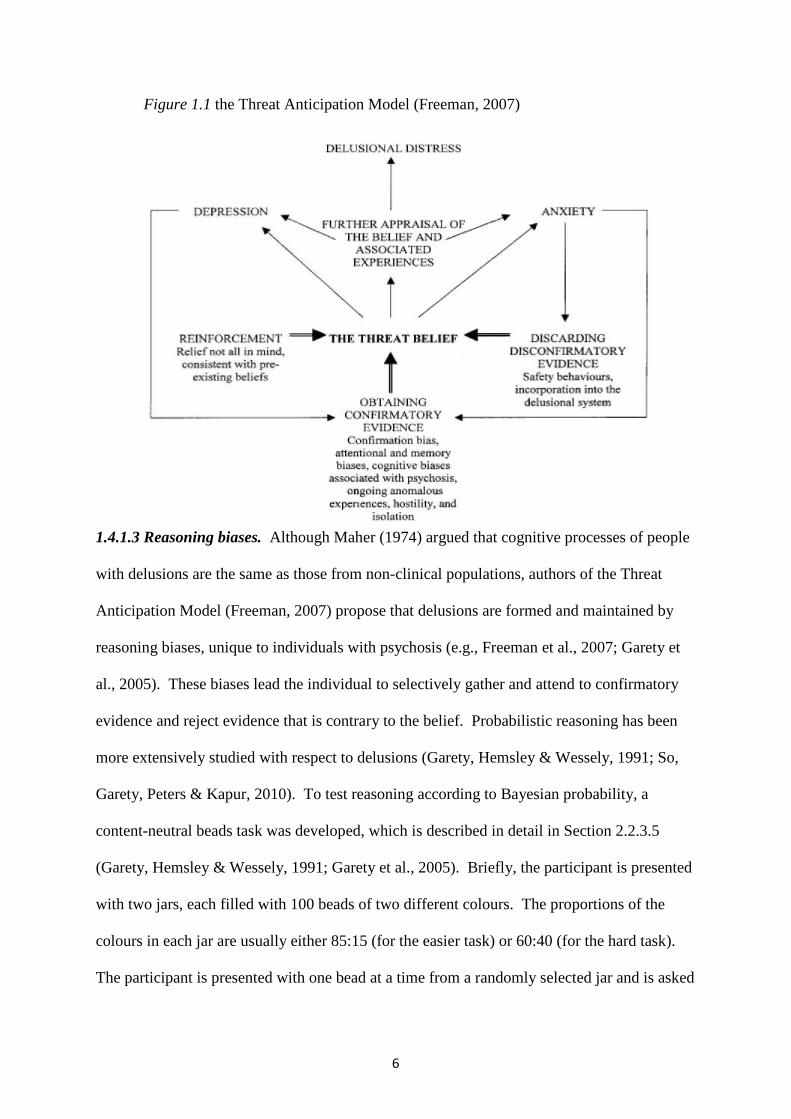
stress (Freeman et al., 2002; Freeman, 2007). Figure 1.1 outlines the Threat Anticipation
Model (Freeman, 2007) of persecutory delusions. Persecutory ideation arises due to attempts
to make sense out of internal or external experiences that are unusual, anomalous, or
emotionally salient. Three pathways to formation and maintenance of persecutory beliefs are
postulated: anomalous experiences, emotional processes and reasoning biases.
1.4.1.1 Affective processes – depression and negative schematic beliefs. Depression
is known to be highly prevalent among people with psychosis (Buckley, Miller, Lehrer &
Castle, 2009). However, cross-sectional data put depression at the core of persecutory
delusions also; Freeman, Garety and Kuipers (2001) found that 80% of their sample of people
with persecutory delusions also presented with significant severity levels of depression, with
4
a mean Beck Depression Inventory (BDI) score of 23. The role of depression is implicated in
the Threat Anticipation Model (Freeman, 2007), but not in the same way as anxiety. First,
the relationship between depression and paranoia is less clear (Freeman, 2007). Second,
depression is considered to be influential in the development of specific themes of
persecutory ideation, as well as having a causal role in onset and maintenance.
In summary, depression does seem to be an important component of persecutory
ideation. Recent studies indicate that there may be processes similar to both depression and
persecutory ideation or paranoia (Freeman, 2007). This is important to bear in mind when
formulating and developing treatments for persecutory delusions which present with
depression. Having briefly discussed the importance of depression, the next section will
consider the role of anxiety in persecutory ideation.
1.4.1.2 Emotional processes – anxiety. Differing forms of anxiety (such as social
anxiety, state anxiety, or worry of an interpersonal nature) are argued to be central in the
formation and maintenance of persecutory beliefs. This is because the psychological
processes underlying persecutory and anxious thoughts are both concerned with the
anticipation of physical, social or psychological harm (Freeman et al., 2002). Anxiety may
therefore breed paranoid thinking, which in turn plays a part in the formation and
maintenance of persecutory ideation (Freeman, 2007). Social anxiety itself is defined as a
fear of being negatively judged or scrutinised by others (Colman, 2006), which conceptually
overlaps with clinical phenomena such as interpersonal sensitivities, worry and paranoia.
The model hypothesises that the experience of social anxiety in itself is misinterpreted by the
individual as objective evidence of threat. Similar to how avoidance and biased
interpretation of social information drives and maintains social anxiety (Clark & Beck, 2010),
avoidance and biased interpretation of social information maintain threat beliefs because they
5
makes the individual’s social world more constricted, limiting the amount and diversity of
potentially disconfirming information.
Research indicates that anxiety is strongly associated with paranoia and with
persecutory delusions (e.g., Freeman & Garety, 1999; Startup, Freeman & Garety, 2007).
Empirical evidence has indicated a causal and maintaining role for social anxiety in an urban
setting in persecutory delusions (e.g., Ellett, Freeman & Garety, 2008). Attempts to identify
differential cognitive and behavioural responses among individuals with persecutory
delusions and individuals with social phobia were not found, suggesting overlap between the
clinical phenomena (e.g., Newman-Taylor & Stopa, 2013). The authors note that individuals
with persecutory delusions may present with cognitive and behavioural responses
characteristic of social phobia, which lends further support to the idea of a hierarchy of
paranoia (Freeman et al., 2005a) that first builds upon social evaluative concerns.
Large longitudinal cohort studies (e.g., Schutters et al., 2012), show that social
anxiety cognitions predict later onset of paranoid symptoms. Research has found anxiety and
interpersonal sensitivity to be significant predictor variables of unfounded persecutory
thinking (e.g. Freeman et al., 2003, 2005b). Furthermore, differential predictor variables of
social anxiety and paranoia were examined. The key variable that increased the risk for
paranoia rather than social anxiety was presence of perceptual anomalies (Freeman, 2008).
This means that emotional disturbance can lead to social anxiety, but the presence of
anomalous experiences – experiences unique to psychosis – makes paranoia more likely. The
following section will discuss the second focus of this study – reasoning biases.
6
Figure 1.1 the Threat Anticipation Model (Freeman, 2007)
1.4.1.3 Reasoning biases. Although Maher (1974) argued that cognitive processes of people
with delusions are the same as those from non-clinical populations, authors of the Threat
Anticipation Model (Freeman, 2007) propose that delusions are formed and maintained by
reasoning biases, unique to individuals with psychosis (e.g., Freeman et al., 2007; Garety et
al., 2005). These biases lead the individual to selectively gather and attend to confirmatory
evidence and reject evidence that is contrary to the belief. Probabilistic reasoning has been
more extensively studied with respect to delusions (Garety, Hemsley & Wessely, 1991; So,
Garety, Peters & Kapur, 2010). To test reasoning according to Bayesian probability, a
content-neutral beads task was developed, which is described in detail in Section 2.2.3.5
(Garety, Hemsley & Wessely, 1991; Garety et al., 2005). Briefly, the participant is presented
with two jars, each filled with 100 beads of two different colours. The proportions of the
colours in each jar are usually either 85:15 (for the easier task) or 60:40 (for the hard task).
The participant is presented with one bead at a time from a randomly selected jar and is asked
7
to decide from which jar the beads have come. If a participant has decided which jar it is
after two or fewer beads, then they have made a hasty decision, according to Bayesian
probability (Garety et al., 1991). The tendency to make hasty decisions based on insufficient
evidence (e.g., to decide which jar the beads were drawn from after seeing two or less beads)
has been termed the jumping to conclusions (JTC) reasoning bias. Freeman (2007) reviewed
the literature and found that in the ten such studies published at the time, all ten showed
significantly hastier data gathering within the delusions groups, compared with non-clinical
controls. JTC may also be related to strength of belief conviction (Garety et al., 2005).
Data on the relationship between JTC and persecutory delusions is less clear.
However, several studies have found significant JTC biases in persecutory delusions samples,
compared with matched non-clinical controls (Conway et al., 2002; Startup, 2004; Startup,
Freeman & Garety, 2008), indicating that JTC may also be implicated in this particular
clinical group.
Other types of reasoning biases proposed within the model include lack of belief
flexibility, which is an inability to reflect on and alter one’s own beliefs through the iterative
process of generating and considering alternative explanations. This style of reasoning has
been quantified in three different ways; (1) asking the participant if there is any possibility
that they could be mistaken about their belief and noting their response; (2) presenting the
individual with a hypothetical scenario that contradicts their belief, and recording their
responses to it; and (3) asking the participant to consider any other possible alternative
explanations for their experiences that have led them to form their belief, even if they think
they are unlikely. The measures used for these biases include the Possibility of Being
Mistaken (PM) and Reaction to Hypothetical Contradiction (RTHC) components of the
Maudsley Assessment of Delusions (MADS; Wessely et al., 1993). The third construct is
measured from the Explanations of Experiences assessment (Freeman et al., 2004). Belief
8
inflexibility, measured by these three constructs, has been found to be significantly elevated
in samples of individuals with delusions and has been associated with increased delusional
conviction (Garety et al., 2005; Freeman et al., 2004; So et al., 2012). The relationship
between belief inflexibility and persecutory delusions is unclear at present. However, it
seems likely that belief inflexibility is associated with persecutory delusions, given the fact
that in one large study (So et al., 2012), 57.5% of a sample of 273 individuals with delusions
reported persecutory delusions in particular, and belief inflexibility was found to be
significantly inversely correlated with level of conviction of the overall sample.
1.4.1.4 Anomalous experiences. Anomalous experiences are explained as a
dysfunction in cognitive processes that situate and disambiguate internal perceptual processes
as originating from and remaining within the individual’s mind. In other words, anomalous
experiences occur from inner-outer confusion (Fowler, 2000; Frith, 1992). Using the
example of auditory hallucinations, thoughts that originate from the mind of the individual
are experienced as auditory perceptions that seem external. Passivity phenomena, ideas of
reference and other psychotic experiences may also be explained by inner-outer confusion.
Some empirical findings support the above hypotheses (e.g., Green & Kinsbourne,
1990) however; a detailed review is beyond the scope of this section. Data linking
anomalous experiences to persecutory delusions specifically is limited, due to methodological
problems (Freeman, 2007). Anomalous experiences have been shown to differentially
predict paranoia and not social anxiety (Freeman et al., 2005b). Data on delusions in general
indicate onset of beliefs due to anomalous experiences such as hallucinations (e.g., Garety &
Hemsley, 1994). Compton, Potts, Wan & Ionescu (2012) examined the temporal relationship
between delusions and hallucinations in first episode psychosis. They divided their sample
into four groups; (1) delusions only (n = 29, 18.2%), (2) delusions present at least one month
before hallucinations (n = 31, 19.5%), (3) hallucinations present at least one month before
9
delusions (n = 26, 16.4%) and (4) delusions and hallucinations that emerged within the same
month (n = 73, 45.9%). Only a very small proportion of the sample experienced
hallucinations without delusions. The delusions only group also consistently exhibited less
positive symptom severity and impairment.
1.4.1.5 Summary of the Threat Anticipation Model (Freeman, 2007). According to
the Threat Anticipation Model (Freeman, 2007), persecutory delusions arise due to the
interaction between anomalous experiences, emotional disturbance and reasoning biases.
Some data suggest the possibility of a differential aetiology of persecutory delusions as
compared to other types of delusion. For example, Garety et al. (2013) found that negative
self-evaluation, depression and anxiety predicted a significantly increased chance of
persecutory delusions, whereas grandiose delusions were predicted by lower levels of all
three variables. Grandiosity was also significantly better predicted by higher levels of
positive self and positive other evaluations. Although JTC and belief inflexibility were
elevated in both groups, both styles of reasoning were significantly more pronounced in the
group with grandiose delusions. These findings support the processes implicated in the
Threat Anticipation Model (Freeman, 2007).
Mechanisms within the model include the role of depression, negative schematic
beliefs, and anomalous experiences, but this study will focus on social anxiety and reasoning
biases specifically. Similar experimental manipulations of anxiety within non-clinical groups
have also found support for the model. Lincoln, Lange, Burau, Exner, and Moritz (2009)
used a sample of 90 non-clinical participants who were randomly allocated to an anxiety-
inducing manipulation, or control task. They found that paranoia and JTC were elevated
within the anxiety provoking condition, that higher baseline vulnerability to psychosis
predicted a more paranoid reaction to the anxiety provoking condition, and that the
relationship between anxiety and paranoia was mediated by the JTC reasoning bias.
10
In conclusion, research is now focusing on detailed aetiological processes of
persecutory ideation. Initial data support the mechanisms postulated within the Threat
Anticipation Model (Freeman, 2007).
1.4.2 Cognitive models based on motivational theory. Alternative models such as
the attributional bias and defence of self-esteem model of persecutory delusions (Bentall,
1994; Bentall, Kinderman & Kaney, 1994; Kinderman & Bentall, 1997a) and Trower and
Chadwick’s (1995) model of paranoia have also been developed. The attributional bias
model (Bentall, 1994) suggests that persecutory delusions are a defence of self esteem,
therefore it is hypothesised that people with persecutory delusions display an externalising
bias, compared with non-clinical controls. Freeman (2007) conducted a review of the
relevant studies at the time and reported that three of the studies support this claim (Fear,
Sharp & Healy, 1996; Krstev, Jackson & Maude, 1999; Lyon, Kaney & Bentall, 1994), while
two studies do not (Kinderman, Kaney, Morley & Bentall, 1992; Martin & Penn, 2002). One
possible reason for these mixed findings is difference in methodology across studies;
including a mixture of between-group and within group cross-sectional designs, populations
that were poorly defined (e.g., the sample reported by Krstev et al., 1999, comprised first
episode psychosis with no operational criteria for any type of delusion), as well as variation
in sample size. Treatment identified from Bentall’s (1994) cognitive model involves specific
forms of attribution therapy. Although external attribution bias for negative events is a
potentially important theoretical and clinical hypothesis, it differs from the Threat
Anticipation Model (Freeman, 2007) by not being given a central role in the formation and
maintenance of persecutory ideation, rather as a dimensional feature of it (Freeman, 2007).
Trower and Chadwick’s (1995) model of persecutory delusions suggests that paranoia
may be broadly categorised into two different types; ‘Bad Me’ paranoia, where the content of
the delusion implicates some deserved punishment of the individual and ‘Poor Me,’ paranoia,
11
which implicates persecution that is not warranted. Clinical aspects focus on addressing
depressive beliefs in therapy, prior to paranoid beliefs, for those who present with ‘Bad Me’
paranoia. They assert that people with ‘Bad Me’ paranoia will benefit from therapy due to
alleviation of negative beliefs about the self. Conversely, individuals who present with ‘Poor
Me’ paranoia will be more difficult to engage, due to higher levels of narcissism and
grandiosity, and will be more resistant to accepting help.
However, there have been few studies to test these hypotheses. One study
investigated the clinical characteristics of a sample of 53 individuals sub classified into ‘Poor
Me,’ ‘Bad Me,’ or neither category, finding that the ‘Bad Me’ group had lower self-esteem,
more negative self-evaluative beliefs, lower negative evaluative beliefs about others and
higher depression and anxiety (Chadwick, Trower, Juusti-Butler & Maguire, 2005). These
findings may indicate that there are two distinct types of paranoia. Further research into
possible typologies of paranoia could prove clinically and theoretically useful.
The second line of evidence that Trower and Chadwick (1995) cited originates from a
cognitive model of auditory hallucinations (Chadwick & Birchwood, 1994) and the
attributions given to them based on dimensions such as power, identity and purpose.
However, this may not be a valid way of conceptualising persecutory delusions since the
phenomenology of auditory hallucinations may not be directly the same as that of persecutory
ideation.
Although potentially useful, these models are mentioned here for context because
they do suggest some interesting theoretical and clinical hypotheses, and there is some
evidence for them. Neither of these models identifies anxiety or reasoning biases as
significant mechanisms in the formation and maintenance of paranoia, therefore, this thesis
will focus on the Threat Anticipation Model (Freeman, 2007).
12
1.5 Summary and conclusion
In conclusion, clarity on the definition of persecutory delusions as well as their
theoretical basis is essential for research and clinical practice to make advances. As
discussed above, psychological models of persecutory beliefs have been developed to
identify treatment targets and test these empirically. Prominent treatment targets suggested
from the Threat Anticipation Model (Freeman et al., 2002; Freeman, 2007) are interpersonal-
related anxiety and reasoning biases. These models of persecutory beliefs have opened up
further research avenues with which treatments can be developed and evaluated. However,
due to such attempts being made only relatively recently, it would be useful to investigate if
cognitive packages targeted specifically at persecutory delusions are effective, and if so, if
any common treatment approaches or targets can be identified as being most effective. The
next section will give a systematic review of the literature focusing on this issue.
1.6 Systematic review of the efficacy of cognitive behavioural therapies in treating
persecutory delusions
1.6.1 Overview. This section gives a systematic review of the literature to evaluate
the efficacy of cognitive behavioural therapy for persecutory delusions. The review will
consider the methodological profile of relevant studies. It will highlight the need to replicate
findings of key studies and to determine specific mechanisms of change, as well as common
elements or therapeutic targets that work best. The research and clinical implications of this
will be discussed, with an emphasis on further developing the field.
1.6.2 Search strategy. A literature search was performed separately on the Embase,
Medline and PsycINFO databases on 6th May 2014. Although the review focuses on
persecutory delusions within the context of psychosis, earlier searches incorporating different
terms relating to psychosis (e.g., schizophren* OR psychosis OR schizoaffective...etc.) failed
to detect key papers (e.g., Foster, Startup, Potts & Freeman, 2010). Therefore, the search
13
used two groups of terms; one group of terms for various cognitive behavioural therapies and
the other a group of differing terms relating to persecutory delusions. Search terms were
nested together, rather than entered as phrases, which maximised sensitivity. The following
terms were used: (cognitive AND behavio* AND therapy) OR CBT OR (cognitive AND
therapy) OR (metacognitive AND therapy) OR (metacognitive AND training) OR (reasoning
AND training) OR (cognitive AND bias AND modification) OR (acceptance AND
commitment AND therapy) OR (dialectic AND behavio* AND therapy) OR (DBT) OR
(dialectical AND behavio* AND therapy) AND (persecut* AND delusion*) OR persecut*
OR (paranoi* AND delusion*) OR paranoi*. Titles, abstracts and occasionally methodology
sections were scrutinised manually to reveal CBT based packages that specifically reported
persecutory delusions. As evident from the search parameters, various CBT based packages
were searched for, including 2nd and 3rd wave therapies. The ancestry method was also used
to identify studies the initial search missed.
1.6.3 Inclusion criteria. A priori limits were set to human studies, published in the
English language. Peer reviewed journals were not set as search parameters prior to the
search, but non peer-reviewed articles were excluded during manual screening. No other
parameters were set. The search revealed 509 results on Embase, 154 on Medline and 315 on
PsycINFO. Studies were only selected on the basis of persecutory delusions being reported
in the title or abstract. Studies reporting paranoid delusions alone were further scrutinised to
determine suitability for inclusion. This is because paranoid delusions and persecutory
delusions are often referred to interchangeably in the literature (Key et al., 2003). This may
result in studies that purport to examine one specific element of psychotic experience actually
including varying types, such as delusions of reference as well as persecutory delusions, in
their respective samples. In some cases, it was not clear if the delusion could be classified as
paranoid or persecutory. In keeping with Freeman and Garety’s (2000) criteria of (a) harm
14
occurring, or will be occurring to the individual in question, and (b) a persecutor having
intention to inflict harm, some studies were omitted, (e.g., Serruya & Grant, 2009; Key et al.,
2003). This is because some of the delusional themes were of being under surveillance, with
no actual harm – psychological or physical – intended (or none reported).
One study reported a randomised controlled trial of paranoia-focused CBT for a
sample of individuals with persecutory delusions (Landa et al., 2012), but was excluded
because only conference proceedings were published and no written material other than the
abstract was available. During various searches for more material, a previous abstract that
briefly described the RCT was discovered (Landa et al., 2011), so this was included.
Attempts to contact the authors to determine if more information was published were
unsuccessful. All duplicates were excluded in the initial screening phase. In total, 14 studies
were selected from Embase, one from PsycINFO, one from Medline, and one as described
above. A review of the studies’ reference lists revealed one further study (Kuipers et al.,
1998). Although this was not an RCT specifically targeting persecutory delusions, it is the
first RCT of CBT to specifically report persecutory delusions, and so effects of CBT can be
examined. This study was included in a selective review of CBT for persecutory delusions
(Garety, Bentall & Freeman, 2008). Three studies were then excluded from the full-text
articles assessed for eligibility, as described above (Landa et al., 2012; Serruya & Grant,
2009; Key et al., 2003). Figure 1.2 below provides a PRISMA diagram (Moher et al., 2009)
indicating how the literature was selected. Table 1.1 below presents the selected studies in
chronological order.
15
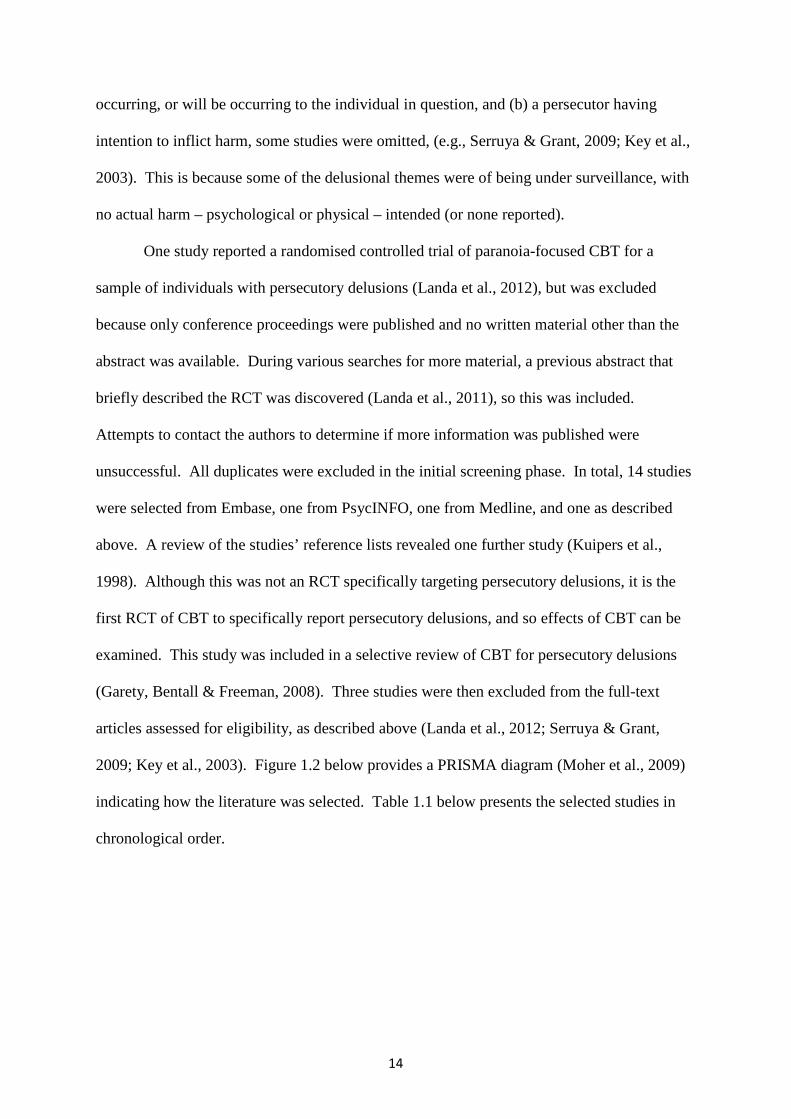
Figure 1.2 PRISMA diagram of systematic literature review
Records identified through database searching
(n = 978)
Scr
eeni
ng
Incl
uded
E
ligib
ility
Id
entif
icat
ion
Additional records identified through other sources
(n = 2)
Records after duplicates removed (n = 793)
Records screened (n = 793)
Records excluded (n = 775)
Full-text articles assessed for eligibility
(n = 18)
Full-text articles excluded, with reasons
(n = 3)
Studies included (n = 15)
16
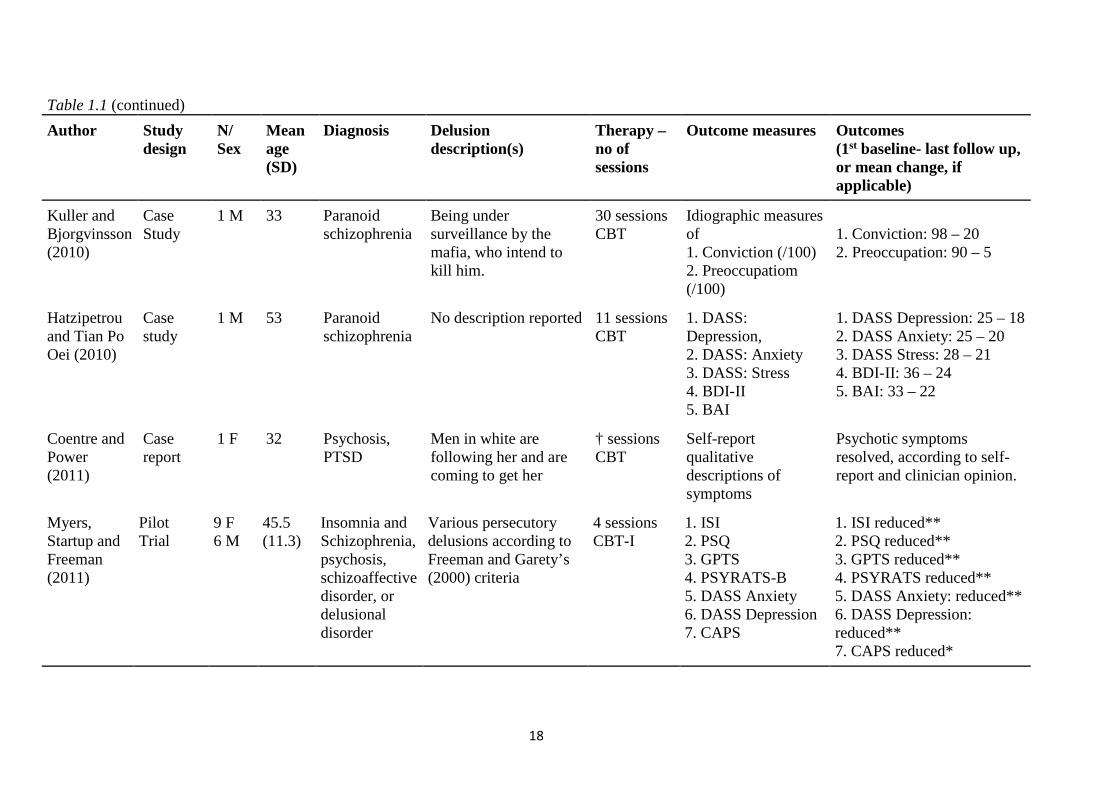
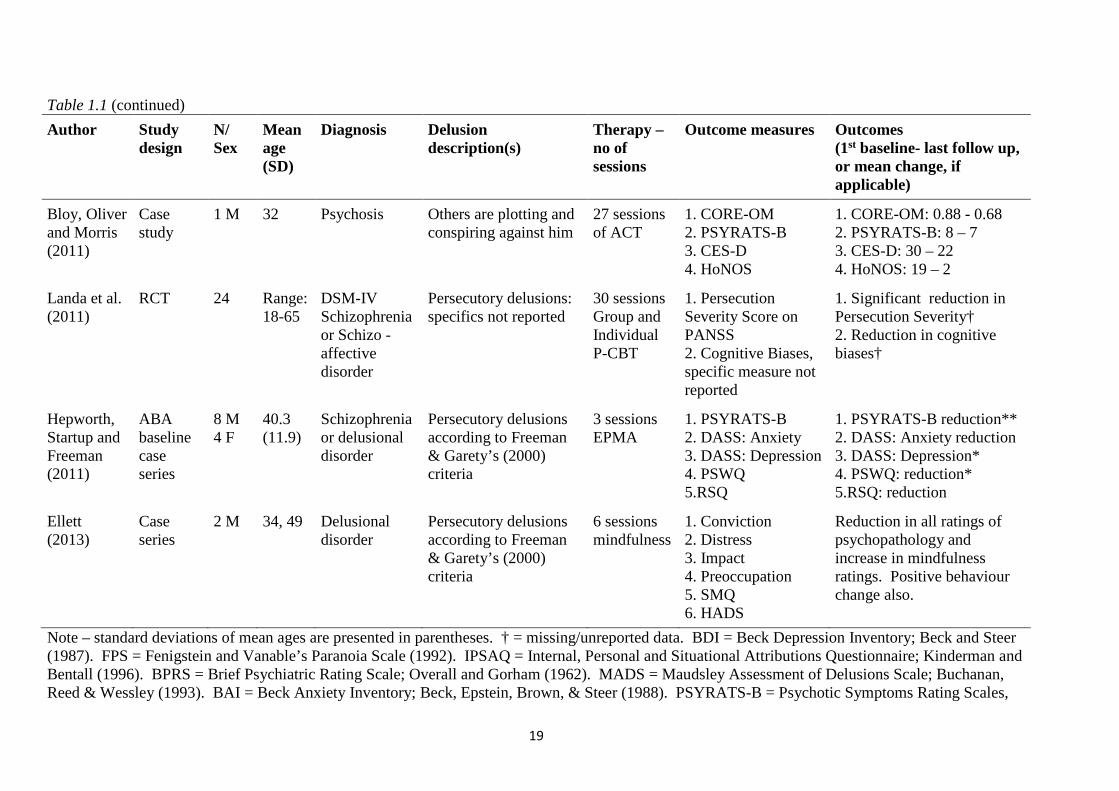
Table 1.1 Studies reporting on the efficacy of differing cognitive behavioural therapies for persecutory delusions, displayed in chronological order.
Author Study design
N/ Sex
Mean age (SD)
Diagnosis Delusion description(s)
Therapy – no of sessions
Outcome measures Outcomes (1st baseline - last follow up, or mean change, if applicable)
Chadwick and Trower (1995)
Multiple-baseline single case
1 M 31 Schizophrenia (a) Being punished by members of the public (b) Being physically punished by God for blasphemy
12 sessions Cognitive Therapy
1. BDI 2. Idiographic conviction % rating of belief (a) 3. Idiographic conviction % rating of belief (b)
1. BDI: 24 – 9 2. Conviction in belief a: 100% - 5% 3. Conviction in belief b: 40% - 0%
Kinderman and Bentall (1997b)
Case report
1 M 33 Paranoid schizophrenia
Conspiracy to pressure him into joining a drug cartel
21 sessions Attribution Therapy
1. BDI 2. Idiographic paranoid anxiety, depression and self-esteem ratings (/10) 3. FPS 4. IPSAQ
1. BDI: 30 – 8 2. Paranoid anxiety: 7/10 – 1/10, depression† self-esteem† 3. FPS: 78 – 40 4. IPSAQ +5 - +2
Kuipers et al. (1997)
RCT 38 M 22 F
40 Range: 18-65
Psychosis Various persecutory delusions
Mean of 19 sessions CBT for psychosis
1. BPRS 2. MADS: conviction and distress 3. BDI 4. BAI
1. BPRS: reduction** 2. non-significant reduction in conviction and distress 3. BDI: non-sig. difference 4. BAI: non-sig. difference
17
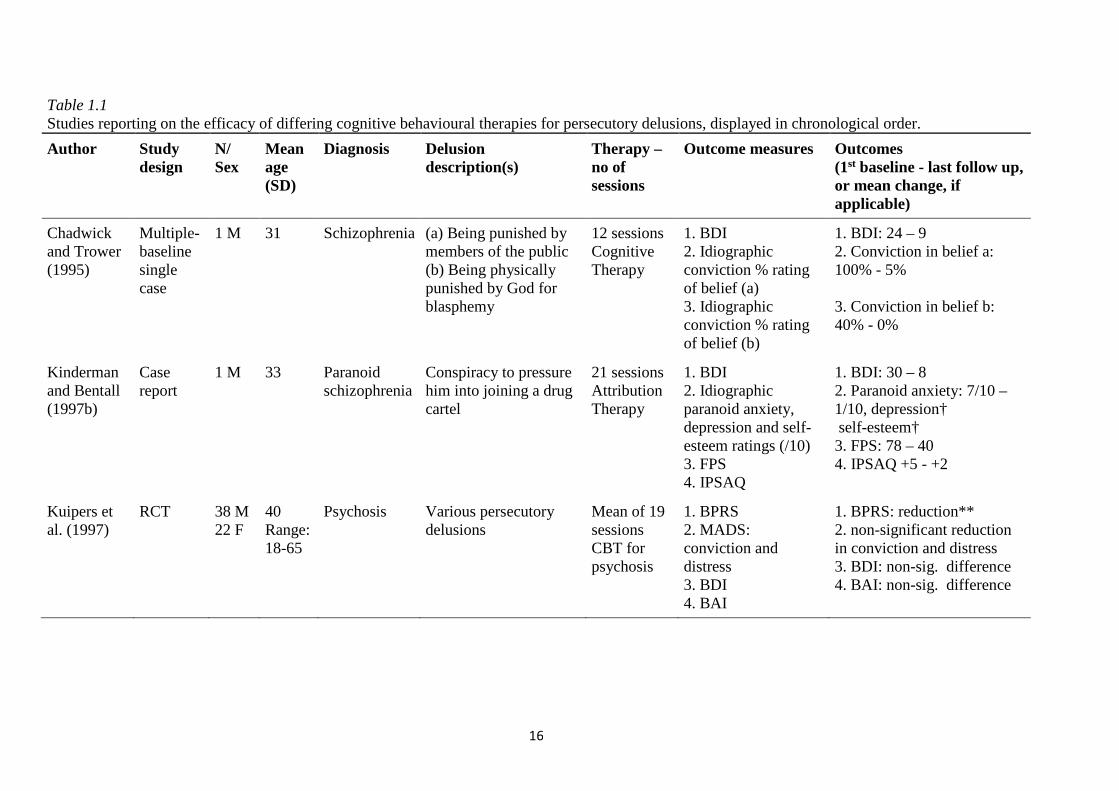
Table 1.1 (continued)
Author Study design
N/ Sex
Mean age (SD)
Diagnosis Delusion description(s)
Therapy – no of sessions
Outcome measures Outcomes (1st baseline- last follow up, or mean change, if applicable)
Morrison 2004
Case Study
1 M 30 Delusional disorder
Being under surveillance by a group who wished him harm
12 sessions Imagery-based CBT
PSYRATS Delusions: 1. Conviction 2. Preoccupation 3. Distress
PSYRATS Delusions: 1.Conviction: 100% - 0% 2.Preoccupation: 75% - 0% 3.Distress 75% - 0%
Pinninti and Datto (2006)
Case report
1 F 80 Paranoid schizophrenia
Being poisoned by the blood tests required for clozapine monitoring
† sessions CBT
Medication adherence
Initial withdrawal of clozapine due to refusal of blood draws – Acceptance of blood draws and clozapine adherence.
Hagen and Nordahl (2008)
Case study
1 M 25 Paranoid schizophrenia
Being tortured by members of the anti-narcotic squad through radio beams
42 sessions Behavioural experiments
Idiographic ratings of: 1. Anxiety (/8) 2. Depression (/8) 3. Conviction (/8)
1. Anxiety: 8/8 – 0/8 2. Depression 8/8 – 0/8 3. Conviction 8/8 – 0/8
Foster, Startup, Potts and Freeman (2010)
RCT 14 M 10 F
CBT: 40 (10) TAU: 39.1 (9.2)
Schizophrenia, schizoaffective disorder, delusional disorder
Various persecutory delusions according to Freeman and Garety’s (2000) criteria
4 sessions CBT worry intervention
1. PSWQ 2. PSYRATS-B: frequency / duration 3. PSYRATS-B: distress 4. GPTS
1. Reduction in PSWQ* 2. Non-significant reduction in PSYRATS frequency/duration 3. Reduction in distress* 4.Non-significant reduction in GPTS
18
Table 1.1 (continued)
Author Study design
N/ Sex
Mean age (SD)
Diagnosis Delusion description(s)
Therapy – no of sessions
Outcome measures Outcomes (1st baseline- last follow up, or mean change, if applicable)
Kuller and Bjorgvinsson (2010)
Case Study
1 M 33 Paranoid schizophrenia
Being under surveillance by the mafia, who intend to kill him.
30 sessions CBT
Idiographic measures of 1. Conviction (/100) 2. Preoccupatiom (/100)
1. Conviction: 98 – 20 2. Preoccupation: 90 – 5
Hatzipetrou and Tian Po Oei (2010)
Case study
1 M 53 Paranoid schizophrenia
No description reported 11 sessions CBT
1. DASS: Depression, 2. DASS: Anxiety 3. DASS: Stress 4. BDI-II 5. BAI
1. DASS Depression: 25 – 18 2. DASS Anxiety: 25 – 20 3. DASS Stress: 28 – 21 4. BDI-II: 36 – 24 5. BAI: 33 – 22
Coentre and Power (2011)
Case report
1 F 32 Psychosis, PTSD
Men in white are following her and are coming to get her
† sessions CBT
Self-report qualitative descriptions of symptoms
Psychotic symptoms resolved, according to self-report and clinician opinion.
Myers, Startup and Freeman (2011)
Pilot Trial
9 F 6 M
45.5 (11.3)
Insomnia and Schizophrenia, psychosis, schizoaffective disorder, or delusional disorder
Various persecutory delusions according to Freeman and Garety’s (2000) criteria
4 sessions CBT-I
1. ISI 2. PSQ 3. GPTS 4. PSYRATS-B 5. DASS Anxiety 6. DASS Depression 7. CAPS
1. ISI reduced** 2. PSQ reduced** 3. GPTS reduced** 4. PSYRATS reduced** 5. DASS Anxiety: reduced** 6. DASS Depression: reduced** 7. CAPS reduced*
19
Table 1.1 (continued)
Author Study design
N/ Sex
Mean age (SD)
Diagnosis Delusion description(s)
Therapy – no of sessions
Outcome measures Outcomes (1st baseline- last follow up, or mean change, if applicable)
Bloy, Oliver and Morris (2011)
Case study
1 M 32 Psychosis Others are plotting and conspiring against him
27 sessions of ACT
1. CORE-OM 2. PSYRATS-B 3. CES-D 4. HoNOS
1. CORE-OM: 0.88 - 0.68 2. PSYRATS-B: 8 – 7 3. CES-D: 30 – 22 4. HoNOS: 19 – 2
Landa et al. (2011)
RCT 24 Range: 18-65
DSM-IV Schizophrenia or Schizo -affective disorder
Persecutory delusions: specifics not reported
30 sessions Group and Individual P-CBT
1. Persecution Severity Score on PANSS 2. Cognitive Biases, specific measure not reported
1. Significant reduction in Persecution Severity† 2. Reduction in cognitive biases†
Hepworth, Startup and Freeman (2011)
ABA baseline case series
8 M 4 F
40.3 (11.9)
Schizophrenia or delusional disorder
Persecutory delusions according to Freeman & Garety’s (2000) criteria
3 sessions EPMA
1. PSYRATS-B 2. DASS: Anxiety 3. DASS: Depression 4. PSWQ 5.RSQ
1. PSYRATS-B reduction** 2. DASS: Anxiety reduction 3. DASS: Depression* 4. PSWQ: reduction* 5.RSQ: reduction
Ellett (2013)
Case series
2 M 34, 49 Delusional disorder
Persecutory delusions according to Freeman & Garety’s (2000) criteria
6 sessions mindfulness
1. Conviction 2. Distress 3. Impact 4. Preoccupation 5. SMQ 6. HADS
Reduction in all ratings of psychopathology and increase in mindfulness ratings. Positive behaviour change also.
Note – standard deviations of mean ages are presented in parentheses. † = missing/unreported data. BDI = Beck Depression Inventory; Beck and Steer (1987). FPS = Fenigstein and Vanable’s Paranoia Scale (1992). IPSAQ = Internal, Personal and Situational Attributions Questionnaire; Kinderman and Bentall (1996). BPRS = Brief Psychiatric Rating Scale; Overall and Gorham (1962). MADS = Maudsley Assessment of Delusions Scale; Buchanan, Reed & Wessley (1993). BAI = Beck Anxiety Inventory; Beck, Epstein, Brown, & Steer (1988). PSYRATS-B = Psychotic Symptoms Rating Scales,
20
Delusions Subscale; Haddock, McCarron, Tarrier and Faragher (1999). PSWQ = Penn State Worry Questionnaire; Meyer, Miller, Metzger and Borkovec (1990). GPTS = Green et al. Paranoid Thought Scales; Green et al. (2008). DASS42 = Depression, Anxiety and Stress Scales; Lovibond and Lovibond (1995). BDI-II = Beck Depression Inventory – 2nd Edition; Beck, Steer & Brown (1996). PTSD = post-traumatic stress disorder. CBT-I = CBT for Insomnia. ISI = Insomnia Severity Index; Bastien, Vallieres & Morin (2001). PSQ = Pittsburgh Sleep Quality Index; Buysse, Reynolds, Monk, Berman & Kupferet (1988). CAPS = Cardiff Anomalous Perception Scale; Bell, Halligan & Ellis (2006). ACT = Acceptance and Commitment Therapy. CORE-OM = Clinical Outcomes in Routine Evaluation – Outcome Measure; Evans et al. (2000). CES-D = Center for Epidemiologic Studies – Depression Scale; Ross and Mirowski (1983). HoNOS = Health of the Nation Outcome Scales; Wing et al. (1998). P-CBT = Paranoia-Focused CBT. PANSS = Positive and Negative Syndrome Scale; Kay, Fiszbein & Opler (1987). EPMA = Emotional Processing and Metacognitive Awareness. RSQ = Response Style Questionnaire; Nolen-Hoeksema & Morrow (1991). SMQ = Southampton Mindfulness Questionnaire; Chadwick et al. (2008). * p ≤ .05. ** p ≤ .01.
21
1.6.4 Evaluation of case studies. Chadwick and Trower (1995) described Bill, with
whom they used cognitive therapy, to target both of his persecutory beliefs sequentially.
Using a multiple-baseline design made the results more reliable than single case studies, as it
established that observed change could be attributed with more confidence to the treatment,
rather than extraneous influences. The idiographic conviction rating in belief (a) was stable
throughout baseline and intervention phase until session 5, when it fell from approximately
95% to 50%. Conviction in belief (b) was more erratic, but indicated a decline overall. Use
of follow up assessments at one, two and three months further strengthened the study.
However, presenting an isolated case contributes little to the evidence base (Kazdin, 2010). It
is interesting that depression, not anxiety, was assessed – according to the Threat Anticipation
Model (Freeman, 2007), there may have been a very important treatment target that was
missed.
Kinderman and Bentall (1997) presented BI, with whom they used attribution therapy,
in order to allow BI to re-attribute negative life experiences to situational causes rather than
persecutory delusions. As described in table 1, they took multiple observations of idiographic
measures of paranoid anxiety, low mood and self-esteem over two therapy phases, before and
after introducing instructions to practice alternative situational explanations for ambiguous
events. As well as a visual graph, they also conducted one-way ANOVA indicating
significant declines in paranoid anxiety (F (1, 47) = 24.08, p <.0005), low mood (F (1, 47) =
10.11, p <.005) and poor self-esteem (F (1, 47) = 12.04, p <.005). Improvements on paranoid
anxiety were maintained at one - five month follow up. A lack of multiple baseline
assessments confused the differential effects of the two different therapies (Kazdin, 2010).
Morrison (2004) reported Joe, with whom CBT with imagery was used. Although use
of standardised assessment tools (PSYRATS) could be considered more robust than
idiographic measures, there was no extended baseline period. Also, the study could have
benefitted from more controlled applications of verbal, imaginal and behavioural intervention
22
strategies (Barker, Pistrang & Elliott, 2011). Table 1 indicates improvement in delusional
conviction, preoccupation and distress.
Pinninti and Datto (2006) briefly described a case where CBT was used to assist with
Clozapine monitoring. The individual rapidly developed delusions of being poisoned by the
blood tests necessary to continue Clozapine therapy and withdrew from treatment. CBT was
initiated and focused on this delusion. Following improvement, Clozapine was re-instated
and maintained. Other than medication compliance, no other measures were reported in this
letter to the editor, making further interpretation of the efficacy of CBT in this case
impossible.
Hagen and Nordahl (2008) presented Tony, who was treated with 42 sessions of
behavioural experiments. A rich account of the various behavioural experiments was given.
All measures were idiographic and no stable baseline of difficulties was established (Kazdin,
2010). Although all domains improved, follow up was only a week following the therapy,
which cannot determine longer term gains.
Kuller and Bjorgvinsson (2010) reported on Michael, treated with CBT. A detailed
history and case conceptualisation is given, e.g., after 10 sessions, Michael was able to trust
his wife again, and moved back home with his family. This can be useful information from a
clinical perspective. However, no extended baseline assessment was conducted, weakening
the methodology (Kazdin, 2010). There was also no official follow-up.
Hatzipetrou and Tian Po Oei (2010) described 11 sessions of CBT with MH, who
experienced persecutory delusions and visual and auditory hallucinations. Although
improvements were documented, no elements specifically related to delusions were assessed,
e.g., conviction, etc. The authors did not include a description of the belief, and the therapy
focused more on hallucinations. Lack of extended baseline or follow-up also weakened their
methodology (Kazdin, 2010).
23
Coentre and Power (2011) presented a case of psychosis and PTSD, treated with an
unknown number of CBT sessions. Although clear persecutory ideation was described, no
standardised measures were reported, leaving only clinician opinion, which reported
psychotic symptoms being ‘resolved,’ and persistent PTSD symptoms. This article was much
more focused on the challenges of diagnosis rather than the efficacy of CBT. This was more
of a clinical case presentation rather than a piece of research with methodological rigour.
Bloy et al. (2011) reported on Brian, who believed that he was being filmed by the
secret service and was the subject of a malevolent conspiracy. He was treated with 27
sessions of ACT, which, although a 3rd wave CBT therapy, is quite different in its underlying
approach. As with other studies, a rich account of Brian’s history and comprehensive case
conceptualisation was given. As indicated in Table 1, Brian improved on all outcomes, and
these measures were appropriate for delusional experiences. One strength of this study was
calculation of reliable change indexes. Interestingly, all outcomes except for the PSYRATS B
demonstrated reliable reduction. These outcomes fit well with the ACT model, as symptom
reduction is not the aim: increasing ability to cope with and limiting distress resulting from
symptoms is the focus. A 6 month follow-up was conducted, but outcome measures were not
taken. HoNOS ratings were performed by independent evaluators, which is another
advantage.
Ellett (2013) described two participants who undertook mindfulness exercises for
persecutory beliefs. Description of the beliefs allowed clear comparison with Freeman and
Garety’s (2000) criteria. This study was succinctly reported, but contained all of the
information needed to evaluate its strength. Therapy followed previously published guidance,
increasing uniformity of delivery. Although outcomes were independently verified, clinical
supervision of therapy delivery would have increased the study’s merit (Barker et al., 2011).
The design addressed the research question well but a longer baseline was needed to establish
24
whether symptoms were on a natural path to recovery or not – Kazdin (2010) suggests a
minimum of five observations.
1.6.5 Evaluation of group Studies. The RCT conducted by Kuipers et al. (1997),
although not designed specifically for persecutory delusions, still comprises one of the best
sources of evidence of the efficacy of CBT. Randomisation to treatment and control
conditions limited bias and also provided fair basis for comparison. Although a CONSORT
diagram (Altman et al., 2001) was not given, a full account of the recruitment and selection
process was provided, increasing confidence in the sampling methods used. Power
calculations indicated their sample size was such that inferences could be made about the
population from which the sample was derived. Although assessors were not blinded to
condition (a common difficulty in psychology research), all assessments were carried out by
independent researchers. Peer and therapy supervision was also reported, along with efforts
to maintain uniform provision of therapy - manualised therapy facilitated this (Fowler, Garety
& Kuipers, 1995). Detailed numbers of therapy sessions conducted with all clients was
reported, which is an advantage. Similarly, strategies to maximise engagement and minimise
drop out were also outlined. This controlled against participants being excluded from
analyses due to insufficient engagement, which can be the result of more severe levels of
distress or symptoms. Maximising engagement strengthened the method as this more closely
mirrored clinical practice.
In terms of data analysis, missing data and data transformations were reported and
appropriate. Where participants were lost to second assessment, subsequent intention to treat
analyses were conducted using the carry forward method to impute missing values. This
represents a particular strength, given that this RCT was one of the first of its kinds at the
time. Assessments were conducted at initial, three, six and nine month intervals, with a
follow-up assessment at 18 months after entry. The length of follow-up assessment was a
further strength. Use of two-way analysis of variance (ANOVA) with both explanatory
25
factors being treatment centre (London, Norwich or Cambridge) and treatment group (CBT
vs. TAU) was an appropriate way of analysing the data. Number needed to treat analysis
might have been another advantage, had it been employed (Barker et al., 2011).
Measures were appropriate for the research questions concerned – in the case of this
review, significant improvement in the BPRS suspiciousness item indicated improvement in
persecutory ideation and ideas of reference. Unusual thought content (delusional ideas) and
hallucinations also significantly improved. The change was greatest on these three variables,
indicating that efficacy of CBT for persecutory and delusional ideation was effective. No
other clinical or occupational variable improved significantly (apart from total BPRS scores),
including other individual BPRS items, such as delusional conviction and distress. Even
considering its modest efficacy and the fact that generic CBT for psychosis was used rather
than specific interventions targeting persecutory ideation, this study still represents some of
the most robust evidence for efficacy of CBT.
Foster et al. (2010) reported on the first published RCT to specifically target
persecutory delusions. Increased theoretical understanding of formation and maintenance of
persecutory ideation has led to identification of more specific putative causative processes,
resulting in development of novel treatment targets; in this case interpersonal worry. They
were also interested in finding if changes in worry were related to changes in paranoia, as
there are theoretical grounds for this. Inclusion criteria were psychosis spectrum disorder and
presence of persecutory ideation according to Freeman and Garety’s (2000) criteria, which
increaseed confidence in the sampling methods used. They also stipulated a clinically
significant level of worry: 45+ on the PSWQ.
A CONSORT diagram was provided, outlining the recruitment process and losses to
follow-up, which further improved transparency and confidence in non-biased recruitment
and data analysis. Block randomisation to treatment and control conditions, performed by an
independent researcher limited selection bias. Both treatment and control conditions were
26
described, but manualising the worry intervention might have improved uniform delivery of
therapy across all participants. Therapy supervision was given to the author who delivered it.
There was no monitoring of therapy adherence or competence however, which is a weakness.
High levels of engagement with therapy were reported: all individuals completed all 4
sessions.
A priori power calculation indicated a sample size of 24 (12 in each arm) to achieve a
clinically important effect size of 0.9 in the analysis of PSWQ scores, at 90% power and 5%
(2-sided) significance. Outcome measures in Table 1 are appropriate to the research question:
delusional dimensions as well as paranoia, worry and persecutory ideation are all important
variables. The outcomes were modeled using multilevel linear regression as the data were
longitudinal and this method is robust against missing data (Van Der Leeden, 1998).
Kendall’s tau was calculated to investigate possible relationships between reduction in
worry and reduction in persecutory thoughts. This method is robust against outliers and ties
in the data. Adjusting for baseline differences indicated that W-CBT reduced worry by ten
points at two month follow-up in comparison to TAU – a significant difference. Similarly,
PSYRATS delusional distress scores were reduced by 1.7 points in comparison to TAU at
two month follow-up. Reliable and/or clinical change were not reported, which may have
benefitted the study (Kazdin, 2010), although given that the reliable change index calculated
by others (e.g., Bole et al., 2011) for the PSYRATS-B subscale is 5.41, it is very unlikely that
reliable change could be evidenced based on the reported data. Finally, non-significant
reductions in paranoia when compared to TAU were positively correlated with reductions in
persecutory ideation, measured by the PSYRATS, at two month follow-up.
Although a good pilot study, it would have been greatly improved if the sample size
had been increased (Barker et al., 2011); this may have added increased power to detect
significant changes in paranoia. There were also differences between the groups, the
intervention group initially having higher levels of worry and paranoia. Another follow-up
27
after 2 months would have improved understanding of longer term therapeutic gains Kazdin,
2010).
Myers et al. (2011) reported a pilot trial of CBT-I for persecutory delusions, given that
insomnia has been theoretically and empirically identified as a strong putative causal and
maintaining factor for paranoia and persecutory ideation (Freeman, 2007). Using an open,
uncontrolled trial methodology was appropriate for pilot research, but ideally a small scale
RCT would have increased confidence in the findings. Power calculations identified a total of
eleven participants needed to have 80% power to detect an effect size of 0.96 for a reduction
in insomnia, using a single group t-test with a 0.5 two-sided significance level. Fifteen
individuals were recruited to allow for loss to follow-up. A diagnosis of psychosis spectrum
disorder and presence of persecutory delusions as defined by Freeman and Garety (2000)
clarified the sample. Flow-charting recruitment and selection improved transparency and
limited selection bias. The components of therapy were briefly discussed, but there was no
treatment manual developed, and although the therapist was supervised, adherence and
competence was not formally assessed.
The design was amended after eight participants had been through the process. An
extra baseline assessment of all outcome measures was added one or two weeks before the
pre-treatment assessment, to assess stability of symptoms. This strengthened the
methodology, indicating that the symptoms were not on a path of natural recovery. In terms
of data analysis, there were no missing data. Changes in outcomes across time (pre and post-
treatment, one month follow-up) were assessed using repeated measures ANOVA, which is
appropriate, although reporting properties of assumptions of the data would have increased
confidence in the appropriateness of the analyses. Pairwise comparisons identified
differences in assessment times and effect sizes were calculated using Cohen’s d (Cohen,
1988) – this multiple statistical testing is a disadvantage (Barker et al., 2011), although
confidence was enhanced due to all measures showing similar changes.
28
As indicated in Table 1, all outcomes were significantly reduced at one month follow-
up. Although delusional content was never targeted, improving sleep reduced persecutory
ideation. There were also moderate to large effect sizes for reduction of anxiety, depression
and anomalous experiences. This study represents a well designed and carried out pilot test,
with some disadvantages, such as lack of control group and randomisation, short length of
follow-up assessment, and small sample size (Barker et al., 2011).
Landa et al. (2011) reported a small scale RCT of group P-CBT for 24 adults
experiencing drug-refractory persecutory delusions. Groups were randomised to P-CBT plus
TAU, or TAU alone. Therapy consisted of one group and one individual session weekly for
15 weeks, participants were assessed by blind assessors at baseline, post-treatment and six
month follow up. Differential treatment effects were examined using linear mixed effects
modeling, indicating significant reductions in PANSS Persecution Severity (main outcome).
It is unclear as to whether these analysis methods were appropriate, as no other information
was given, e.g., power calculations. No other details of the study were reported in this
abstract, and so judgments cannot be made as to how well it was carried out. The study does
provide preliminary efficacy of P-CBT for persecutory delusions.
Hepworth et al. (2011) reported a case series using an ABA design. Two baseline
assessments were conducted, allowing comparison of baseline differences between both time
points. They report that symptoms were improving during the baseline period, which limits
confidence in the findings (see table 1.1; Barker et al., 2011), but does improve transparency
and methodology. The intervention itself involved three sessions of writing about their
experiences of persecutory beliefs in a narrative style, to promote access to the emotional
experience. Further verbal descriptions of the material were encouraged but in a reflective
rather than evaluative manner, to promote exposure to anxiety and hence habituation.
Following this, the narrative was broken down to identify thoughts, feelings, images and
memories, to promote metacognitive awareness. Participants were then encouraged to
29
observe the malleability of thoughts, to promote acceptance. Finally, Gestalt and diffusion
techniques were used where experiences were particularly powerful and distressing.
This study has some limitations. No CONSORT diagram was provided to show how
participants were recruited (Altman et al., 2001). No randomisation to treatment was
conducted. All assessments were carried out unblinded also (Barker et al., 2011). As
indicated in Table 1, paired t tests were conducted to determine symptomatic change.
However, no formal power calculation was reported, and so it is unclear if a sample size of 12
participants with repeated measures can provide enough data for adequately powered analysis
(Field, 2005). With this in mind, the authors report reliable change estimates for the
PSYRATS-B, indicating that ten participants showed reliable improvement in total scores
following the intervention phase, one showed no change, and one reported a reliable increase
in delusion symptoms.
1.6.6 Discussion. Although the literature reviewed is varied and from different
theoretical viewpoints, there is preliminary support that CBT based interventions are
efficacious for persecutory delusions. Before the theoretical and clinical implications of these
studies are discussed, the overall limitations shall be briefly outlined.
1.6.6.1 Methodological issues regarding the studies reviewed. Single-case research
has been shown to be useful for pilot testing of novel therapies and developing rich
phenomenological accounts of how hypothesised mechanisms interact to drive intention,
behaviour and belief systems (Kazdin, 2010). It also provides insight into individual
mechanisms of change, which may then be tested using group designs. The single case design
can also be used to identify gaps in research and refine clinical theories or models. Although
the case studies reported give rich accounts of the problems and how they were maintained
and treated, their usefulness is limited. They cannot make claims as to efficacy of a therapy
using isolated or small sample designs – they can only test them out in a preliminary fashion
(Kazdin, 2010). Regarding multiple baseline single case series methodology, a convincing
30
demonstration of intervention efficacy requires change that does not occur across settings,
behaviour or individuals until the intervention is introduced; change that does occur across
outcomes simultaneously is therefore difficult to interpret from a research viewpoint, even if
it may be desirable from a clinical perspective (Nock, Michel & Photos, 2007). In terms of
data analysis, there is ongoing debate as to the most appropriate method for analysing time-
series data; different authors promoting visual inspection (e.g., Kazdin, 2010) and inferential
statistical testing (e.g., Zhan & Ottenbacher, 2001). Both approaches suffer disadvantages:
visual inspection has been criticised for being too subjective, with different analysts reaching
different conclusions (Kazdin, 2010), whereas inferential statistics for small sample sizes are
invalid because they are underpowered to detect real change.
As indicated, evaluating the efficacy of CBT for persecutory delusions is majorly
hampered by a lack of well-designed RCTs. Given that persecutory delusions are such a
common experience in psychosis, the various trials that have examined efficacy of CBT for
psychosis would have encountered and treated many individuals with persecutory ideation.
This is unfortunate; a lack of clarity in defining, identifying and reporting persecutory
delusions in this research has led to heterogeneity of the research samples. This hampers
exact analysis of effects, leading to a situation where firm conclusions cannot yet be drawn.
More recent efforts to gain clarity on the problem are proving beneficial, with some
small trials reporting preliminary progress. The quality of these trials is improving which
increases confidence in their findings. However, there are always improvements that can be
made. Longer follow-up assessment periods would inform length of therapeutic gains Barker
et al., 2011). Arguably, once of the most crucial reasons for a follow-up assessment is that
CBT based interventions help clients to maintain their own therapeutic gains. Evidence
indicates that CBT for psychosis is superior for maintenance of gains when compared to other
more general supportive work, e.g., befriending (Garety, Fowler & Kuipers, 2000).
31
Although very difficult to achieve and easily undone, blind assessment is possible and
studies that successfully employ it are at an advantage, as unblinded assessment has been
found to be a particular source of bias (Tarrier & Wykes, 2004). Manualisation of therapy,
clear reporting of supervision and formal assessment of quality and adherence will add further
clarity as to what the ‘active ingredients’ of the therapy are. This also promotes further
development of treatments, to make them safer, more tolerable and effective.
In summary, there are some key methodological strengths across the above sample of
studies. The variety of case studies provides a rich account of various therapeutic targets,
according to presentation, which inform individual clinical work. The above case studies also
identify novel treatment targets and provide detailed information on individual mechanisms of
change. The small numbers of RCTs provide data on the effectiveness of specific forms of
CBT for persecutory delusions that target specific areas of psychopathology, e.g., clinical
levels of worry and insomnia.
However, there are key methodological weaknesses in the above sample of studies
also. Many of the case studies did not employ baseline lengths of sufficient duration to
establish stability of symptoms. The group designs suffer from this limitation also; one
measure of symptoms at one time-point does not facilitate group statistical comparison, which
is important in determining whether or not significant symptomatic differences existed prior
to package. One study that did address this difficulty was that of Myers et al (2011).
1.6.6.2 Theoretical and clinical implications. Broadly speaking, the research to date
supports the Threat Anticipation Model (Freeman, 2007). Specific mechanisms of formation
and maintenance of persecutory ideation include anxiety, such as worry and disturbances in
functioning, e.g., insomnia. These have been used successfully as proxy therapeutic targets,
which have had beneficial effects on persecutory delusions and paranoia. Out of the 15
studies reviewed, nine of them report variants of anxiety as specific therapeutic goals.
Considering some studies came from differing theoretical viewpoints, as well as others not
32
reporting any specifics about therapeutic targets; this in itself can be considered to be good
consensus that anxiety is an important mechanism of persecutory ideation.
Some therapeutic components common to the studies include generic CBT principles,
such as engagement, working collaboratively, normalisation, exploring meaning and
appraisals of psychotic experiences, working with negative affect and relapse prevention.
Another common theme was not directly challenging delusional content. This seems to be an
important consideration when working clinically: Brehm (1966) termed ‘psychological
reactance’ the process whereby direct challenging of a delusional belief may only serve to
further reinforce it. Other common components included reviewing the evidence, practicing
generating alternative explanations for experiences and reality-testing. These techniques
could be thought of as attempts to improve belief inflexibility, as described by the Threat
Anticipation Model (Freeman, 2007). However, no studies to date have targeted specific
reasoning biases, such as JTC, within the context of persecutory delusions. Whether or not
this will result in clinical improvement remains to be determined, however, future studies now
have very specific targets with which to test out therapies to see if they have a positive
impact.
Finally, the studies also show the positive benefits of applying attribution theory to a
clinical setting (e.g., Kinderman & Bentall, 1997b). This suggests that the Threat
Anticipation Model (Freeman, 2007) may benefit from also considering the process of
misattributions in persecutory ideation.
1.6.7 Conclusion. In summary, although the quality of the evidence of CBT for
persecutory delusions is improving, it is still premature to draw firm conclusions about
efficacy. However, some forms of CBT that focus on convergent therapeutic targets (e.g.,
anxiety) do seem to benefit individuals with persecutory delusions. Clearer definition of the
problem and consensus among researchers as to the definition will greatly assist a more
uniform approach to sampling methods. Structured, clearly specified interventions set at
33
theoretically and empirically identified treatment targets will bring clarity to mechanisms of
change. Single-case research that is designed well should provide rich information about
potential benefits and pitfalls of these therapies. Appropriately designed group research that
is well powered to detect key processes of change will enable findings to be generalised to the
population, and should help shape policy of care and treatment.
When considered together, the main drawback from the above sample of studies is that
there are not enough of them to give a clear indication as to the efficacy of any of the forms of
CBT for persecutory delusions used. There is a clear need for further research as outlined
above before the question ‘are CBT interventions efficacious for persecutory delusions?’ can
be answered one way or the other.
1.7 Rationale for the current study
The Threat Anticipation Model (Freeman, 2007) identifies specific treatment targets
for persecutory delusions. In particular, social anxiety or worry of an interpersonal nature,
anomalous experiences, and reasoning biases are implicated in the formation and maintenance
of paranoia and persecutory ideation.
With this in mind, together with the recent empirical evidence discussed, treatments to
reduce social anxiety are now indicated in the study of persecutory delusions. To identify
suitable treatments for social anxiety, the anxiety literature should be consulted. If there are
psychological mechanisms common to individuals with anxiety disorders as well as
individuals with psychotic disorders, then treatments shown to be efficacious for one group
may also be so for the other. There is much evidence indicating that socially anxious
individuals selectively attend more to socially threatening words in experimental situations
using tasks such as the dot-probe task (e.g., Pishyar et al., 2004) and the stroop test (e.g.,
Matthews & MacLeod, 1985). These studies indicate that socially anxious individuals
demonstrate a negative attention bias, which is in keeping with the Threat Anticipation Model
(Freeman, 2007) of persecutory ideation. Studies also indicate that individuals with clinical
34
and non-clinical levels of social anxiety demonstrate a more negative interpretation bias when
processing and interpreting ambiguous social information; i.e., they interpret ambiguous
situations as negative and threatening (e.g., Stopa & Clarke, 2000; Mathews & Mackintosh,
2000). This bias would seem to have particular clinical relevance for individuals with social
anxiety as well as paranoia, given the overlap between the two, since most social situations
are ambiguous and are therefore open to interpretation.
1.7.1 Targeting social anxiety: cognitive bias modification for interpretation
(CBM-I). Building on these findings, recent research has focused on whether or not these
interpretative biases can be modified to help the individual process social information in a less
negative and threatening way. One treatment is known as Cognitive Bias Modification for
interpretation (CBM-I; Mathews & Mackintosh, 2000). This is based on the premise that
repeatedly exposing the individual to socially ambiguous stimuli and then promoting positive
and non-threatening interpretation of that information will modify the pre-existing negative
interpretation bias towards a more positive one. This is usually done through text-based
computer training programmes that deliver repeated scenarios in specific ways. How CBM-I
is conducted will be described in further detail in section 2.3.1 below.
Many previous studies have shown a relationship between negative interpretation bias
and varying levels of severity of anxiety, ranging from non-clinical high trait anxiety (e.g.,
MacLeod & Cohen, 1993) to clinical levels of social anxiety (e.g., Mobini, Reynolds &
Mackintosh, 2013). A recent meta-analysis of studies using CBM-I within clinical and non-
clinical samples indicates small but significant effect sizes on anxiety in both post-test (g =
0.13, 95% CI = [0.05, 0.22]) and stressor (g = 0.28, 95% CI = [0.16, 0.41] types of study
protocol (Hallion & Ruscio, 2011).
Therefore, this study will not seek to replicate previous studies by determining
whether or not interpretation biases change as a result of CBM-I. Any change in social
35
anxiety symptoms attributed to CBM-I will be assumed to have happened due to underlying
change in interpretation biases.
At present, the link between social anxiety, paranoia and persecutory delusions is
reasonably well established. However, no experimental studies have used CBM-I to target
social anxiety within the context of persecutory delusions. Two studies published to date
have examined the feasibility of CBM-I to treat both social and state anxiety within the
context of psychosis. Steel, Wykes, Ruddle, Smith, Shah and Holmes (2010) reported a non-
significant reduction in state anxiety following a single session of CBM-I in a group of 21
individuals diagnosed with schizophrenia. Turner et al. (2011) piloted a CBM-I task
particularly for social anxiety in psychosis using a case series of six individuals experiencing
first episode psychosis, resulting in more positive interpretation of social situations and
improvement in social anxiety after a single session. However, neither study investigated
levels of paranoia. Given the proposed link between social anxiety and paranoia in the
genesis of persecutory ideation, it would seem theoretically worthwhile to investigate any
indirect effects CBM-I may also have on paranoia, as well as social anxiety. Preliminary
empirical findings suggest a possible link between reducing interpersonal anxiety, such as
worry and a corresponding reduction in paranoia, as previously discussed (Foster et al, 2010).
However, given that the Threat Anticipation Model (Freeman, 2007) highlights at least
three important mechanisms (social anxiety or worry, anomalous experiences and reasoning
biases), reducing social anxiety alone may not be enough to produce appreciable reductions in
persecutory thinking. Targeting reasoning biases may also reduce paranoia; promote
increased data gathering in uncertain situations and increase belief flexibility, which may
result in increased processing of disconfirming information. Computerised treatment
packages targeting reasoning biases have been developed for delusions generally, and may
now be indicated for persecutory delusions.
36
1.7.2 Targeting reasoning biases: the Maudsley Review Training Programme
(MRTP; Waller, Freeman, Jolley, Dunn & Garety, 2011). As previously discussed, the
Threat Anticipation Model (Freeman, 2007) also implicates reasoning biases in the formation
and maintenance of persecutory delusions. Selective gathering of confirmatory evidence and
dismissal of disconfirmatory evidence are hypothesised to lead to the rapid acceptance of
beliefs, even if there is limited evidence to support them. Computerised reasoning packages
have been developed and piloted to reduce the reasoning biases of JTC, promote increased
belief flexibility, and reduce delusional conviction rates. These have generally been delivered
also as computer packages, which involve training slides, video vignettes and other exercises
that individuals can engage with. For example, Waller et al. (2011) used the MRTP among 13
people with delusions with high conviction, demonstrating a significant improvement in
reasoning (belief flexibility, and a non significant reduction in JTC) after a single session. A
more detailed description of the MRTP is given in section 2.3.2. Similarly, preliminary
results from a recent randomised controlled trial using the same programme indicate an
improvement in reasoning (significant reduction in JTC and improvement in belief flexibility)
over the 3 time points measured, following 3 sessions (Waller, H. personal communication,
June 2012).
Although the exact nature of the relationship between reasoning biases and paranoia is
less clear (Freeman et al., 2005a), research does suggest some association between paranoia
and the JTC bias in particular (e.g., Moritz, Van Quaquebeke & Lincoln, 2012; Garety et al.,
2013). Therefore, similar to social anxiety, investigating the effect of improving reasoning
biases on levels of paranoia would also be theoretically and clinically important.
1.7.3 The rationale for hypothesising differential effects of CBM-I and the MRTP
on social anxiety and reasoning biases. As discussed above, negative interpretative biases
contribute to social anxiety, and targeting these biases using CBM-I has led to modest
improvements in anxiety. Reasoning biases are involved in persecutory delusion formation
37
and maintenance through biased data gathering and lack of belief flexibility, and targeting
these biases with the MRTP has led to improvements in reasoning.
The Threat Anticipation Model (Freeman, 2007) proposes that both social anxiety and
reasoning biases play different yet complementary roles in the formation and maintenance of
paranoia and therefore persecutory delusions. To date, no studies have examined the
differential effects of CBM-I on social anxiety and the MRTP on reasoning biases within the
same group. This comprises the first research question. Since social anxiety and reasoning
biases are hypothesised to interact and therefore develop and maintain paranoia, the second
research question asks whether targeting social anxiety and reasoning biases will have any
subsequent effect on levels of paranoia. These will be the aims of the current study.
1.7.4 Research hypotheses. Based on the rationale above, the following hypotheses
will be tested:
1. In comparison to baseline, five sessions of CBM-I will reduce levels of social
anxiety, but will not improve reasoning in a sample of individuals with
persecutory delusions.
2. In comparison to baseline, five sessions of CBM-I will correspondingly reduce
levels of severity of paranoia in a sample of individuals with persecutory
delusions.
3. In comparison to baseline, five sessions of the Maudsley Review Training
Programme (MRTP) will improve reasoning, but will not improve anxiety in a
sample of individuals with persecutory delusions.
4. In comparison to baseline, five sessions of MRTP will result in a
corresponding reduction in paranoia in a sample of individuals with
persecutory delusions.
The next chapter will outline the design and methodology used to test the above
hypotheses.
38
Methods
2.1 Participants
Participants were approached from Early Intervention and Adult Recovery services
based in King’s Lynn. Inclusion criteria were males and females aged between 18-65 years
with a primary diagnosis of schizophrenia spectrum disorder and presence of persecutory
delusions, based on Freeman and Garety’s (2000) criteria. Both criteria were (a) belief that
harm is occurring, or that harm will occur to the individual and (b) belief that the persecutor
has intention to inflict harm on the individual. Conviction level in persecutory belief needed
to be at 50% or higher at time of assessment, as assessed by The Psychotic Symptoms Rating
Scales – Delusions subscale (PSYRATS-B; Haddock, McCarron, Tarrier & Faragher, 1999).
Participants needed to be deemed to have capacity to give informed consent by their care
coordinator or responsible clinician.
Exclusion criteria included a primary diagnosis of substance or alcohol dependency,
organic syndrome or learning disability, insufficient command of English to engage in the
tasks, or receiving psychological input at the same time as the study (for ethical reasons and to
reduce potential differential effects of other interventions on outcome measures).
Although no formal power calculation was needed, some consideration of sample size
was required. Kazdin (2010) does not describe any formal means of calculating how many
participants are adequate for a single case series for standard hypothesis testing. Therefore,
other non-statistical considerations were addressed, such as: what would be a feasible number
of participants, given the constraints of time and resources? What would provide a good
enough balance of participants, to be able to be randomised to four different conditions and to
provide enough data to adequately test the differential hypotheses? Although no sample sizes
are recommended, Gerring (2007) does describe single case series studies with a sample of
five participants to test standard hypotheses. Since there are no other papers or books (to the
39
author’s knowledge) that recommend appropriate sample sizes, it was decided that doubling
the minimum of five and adding two (for potential attrition, etc.) would be a sensible sample
size for the current study. Therefore, 12 participants were sought after. All 12 participants
were recruited, with no missing data and none lost to follow-up. The sample comprised eight
males and four females with a mean age of 39.4 (SD = 14.5) and an age range of 19-61.
Table 3.2 in the results section gives full demographic and clinical information on all
participants.
2.2. Design
The study employed a multiple baseline single case series ABC crossover design
(Kazdin, 2010), with a total of 12 participants allocated to one of four conditions using block
randomisation. Block randomisation was conducted by the author’s primary supervisor and
the allocation slips kept in sealed envelopes so that the author did not know to which
condition the participant would be assigned until after the participant had consented on to the
study. The four conditions comprised two differing baseline lengths of two or three weeks
and counterbalanced order of treatment blocks. Counterbalancing of packages assisted with
control of carry-over effects and enhanced confidence in attributing any symptomatic
improvement to the treatment, rather than extraneous influences (Kazdin, 2010). Multiple
baseline periods and two baseline assessments established that symptoms were not on a
natural path to recovery (Nock et al., 2007). Each package block was approximately two
weeks, bearing in mind flexibility of research appointments for participants. Figure 2.1
illustrates the design and treatment allocation.
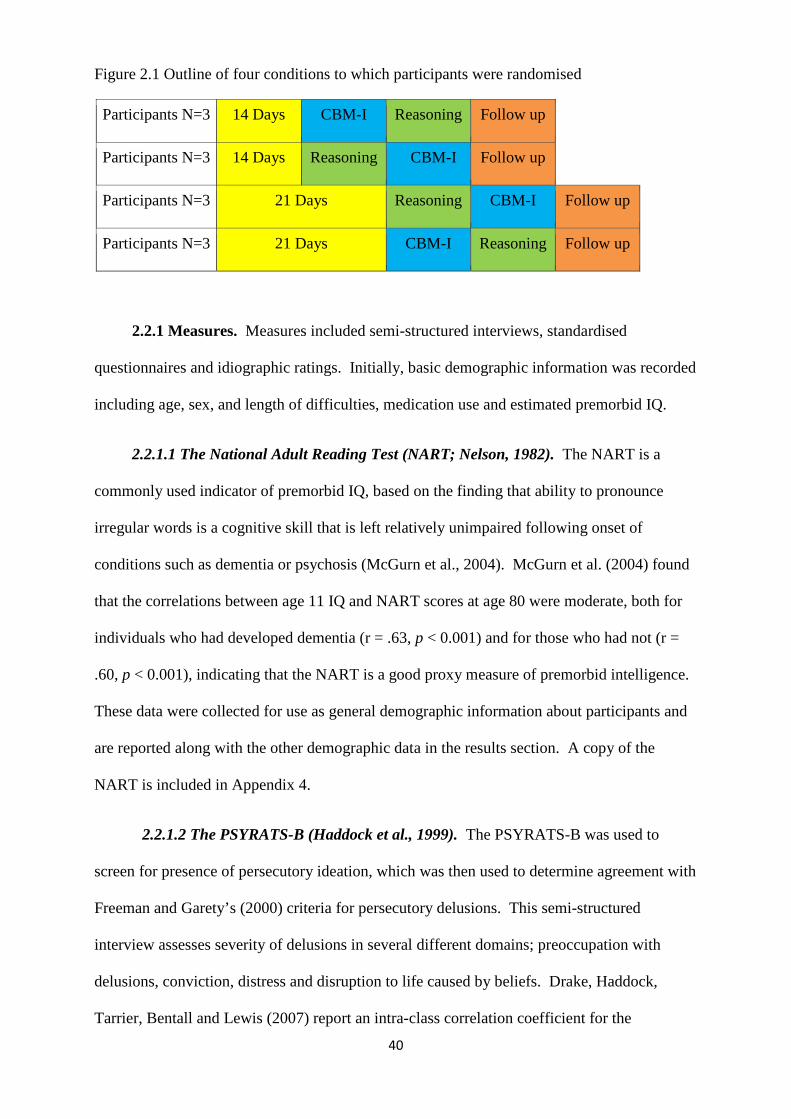
40
Figure 2.1 Outline of four conditions to which participants were randomised
Participants N=3 14 Days CBM-I Reasoning Follow up
Participants N=3 14 Days Reasoning CBM-I Follow up
Participants N=3 21 Days Reasoning CBM-I Follow up
Participants N=3 21 Days CBM-I Reasoning Follow up
2.2.1 Measures. Measures included semi-structured interviews, standardised
questionnaires and idiographic ratings. Initially, basic demographic information was recorded
including age, sex, and length of difficulties, medication use and estimated premorbid IQ.
2.2.1.1 The National Adult Reading Test (NART; Nelson, 1982). The NART is a
commonly used indicator of premorbid IQ, based on the finding that ability to pronounce
irregular words is a cognitive skill that is left relatively unimpaired following onset of
conditions such as dementia or psychosis (McGurn et al., 2004). McGurn et al. (2004) found
that the correlations between age 11 IQ and NART scores at age 80 were moderate, both for
individuals who had developed dementia (r = .63, p < 0.001) and for those who had not (r =
.60, p < 0.001), indicating that the NART is a good proxy measure of premorbid intelligence.
These data were collected for use as general demographic information about participants and
are reported along with the other demographic data in the results section. A copy of the
NART is included in Appendix 4.
2.2.1.2 The PSYRATS-B (Haddock et al., 1999). The PSYRATS-B was used to
screen for presence of persecutory ideation, which was then used to determine agreement with
Freeman and Garety’s (2000) criteria for persecutory delusions. This semi-structured
interview assesses severity of delusions in several different domains; preoccupation with
delusions, conviction, distress and disruption to life caused by beliefs. Drake, Haddock,
Tarrier, Bentall and Lewis (2007) report an intra-class correlation coefficient for the
41
PSYRATS-D subscale of .70, indicating good test-retest reliability. Kendall’s tau for each
subscale score minus that item ranged from .17 to .41, indicating overall adequate internal
consistency. Drake et al. (2007) also report a Spearman coefficient of .80, indicating good
sensitivity to change in relation to the Delusions subscale of the Positive and Negative
Syndrome Scale (PANSS; Kay et al., 1987), which is a very well established measure of
positive symptoms. A copy of the PSYRATS-D is included in Appendix 4.
2.2.1.3 The Social Interaction Anxiety Scale (SIAS; Mattick & Clarke, 1998). This
measure assesses levels of social anxiety, including cognitive, affective and behavioural
reactions to situations that involve social interaction. Out of a total of 60 points, scores of 34
or above indicate clinically significant social phobia, while scores of 43 or above indicate
clinical levels of social anxiety that impact on the individual’s life greatly. Mattick and
Clarke (1998) report high internal consistency (α = .94), while others have demonstrated good
test-retest reliability (range from .86 to .92; Heimberg, Mueller, Holt, Hope & Liebowitz,
1992). Factor analysis has revealed good construct validity, indicating that the SIAS
measures social anxiety well with good convergent and discriminant validity also being
demonstrated (Orsillo, 2001). The SIAS is increasingly being used in research studies as well
as in clinical work with people who experience psychosis, e.g., Turner et al. (2011). A copy
of the SIAS is included in Appendix 4.
2.2.1.4 The Green et al., Paranoid Thoughts Scale (GPTS; Green et al., 2007). The
GPTS is a 32-item scale with two constructs measuring (1) ideas of reference and (2) overt
persecution, which combined make a robust measure for paranoia. Reliability was found to
be very high (α = .90) and factor analysis demonstrated good measurement of ideas of
reference and persecution. Concurrent and convergent validity were estimated by correlating
scores from the GPTS with existing measures of paranoia, namely the Paranoia Scale (PS;
Fenigstein & Vanable, 1992) and the Peters et al., Delusions Inventory (PDI; Peters, Joseph &
Garety, 1999). This indicated good validity of the GPTS when compared with the PDI
42
(Spearman’s ρ = 0.39, p = 0.01) and the PS (ρ = 0.81, p = 0.01, Green et al., 2007).
Sensitivity to change in relation to the PSYRATS was demonstrated by significant positive
correlations with GPTS scores over time. A copy of the GPTS is included in Appendix 4.
2.2.1.5 The 85:15 and 60:40 Beads Tasks (Garety et al., 2005; Dudley, John, Young
& Over, 1997). These tasks both represent the ‘easy’ and ‘difficult’ versions of a Bayesian
probabilistic reasoning task that has been extensively used among individuals with delusions,
to measure the JTC reasoning bias. During this ‘easy’ task, individuals are presented with
two jars each containing 100 coloured beads. There are 85 beads of one colour (e.g., black)
and 15 beads of another (e.g., yellow) in one jar, while the other jar contains beads in opposite
proportions (i.e., 15 black and 85 yellow). The jars are removed from view. Upon request
from the participant, beads are presented, one at a time, from one of the jars in a
predetermined order. Although predetermined, the participants are informed that the jars and
order of beads have been selected randomly every time the task is given. Participants can
view as many beads as they want until they are certain from which jar the beads are drawn. In
a harder version of the task, a colour ratio of 60:40 instead of 85:15 may be used (Dudley et
al., 1997). Freeman (2007) reviewed the literature and found that in the ten studies looking at
discriminatory performance on the different versions of the beads tasks, all ten showed
significantly hastier data gathering within the delusions groups. JTC seems to also be related
to strength of belief conviction (Garety et al., 2005). The relationship between JTC and
persecutory delusions is less clear, most likely because the majority of studies rarely focus on
delusion subtypes. However, initial data indicate that the JTC bias has been found to also be
significantly pronounced among individuals with persecutory delusions when compared with
matched non-clinical controls (Conway et al., 2002; Startup, 2004; Startup, Freeman &
Garety, 2008). Data were grouped by category of whether participants JTC or not – this was
operationalised as a decision based on two or fewer beads drawn.
43
2.2.1.6 Possibility of being Mistaken (PBM) and Reaction to Hypothetical
Contradiction (RTHC) items from the Maudsley Assessment of Delusions Schedule
(MADS; Wessely et al., 1993). These measures have been extensively used in delusions
research (Garety et al., 2005). These components of the MADS are delivered as a semi-
structured interview. PBM is measured by recounting the evidence that the participant has
cited for their belief and by then asking the participant ‘Is there any possibility that you might
be mistaken?’ in relation to their primary belief. A Yes/No response is recorded, providing
categorical data. Wessely et al. (1993) report good inter-rater reliability for this component (k
= .91). RTHC involves presentation of a hypothetical scenario (the participant is informed it
is hypothetical, in order to encourage engagement with the scenario) that is at clear odds with
the content of the delusion. Their reaction to this scenario is coded as follows: 1.
Ignores/Rejects Scenario, 2. Accommodates Scenario into Delusion, 3. Delusional Conviction
is lowered, 4. Delusion is dismissed. In this case, one and two indicate belief inflexibility,
three and four indicate belief flexibility, thus providing either ordinal or categorical data for
this measure. Wessely et al. (1993) report good inter-rater reliability for this component (k =
.90). Copies of these measures are included in Appendix 4.
2.2.1.7 Explanations of Experiences Assessment (EoE; Freeman et al., 2004). This is
an item also taken from the MADS (Wessely et al., 1993), which presents a description of the
delusional belief, and asks, citing the identified evidence for this belief, if any other
explanations for these experiences could be possible, even if the participant considers the
alternative to be very unlikely. The numbers of explanations that are qualitatively different
from the primary explanatory delusion are counted, therefore giving continuous scores to be
used in analysis. Freeman et al. (2004) report an inability to calculate a simple reliability
statistic and so examined each of the changes over three months separately for the 25
individuals that were given repeat administration of the EOE interview, concluding that good
stability was demonstrated overall. In terms of validity, individuals who had alternatives
44
(83%) were more likely than those who did not (43%) to have greater awareness that they
experienced false beliefs, as assessed by the Assessment of Insight in Psychosis (Amador,
Strauss, Yale, Gorman, & Endicott, 1993), t (95) = 3.16, p < .01. Therefore, this indicates
that the EoE shows some validity, in that it is consistent with another established measure of
insight (Freeman et al., 2004). A copy of the EoE interview schedule is included in Appendix
4.
2.2.1.8 Idiographic ratings of anxiety, conviction and paranoia. In order to establish
levels of anxiety, delusional conviction and paranoia that are stable and not on a natural path
to recovery, it was necessary to take multiple measures on a daily basis. Idiographic self-
ratings of anxiety, delusional conviction and paranoia were completed once daily.
Participants were asked to provide a rating from 0-100% to measure social anxiety severity.
To assist participants with giving these ratings, anchor points were provided; 0% = not at all
anxious, 25% = somewhat anxious 50% = moderately anxious, 75% = very anxious, 100% =
extremely anxious. Similar anchor points were also given to assist with 0-100% ratings levels
of delusional conviction and paranoia (Appendix 5).
2.2.1.9 Anecdotal qualitative observations from participants. As part of every session,
any noteworthy qualitative feedback from participants was recorded. This typically included
any helpful aspects of either programme they had remembered, or how they felt they were
responding to the study programmes. These qualitative data were not subjected to any formal
analysis; the author’s primary supervisor read through drafts of the results section to ensure
that comments included were appropriate and were for informational purposes to enhance
understanding of the quantitative results of each case.
2.3 Experimental manipulations
2.3.1 Text-based CBM-I for social anxiety in psychosis, Turner et al. (2011). The
aim of CBM-I is to train individuals to appraise an ambiguous social situation in a more
45
positive or neutral way. It is the bias modification which is hypothesised to result in symptom
reduction (Mathews & Mackintosh, 2000). The training materials used in the current study
were based on the original text based paradigm and were identical to those developed by
Turner et al. (2011). Prior to beginning each session, participants were asked to engage in a
brief visual exercise, in order to promote visual imagination of the text-based materials, which
previous research has shown to be more effective than verbal processing alone (e.g., Holmes,
Matthews, Dalgleish & Mackintosh, 2006). This exercise is based on the study by Holmes et
al. (2006). Participants were asked to close their eyes while they imagined cutting a lemon
(holding the lemon, shining a light on it and looking at its skin, cutting it with a knife and
squeezing it) then rating how vividly they could imagine the images on a 5 point likert scale
(1 = not at all vivid, 5 = extremely vivid). This exercise provides a useful means of assessing
the degree to which participants can use imagery as well as explaining what was being asked
of them during the following task.
Following administration of the brief visual exercise, participants were presented with a
written set of instructions and 100 scenarios (see Appendix 6), given in blocks of 10, with
optional brief rests after each block. Each scenario was 3 lines in length, and was emotionally
ambiguous until the last word, which was presented as fragmented, and resolves the scenario
in a positive way. To progress through the text-based stimuli at their own pace, participants
pressed the ‘advance key’ (programmed to be the down arrow key). The scenario concluded
once the participant entered the correct letter. At the end of each scenario, a comprehension
question was presented to ensure the participant had interpreted and understood the scenario
in the intended way. Feedback on whether the participant’s response was ‘correct’ or
‘incorrect’ was given. Each session lasted approximately 60 minutes.
An example of one scenario is: “A friend suggests that the two of you join an evening
class on creative writing. The thought of other people looking at your efforts makes you feel
[word presented with missing letters: enth----st-c]. [Correct word: enthusiastic]. [Missing
46
letter: u]. Would you expect to feel uncomfortable if others look at your work? [Correct
response: No].” No other data (e.g., response time, interpretation bias pre/post measurement)
from the CBM-I task will be recorded. As described in the introduction, interpretation bias
will be assumed to have changed, if levels of social anxiety have decreased from baseline,
following CBM-I.
2.3.2 The Maudsley Review Training Programme; the MRTP – Waller et al.
(2011). Adapted from earlier work by Ross, Freeman, Dunn and Garety (2011), this package
aims primarily to reduce frequency of JTC, improve ability to generate alternative
explanations of experiences and ultimately to reduce delusional conviction, without directly
challenging any of the delusional content itself. The training package was delivered in task
format; each task was delivered by computer and then discussed with the participant. A
synopsis of the five tasks follows, a screenshot of some of the slides in the MRTP is provided
in Appendix 10.
Task 1: ‘What’s the Picture?’ This task introduces the idea that it can be difficult to
come to an informed decision without all of the evidence. Six pictures are revealed in
sections, one at a time; the participant is given the option to decide what picture it is (from a
list of six possibilities displayed at the beginning), or to request another piece to be added to
it. The task is designed so that all options are potentially correct to begin with, and only by
requesting more information will the correct option become clearer. This teaches participants
to look for more evidence before making a decision.
Task 2: ‘Illusions.’ This introduces the idea that things are not always as they first seem
and that sometimes we only see part of the story, which can lead us to jump to conclusions
and make mistakes. A series of optical illusions are presented, which helps to illustrate this.
Task 3: ‘First impressions.’ This task gives three real life examples in video vignettes
of scenarios. Participants are asked to rate what they believe is going on at early stages of the
47
scenarios, which illustrates how we can all make incorrect assumptions, if we do not slow
down and gather all the necessary evidence.
Task 4: ‘Looking for other possible explanations.’ This introduces the idea of thinking
flexibly about alternative explanations before reaching a conclusion. Three video vignettes are
shown, each with the option of positive, neutral or paranoid interpretation. Participants are
encouraged at various points to use the interactive software to interpret the scenario as they
see fit, with a discussion after the end of each vignette, depending on their interpretation.
Task 5: ‘JTC summary.’ This final task allows review of the key learning points
throughout the tasks. Participants are shown four video scenarios, involving characters who
jump to conclusions. They are encouraged to identify who the characters that jump to
conclusions will be. Finally, they are asked about how the characters might have avoided the
situations they got themselves into, by not jumping to conclusions.
The tasks do not involve any material directly related to the participant’s delusional
content, but are based on everyday scenarios such that it is anticipated or hoped that the
participant might be able to generalise the ideas to their own experiences. The format is video
and task-based, which is interactive, and encourages active participation. Each session lasted
about 60 minutes.
2.3.3 Equipment. The 85:15 and 60:40 versions of the Beads Task (Garety et al., 2005,
Dudley et al., 1997) were developed on Microsoft PowerPoint. The CBM-I materials were
programmed and presented using E-Prime Software (Version 2.0, Psychology Software Tools,
Inc 2010). The MRTP materials were developed on Microsoft PowerPoint and then
transferred to a Real BASIC programme to incorporate the interactive elements (Waller et al.,
2011). The programmes were run on a personal laptop using Windows 7 Home Premium (©
Microsoft Corporation, 2009). The testing sessions were carried out in locations convenient
48
and comfortable for the research participants, i.e., either on NHS premises, or in their own
homes.
2.4 Procedure
2.4.1 Ethical approval, consent and randomisation. Ethical approval was granted by
the NRES Committee East of England on 14th June, 2013 (Ref: 13/EE/0134; see Appendix
11). Research and Development approval for Norfolk and Suffolk NHS Foundation Trust
was given on 26th July, 2013 (see Appendix 12 for the Letter of Access).
Potential participants were first approached by their care coordinators or case managers
within Early Intervention and Recovery services in West Norfolk. Following discussion with
the researcher to determine eligibility for the study, case managers approached potential
participants with the Participant Information Sheet (Appendix 1), in order to briefly explain
what the project entailed and to ascertain if they would be interested in taking part. If so, case
managers passed on contact information (home address and telephone number) to the
researcher who would send them the Participant Information Sheet with a cover letter
(Appendix 2), indicating that they would be contacted via telephone to arrange a screening
meeting.
At the screening meeting the PSYRATS-B semi-structured interview was conducted.
This information was used to determine whether the study was suitable for the participant.
Those who did not meet inclusion criteria were informed verbally and thanked for their time.
Those who were eligible and still interested in taking part were asked to sign a consent form
(Appendix 3). Following consent, basic demographic information was documented (such as
age, sex, length of difficulties, estimated premorbid IQ and medication use) and participants
were randomly allocated to one of the four groups as outlined in figure 2.1 above. Block
randomisation was conducted by the researcher’s supervisor. The researcher was blinded to
allocation of condition, using sealed envelopes, until after the participant had consented to

49
take part. Figure 2.2 below provides a flow diagram of study participants. The five
participants who were not suitable were so because they had no specific beliefs that they were
being harmed on purpose. They were referred for screening by their care co-ordinators in
Early Intervention services because they experienced paranoia. However, after screening, it
transpired that they experienced generalised paranoia, but no persecutory delusions.
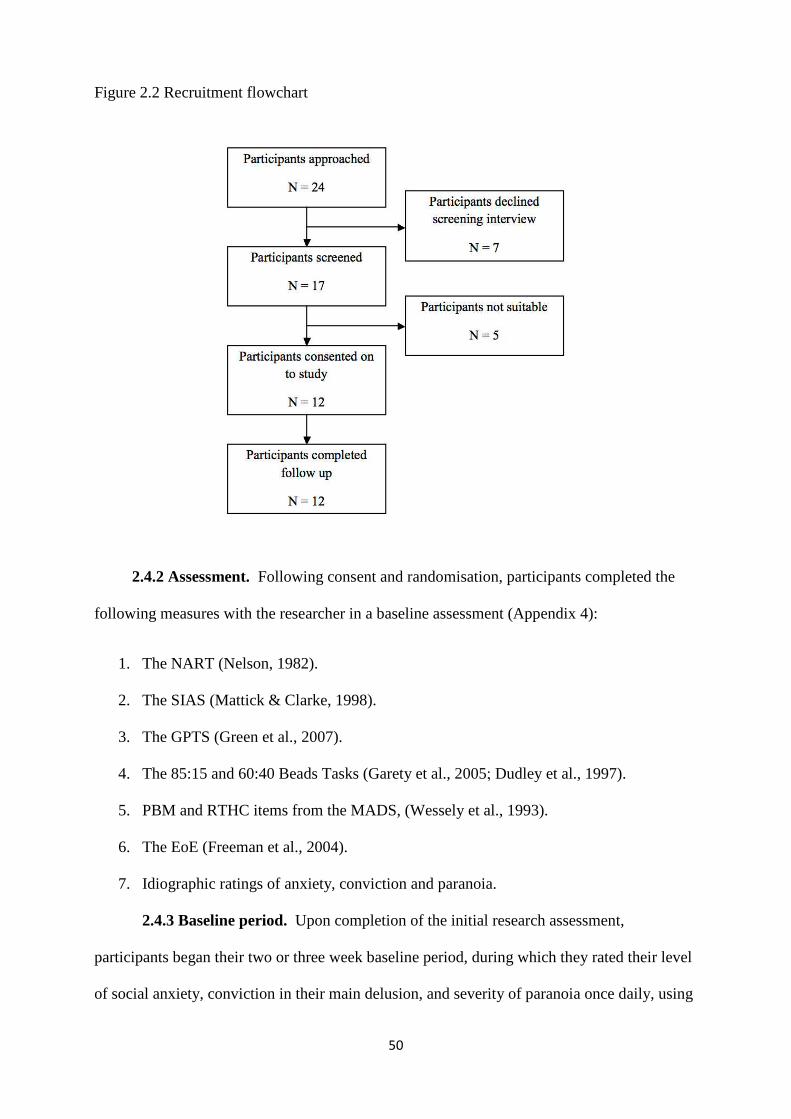
50
Figure 2.2 Recruitment flowchart
2.4.2 Assessment. Following consent and randomisation, participants completed the
following measures with the researcher in a baseline assessment (Appendix 4):
1. The NART (Nelson, 1982).
2. The SIAS (Mattick & Clarke, 1998).
3. The GPTS (Green et al., 2007).
4. The 85:15 and 60:40 Beads Tasks (Garety et al., 2005; Dudley et al., 1997).
5. PBM and RTHC items from the MADS, (Wessely et al., 1993).
6. The EoE (Freeman et al., 2004).
7. Idiographic ratings of anxiety, conviction and paranoia.
2.4.3 Baseline period. Upon completion of the initial research assessment,
participants began their two or three week baseline period, during which they rated their level
of social anxiety, conviction in their main delusion, and severity of paranoia once daily, using
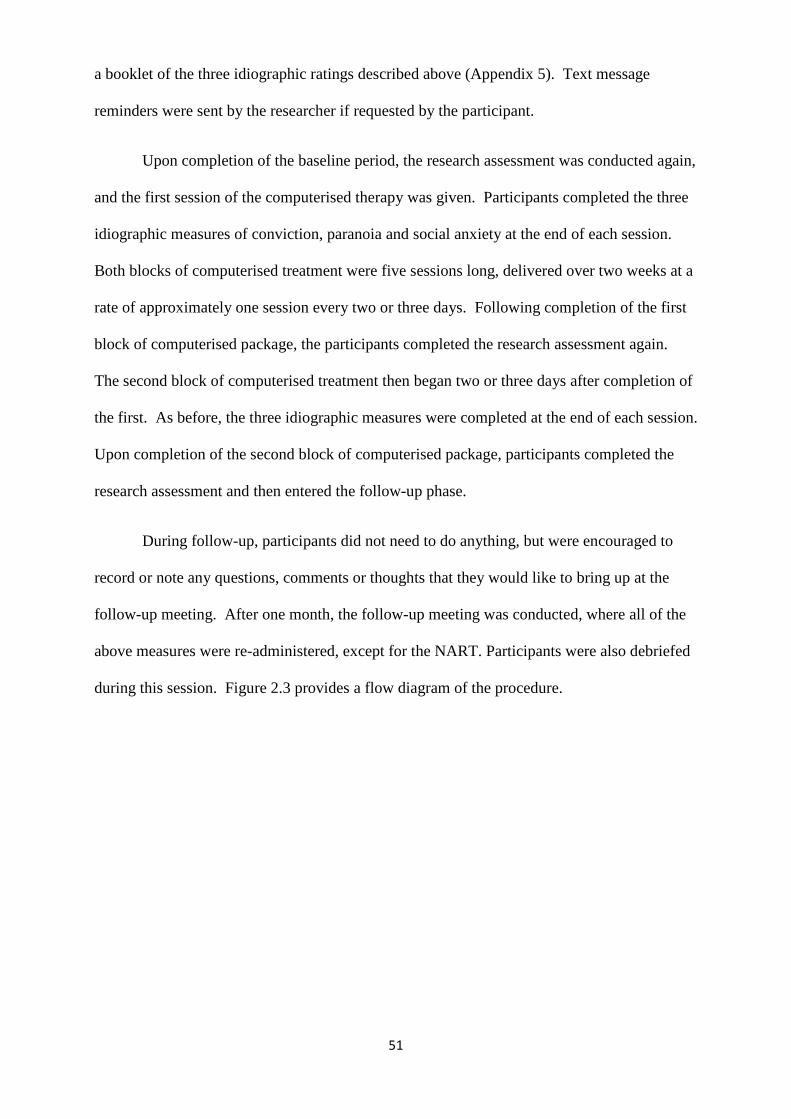
51
a booklet of the three idiographic ratings described above (Appendix 5). Text message
reminders were sent by the researcher if requested by the participant.
Upon completion of the baseline period, the research assessment was conducted again,
and the first session of the computerised therapy was given. Participants completed the three
idiographic measures of conviction, paranoia and social anxiety at the end of each session.
Both blocks of computerised treatment were five sessions long, delivered over two weeks at a
rate of approximately one session every two or three days. Following completion of the first
block of computerised package, the participants completed the research assessment again.
The second block of computerised treatment then began two or three days after completion of
the first. As before, the three idiographic measures were completed at the end of each session.
Upon completion of the second block of computerised package, participants completed the
research assessment and then entered the follow-up phase.
During follow-up, participants did not need to do anything, but were encouraged to
record or note any questions, comments or thoughts that they would like to bring up at the
follow-up meeting. After one month, the follow-up meeting was conducted, where all of the
above measures were re-administered, except for the NART. Participants were also debriefed
during this session. Figure 2.3 provides a flow diagram of the procedure.
52
Figure 2.3 Participant flow diagram
2.5 Data analysis plan
Data were recorded on original anonymous paper files and later entered on to a
Microsoft Excel spreadsheet. This spreadsheet was checked several times for accuracy of
data entry. Data on conviction for participant 11 had to be retrospectively re-rated by the
participant during both package phases, as it transpired during the follow up assessment that
participant 11 had been rating how much they believed the delusion was happening at that
time, rather than how much they believed the delusion was true. Participant 3 declined to do
53
the NART, because the voices were calling them derogatory names at the time. Other than
these instances, there were no other known missing or incorrect data.
2.5.1 Hypothesis one: In comparison to baseline, five sessions of CBM-I will
reduce levels of social anxiety, but will not improve reasoning. To test this hypothesis, the
idiographic data on social anxiety were visually inspected and Kendall’s tau was calculated
(Kazdin, 2010). Data were plotted graphically according to participant on social anxiety
measures over time. A standardised measure of social anxiety, the SIAS, was also used and
the five measurements were plotted underneath the idiographic data. Reliable and clinical
changes were examined between both baseline assessments, at the end of each package phase,
and at four week follow-up. Further information on reliable and clinical change and how they
were calculated is given in the results chapter.
The reasoning component of this differential hypothesis was tested using the beads
tasks. Reliable change could not be calculated due to insufficient published data, but a cut off
score of 3+ draws indicated not JTC. These data were tabulated across the five time points
along with the categorical data derived from the PM, continuous data from the EoE and
ordinal data from the RTHC. Using these two graphs and one table, the differential effects of
CBM-I on social anxiety and reasoning were investigated.
2.5.2 Hypothesis two: In comparison to baseline, five sessions of CBM-I will
correspondingly reduce levels of severity of paranoia. As above, this hypothesis was
tested using visual inspection of the idiographic paranoia data; Kendall’s tau was also
calculated to assess stability of baseline (Kazdin, 2010). GPTS scores were plotted across
phases and aligned underneath the idiographic ratings. There are no clinical cut-offs
published for the GPTS, (Green et al., 2007). However, based on criterion b by Jacobson and
Truax (1991), the clinical cut-off was calculated to be 86.2. The reliable change index for the
GPTS was calculated using the same guidance to be 18.69. These calculations are given in
more detail in the results section.
54
Conviction was included in the analyses with the GPTS scores because it is a
dimensional measure of paranoia (Haddock et al, 1999; Freeman, 2007), indicating how
firmly held the persecutory belief is and how susceptible to change the belief may be. The
idiographic data were visually inspected to determine which package had an effect on
conviction, if any. Kendall’s tau was also calculated to assess stability of baseline. An
improvement in paranoia occurred if a participant improved in GPTS scores and/or
conviction.
2.5.3 Hypothesis three: In comparison to baseline, five sessions of the Maudsley
Review Training Programme (MRTP) will improve reasoning, but will not improve
anxiety. As with the first hypothesis, this hypothesis was tested by visual inspection and
Kendall’s tau calculation of the idiographic data on social anxiety (Kazdin, 2010).
Idiographic social anxiety and SIAS data were plotted graphically according to each
participant over time, visually inspected and examined for clinical and/or reliable change.
The reasoning component of this differential hypothesis was tested using the tabulated
reasoning measures as described above. Improvements in these reasoning measures that were
stable (i.e., were not present during baseline and were maintained at follow up) were
attributed to the relevant package.
2.5.4 Hypothesis four: In comparison to baseline, five sessions of MRTP will result
in a corresponding reduction in paranoia. As described, this hypothesis was tested using
visual inspection and Kendall’s tau calculation of the idiographic paranoia and conviction
data (Kazdin, 2010). GPTS data were examined for clinical and/or reliable change.
2.5.5 Statistical analysis. Although Kazdin (2010) advocates the use of visual
inspection alone, others argue that statistical analyses of time series data are more appropriate
(e.g., Zhan & Ottenbacher, 2001). A recent large scale study reviewed the validity of both
55
visual inspection and statistical analyses, concluding that both should be used in conjunction
with one another (Harrington, 2013).
A programme running Simulation Modeling Analysis (SMA; Borckhardt, 2006) uses
bootstrapping to reliably analyse short streams (N < 30) of time series, autocorrelated data.
SMA was used along with visual inspection to analyse the conviction data. SMA analysis
was only used with conviction data because there was no standardised measure to accompany
conviction change, which could also be inspected visually, as with the social anxiety and
paranoia data. Even though it is likely that the conviction data are not normally distributed,
Borckardt (2006) recommends use of Pearson’s r rather than Spearman’s ρ to determine
significant change in slope and level of phases, because it is more reliable within the model
used.
Conviction data from each treatment phase were both compared with baseline, because
the package could not analyse three variables using correlation. This assumes no carry-over
effects, which is a limitation, but the analyses should be considered in conjunction with the
visual inspection. Use of statistical analysis makes it easier to determine differential effects
on conviction, which was measured with idiographic ratings alone.
To complement interpretation of the visual analyses of social anxiety, paranoia and
reasoning biases, underpowered statistical tests of significance were used, and where
appropriate, effect sizes generated. Data on all participants were merged together to increase
power, but again this assumes no carry-over effects, which is a limitation, but is preferable to
tests with N = 6.
Due to the fact that multiple comparisons would limit the confidence of the findings, it
was decided to test three variables; the second baseline assessment and measures taken from
the CBM-I and the MRTP packages. These tests were reported within the relevant sections
on hypotheses at the end of the results chapter. Because these tests are underpowered, the

56
results should be interpreted with caution. However, if the visual analyses correspond with
the statistical test results, it may improve confidence in the findings.
57
Results
3.1 Overview
This chapter outlines the results of the data analysis plan. Self-reported idiographic
measures of social anxiety, paranoia and belief conviction were collected at assessment points
then graphed in terms of number of days of involvement in the study and visually inspected
using Kazdin’s (2010) criteria. Social anxiety and paranoia measures were assessed for
reliable and clinically significant change at various time points: within the baseline period
itself, following each package phase and at follow up. Reasoning data were tabulated and
monitored for change across phases. Statistical analyses were also computed to complement
the visual inspection. Data were initially grouped together according to each participant, with
a summary of the results per hypothesis at the end. Effect sizes of both packages on social
anxiety and paranoia were calculated.
3.2. Data presentation and analysis
3.2.1 Visual inspection. Kendall’s tau (Kendall, 1970) establishes whether scores
over baseline are stable enough to make a good basis for comparison with the other phases.
Kazdin’s (2010) four criteria for visual inspection are outlined in Table 3.1.
Table 3.1
Criteria for data evaluation in single-case series designs
Characteristic Definition
Change in mean
Change in mean scores from phase to phase, in the expected direction
Shift in level
Change in score from the last day of one phase and the first day of the
next. An abrupt shift facilitates interpretation.
Change in slope
Whether the direction of the slope changes between phases; slopes can be classified as (1) stable, (2) accelerating or (3) decelerating
Latency of change
The speed with which change occurs when the conditions are changed;
briefer latency of change implies an effect
58
Idiographic data were examined according to Table 3.1 above across phases; from left
to right. This means that change was assessed in one phase based on comparison with the
preceding phase. When assessing latency of change, change in idiographic rating between
phases was established by comparing the final rating in the preceding phase with the ratings in
the following phase. The first rating that was different was noted and the number of days that
lapsed in between that change was calculated, and reported in the relevant tables.
When all four criteria are met, effects can be easily attributed to the relevant package
(Kazdin, 2010). However, all four criteria need not be met to infer an effect, and the criteria
can vary, making the process more subjective (Kazdin, 2010). Reliable and clinical change
was assessed slightly differently. Scores on the SIAS and GPTS were examined by first
determining whether there was a significant reduction between both baseline assessments.
Reduction in the second baseline assessment, relative to the first, made it more difficult to
attribute change to the relevant package because the baseline itself was not stable. Mean
baseline scores minus the RCI were then compared with all phases, to determine whether
there was a significant reduction in each phase.
Clinical and/or reliable reductions compared to baseline were reported for each phase,
including follow up. Due to the fact that two package phases were used to test differential
hypotheses, it was decided that the package that first resulted in a significant effect would
support the relevant hypothesis. This was to separate out potential interaction effects of both
packages. For example, if there were no significant reductions in social anxiety during
baseline or MRTP phases, but there were during the CBM-I and follow-up phases, hypothesis
one (CBM-I would improve social anxiety, but not reasoning biases) would be supported.
Regarding reasoning biases, it was decided that if an improvement in any one of the five
measures of reasoning biases was stable across the remaining phases, the improvement would
be attributed to the relevant package. For example, if a participant JTC during baseline and
then stopped JTC following phase one (MRTP), and also stopped JTC throughout other
59
phases (i.e., CBM-I and follow-up), then this would be interpreted as an improvement in
reasoning biases, following the MRTP package.
3.2.2 Calculation of clinical and reliable change indices. The guidance by Jacobson
and Truax (1991) was used to calculate clinical and reliable change indices.
3.2.2.1 Clinical change. Jacobson and Truax (1991) recommend three different ways
of calculating appropriate cut scores to denote clinical levels of symptoms when these cut
scores have not been published. When clinical and non-clinical norms are available and do
not overlap with each other, criterion b is recommended (Jacobson & Truax, 1991); this is
where the post-treatment score should fall within two standard deviations of the normative
group mean. Jacobson and Truax (1991) argue that this criterion leads to fairly stringent
levels of clinically significant change. For paranoia assessed by the GPTS using
psychometric data from Green et al. (2007), this was calculated as:
b = (non-clinical mean) + 2*(SD of non clinical group)
b = 48.8 + 37.4 = 86.2.
Therefore, GPTS scores above 86 during baseline that reduced to below 86 during
package phases were considered clinically significant. This is out of a possible range of 32 -
160.
According to Mattick and Clarke (1998), SIAS scores above 34 during baseline that
reduced to below 34 during package phases were also considered clinically significant.
3.2.2.2 Reliable change. The reliable change index (RCI) was calculated using the
following formula (Jacobson & Truax 1991):
1.96*SD1*√2*√ (1-r)
Where SD1 = standard deviation of the sample and r = test re-test reliability coefficient.
60
Using the standard deviation and reliability coefficient reported by Mattick and Clarke
(1998), the RCI for the SIAS was calculated to be:
1.96*16.4*√2*√ (1-.92) = 12.86.
Data from Green et al. (2007) yielded 1.96*18.7*√2*√ (1-.87) = 18.69. Reductions
greater than or equal to 13 points on the SIAS and 19 points on the GPTS were considered
statistically significant.
3.2.3 Participant information. Table 3.2 gives the clinical and demographic
characteristics of the sample. Table 3.3 outlines the threat belief of each participant and
conviction obtained during screening interview.
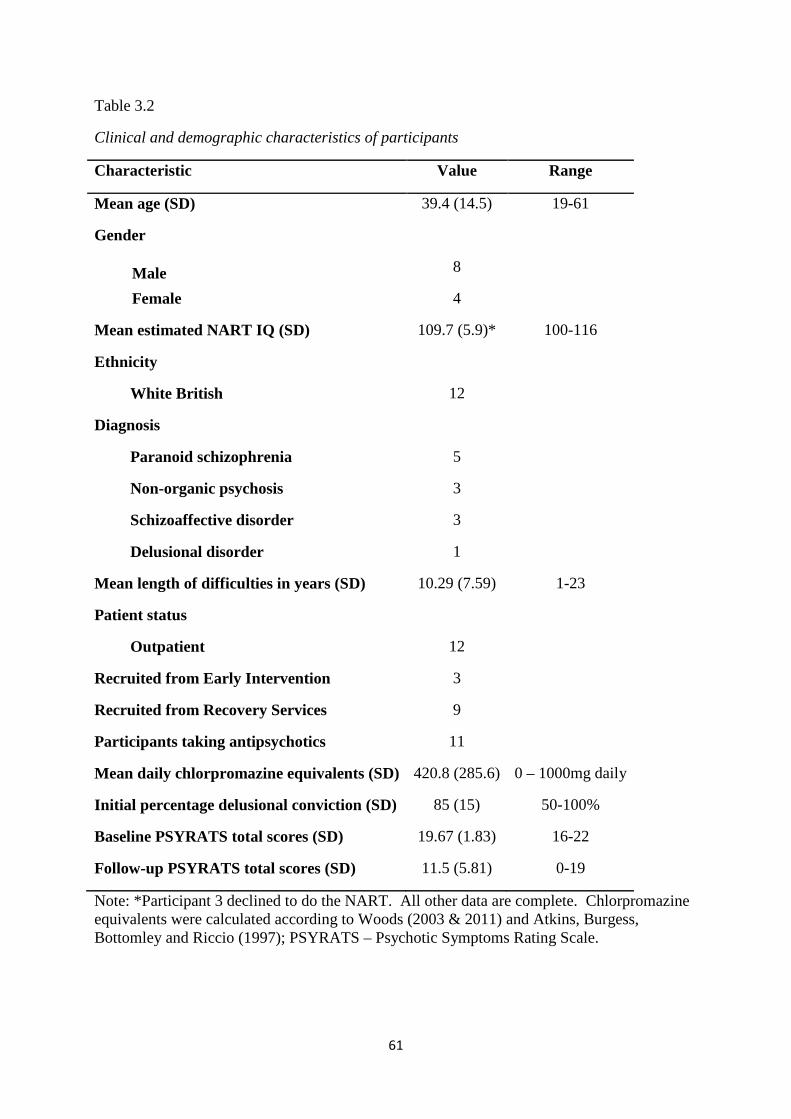
61
Table 3.2
Clinical and demographic characteristics of participants
Characteristic Value Range
Mean age (SD) 39.4 (14.5) 19-61
Gender
8
Male
Female 4
Mean estimated NART IQ (SD) 109.7 (5.9)* 100-116
Ethnicity
White British 12
Diagnosis
Paranoid schizophrenia 5
Non-organic psychosis 3
Schizoaffective disorder 3
Delusional disorder 1
Mean length of difficulties in years (SD) 10.29 (7.59) 1-23
Patient status
Outpatient 12
Recruited from Early Intervention 3
Recruited from Recovery Services 9
Participants taking antipsychotics 11
Mean daily chlorpromazine equivalents (SD) 420.8 (285.6) 0 – 1000mg daily
Initial percentage delusional conviction (SD) 85 (15) 50-100%
Baseline PSYRATS total scores (SD) 19.67 (1.83) 16-22
Follow-up PSYRATS total scores (SD) 11.5 (5.81) 0-19
Note: *Participant 3 declined to do the NART. All other data are complete. Chlorpromazine equivalents were calculated according to Woods (2003 & 2011) and Atkins, Burgess, Bottomley and Riccio (1997); PSYRATS – Psychotic Symptoms Rating Scale.
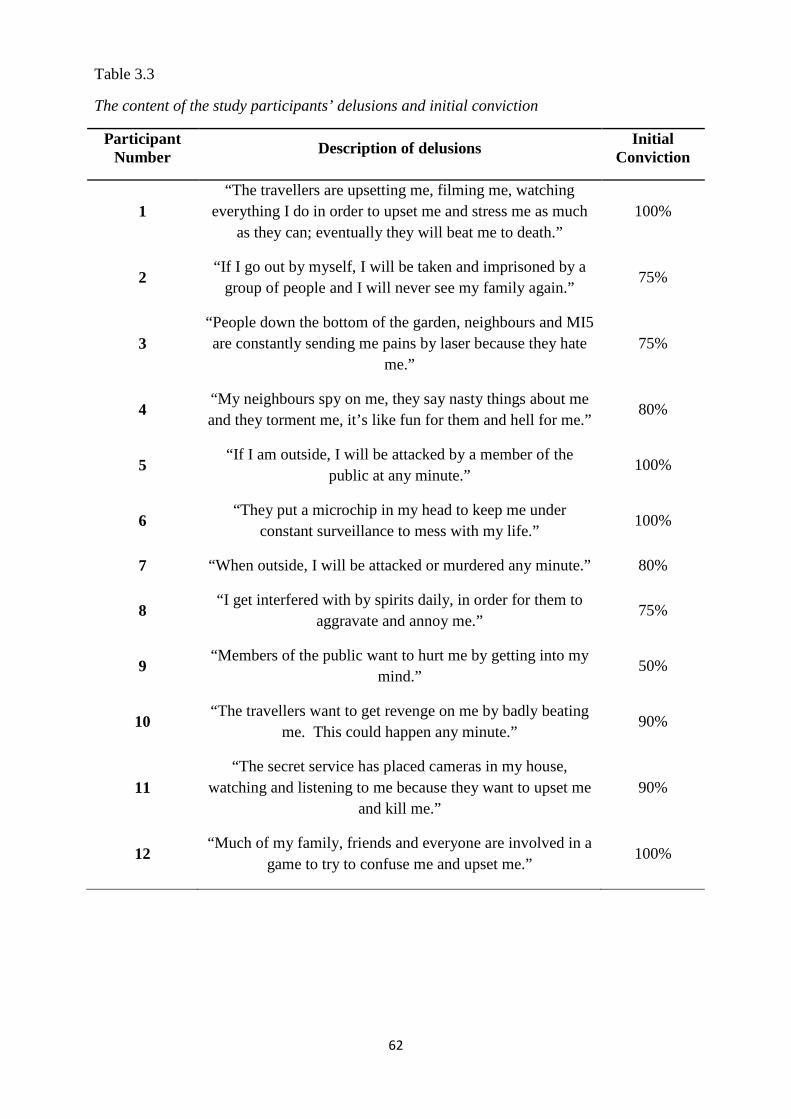
62
Table 3.3
The content of the study participants’ delusions and initial conviction
Participant Number Description of delusions
Initial Conviction
1 “The travellers are upsetting me, filming me, watching
everything I do in order to upset me and stress me as much as they can; eventually they will beat me to death.”
100%
2 “If I go out by myself, I will be taken and imprisoned by a
group of people and I will never see my family again.” 75%
3 “People down the bottom of the garden, neighbours and MI5 are constantly sending me pains by laser because they hate
me.” 75%
4 “My neighbours spy on me, they say nasty things about me and they torment me, it’s like fun for them and hell for me.”
80%
5 “If I am outside, I will be attacked by a member of the
public at any minute.” 100%
6 “They put a microchip in my head to keep me under
constant surveillance to mess with my life.” 100%
7 “When outside, I will be attacked or murdered any minute.” 80%
8 “I get interfered with by spirits daily, in order for them to
aggravate and annoy me.” 75%
9 “Members of the public want to hurt me by getting into my
mind.” 50%
10 “The travellers want to get revenge on me by badly beating
me. This could happen any minute.” 90%
11 “The secret service has placed cameras in my house,
watching and listening to me because they want to upset me and kill me.”
90%
12 “Much of my family, friends and everyone are involved in a
game to try to confuse me and upset me.” 100%
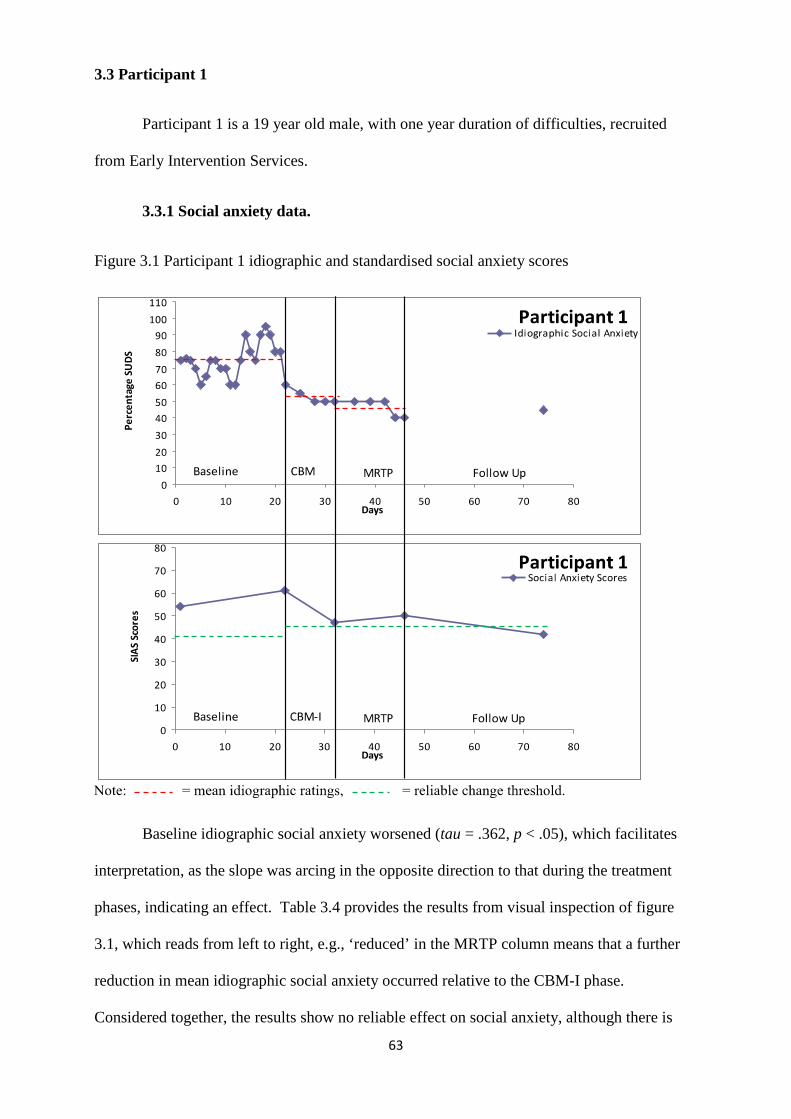
63
3.3 Participant 1
Participant 1 is a 19 year old male, with one year duration of difficulties, recruited
from Early Intervention Services.
3.3.1 Social anxiety data.
Figure 3.1 Participant 1 idiographic and standardised social anxiety scores
Baseline idiographic social anxiety worsened (tau = .362, p < .05), which facilitates
interpretation, as the slope was arcing in the opposite direction to that during the treatment
phases, indicating an effect. Table 3.4 provides the results from visual inspection of figure
3.1, which reads from left to right, e.g., ‘reduced’ in the MRTP column means that a further
reduction in mean idiographic social anxiety occurred relative to the CBM-I phase.
Considered together, the results show no reliable effect on social anxiety, although there is
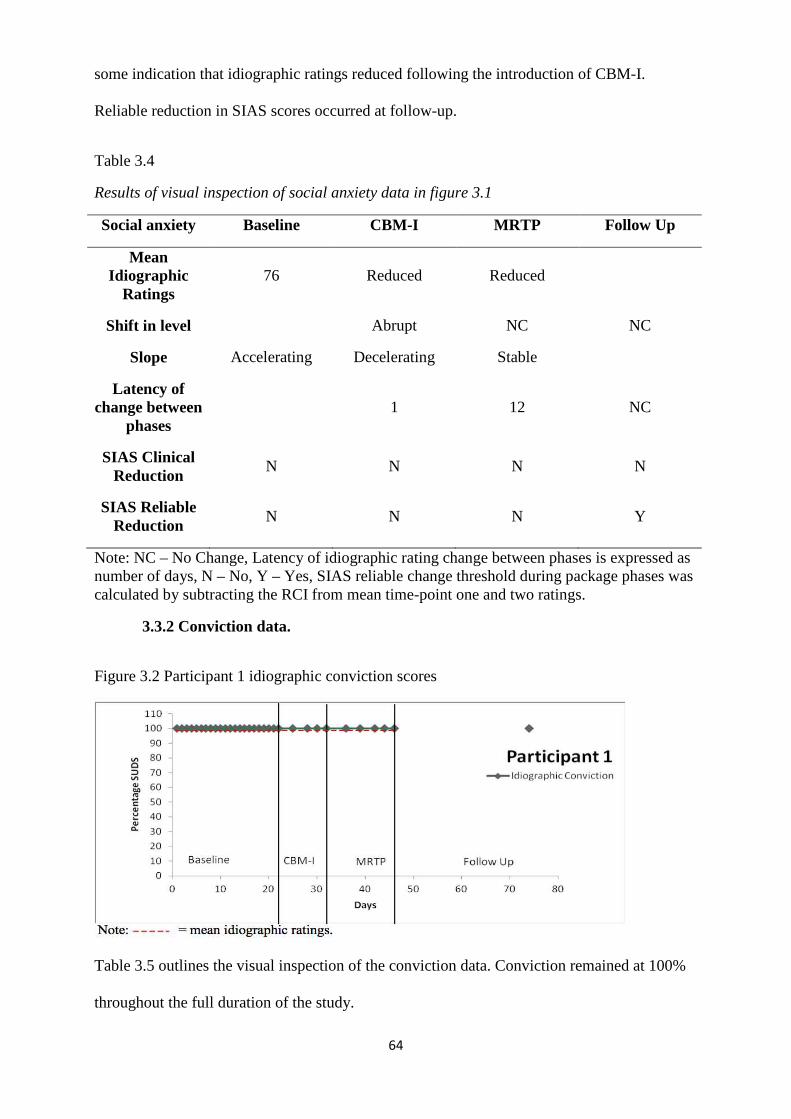
64
some indication that idiographic ratings reduced following the introduction of CBM-I.
Reliable reduction in SIAS scores occurred at follow-up.
Table 3.4
Results of visual inspection of social anxiety data in figure 3.1
Social anxiety Baseline CBM-I MRTP Follow Up
Mean Idiographic
Ratings 76 Reduced Reduced
Shift in level Abrupt NC NC
Slope Accelerating Decelerating Stable
Latency of change between
phases 1 12 NC
SIAS Clinical Reduction
N N N N
SIAS Reliable Reduction
N N N Y
Note: NC – No Change, Latency of idiographic rating change between phases is expressed as number of days, N – No, Y – Yes, SIAS reliable change threshold during package phases was calculated by subtracting the RCI from mean time-point one and two ratings.
3.3.2 Conviction data.
Figure 3.2 Participant 1 idiographic conviction scores
Table 3.5 outlines the visual inspection of the conviction data. Conviction remained at 100%
throughout the full duration of the study.
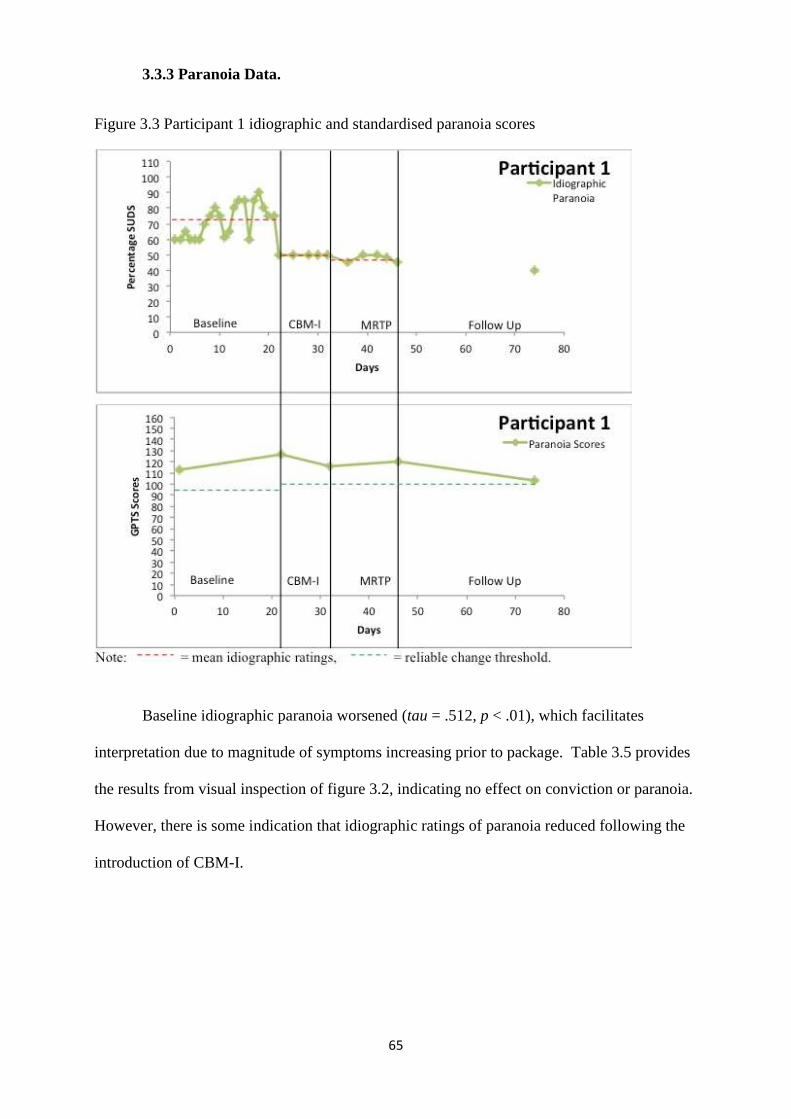
65
3.3.3 Paranoia Data.
Figure 3.3 Participant 1 idiographic and standardised paranoia scores
Baseline idiographic paranoia worsened (tau = .512, p < .01), which facilitates
interpretation due to magnitude of symptoms increasing prior to package. Table 3.5 provides
the results from visual inspection of figure 3.2, indicating no effect on conviction or paranoia.
However, there is some indication that idiographic ratings of paranoia reduced following the
introduction of CBM-I.
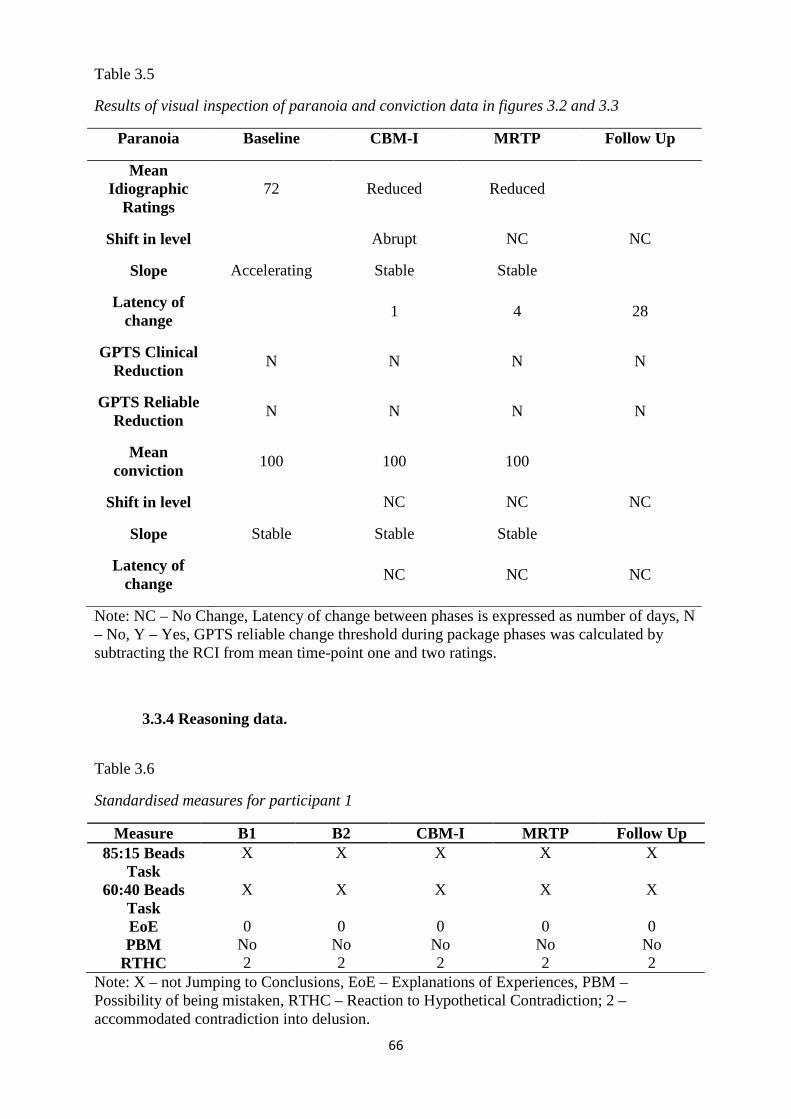
66
Table 3.5
Results of visual inspection of paranoia and conviction data in figures 3.2 and 3.3
Paranoia Baseline CBM-I MRTP Follow Up
Mean Idiographic
Ratings 72 Reduced Reduced
Shift in level Abrupt NC NC
Slope Accelerating Stable Stable
Latency of change
1 4 28
GPTS Clinical Reduction
N N N N
GPTS Reliable Reduction
N N N N
Mean conviction
100 100 100
Shift in level NC NC NC
Slope Stable Stable Stable
Latency of change
NC NC NC
Note: NC – No Change, Latency of change between phases is expressed as number of days, N – No, Y – Yes, GPTS reliable change threshold during package phases was calculated by subtracting the RCI from mean time-point one and two ratings.
3.3.4 Reasoning data.
Table 3.6
Standardised measures for participant 1
Measure B1 B2 CBM-I MRTP Follow Up 85:15 Beads
Task X X X X X
60:40 Beads Task
X X X X X
EoE 0 0 0 0 0 PBM No No No No No
RTHC 2 2 2 2 2 Note: X – not Jumping to Conclusions, EoE – Explanations of Experiences, PBM – Possibility of being mistaken, RTHC – Reaction to Hypothetical Contradiction; 2 – accommodated contradiction into delusion.
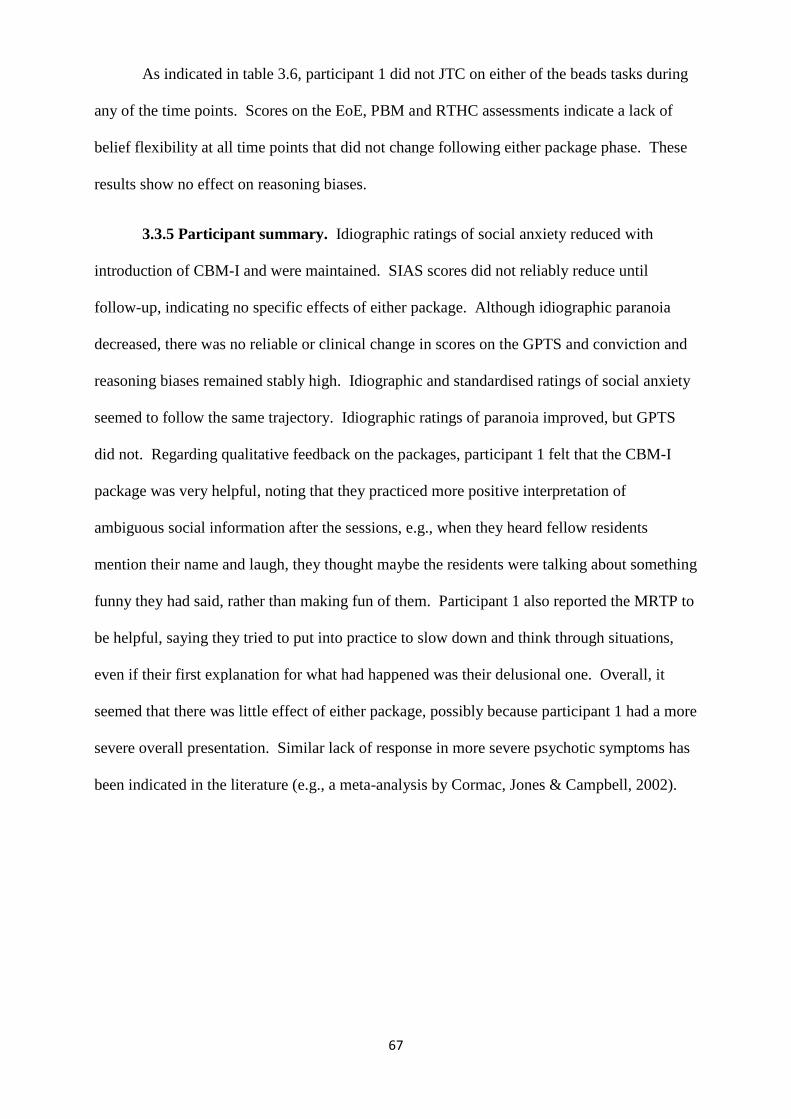
67
As indicated in table 3.6, participant 1 did not JTC on either of the beads tasks during
any of the time points. Scores on the EoE, PBM and RTHC assessments indicate a lack of
belief flexibility at all time points that did not change following either package phase. These
results show no effect on reasoning biases.
3.3.5 Participant summary. Idiographic ratings of social anxiety reduced with
introduction of CBM-I and were maintained. SIAS scores did not reliably reduce until
follow-up, indicating no specific effects of either package. Although idiographic paranoia
decreased, there was no reliable or clinical change in scores on the GPTS and conviction and
reasoning biases remained stably high. Idiographic and standardised ratings of social anxiety
seemed to follow the same trajectory. Idiographic ratings of paranoia improved, but GPTS
did not. Regarding qualitative feedback on the packages, participant 1 felt that the CBM-I
package was very helpful, noting that they practiced more positive interpretation of
ambiguous social information after the sessions, e.g., when they heard fellow residents
mention their name and laugh, they thought maybe the residents were talking about something
funny they had said, rather than making fun of them. Participant 1 also reported the MRTP to
be helpful, saying they tried to put into practice to slow down and think through situations,
even if their first explanation for what had happened was their delusional one. Overall, it
seemed that there was little effect of either package, possibly because participant 1 had a more
severe overall presentation. Similar lack of response in more severe psychotic symptoms has
been indicated in the literature (e.g., a meta-analysis by Cormac, Jones & Campbell, 2002).
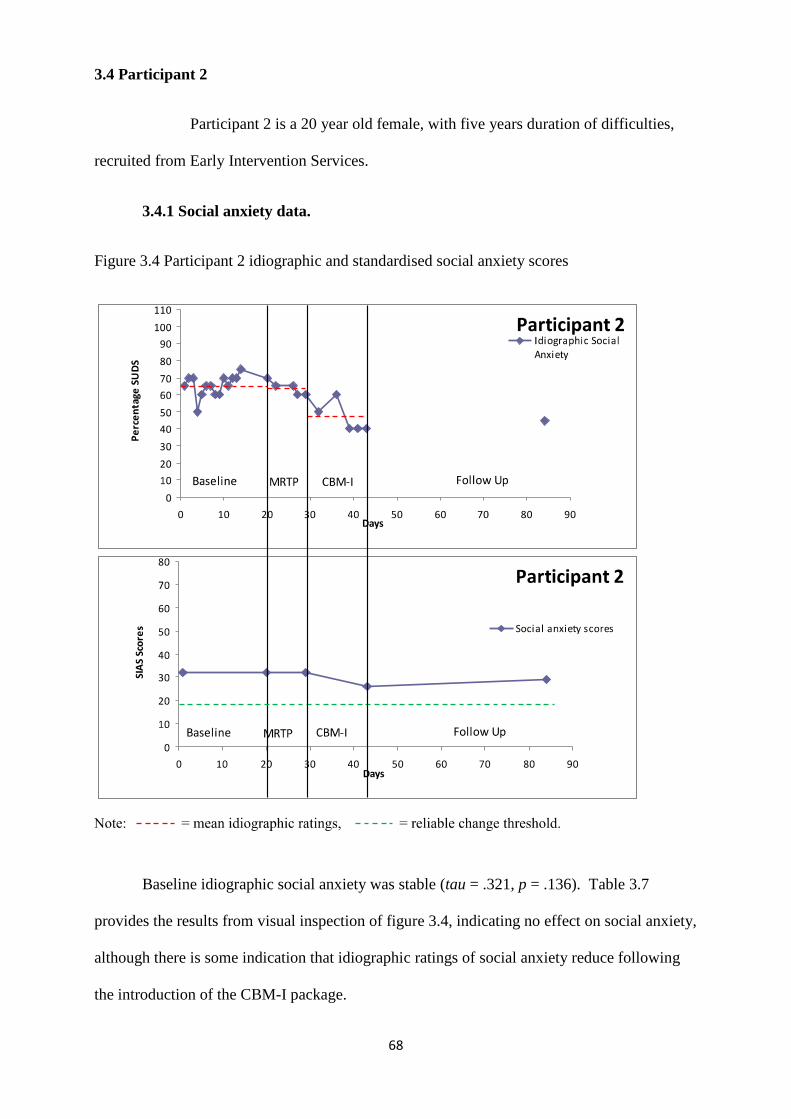
68
3.4 Participant 2
Participant 2 is a 20 year old female, with five years duration of difficulties,
recruited from Early Intervention Services.
3.4.1 Social anxiety data.
Figure 3.4 Participant 2 idiographic and standardised social anxiety scores
Baseline idiographic social anxiety was stable (tau = .321, p = .136). Table 3.7
provides the results from visual inspection of figure 3.4, indicating no effect on social anxiety,
although there is some indication that idiographic ratings of social anxiety reduce following
the introduction of the CBM-I package.
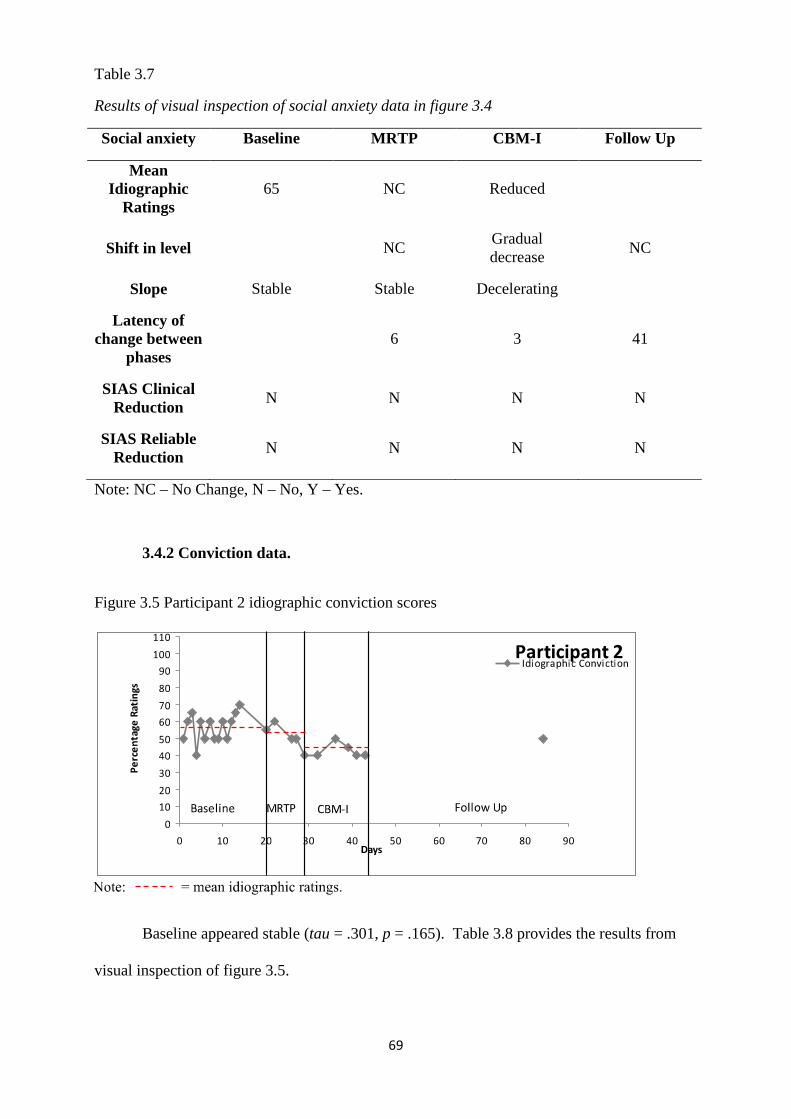
69
Table 3.7
Results of visual inspection of social anxiety data in figure 3.4
Social anxiety Baseline MRTP CBM-I Follow Up
Mean Idiographic
Ratings 65 NC Reduced
Shift in level NC Gradual decrease
NC
Slope Stable Stable Decelerating
Latency of change between
phases 6 3 41
SIAS Clinical Reduction
N N N N
SIAS Reliable Reduction
N N N N
Note: NC – No Change, N – No, Y – Yes.
3.4.2 Conviction data.
Figure 3.5 Participant 2 idiographic conviction scores
Baseline appeared stable (tau = .301, p = .165). Table 3.8 provides the results from
visual inspection of figure 3.5.
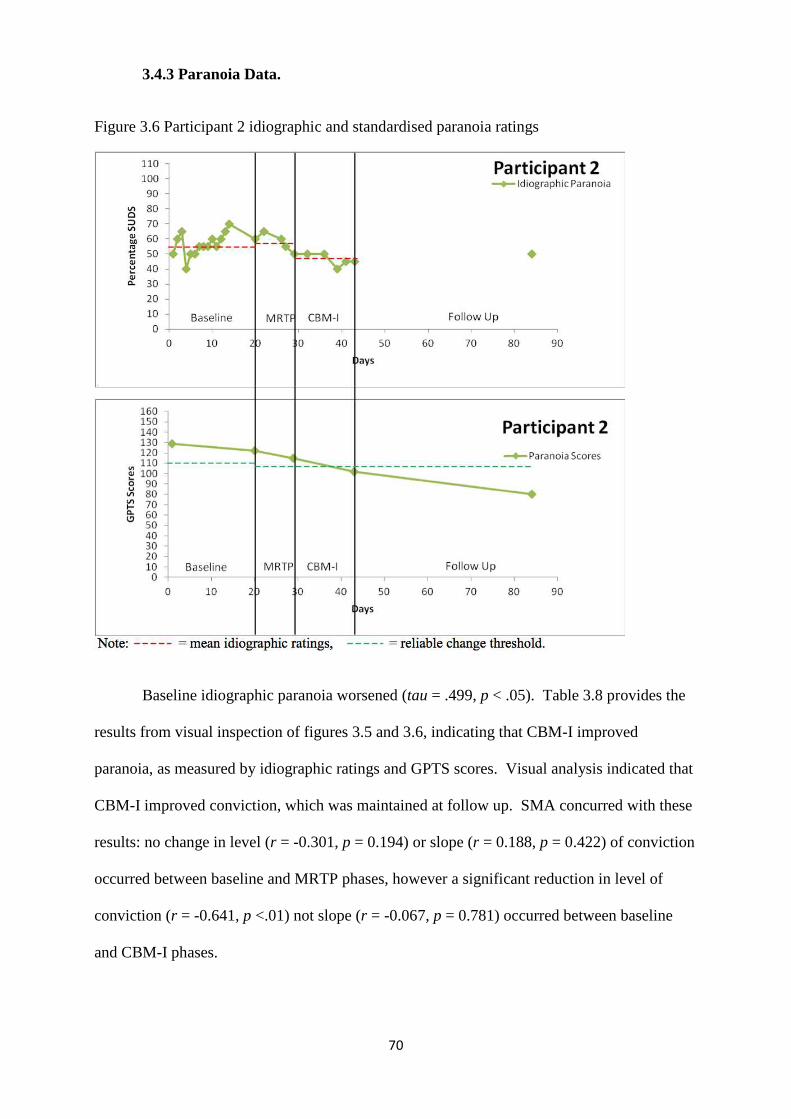
70
3.4.3 Paranoia Data.
Figure 3.6 Participant 2 idiographic and standardised paranoia ratings
Baseline idiographic paranoia worsened (tau = .499, p < .05). Table 3.8 provides the
results from visual inspection of figures 3.5 and 3.6, indicating that CBM-I improved
paranoia, as measured by idiographic ratings and GPTS scores. Visual analysis indicated that
CBM-I improved conviction, which was maintained at follow up. SMA concurred with these
results: no change in level (r = -0.301, p = 0.194) or slope (r = 0.188, p = 0.422) of conviction
occurred between baseline and MRTP phases, however a significant reduction in level of
conviction (r = -0.641, p <.01) not slope (r = -0.067, p = 0.781) occurred between baseline
and CBM-I phases.
71
Table 3.8
Results of visual inspection of paranoia and conviction data in figures 3.5 and 3.6
Paranoia Baseline MRTP CBM-I Follow Up
Mean Idiographic
Ratings 56 Stable Reduced
Shift in level Abrupt NC NC
Slope Accelerating Decelerating Stable
Latency of change between
phases 6 10 41
GPTS Clinical Reduction
N N N Y
GPTS Reliable Reduction
N N Y Y
Mean Conviction
Ratings 56 Reduced Reduced
Shift in level Abrupt NC Increased
Slope Stable Decreasing Stable
Latency of change between
phases 6 7 41
Note: NC – No Change, Latency of change between phases is expressed as number of days, N – No, Y – Yes.
3.4.4 Reasoning data.
Table 3.9
Standardised measures for participant 2
Measure B1 B2 MRTP CBM-I Follow Up 85:15 Beads
Task X X X X X
60:40 Beads Task
X X X X X
EoE 0 0 1 1 1 PBM Yes Yes Yes Yes Yes
RTHC 1 1 1 1 1 Note: X – not Jumping to Conclusions, EoE – Explanations of Experiences, PBM – Possibility of being mistaken, RTHC – Reaction to Hypothetical Contradiction; 1 – reduced delusional conviction.
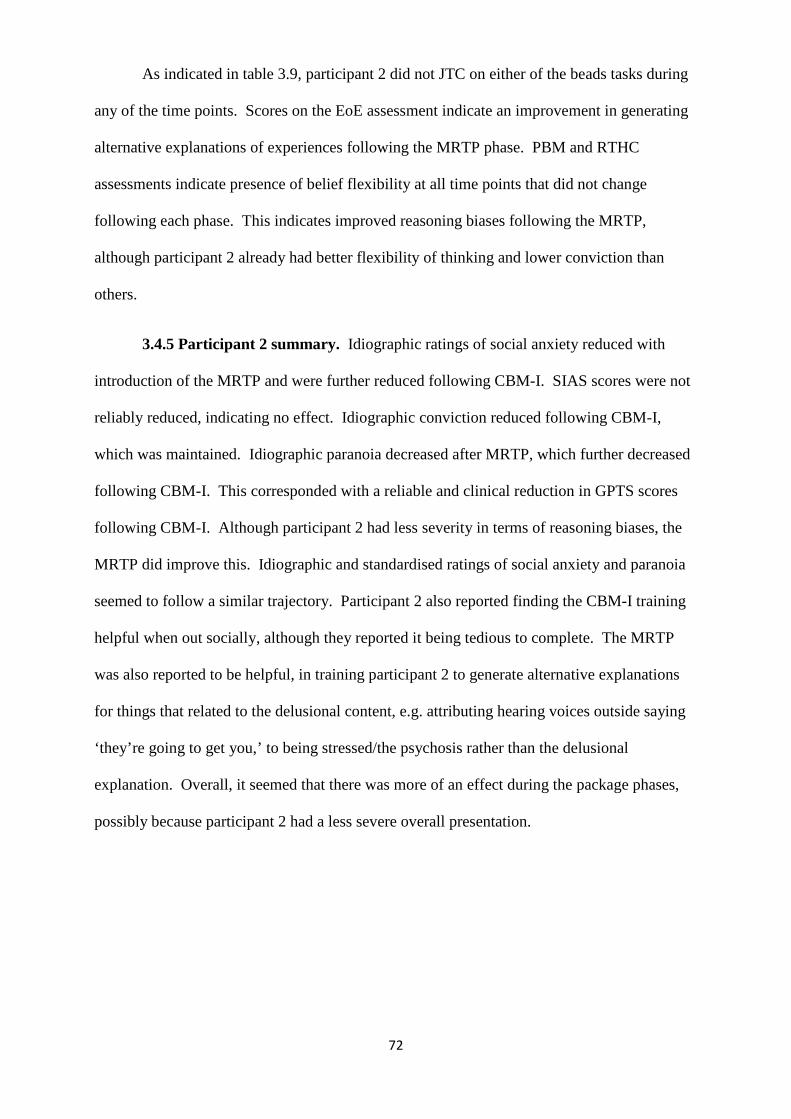
72
As indicated in table 3.9, participant 2 did not JTC on either of the beads tasks during
any of the time points. Scores on the EoE assessment indicate an improvement in generating
alternative explanations of experiences following the MRTP phase. PBM and RTHC
assessments indicate presence of belief flexibility at all time points that did not change
following each phase. This indicates improved reasoning biases following the MRTP,
although participant 2 already had better flexibility of thinking and lower conviction than
others.
3.4.5 Participant 2 summary. Idiographic ratings of social anxiety reduced with
introduction of the MRTP and were further reduced following CBM-I. SIAS scores were not
reliably reduced, indicating no effect. Idiographic conviction reduced following CBM-I,
which was maintained. Idiographic paranoia decreased after MRTP, which further decreased
following CBM-I. This corresponded with a reliable and clinical reduction in GPTS scores
following CBM-I. Although participant 2 had less severity in terms of reasoning biases, the
MRTP did improve this. Idiographic and standardised ratings of social anxiety and paranoia
seemed to follow a similar trajectory. Participant 2 also reported finding the CBM-I training
helpful when out socially, although they reported it being tedious to complete. The MRTP
was also reported to be helpful, in training participant 2 to generate alternative explanations
for things that related to the delusional content, e.g. attributing hearing voices outside saying
‘they’re going to get you,’ to being stressed/the psychosis rather than the delusional
explanation. Overall, it seemed that there was more of an effect during the package phases,
possibly because participant 2 had a less severe overall presentation.
73
3.5 Participant 3
Participant 3 is a 31 year old male, with 16 years duration of difficulties, recruited
from Recovery Services.
3.5.1 Social anxiety data.
Figure 3.7 Participant 3 idiographic and standardised social anxiety scores
Baseline idiographic social anxiety was unstable yet not significantly increasing or
decreasing (tau = -.103, p = .649). Table 3.10 provides the results from visual inspection of
figure 3.7, indicating no effect on social anxiety.
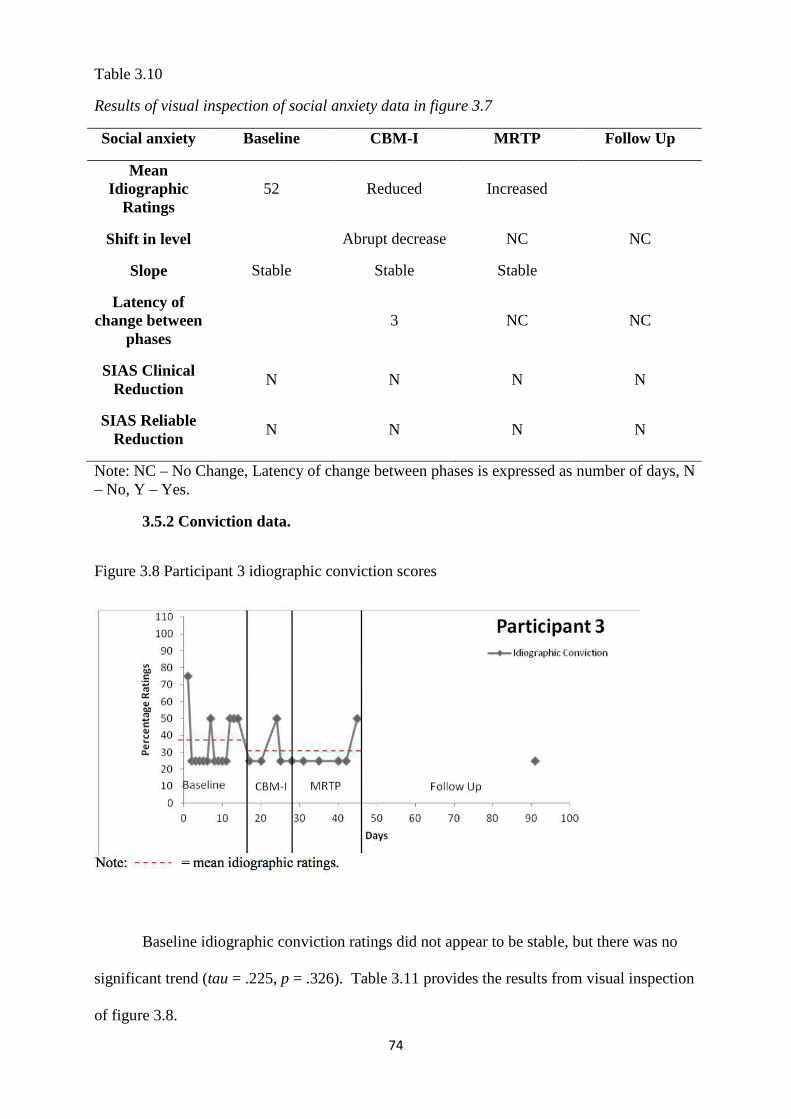
74
Table 3.10
Results of visual inspection of social anxiety data in figure 3.7
Social anxiety Baseline CBM-I MRTP Follow Up
Mean Idiographic
Ratings 52 Reduced Increased
Shift in level Abrupt decrease NC NC
Slope Stable Stable Stable
Latency of change between
phases 3 NC NC
SIAS Clinical Reduction
N N N N
SIAS Reliable Reduction
N N N N
Note: NC – No Change, Latency of change between phases is expressed as number of days, N – No, Y – Yes.
3.5.2 Conviction data.
Figure 3.8 Participant 3 idiographic conviction scores
Baseline idiographic conviction ratings did not appear to be stable, but there was no
significant trend (tau = .225, p = .326). Table 3.11 provides the results from visual inspection
of figure 3.8.
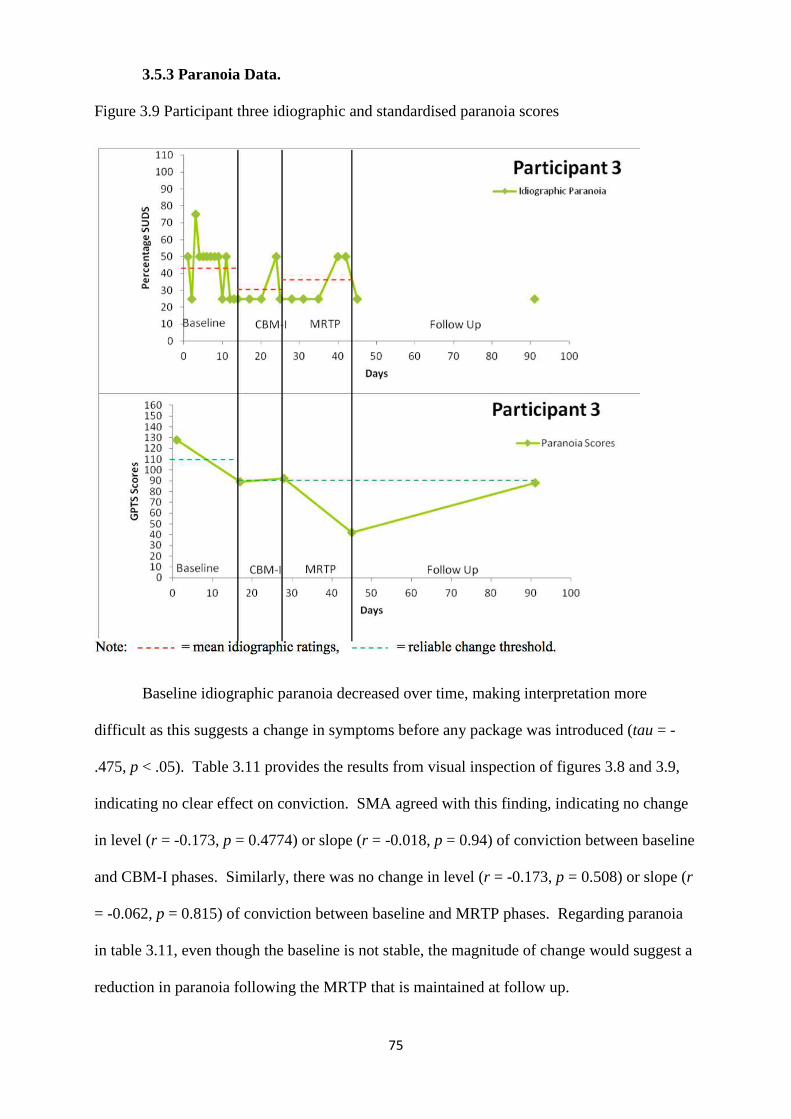
75
3.5.3 Paranoia Data.
Figure 3.9 Participant three idiographic and standardised paranoia scores
Baseline idiographic paranoia decreased over time, making interpretation more
difficult as this suggests a change in symptoms before any package was introduced (tau = -
.475, p < .05). Table 3.11 provides the results from visual inspection of figures 3.8 and 3.9,
indicating no clear effect on conviction. SMA agreed with this finding, indicating no change
in level (r = -0.173, p = 0.4774) or slope (r = -0.018, p = 0.94) of conviction between baseline
and CBM-I phases. Similarly, there was no change in level (r = -0.173, p = 0.508) or slope (r
= -0.062, p = 0.815) of conviction between baseline and MRTP phases. Regarding paranoia
in table 3.11, even though the baseline is not stable, the magnitude of change would suggest a
reduction in paranoia following the MRTP that is maintained at follow up.
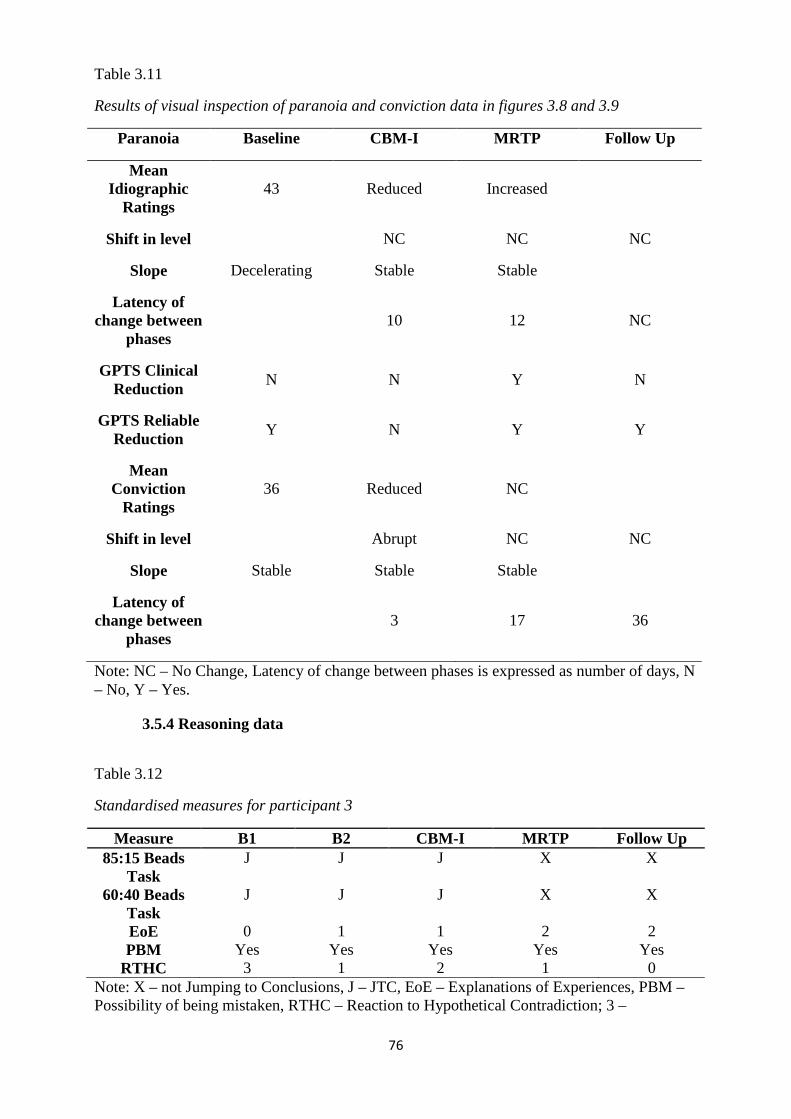
76
Table 3.11
Results of visual inspection of paranoia and conviction data in figures 3.8 and 3.9
Paranoia Baseline CBM-I MRTP Follow Up
Mean Idiographic
Ratings 43 Reduced Increased
Shift in level NC NC NC
Slope Decelerating Stable Stable
Latency of change between
phases 10 12 NC
GPTS Clinical Reduction
N N Y N
GPTS Reliable Reduction
Y N Y Y
Mean Conviction
Ratings 36 Reduced NC
Shift in level Abrupt NC NC
Slope Stable Stable Stable
Latency of change between
phases 3 17 36
Note: NC – No Change, Latency of change between phases is expressed as number of days, N – No, Y – Yes.
3.5.4 Reasoning data
Table 3.12
Standardised measures for participant 3
Measure B1 B2 CBM-I MRTP Follow Up 85:15 Beads
Task J J J X X
60:40 Beads Task
J J J X X
EoE 0 1 1 2 2 PBM Yes Yes Yes Yes Yes
RTHC 3 1 2 1 0 Note: X – not Jumping to Conclusions, J – JTC, EoE – Explanations of Experiences, PBM – Possibility of being mistaken, RTHC – Reaction to Hypothetical Contradiction; 3 –
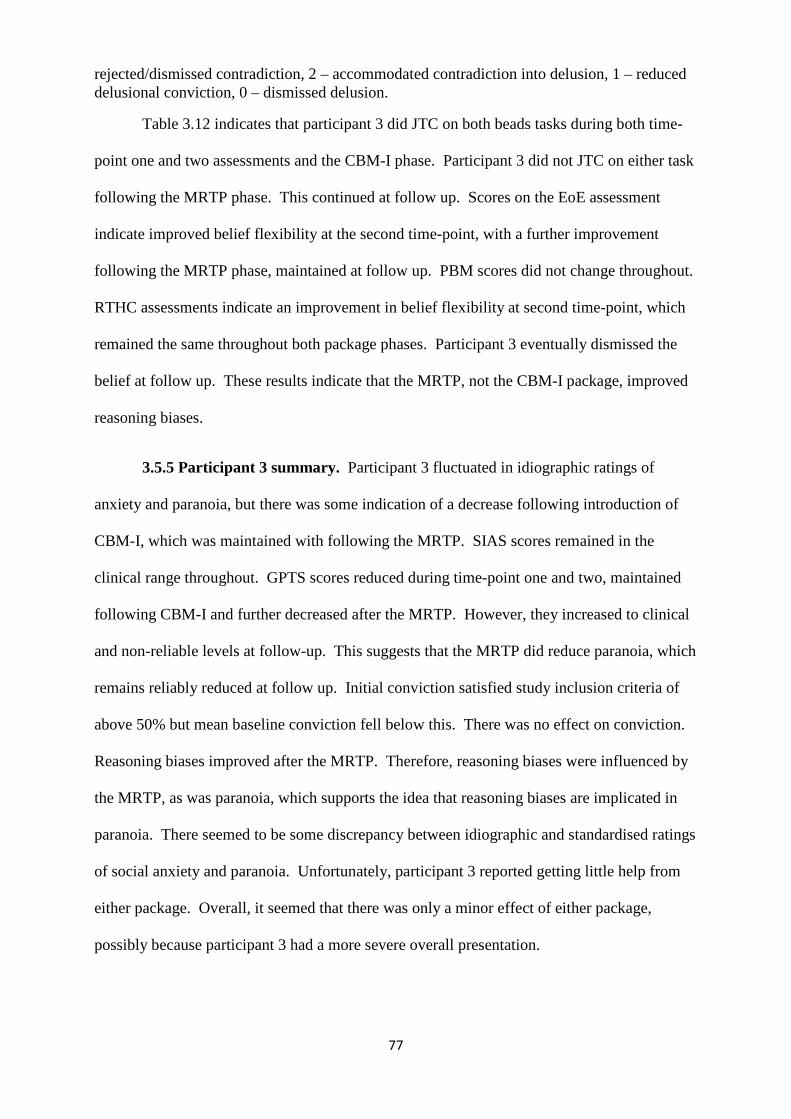
77
rejected/dismissed contradiction, 2 – accommodated contradiction into delusion, 1 – reduced delusional conviction, 0 – dismissed delusion.
Table 3.12 indicates that participant 3 did JTC on both beads tasks during both time-
point one and two assessments and the CBM-I phase. Participant 3 did not JTC on either task
following the MRTP phase. This continued at follow up. Scores on the EoE assessment
indicate improved belief flexibility at the second time-point, with a further improvement
following the MRTP phase, maintained at follow up. PBM scores did not change throughout.
RTHC assessments indicate an improvement in belief flexibility at second time-point, which
remained the same throughout both package phases. Participant 3 eventually dismissed the
belief at follow up. These results indicate that the MRTP, not the CBM-I package, improved
reasoning biases.
3.5.5 Participant 3 summary. Participant 3 fluctuated in idiographic ratings of
anxiety and paranoia, but there was some indication of a decrease following introduction of
CBM-I, which was maintained with following the MRTP. SIAS scores remained in the
clinical range throughout. GPTS scores reduced during time-point one and two, maintained
following CBM-I and further decreased after the MRTP. However, they increased to clinical
and non-reliable levels at follow-up. This suggests that the MRTP did reduce paranoia, which
remains reliably reduced at follow up. Initial conviction satisfied study inclusion criteria of
above 50% but mean baseline conviction fell below this. There was no effect on conviction.
Reasoning biases improved after the MRTP. Therefore, reasoning biases were influenced by
the MRTP, as was paranoia, which supports the idea that reasoning biases are implicated in
paranoia. There seemed to be some discrepancy between idiographic and standardised ratings
of social anxiety and paranoia. Unfortunately, participant 3 reported getting little help from
either package. Overall, it seemed that there was only a minor effect of either package,
possibly because participant 3 had a more severe overall presentation.
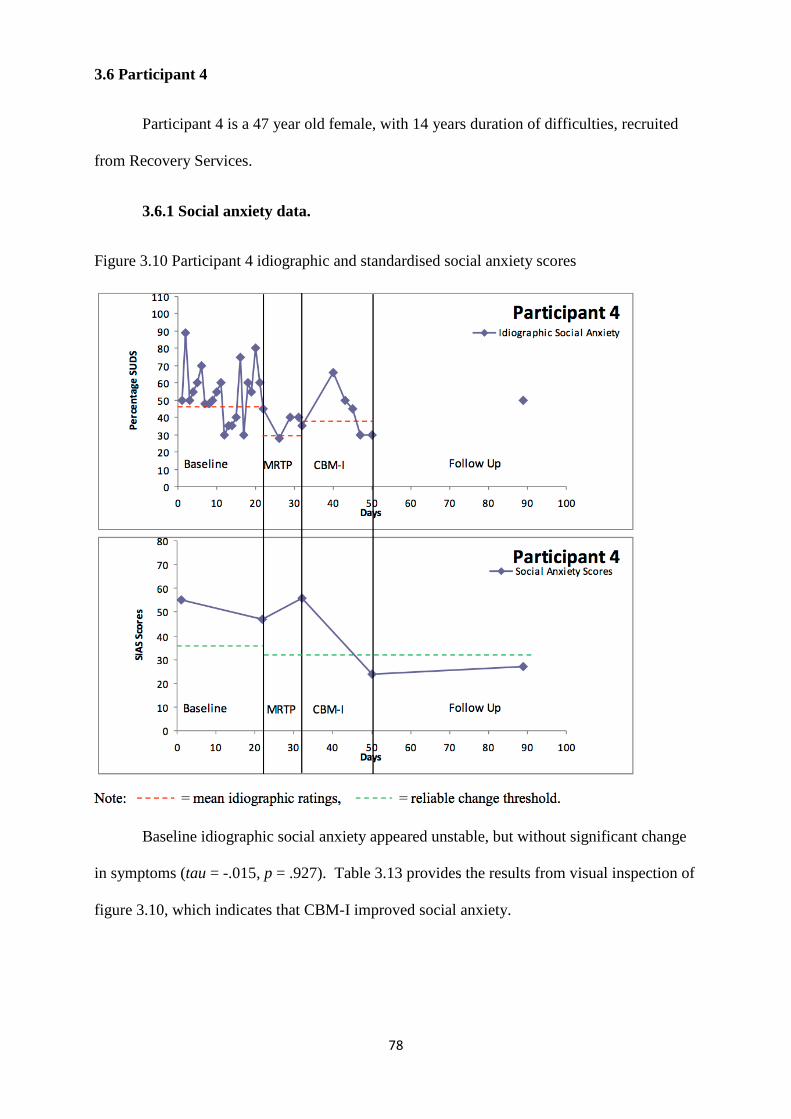
78
3.6 Participant 4
Participant 4 is a 47 year old female, with 14 years duration of difficulties, recruited
from Recovery Services.
3.6.1 Social anxiety data.
Figure 3.10 Participant 4 idiographic and standardised social anxiety scores
Baseline idiographic social anxiety appeared unstable, but without significant change
in symptoms (tau = -.015, p = .927). Table 3.13 provides the results from visual inspection of
figure 3.10, which indicates that CBM-I improved social anxiety.
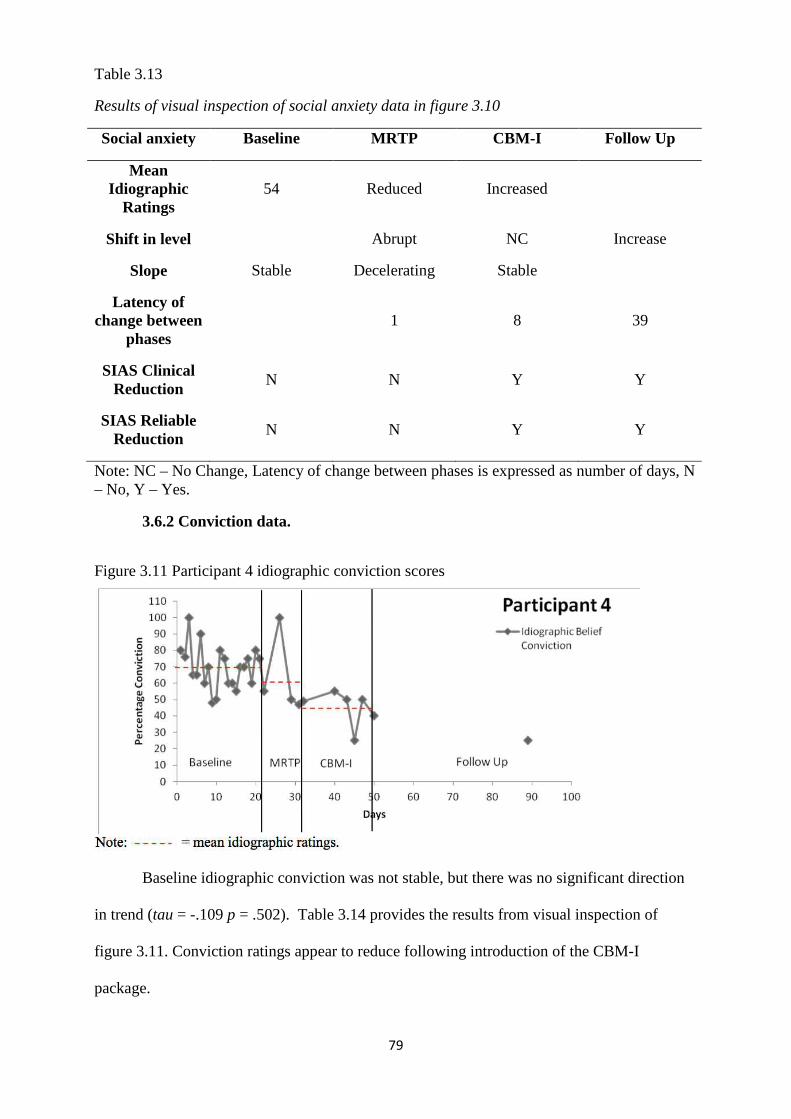
79
Table 3.13
Results of visual inspection of social anxiety data in figure 3.10
Social anxiety Baseline MRTP CBM-I Follow Up
Mean Idiographic
Ratings 54 Reduced Increased
Shift in level Abrupt NC Increase
Slope Stable Decelerating Stable
Latency of change between
phases 1 8 39
SIAS Clinical Reduction
N N Y Y
SIAS Reliable Reduction
N N Y Y
Note: NC – No Change, Latency of change between phases is expressed as number of days, N – No, Y – Yes.
3.6.2 Conviction data.
Figure 3.11 Participant 4 idiographic conviction scores
Baseline idiographic conviction was not stable, but there was no significant direction
in trend (tau = -.109 p = .502). Table 3.14 provides the results from visual inspection of
figure 3.11. Conviction ratings appear to reduce following introduction of the CBM-I
package.
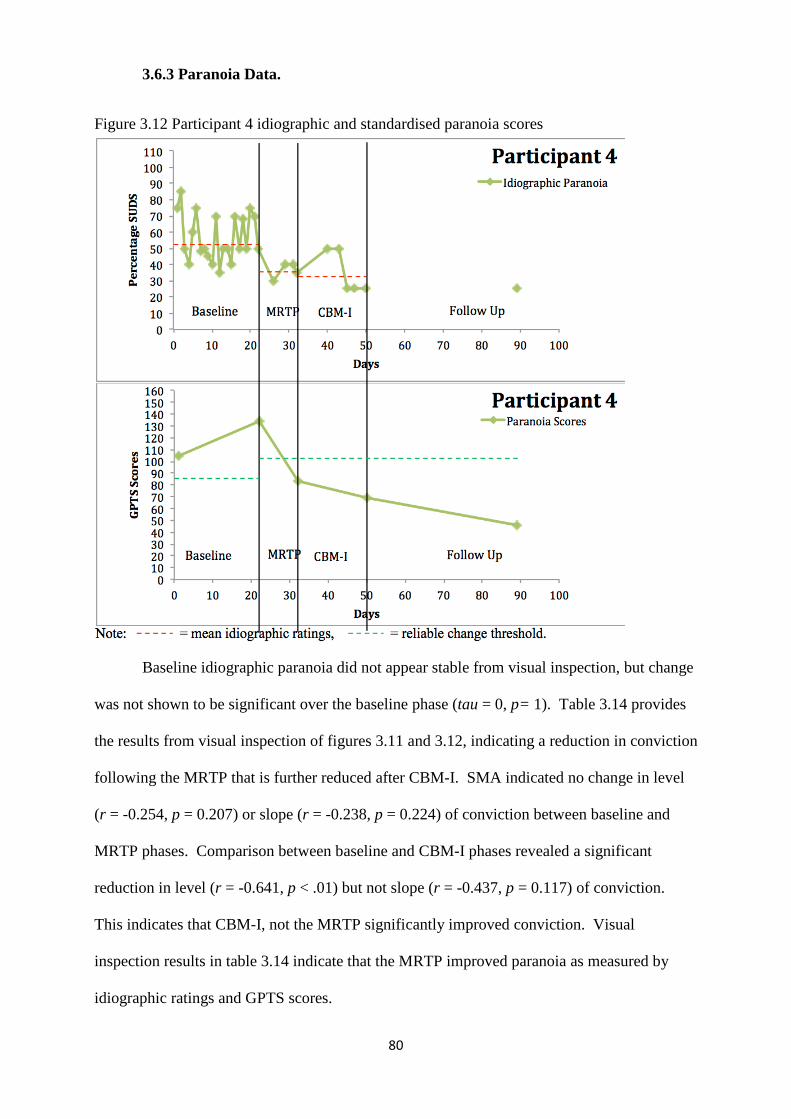
80
3.6.3 Paranoia Data.
Figure 3.12 Participant 4 idiographic and standardised paranoia scores
Baseline idiographic paranoia did not appear stable from visual inspection, but change
was not shown to be significant over the baseline phase (tau = 0, p= 1). Table 3.14 provides
the results from visual inspection of figures 3.11 and 3.12, indicating a reduction in conviction
following the MRTP that is further reduced after CBM-I. SMA indicated no change in level
(r = -0.254, p = 0.207) or slope (r = -0.238, p = 0.224) of conviction between baseline and
MRTP phases. Comparison between baseline and CBM-I phases revealed a significant
reduction in level (r = -0.641, p < .01) but not slope (r = -0.437, p = 0.117) of conviction.
This indicates that CBM-I, not the MRTP significantly improved conviction. Visual
inspection results in table 3.14 indicate that the MRTP improved paranoia as measured by
idiographic ratings and GPTS scores.
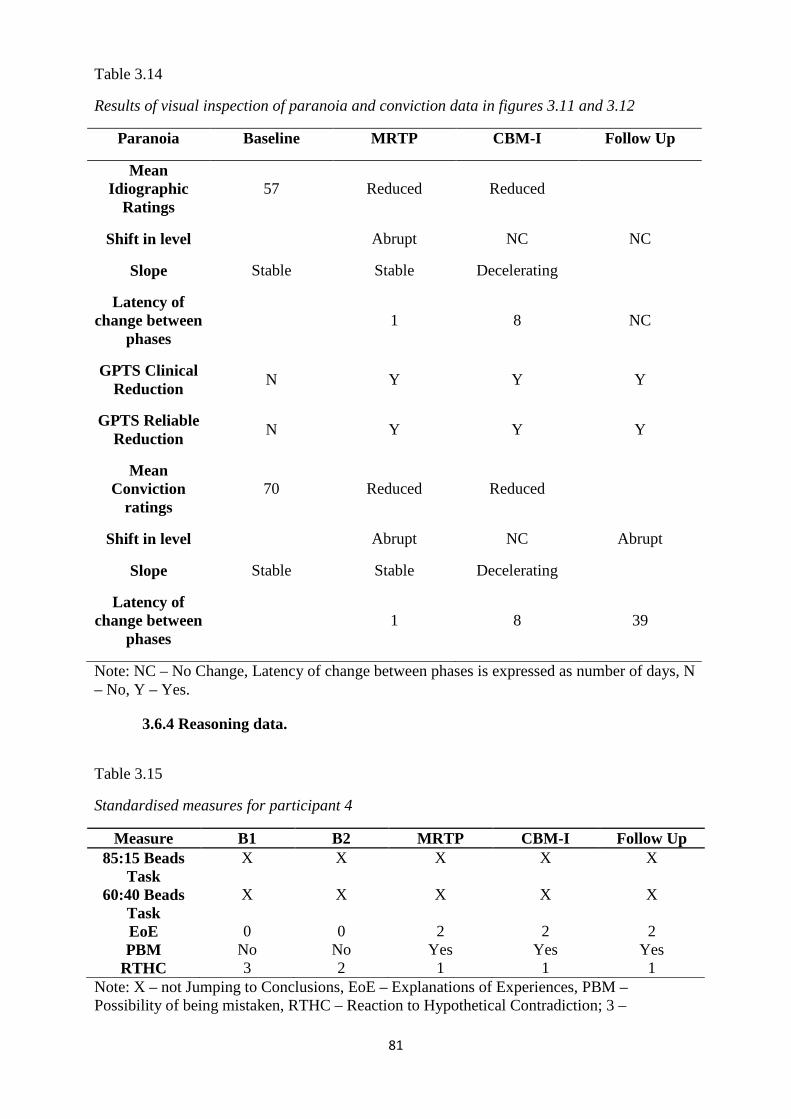
81
Table 3.14
Results of visual inspection of paranoia and conviction data in figures 3.11 and 3.12
Paranoia Baseline MRTP CBM-I Follow Up
Mean Idiographic
Ratings 57 Reduced Reduced
Shift in level Abrupt NC NC
Slope Stable Stable Decelerating
Latency of change between
phases 1 8 NC
GPTS Clinical Reduction
N Y Y Y
GPTS Reliable Reduction
N Y Y Y
Mean Conviction
ratings 70 Reduced Reduced
Shift in level Abrupt NC Abrupt
Slope Stable Stable Decelerating
Latency of change between
phases 1 8 39
Note: NC – No Change, Latency of change between phases is expressed as number of days, N – No, Y – Yes.
3.6.4 Reasoning data.
Table 3.15
Standardised measures for participant 4
Measure B1 B2 MRTP CBM-I Follow Up 85:15 Beads
Task X X X X X
60:40 Beads Task
X X X X X
EoE 0 0 2 2 2 PBM No No Yes Yes Yes
RTHC 3 2 1 1 1 Note: X – not Jumping to Conclusions, EoE – Explanations of Experiences, PBM – Possibility of being mistaken, RTHC – Reaction to Hypothetical Contradiction; 3 –
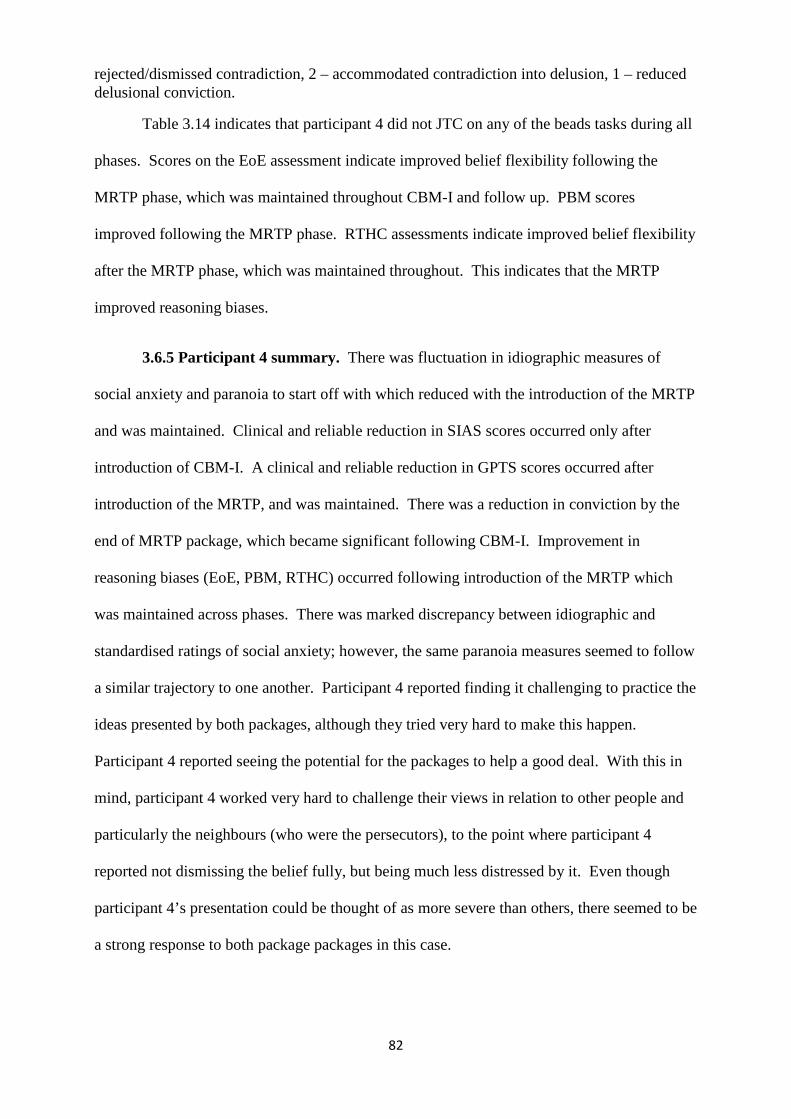
82
rejected/dismissed contradiction, 2 – accommodated contradiction into delusion, 1 – reduced delusional conviction.
Table 3.14 indicates that participant 4 did not JTC on any of the beads tasks during all
phases. Scores on the EoE assessment indicate improved belief flexibility following the
MRTP phase, which was maintained throughout CBM-I and follow up. PBM scores
improved following the MRTP phase. RTHC assessments indicate improved belief flexibility
after the MRTP phase, which was maintained throughout. This indicates that the MRTP
improved reasoning biases.
3.6.5 Participant 4 summary. There was fluctuation in idiographic measures of
social anxiety and paranoia to start off with which reduced with the introduction of the MRTP
and was maintained. Clinical and reliable reduction in SIAS scores occurred only after
introduction of CBM-I. A clinical and reliable reduction in GPTS scores occurred after
introduction of the MRTP, and was maintained. There was a reduction in conviction by the
end of MRTP package, which became significant following CBM-I. Improvement in
reasoning biases (EoE, PBM, RTHC) occurred following introduction of the MRTP which
was maintained across phases. There was marked discrepancy between idiographic and
standardised ratings of social anxiety; however, the same paranoia measures seemed to follow
a similar trajectory to one another. Participant 4 reported finding it challenging to practice the
ideas presented by both packages, although they tried very hard to make this happen.
Participant 4 reported seeing the potential for the packages to help a good deal. With this in
mind, participant 4 worked very hard to challenge their views in relation to other people and
particularly the neighbours (who were the persecutors), to the point where participant 4
reported not dismissing the belief fully, but being much less distressed by it. Even though
participant 4’s presentation could be thought of as more severe than others, there seemed to be
a strong response to both package packages in this case.
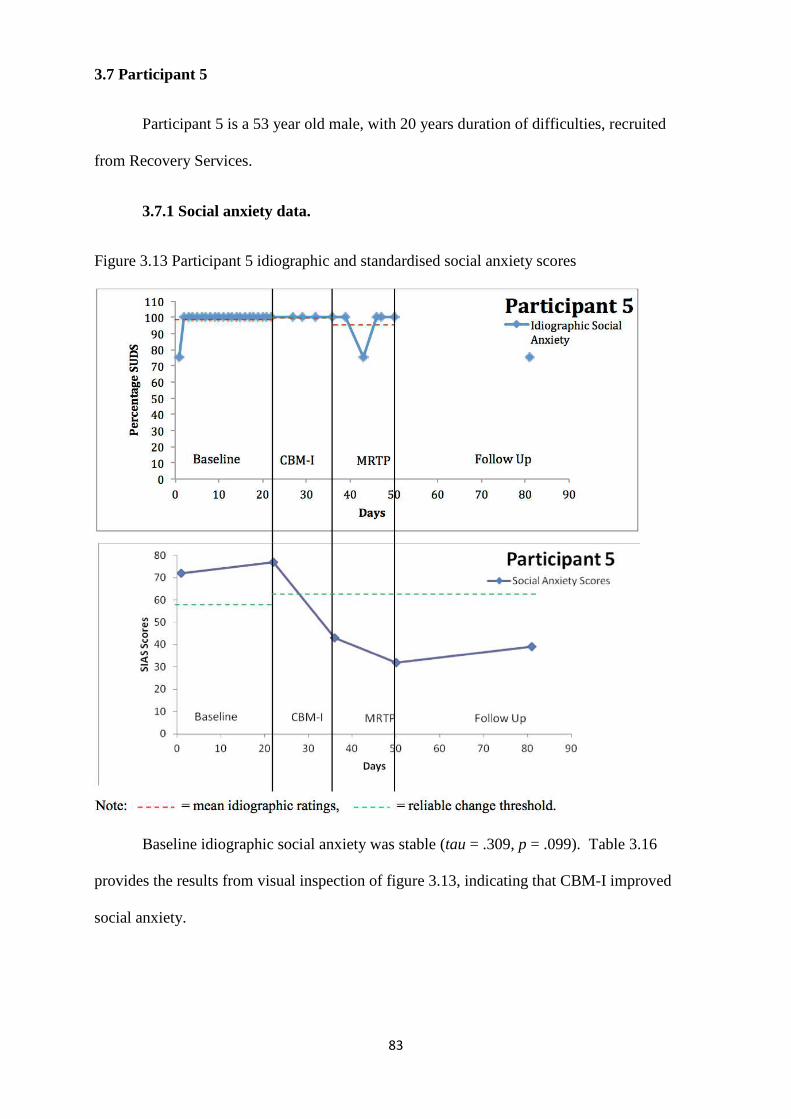
83
3.7 Participant 5
Participant 5 is a 53 year old male, with 20 years duration of difficulties, recruited
from Recovery Services.
3.7.1 Social anxiety data.
Figure 3.13 Participant 5 idiographic and standardised social anxiety scores
Baseline idiographic social anxiety was stable (tau = .309, p = .099). Table 3.16
provides the results from visual inspection of figure 3.13, indicating that CBM-I improved
social anxiety.
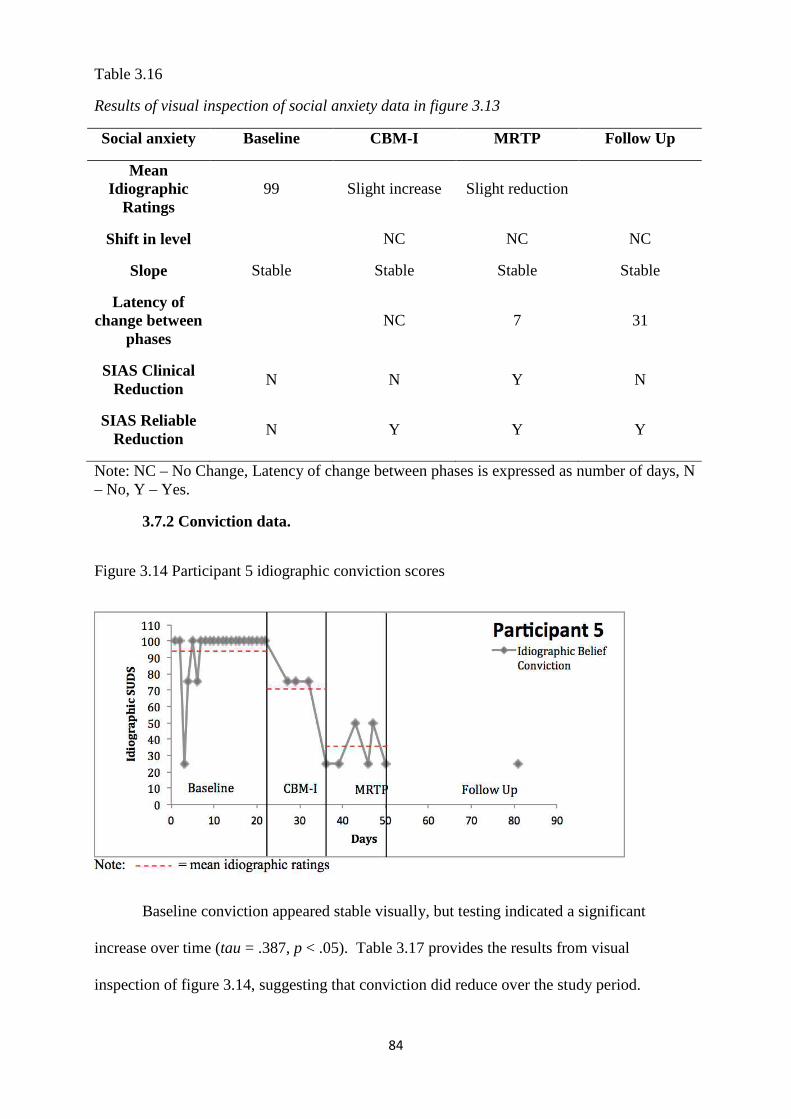
84
Table 3.16
Results of visual inspection of social anxiety data in figure 3.13
Social anxiety Baseline CBM-I MRTP Follow Up
Mean Idiographic
Ratings 99 Slight increase Slight reduction
Shift in level NC NC NC
Slope Stable Stable Stable Stable
Latency of change between
phases NC 7 31
SIAS Clinical Reduction
N N Y N
SIAS Reliable Reduction
N Y Y Y
Note: NC – No Change, Latency of change between phases is expressed as number of days, N – No, Y – Yes.
3.7.2 Conviction data.
Figure 3.14 Participant 5 idiographic conviction scores
Baseline conviction appeared stable visually, but testing indicated a significant
increase over time (tau = .387, p < .05). Table 3.17 provides the results from visual
inspection of figure 3.14, suggesting that conviction did reduce over the study period.
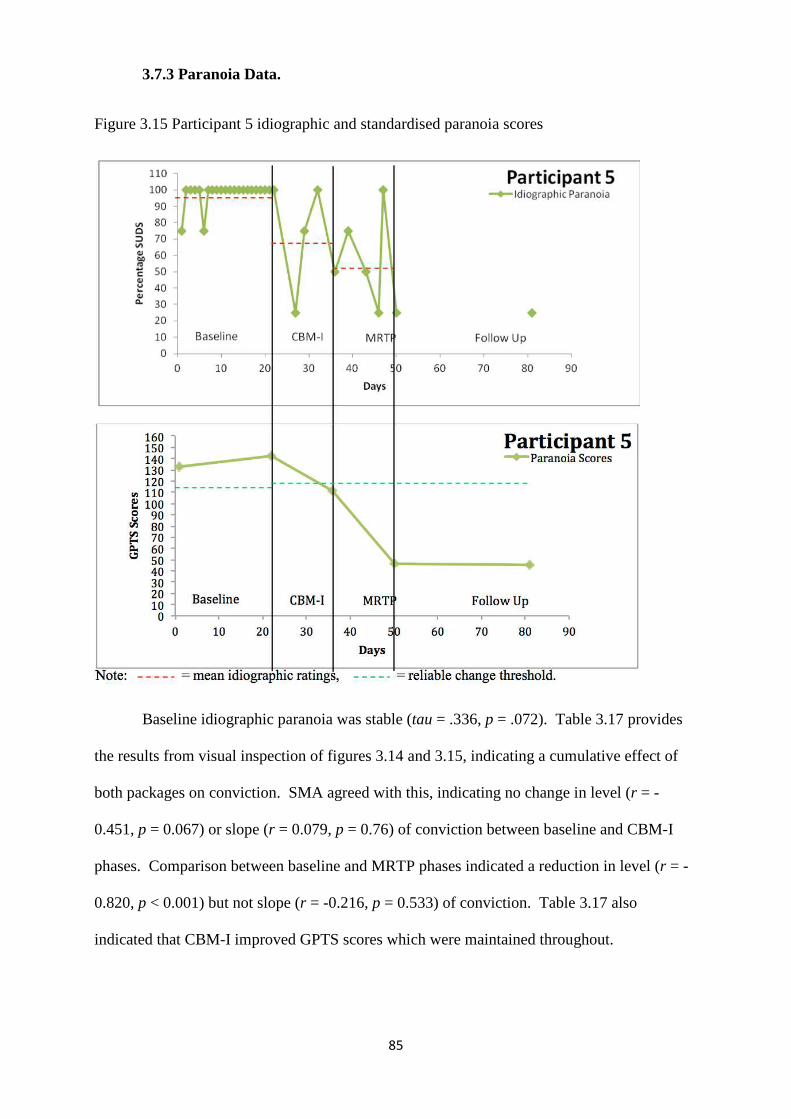
85
3.7.3 Paranoia Data.
Figure 3.15 Participant 5 idiographic and standardised paranoia scores
Baseline idiographic paranoia was stable (tau = .336, p = .072). Table 3.17 provides
the results from visual inspection of figures 3.14 and 3.15, indicating a cumulative effect of
both packages on conviction. SMA agreed with this, indicating no change in level (r = -
0.451, p = 0.067) or slope (r = 0.079, p = 0.76) of conviction between baseline and CBM-I
phases. Comparison between baseline and MRTP phases indicated a reduction in level (r = -
0.820, p < 0.001) but not slope (r = -0.216, p = 0.533) of conviction. Table 3.17 also
indicated that CBM-I improved GPTS scores which were maintained throughout.

86
Table 3.17
Results of visual inspection of paranoia and conviction data in figures 3.14 and 3.15
Paranoia Baseline CBM-I MRTP Follow Up
Mean Idiographic
Ratings 98 Reduced Reduced
Shift in level NC Abrupt Increase NC
Slope Stable Unstable Unstable
Latency of change between
phases 6 3 NC
GPTS Clinical Reduction
N N Y Y
GPTS Reliable Reduction
N Y Y Y
Mean Conviction
Ratings 94 Reduced Reduced
Shift in level NC NC NC
Slope Accelerating Decelerating Stable
Latency of change between
phases 6 7 NC
Note: NC – No Change, Latency of change between phases is expressed as number of days, N – No, Y – Yes.
3.7.4 Reasoning data
Table 3.18
Standardised measures for participant 5
Measure B1 B2 CBM-I MRTP Follow Up 85:15 Beads
Task X X X X X
60:40 Beads Task
J X X X X
EoE 0 0 0 1 1 PBM Yes Yes Yes Yes Yes
RTHC 1 1 1 0 0 Note: X – not Jumping to Conclusions, J – JTC, EoE – Explanations of Experiences, PBM – Possibility of being mistaken, RTHC – Reaction to Hypothetical Contradiction; 1 – reduced delusional conviction, 0 – dismissed delusion.
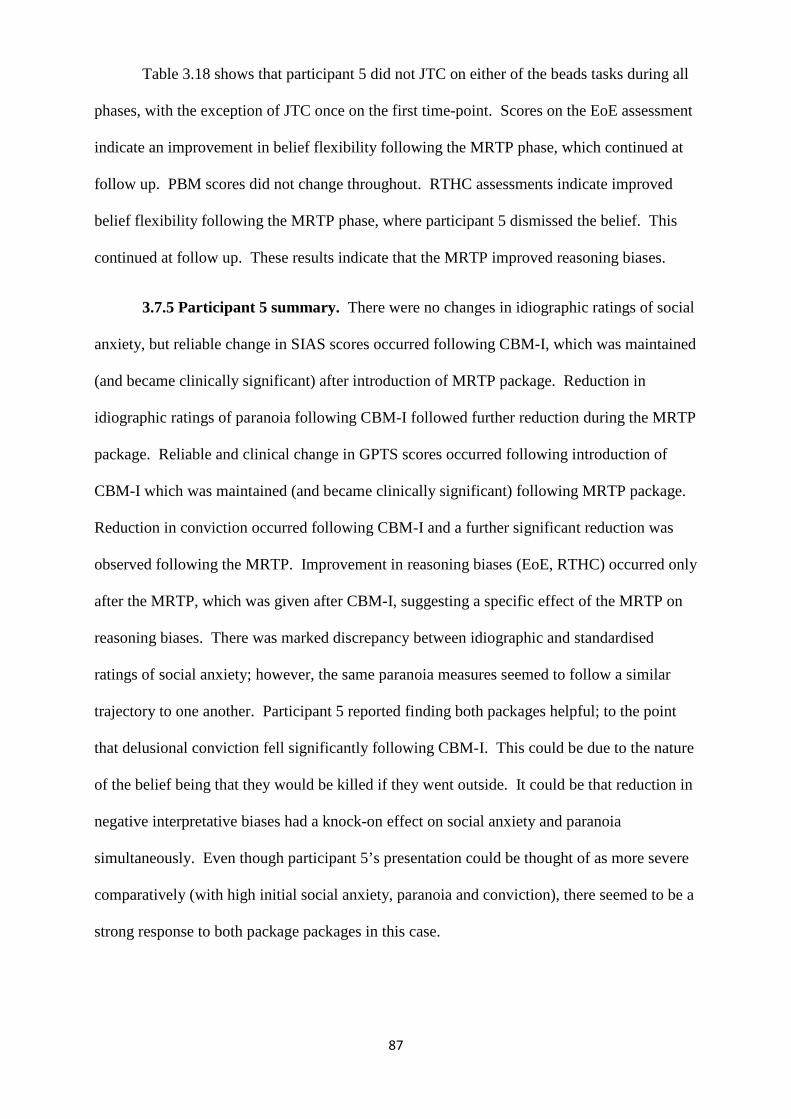
87
Table 3.18 shows that participant 5 did not JTC on either of the beads tasks during all
phases, with the exception of JTC once on the first time-point. Scores on the EoE assessment
indicate an improvement in belief flexibility following the MRTP phase, which continued at
follow up. PBM scores did not change throughout. RTHC assessments indicate improved
belief flexibility following the MRTP phase, where participant 5 dismissed the belief. This
continued at follow up. These results indicate that the MRTP improved reasoning biases.
3.7.5 Participant 5 summary. There were no changes in idiographic ratings of social
anxiety, but reliable change in SIAS scores occurred following CBM-I, which was maintained
(and became clinically significant) after introduction of MRTP package. Reduction in
idiographic ratings of paranoia following CBM-I followed further reduction during the MRTP
package. Reliable and clinical change in GPTS scores occurred following introduction of
CBM-I which was maintained (and became clinically significant) following MRTP package.
Reduction in conviction occurred following CBM-I and a further significant reduction was
observed following the MRTP. Improvement in reasoning biases (EoE, RTHC) occurred only
after the MRTP, which was given after CBM-I, suggesting a specific effect of the MRTP on
reasoning biases. There was marked discrepancy between idiographic and standardised
ratings of social anxiety; however, the same paranoia measures seemed to follow a similar
trajectory to one another. Participant 5 reported finding both packages helpful; to the point
that delusional conviction fell significantly following CBM-I. This could be due to the nature
of the belief being that they would be killed if they went outside. It could be that reduction in
negative interpretative biases had a knock-on effect on social anxiety and paranoia
simultaneously. Even though participant 5’s presentation could be thought of as more severe
comparatively (with high initial social anxiety, paranoia and conviction), there seemed to be a
strong response to both package packages in this case.
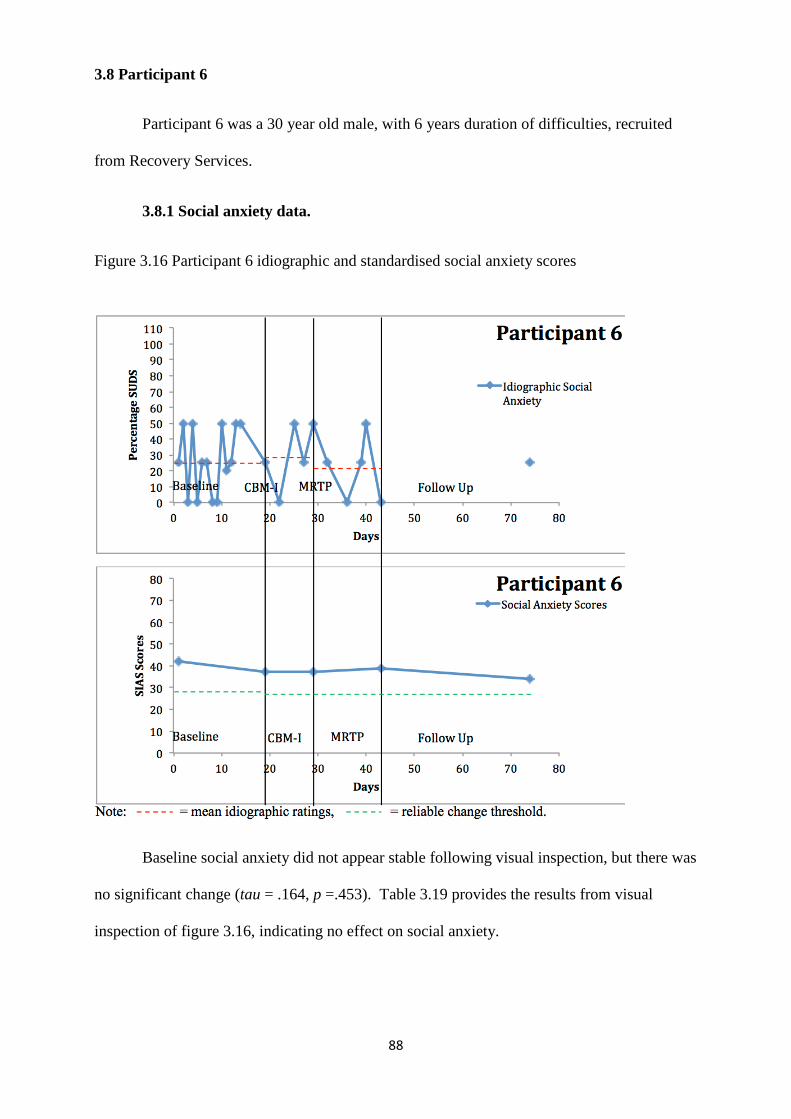
88
3.8 Participant 6
Participant 6 was a 30 year old male, with 6 years duration of difficulties, recruited
from Recovery Services.
3.8.1 Social anxiety data.
Figure 3.16 Participant 6 idiographic and standardised social anxiety scores
Baseline social anxiety did not appear stable following visual inspection, but there was
no significant change (tau = .164, p =.453). Table 3.19 provides the results from visual
inspection of figure 3.16, indicating no effect on social anxiety.
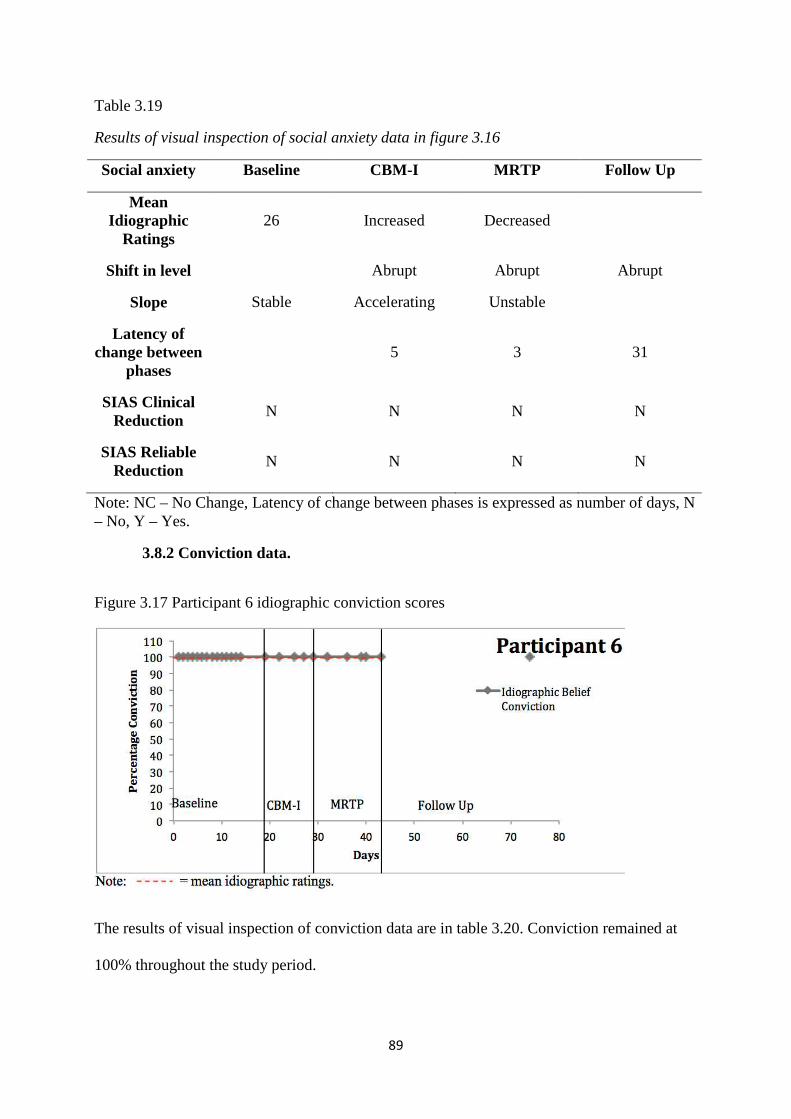
89
Table 3.19
Results of visual inspection of social anxiety data in figure 3.16
Social anxiety Baseline CBM-I MRTP Follow Up
Mean Idiographic
Ratings 26 Increased Decreased
Shift in level Abrupt Abrupt Abrupt
Slope Stable Accelerating Unstable
Latency of change between
phases 5 3 31
SIAS Clinical Reduction
N N N N
SIAS Reliable Reduction
N N N N
Note: NC – No Change, Latency of change between phases is expressed as number of days, N – No, Y – Yes.
3.8.2 Conviction data.
Figure 3.17 Participant 6 idiographic conviction scores
The results of visual inspection of conviction data are in table 3.20. Conviction remained at
100% throughout the study period.
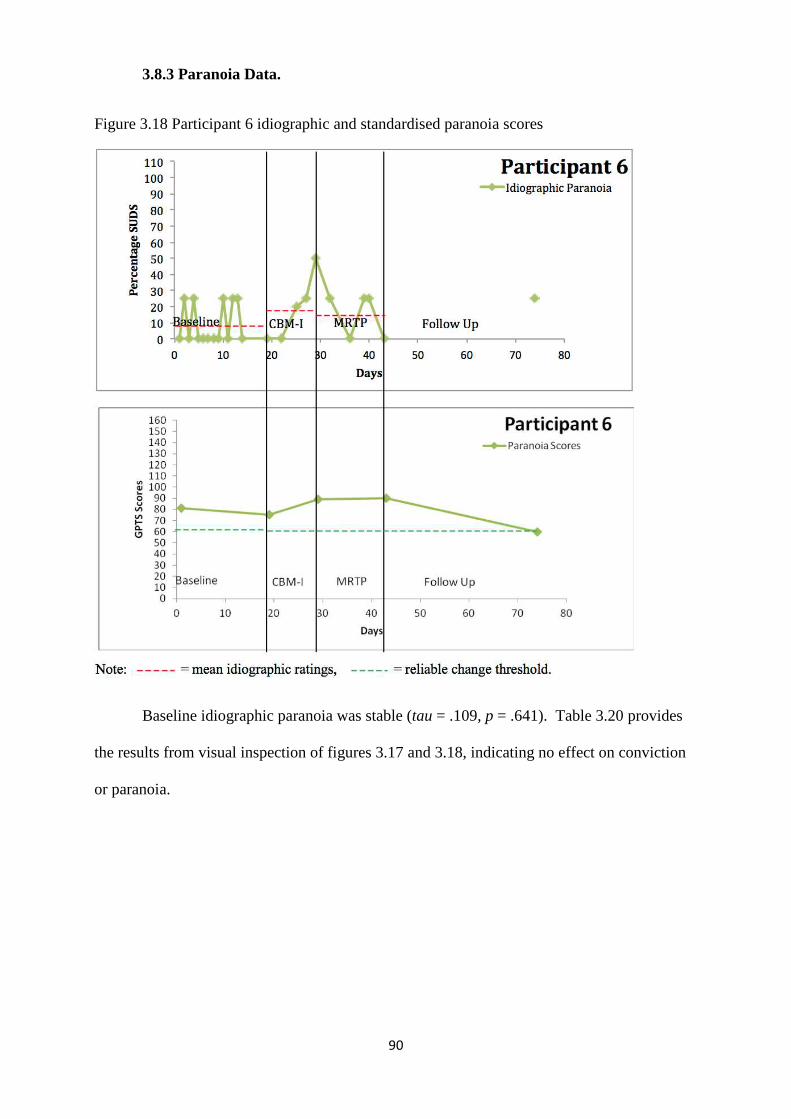
90
3.8.3 Paranoia Data.
Figure 3.18 Participant 6 idiographic and standardised paranoia scores
Baseline idiographic paranoia was stable (tau = .109, p = .641). Table 3.20 provides
the results from visual inspection of figures 3.17 and 3.18, indicating no effect on conviction
or paranoia.
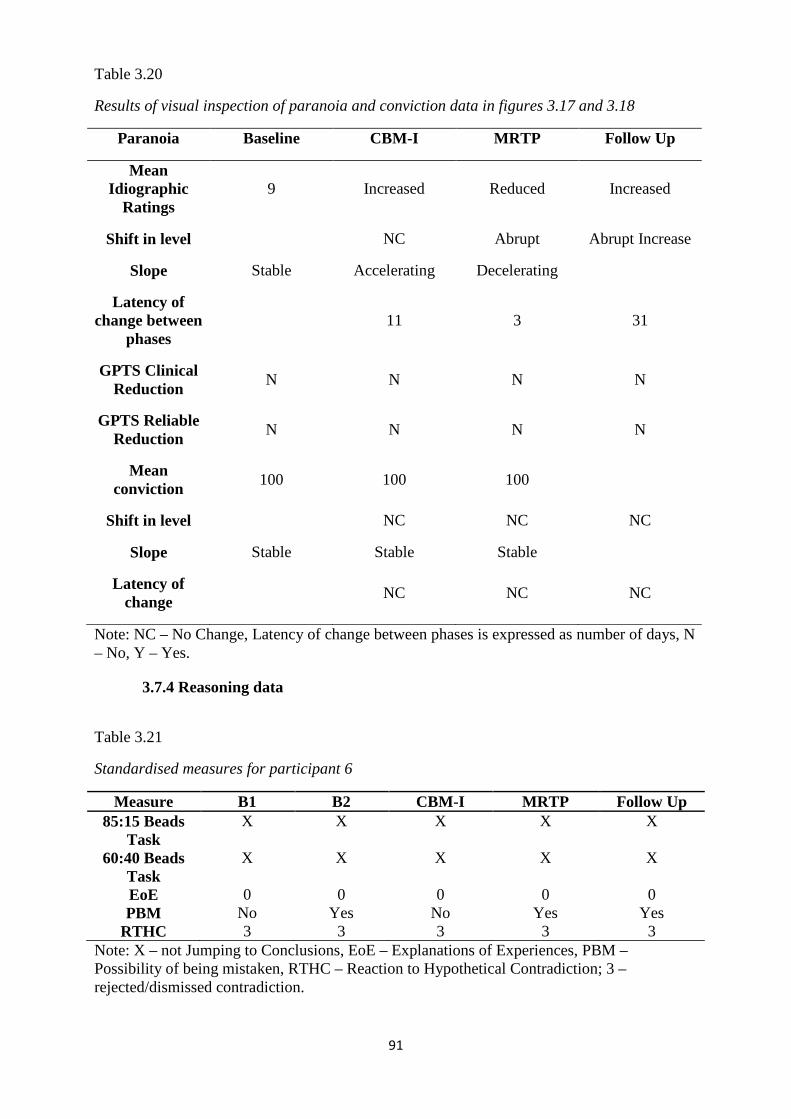
91
Table 3.20
Results of visual inspection of paranoia and conviction data in figures 3.17 and 3.18
Paranoia Baseline CBM-I MRTP Follow Up
Mean Idiographic
Ratings 9 Increased Reduced Increased
Shift in level NC Abrupt Abrupt Increase
Slope Stable Accelerating Decelerating
Latency of change between
phases 11 3 31
GPTS Clinical Reduction
N N N N
GPTS Reliable Reduction
N N N N
Mean conviction
100 100 100
Shift in level NC NC NC
Slope Stable Stable Stable
Latency of change
NC NC NC
Note: NC – No Change, Latency of change between phases is expressed as number of days, N – No, Y – Yes.
3.7.4 Reasoning data
Table 3.21
Standardised measures for participant 6
Measure B1 B2 CBM-I MRTP Follow Up 85:15 Beads
Task X X X X X
60:40 Beads Task
X X X X X
EoE 0 0 0 0 0 PBM No Yes No Yes Yes
RTHC 3 3 3 3 3 Note: X – not Jumping to Conclusions, EoE – Explanations of Experiences, PBM – Possibility of being mistaken, RTHC – Reaction to Hypothetical Contradiction; 3 – rejected/dismissed contradiction.
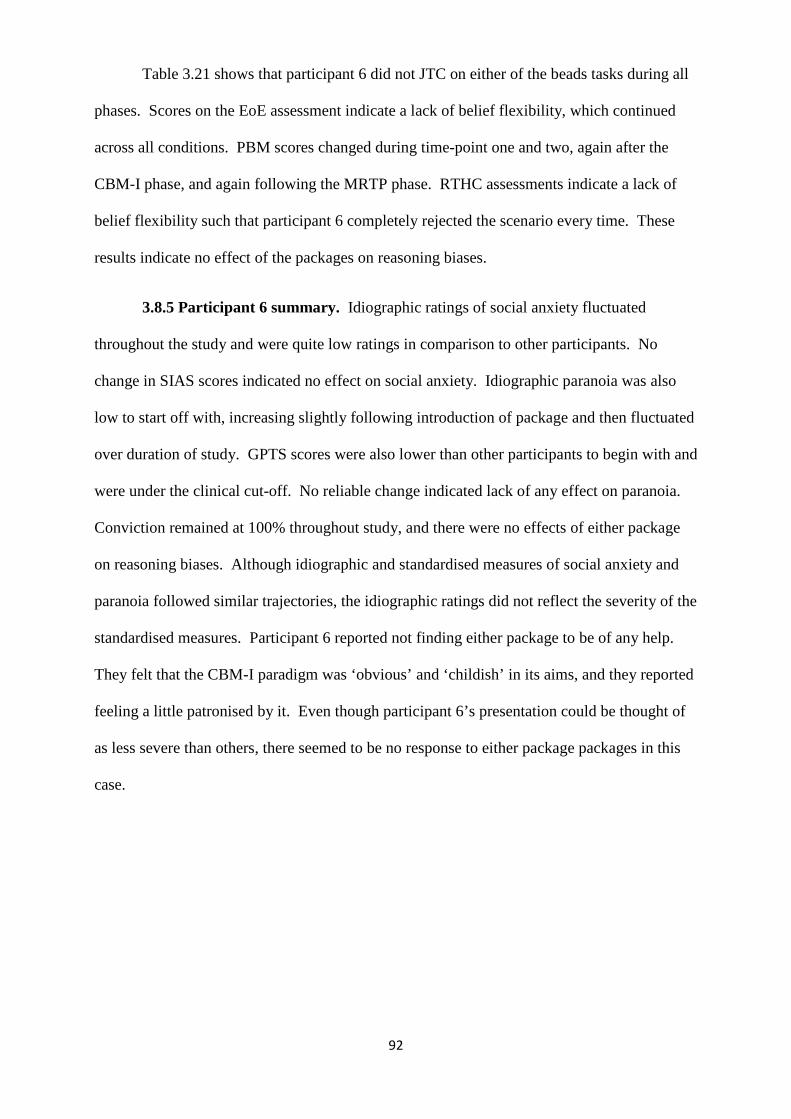
92
Table 3.21 shows that participant 6 did not JTC on either of the beads tasks during all
phases. Scores on the EoE assessment indicate a lack of belief flexibility, which continued
across all conditions. PBM scores changed during time-point one and two, again after the
CBM-I phase, and again following the MRTP phase. RTHC assessments indicate a lack of
belief flexibility such that participant 6 completely rejected the scenario every time. These
results indicate no effect of the packages on reasoning biases.
3.8.5 Participant 6 summary. Idiographic ratings of social anxiety fluctuated
throughout the study and were quite low ratings in comparison to other participants. No
change in SIAS scores indicated no effect on social anxiety. Idiographic paranoia was also
low to start off with, increasing slightly following introduction of package and then fluctuated
over duration of study. GPTS scores were also lower than other participants to begin with and
were under the clinical cut-off. No reliable change indicated lack of any effect on paranoia.
Conviction remained at 100% throughout study, and there were no effects of either package
on reasoning biases. Although idiographic and standardised measures of social anxiety and
paranoia followed similar trajectories, the idiographic ratings did not reflect the severity of the
standardised measures. Participant 6 reported not finding either package to be of any help.
They felt that the CBM-I paradigm was ‘obvious’ and ‘childish’ in its aims, and they reported
feeling a little patronised by it. Even though participant 6’s presentation could be thought of
as less severe than others, there seemed to be no response to either package packages in this
case.
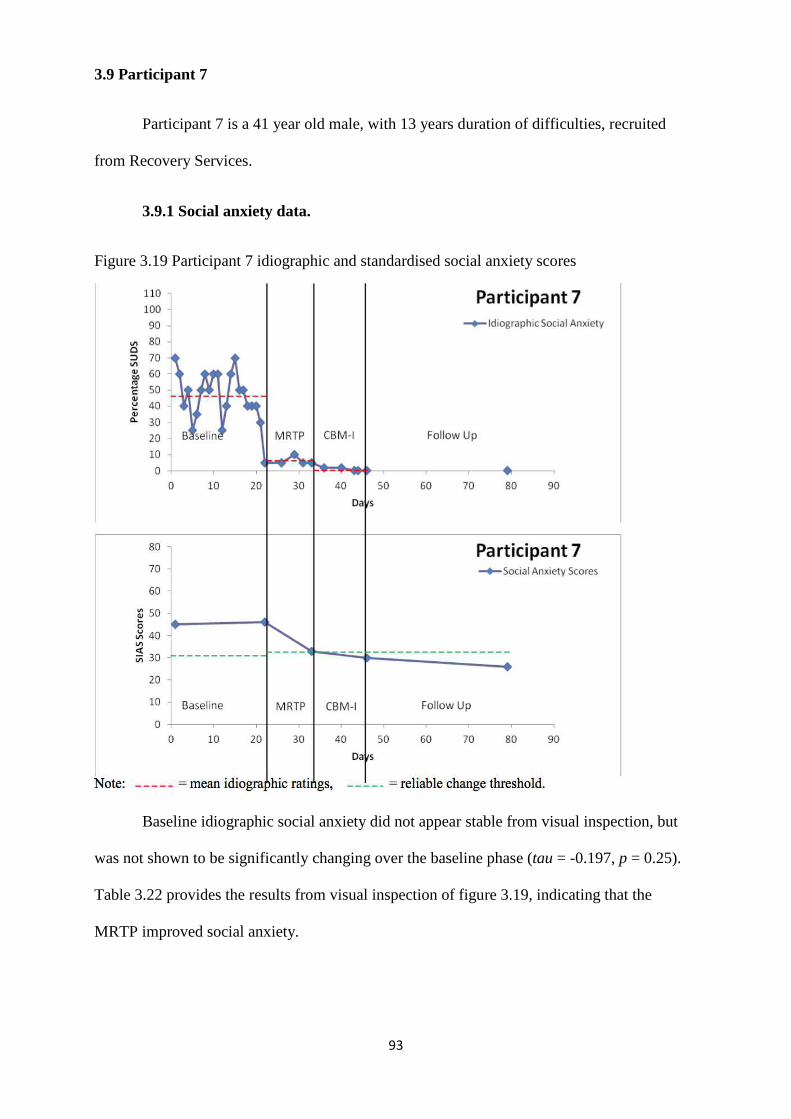
93
3.9 Participant 7
Participant 7 is a 41 year old male, with 13 years duration of difficulties, recruited
from Recovery Services.
3.9.1 Social anxiety data.
Figure 3.19 Participant 7 idiographic and standardised social anxiety scores
Baseline idiographic social anxiety did not appear stable from visual inspection, but
was not shown to be significantly changing over the baseline phase (tau = -0.197, p = 0.25).
Table 3.22 provides the results from visual inspection of figure 3.19, indicating that the
MRTP improved social anxiety.
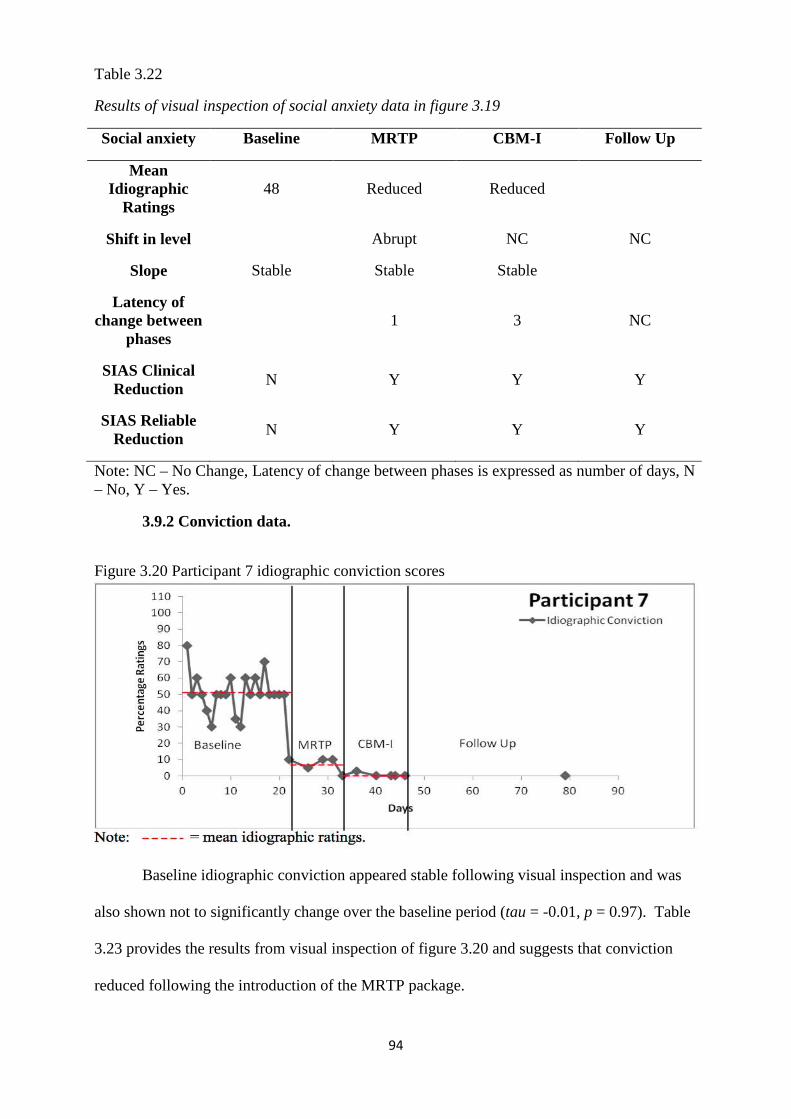
94
Table 3.22
Results of visual inspection of social anxiety data in figure 3.19
Social anxiety Baseline MRTP CBM-I Follow Up
Mean Idiographic
Ratings 48 Reduced Reduced
Shift in level Abrupt NC NC
Slope Stable Stable Stable
Latency of change between
phases 1 3 NC
SIAS Clinical Reduction
N Y Y Y
SIAS Reliable Reduction
N Y Y Y
Note: NC – No Change, Latency of change between phases is expressed as number of days, N – No, Y – Yes.
3.9.2 Conviction data.
Figure 3.20 Participant 7 idiographic conviction scores
Baseline idiographic conviction appeared stable following visual inspection and was
also shown not to significantly change over the baseline period (tau = -0.01, p = 0.97). Table
3.23 provides the results from visual inspection of figure 3.20 and suggests that conviction
reduced following the introduction of the MRTP package.
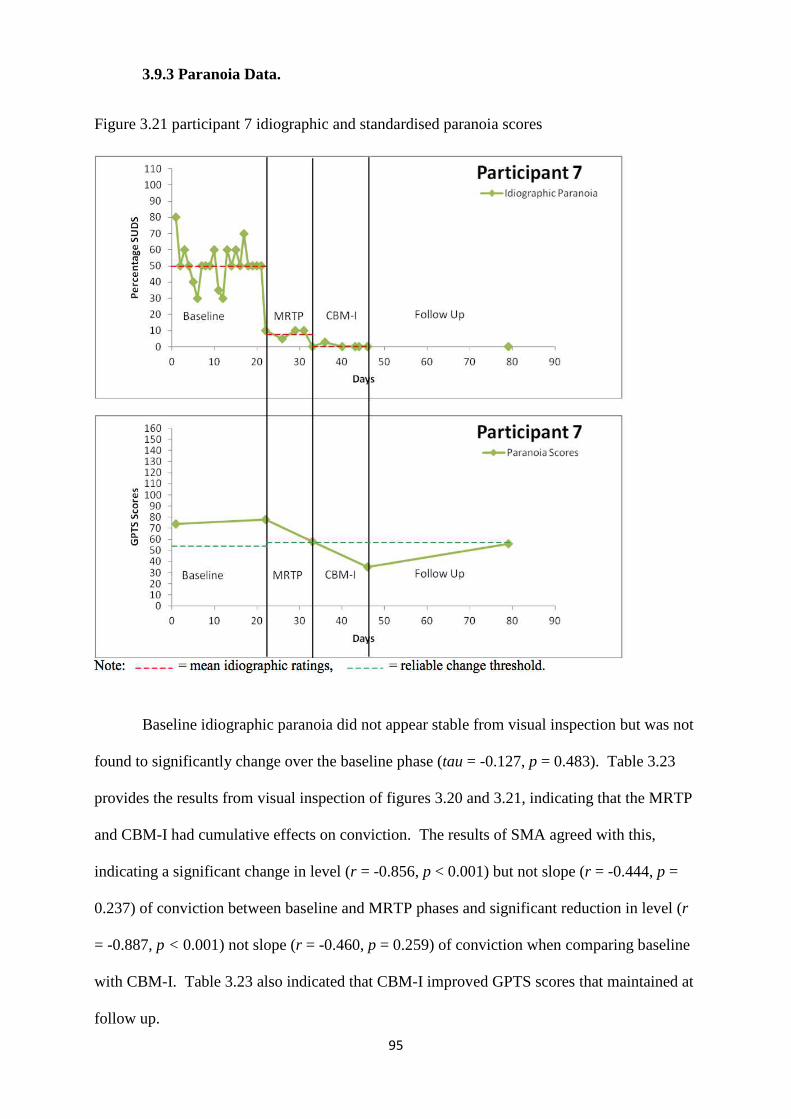
95
3.9.3 Paranoia Data.
Figure 3.21 participant 7 idiographic and standardised paranoia scores
Baseline idiographic paranoia did not appear stable from visual inspection but was not
found to significantly change over the baseline phase (tau = -0.127, p = 0.483). Table 3.23
provides the results from visual inspection of figures 3.20 and 3.21, indicating that the MRTP
and CBM-I had cumulative effects on conviction. The results of SMA agreed with this,
indicating a significant change in level (r = -0.856, p < 0.001) but not slope (r = -0.444, p =
0.237) of conviction between baseline and MRTP phases and significant reduction in level (r
= -0.887, p < 0.001) not slope (r = -0.460, p = 0.259) of conviction when comparing baseline
with CBM-I. Table 3.23 also indicated that CBM-I improved GPTS scores that maintained at
follow up.
96
Table 3.23
Results of visual inspection of paranoia and conviction data in figures 3.20 and 3.21
Paranoia Baseline MRTP CBM-I Follow Up
Mean Idiographic
Ratings 50 Reduced Reduced
Shift in level Abrupt Abrupt NC
Slope Stable Stable Stable
Latency of change between
phases 1 3 NC
GPTS Clinical Reduction
* * * *
GPTS Reliable Reduction
N N Y Y
Mean Conviction
Ratings 51 Reduced Reduced
Shift in level Abrupt Abrupt NC
Slope Stable Decelerating Stable
Latency of change between
phases 1 3 33
Note: NC – No Change, Latency of change between phases is expressed as number of days, * - Scored below clinical cut off at time-points one/two, N – No, Y – Yes
3.9.4 Reasoning data
Table 3.24
Standardised measures for participant 7
Measure B1 B2 MRTP CBM-I Follow Up 85:15 Beads
Task J J X X X
60:40 Beads Task
J J X X X
EoE 0 0 1 2 2 PBM Yes Yes Yes Yes Yes
RTHC 1 1 0 0 0 Note: X – not Jumping to Conclusions, J – JTC, EoE – Explanations of Experiences, PBM – Possibility of being mistaken, RTHC – Reaction to Hypothetical Contradiction; 1 – reduced delusional conviction, 0 – dismissed delusion.
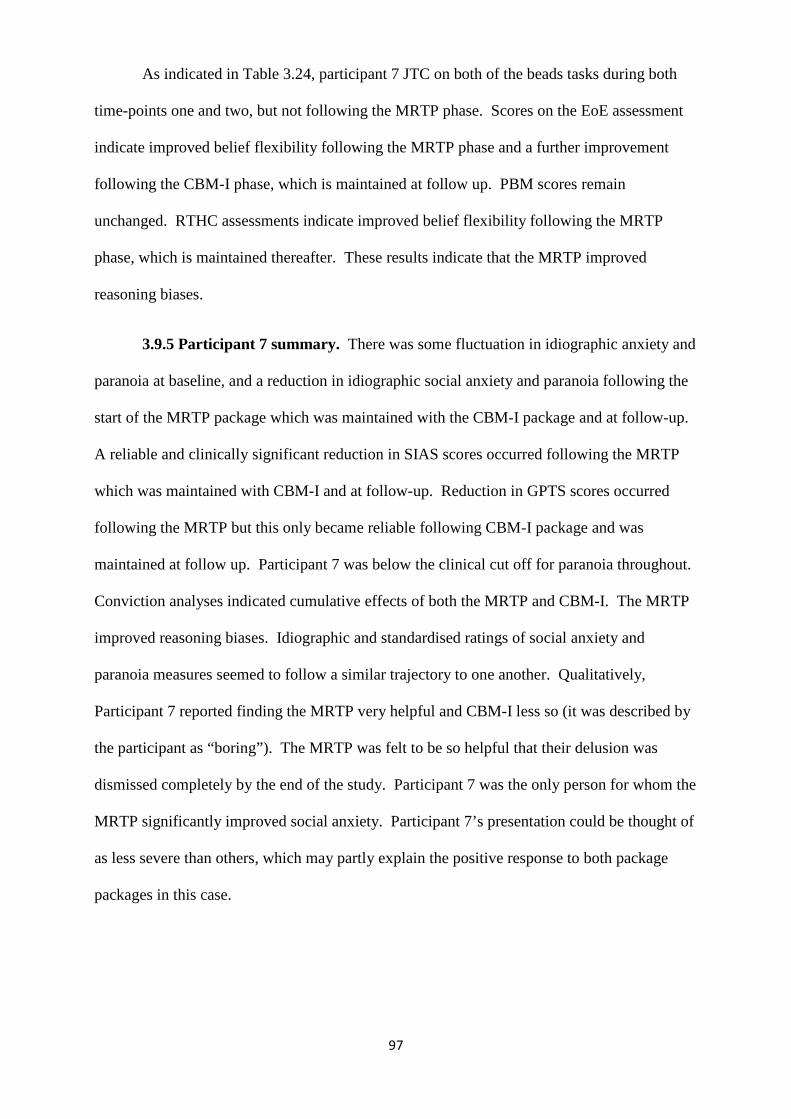
97
As indicated in Table 3.24, participant 7 JTC on both of the beads tasks during both
time-points one and two, but not following the MRTP phase. Scores on the EoE assessment
indicate improved belief flexibility following the MRTP phase and a further improvement
following the CBM-I phase, which is maintained at follow up. PBM scores remain
unchanged. RTHC assessments indicate improved belief flexibility following the MRTP
phase, which is maintained thereafter. These results indicate that the MRTP improved
reasoning biases.
3.9.5 Participant 7 summary. There was some fluctuation in idiographic anxiety and
paranoia at baseline, and a reduction in idiographic social anxiety and paranoia following the
start of the MRTP package which was maintained with the CBM-I package and at follow-up.
A reliable and clinically significant reduction in SIAS scores occurred following the MRTP
which was maintained with CBM-I and at follow-up. Reduction in GPTS scores occurred
following the MRTP but this only became reliable following CBM-I package and was
maintained at follow up. Participant 7 was below the clinical cut off for paranoia throughout.
Conviction analyses indicated cumulative effects of both the MRTP and CBM-I. The MRTP
improved reasoning biases. Idiographic and standardised ratings of social anxiety and
paranoia measures seemed to follow a similar trajectory to one another. Qualitatively,
Participant 7 reported finding the MRTP very helpful and CBM-I less so (it was described by
the participant as “boring”). The MRTP was felt to be so helpful that their delusion was
dismissed completely by the end of the study. Participant 7 was the only person for whom the
MRTP significantly improved social anxiety. Participant 7’s presentation could be thought of
as less severe than others, which may partly explain the positive response to both package
packages in this case.
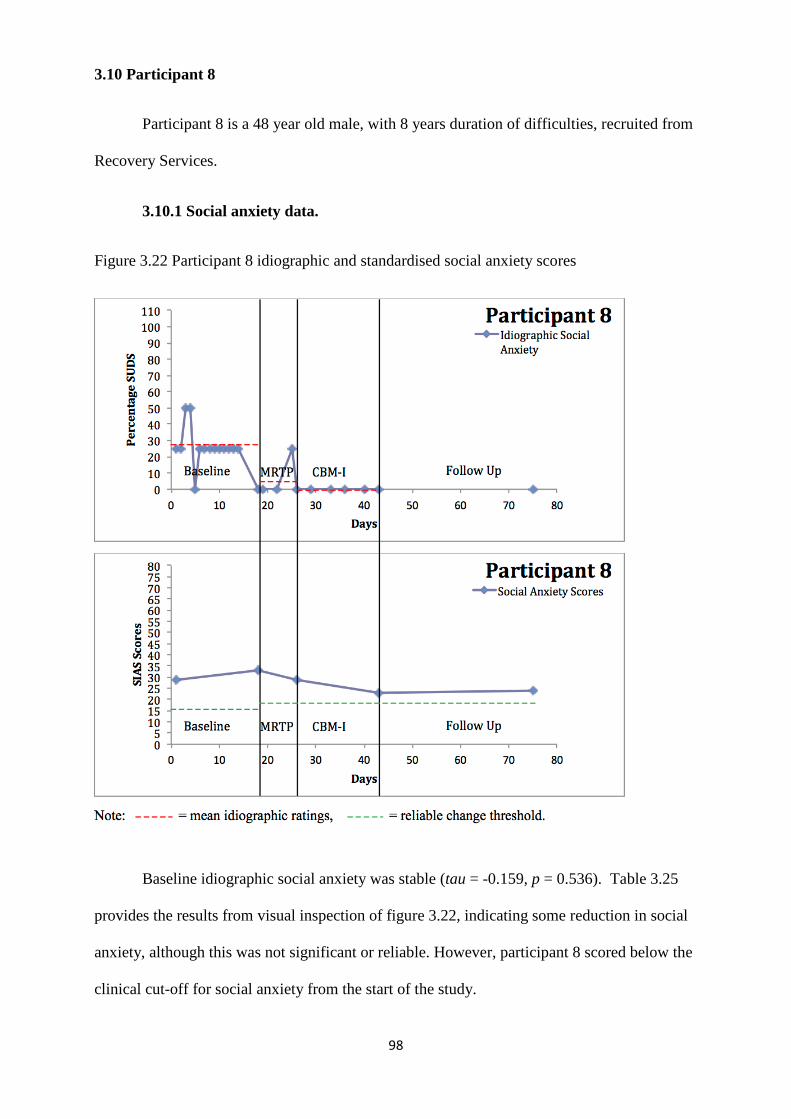
98
3.10 Participant 8
Participant 8 is a 48 year old male, with 8 years duration of difficulties, recruited from
Recovery Services.
3.10.1 Social anxiety data.
Figure 3.22 Participant 8 idiographic and standardised social anxiety scores
Baseline idiographic social anxiety was stable (tau = -0.159, p = 0.536). Table 3.25
provides the results from visual inspection of figure 3.22, indicating some reduction in social
anxiety, although this was not significant or reliable. However, participant 8 scored below the
clinical cut-off for social anxiety from the start of the study.
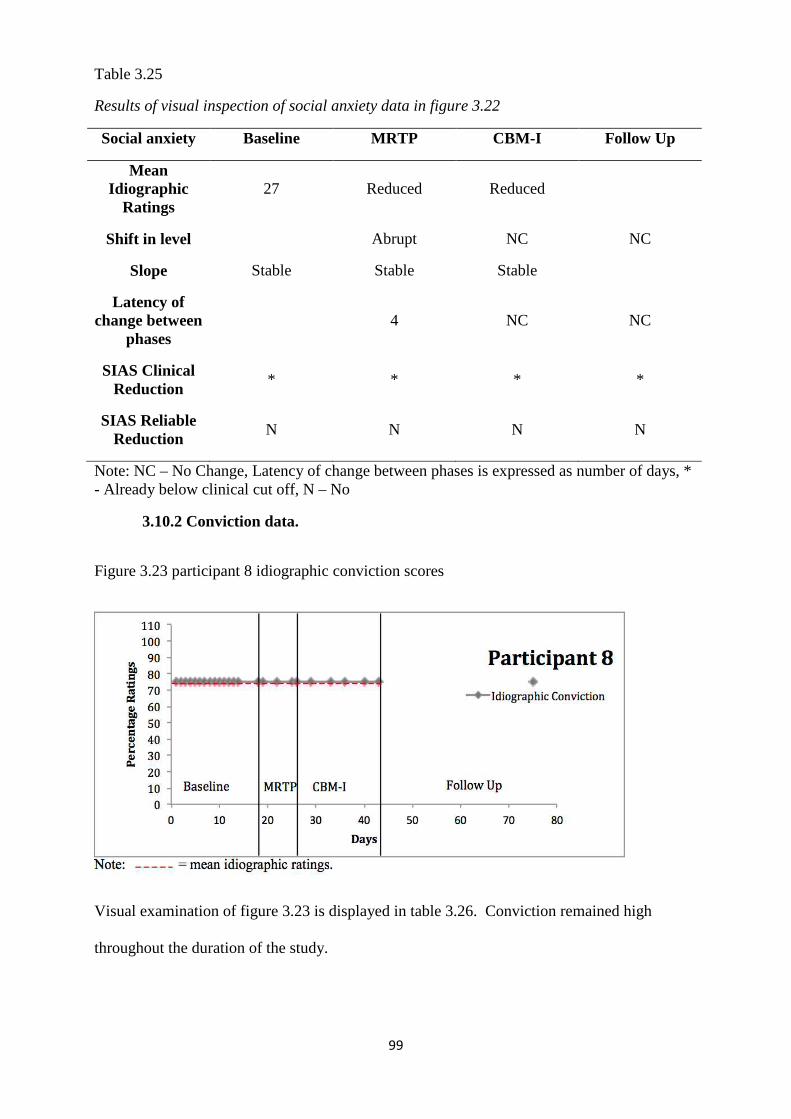
99
Table 3.25
Results of visual inspection of social anxiety data in figure 3.22
Social anxiety Baseline MRTP CBM-I Follow Up
Mean Idiographic
Ratings 27 Reduced Reduced
Shift in level Abrupt NC NC
Slope Stable Stable Stable
Latency of change between
phases 4 NC NC
SIAS Clinical Reduction
* * * *
SIAS Reliable Reduction
N N N N
Note: NC – No Change, Latency of change between phases is expressed as number of days, * - Already below clinical cut off, N – No
3.10.2 Conviction data.
Figure 3.23 participant 8 idiographic conviction scores
Visual examination of figure 3.23 is displayed in table 3.26. Conviction remained high
throughout the duration of the study.
100
3.10.3 Paranoia Data.
Baseline idiographic paranoia was stable (tau = -0.297, p = 0.23). Table 3.26 provides
the results from visual inspection of figures 3.23 and 3.24, indicating no effect on conviction
and that the MRTP improved GPTS scores, which was maintained throughout the CBM-I
package phase and at follow up.
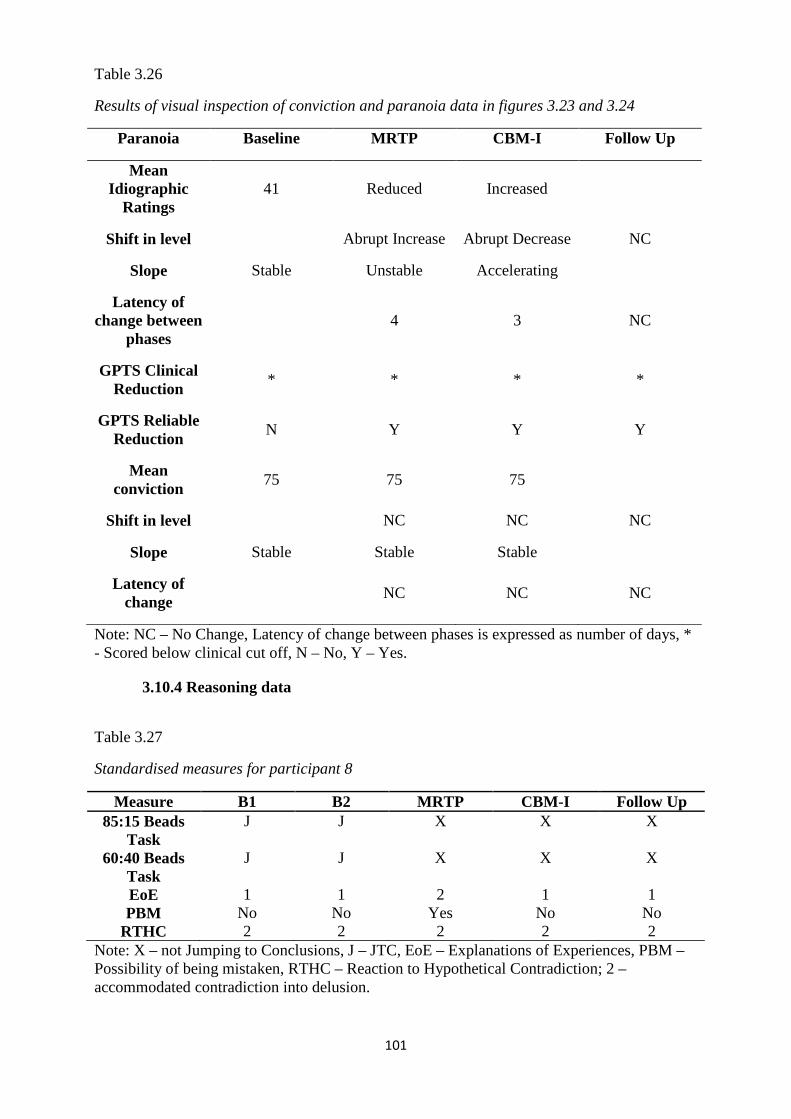
101
Table 3.26
Results of visual inspection of conviction and paranoia data in figures 3.23 and 3.24
Paranoia Baseline MRTP CBM-I Follow Up
Mean Idiographic
Ratings 41 Reduced Increased
Shift in level Abrupt Increase Abrupt Decrease NC
Slope Stable Unstable Accelerating
Latency of change between
phases 4 3 NC
GPTS Clinical Reduction
* * * *
GPTS Reliable Reduction
N Y Y Y
Mean conviction
75 75 75
Shift in level NC NC NC
Slope Stable Stable Stable
Latency of change
NC NC NC
Note: NC – No Change, Latency of change between phases is expressed as number of days, * - Scored below clinical cut off, N – No, Y – Yes.
3.10.4 Reasoning data
Table 3.27
Standardised measures for participant 8
Measure B1 B2 MRTP CBM-I Follow Up 85:15 Beads
Task J J X X X
60:40 Beads Task
J J X X X
EoE 1 1 2 1 1 PBM No No Yes No No
RTHC 2 2 2 2 2 Note: X – not Jumping to Conclusions, J – JTC, EoE – Explanations of Experiences, PBM – Possibility of being mistaken, RTHC – Reaction to Hypothetical Contradiction; 2 – accommodated contradiction into delusion.
102
Table 3.27 shows that participant 8 JTC on both of the beads tasks during both time-
points one and two. This improved following the MRTP phase and throughout. Scores on the
EoE assessment indicate an improvement in belief flexibility following the MRTP phase, that
returned to baseline level following the CBM-I phase and at follow up. PBM scores
improved only following the MRTP phase and also revert back to baseline level following
CBM-I and at follow up. RTHC assessments indicate lack of belief flexibility throughout.
These results indicate that the MRTP improved reasoning biases.
3.10.5 Participant 8 summary. Reduction in idiographic ratings of anxiety occurred
following the MRTP which was maintained (and potentially further reduced) following CBM-
I. There were no reliable changes in SIAS scores, but participant 8 scored below the clinical
cut off at time-point one and two. Idiographic ratings of paranoia fluctuated throughout the
study, but these were not as high as other participants. A reliable reduction in GPTS scores
occurred after the MRTP and was maintained throughout, but participant 8 scored below the
clinical cut off for paranoia at time-point one and two. Conviction remained at 75%
throughout. There was some indication of improvement in reasoning biases (JTC, EoE,
PBM) following MRTP but only improvement in the JTC task maintained with CBM-I and at
follow up. This indicates that the MRTP improved reasoning biases and paranoia. There was
marked discrepancy between idiographic and standardised ratings of social anxiety; however,
the idiographic and GPTS measures seemed to follow a similar trajectory to one another.
Participant 8 reported not finding either package to be particularly helpful. Participant 8’s
less severe presentation (comparatively) may partly explain the positive effects of both
packages.
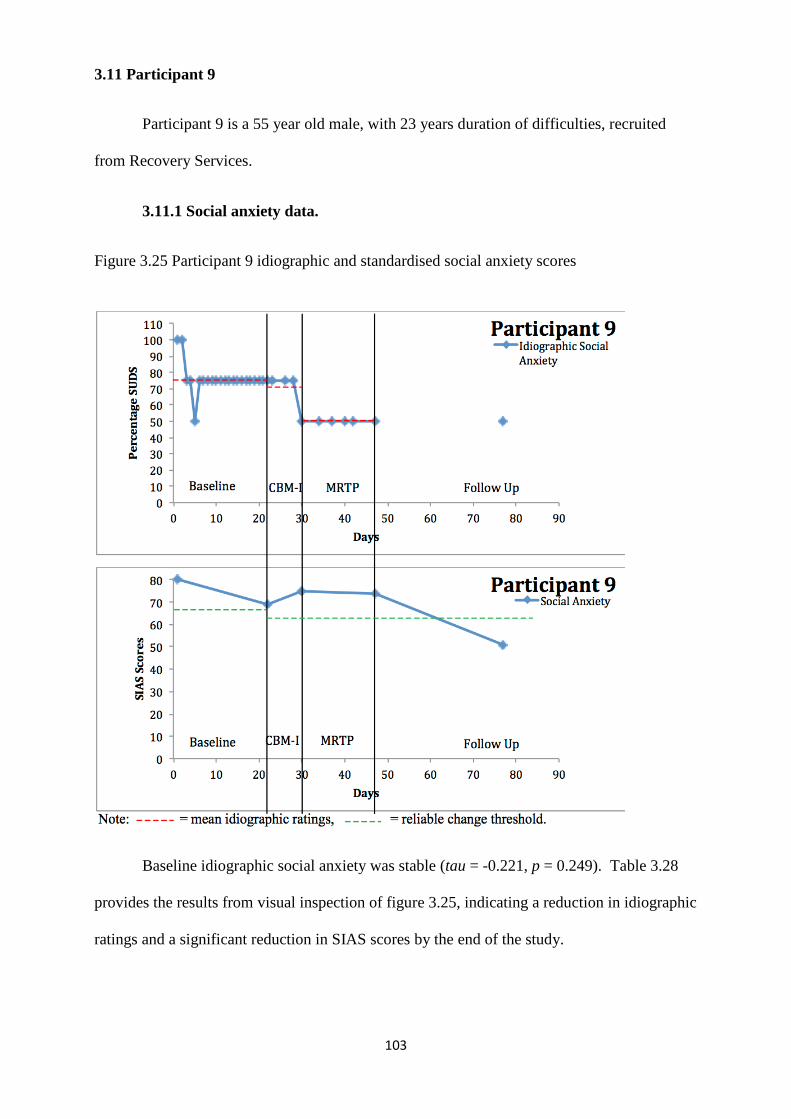
103
3.11 Participant 9
Participant 9 is a 55 year old male, with 23 years duration of difficulties, recruited
from Recovery Services.
3.11.1 Social anxiety data.
Figure 3.25 Participant 9 idiographic and standardised social anxiety scores
Baseline idiographic social anxiety was stable (tau = -0.221, p = 0.249). Table 3.28
provides the results from visual inspection of figure 3.25, indicating a reduction in idiographic
ratings and a significant reduction in SIAS scores by the end of the study.
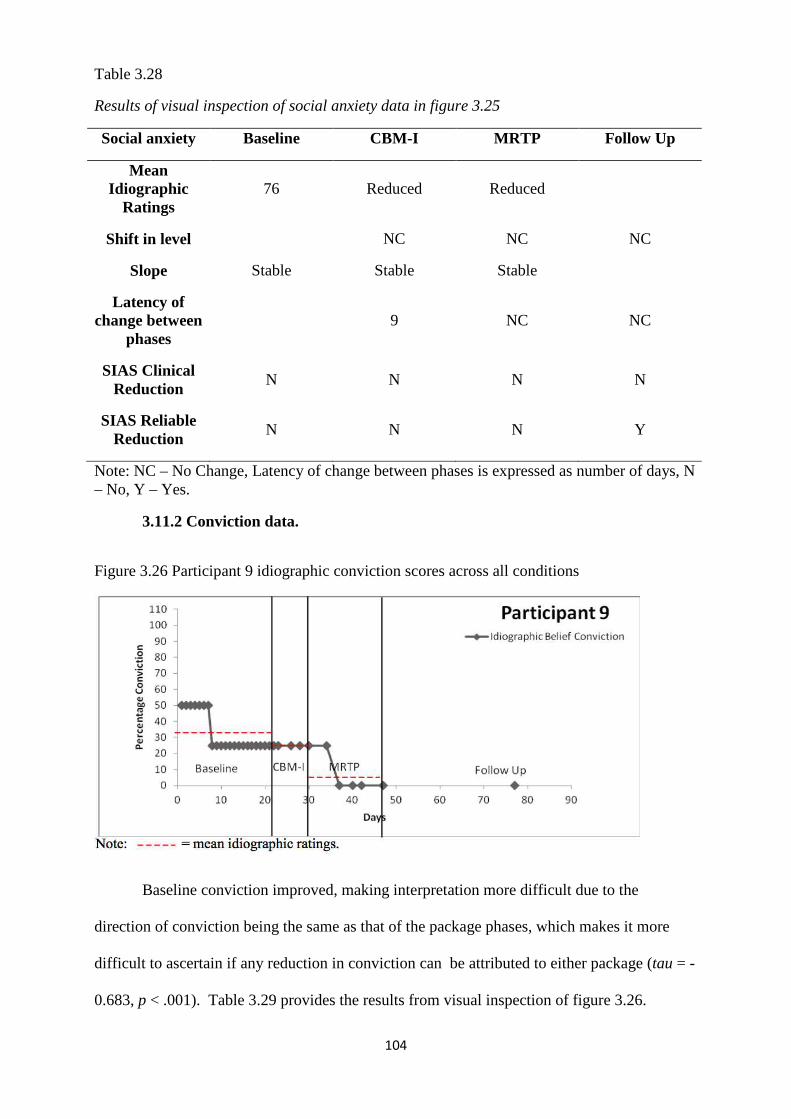
104
Table 3.28
Results of visual inspection of social anxiety data in figure 3.25
Social anxiety Baseline CBM-I MRTP Follow Up
Mean Idiographic
Ratings 76 Reduced Reduced
Shift in level NC NC NC
Slope Stable Stable Stable
Latency of change between
phases 9 NC NC
SIAS Clinical Reduction
N N N N
SIAS Reliable Reduction
N N N Y
Note: NC – No Change, Latency of change between phases is expressed as number of days, N – No, Y – Yes.
3.11.2 Conviction data.
Figure 3.26 Participant 9 idiographic conviction scores across all conditions
Baseline conviction improved, making interpretation more difficult due to the
direction of conviction being the same as that of the package phases, which makes it more
difficult to ascertain if any reduction in conviction can be attributed to either package (tau = -
0.683, p < .001). Table 3.29 provides the results from visual inspection of figure 3.26.
105
3.11.3 Paranoia Data.
Baseline idiographic paranoia was improving (tau = 0.424, p < 0.05). Table 3.29
provides the results from visual inspection of figures 3.26 and 3.27, indicating that the MRTP
significantly reduced conviction but already within the context of some improvement. The
SMA results were in agreement with this observation, indicating no significant change in
level (r = -0.296, p = 0.5768) but a significant reduction in slope (r = -0.820, p < 0.05)
between baseline and CBM-I phases. A significant change in level (r = -0.778, p < 0.05) and
slope (r = -0.830, p < 0.05) of conviction was found between baseline and MRTP phases.
The results in table 3.29 also indicate no clear effect of either package on paranoia, although
there was a reliable reduction at follow up.
106
Table 3.29
Results of visual inspection of paranoia and conviction data in figures 3.26 and 3.27
Paranoia Baseline CBM MRTP Follow Up
Mean Idiographic
Ratings 30 Reduced Reduced
Shift in level Abrupt NC NC
Slope Decelerating Stable Stable
Latency of change between
phases 1 NC NC
GPTS Clinical Reduction
* * * *
GPTS Reliable Reduction
N N N Y
Mean Conviction
Ratings 33 Reduced Reduced
Shift in level NC NC NC
Slope Decelerating Stable Decelerating
Latency of change between
phases NC 7 NC
Note: NC – No Change, Latency of change between phases is expressed as number of days, * - scores below clinical cut off, N – No, Y – Yes.
3.11.4 Reasoning data
Table 3.30
Standardised measures for participant 9
Measure B1 B2 CBM-I MRTP Follow Up 85:15 Beads
Task J X X X X
60:40 Beads Task
X X X X X
EoE 0 0 0 1 2 PBM Y Y Y Y Y
RTHC 1 1 1 0 0 Note: X – not Jumping to Conclusions, J – JTC, EoE – Explanations of Experiences, Y – Yes, N – No, PBM – Possibility of being mistaken, RTHC – Reaction to Hypothetical Contradiction; 1 – reduced delusional conviction, 0 – dismissed delusion.
107
Table 3.30 shows that participant 9 JTC once at time-point one, and did not JTC on
either beads task during all remaining phases. Scores on the EoE assessment indicate lack of
belief flexibility, which improved following MRTP and follow up phases. PBM scores were
stable across phases. RTHC assessments indicate belief flexibility that improved following
the MRTP and follow up phases, such that participant 9 dismissed the delusion. These results
indicate that the MRTP improved reasoning biases.
3.11.5 Participant 9 summary. A reduction in idiographic ratings of social anxiety
occurred following CBM-I, with a further reduction following the MRTP. There was no
reliable reduction in SIAS scores following either package but a reliable change had occurred
at follow up. Some reduction in idiographic ratings of paranoia followed CBM-I and were
maintained throughout, however, there was some improvement during baseline. GPTS scores
were also below the clinical range throughout the study. No reliable change in GPTS scores
occurred following either package but there was a gradual decreasing slope in GPTS scores
over the duration of study that ended up with reliable reduction at follow up. Conviction also
improved during baseline and was maintained during CBM-I, with an additional reduction
following the MRTP. There was some improvement in reasoning biases only following
MRTP (EoE, RTHC) but participant 9 already showed flexibility at time-point one and two
(PBM) and JTC improved between both time-points. Idiographic and standardised measures
of social anxiety largely agree with one another and follow a similar trajectory. Idiographic
and GPTS scores also follow a similar trajectory, but the severity of both scores is not
matched, i.e., idiographic measures don’t reflect the same severity as the GPTS. Participant 9
reported finding both packages very helpful and gave several examples of how they had put
into practice the training tips from the MRTP. Participant 9’s comparatively less severe
presentation may partly explain the positive response to both package packages. However, it
is difficult to ascertain specific effects of either package due to the gradually improving
profile of scores over the duration of the study.
108
3.12 Participant 10
Participant 10 is a 61 year old male, with 1.5 years duration of difficulties, recruited
from Recovery Services.
3.12.1 Social anxiety data.
Figure 3.28 Participant 10 idiographic and standardised social anxiety scores
Baseline idiographic social anxiety was improving (tau = -0.614, p < 0.01). Table
3.31 provides the results from visual inspection of figure 3.28, indicating that CBM-I
improved social anxiety but this became non-reliable at follow-up, although the reduction was
maintained to some degree.
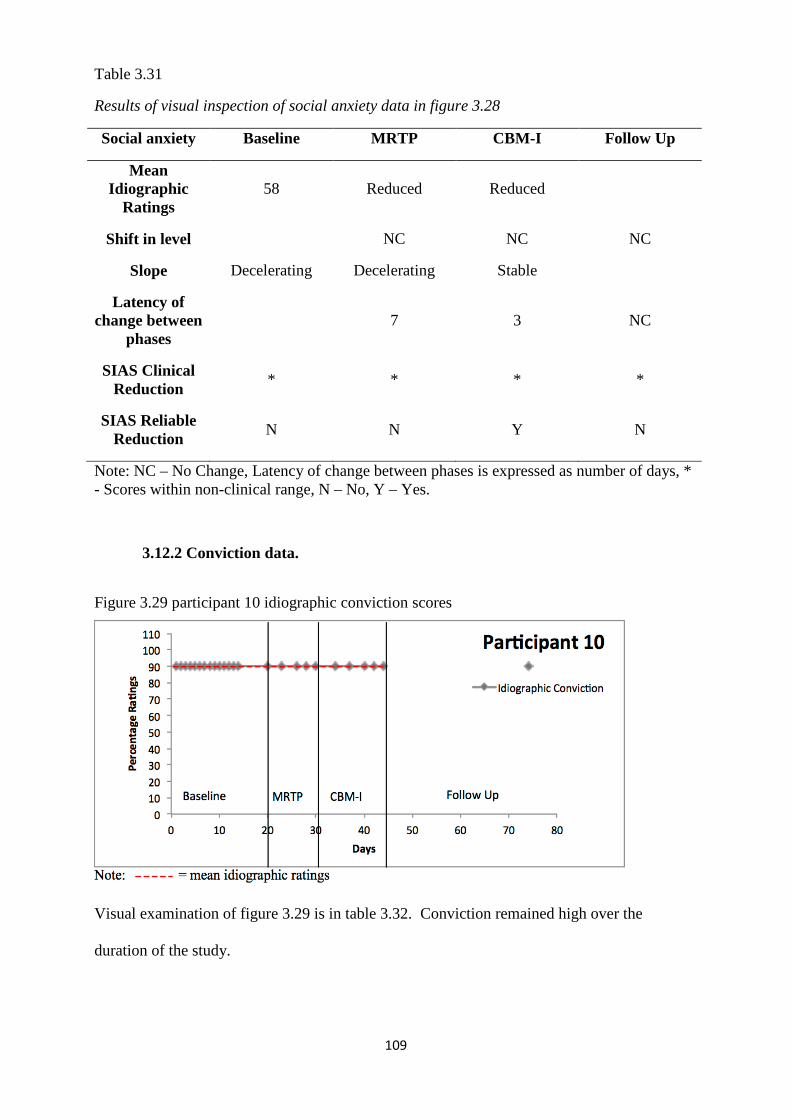
109
Table 3.31
Results of visual inspection of social anxiety data in figure 3.28
Social anxiety Baseline MRTP CBM-I Follow Up
Mean Idiographic
Ratings 58 Reduced Reduced
Shift in level NC NC NC
Slope Decelerating Decelerating Stable
Latency of change between
phases 7 3 NC
SIAS Clinical Reduction
* * * *
SIAS Reliable Reduction
N N Y N
Note: NC – No Change, Latency of change between phases is expressed as number of days, * - Scores within non-clinical range, N – No, Y – Yes.
3.12.2 Conviction data.
Figure 3.29 participant 10 idiographic conviction scores
Visual examination of figure 3.29 is in table 3.32. Conviction remained high over the
duration of the study.
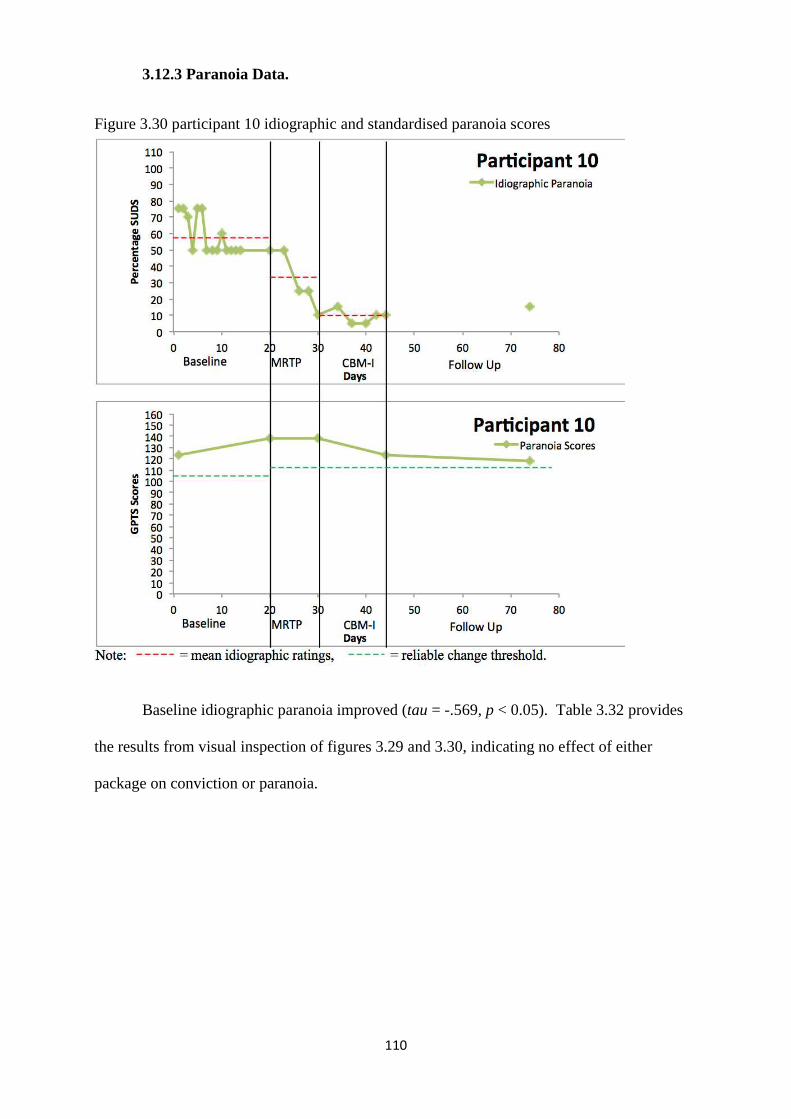
110
3.12.3 Paranoia Data.
Figure 3.30 participant 10 idiographic and standardised paranoia scores
Baseline idiographic paranoia improved (tau = -.569, p < 0.05). Table 3.32 provides
the results from visual inspection of figures 3.29 and 3.30, indicating no effect of either
package on conviction or paranoia.
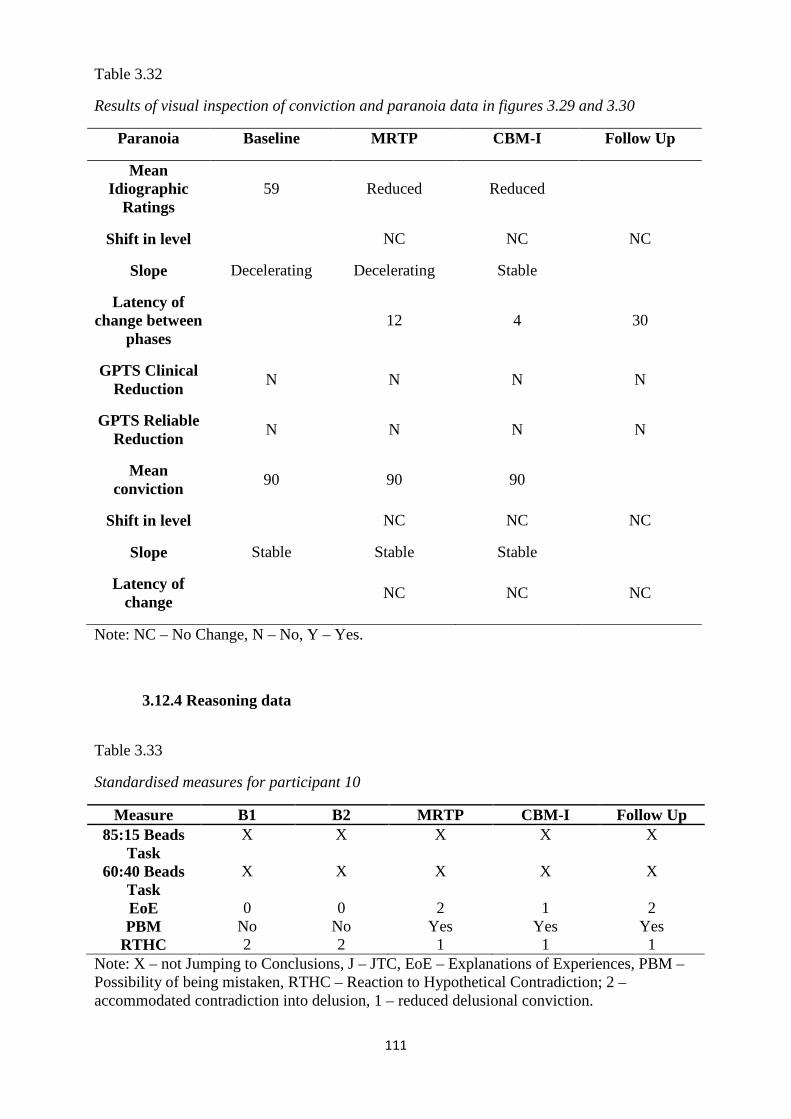
111
Table 3.32
Results of visual inspection of conviction and paranoia data in figures 3.29 and 3.30
Paranoia Baseline MRTP CBM-I Follow Up
Mean Idiographic
Ratings 59 Reduced Reduced
Shift in level NC NC NC
Slope Decelerating Decelerating Stable
Latency of change between
phases 12 4 30
GPTS Clinical Reduction
N N N N
GPTS Reliable Reduction
N N N N
Mean conviction
90 90 90
Shift in level NC NC NC
Slope Stable Stable Stable
Latency of change
NC NC NC
Note: NC – No Change, N – No, Y – Yes.
3.12.4 Reasoning data
Table 3.33
Standardised measures for participant 10
Measure B1 B2 MRTP CBM-I Follow Up 85:15 Beads
Task X X X X X
60:40 Beads Task
X X X X X
EoE 0 0 2 1 2 PBM No No Yes Yes Yes
RTHC 2 2 1 1 1 Note: X – not Jumping to Conclusions, J – JTC, EoE – Explanations of Experiences, PBM – Possibility of being mistaken, RTHC – Reaction to Hypothetical Contradiction; 2 – accommodated contradiction into delusion, 1 – reduced delusional conviction.
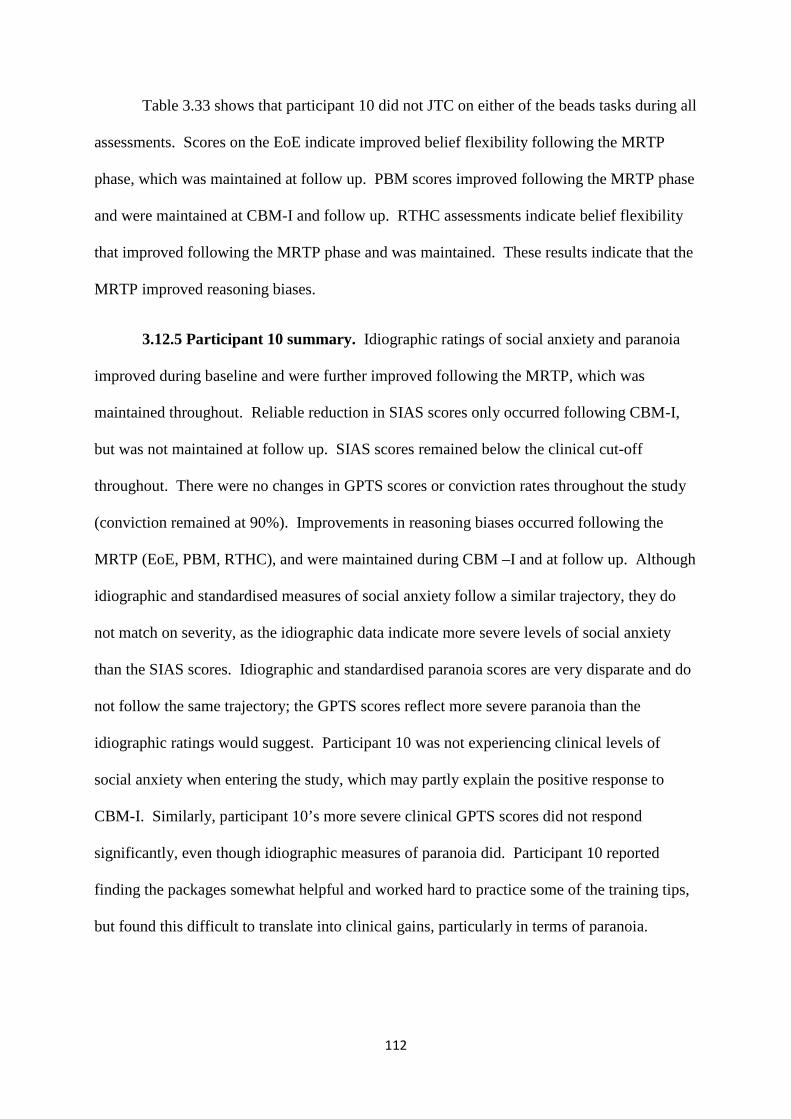
112
Table 3.33 shows that participant 10 did not JTC on either of the beads tasks during all
assessments. Scores on the EoE indicate improved belief flexibility following the MRTP
phase, which was maintained at follow up. PBM scores improved following the MRTP phase
and were maintained at CBM-I and follow up. RTHC assessments indicate belief flexibility
that improved following the MRTP phase and was maintained. These results indicate that the
MRTP improved reasoning biases.
3.12.5 Participant 10 summary. Idiographic ratings of social anxiety and paranoia
improved during baseline and were further improved following the MRTP, which was
maintained throughout. Reliable reduction in SIAS scores only occurred following CBM-I,
but was not maintained at follow up. SIAS scores remained below the clinical cut-off
throughout. There were no changes in GPTS scores or conviction rates throughout the study
(conviction remained at 90%). Improvements in reasoning biases occurred following the
MRTP (EoE, PBM, RTHC), and were maintained during CBM –I and at follow up. Although
idiographic and standardised measures of social anxiety follow a similar trajectory, they do
not match on severity, as the idiographic data indicate more severe levels of social anxiety
than the SIAS scores. Idiographic and standardised paranoia scores are very disparate and do
not follow the same trajectory; the GPTS scores reflect more severe paranoia than the
idiographic ratings would suggest. Participant 10 was not experiencing clinical levels of
social anxiety when entering the study, which may partly explain the positive response to
CBM-I. Similarly, participant 10’s more severe clinical GPTS scores did not respond
significantly, even though idiographic measures of paranoia did. Participant 10 reported
finding the packages somewhat helpful and worked hard to practice some of the training tips,
but found this difficult to translate into clinical gains, particularly in terms of paranoia.
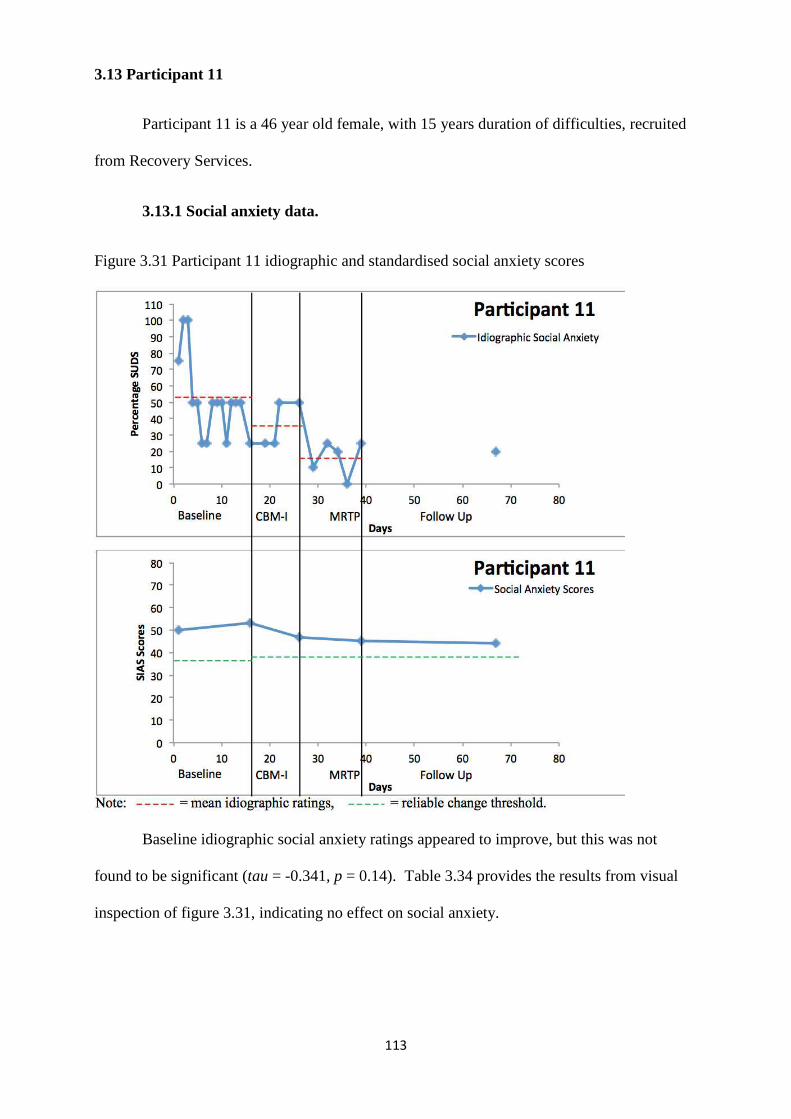
113
3.13 Participant 11
Participant 11 is a 46 year old female, with 15 years duration of difficulties, recruited
from Recovery Services.
3.13.1 Social anxiety data.
Figure 3.31 Participant 11 idiographic and standardised social anxiety scores
Baseline idiographic social anxiety ratings appeared to improve, but this was not
found to be significant (tau = -0.341, p = 0.14). Table 3.34 provides the results from visual
inspection of figure 3.31, indicating no effect on social anxiety.
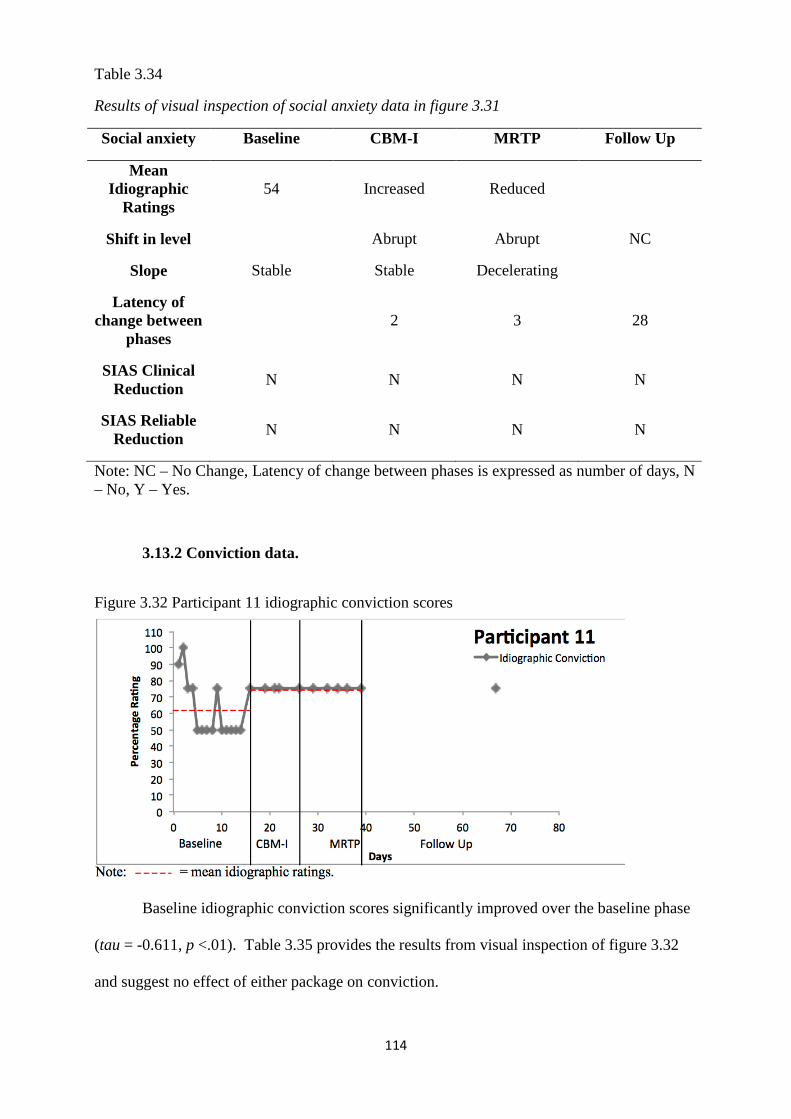
114
Table 3.34
Results of visual inspection of social anxiety data in figure 3.31
Social anxiety Baseline CBM-I MRTP Follow Up
Mean Idiographic
Ratings 54 Increased Reduced
Shift in level Abrupt Abrupt NC
Slope Stable Stable Decelerating
Latency of change between
phases 2 3 28
SIAS Clinical Reduction
N N N N
SIAS Reliable Reduction
N N N N
Note: NC – No Change, Latency of change between phases is expressed as number of days, N – No, Y – Yes.
3.13.2 Conviction data.
Figure 3.32 Participant 11 idiographic conviction scores
Baseline idiographic conviction scores significantly improved over the baseline phase
(tau = -0.611, p <.01). Table 3.35 provides the results from visual inspection of figure 3.32
and suggest no effect of either package on conviction.
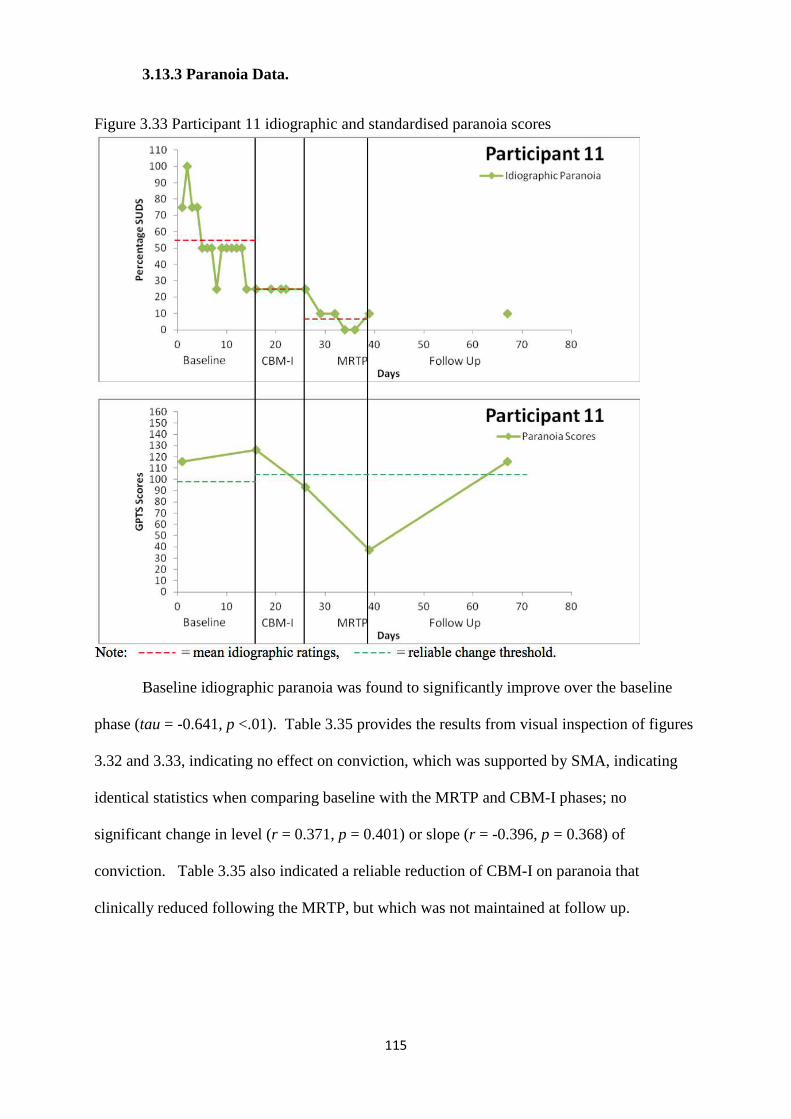
115
3.13.3 Paranoia Data.
Figure 3.33 Participant 11 idiographic and standardised paranoia scores
Baseline idiographic paranoia was found to significantly improve over the baseline
phase (tau = -0.641, p <.01). Table 3.35 provides the results from visual inspection of figures
3.32 and 3.33, indicating no effect on conviction, which was supported by SMA, indicating
identical statistics when comparing baseline with the MRTP and CBM-I phases; no
significant change in level (r = 0.371, p = 0.401) or slope (r = -0.396, p = 0.368) of
conviction. Table 3.35 also indicated a reliable reduction of CBM-I on paranoia that
clinically reduced following the MRTP, but which was not maintained at follow up.
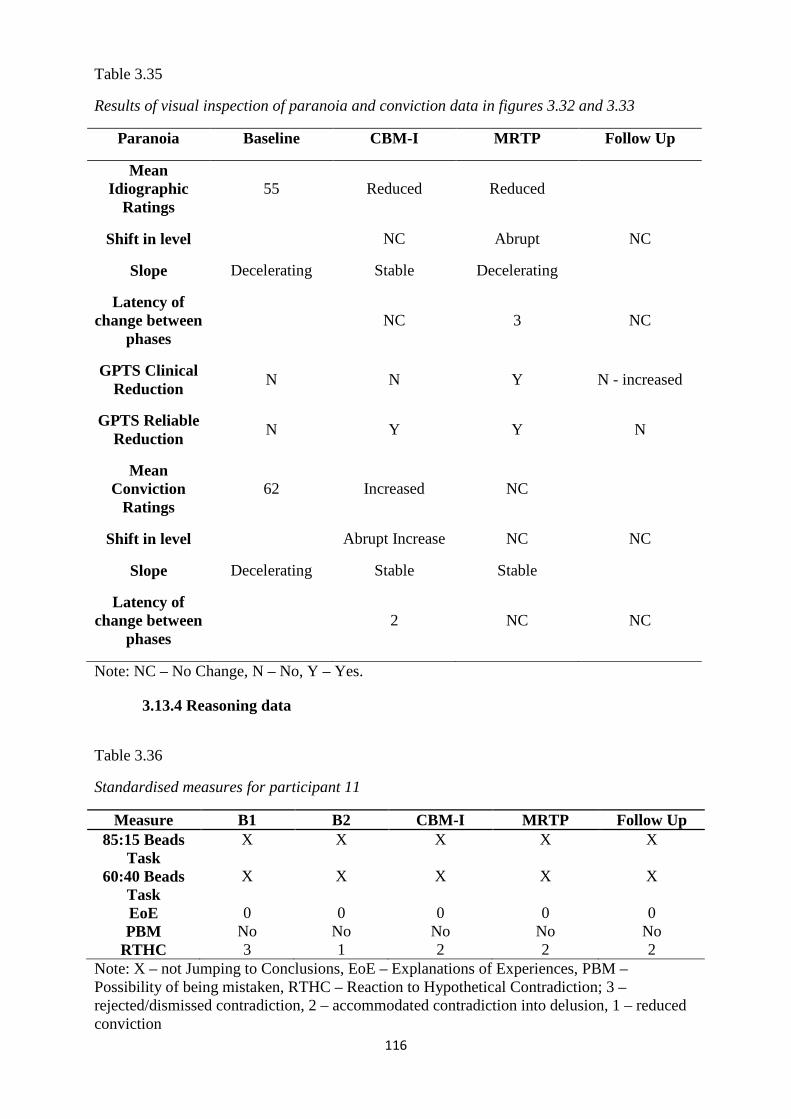
116
Table 3.35
Results of visual inspection of paranoia and conviction data in figures 3.32 and 3.33
Paranoia Baseline CBM-I MRTP Follow Up
Mean Idiographic
Ratings 55 Reduced Reduced
Shift in level NC Abrupt NC
Slope Decelerating Stable Decelerating
Latency of change between
phases NC 3 NC
GPTS Clinical Reduction
N N Y N - increased
GPTS Reliable Reduction
N Y Y N
Mean Conviction
Ratings 62 Increased NC
Shift in level Abrupt Increase NC NC
Slope Decelerating Stable Stable
Latency of change between
phases 2 NC NC
Note: NC – No Change, N – No, Y – Yes.
3.13.4 Reasoning data
Table 3.36
Standardised measures for participant 11
Measure B1 B2 CBM-I MRTP Follow Up 85:15 Beads
Task X X X X X
60:40 Beads Task
X X X X X
EoE 0 0 0 0 0 PBM No No No No No
RTHC 3 1 2 2 2 Note: X – not Jumping to Conclusions, EoE – Explanations of Experiences, PBM – Possibility of being mistaken, RTHC – Reaction to Hypothetical Contradiction; 3 – rejected/dismissed contradiction, 2 – accommodated contradiction into delusion, 1 – reduced conviction
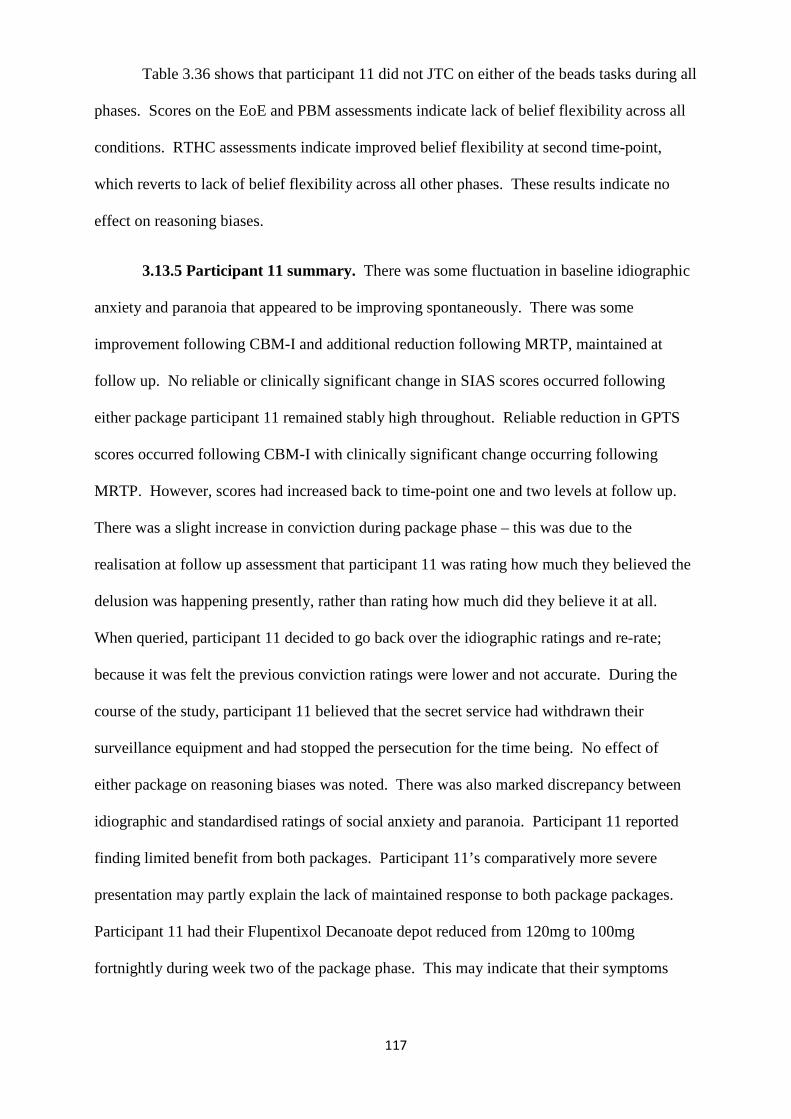
117
Table 3.36 shows that participant 11 did not JTC on either of the beads tasks during all
phases. Scores on the EoE and PBM assessments indicate lack of belief flexibility across all
conditions. RTHC assessments indicate improved belief flexibility at second time-point,
which reverts to lack of belief flexibility across all other phases. These results indicate no
effect on reasoning biases.
3.13.5 Participant 11 summary. There was some fluctuation in baseline idiographic
anxiety and paranoia that appeared to be improving spontaneously. There was some
improvement following CBM-I and additional reduction following MRTP, maintained at
follow up. No reliable or clinically significant change in SIAS scores occurred following
either package participant 11 remained stably high throughout. Reliable reduction in GPTS
scores occurred following CBM-I with clinically significant change occurring following
MRTP. However, scores had increased back to time-point one and two levels at follow up.
There was a slight increase in conviction during package phase – this was due to the
realisation at follow up assessment that participant 11 was rating how much they believed the
delusion was happening presently, rather than rating how much did they believe it at all.
When queried, participant 11 decided to go back over the idiographic ratings and re-rate;
because it was felt the previous conviction ratings were lower and not accurate. During the
course of the study, participant 11 believed that the secret service had withdrawn their
surveillance equipment and had stopped the persecution for the time being. No effect of
either package on reasoning biases was noted. There was also marked discrepancy between
idiographic and standardised ratings of social anxiety and paranoia. Participant 11 reported
finding limited benefit from both packages. Participant 11’s comparatively more severe
presentation may partly explain the lack of maintained response to both package packages.
Participant 11 had their Flupentixol Decanoate depot reduced from 120mg to 100mg
fortnightly during week two of the package phase. This may indicate that their symptoms
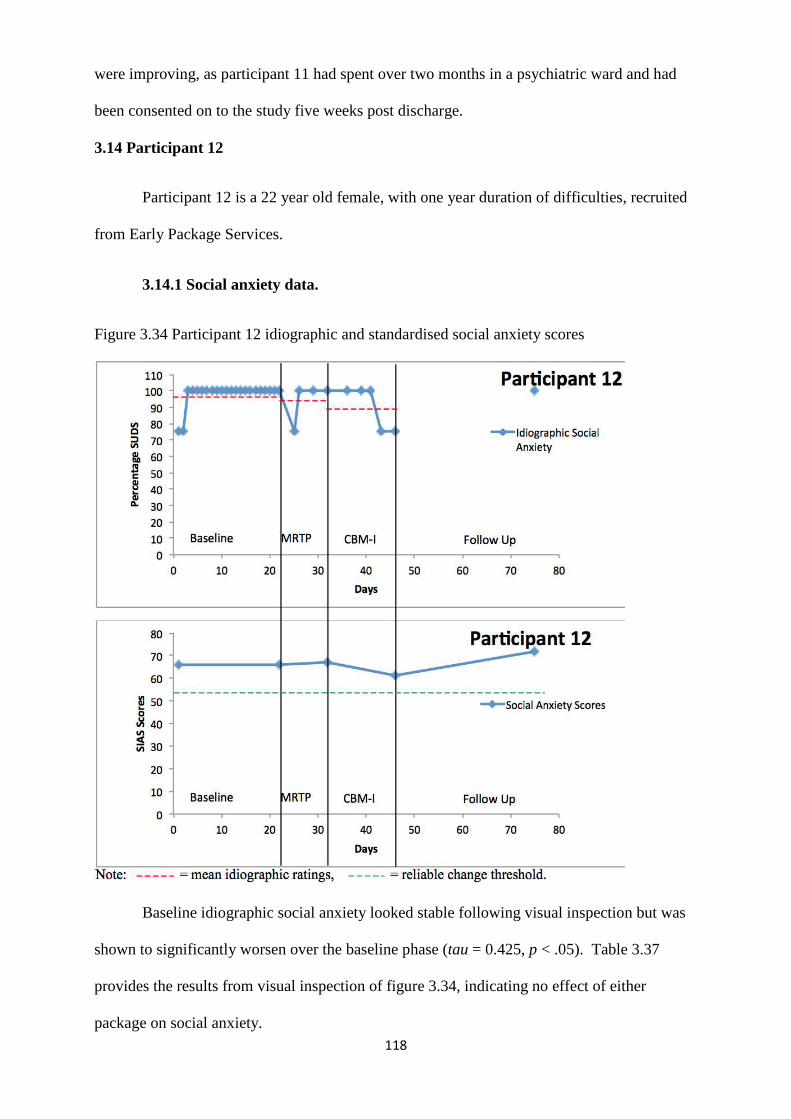
118
were improving, as participant 11 had spent over two months in a psychiatric ward and had
been consented on to the study five weeks post discharge.
3.14 Participant 12
Participant 12 is a 22 year old female, with one year duration of difficulties, recruited
from Early Package Services.
3.14.1 Social anxiety data.
Figure 3.34 Participant 12 idiographic and standardised social anxiety scores
Baseline idiographic social anxiety looked stable following visual inspection but was
shown to significantly worsen over the baseline phase (tau = 0.425, p < .05). Table 3.37
provides the results from visual inspection of figure 3.34, indicating no effect of either
package on social anxiety.
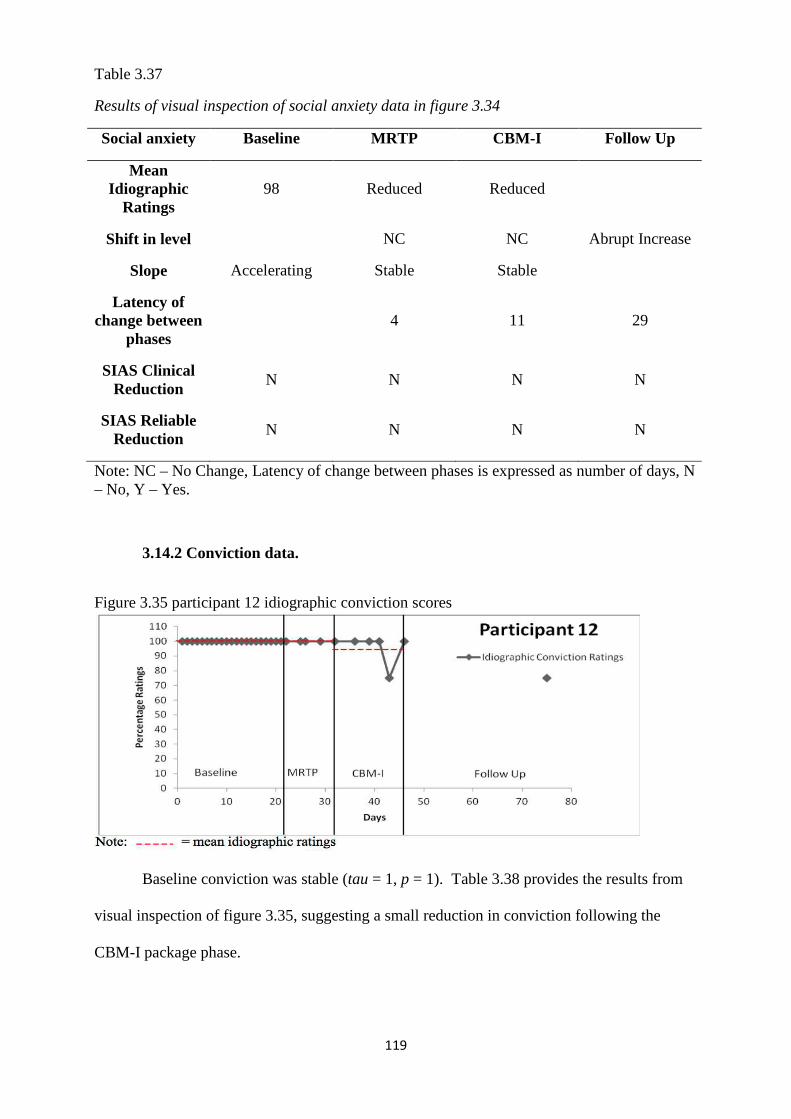
119
Table 3.37
Results of visual inspection of social anxiety data in figure 3.34
Social anxiety Baseline MRTP CBM-I Follow Up
Mean Idiographic
Ratings 98 Reduced Reduced
Shift in level NC NC Abrupt Increase
Slope Accelerating Stable Stable
Latency of change between
phases 4 11 29
SIAS Clinical Reduction
N N N N
SIAS Reliable Reduction
N N N N
Note: NC – No Change, Latency of change between phases is expressed as number of days, N – No, Y – Yes.
3.14.2 Conviction data.
Figure 3.35 participant 12 idiographic conviction scores
Baseline conviction was stable (tau = 1, p = 1). Table 3.38 provides the results from
visual inspection of figure 3.35, suggesting a small reduction in conviction following the
CBM-I package phase.
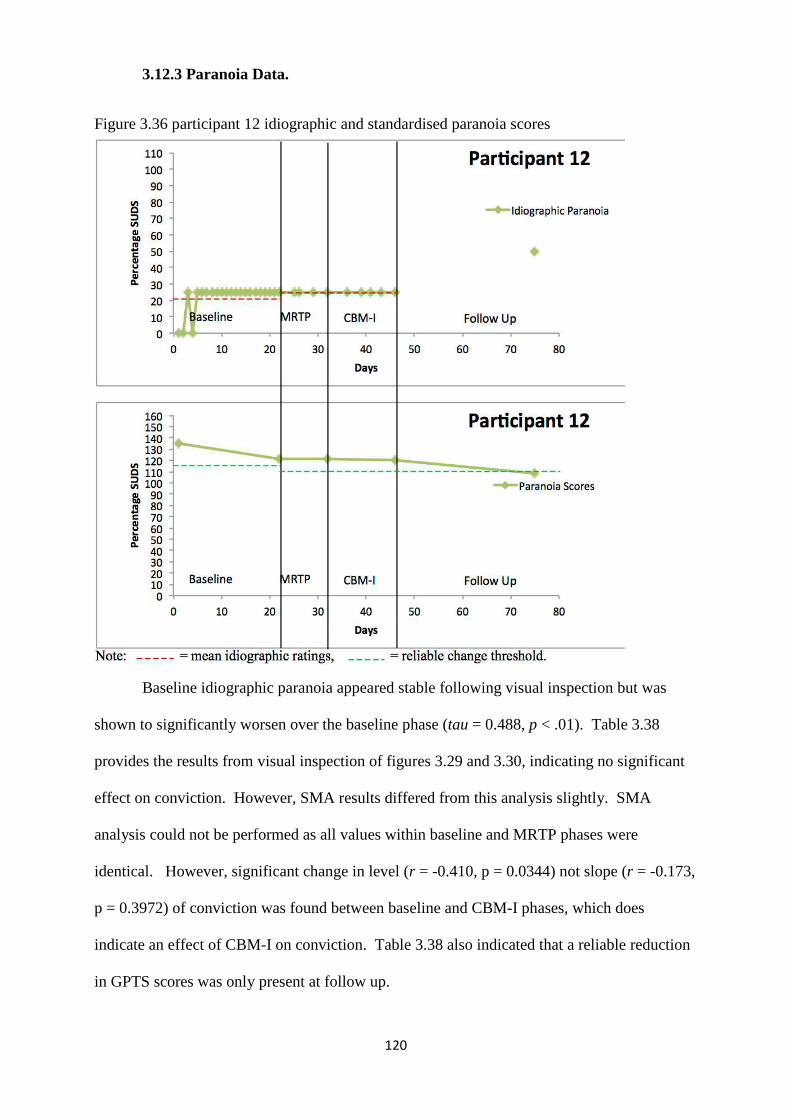
120
3.12.3 Paranoia Data.
Figure 3.36 participant 12 idiographic and standardised paranoia scores
Baseline idiographic paranoia appeared stable following visual inspection but was
shown to significantly worsen over the baseline phase (tau = 0.488, p < .01). Table 3.38
provides the results from visual inspection of figures 3.29 and 3.30, indicating no significant
effect on conviction. However, SMA results differed from this analysis slightly. SMA
analysis could not be performed as all values within baseline and MRTP phases were
identical. However, significant change in level (r = -0.410, p = 0.0344) not slope (r = -0.173,
p = 0.3972) of conviction was found between baseline and CBM-I phases, which does
indicate an effect of CBM-I on conviction. Table 3.38 also indicated that a reliable reduction
in GPTS scores was only present at follow up.

121
Table 3.38
Results of visual inspection of paranoia and conviction data in figures 3.35 and 3.36
Paranoia Baseline MRTP CBM-I Follow Up
Mean Idiographic
Ratings 21 Increase NC
Shift in level NC NC Abrupt Increase
Slope Accelerating Stable Stable
Latency of change between
phases NC NC 29
GPTS Clinical Reduction
N N N N
GPTS Reliable Reduction
N N N Y
Mean Conviction
Ratings 100 NC Decreased
Shift in level NC NC Abrupt
Slope Stable Stable Stable Stable
Latency of change between
phases NC 11 29
Note: NC – No Change, N – No, Y – Yes.
3.14.4 Reasoning data
Table 3.39
Standardised measures for participant 12
Measure B1 B2 MRTP CBM-I Follow Up 85:15 Beads
Task J J J J J
60:40 Beads Task
J J J J J
EoE 0 0 2 1 1 PBM N N Y N N
RTHC 3 2 1 1 1 Note: J – JTC, EoE – Explanations of Experiences, PBM – Possibility of being mistaken, RTHC – Reaction to Hypothetical Contradiction; 3 – rejected/dismissed contradiction, 2 – accommodated contradiction into delusion, 1 – reduced delusional conviction.
122
Table 3.39 shows that participant 12 did JTC on both tasks at all assessments. Scores
on the EoE indicate improved belief flexibility following the MRTP phase, which declined
but remained improved at follow up. PBM scores improved following the MRTP phase but
were not maintained at CBM-I and follow up. RTHC assessments indicate belief flexibility
that improved following the MRTP phase and was maintained. These results indicate that the
MRTP improved reasoning biases.
3.14.5 Participant 12 summary. Idiographic anxiety and paranoia remained stable
visually, but were shown to worsen over time according to tau calculations with very slight
reductions in both package phases. No reliable or clinically significant change in SIAS scores
occurred following either package (social anxiety remained stably high). No reliable or
clinically significant change occurred in GPTS scores following either package (paranoia
remained stably high), with a reliable decrease at follow up. Conviction ratings remained
stably high with a suggestion of a very slight decrease following CBM-I. Reasoning biases
improved following the MRTP package (EoE, PBM, RTHC) but only EoE remained
following CBM-I. JTC occurred throughout. Although idiographic and standardised
measures of social anxiety seemed to follow the same trajectory, there was marked
discrepancy between idiographic and standardised measures of paranoia. Participant 12
reported limited benefit from both packages, and struggled to leave the house, even to go to
the shops. Participant 12’s comparatively more severe presentation may partly explain the
lack of response to either package packages. Participant 12 changed from Risperidone 10mg
daily to Olanzapine 20mg daily during the baseline period, because those involved in their
care felt that the symptoms were worsening.
Following inspection of data for individual participants, the next section will collate
data from all participants and relate this to the hypotheses posed in section 2.5.
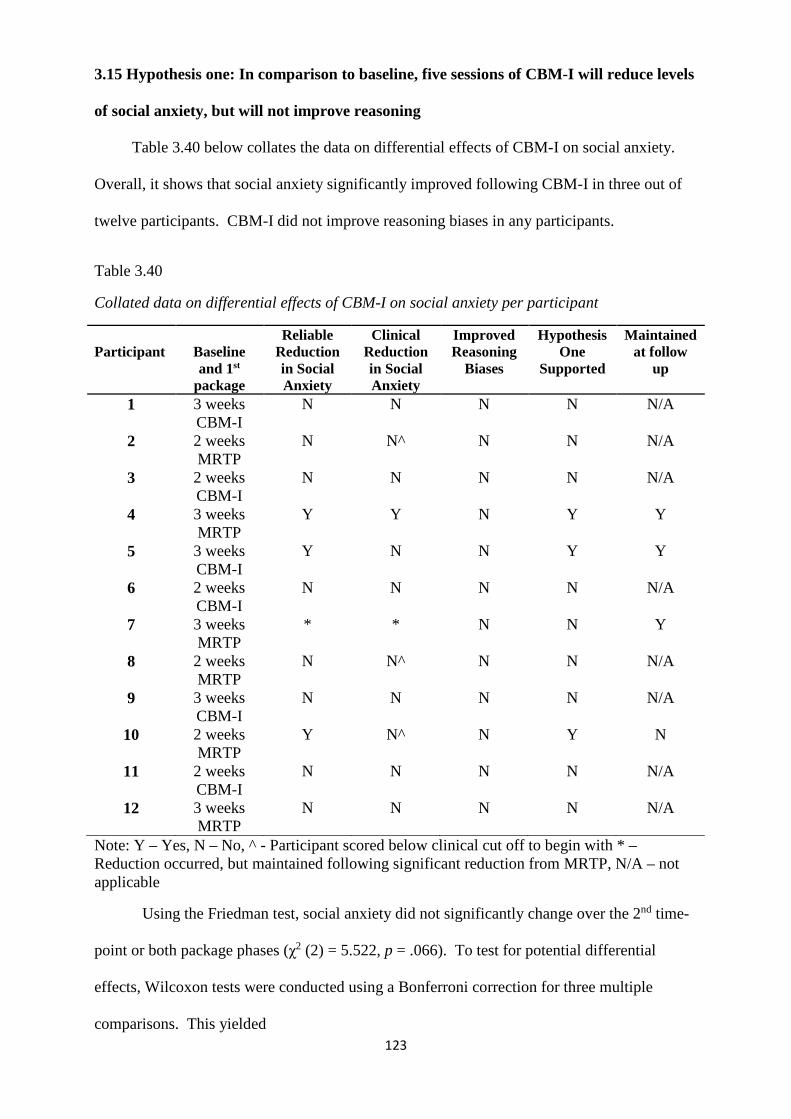
123
3.15 Hypothesis one: In comparison to baseline, five sessions of CBM-I will reduce levels
of social anxiety, but will not improve reasoning
Table 3.40 below collates the data on differential effects of CBM-I on social anxiety.
Overall, it shows that social anxiety significantly improved following CBM-I in three out of
twelve participants. CBM-I did not improve reasoning biases in any participants.
Table 3.40
Collated data on differential effects of CBM-I on social anxiety per participant
Note: Y – Yes, N – No, ^ - Participant scored below clinical cut off to begin with * – Reduction occurred, but maintained following significant reduction from MRTP, N/A – not applicable
Using the Friedman test, social anxiety did not significantly change over the 2nd time-
point or both package phases (χ2 (2) = 5.522, p = .066). To test for potential differential
effects, Wilcoxon tests were conducted using a Bonferroni correction for three multiple
comparisons. This yielded
Participant
Baseline and 1st
package
Reliable Reduction in Social Anxiety
Clinical Reduction in Social Anxiety
Improved Reasoning
Biases
Hypothesis One
Supported
Maintained at follow
up
1 3 weeks CBM-I
N N N N N/A
2 2 weeks MRTP
N N^ N N N/A
3 2 weeks CBM-I
N N N N N/A
4 3 weeks MRTP
Y Y N Y Y
5 3 weeks CBM-I
Y N N Y Y
6 2 weeks CBM-I
N N N N N/A
7 3 weeks MRTP
* * N N Y
8 2 weeks MRTP
N N^ N N N/A
9 3 weeks CBM-I
N N N N N/A
10 2 weeks MRTP
Y N^ N Y N
11 2 weeks CBM-I
N N N N N/A
12 3 weeks MRTP
N N N N N/A
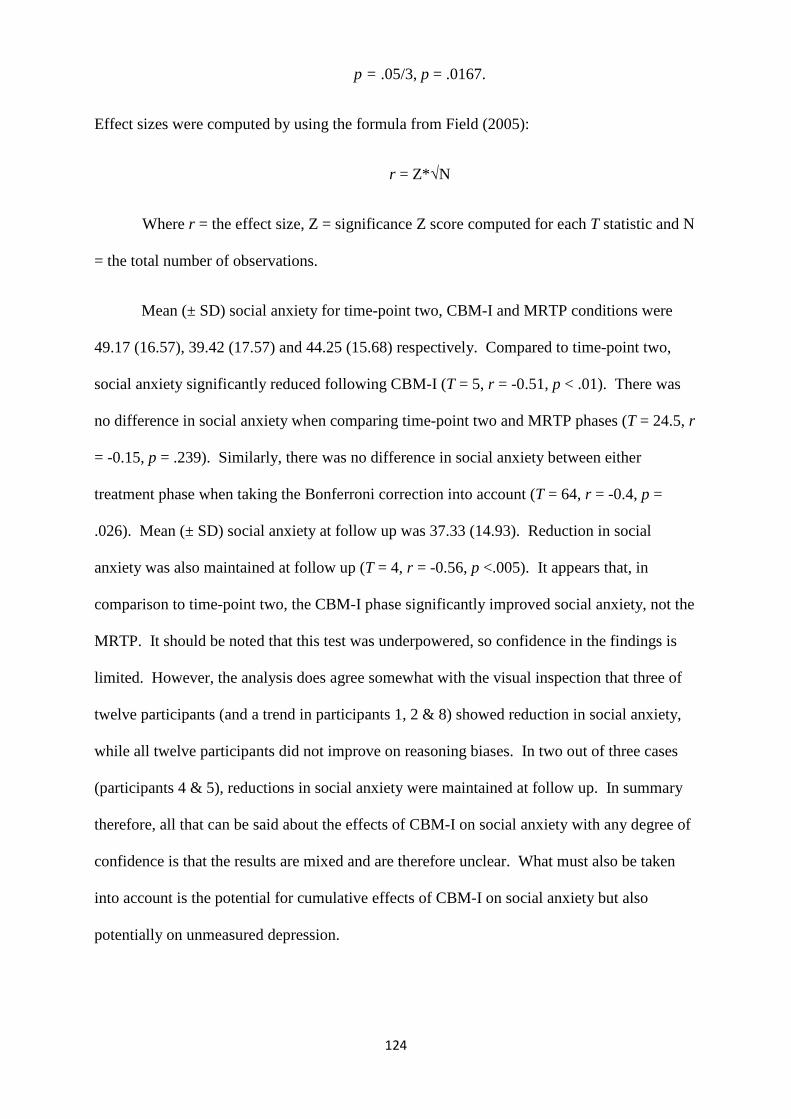
124
p = .05/3, p = .0167.
Effect sizes were computed by using the formula from Field (2005):
r = Z*√N
Where r = the effect size, Z = significance Z score computed for each T statistic and N
= the total number of observations.
Mean (± SD) social anxiety for time-point two, CBM-I and MRTP conditions were
49.17 (16.57), 39.42 (17.57) and 44.25 (15.68) respectively. Compared to time-point two,
social anxiety significantly reduced following CBM-I (T = 5, r = -0.51, p < .01). There was
no difference in social anxiety when comparing time-point two and MRTP phases (T = 24.5, r
= -0.15, p = .239). Similarly, there was no difference in social anxiety between either
treatment phase when taking the Bonferroni correction into account (T = 64, r = -0.4, p =
.026). Mean (± SD) social anxiety at follow up was 37.33 (14.93). Reduction in social
anxiety was also maintained at follow up (T = 4, r = -0.56, p <.005). It appears that, in
comparison to time-point two, the CBM-I phase significantly improved social anxiety, not the
MRTP. It should be noted that this test was underpowered, so confidence in the findings is
limited. However, the analysis does agree somewhat with the visual inspection that three of
twelve participants (and a trend in participants 1, 2 & 8) showed reduction in social anxiety,
while all twelve participants did not improve on reasoning biases. In two out of three cases
(participants 4 & 5), reductions in social anxiety were maintained at follow up. In summary
therefore, all that can be said about the effects of CBM-I on social anxiety with any degree of
confidence is that the results are mixed and are therefore unclear. What must also be taken
into account is the potential for cumulative effects of CBM-I on social anxiety but also
potentially on unmeasured depression.
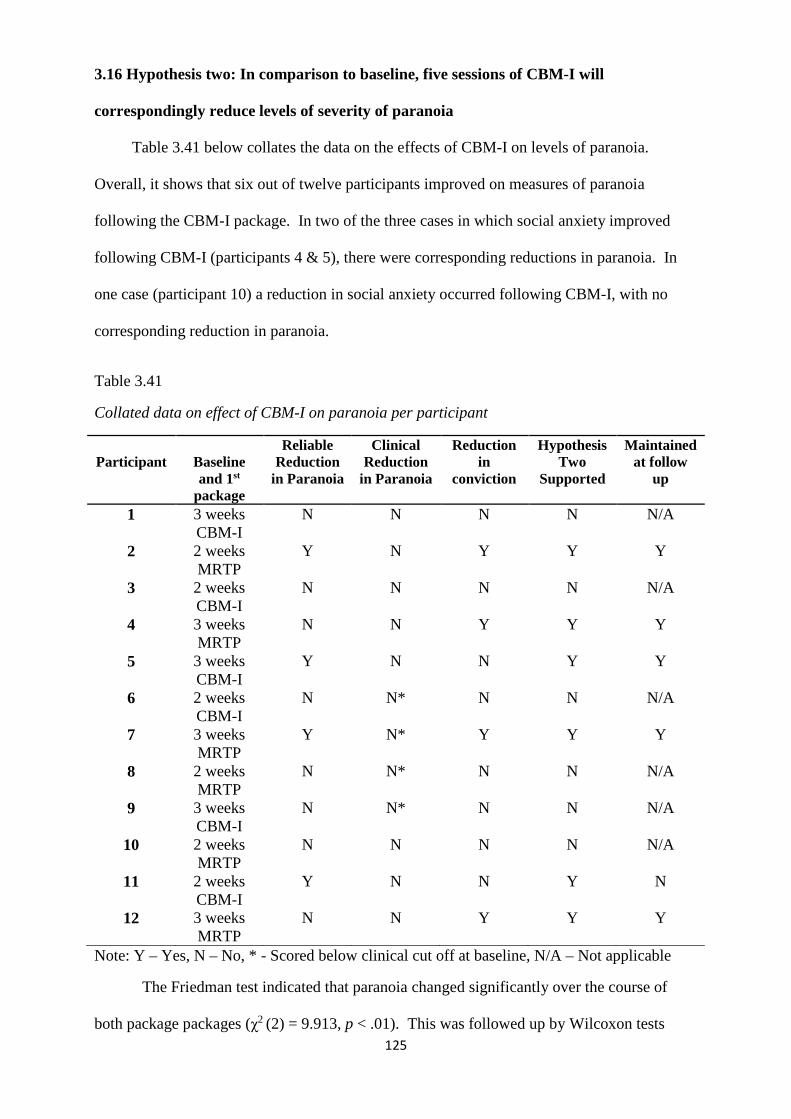
125
3.16 Hypothesis two: In comparison to baseline, five sessions of CBM-I will
correspondingly reduce levels of severity of paranoia
Table 3.41 below collates the data on the effects of CBM-I on levels of paranoia.
Overall, it shows that six out of twelve participants improved on measures of paranoia
following the CBM-I package. In two of the three cases in which social anxiety improved
following CBM-I (participants 4 & 5), there were corresponding reductions in paranoia. In
one case (participant 10) a reduction in social anxiety occurred following CBM-I, with no
corresponding reduction in paranoia.
Table 3.41
Collated data on effect of CBM-I on paranoia per participant
Note: Y – Yes, N – No, * - Scored below clinical cut off at baseline, N/A – Not applicable
The Friedman test indicated that paranoia changed significantly over the course of
both package packages (χ2 (2) = 9.913, p < .01). This was followed up by Wilcoxon tests
Participant
Baseline and 1st
package
Reliable Reduction
in Paranoia
Clinical Reduction
in Paranoia
Reduction in
conviction
Hypothesis Two
Supported
Maintained at follow
up
1 3 weeks CBM-I
N N N N N/A
2 2 weeks MRTP
Y N Y Y Y
3 2 weeks CBM-I
N N N N N/A
4 3 weeks MRTP
N N Y Y Y
5 3 weeks CBM-I
Y N N Y Y
6 2 weeks CBM-I
N N* N N N/A
7 3 weeks MRTP
Y N* Y Y Y
8 2 weeks MRTP
N N* N N N/A
9 3 weeks CBM-I
N N* N N N/A
10 2 weeks MRTP
N N N N N/A
11 2 weeks CBM-I
Y N N Y N
12 3 weeks MRTP
N N Y Y Y
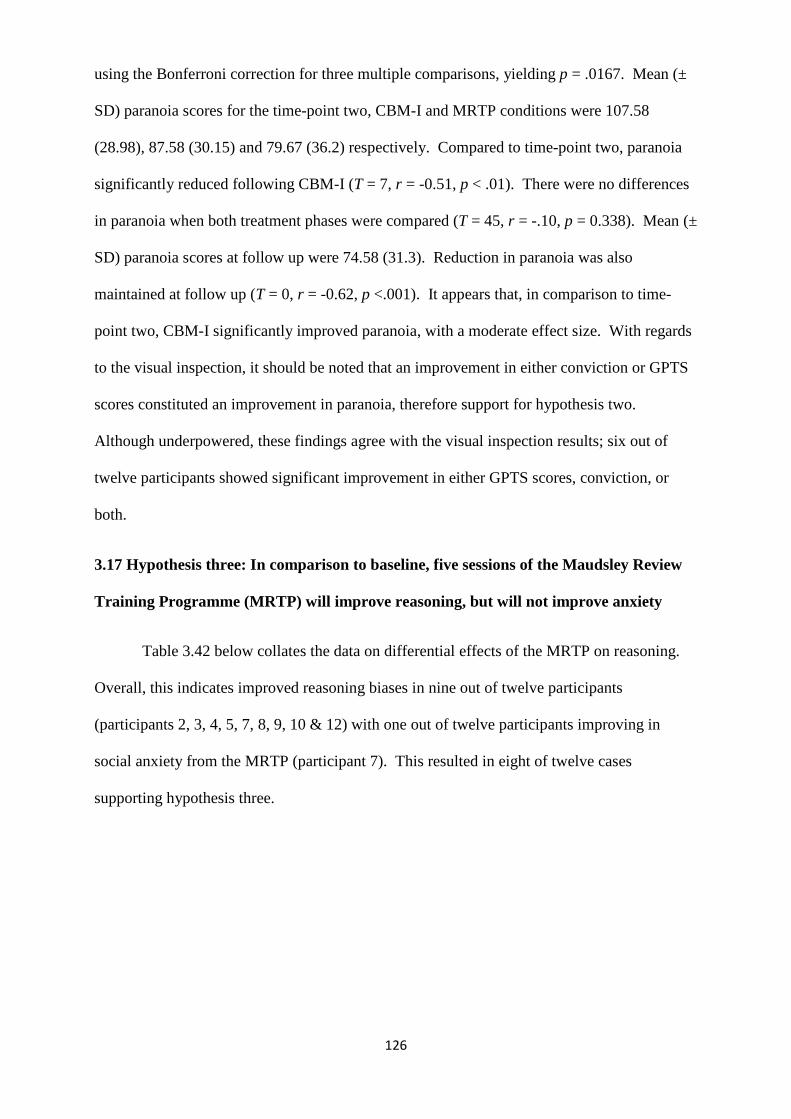
126
using the Bonferroni correction for three multiple comparisons, yielding p = .0167. Mean (±
SD) paranoia scores for the time-point two, CBM-I and MRTP conditions were 107.58
(28.98), 87.58 (30.15) and 79.67 (36.2) respectively. Compared to time-point two, paranoia
significantly reduced following CBM-I (T = 7, r = -0.51, p < .01). There were no differences
in paranoia when both treatment phases were compared (T = 45, r = -.10, p = 0.338). Mean (±
SD) paranoia scores at follow up were 74.58 (31.3). Reduction in paranoia was also
maintained at follow up (T = 0, r = -0.62, p <.001). It appears that, in comparison to time-
point two, CBM-I significantly improved paranoia, with a moderate effect size. With regards
to the visual inspection, it should be noted that an improvement in either conviction or GPTS
scores constituted an improvement in paranoia, therefore support for hypothesis two.
Although underpowered, these findings agree with the visual inspection results; six out of
twelve participants showed significant improvement in either GPTS scores, conviction, or
both.
3.17 Hypothesis three: In comparison to baseline, five sessions of the Maudsley Review
Training Programme (MRTP) will improve reasoning, but will not improve anxiety
Table 3.42 below collates the data on differential effects of the MRTP on reasoning.
Overall, this indicates improved reasoning biases in nine out of twelve participants
(participants 2, 3, 4, 5, 7, 8, 9, 10 & 12) with one out of twelve participants improving in
social anxiety from the MRTP (participant 7). This resulted in eight of twelve cases
supporting hypothesis three.
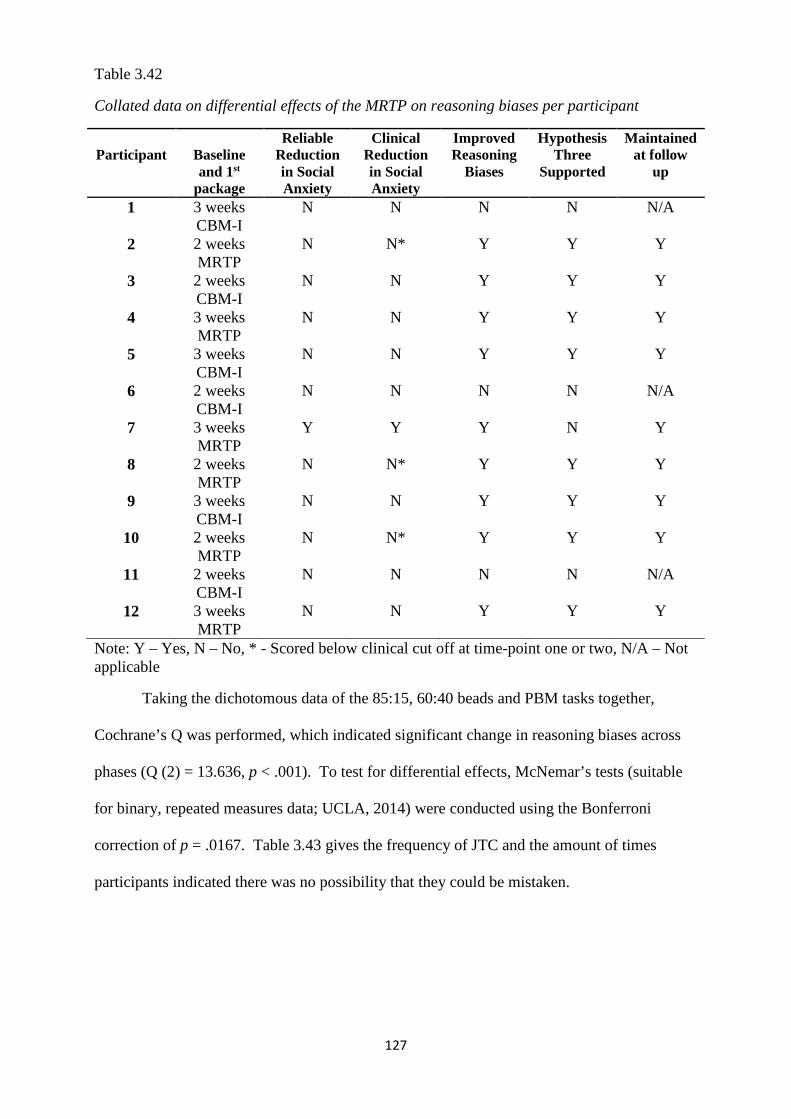
127
Table 3.42
Collated data on differential effects of the MRTP on reasoning biases per participant
Participant
Baseline and 1st
package
Reliable Reduction in Social Anxiety
Clinical Reduction in Social Anxiety
Improved Reasoning
Biases
Hypothesis Three
Supported
Maintained at follow
up
1 3 weeks CBM-I
N N N N N/A
2 2 weeks MRTP
N N* Y Y Y
3 2 weeks CBM-I
N N Y Y Y
4 3 weeks MRTP
N N Y Y Y
5 3 weeks CBM-I
N N Y Y Y
6 2 weeks CBM-I
N N N N N/A
7 3 weeks MRTP
Y Y Y N Y
8 2 weeks MRTP
N N* Y Y Y
9 3 weeks CBM-I
N N Y Y Y
10 2 weeks MRTP
N N* Y Y Y
11 2 weeks CBM-I
N N N N N/A
12 3 weeks MRTP
N N Y Y Y
Note: Y – Yes, N – No, * - Scored below clinical cut off at time-point one or two, N/A – Not applicable
Taking the dichotomous data of the 85:15, 60:40 beads and PBM tasks together,
Cochrane’s Q was performed, which indicated significant change in reasoning biases across
phases (Q (2) = 13.636, p < .001). To test for differential effects, McNemar’s tests (suitable
for binary, repeated measures data; UCLA, 2014) were conducted using the Bonferroni
correction of p = .0167. Table 3.43 gives the frequency of JTC and the amount of times
participants indicated there was no possibility that they could be mistaken.
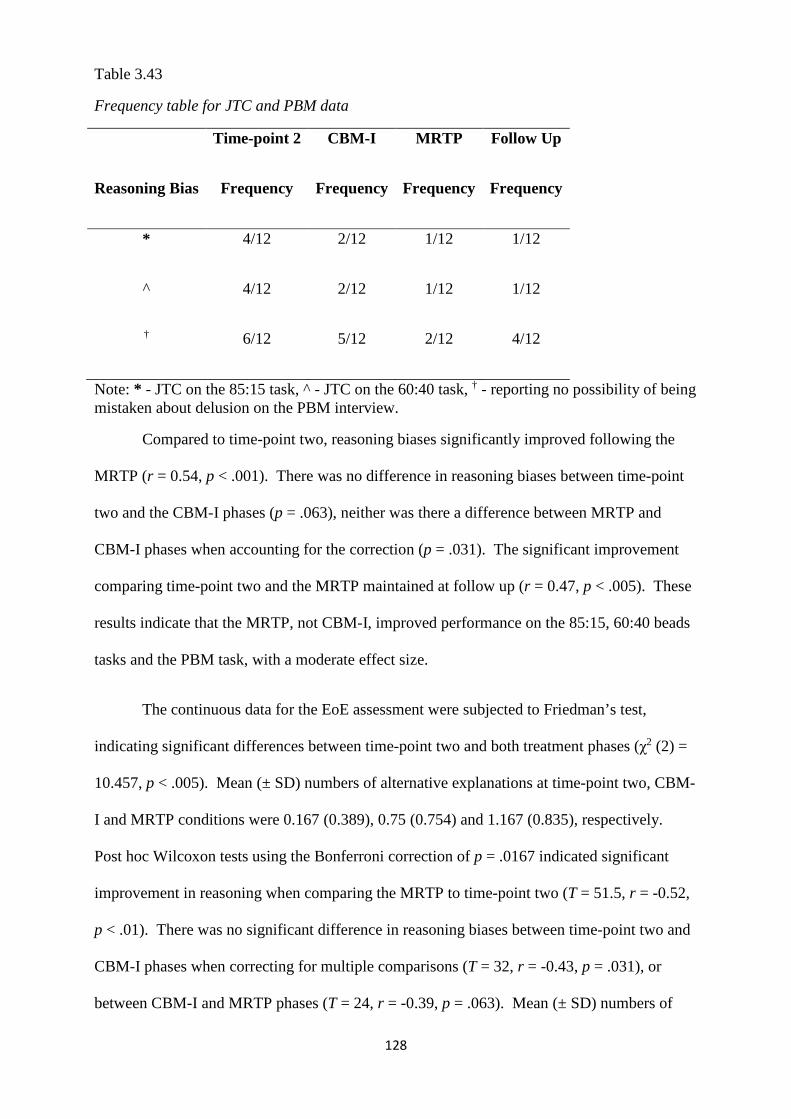
128
Table 3.43
Frequency table for JTC and PBM data
Time-point 2 CBM-I MRTP Follow Up
Reasoning Bias Frequency Frequency Frequency Frequency
* 4/12 2/12 1/12 1/12
^ 4/12 2/12 1/12 1/12
† 6/12 5/12 2/12 4/12
Note: * - JTC on the 85:15 task, ^ - JTC on the 60:40 task, † - reporting no possibility of being mistaken about delusion on the PBM interview.
Compared to time-point two, reasoning biases significantly improved following the
MRTP (r = 0.54, p < .001). There was no difference in reasoning biases between time-point
two and the CBM-I phases (p = .063), neither was there a difference between MRTP and
CBM-I phases when accounting for the correction (p = .031). The significant improvement
comparing time-point two and the MRTP maintained at follow up (r = 0.47, p < .005). These
results indicate that the MRTP, not CBM-I, improved performance on the 85:15, 60:40 beads
tasks and the PBM task, with a moderate effect size.
The continuous data for the EoE assessment were subjected to Friedman’s test,
indicating significant differences between time-point two and both treatment phases (χ2 (2) =
10.457, p < .005). Mean (± SD) numbers of alternative explanations at time-point two, CBM-
I and MRTP conditions were 0.167 (0.389), 0.75 (0.754) and 1.167 (0.835), respectively.
Post hoc Wilcoxon tests using the Bonferroni correction of p = .0167 indicated significant
improvement in reasoning when comparing the MRTP to time-point two (T = 51.5, r = -0.52,
p < .01). There was no significant difference in reasoning biases between time-point two and
CBM-I phases when correcting for multiple comparisons (T = 32, r = -0.43, p = .031), or
between CBM-I and MRTP phases (T = 24, r = -0.39, p = .063). Mean (± SD) numbers of
129
alternative explanations at follow up were 1.167 (0.835). These improvements in EoE scores
were maintained at follow up, compared to time-point two (T = 51, r = -0.46, p = .01). These
results indicate that the MRTP improved performance on the EoE assessment, not CBM-I,
with small – moderate effect sizes.
The ordinal data of the RTHC were tested using Friedman’s test, indicating no
significant differences in reasoning biases on this measure between phases (χ2 (2) = 4.750, p =
.114). Table 3.44 gives the frequency of the four different RTHC codes.
Table 3.44
Frequency table for RTHC codes
Time-point 2 CBM-I MRTP Follow Up
Code Frequency Frequency Frequency Frequency
0 0/12 1/12 3/12 4/12
1 6/12 6/12 5/12 4/12
2 5/12 4/12 3/12 3/12
3 1/12 1/12 1/12 1/12
Note: 0 – dismissed delusion, 1 – reduced delusional conviction, 2 – accommodated contradiction into delusion, 3 – rejected/dismissed contradiction.
To investigate potential differential effects, Wilcoxon’s test with the above Bonferroni
correction of p = .0167 was used, indicating no significant difference in reasoning biases
between time-point two and MRTP phases (T = 4, r = -0.55, p = .063). Similarly, there was
no difference in reasoning biases between time-point two and CBM-I phases (T = 7, r = -0.55,
p = 0.344), or between CBM-I and MRTP phases (T = 0, r = -0.5, p = 0.125). These results
indicate that neither package had any effect on reasoning biases measured by the RTHC.
130
Again, although underpowered, these results do agree with the results from visual
inspection that indicate that nine out of twelve participants improved in reasoning biases
following the MRTP, while eight of those nine participants showed no improvement in social
anxiety.
3.18 Hypothesis four: In comparison to baseline, five sessions of MRTP will result in a
corresponding reduction in paranoia
Table 3.45 below collates the data on the effects of the MRTP on levels of paranoia.
Overall, this shows that six out of twelve participants (participants 3, 4, 5, 7, 8 & 9)
experienced an improvement in paranoia from the MRTP. All of these participants also
demonstrated improvement in reasoning biases.
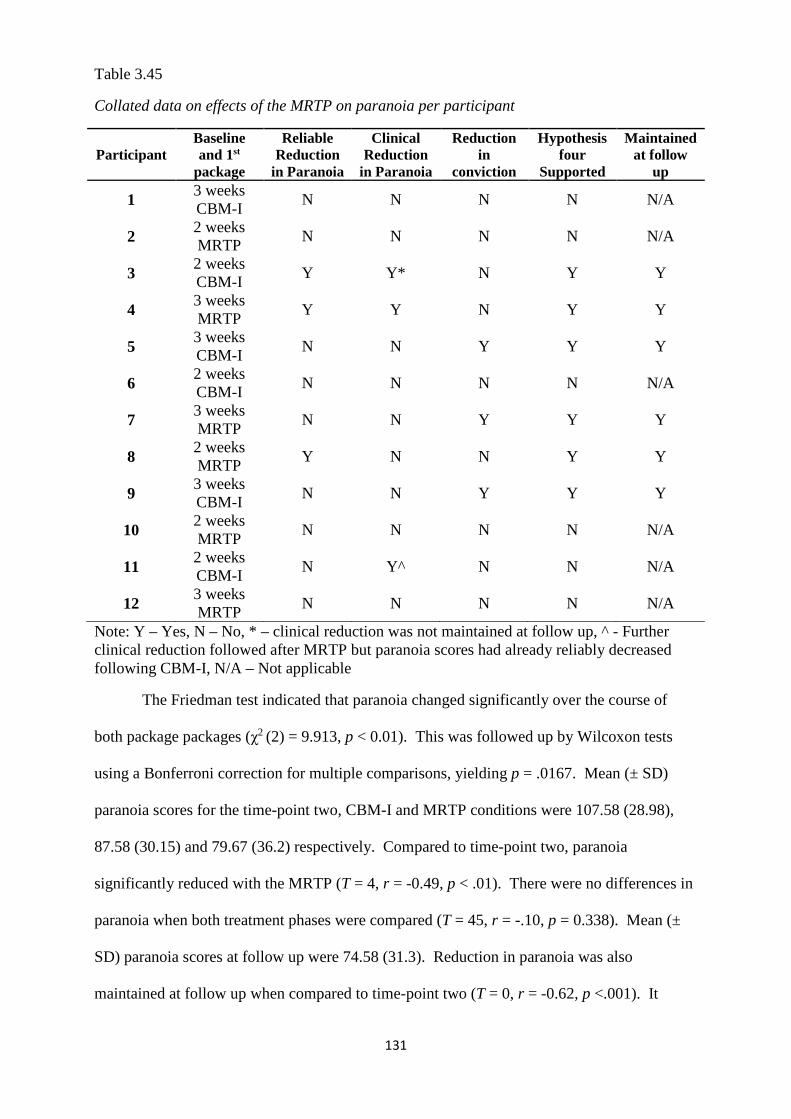
131
Table 3.45
Collated data on effects of the MRTP on paranoia per participant
Participant Baseline and 1st
package
Reliable Reduction
in Paranoia
Clinical Reduction
in Paranoia
Reduction in
conviction
Hypothesis four
Supported
Maintained at follow
up
1 3 weeks CBM-I
N N N N N/A
2 2 weeks MRTP
N N N N N/A
3 2 weeks CBM-I
Y Y* N Y Y
4 3 weeks MRTP
Y Y N Y Y
5 3 weeks CBM-I
N N Y Y Y
6 2 weeks CBM-I
N N N N N/A
7 3 weeks MRTP
N N Y Y Y
8 2 weeks MRTP
Y N N Y Y
9 3 weeks CBM-I
N N Y Y Y
10 2 weeks MRTP
N N N N N/A
11 2 weeks CBM-I
N Y^ N N N/A
12 3 weeks MRTP
N N N N N/A
Note: Y – Yes, N – No, * – clinical reduction was not maintained at follow up, ^ - Further clinical reduction followed after MRTP but paranoia scores had already reliably decreased following CBM-I, N/A – Not applicable
The Friedman test indicated that paranoia changed significantly over the course of
both package packages (χ2 (2) = 9.913, p < 0.01). This was followed up by Wilcoxon tests
using a Bonferroni correction for multiple comparisons, yielding p = .0167. Mean (± SD)
paranoia scores for the time-point two, CBM-I and MRTP conditions were 107.58 (28.98),
87.58 (30.15) and 79.67 (36.2) respectively. Compared to time-point two, paranoia
significantly reduced with the MRTP (T = 4, r = -0.49, p < .01). There were no differences in
paranoia when both treatment phases were compared (T = 45, r = -.10, p = 0.338). Mean (±
SD) paranoia scores at follow up were 74.58 (31.3). Reduction in paranoia was also
maintained at follow up when compared to time-point two (T = 0, r = -0.62, p <.001). It
132
appears that, in comparison to time-point two, the MRTP significantly improved paranoia,
with a moderate effect size.
With regards to the visual inspection, it should be noted that an improvement in either
conviction or GPTS scores constituted an improvement in paranoia, therefore support for
hypothesis four. Although underpowered, the statistical tests above agree with the visual and
statistical testing of the GPTS and conviction data; six out of twelve participants reduced in
GPTS scores, conviction, or both.
3.19 Relationship between social anxiety, reasoning biases and paranoia
Table 3.46 below outlines the relationship between improved social anxiety, improved
reasoning biases and paranoia, regardless of the package responsible.
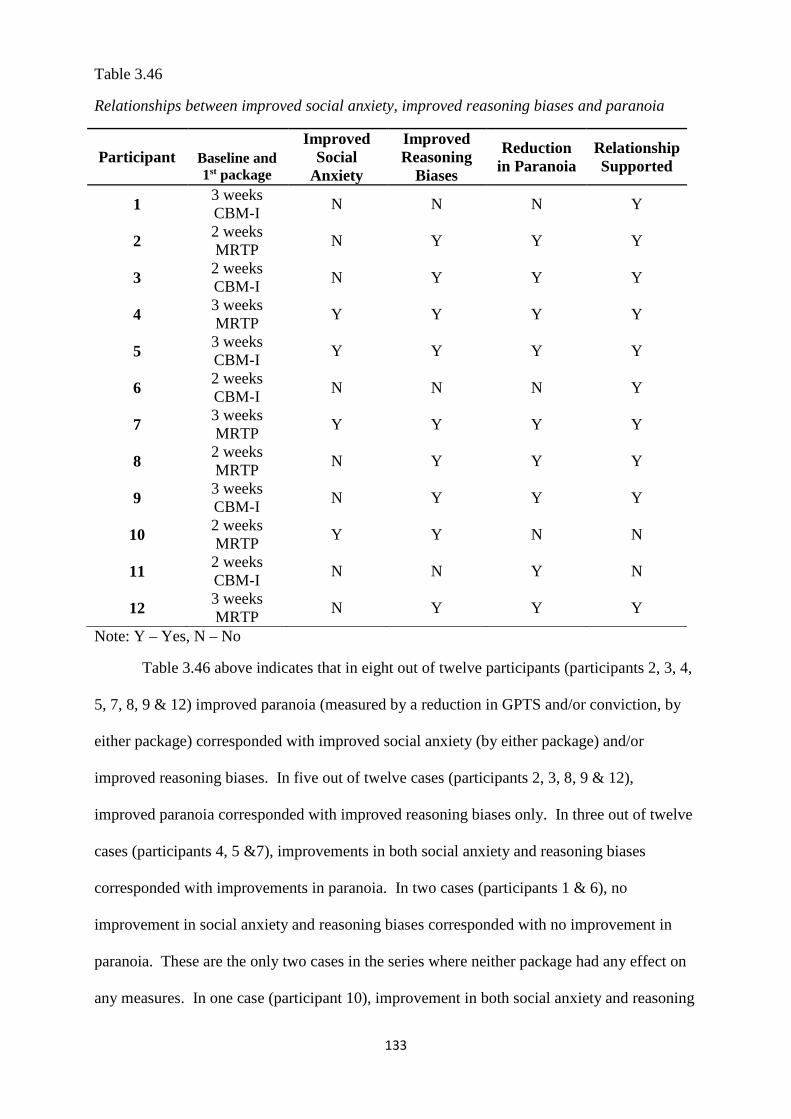
133
Table 3.46
Relationships between improved social anxiety, improved reasoning biases and paranoia
Participant
Baseline and 1st package
Improved Social
Anxiety
Improved Reasoning
Biases
Reduction in Paranoia
Relationship Supported
1 3 weeks CBM-I
N N N Y
2 2 weeks MRTP
N Y Y Y
3 2 weeks CBM-I
N Y Y Y
4 3 weeks MRTP
Y Y Y Y
5 3 weeks CBM-I
Y Y Y Y
6 2 weeks CBM-I
N N N Y
7 3 weeks MRTP
Y Y Y Y
8 2 weeks MRTP
N Y Y Y
9 3 weeks CBM-I
N Y Y Y
10 2 weeks MRTP
Y Y N N
11 2 weeks CBM-I
N N Y N
12 3 weeks MRTP
N Y Y Y
Note: Y – Yes, N – No
Table 3.46 above indicates that in eight out of twelve participants (participants 2, 3, 4,
5, 7, 8, 9 & 12) improved paranoia (measured by a reduction in GPTS and/or conviction, by
either package) corresponded with improved social anxiety (by either package) and/or
improved reasoning biases. In five out of twelve cases (participants 2, 3, 8, 9 & 12),
improved paranoia corresponded with improved reasoning biases only. In three out of twelve
cases (participants 4, 5 &7), improvements in both social anxiety and reasoning biases
corresponded with improvements in paranoia. In two cases (participants 1 & 6), no
improvement in social anxiety and reasoning biases corresponded with no improvement in
paranoia. These are the only two cases in the series where neither package had any effect on
any measures. In one case (participant 10), improvement in both social anxiety and reasoning
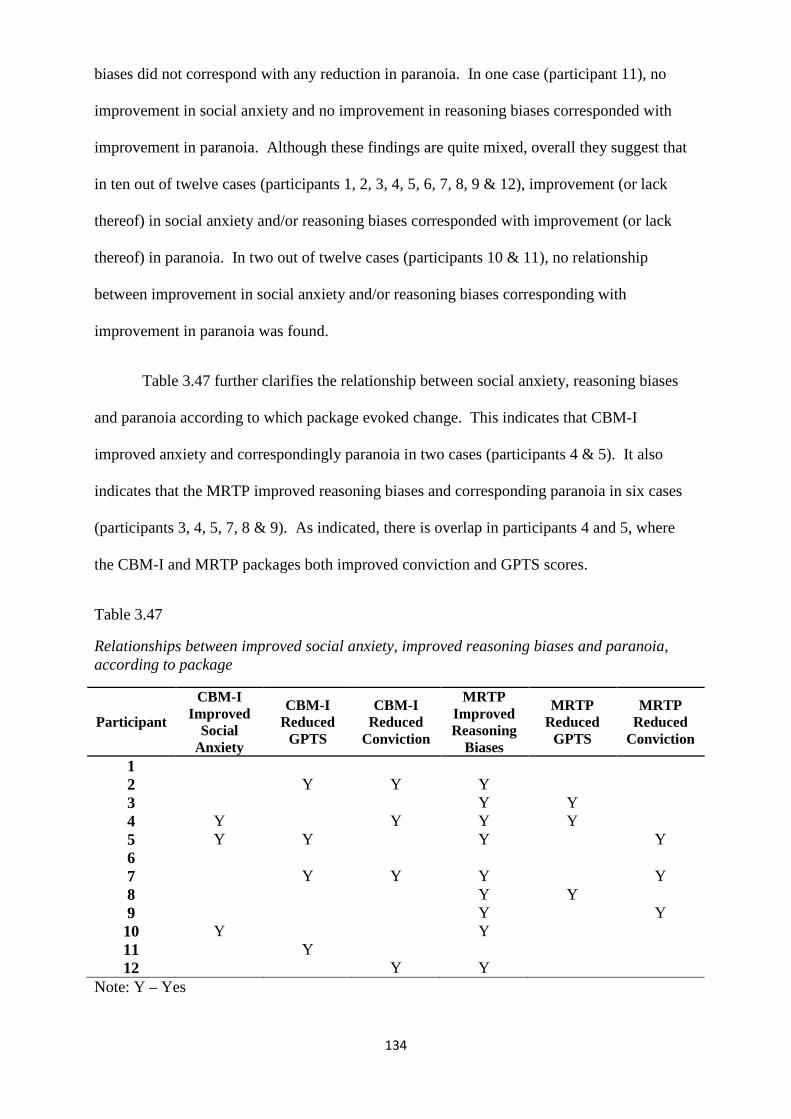
134
biases did not correspond with any reduction in paranoia. In one case (participant 11), no
improvement in social anxiety and no improvement in reasoning biases corresponded with
improvement in paranoia. Although these findings are quite mixed, overall they suggest that
in ten out of twelve cases (participants 1, 2, 3, 4, 5, 6, 7, 8, 9 & 12), improvement (or lack
thereof) in social anxiety and/or reasoning biases corresponded with improvement (or lack
thereof) in paranoia. In two out of twelve cases (participants 10 & 11), no relationship
between improvement in social anxiety and/or reasoning biases corresponding with
improvement in paranoia was found.
Table 3.47 further clarifies the relationship between social anxiety, reasoning biases
and paranoia according to which package evoked change. This indicates that CBM-I
improved anxiety and correspondingly paranoia in two cases (participants 4 & 5). It also
indicates that the MRTP improved reasoning biases and corresponding paranoia in six cases
(participants 3, 4, 5, 7, 8 & 9). As indicated, there is overlap in participants 4 and 5, where
the CBM-I and MRTP packages both improved conviction and GPTS scores.
Table 3.47
Relationships between improved social anxiety, improved reasoning biases and paranoia, according to package
Participant
CBM-I Improved
Social Anxiety
CBM-I Reduced
GPTS
CBM-I Reduced
Conviction
MRTP Improved Reasoning
Biases
MRTP Reduced
GPTS
MRTP Reduced
Conviction
1 2 Y Y Y 3 Y Y 4 Y Y Y Y 5 Y Y Y Y 6 7 Y Y Y Y 8 Y Y 9 Y Y 10 Y Y 11 Y 12 Y Y
Note: Y – Yes
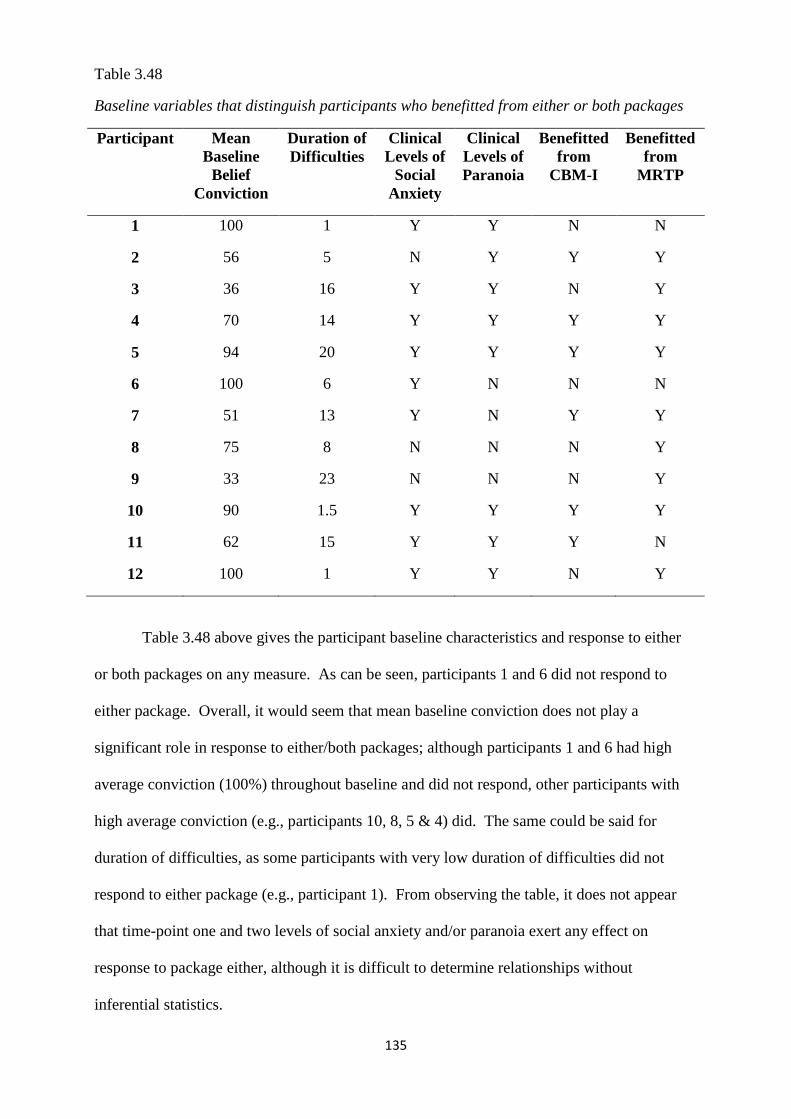
135
Table 3.48
Baseline variables that distinguish participants who benefitted from either or both packages
Participant Mean Baseline
Belief Conviction
Duration of Difficulties
Clinical Levels of
Social Anxiety
Clinical Levels of Paranoia
Benefitted from
CBM-I
Benefitted from
MRTP
1 100 1 Y Y N N
2 56 5 N Y Y Y
3 36 16 Y Y N Y
4 70 14 Y Y Y Y
5 94 20 Y Y Y Y
6 100 6 Y N N N
7 51 13 Y N Y Y
8 75 8 N N N Y
9 33 23 N N N Y
10 90 1.5 Y Y Y Y
11 62 15 Y Y Y N
12 100 1 Y Y N Y
Table 3.48 above gives the participant baseline characteristics and response to either
or both packages on any measure. As can be seen, participants 1 and 6 did not respond to
either package. Overall, it would seem that mean baseline conviction does not play a
significant role in response to either/both packages; although participants 1 and 6 had high
average conviction (100%) throughout baseline and did not respond, other participants with
high average conviction (e.g., participants 10, 8, 5 & 4) did. The same could be said for
duration of difficulties, as some participants with very low duration of difficulties did not
respond to either package (e.g., participant 1). From observing the table, it does not appear
that time-point one and two levels of social anxiety and/or paranoia exert any effect on
response to package either, although it is difficult to determine relationships without
inferential statistics.
136
3.20 Chapter conclusion
This chapter details and displays the results of the current study in ascertaining the
differential effects of both packages on social anxiety and reasoning biases as well as on
paranoia. It may be worth noting here that the overall sample reflects three individuals from
Early Intervention Services and nine from Recovery services. Although studies suggest that
samples from Early Intervention and Recovery services are different, particularly in terms of
chronicity and duration of difficulties (e.g., Singh, 2010), it is interesting to note here that the
three participants from Early Intervention (participants 1, 2 & 12) comprised two individuals
with a comparatively more severe presentation in terms of symptoms and treatment response
(participants 1 & 12) and an individual with a comparatively less severe presentation overall.
This indicates that the full sample may be considered in its entirety, without special
consideration for participants from Early Intervention, as they did not seem to exert a
differential influence over the presentation of the general sample.
Three out of twelve participants supported hypothesis one, i.e., that CBM-I would
improve social anxiety, not reasoning biases. The statistical analyses also indicated a
significant effect of CBM-I, not the MRTP, on social anxiety. Six out of twelve participants
(participants 2, 4, 5, 7, 11 & 12) supported hypothesis two, that CBM-I would improve
paranoia. This comprised four out of twelve reductions in GPTS scores, and four out of
twelve reductions in conviction, with two cases of overlap. The underpowered statistical
analyses also support this hypothesis.
Eight out of twelve participants supported hypothesis three; that the MRTP would
improve reasoning biases, not social anxiety. In one case, (participant 7) the MRTP improved
social anxiety and reasoning biases. The statistical analyses described above indicate
significant improvement of the MRTP, not CBM-I, on reasoning biases, on all measures
except the RTHC, which failed to reach significance.
137
Six out of twelve participants (3, 4, 5, 7, 8 & 9) supported hypothesis four; that the
MRTP would reduce paranoia. This comprised three out of twelve reductions in GPTS scores
(participants 3, 4 & 8) and three out of twelve reductions in conviction (participants 5, 7 & 9).
Statistical analyses outlined above also indicate a significant overall effect of the MRTP on
paranoia.
Finally, the patterns between improvement (and lack thereof) in social anxiety and/or
reasoning biases and corresponding improvement (and lack thereof) in paranoia were
investigated. A total of eight out of twelve participants demonstrated improvements in social
anxiety and/or reasoning biases that also corresponded with improvements in paranoia. Two
participants did not show any improvements in social anxiety, reasoning biases or paranoia.
One participant reported improvements in social anxiety and reasoning biases but did not
report any corresponding improvements in paranoia. One participant did not report
improvements in social anxiety or reasoning biases but did report improvements in paranoia.
These results are discussed in the next section.
138
Discussion
4.1 Chapter overview
This chapter reviews the aims of the study, and interprets and discusses the findings.
The theoretical implications are discussed with an emphasis on the literature described in the
introduction. How this study might inform clinical and service development within the NHS
is also mentioned. Future research questions are identified based on this study. Limitations
and advantages of the research are also outlined.
4.2 Aims
The main aims of this study were twofold: (1) Do CBM-I and the MRTP exert
differential effects on social anxiety, and reasoning biases? (2) Do either/both packages also
reduce paranoia? Following a review of the literature, social anxiety and reasoning biases
were implicated in the formation and maintenance of persecutory delusions (Freeman, 2007)
and may therefore be important therapeutic targets. However, the link between these
mechanisms and the potential they may play in the development and persistence of delusional
levels of paranoia are less clearly understood from the current evidence. This study aimed to
clarify any relationship between these clinical constructs.
4.3 Summary of results
Single case series designs are useful from a clinical perspective, but the small sample
sizes mean that generality of results must be conducted with caution (Kazdin, 2010). This is
particularly true for the underpowered group analyses conducted, which undermines
confidence in the findings. However, as Harrington (2013) suggests, visual inspection and
clinical/reliable change should be used in conjunction with inferential statistical tests of single
case series data. If these two independent and methodologically different analytical strategies
139
both converge on the same results, confidence in the findings and ability to generalise back to
the population may increase. With this in mind, the hypotheses will now be discussed.
4.3.1 Hypothesis one: five sessions of CBM-I will reduce levels of social anxiety,
but will not improve reasoning. In support of this hypothesis, three of twelve participants
met reliable and/or clinical reduction in social anxiety (participants 4, 5 and 10). In one of
these cases CBM-I occurred first (participant 5) and in two cases (participants 4 & 10) CBM-I
occurred after the MRTP but it was only at the point that CBM-I was introduced that
reductions in social anxiety occurred, suggesting a specific effect of CBM-I. Three
participants trended towards significantly reduced social anxiety during the CBM-I package
(participants 1, 2 & 8). Of the significant changes, two out of three participants’ reduced
social anxiety was maintained at follow up (with the exception of participant 10). There were
no reliable and/or clinical changes in the remaining six participants. It should be noted that in
some cases, (participants 2, 8 & 10) time-points one and/or two social anxiety scored below
the clinical cut off of 34 to begin with. Having said this, time-points one and/or two scores
were close to the clinical cut off, suggesting some degree of social anxiety.
All twelve participants showed no improvement in reasoning biases following CBM-I,
suggesting effects of CBM-I that were specific to social anxiety, not reasoning biases. A
change in only one quarter of participants provides only partial support for hypothesis one.
The main reason why more participants did not support hypothesis one was because there was
no reliable/clinical reduction in social anxiety: a reduction of at least 13/80 points on the
SIAS. It is possible that the reason for this is due to the study design – larger effects must be
present in each case for the analysis strategy to be able to attribute an effect to the treatment
with confidence (Kazdin, 2010). Several participants approached reliable/clinical reductions
in social anxiety, but did not meet reliable or clinical change criteria. Therefore, the statistical
tests carried out may clarify whether or not this hypothesis is supported.
140
In addition to the individual differences, group analyses also supported hypothesis
one. Although the Friedman test showed no significant change in social anxiety over the
second time-point or package phases, post hoc Wilcoxon tests showed that, compared to time-
point two, social anxiety significantly reduced following CBM-I. There was no difference in
social anxiety when comparing time-point two and MRTP phases. Reduction in social
anxiety was also maintained at follow up. However, social anxiety was still not
reliably/clinically reduced in nine out of twelve participants. Taken together, these results
indicate that CBM-I improved social anxiety but not reasoning biases, in three out of twelve
participants, with a moderate effect size overall. The findings for this hypothesis are therefore
mixed.
4.3.2 Hypothesis two: five sessions of CBM-I will correspondingly reduce levels of
severity of paranoia, compared to baseline. In support of hypothesis two, six out of twelve
participants showed clinical and/or reliable change in GPTS scores, reduced conviction, or
both following the CBM-I package (participants 2, 4, 5, 7, 11, & 12). All participants, except
participant 11, maintained their gains at follow up. Reduced paranoia due to CBM-I package
corresponded with reduced social anxiety in two cases (participants 4 & 5, not participant 10).
This means that in four cases paranoia reduced without corresponding reliable/clinical
reduction in social anxiety.
In addition to the individual differences, group analyses also supported hypothesis
two. The Friedman test indicated that paranoia changed significantly over the course of both
package packages. This was followed up by Wilcoxon tests using the Bonferroni correction.
Compared to time-point two, paranoia significantly reduced following CBM-I. There were no
differences in paranoia when both treatment phases were compared. Reduction in paranoia
was also maintained at follow up. It appears that, in comparison to time-point two, CBM-I
significantly improved paranoia, with a moderate effect size.
141
4.3.3 Hypothesis three: five sessions of the Maudsley Review Training
Programme will improve reasoning, compared to baseline, but will not improve anxiety.
Following visual inspection, nine out of twelve participants improved in reasoning biases,
although in one case (participant 7), the MRTP also improved social anxiety. Therefore, eight
out of twelve participants’ results supported hypothesis three (participants 2, 3, 4, 5, 8, 9, 10
& 12). All participants’ improvements in reasoning biases were maintained at follow up.
Several group analyses were conducted, based on type of reasoning biases data.
Cochrane’s Q revealed significant change in reasoning biases across time-point two and
package phases. To test for differential effects, McNemar’s tests were conducted using the
Bonferroni correction for multiple comparisons. Compared to time-point two, reasoning
biases significantly improved following the MRTP. There was no difference in reasoning
biases between time-point two and the CBM-I phases, neither was there a difference between
MRTP and CBM-I phases when accounting for the correction. The significant improvement
comparing time-point two and the MRTP maintained at follow up. Overall, it seems that the
MRTP improved these reasoning biases with a moderate effect size, which was maintained at
follow up.
Friedman’s test indicated significant differences in EoE data between second time-
point two and both treatment phases. Post hoc Wilcoxon tests using the Bonferroni correction
indicated significant improvement in reasoning when comparing the MRTP to time-point two.
There was no significant difference in reasoning biases between time-point two and CBM-I
phases when correcting for multiple comparisons or between CBM-I and MRTP phases.
These improvements in EoE scores maintained at follow up, compared to time-point two.
These results indicate that the MRTP improved performance on the EoE assessment, with
small – moderate effect sizes.
142
Friedman’s test indicated no significant differences in RTHC data between phases.
Post hoc Wilcoxon’s tests with the Bonferroni correction also found no significant difference
in reasoning biases between time-point two and MRTP phases, or between time-point two and
CBM-I phases. These results indicate that neither package had any effect on reasoning biases
measured by the RTHC.
Taken together, these results are suggestive of a moderate effect of the MRTP specific
to reasoning biases, not social anxiety.
4.3.4 Hypothesis four: it is expected that five sessions of the Maudsley Review
Training Programme will result in a corresponding reduction in paranoia, compared to
baseline. Following visual inspection, six of twelve participants improved in GPTS scores,
conviction or both (participants 3, 4, 5, 7, 8 & 9). All participants maintained their gains at
follow up. All of these participants also had corresponding improved reasoning biases,
attributed to the MRTP package. Three participants who reported improved reasoning biases
did not report corresponding improvement in paranoia attributed to the MRTP (participants 2,
10 & 12). Two of these did experience improved paranoia following the CBM-I package
however. Therefore, one participant (10) experienced improved reasoning biases but not
paranoia. These relationships will be discussed in greater detail below.
In terms of group analyses, the Friedman test indicated that paranoia changed
significantly over the course of both package packages. This was followed up by Wilcoxon
tests using a Bonferroni correction. Compared to time-point two, paranoia significantly
reduced with the MRTP. There were no differences in paranoia when both treatment phases
were compared. Reduction in paranoia was also maintained at follow up. It appears that, in
comparison to time-point two, the MRTP also significantly improved paranoia, with a
moderate effect size.
143
4.3.5 The relationship between baseline characteristics and response. Table 3.48
above describes time-point one and two and baseline clinical characteristics of each
participant. However, as discussed above, there does not appear to be any strong relationship
between levels of conviction, duration of difficulties, severity of social anxiety and/or
paranoia and response to either package.
4.3.6 The relationship between social anxiety, reasoning biases and paranoia.
This study was also interested in determining the relationship between these mechanisms of
persecutory delusions. As outlined in table 3.47, eight out of twelve participants showed that
an improvement in social anxiety and/or reasoning biases corresponded with improvement in
paranoia (as measured by reduced GPTS scores and/or improved conviction). Specifically,
improvement in social anxiety following CBM-I also corresponded with improvement in
paranoia following CBM-I in two cases (participants 4 & 5), not in one (participant 10).
Improvement in reasoning biases following the MRTP also corresponded with improvement
in paranoia following the MRTP in five cases (participants 2, 3, 8, 9, & 12). In one case
(participant 7), the CBM-I package improved GPTS scores and conviction, but not social
anxiety. The MRTP improved social anxiety, reasoning biases and also improved conviction.
In two cases (participants 1 & 6), did no improvements in either social anxiety or reasoning
biases correspond with no improvement in paranoia, thus supporting the idea that these
constructs may be linked. In one case (participant 10), there were improvements in both
social anxiety and reasoning biases, but no corresponding improvement in paranoia. In
another case (participant 11), the opposite occurred, where there were no improvements in
either social anxiety or reasoning biases but paranoia improved. It is interesting that in some
cases, there was overlap in improved GPTS scores and/or conviction, according to type of
package (participants 4, 5 & 7). This also suggests that change in social anxiety and/or
reasoning biases interact with change in paranoia, perhaps in a dynamic, rather than linear
fashion. Overall, ten of twelve participants supported a relationship, two of twelve did not.
144
It is also interesting to note that the underpowered inferential statistics indicated
differential effects of CBM-I on social anxiety and the MRTP on reasoning, with a
corresponding reduction in paranoia that was almost identical (both in terms of significance
and effect size) to each package. This suggests that there is, to some extent, a relationship
between these three clinical constructs, although it is difficult to clarify this any further.
These findings suggest that the Threat Anticipation Model (Freeman, 2007) has been
largely supported, in that reduction in social anxiety and/or reasoning biases will result in a
reduction in paranoia.
4.4 Theoretical implications
Although the findings should be interpreted with some caution, there are important
theoretical implications based on this study.
4.4.1 Social anxiety. Although bias modification by CBM-I was not measured, the
results support previous findings that social anxiety is at least to some extent maintained by
negative interpretative biases of socially ambiguous information that promote fear of negative
evaluation (Clark & Beck, 2010). Although not formally measured, previous research does
suggest a link between interpretation bias and social anxiety symptoms and that CBM-I exerts
moderate effect sizes in modifying these biases thereby reducing symptoms (Hallion &
Ruscio, 2011). Similar effects of CBM-I have been found in the psychosis literature also
(e.g., Turner et al., 2011). Therefore, we may be able to assume with reasonable confidence
that similar mechanisms of change may have happened in the current study. In keeping with
information processing models of social anxiety (e.g., Clark & Beck, 2010), the participants
who reported better engagement with CBM-I did tend to get more clinical benefit from it
(participants 1, 2, 4, 5 & 10), although in some instances this benefit only trended towards a
reliable reduction. This may be due to increased engagement with the task material and
greater likelihood to apply the positive interpretative modification to real-life scenarios, as
145
reported in the results chapter. Conversely, those participants who did not find the CBM-I
task helpful (participants 3, 6, 8, 9, 11 & 12) were those who tended to have a more negative
experience with it, e.g., it being patronising or repetitive, as well as being less likely to apply
a more positive interpretation in real-life situations. Considered overall, the results show
moderate yet limited support for information processing models of social anxiety.
The MRTP did not appear to significantly improve social anxiety, with the exception
of one case (participant 7). This case is interesting, because improvement in social anxiety
may have been secondary to decreased delusional conviction and paranoia, rather than direct
effects on social anxiety alone. This makes sense when the content of the delusion is
considered; a belief that they would be beaten or killed by a member of the public, were they
to go outdoors. It also makes sense given that all measures (idiographic and standardised)
improved dramatically following the first few sessions of the MRTP, which the participant
was randomised to first receive. If this explanation is the case, then the Threat Anticipation
Model (Freeman, 2007) would be supported, as relevant mechanisms of paranoia interact
under change. However, the possibility that the MRTP may have directly acted on social
anxiety can't be ruled out. This instance is difficult to tease apart with this design.
Other than in the above case, the MRTP did not have any significant effect on social
anxiety, further supporting the idea that social anxiety and reasoning biases are qualitatively
different, with different treatment profiles. The theoretical implications of this will be
discussed further in the next section.
4.4.2 Interpretation biases and reasoning biases as distinct. Although reasoning
biases have repeatedly been shown to be specific to psychosis (Garety et al., 2005; Freeman,
2007), the reason why they are specific has not been fully explained. The results of the
current study may indicate that reasoning biases and social anxiety have unique aetiology,
given their differential susceptibility to change. This fits with some of the initial literature on
146
reasoning biases, suggesting that they may be associated with neuropsychological problems,
such as working memory (Broom et al., 2007; Garety et al., 2013). Difficulties with working
memory have been shown to be more specific to psychosis, rather than social anxiety, and
have even been proposed as a potential endophenotype of psychosis (e.g., Wood et al., 2003).
Given this finding, the techniques used in the MRTP would be better suited to improve data
gathering biases, since the package encourages general strategies, empirically shown to
improve working memory, such as slowing down before making a decision, breaking down
the decision making process into more manageable parts, use of visual aids, and frequent
summarising, which all promote consolidation of material into longer term memory
(McNamara & Scott, 2001). The results of the current study show a significant effect of the
MRTP on improving reasoning biases within the sample – ten of twelve cases overall, with a
moderate effect size.
Although theoretical models have explained the causal and maintaining role
interpretation biases can play in social anxiety (e.g., Clark & Beck, 2010), the aetiology of
reasoning biases in psychosis and persecutory delusions is less clearly known at present
(Freeman, 2007). Also, there seem to be certain cognitive styles that overlap between
psychosis and social anxiety, e.g., intolerance of uncertainty (Broome et al., 2007). Due to
further research into the aetiology of data gathering biases in psychosis being needed, in-
depth discussion on how they develop is beyond the scope of the present study.
4.4.3 Support for the Threat Anticipation Model (Freeman, 2007). The second
research question was whether or not both packages would improve paranoia. The
implication would be that improvements in social anxiety and/or reasoning biases would lead
to improvements in persecutory delusions, paranoia and ideas of reference as measured by the
full GPTS scores and conviction ratings. As already outlined in previous sections, support
was found for hypothesised improvements in paranoia by both the CBM-I and MRTP
packages. Furthermore, in eight out of twelve cases, support for improvements in social
147
anxiety and/or reasoning biases corresponding with improved paranoia was found. In two
cases, no improvement in either social anxiety, reasoning biases or paranoia was found, which
does also support the model, as no change in either or both mechanisms corresponded with no
change in paranoia. In two cases, the results contradicted any relationship between social
anxiety, reasoning biases and paranoia. Considered together, the findings from the current
study give moderate support to several hypotheses that the Threat Anticipation Model
(Freeman, 2007) makes.
(1) Can it be shown that psychological factors are causal in paranoid thinking
(Freeman, 2007)? One of the potential advantages of this study was the use of specific
computerised treatments, aimed at discrete psychological styles of information processing,
using an experimental prospective design. With the exception of one or two cases that could
be argued to have been spontaneously improving (participants 2 & 3), the design of this study
established with reasonable confidence that symptoms were not on a natural path to recovery.
Therefore, experimental manipulation of psychological factors (such as interpretation and
reasoning biases) corresponding with reduction in delusional conviction and persecutory
ideation may lead to the conclusion that they are causally related.
(2) Do psychological factors interact in the development of paranoia (Freeman, 2007)?
Overall improvement in social anxiety and/or reasoning biases with a corresponding reduction
in paranoia suggests that these factors do interact in the development and maintenance of
paranoia. Some individual findings supporting this hypothesis include the fact that there was
some overlap of effects within individual cases, e.g., CBM-I and the MRTP both had
significant effects on conviction for participant 7. While CBM-I reduced social anxiety and
the MRTP improved reasoning biases in participants 4 and 5, both packages also reduced
GPTS scores and conviction in a discrete manner (see table 3.47). Similarly, the CBM-I
package induced reliable change in GPTS scores of participant 11, followed by a dramatic
148
reduction following the MRTP, which became clinically significant. The gains were not
maintained at follow up, but the results lend some support to the above hypothesis.
(3) Do processes that maintain social anxiety also serve to maintain paranoid thoughts
(Freeman, 2007)? Supporting this research question is more difficult due to lack of
interpretation bias measures; however, the results do indicate some potential relationship
between this maintaining factor and paranoia. The results of this study showed that in two
cases where clinical and/or reliable change in social anxiety occurred following CBM-I, there
was also a corresponding reduction in paranoia (participants 4 & 5). It must be noted that in
these two cases, improved reasoning biases occurred also, indicating lack of a clear, exclusive
link between interpretation bias and paranoia. Given the results, it appears that targeting
interpretation bias and social anxiety alone might not have been enough to induce reduction in
paranoia in many cases. However, it is interesting to note that group effect sizes of CBM-I on
social anxiety and paranoia were similar (T = 5, r = -0.51, p < .01 and T = 7, r = -0.51, p <
.01, respectively). Although not measured, bias modification may have occurred to an
unknown extent across the sample, which may then have reduced social anxiety and so led to
a reduction in paranoid thoughts. There were also four out of twelve cases where the CBM-I
package significantly improved delusional conviction rates, a dimensional aspect of paranoia
directly related to threat from other people. One possible explanation for this is that CBM-I
may be acting on paranoia through a mechanism other than social anxiety, due to lack of
improvement in social anxiety found. Another more likely possibility is that use of
clinical/reliable change was not sensitive enough to detect relationships between changes in
social anxiety and paranoia – increased sample size may have allowed for greater powered
analyses, e.g., mediation analysis to clarify the differential mediating roles of social anxiety
and reasoning biases and their mediating effects on paranoia.
(4) Are threat beliefs most likely to become of delusional intensity when accompanied
by data gathering biases such as JTC, or belief inflexibility (measured by EoE, PBM and
149
RTHC; Freeman, 2007)? This study has also provided experimental evidence that improving
reasoning biases led to a corresponding reduction in paranoia in six out of twelve cases
(participants 3, 4, 5, 7, 8 & 9). In two cases (participants 4 & 5), improvements with
reasoning biases occurred alongside improved social anxiety and a corresponding reduction in
paranoia. In three cases (participants 2, 10 & 12) improved reasoning biases did not
correspond with a reduction in paranoia. Improved reasoning biases corresponding with
improved ideas of reference, ideas of persecution and/or reduced delusional conviction do
suggest that presence of reasoning biases exacerbates delusional severity. Further initial
support for this relationship may be found when considering those participants whose
reasoning biases did not respond (participants 1, 6 & 11). In two out of three cases
(participants 1 & 6), neither GPTS scores nor delusional conviction improved. In one case
(participant 11), GPTS scores, not conviction improved and the GPTS scores returned to time-
points one and/or two clinical rate at follow up.
4.5 Clinical implications
The last research question asked by Freeman (2007; pp 452) is ‘can the developments
in the understanding of paranoia be used to improve treatments?’ This question raises
important ideas about how to develop clinical packages for persecutory delusions that the
results of this study may be able address to some degree. In the introduction, the limitations
of treating heterogeneous clinical phenomena found in psychosis were discussed. Potentially,
the advantages of the single-symptom approach could be extended to tailored clinical
packages depending on presentation. A clear clinical advantage is how discrete the effects of
both computerised packages have been shown to be in this study. It indicates that
mechanisms of change can be targeted relatively specifically and with a fair amount of
confidence that secondary benefits in paranoia may ensue. This study also suggests that
different packages may be indicated, depending on how the individual presents during
assessment.
150
The results of the current study, as well as other studies (Hallion & Ruscio, 2011,
Waller et al., 2011) indicate that CBM-I and the MRTP may not exert clinical effects large
enough to be used as the only means of input for individuals. However, they might prove to
be a useful adjunct to other evidence based packages, such as CBT for social anxiety (Clark &
Beck, 2010) and/or CBT for paranoid thoughts (Freeman & Garety, 2006). Use of the CBM-I
scenarios may facilitate development of behavioural experiments, which may help to decrease
isolation and begin processing of disconfirmatory information. The individual may have also
presented with some overt reasoning biases during assessment. The MRTP may help the
individual to practice some of the techniques as behavioural experiments, or between session
tasks, in keeping with the scientific theme of inquiry of the tasks themselves.
Use of computerised packages also departs from traditional CBT for psychosis in that
much of the clinical activity does not involve the client talking about past experiences, or
developing a formulation with the clinician. This may be preferable for some people, who,
for various reasons, may not wish to explore their past in great detail with another person.
Although difficult to research and subject to debate, limited evidence suggests that some
individuals with psychosis find the process of developing a formulation to not be helpful and
to actually be distressing (e.g., Chadwick, Williams & MacKenzie, 2003). A combination of
some initial computerised sessions may also be helpful for individuals who are suspicious
and/or anxious and may therefore be unwilling to engage with services in the initial stages of
therapy. As people make increased use of technology and computers in many areas of their
lives (e.g., purchases, socialising, etc.), the idea of computerised therapy delivered at home
gains merit and feasibility. It also may be seen as an attractive option for NHS trusts that are
continually striving for cost effectiveness and meeting increased demands with less financial
resources.
151
4.6 Limitations of the study
4.6.1 Study design. This study has several limitations. Although single case series
and multiple baseline designs are appropriate for initial clinical studies, there is debate about
whether or not findings from these designs can be generalised back to the populations from
which the samples came (Kazdin, 2010). As this debate is still ongoing, and due to further
limitations described below, it may be sensible to interpret the findings of this study with
caution.
Due to the repeated measures nature of single case series designs, study of more than
one package becomes difficult, due to the potential for cross-over and interaction effects.
This is particularly true for studies that use packages designed to induce lasting change in
cognitive processes, such as CBM-I and the MRTP. Although counterbalancing of treatment
does control for this effect somewhat, the design itself suffers this disadvantage. There may
have been alternative study designs better able to address the hypotheses. For example, a
group experimental design may have been more appropriate, where one group were
randomised to CBM-I and another group were randomised to the MRTP. Using comparative
statistics would probably have yielded clearer results, whereas using two different groups
would have controlled better for cross-over effects and may potentially have measured
differential effects more clearly. Although ten of twelve participants’ changes on measures of
social anxiety, reasoning biases and paranoia support a relationship between them, use of the
above group design employing multiple regression statistics could perhaps more objectively
clarify the relationship and the strength of the relationship between these mechanisms of
persecutory delusions. However, this must be balanced with the constraints of the time and
resources allocated to the study, as well as the scope of the study itself, i.e., an initial test of
theoretically driven hypotheses. The single case series design has been shown to be a good
design of initial exploration of hypotheses, which can pave the way for larger scale studies.
152
4.6.2 Discrepancy between idiographic and standardised ratings. In several cases
(participants 1, 3, 4, 5, 8, 10 & 11), the idiographic and standardised ratings of social anxiety
and/or paranoia did not follow a similar trajectory. This means that the improvement or
deterioration of symptoms captured by the high frequency idiographic data did not reflect the
scores obtained by the standardised measures. Similarly, in several cases, the idiographic
ratings did not reflect the severity of social anxiety and/or paranoia symptoms elicited using
the standardised measures (i.e., in participants 3, 5, 6, 8, 9, 10 & 12). In most cases, (with the
exception of participant 5) the idiographic social anxiety and/or paranoia data reflected a more
positive appraisal of symptoms than the score on their respective measures.
One potential explanation for this is the general nature of the idiographic measures,
e.g., the daily measure of paranoia ‘Today, I am feeling under threat from others __%,’ may
not have had direct relevance to the participants’ delusional content. Another explanation
may involve demand characteristics. This idea refers to the experimental artefact from
research participants being aware of what the researcher is investigating and changing their
responses accordingly (Orne, 1962). One particular feature of this that may be a relevant
criticism of this study is the role of the ‘good subject,’ which Orne (1962) describes as
research participants seeking to satisfy the perceived needs of the researcher. This may
explain why many of the idiographic ratings reported improved symptoms, when the
standardised measures indicated stasis, or even decline. It may also explain the discrepancy
in severity of idiographic and standardised ratings, as in many cases, the idiographic ratings
reflected less severity.
One way that the current study differs from other studies using CBM-I is that the
researcher visited the participants in person for every session, whereas other research has
promoted delivery of sessions without the researcher present (e.g., through providing
computers, or delivery via the internet; Salemink, Kindt, Rienties, & van den Hout, 2014).
This means that the potential for the researcher to give cues about the intentions of the study
153
to the participants may have helped to foster a desire for the participants to help the researcher
in their aims. This can have negative consequences for the data, as they may become skewed
in various ways, depending on what the participant believes the goal of the study is. This has
implications for interpretation of the results, and should always be borne in mind when studies
are conducted interpersonally, as opposed to remotely, e.g., via the internet.
Conversely, the idea that certain research participants were motivated to make a
positive contribution to the study could be interpreted as helpful. This indicates that at least a
certain proportion, if not all of the participants were willing to engage with all of the
assessments and multiple computer sessions fully. Research does show that individuals who
have positive expectations of therapy tend to receive the most benefit from it (the opposite has
also been shown; that low expectations may result in poorer benefit; Constantino, Ametrano
& Greenberg, 2012).
Orne (1962) identifies some ways experimenters can mitigate demand characteristics.
He notes that ‘considerable self-discipline’ is needed on the part of the investigator in order to
obtain a valid inquiry. There were some instances where the researcher tried to at least be
uniform in the information given to all research participants. For example, all research
participants read the Participant Information Sheet and had the opportunity to question it with
the researcher. The researcher also made efforts to conceal the purpose of certain parts of the
study, e.g., several research participants queried the purpose of the 85:15 and 60:40 beads
tasks. All participants were happy to continue with the tasks until after the follow up
assessment (or after dropping out of the study, if they wished), when the purposes and
hypotheses behind the tasks were explained and discussed. Although Orne (1962)
recommends deception as to the purpose of the study to avoid the participant working out
what the hypotheses might be, this would have presented some ethical difficulties in the
current study. In striving for just the opposite (clarity as to the purpose of both computerised
packages in the Participant Information Sheet without making the differential hypotheses or
154
their relationship to paranoia explicit), this study may have reduced attempts of participants to
guess at differing hypotheses, which may have idiosyncratically skewed the data (Orne,
1962). Finally, another control was to use the idiographic data to inform the analyses, but to
only attribute an effect if the standardised measures indicated this.
4.6.3 Interpretation bias. As discussed in section 1.7, social anxiety is hypothesised
to develop and be maintained by negative interpretative biases (Stopa & Clarke, 2000;
Mathews & Mackintosh, 2000). Many studies have examined the relationship between the
effects of CBM-I on reducing interpretative biases and the relationship that bias modification
has with anxiety symptoms (e.g., Salemink et al., 2014). Not measuring interpretative biases
and their relationship to social anxiety symptoms is a limitation of this study. It was decided
to assume that social anxiety symptoms would be, to some extent, explained by negative
interpretative biases and that these biases and symptoms would be amenable to modification,
in line with previous research in anxiety generally (e.g., Hallion & Ruscio, 2011) as well as
research into social anxiety in psychosis (e.g., Turner et al., 2011). Although three
participants did not meet clinical levels of social anxiety symptoms, this does not mean that
interpretation biases were not present in the sub-sample. Much research indicates presence of
interpretation biases in sub-clinical levels of anxiety (e.g., MacLeod & Cohen, 1993; Mogg et
al., 1994; Richards & French, 1992). It should also be noted that the research questions and
hypotheses did have a different focus in this study; looking at differential effects of CBM-I,
rather than replicating previous findings related to bias modification and symptom reduction.
4.6.4 Statistical analyses. Although Harrington (2013) proposes using both visual
inspection and inferential statistics to complement analysis, it must be re-iterated that all
inferential tests were underpowered, and therefore their results must be interpreted with
caution. The primary method of analysis was that of visual inspection and clinical/reliable
reductions, which did indicate mixed support for hypothesis one and modest support for all
other hypotheses. The fact that two analytical strategies, derived from different
155
methodological perspectives, seem to agree with one another may increase confidence in the
findings, however it is probably sensible to interpret these findings with caution.
4.6.5 Anomalous experiences. Anomalous experiences are the third mechanism of
paranoia implicated within the Threat Anticipation Model (Freeman, 2007) and are likely to
play an important role in the genesis of persecutory thinking, given some findings (e.g.,
Freeman, 2008). However, perceptual anomalies are difficult to describe, to measure and to
treat, given their phenomenology (Freeman, 2007). Having said this, this study may have
been improved by a third dimension of measuring and treating the distress associated with
perceptual anomalies, and determining their relationship to reductions in paranoia.
4.6.6 Qualitative observations. Although it could be argued that including
qualitative observations and comments by participants was very helpful for understanding the
data and interpreting the results on a case-by-case basis, there were limitations with this
approach also. No theoretically-driven qualitative analysis strategy was used on the data,
therefore it is possible that the included comments are misleading, biased, or skewed in other
ways. Having said this, the qualitative observations were primarily for informational
purposes only; the primary analysis of the study was that of visual inspection and
clinical/reliable change to determine effects of each package.
4.7 Advantages of the study
Despite the weaknesses outlined above, this study also has several strengths. One of
the main criticisms of the case studies in the systematic literature review was lack of sufficient
baseline length. This study employed randomly allocated baseline lengths of either two or
three weeks – without any treatment phase being longer in duration than the baseline, which is
methodologically sound for interpretation of temporal changes (Kazdin, 2010). A further
strength of this design is that, although there is the potential for carry-over effects (which
counterbalancing of treatment did address to some extent), it does still enable differential
156
effects to be explicitly tested. For example, in some cases, reasoning biases did not improve
until the MRTP was introduced, even after introduction of CBM-I, so we can be more certain
that improvements in reasoning biases are attributed to the MRTP as opposed to generic
therapeutic effects.
Another weakness of many of the studies reviewed was lack of standardisation of
treatment protocol. The CBM-I package was delivered in identically the same way across all
60 sessions, as described in the methods section. Although the MRTP encourages discussion
and participant feedback, the tasks are highly structured, with the result that many of the
discussions took similar themes. A further advantage was no participant drop out and no loss
of data. All individuals who consented to take part completed the study fully, including the
one-month follow up assessment, which means that this study does not suffer from loss to
follow up, like many research studies in psychosis. Recent studies have shown that clinician
involvement helps with engagement and outcome in self-help packages, (e.g., Cuijpers,
Donker, van Straten, Li, & Andersson, 2010). Therefore, although there are potential reasons
as to why researcher involvement may be a disadvantage, there are also clear advantages for
this approach.
4.8 Further research
Although the findings are mixed, further research into the effects of both packages in
individuals with psychosis is warranted. This study identifies some potential further research
questions. Although some support has been found for a relationship between JTC and belief
conviction for delusions of varying types (e.g., Garety et al., 2005), these findings (to the
author’s knowledge) have not yet been replicated. An experimental prospective design
manipulating change in the JTC bias would help to clarify the relationship with belief
conviction, and potentially other measures of paranoia. The results may stimulate theoretical
and clinical advances. Larger group designs as described previously could test out more
157
complicated associations, such as how does social anxiety interact with reasoning biases on
paranoia, and which mechanisms of change (if any) exert greater effect sizes on reduction of
paranoia. Alternative designs could include well powered RCTs using mediation analysis,
e.g., manipulation of social anxiety symptoms using CBM-I may clarify the relationship
between social anxiety and paranoia via a mediating variable, perhaps anomalous experiences,
as the Threat Anticipation Model (Freeman, 2007) postulates. Conversely, testing out
moderating factors would also be beneficial, e.g., would other clinical problems common to
psychosis (for instance, negative symptoms), mitigate the efficacy of the MRTP package on
reasoning biases and therefore paranoia? Studies such as this may help to refine the active
components of these packages, as mentioned in the introduction, and improve their effects.
This study has replicated other literature on the clinical efficacy of CBM-I in reducing
anxiety symptoms with small – moderate effect sizes (e.g., Hallion & Ruscio, 2011). If
further research is warranted in the application of CBM-I to samples with psychosis, then the
next step may be to test out ways of increasing its efficacy. This could be tested by trying
different modalities, such as audio (e.g., Steel et al., 2010), or visual, as well as augmentation
using behavioural components of treatment, such as in vitro computerised self-immersion or
behavioural experiments, which have been found to be effective for psychosis (Hagen &
Nordal, 2008). Clinical research may also focus on the feasibility, tolerability and clinical
gains made from incorporating the CBM-I and MRTP tasks into CBT for persecutory
delusions, with a focus on such issues as using the tasks themselves as homework, or to
generate behavioural experiments. Larger group studies would also provide more data on the
relationship between baseline clinical characteristics of participants, and response to the
computer packages. Addressing this important research question could result in tailoring the
computer packages according to presentation, which would improve efficacy. The
applicability of these tasks in group therapeutic settings may be a further innovation. Target
samples could include other clinical groups, such as individuals who comply with command
158
hallucinations, or individuals experiencing a first episode psychosis. Small-scale single case
series designs may be adequate to test out hypotheses related to these potential clinical
applications.
4.9 Conclusion
In summary, despite some methodological limitations, this study indicated that
multiple sessions of CBM-I selectively improved social anxiety, not reasoning biases, with a
moderate effect size. However, it must be noted that improvements were only significant
using underpowered statistics across the sample, with only three participants experiencing
reliable/clinical reduction. This study also showed that the MRTP improved reasoning biases,
but not social anxiety in eight out of twelve participants. These findings suggest that social
anxiety and reasoning biases may have aetiology unique from one another, although this study
could not establish this for certain. The results did indicate specificity of response to either
treatment, which holds interesting theoretical and clinical implications. Furthermore, the
relationship between improved anxiety, improved reasoning biases and a corresponding
improvement in paranoia suggests further support for the Threat Anticipation Model
(Freeman, 2007). Future research focusing on various clinical applications of these packages
may help to improve their effectiveness and potentially increase the effectiveness of CBT for
distressing psychotic symptoms.
159
References
Altman, D.G., Schulz, K.F., Moher, D., Egger, M., Davidoff, F., Elbourne, D., Gotzsche, P.C.
and Lang, T. (2001) The revised CONSORT statement for reporting randomized trials:
explanation and elaboration. Ann Intern Med, 134(8): 663-694.
Amador, X. F., Strauss, D. H., Yale, S., Gorman, J. M. & Endicott, J. (1993). The assessment
of insight in psychosis. American Journal of Psychiatry, 150, 873–879.
American Psychiatric Association. (2000). Diagnostic and Statistical Manual of Mental
Disorders (Fourth Edition, Text Revision). Washington, DC; American Psychiatric
Association.
Andreasen, N.C., Flaum, M., and Arndt, S. (1991) Positive and negative symptoms:
assessment and validity. Negative Versus Positive Schizophrenia (eds A. Marneros,
N.C. Andreasen & M.T. Tsuang), pp. 28 - 51. Springer-Verlag: Berlin, Heidelberg.
Appelbaum, P.S., Robbins, P.C., & Roth, L.H. (1999). Dimensional approach to delusions:
comparison across types and diagnoses. Am J Psychiatry, 156, 1938-1943.
Atkins, M., Burgess, A., Bottomley, C., Riccio, M. (1997). Chlorpromazine equivalents: a
consensus of opinion for both clinical and research applications. Psychiatric Bulletin,
21, 224-226.
Barker, C., Pistrang, N. & Elliott, R. (2011). Research Methods in Clinical Psychology. (2nd
Ed.) England: Wiley.
Bastien, C.H., Vallieres, A., & Morin, C.M. (2001). Validation of the insomnia severity index
as an outcome measure for insomnia research. Sleep Medicine, 2, 297-307.
Beck, A.T. and Steer, R. (1987). Beck depression inventory scoring manual. The
Psychological Corporation. New York: Harcourt (Brace & Co).
Beck, A.T., Steer, R., and Brown, G.K. (1996). Beck Depression Inventory – Second Edition
Manual. San Antonio, TX: Psychological Corporation, Harcourt, Brace.
160
Beck, A.T., Epstein, N., Brown, G., and Steer, R.A. (1988). An inventory for measuring
clinical anxiety; psychometric properties. Journal of Consulting and Clinical
Psychology, 56, 893-897.
Beck A.T., Silbersweig, D.A. (2012). Cognitive behavioral therapy for paranoia: A pilot
randomized controlled clinical trial and fMRI investigation of systems-level brain
circuit modulation. Biological Psychiatry, 71, (8): SUPPL. 1 65S-66S.
Bentall, R. P. (1994). Cognitive biases and abnormal beliefs: Towards a model of persecutory
delusions. In A. S. David &J. Cutting (Eds.), The Neuropsychology of Schizophrenia
(pp. 337–360). London: Erlbaum.
Bentall, R.P., Kinderman P. & Kaney, S. (1994). The self, attributional processes and
abnormal beliefs: towards a model of persecutory delusions. Behaviour Research and
Therapy, 34, 331-341.
Bell, V., Halligan, P.W., and Ellis, H.D. (2006). The Cardiff Anomalous Experiences Scale
(CAPS). Schizophrenia Bulletin, 32, 366-377.
Bloy S., Oliver J.E., and Morris E. (2011). Using acceptance and commitment therapy with
people with psychosis: A case study. Clinical Case Studies, 10, 347-359.
Borckardt, J.J. (2006). SMA - Version 9.9.28 -Simulation Modeling Analysis program for
short streams of time-series data (Freeware). Accessed in April 2014 on
http://clinicalresearcher.org/software.htm
Brehm, J.W. (1966). A theory of psychological reactance. New York: Academic Press.
Broome, M.R., Johns, L.C., Woolley, J.B., Tabraham, T., Brett, C., Valmaggia, L., Peters, E.,
Garety, P.A., McGuire, P.K. (2007). Delusion formation and reasoning biases in those
at clinical high risk for psychosis. The British Journal of Psychiatry, 191, 38-42.
Buchannan, A., Reed, A., Wessley, S. (1993). Acting on delusions 2: the phenomenological
correlates of acting on delusions. British Journal of Psychiatry, 163, 77-81.
161
Buckley, P. F., Miller, B. J., Lehrer, D. S., & Castle, D. J., (2009). Psychiatric comorbidities
and schizophrenia. Schizophrenia Bulletin, 35, 383-402.
Buysse, D.J., Reynolds, C.F., Monk, T.H., Berman, S.R., Kupferet, D.J. (1988). The
Pittsburgh Sleep Quality Index: a new instrument for psychiatric practice and research.
Psychiatry Research, 28, 193-213.
Chadwick, P.D.J., & Birchwood, M. (1994). The omnipotence of voices: A cognitive
approach to auditory hallucinations. British Journal of Psychiatry, 164, 190-201.
Chadwick, P., & Trower, P. (1996). Cognitive therapy for punishment paranoia: A single case
experiment. Behaviour Research and Therapy, 34 (4), 351-356.
Chadwick, P., Williams, C., & Mackenzie, J. (2003). Impact of case formulation in cognitive
behaviour therapy for psychosis. Behaviour Research and Therapy, 41, 671-680.
Chadwick, P.D.J., Trower, P., Juusti-Butler, T., & Maguire, N. (2005). Phenomenological
evidence for two types of paranoia. Psychopathology, 38, 327-333.
Chadwick, P.D.J., Hember, M., Symes, M., Peters, E., Kuipers, E. Dagnan, D. (2008).
Responding mindfully to distressing thoughts and images: evaluation of the
Southampton mindfulness questionnaire (SMQ). British Journal of Clinical Psychology,
47, 451-455.
Clark, D.A. & Beck, A.T. (2010). Cognitive theory and therapy of anxiety and depression:
convergence with neurobiological findings. Trends in Cognitive Sciences, 14, 418-424
Coentre R., & Power P. (2011). A diagnostic dilemma between psychosis and post-traumatic
stress disorder: A case report and review of the literature. Journal of Medical Case
Reports, 5, 1752-1947.
Cohen, J. (1988). Statistical power analysis for the behavioural sciences (2nd Ed.). Hilsdale,
NK: Erlbaum.
Colman, C. (2006). Oxford Dictionary of Clinical Psychology. Oxford: Oxford Press.
162
Compton, M.T., Potts, A.A., Wan, C.R., & Ionescu, D.F. (2012). Which came first, delusions
or hallucinations? An exploration of clinical differences among patients with first-
episode psychosis based on patterns of emergence of positive symptoms. Psychiatry
Research, 200, 702-707.
Conway, C. R., Bollini, A. M., Graham, B. G., Keefe, R. S. E., Schiffman, S. S., & McEvoy,
J. P. (2002). Sensory acuity and reasoning in delusional disorder. Comprehensive
Psychiatry, 43, 75−178.
Constantino, M.J., Ametrano, R.M., & Greenberg, R.P. (2012). Clinician intervention and
participant characteristics that foster adaptive patient expectations for psychotherapy
and psychotherapeutic change. Psychotherapy, 49, 557-569.
Cormac, I., Jones, C. & Campbell, C. (2002). Cognitive behaviour therapy for schizophrenia
(Cochrane Review). Cochrane Library, 2, Oxford: Software Update.
Cuijpers, P., Li, J., Hofmann, S.G., Andersson, G. (2010). Self-reported versus clinician-rated
symptoms of depression as outcome measures in psychotherapy research on depression:
A meta-analysis. Clinical Psychology Review, 30, 768-778.
Dudley, R. E., John, C. H., Young, A. W., & Over, D. E. (1997). Normal and abnormal
reasoning in people with delusions. British Journal of Clinical Psychology, 36, 243-
258.
Drake, R., Haddock, G., Tarrier, N., Bentall, R. and Lewis, S. (2007). The Psychotic
Symptom Rating Scales (PSYRATS): Their usefulness and properties in first episode
psychosis. Schizophrenia Research, 89, 119-122.
Ellett, L., Freeman, D., & Garety, P.A. (2008). The psychological effect of an urban
environment on individuals with persecutory delusions: The Camberwell Walk Study.
Schizophrenia Research, 99, 77-84.
Ellett, L. (2013). Mindfulness for paranoid beliefs: evidence from two case studies.
Behavioural and Cognitive Psychotherapy, 41, 238-242.
163
Evans, C., Mellor-Clark, J., Margison, F., Barkham, M., Audin, K., Connell, J., McGrath, G.
(2000). CORE: Clinical Outcomes in Routine Evaluation. Journal of Mental Health, 9,
247–255.
Fear, C.F., Sharp, H., & Healy, D. (1996). Cognitive processes in delusional disorders. British
Journal of Psychiatry, 168, 1-8.
Fenigstein, A., & Vanable, P.A. (1992). Paranoia and self-consciousness. Journal of
personality and social psychology, 62, 129-134.
Field, A. (2005). Discovering statistics using SPSS. (2nd Ed). Wiley: Blackwell Publishing.
Foster C., Startup H., Potts L., and Freeman D. (2010). A randomised controlled trial of a
worry package for individuals with persistent persecutory delusions. Journal of
Behavior Therapy and Experimental Psychiatry, 41 (1): 45-51
Fowler, D., Garety, P.A. and Kuipers, E. (1995). Cognitive Behaviour Therapy for Psychosis:
Theory and Practice. Chichester: Wiley.
Fowler, D. (2000). Psychological formulation of early episodes of psychosis: a cognitive
model. In M. Birchwood, D. Fowler, & C. Jackson (Eds.), Early Intervention in
Psychosis: a Guide to Concepts, Evidence and Packages (pp. 101-127). Chichester:
Wiley.
Frangos, E., Athanassenas, G., Tsitourides, S., Psilolignos, P., & Katsanou, N. (1983).
Psychotic depressive disorder. A separate entity? Journal of Affective Disorders, 5,
259−265.
Freeman D., Garety P.A., Fowler D., Kuipers E., Dunn G., Bebbington P., and Hadley C.
(1998). The London - East Anglia randomized controlled trial of cognitive-behaviour
therapy for psychosis IV: Self-esteem and persecutory delusions. British Journal of
Clinical Psychology, 37 (4): 415-430.
164
Freeman, D., & Garety, P.A. (1999). Worry, worry processes and dimensions of delusions: an
exploratory investigation of a role for anxiety processes in the maintenance of
delusional distress. Behavioural and Cognitive Psychotherapy, 27, 47-62.
Freeman, D. & Garety, P.A. (2000). Comments on the content of persecutory delusions: does
the definition need clarification? British Journal of Clinical Psychology, 39, 407-414.
Freeman, D., Garety, P. A., & Kuipers, E. (2001). Persecutory delusions: developing the
understanding of belief maintenance and emotional distress. Psychological Medicine,
31, 1293-1306.
Freeman, D., Garety, P.A., Kuipers, E., Fowler, D., Bebbington, P. (2002). A cognitive
model of persecutory delusions. British Journal of Clinical Psychology, 41, 331-347.
Freeman, D., Slater, M., Bebbington, P.E., Garety, P.A., Kuipers, E., Fowler, D., Met, A.,
Read, C. M., Jordan, J., Vinayagamoorthy, V. (2003). Can virtual reality be used to
investigate persecutory ideation? Journal of Nervous and Mental Disease, 191, 509-
514.
Freeman, D., Garety, P. A., Fowler, D., Kuipers, E., Bebbington, P. E., & Dunn, G. (2004).
Why do people with delusions fail to choose more realistic explanations for their
experiences? An empirical investigation. Journal of Consulting and Clinical
Psychology, 72, 671-680.
Freeman, D., Garety, P.A., Bebbington, P.E., Smith, B., Rollinson, R., Fowler, D., Kuipers,
E., Ray, K., Dunn, G. (2005a). Psychological investigation of the structure of paranoia
in a non-clinical population. British Journal of Psychiatry, 186, 427-435.
Freeman, D., Garety, P., Bebbington, P., Slater, M., Kuipers, E., Fowler, D., Green, C.,
Jordan, J., Ray, K., & Dunn, G., (2005b). The psychology of persecutory ideation II: A
virtual reality experimental study. Journal of Nervous and Mental Disease, 193, 309-
315.
165
Freeman, D, & Garety, P.A. (2006). Helping patients with paranoid and suspicious thoughts –
a cognitive behavioural approach. Advances in Psychiatric Treatment, 12, 404-415.
Freeman, D. (2007). Suspicious minds: the psychology of persecutory delusions. Clinical
Psychology Review, 27, 425-457.
Freeman, D., Gittins, M., Pugh, K., Antley, A., Slater, M., & Dunn, G. (2008). What makes
one person paranoid and another person anxious? The differential prediction of social
anxiety and persecutory ideation in an experimental situation. Psychological Medicine,
38, 1121-1132.
Frith, C.D. (1992). The Cognitive Neuropsychology of Schizophrenia. Hove: LEA.
Garety, PA., Hemsley, DR., & Wessely, S., 1991. Reasoning in deluded schizophrenic and
paranoid patients: Biases in performance on a probabilistic inference task. Journal of
Nervous and Mental Disease, 179, 194-201.
Garety, P.A. & Hemsley, D. R. (1994). Delusions: Investigations into the Psychology of
Delusional Reasoning. Oxford: OUP.
Garety, P.A., Fowler, D., & Kuipers, E. (2000). Cognitive-behavioural therapy for
medication-resistant symptoms. Schizophrenia Bulletin, 26, 73-86.
Garety, P. A., Freeman, D., Jolley, S., Dunn, G., Bebbington, P. E., & Fowler, D. (2005).
Reasoning, emotions and delusional conviction in psychosis. Journal of Abnormal
Psychology, 114, 373−384.
Garety, P.A., Bebbington, P., Fowler, D., Freeman, D., & Kuipers, E., 2007. Implications for
neurobiological research of cognitive models of psychosis: A theoretical paper.
Psychological Medicine, 37, 1377-1391.
Garety, P. A., Bentall, R., & Freeman, D. (2008). Research evidence of the effectiveness of
cognitive behavioural therapy for persecutory delusions: more work is needed. In D.
Freeman, R. Bentall, & P. Garety (Eds.), Persecutory Delusions; assessment, theory and
treatment. pp. 329-351. Oxford: Oxford University Press.
166
Garety, P., Joyce, E., Jolley, S., Emsley, R., Waller, H., Kuipers, E., Bebbington, P., Fowler,
D., Dunn, G., Freeman, D. (2013). Neuropsychological functioning and jumping to
conclusions in delusions. Schizophrenia Research, 150, 570-4.
Gerring, J. (2007). Case Study Research – Principles and Practice. Boston: Cambridge
University Press.
Goodwin, F., & Jamison, K. (1990). Manic-depressive illness. Oxford: Oxford University
Press.
Green, M. F., & Kinsbourne, M. (1990). Subvocal activity and auditory hallucinations: clues
for behavioural treatments? Schizophrenia Bulletin, 16, 617-625.
Green, C., Freeman, D., Kuipers, E., Bebbington, P., Fowler, D., Dunn, G., Garety, P.A.
(2007). Measuring ideas of persecution and social reference: the Green et al. Paranoid
Thoughts Scale (G-PTS). Psychological Medicine, 38 (1): 101-111.
Haddock, G., McCarron, J., Tarrier, N. and Faragher, E.B. (1999). Scales to measure
dimensions of hallucinations and delusions: the psychotic symptom rating scales
(PSYRATS). Psychological Medicine, 29, 879-889.
Hagen R., and Nordahl, H.M. (2008). Behavioral Experiments in the Treatment of Paranoid
Schizophrenia: A Single Case Study. Cognitive and Behavioral Practice, 15, 296-305.
Hallion, L.S., & Ruscio, L.M. (2011). A meta-analysis of the effect of cognitive bias
modification on anxiety and depression. Psychological Bulletin, 174, 940-58.
Harrington, M. (2013). Comparing Visual and Statistical Analysis in Single Subject Studies.
PhD Thesis, University of Rhode Island. Accessed in May 2014 on
http://digitalcommons.uri.edu/cgi/viewcontent.cgi?article=1008&context=oa_diss
Hatzipetrou, L., and Tian Po Oei. (2010). Coping with psychological distress associated to
positive symptoms of schizophrenia: A brief cognitive behavioural package. Clinical
Case Studies, 9, 339-352.
167
Heimberg, R.G., Mueller, G.P., Holt, C.S., Hope, D.A., & Liebowitz, M.R. (1992).
Assessment of anxiety in social interaction and being observed by others: The Social
Interaction Anxiety Scale and the Social Phobia Scale. Behavior Therapy, 23, 53-73.
Hepworth, C., Startup, H., & Freeman, D. (2011). Developing treatments of persistent
persecutory delusions: the impact of an emotional processing and metacognitive
awareness package. The Journal of Nervous and Mental Disease, 199, 653-658.
Holmes, E. A., Mathews, A., Dalgleish, T., & Mackintosh, B. (2006). Positive interpretation
training: Effects of mental imagery versus verbal training on positive mood. Behaviour
Therapy, 37, 237–247.
Jacobson, N.S., Follette, W.C., & Revenstorf, D. (1984). Psychotherapy outcome research:
Methods for reporting variability and evaluating clinical significance. Behaviour
Therapy, 15, 336-352.
Jauhar, S., McKenna, P.J., Radua, J., Fung, E., Salvador, R., & Laws, K.R. (2014). Cognitive-
behavioural therapy for the symptoms of schizophrenia: systematic review and meta-
analysis with examination of potential bias. British Journal of Psychiatry, 204, 20-29.
Kay, S.R., Fiszbein, A., and Opler, L.A. (1987). The Positive and Negative Syndrome Scale
(PANSS) for Schizophrenia. Schizophrenia Bulletin, 13, 261-276.
Kazdin, A.E. (2010). Single case research designs, methods for clinical and applied setting
(2nd Ed.). New York: Oxford University Press.
Key, F.A., Craske, M.G. and Reno, R.M. (2003). Anxiety-based cognitive-behavioural
therapy for paranoid beliefs. Behavior Therapy, 34, 97-115.
Kinderman, P., Kaney, S., Morley, S., & Bentall, R.P. (1992). Paranoia and the defensive
attributional style. British Journal of Medical Psychology, 65, 371-383.
Kinderman, P., & Bentall, R.P. (1996). A new measure of causal locus: The Internal, Personal
and Situational Questionnaire. Personality and Individual Differences, 20, 261-264.
168
Kinderman, P., & Bentall, R. P. (1997a). Causal attributions in paranoia and depression:
Internal, personal and situational attributions for negative events. Journal of Abnormal
Psychology, 106, 341–345.
Kinderman, P. and Bentall, R.P. (1997b). Attribution therapy for paranoid delusions: a case
study. Behavioural and Cognitive Psychotherapy, 25, 269-280.
Krstev, H., Jackson, H., & Maude, D. (1999). An investigation of attributional style in first
episode psychosis. British Journal of Clinical Psychology, 38, 181-194.
Kuipers E., Garety P., Fowler D., Dunn G., Bebbington P., Freeman D., and Hadley C.
(1998). The London - East Anglia randomized controlled trial of cognitive-behaviour
therapy for psychosis I: Effects of the treatment phase. British Journal of Psychiatry,
171, 319-327.
Kuller A.M. and Bjorgvinsson T. (2010). Cognitive behavioral therapy with a paranoid
schizophrenic patient. Clinical Case Studies, 9, 311-327.
Landa, Y., Chadwick, P., Beck, A.T., Alexeenko, L., Sheets, M., Zhu, Y., and Silbersweig,
D.A. (2011). Targeting information processing biases and social avoidance in group
cognitive behavioral therapy for paranoia: A pilot randomized controlled clinical trial.
Schizophrenia bulletin, 37 (1): 271.
Landa Y., Chadwick P., Stern E., Pan H., Alexeenko L., Zhu Y., Chen H., Sheets M., Beck
A.T., Silbersweig, D.A. (2012). Cognitive behavioral therapy for paranoia: A pilot
randomized controlled clinical trial and fMRI investigation of systems-level brain
circuit modulation. Biological Psychiatry, 71, (8): SUPPL. 1 65S-66S.
Lincoln, T.M., Lange, J., Burau, J., Exner, C., & Moritz, S. (2009). The effect of state anxiety
on paranoid ideation and jumping to conclusions. An experimental investigation.
Schizophrenia Bulletin, 36, 1140–1148.
Lovibond, S.H. and Lovibond, P.F. (1995). Manual for the depression, anxiety and stress
scales (2nd Ed). Sydney, NSW: Psychology Foundation Monograph.
169
Lyon, H.M., Kaney, S., & Bentall, R.P. (1994). The defensive function of persecutory
delusions: Evidence from attribution tasks. British Journal of Psychiatry, 164, 637-646.
MacLeod, C., & Cohen, I. L. (1993). Anxiety and the interpretation of ambiguity: a text
comprehension study. Journal of Abnormal Psychology, 102, 238–47. Retrieved from
http://www.ncbi.nlm.nih.gov/pubmed/8315136
Maher, B. A. (1974). Delusional thinking and perceptual disorder. Journal of Individual
Psychology, 30, 98-113.
Martin, J.A., & Penn, D.L. (2002). Attributional style in schizophrenia. Schizophrenia
Bulletin, 28, 131-141.
Mathews, A., & MacLeod, C. (1985). Selective Processing of threat cues in anxiety states.
Behaviour Research and Therapy, 23, 563-569.
Mathews, A., & Mackintosh, B. (2000). Induced emotional interpretation bias and anxiety.
Journal of Abnormal Psychology, 109, 602-615.
Mattick, R.P., & Clarke, J.C. (1998). Development and validation of measures of social
phobia scrutiny fear and social interaction anxiety. Behaviour Research and Therapy,
98, 455-470
McGurn, B., Starr, J.M., Topfer, J.A., Pattie, A., Whiteman, M.C., Lemmon, H.A., Whalley,
L.J., & Deary, I.J. (2004). Pronunciation of irregular words is preserved in dementia,
validating premorbid IQ estimation. Neurology, 62, 1184-1186.
McKay, R., Langdon, R., & Coltheart, M. (2005). Paranoia, persecutory delusions and
attributional biases. Psychiatry Research, 136, 233-245.
McNamara, D.S., & Scott, J.L. (2001). Working memory capacity and strategy use. Memory
and Cognition, 29, 10-17.
Meyer, T.J., Miller, M.L., Metzger, R.L., and Borkovec, T.D. (1990). Development and
validation of the Penn State Worry Questionnaire. Behaviour Research and Therapy,
28, 487-495.
170
Microsoft Corporation® 2009. Windows 7 Home Premium.
Mobini, S., Reynolds, S., and Mackintosh, B. (2013). Clinical implications of cognitive bias
modification for interpretative biases in social anxiety: an integrative literature review.
Cognitive Therapy and Research, 37, 173-182.
Mogg, K., Bradley, P, B., Miller, T., Potts, H., Glenwright, J., and Kentish, J. (1994).
Interpretation of Homophones Related to Threat: Anxiety or Response Bias Effects?
Cognitive Therapy and Research, 18, 461–477.
Moher D., Liberati A., Tetzlaff J., Altman D.G., The PRISMA Group (2009). Preferred
Reporting Items for Systematic Reviews and Meta-Analyses: The PRISMA Statement.
PLoS Med 6(6): e1000097. doi:10.1371/journal.pmed1000097
Moritz, S., Van Quaquebeke, N., & Lincoln, T. (2012). Jumping to conclusions is associated
with paranoia but not general suspiciousness: A comparison of two versions of the
probabilistic reasoning paradigm. Schizophrenia Research and Treatment,
doi:10.1155/2012/384039.
Morrison, A.P. (2004). The use of imagery in cognitive therapy for psychosis: A case
example. Memory, 12, 517-524.
Myers, E., Startup, H., and Freeman, D. (2011). Cognitive behavioural treatment of insomnia
in individuals with persecutory delusions: A pilot trial. Journal of Behaviour Therapy
and Experimental Psychiatry, 42, 330-336.
Nelson, H. E. (1982). National Adult Heading Test (NART): Test Manual. Windsor: NFER-
Nelson.
Newman-Taylor, K. and Stopa, L. (2013). The fear of others: A pilot study of social anxiety
processes in paranoia. Behavioural and Cognitive Psychotherapy, 41, 66-88.
171
Nock, M.K., Michel, B.D., & Photos, V.I. (2007). Single-case research designs. In McKay,
M.R. (Ed.) Methodological Advances and Data Analysis. Retrieved online in
September, 2014 at http://www.corwin.com/upm-data/19353_Chapter_22.pdf
Nolen-Hoeksema S, Morrow J (1991) A prospective study of depression and posttraumatic
stress symptoms after a natural disaster: The 1989 Loma Prieta earthquake. Journal of
Personality and Social Psychology, 61, 121-127.
Orne, M.T. (1962). On the social psychology of the psychological experiment: With particular
reference to demand characteristics and their implications. American Psychologist, 17,
776–783.
Orsillo, S. M. (2001). Measures for social phobia. In M.M. Antony, S.M. Orsillo & L.
Roemer, Practitioner’s guide to empirically based measures of anxiety. New York:
Kluwer Academic / Plenum Publishers.
Overall, J.E. and Gorham, D.R. (1962). The Brief Psychiatric Rating Scale. Psychological
Reports, 10, 799-812.
Peters, E. R., Joseph, S., & Garety, P.A. (1999). The assessment of delusions in normal and
psychotic populations: introducing the PDI (Peters et al. Delusions Inventory).
Schizophrenia Bulletin 25, 553–576.
Pinninti, N.R., & Datto, C.J. (2006). Cognitive Behavior Therapy and Clozapine Synergy in
an Older Adult with Schizophrenia? The American Journal of Geriatric Psychiatry, 14,
717-718.
Pishyar, R., Harris, L. M., & Menzies, R. G. (2004). Attentional bias for words and faces in
social anxiety. Anxiety, Stress, & Coping, 17, 23-36.
Psychology Software Tools, Inc. (2010). E-Prime Ver 2.0
Randall, F., Corcoran, R., Day, J.C., & Bentall, R.P. (2003). Attention, theory of mind, and
causal attributions in people with persecutory delusions. Cognitive Neuropsychiatry, 8,
287-294.
172
Richards, A., and French, C. C. (1992). An anxiety-related bias in semantic activation when
processing threat/neutral homographs. The Quarterly Journal of Experimental
Psychology Section A, 45, 503–525.
Ross, C.E. and Mirowski, J. (1983). Components of depressed mood in married men and
women: the Centre for Epidemiologic Studies’ Depression Scale. American Journal of
Epidemiology, 119, 997-1004.
Ross, K., Freeman, D., Dunn, G., & Garety, P. (2011). A randomised experimental
investigation of reasoning training for people with delusions. Schizophrenia Bulletin
37,324-33.
Salemink, E., Kindt, M., Rienties, H., & van den Hout, M. (2014). Internet-based Cognitive
Bias Modification of Interpretations in patients with anxiety disorders: A randomised
controlled trial. Journal of Behavior Therapy and Experimental Psychiatry, 45, 186-
195.
Sartorius, N., Jablensky, A., Korten, A., Ernberg, G., Anker, M., Cooper, J. E., et al. (1986).
Early manifestations and first-contact incidence of schizophrenia in different cultures.
Psychological Medicine, 16, 909−928.
Serruya, G., & Grant, P. (2009). Cognitive-behavioral therapy of delusions: mental imagery
within a goal-directed framework. Journal of Clinical Psychology, 65 (8), 791-802.
Schutters, S.I.J., Dominguez, M.D.G., Knappe, S., Lieb, R., Os, J. van, Schruers, K.R.J. &
Wittchen, H.U. (2012). The association between social phobia, social anxiety cognitions
and paranoid symptoms. Acta Psychiatrica Scandinavica, 125, 213-227.
Singh, S.P. (2010). Early intervention in psychosis. The British Journal of Psychiatry, 196,
343-345.
So, S.H., Garety, P.A., Peters, E.R., & Kapur, S., 2010. Do antipsychotics improve reasoning
biases? A review. Psychosomatic Medicine, 72, 681-93.
173
So, S. H., Freeman, D., Dunn, G., Kapur, S., Kuipers, E., Bebbington, P., Fowler, D., &
Garety, P. A. (2012). Jumping to Conclusions, a Lack of Belief Flexibility and
Delusional Conviction in Psychosis: A Longitudinal Investigation of the Structure,
Frequency, and Relatedness of Reasoning Biases. Journal of Abnormal Psychology,
121, 129 – 139.
Startup, H. (2004). Persecutory beliefs and catastrophic worry. D.ClinPsy thesis. University of
London.
Startup, H., Freeman, D., & Garety, P.A. (2007). Persecutory delusions and catastrophic
worry in psychosis: developing the understanding of delusion distress and persistence.
Behaviour Research and Therapy, 45, 523-37.
Startup, H., Freeman, D., & Garety, P.A. (2008). Jumping to conclusions and persecutory
delusions. European Psychiatry, 23, 457-459.
Steel, C., Wykes, T., Ruddle, A., Smith, G., Shah, D.M., & Holmes, D.A. (2010) Can we
harness computerised cognitive bias modification to treat anxiety in schizophrenia? A
first step highlighting the role of mental imagery. Psychiatry Research, 178, 451-455.
Stopa, L., & Clark, D. M. (2000). Social phobia and interpretation of social events. Behaviour
Research and Therapy, 38, 759-777.
Tarrier, R., & Wykes, T. (2004). Is there evidence that cognitive behaviour therapy is an
effective treatment for schizophrenia? A cautious or cautionary tale? Behaviour
Research and Therapy, 42, 1377-1401.
Trower, P., & Chadwick, P.D.J. (1995). Pathways to defence of the self: A theory of two
types of paranoia. Clinical Psychology: Science and Practice, 2, 263-278.
Turner, R., Hoppitt, L., Hodgekins, J., Wilkinson, J., Mackintosh, B., & Fowler, D. (2011).
Cognitive bias modification in the treatment of social anxiety in early psychosis: a
single case series. Behavioural and Cognitive Psychotherapy, 39, 341-347.
174
UCLA. (2014). What statistical analysis should I use? Statistical analyses using STATA.
Accessed in May 2014 on http://www.ats.ucla.edu/stat/stata/whatstat/whatstat.htm
Van Der Leeden, R. (1998). Multilevel analysis of repeated measures data. Quality and
Quantity, 32, 15-29.
Waller, H., Freeman, D., Jolley, S., Dunn, G., and Garety, P.A. (2011). Treating reasoning
biases in delusions: a pilot study of the Maudsley Review Training Programme for
individuals with persistent, high conviction delusions. Journal of behaviour therapy
and experimental psychiatry, 42, 414-421.
Wessely, S., Buchanan, A., Reed, A., Cutting, J., Everitt, B., Garety, P., & Taylor, P. J.
(1993). Acting on delusions (1): Prevalence. British Journal of Psychiatry, 163, 69–76.
Wing, J.K., Beevor, A.S., Curtis, R.H., Park, S.B., Hadden, S., Burns, A. (1998). Health of
the Nation Outcome Scales (HoNOS). Research and Development. British Journal of
Psychiatry, 172, 11-18.
Wood, S.J., Pantelis, C., Proffitt, T., Phillips, L.J., Stuart, G.W., Buchanan, J.A., Mahony, K.,
Brewer, W., Smith, D.J., McGorry, P.D. (2003). Spatial working memory ability is a
marker of risk for psychosis. Psychological Medicine, 33, 1239-1247.
Woods, S.W. (2003). Chlorpromazine equivalent doses for the newer atypical antipsychotics.
J Clin Psychiatry, 64, 663-7.
Woods, S.W. (2011). Chlorpromazine equivalent doses for atypical antipsychotics: an update
2003-2010. Accessed online in March 2014 at http://scottwilliamwoods.com
World Health Organisation, 2010. International Classification of Diseases, 10th Ed.
Accessed online in April 2014 at
http://apps.who.int/classifications/icd10/browse/2010/en#/F29
Wykes, T., Steel, C., Everitt, B., & Tarrier, N. (2008). Cognitive behaviour therapy for
schizophrenia: effect sizes, clinical models, and methodological rigor. Schizophrenia
Bulletin, 34, 523-537.

175
Zhan, S., & Ottenbacher, K.J. (2001). Single subject research designs for disability research.
Disability and rehabilitation, 23, 1-8.
Participant Information Sheet: Version 5 (16/07/2013) REC Ref: 13/EE/0134
176
Appendix 1 – Participant Information Sheet A study exploring the usefulness of computer packages designed to help with social anxiety and thinking style Participant Information Sheet Invitation Paragraph You are being invited to take part in a research study. Before you decide, it is important for you to understand why the research is being done and what it will involve. Please take time to read the following information carefully and discuss it with others or the researcher if you wish. Please ask the researcher if there is anything that is not clear or if you would like more information. Thank you for reading this. What is the purpose of the study? This study has two aims, which are explained here.
1. Many people have worries about being harmed or upset by others. These worries may make some people look at social situations in a way that increases their anxiety. One aim is to see if computer package A, known as cognitive bias modification for interpretation, helps to reduce social anxiety.
2. People who experience worries about being harmed or upset by others may also find
that they make hasty decisions in uncertain situations. The second aim is to find out if computer package B, known as the Maudsley review training programme, helps to slow down any hasty decision making.
The researchers are trying to find out if these two computer packages are useful for other people who experience similar worries about being harmed or upset by others. To find this out, you will also be invited to take part in a short interview to talk about your experiences of using computer package A. Why have I been chosen? The researcher is approaching people who have worries about being harmed or threatened in any way. We would like to include you in this study if you are aged between 18-65 years and have experienced or are experiencing psychosis, and have current worries about being harmed or threatened by others. As all of the materials used in this study are written in English, in order to take part participants will need to have sufficient English to be able to read and understand this information sheet. Unfortunately we cannot include everyone in this study. People with a learning disability or who have significant problems with drugs and alcohol will not be asked to take part. We are also not approaching people who are currently receiving psychological therapy. People for this study were selected by talking to people working in care teams. It is these people that will have first contacted you, to ensure your confidentiality. There will be 12 participants selected in this way for the study.

Participant Information Sheet: Version 5 (16/07/2013) REC Ref: 13/EE/0134
177
If you are interested in taking part, you will have an initial meeting with the researcher to talk about your current worries and see whether the study is suitable for you. More detail about this is provided below. Do I have to take part? It is up to you to decide whether or not to take part. If you do decide to take part you will be given this information sheet to keep and you will be asked to sign a consent form. If you decide to take part, you are still free to withdraw at any time and without giving a reason. A decision to withdraw at any time or a decision not to take part will not affect the care you receive in any way. If you do withdraw, the data collected up until this point may still be used. What will happen to me if I take part? If you express an interest in taking part, you will have an initial meeting with the researcher for about 30 minutes. During this meeting, the researcher will ask you about your current worries, how upsetting they are to you and how they are affecting you at the moment. This is so that you and the researcher can find out if the study is suitable for you. If it turns out that the study is not suitable, you will be thanked for your time and you will not take further part in the study. If the study is suitable and you would like to take part, you will be asked to sign a consent form. You will then be asked to fill in some questionnaires for up to 3 weeks. After this you will meet again with the researcher to start the computer-based packages. Each step of the study will now be explained in more detail: Step 1: If you agree, you can meet or speak with the researcher who will ask about your current worries and see if the research is suitable for you. Step 2: If the study is not suitable, or you do not wish to take part, you will be thanked for your time and the study will finish. Step 3: If you decide to take part, the researcher will give you a consent form to sign and keep and a calendar with a timetable of the sessions and meetings marked on it, so you can see the overall plan. Next, you will be asked to complete some short questionnaires, talk about your experiences and complete some computerised tasks. You will then be given a length of time which will be either two or three weeks. During this time you will be asked to complete three ratings, once a day. These ratings will be given to you in a booklet that you can keep during the study time, like a diary. If you would like, the researcher can contact you to remind you to fill these in. Step 4: Once the time period is over, the researcher will arrange to meet with you again. Together, you will complete the same measures that you did at the start, including the computerised tasks. The researcher will then arrange to visit you once every 3 days, to complete each computer package with you. You will start with five sessions of computer package A, followed by five sessions of computer package B, or vice versa. This means you will complete ten sessions in total, about one every three days. The dates and times of these sessions can be arranged to best suit you. Step 5: After 5 sessions, the researcher will go through the same measures you did at the beginning of the study (the same as Step 3). Step 6: After 10 sessions, the same interview and measures will be completed again (like in Step 5). Once this is finished, the researcher will arrange a time to meet with you one month later.
Participant Information Sheet: Version 5 (16/07/2013) REC Ref: 13/EE/0134
178
Step 7: During the one-month follow up period, you do not need to do anything, but can record any questions or comments for your follow up meeting if you wish. Step 8: After one month, the researcher will complete the questionnaires, interview and computerised tasks with you for the final time (same as Step 3). The researcher will also ask for your opinion on using computer programme A to see what your experiences of it were like. This interview will be tape recorded. It will be used to explore your experiences of using computer programme A and what you thought about it. You do not have to take part in this interview if you don’t want to. The interview will last about 30 minutes. All of the information will be kept secure. Step 9: You will be thanked for your time and a monetary token of £10 will be given to you. Participation in this research will last between eleven to twelve weeks, but there will be some long periods during this time when you will not need to do anything. The researcher can explain anything you want to ask about, anytime. What is the therapy being tested? This study is testing two types of computer-based therapeutic interventions. Computer package A presents you with different stories about social activities and gives you the opportunity to practice different ways of thinking about the situations. You need to read the story and fill in the missing letter from the last word of the story. You will then be asked a question about the story, before moving on to the next story. Here is one example: You arrange to have coffee with your friend. She arrives late and rushes into the café. She explains that she had found it difficult to find somewhere to [word presented with missing letter: p-rk]. [Correct word: park]. [Missing letter: a].Did you meet your friend in a café? [Correct response: Yes]. Computer package B shows you pictures and short videos of everyday events, such as sitting in a cafe, and asks you what you think about them. It breaks down the processes of how we make decisions about things. It explains how everybody jumps to conclusions about their decisions from time to time, because jumping to conclusions can be helpful, but sometimes it’s hard to come to the right decision, without all the information. There are a few different exercises and videos to practice these ideas. Expenses and payments As a thank you for taking part in this study, you will be offered £10 at the completion of the study. Unfortunately, the researcher will not be able to reimburse your travel costs; however, all visits can be conducted at a location suitable for you, including your own home if you wish. What will I have to do? If you like, you could think about whether you would be interested in taking part. If you would like to talk about this informally, please feel free to contact the researcher using the information below. If you prefer, you could wait a few days and the researcher will try to get in touch with you, by telephone if possible. At different points in time you will be asked to fill in some questionnaires, so that your progress can be monitored. During the therapy sessions, the researcher will talk to you about various way of thinking about your anxiety and guide you through a series of exercises on a computer.
Participant Information Sheet: Version 5 (16/07/2013) REC Ref: 13/EE/0134
179
We may wish to tape record some of your sessions with the researcher. This will be so that we can have a record of your experience of being involved in this study so that we can use this information to improve services for other people who have had similar experiences to you. However, if you do not feel comfortable with this, this will not happen. If you do agree to this, the tapes will be transcribed by a member of the research team and you will have the opportunity to read this transcription to make sure it is a true reflection of what was discussed. The tapes will be stored in a locked filing cabinet and destroyed at the end of the study. What are the alternatives for treatment? Alternative treatments than the ones being looked at in this study can be other talking therapies, such cognitive behavioural therapy. This therapy looks at how our thoughts, feelings and behaviours can influence how we feel about certain worries, and is available on the NHS. If you would like more information on this, please contact the researcher, using the information below. What are the possible benefits of taking part? The aim of computer package A is to help people to feel less worried and stressed about social situations. The aim of computer package B is also to help people gather more evidence about uncertain situations, which can help increase their confidence in the decision they have made about those situations. We hope that these packages will help you. The information we get from this study may help us develop packages for others who experience social anxiety and worries. What happens when the research study stops? When the research study finishes, you will receive normal care from the service you have already been in contact with, or that referred you to this research. If you chose to delay any other treatment until the study ended, the service offering this will be in contact with you. What if there is a problem? Your care co-ordinator will know how you are getting on with the study. In the unlikely event that you are upset by taking part in any research project, there are no special compensation arrangements. If you are harmed by someone’s negligence you may have grounds for legal action but you may have to pay for it. Regardless of this, if you wish to complain, or have any concerns about any aspect of the way you have been approached or treated during the course of the study, the normal National Health Service complaints procedure is available to you. In the event that you become distressed while participating in this research, please contact the researcher, your GP services or primary care contact. If this is outside of normal working hours please contact your out of hours GP service, NHS direct (0845 4647) or the Samaritans (08457 90 90 90). Will my taking part in this study be kept confidential? Yes - all information that is collected about you during the course of the research will be kept strictly confidential. If the researcher is worried about risk to yourself or others during the course of the research then some information may need to be disclosed to relevant persons. This would be discussed with you first. If you consent, the researcher will inform your GP and the team responsible for your care about your involvement in the study. The researcher will send them a very brief summary of the assessment, unless you do not wish them to do so. Research supervisors at the University of East Anglia may look at data connected to this study.
Participant Information Sheet: Version 5 (16/07/2013) REC Ref: 13/EE/0134
180
Involvement of the General Practitioner/Family Doctor (GP) If you agree, a letter informing your GP about your involvement in this study will be sent. This is not necessary however, and if you would prefer that a letter is not sent, it will not be. Your consent to send a letter will be on the consent form. Where and how long will records be stored? Data will be stored in locked cabinets in local health care or university premises. It will be kept for ten years after the completion of the study and then destroyed. What will happen to the results of the research study? The results of the study will be reported as anonymous data. The study will be seen by colleagues and supervisors at the University of East Anglia, and other members of the research team. Results may also become available more publicly if the research is published, however no identifiable material will be published. Who is organising and funding the research? The study has been designed by James Hurley (Trainee Clinical Psychologist at the University of East Anglia), and his research supervisors. The research is being carried out as part of training for a Doctorate in Clinical Psychology. Who has reviewed the study? The research has been considered and approved by the NHS Research Ethics Committee. The research has also been reviewed and approved by the University of East Anglia. Contact for further information: If you would like any more information about the study or need to contact the researcher, please feel free to contact James Hurley (Trainee Clinical Psychologist): Doctoral Programme in Clinical Psychology University of East Anglia Elizabeth Fry Building Norwich Norfolk NR4 7TJ Tel: 07585203167 Email: [email protected] Alternatively, you could contact Dr Jo Hodgekins Clinical Lecturer Doctoral Programme in Clinical Psychology Department of Clinical Psychology Norwich Medical School University of East Anglia Norwich NR4 7TJ Tel: +44 (0)1603 59 1890 Email: [email protected] For independent advice on participating in research, you can also contact your local Patient Advice and Liaison Service (PALS) at NSFT, Drayton High Road, Hellesdon, NR6 5BE or telephone 01603 421421.
Participant Consent Form: Version 3 (16/07/2013) REC Ref: 13/EE/0134
Appendix 2 – Participant Information Sheet Cover Letter
Mr James Hurley, Trainee Clinical Psychologist
Doctoral Programme in Clinical Psychology
University of East Anglia
Elizabeth Fry Building
Norwich
Norfolk
NR4 7TJ
Tel: XXXXXXXXXXX
Email: [email protected]
[Participant Name]
[Participant Address]
[Date]
Dear [Participant Name],
Re: A study exploring the usefulness of computer packages designed to help with social anxiety and thinking style
I am writing to invite you to take part in a research study being conducted as part of my clinical psychology
training at the University of East Anglia. I received your name, address and telephone number from
[Contact Name and Position] who has already spoken to you briefly about taking part in this study.
Please find enclosed a participant information sheet, which explains the study and what would be involved
for you if you decide to take part.
Your participation in this study would be greatly appreciated.
If you have any questions or would like to discuss any aspects of the research study, please do not hesitate
to contact me. I will be contacting you by telephone in a few days to see if you might be interested.
Best wishes,
__________________
James Hurley
Trainee Clinical Psychologist
Participant Consent Form: Version 3 (16/07/2013) REC Ref: 13/EE/0134
Appendix 3 – Informed Consent Form
Centre Number:
Study Number:
Participant Identification Number for this study:
CONSENT FORM
Title of Project: A study exploring the usefulness of computer packages designed to help with social anxiety and thinking style
Name of Researcher: James Hurley
Please initial box
1. I confirm that I have read and understand the information sheet dated 16/07/13 (version 3) for the above study. I have had the opportunity to consider the information, ask questions and have had these answered satisfactorily.
2. I understand that participation is voluntary and that I am free to withdraw at any time without giving any reason, without my medical care or legal rights being affected.
3. I understand that relevant sections of my medical notes and data collected during the study may be looked at by the researcher, from regulatory authorities or from the NHS trust, where it is relevant to my taking part in this research. I give permission for these individuals to have access to my records.
Participant Consent Form: Version 3 (16/07/2013) REC Ref: 13/EE/0134
4. If I withdraw/am withdrawn from the study, I am willing for information that I have provided during the course of the study to be used for research purposes, as stated in the information sheet dated 16/07/13 (version 3).
5. I agree to my GP and care team/clinician involved in my care to be informed of my participation and completion of this project, and for assessment information to be shared with my GP and care team.
6. I give my consent for a qualitative semi-structured interview and for a recording of this to be made. I understand that this is for the purposes of transcribing information, and that any person hearing the tape(s) will sign a declaration of confidentiality and that recordings will be stored under locked conditions.
7. I agree to take part in the above study.
_______________________ ________________ ____________________
Name of Participant Date Signature
_________________________ ________________ ____________________
Name of Person taking consent Date Signature

Validated Questionnaires v1 (15/10/2012) REC Ref 13/EE/0134
Appendix 4 – Copies of all measures to be used
CHORD SUPERFLUOUS ACHE SIMILE DEPOT BANAL AISLE QUADRUPED BOUQUET CELLIST PSALM FAÇADE CAPON ZEALOT DENY DRACHM NAUSEA AEON DEBT PLACEBO COURTEOUS ABSTEMIOUS RAREFY DÉTENTE EQUIVOCAL IDYLL NAÏVE PUERPERAL CATACOMB AVER GAOLED GAUCHE THYME TOPIARY HEIR LEVIATHAN RADIX BEATIFY ASSIGNATE PRELATE HIATUS SIDEREAL SUBTLE DEMESNE PROCREATE SYNCOPE GIST LABILE GOUGE CAMPANILE

Validated Questionnaires v1 (15/10/2012) REC Ref 13/EE/0134
Appendix 4 - Measures
PSYRATS PART B Delusions 1 Amount of preoccupation with delusions 0 No delusions, or delusions which the subject thinks about less than once a week 1 Subject thinks about beliefs at least once a week 2 Subject thinks about beliefs at least once a day 3 Subject thinks about beliefs at least once an hour 4 Subject thinks about delusions continuously or almost continuously 2 Duration of preoccupation with delusions 0 No delusions 1 Thoughts about beliefs last for a few seconds, e.g. fleeting thoughts 2 Thoughts about delusions last for several minutes 3 Thoughts about delusions last for at least 1 hour 4 Thoughts about delusions usually last for hours at a time 3 Conviction 0 No conviction at all 1 Very little conviction in reality of beliefs, <10% 2 Some doubts relating to conviction in beliefs, between 10-49% 3 Conviction in belief is very strong, between 50-99% 4 Conviction is 100% 4 Amount of distress 0 Beliefs never cause distress 1 Beliefs cause distress on the minority of occasions 2 Beliefs cause distress on <50% of occasions 3 Beliefs cause distress on the majority of occasions when they occur between 50-99% of time 4 Beliefs always cause distress when they occur 5 Intensity of distress 0 No distress 1 Beliefs cause slight distress 2 Beliefs cause moderate distress 3 Beliefs cause marked distress 4 Beliefs cause extreme distress, could not be worse 6 Disruption to life caused by beliefs 0 No disruption to life, able to maintain independent living with no problems in daily living skills. Able to maintain social and family relationships (if present). 1 Beliefs cause minimal amount of disruption to life, e.g. interferes with concentration although able to maintain daytime activity and social and family relationships and be able to maintain independent living without support 2 Beliefs cause moderate amount of disruption to life causing some disturbance to daytime activity and/or family or social activities. The patient is not in hospital although may live in supported accommodation or receive additional help with daily living skills 3 Beliefs cause severe disruption to life so that hospitalisation is usually necessary. The patient is able to maintain some daily activities, self-care and relationships while in hospital. The patient may be also be in supported accommodation but experiencing severe disruption of life in terms of activities, daily living skills and/or relationships 4 Beliefs cause complete disruption of daily life requiring hospitalization. The patient is unable to maintain any daily activities and social relationships. Self-care is also severely disrupted

Validated Questionnaires v1 (15/10/2012) REC Ref 13/EE/0134
Appendix 4 - Measures
Explanations of Experiences
We’ve talked a bit about the things that led you to conclude…………You talked about…………that happened at the start and…………that has happened since. Asking you to think about it now can you think of any other explanations for the experiences that you have described? Are there any other reasons—other than…………that could possibly account for these experiences even if you think they are very unlikely?
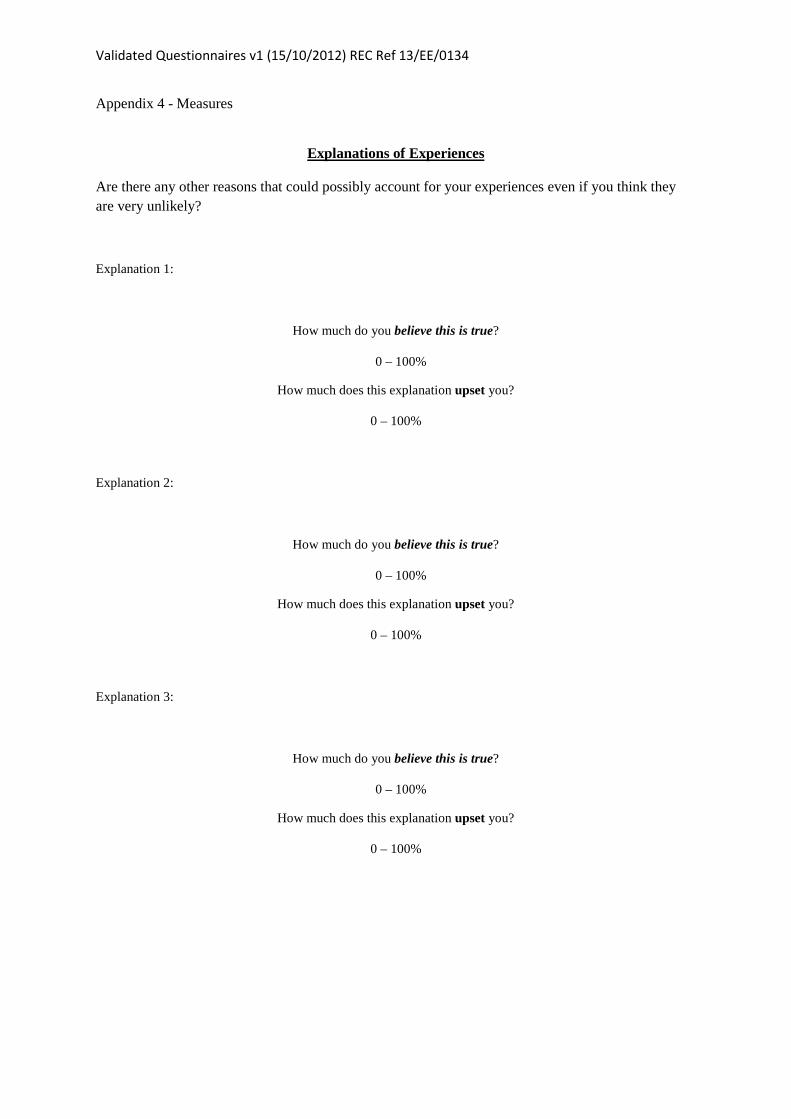
Validated Questionnaires v1 (15/10/2012) REC Ref 13/EE/0134
Appendix 4 - Measures
Explanations of Experiences
Are there any other reasons that could possibly account for your experiences even if you think they are very unlikely?
Explanation 1:
How much do you believe this is true?
0 – 100%
How much does this explanation upset you?
0 – 100%
Explanation 2:
How much do you believe this is true?
0 – 100%
How much does this explanation upset you?
0 – 100%
Explanation 3:
How much do you believe this is true?
0 – 100%
How much does this explanation upset you?
0 – 100%
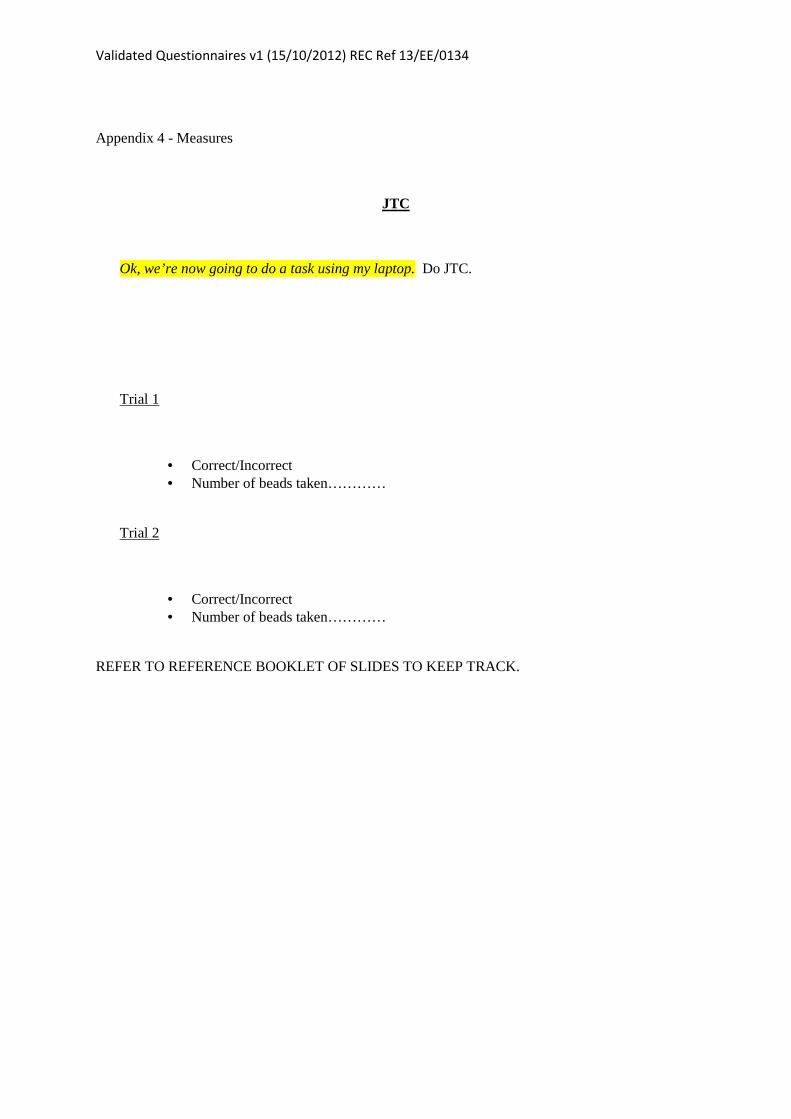
Validated Questionnaires v1 (15/10/2012) REC Ref 13/EE/0134
Appendix 4 - Measures
JTC
Ok, we’re now going to do a task using my laptop. Do JTC.
Trial 1
• Correct/Incorrect • Number of beads taken…………
Trial 2
• Correct/Incorrect • Number of beads taken…………
REFER TO REFERENCE BOOKLET OF SLIDES TO KEEP TRACK.
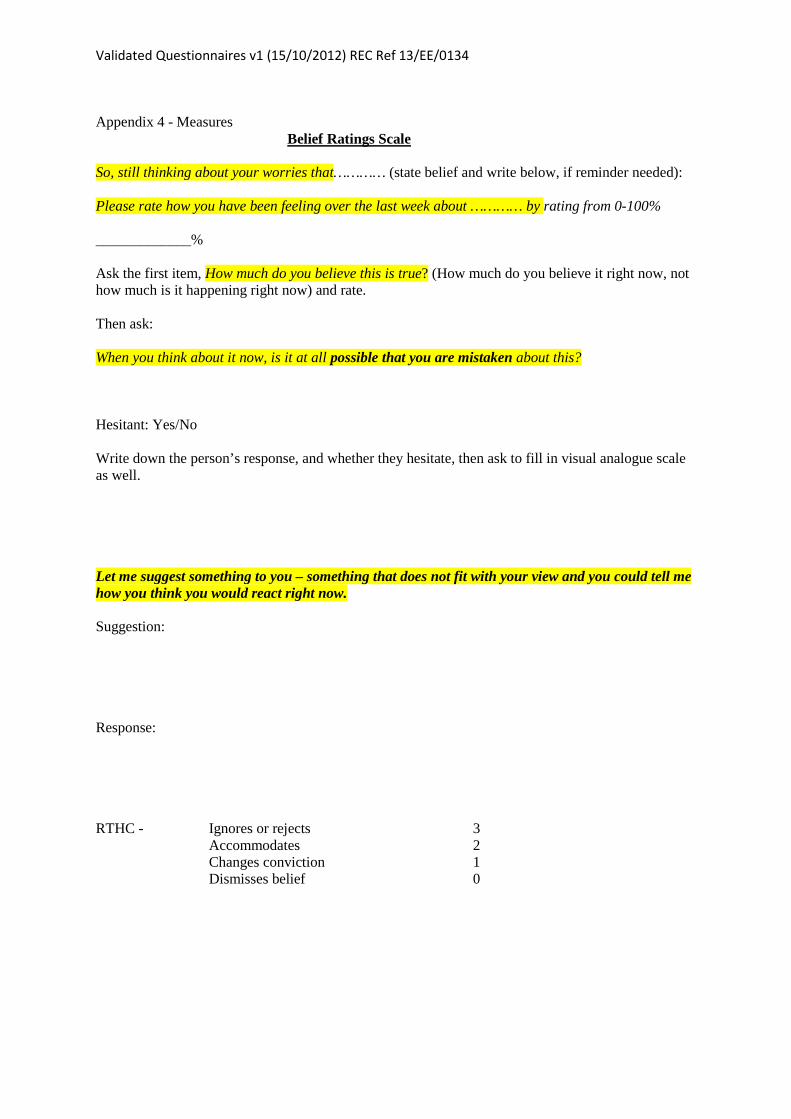
Validated Questionnaires v1 (15/10/2012) REC Ref 13/EE/0134
Appendix 4 - Measures
Belief Ratings Scale
So, still thinking about your worries that………… (state belief and write below, if reminder needed): Please rate how you have been feeling over the last week about ………… by rating from 0-100% _____________% Ask the first item, How much do you believe this is true? (How much do you believe it right now, not how much is it happening right now) and rate. Then ask: When you think about it now, is it at all possible that you are mistaken about this? Hesitant: Yes/No Write down the person’s response, and whether they hesitate, then ask to fill in visual analogue scale as well.
Let me suggest something to you – something that does not fit with your view and you could tell me how you think you would react right now. Suggestion: Response: RTHC - Ignores or rejects 3 Accommodates 2 Changes conviction 1 Dismisses belief 0
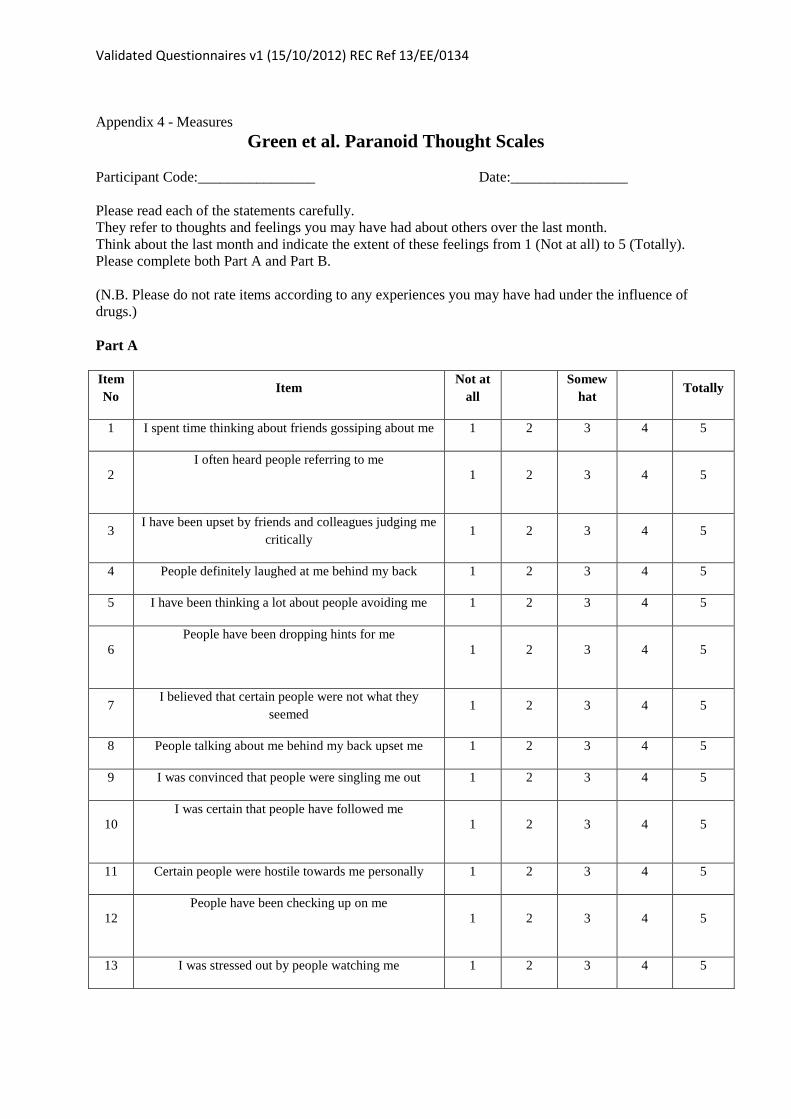
Validated Questionnaires v1 (15/10/2012) REC Ref 13/EE/0134
Appendix 4 - Measures
Green et al. Paranoid Thought Scales Participant Code:________________ Date:________________ Please read each of the statements carefully. They refer to thoughts and feelings you may have had about others over the last month. Think about the last month and indicate the extent of these feelings from 1 (Not at all) to 5 (Totally). Please complete both Part A and Part B. (N.B. Please do not rate items according to any experiences you may have had under the influence of drugs.) Part A Item No
Item Not at
all
Somewhat
Totally
1 I spent time thinking about friends gossiping about me 1 2 3 4 5
2 I often heard people referring to me
1 2 3 4 5
3 I have been upset by friends and colleagues judging me
critically 1 2 3 4 5
4 People definitely laughed at me behind my back 1 2 3 4 5
5 I have been thinking a lot about people avoiding me 1 2 3 4 5
6 People have been dropping hints for me
1 2 3 4 5
7 I believed that certain people were not what they
seemed 1 2 3 4 5
8 People talking about me behind my back upset me 1 2 3 4 5
9 I was convinced that people were singling me out 1 2 3 4 5
10 I was certain that people have followed me
1 2 3 4 5
11 Certain people were hostile towards me personally 1 2 3 4 5
12 People have been checking up on me
1 2 3 4 5
13 I was stressed out by people watching me 1 2 3 4 5
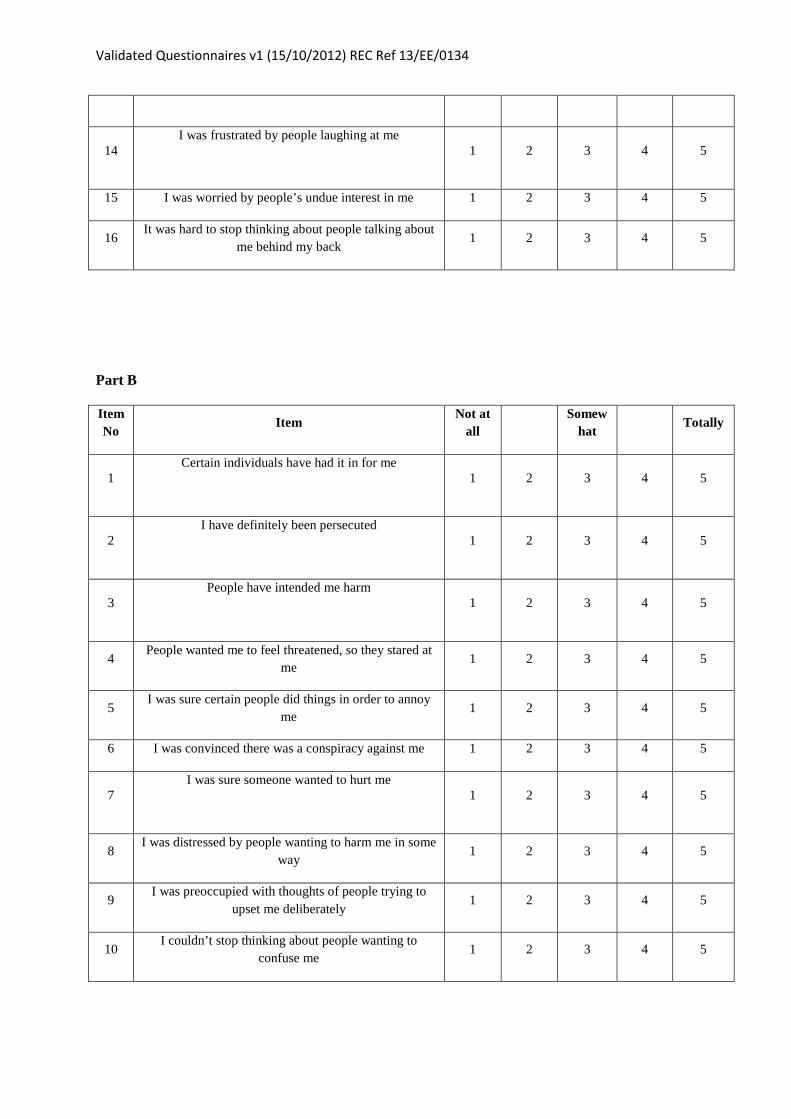
Validated Questionnaires v1 (15/10/2012) REC Ref 13/EE/0134
14 I was frustrated by people laughing at me
1 2 3 4 5
15 I was worried by people’s undue interest in me 1 2 3 4 5
16 It was hard to stop thinking about people talking about
me behind my back 1 2 3 4 5
Part B Item No
Item Not at
all
Somewhat
Totally
1 Certain individuals have had it in for me
1 2 3 4 5
2 I have definitely been persecuted
1 2 3 4 5
3 People have intended me harm
1 2 3 4 5
4 People wanted me to feel threatened, so they stared at
me 1 2 3 4 5
5 I was sure certain people did things in order to annoy
me 1 2 3 4 5
6 I was convinced there was a conspiracy against me 1 2 3 4 5
7 I was sure someone wanted to hurt me
1 2 3 4 5
8 I was distressed by people wanting to harm me in some
way 1 2 3 4 5
9 I was preoccupied with thoughts of people trying to
upset me deliberately 1 2 3 4 5
10 I couldn’t stop thinking about people wanting to
confuse me 1 2 3 4 5
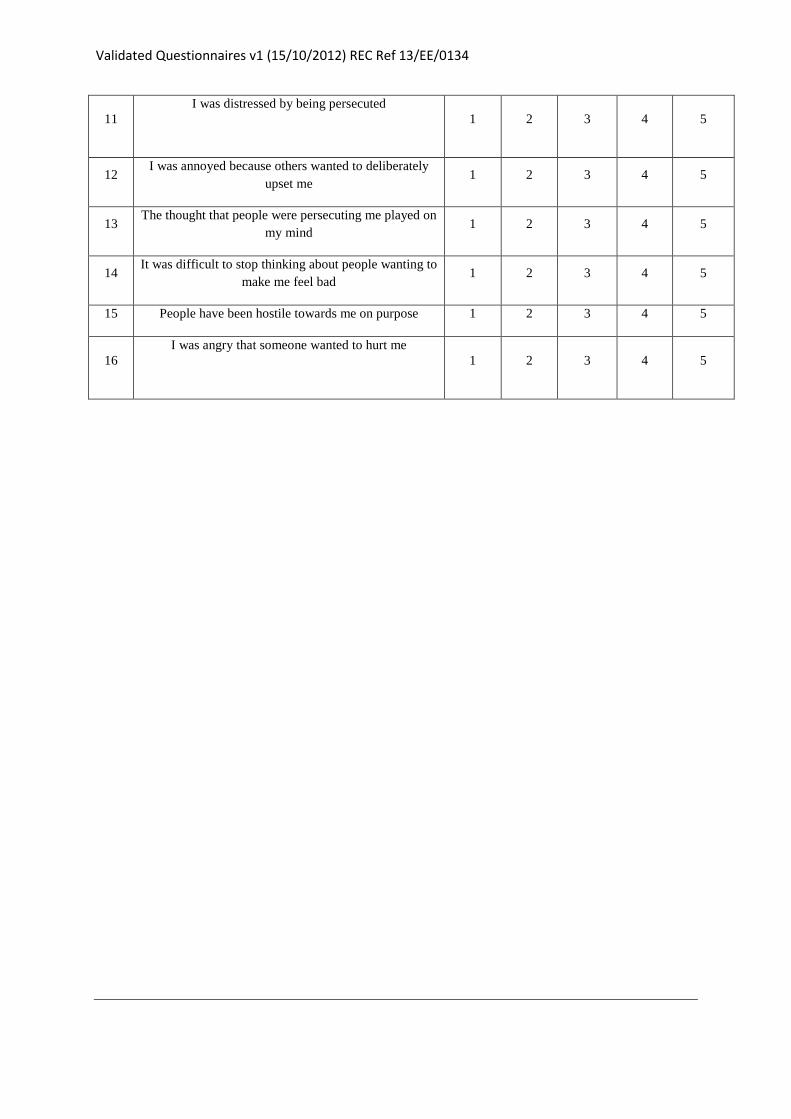
Validated Questionnaires v1 (15/10/2012) REC Ref 13/EE/0134
11 I was distressed by being persecuted
1 2 3 4 5
12 I was annoyed because others wanted to deliberately
upset me 1 2 3 4 5
13 The thought that people were persecuting me played on
my mind 1 2 3 4 5
14 It was difficult to stop thinking about people wanting to
make me feel bad 1 2 3 4 5
15 People have been hostile towards me on purpose 1 2 3 4 5
16 I was angry that someone wanted to hurt me
1 2 3 4 5
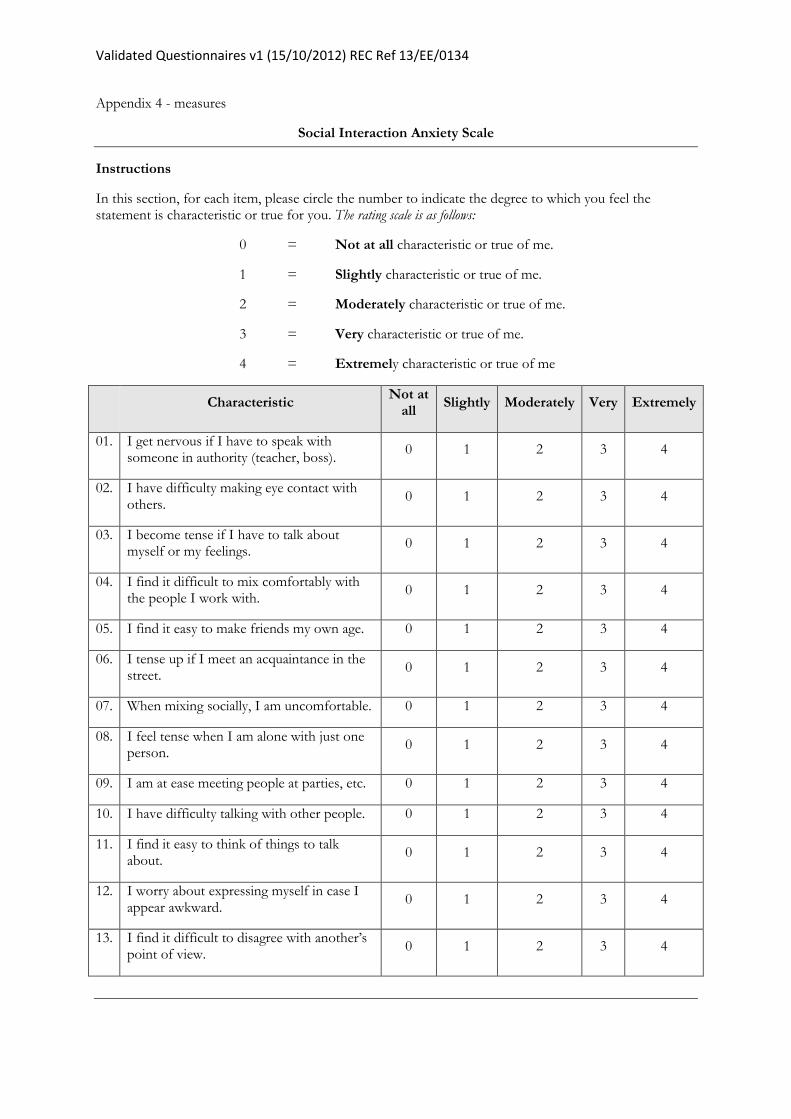
Validated Questionnaires v1 (15/10/2012) REC Ref 13/EE/0134
Appendix 4 - measures
Social Interaction Anxiety Scale
Instructions
In this section, for each item, please circle the number to indicate the degree to which you feel the statement is characteristic or true for you. The rating scale is as follows:
0 = Not at all characteristic or true of me.
1 = Slightly characteristic or true of me.
2 = Moderately characteristic or true of me.
3 = Very characteristic or true of me.
4 = Extremely characteristic or true of me
Characteristic
Not at all
Slightly Moderately Very Extremely
01. I get nervous if I have to speak with someone in authority (teacher, boss).
0 1 2 3 4
02. I have difficulty making eye contact with others.
0 1 2 3 4
03. I become tense if I have to talk about myself or my feelings.
0 1 2 3 4
04. I find it difficult to mix comfortably with the people I work with.
0 1 2 3 4
05. I find it easy to make friends my own age. 0 1 2 3 4
06. I tense up if I meet an acquaintance in the street.
0 1 2 3 4
07. When mixing socially, I am uncomfortable. 0 1 2 3 4
08. I feel tense when I am alone with just one person.
0 1 2 3 4
09. I am at ease meeting people at parties, etc. 0 1 2 3 4
10. I have difficulty talking with other people. 0 1 2 3 4
11. I find it easy to think of things to talk about.
0 1 2 3 4
12. I worry about expressing myself in case I appear awkward.
0 1 2 3 4
13. I find it difficult to disagree with another’s point of view.
0 1 2 3 4
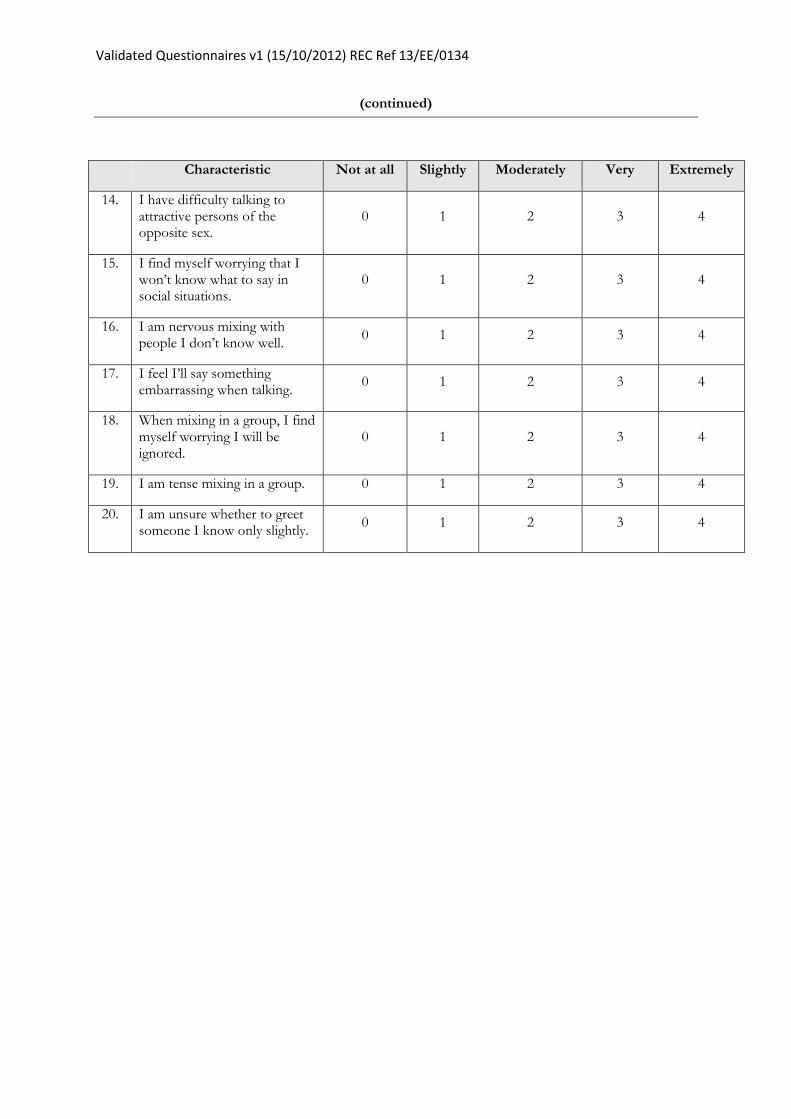
Validated Questionnaires v1 (15/10/2012) REC Ref 13/EE/0134
(continued)
Characteristic Not at all Slightly Moderately Very Extremely
14. I have difficulty talking to attractive persons of the opposite sex.
0 1 2 3 4
15. I find myself worrying that I won’t know what to say in social situations.
0 1 2 3 4
16. I am nervous mixing with people I don’t know well.
0 1 2 3 4
17. I feel I’ll say something embarrassing when talking.
0 1 2 3 4
18. When mixing in a group, I find myself worrying I will be ignored.
0 1 2 3 4
19. I am tense mixing in a group. 0 1 2 3 4
20. I am unsure whether to greet someone I know only slightly.
0 1 2 3 4
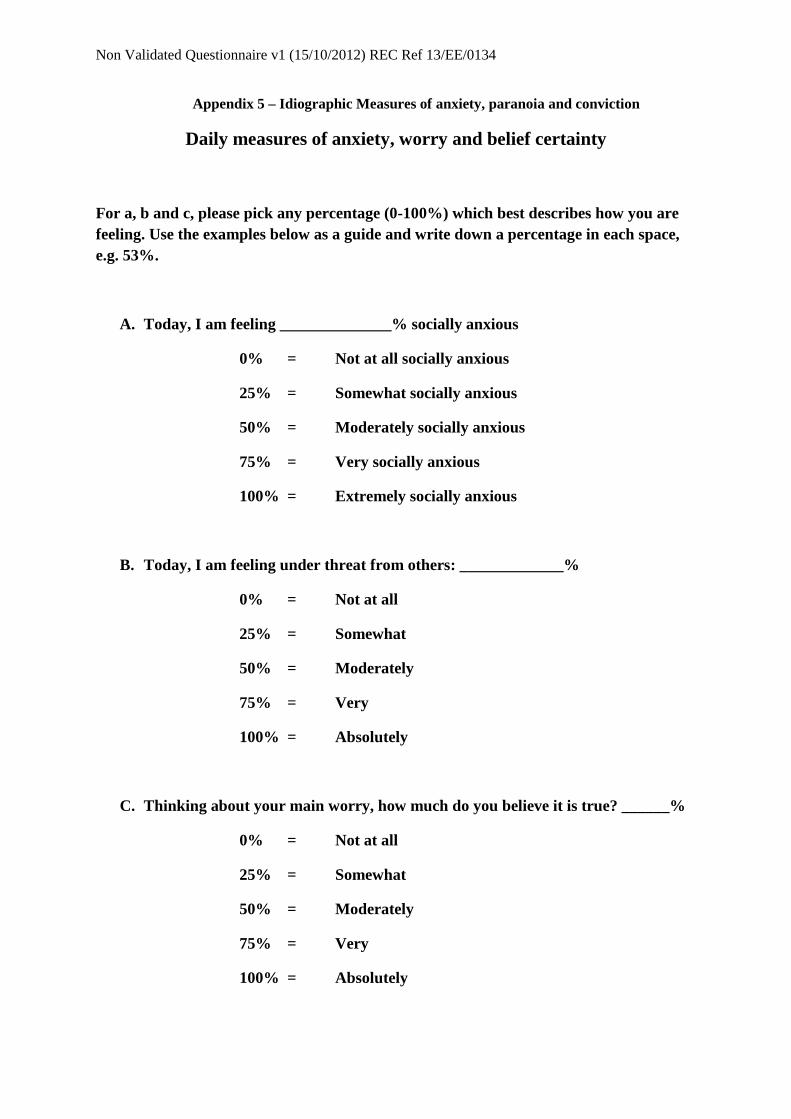
Non Validated Questionnaire v1 (15/10/2012) REC Ref 13/EE/0134
Appendix 5 – Idiographic Measures of anxiety, paranoia and conviction
Daily measures of anxiety, worry and belief certainty
For a, b and c, please pick any percentage (0-100%) which best describes how you are feeling. Use the examples below as a guide and write down a percentage in each space, e.g. 53%.
A. Today, I am feeling ______________% socially anxious
0% = Not at all socially anxious
25% = Somewhat socially anxious
50% = Moderately socially anxious
75% = Very socially anxious
100% = Extremely socially anxious
B. Today, I am feeling under threat from others: _____________%
0% = Not at all
25% = Somewhat
50% = Moderately
75% = Very
100% = Absolutely
C. Thinking about your main worry, how much do you believe it is true? ______%
0% = Not at all
25% = Somewhat
50% = Moderately
75% = Very
100% = Absolutely

CBM-I Scenario examples v1 (15/10/2012) REC Ref 13/EE/0134
Appendix 6 – examples of CBM-I scenarios developed by Turner et al. (2011)
You arrange to have coffee with your friend. She arrives late and rushes into the café.
She explains that she had found it difficult to find somewhere to [word presented with
missing letter: p-rk]. [Correct word: park]. [Missing letter: a].Did you meet your friend in a
café? [Correct response: Yes].
You plant some tomato seeds. After a couple of weeks the seedlings start to grow. In
the summer you will be able to have home grown tomatoes in your [word presented with
missing letters: s—ad}. [Correct word: salad]. [Missing letters: al]. Did your tomato plants
grow? [Correct response: Yes].
You watch a comedian on the television. Some of their jokes are not very funny. You
decide to find something else to watch, and so you change [word presented with missing
letters: c-an-el]. [Correct word: channel]. [Missing letters: h, n]. Was the comedian funny?
[Correct response: No].
You arrange to have coffee with your friend. She arrives late and rushes into the café.
She explains that she had found it difficult to find somewhere to [word presented with
missing letter: p-rk]. [Correct word: park]. [Missing letter: a].Did you meet your friend in a
café? [Correct response: Yes].
MRTP task summaries v1 (15/10/2012) REC Ref 13/EE/0134
Appendix 7 – synopses of the Maudsley Review Training Programme, Waller et al.,
2011
Task 1: ‘What’s the Picture?’
This task introduces the idea that it can be difficult to come to an informed decision
without all of the evidence. This teaches participants to look for more evidence before
making a decision.
Task 2: ‘illusions.’
This introduces the idea that things are not always as they first seem and that
sometimes we only see part of the story, which can lead us to jump to conclusions and make
mistakes. A series of optical illusions are presented, which helps to illustrate this.
Task 3: ‘first impressions’
This task gives 3 real life examples in video vignettes of scenarios. Participants are
asked to rate what they believe is going on at early stages of the scenarios, which illustrates
how we can all make incorrect assumptions, if we do not slow down and gather all the
necessary evidence.
Task 4: ‘looking for other possible explanations.’
This introduces the idea of thinking flexibly about alternative explanations before
reaching a conclusion. 3 video vignettes are shown, each with the option of positive, neutral
or paranoid interpretation. Participants are encouraged at various points to use the interactive
software to interpret the scenario as they see fit, with a debrief after the end of each vignette,
depending on their interpretation.
Task 5: ‘JTC summary’
This final task is aimed at being somewhat light-hearted, allowing review of the key
learning points throughout the tasks. Participants are shown 4 video scenarios, involving
characters who jump to conclusions. They are encouraged to identify who the characters that
jump to conclusions will be. Finally, they are asked about how the characters might have
avoided the situations they got themselves into, by not jumping to conclusions.

MRTP task summaries v1 (15/10/2012) REC Ref 13/EE/0134
Pilot Interview Schedule v1 (15/10/2012) REC Ref 13/EE/0134
Appendix 8 – Pilot Interview Schedule (adapted from Bendelin & Dahl, 2011)
General opinion
Description
How would you describe the treatment you’ve been through?
Please tell me what you did in the treatment?
Attitude
How did you experience this treatment?
How has your life changed as a result of the treatment?
If you were in the position to modify this treatment program based on your experiences of it, what
would you choose to change, withdraw or add?
Please tell me your view of computerised therapy.
The accomplishment of the treatment
Surroundings, time plan, structure of work, privacy-openness,
How did you complete the treatment?
How did others in your life find the treatment?
Did the treatment lead to any practical changes in your everyday life?
Is there any part of the material that you particularly remember?
Efficient mechanisms, reinforcement
What parts of the treatment were most important to you?
Did you find any parts troublesome? Describe these please.
Did you find your anxiety improving? What do you think improved your anxiety?
Motivation, resistance, ambivalence, doubts
What motivated you during the treatment?
Did you have any doubts throughout the treatment time?
Processes of change, key moments, problem situations, time
Was there a certain point in the treatment when you felt things were changing for you? Can you
describe this?
Were there any moments of difficulty during treatment where you felt that nothing was happening
in the treatment? Can you please describe this?
To what extent could you yourself decide about the pace of the treatment?
After the treatment
Experiences at the end of treatment, hopes
How did you feel when the treatment was over?
How did you find the treatment before you entered it and now afterwards?
Power, attribution of results
What was your view on your problem before entering treatment?
What is the reason for how you feel today?
Has your view on your difficulties changed in any way?

Pilot Interview Schedule v1 (15/10/2012) REC Ref 13/EE/0134
General opinion, recommendation
Do you feel that this treatment has helped you? In what way has this treatment helped you?
Life ahead
How has life been since the treatment?
Do you have any other thoughts about going through this that you would like to share?
How has it been like to do this interview?
Is there anything you’d like to ask me?
GP Cover Letter: Version 1 (15/10/2012) REC Ref: 13/EE/0134
Appendix 9 –Letter to care coordinator/GP
Mr James Hurley, Trainee Clinical Psychologist
Doctoral Programme in Clinical Psychology
University of East Anglia
Elizabeth Fry Building
Norwich
Norfolk
NR4 7TJ
Tel: XXXXXXXXXXX
Email: [email protected]
[Clinician Name]
[Clinician Address]
[Date]
Dear [Clinician Name],
Re: A study exploring the usefulness of computer packages designed to help with social anxiety and thinking style
I am writing to confirm that your client/patient Mr/Ms XXXXXX has given informed consent (see copy
of the consent form) to participate in the above research programme.
Please find enclosed a participant information sheet, which explains the study and what would be
involved for Mr/Ms XXXXXXXX.
Upon completion of the project, I will send another letter to you summarising what Mr/Ms XXXXXXX
participated in.
If you have any questions or would like to discuss any aspects of the research study, please do not
hesitate to contact me.
Best wishes,
__________________
James Hurley
Trainee Clinical Psychologist
Cc GP
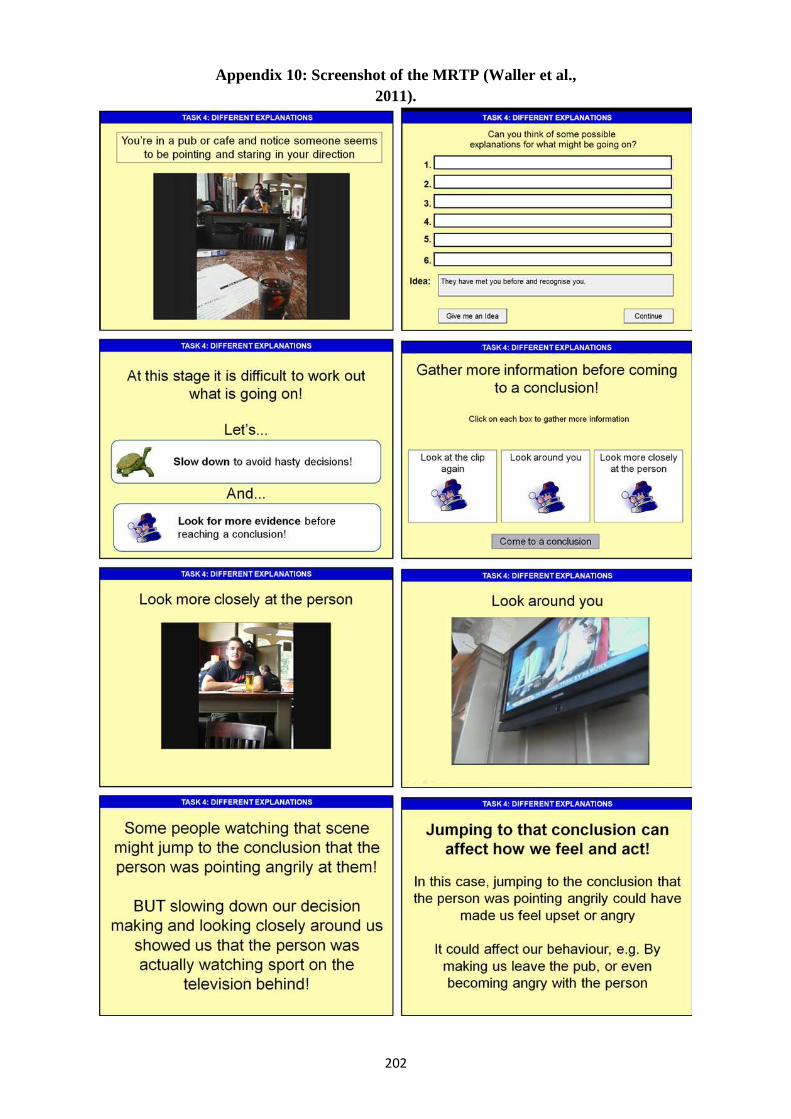
202
Appendix 10: Screenshot of the MRTP (Waller et al., 2011).
203
Appendix 11 – REC Letter of Approval
204
205
206

207
Appendix 12 – NSFT R&D Letter of Access

208