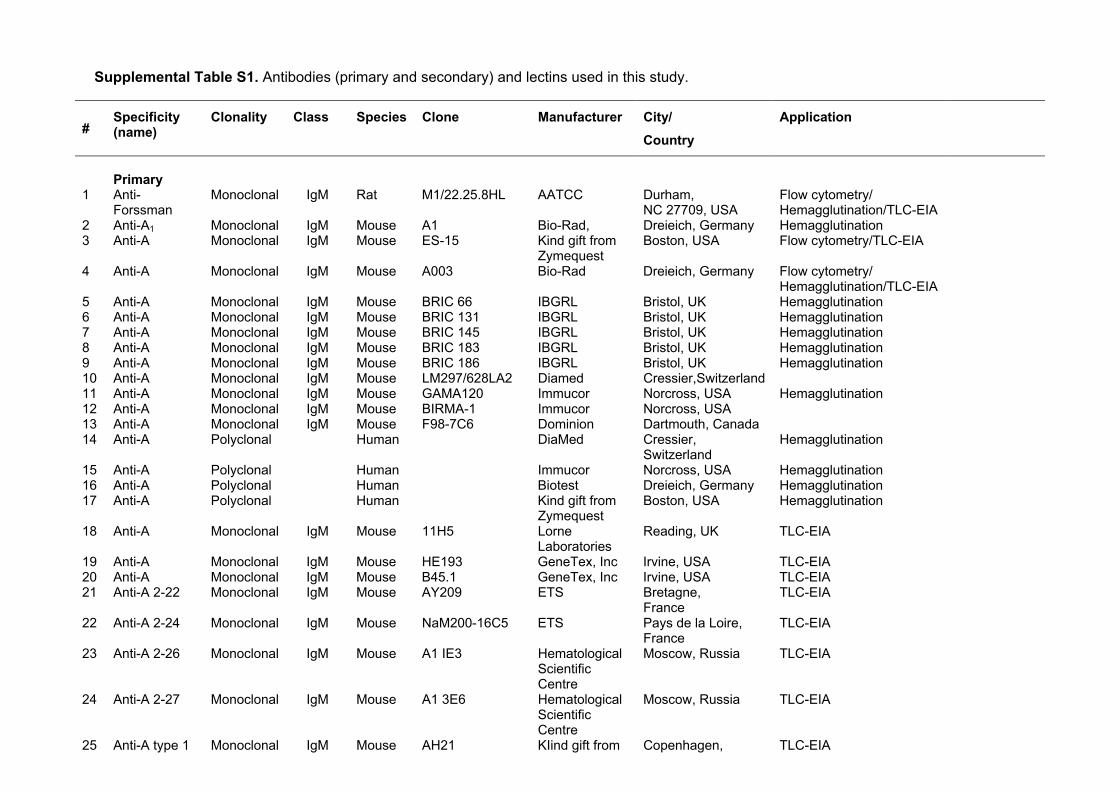
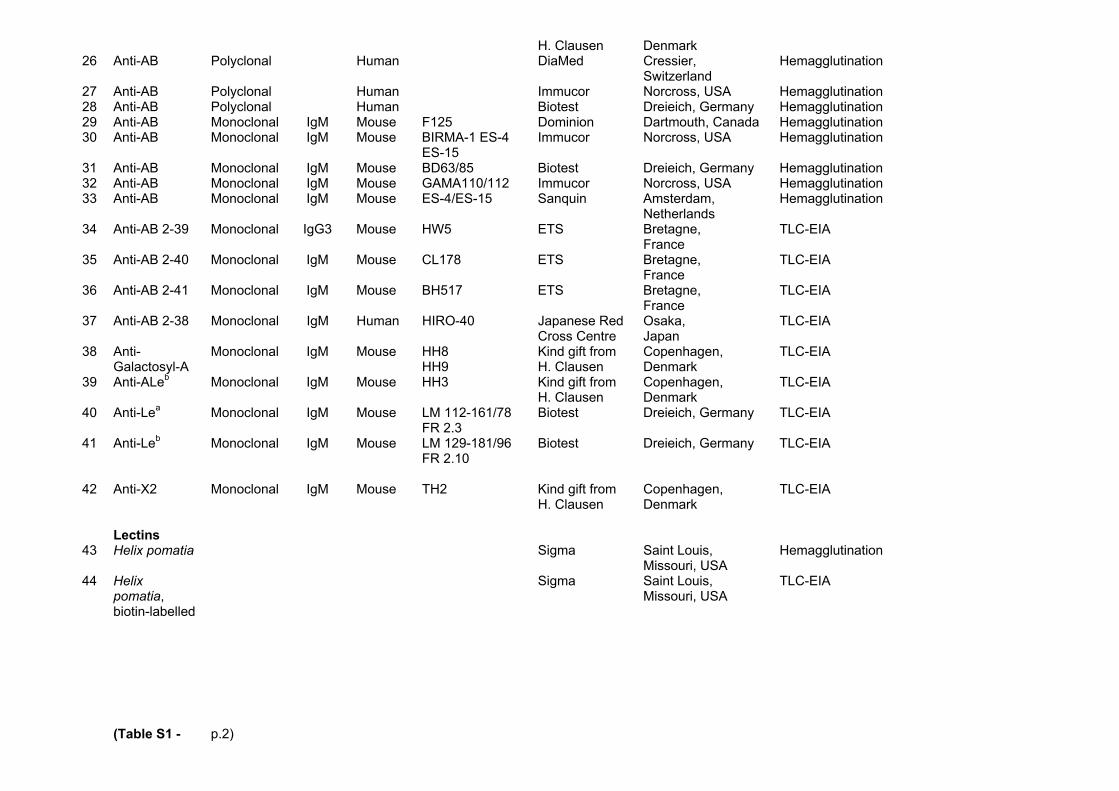
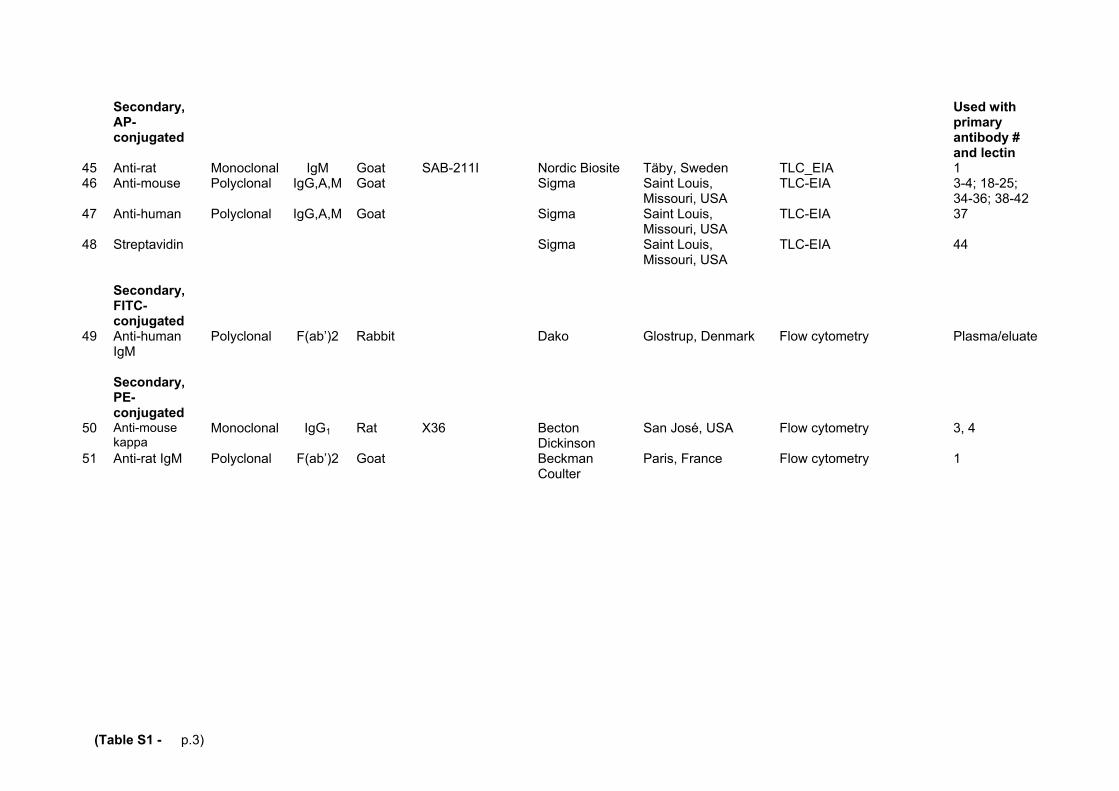
Embed Size (px)
Citation preview
Svensson/Hult et al.
3
Supplemental Method 1
Glycolipid preparation and thin layer chromatography-enzyme immune assay (TLC-EIA)
The lysed blood units were thawed and total neutral glycolipids were isolated with a
system of solvents and silica/ion exchange chromatography as previously reported.1,2
Glycolipids from A1/A2/B/O individuals were used as controls. Fs glycolipids from
canine epithelial cells, and para-Forssman (p-Fs) from human RBCs were used as
immunoassay references. p-Fs from human RBCs and Fs from chicken RBCs were
used as structural references. These antigens are similar in structure and may cross-
react with anti-A reagents. Excluding these compounds is critical to unambiguous
identification of Fs.
Total neutral glycolipids were extracted from RBC lysates resulting in 200 and 160
mg of glycolipids from Apae#1 and Apae#2, respectively. The total glycolipids from
each of Apae#1 and #2 were fractionated by silica chromatography column in a
system of chloroform (C) methanol (M) solvent mixes, starting with the least polar (50
mL fractions). The first solvent CM 9:1 was followed by CM 88:12; CM 85:15; CM
82:18; CM 75:25; CM 65:35; CM 60:40; CM 25:75; M; and finally CM 40:40 mix with
12 parts of water (CMW 40:40:12) v/v.
The TLC method used is based on that of Schnaar et al.3 and reported to be
sensitive for the characterization of weak A subgroups.2 Lane loading concentrations
depended on sample homogeneity with 20 µg of unfractionated total neutral
glycolipids, or 10 µg of semi-fractionated open-column fractions, or 0.1 to 1 µg of high
purity glycolipid fractions (e.g. Fs and p-Fs reference glycolipids) loaded per lane.
Glycolipids were eluted on the TLC plates in solvent mix of chloroform-methanol-
water 60:35:8 v/v, air-dried and then plasticized. In brief, the TLC plate was then
reacted with a primary antibody (Table S1) followed by a species-appropriate alkaline
phosphate conjugated anti-immunoglobulin; goat anti-rat IgM (SAB-211I; Nordic
Biosite, Sweden) or; goat anti-human polyvalent immunoglobulins (A3313, Sigma) or;
goat anti-mouse immunoglobulins (A0162, Sigma). Alternatively, biotin-labeled lectin
Helix pomatia (diluted at 1:3000) was followed by an alkaline phosphate conjugated
Streptavidin (S2890; Sigma). Reactions were visualized with NBT/BCIP chromogenic
substrate (B5655; Sigma).
Svensson/Hult et al.
4
Supplemental Method 2
Genetic testing
ABO genotyping. DNA was extracted from the buffy coat with a modified salting-out
procedure.4 Genomic typing of the ABO locus was performed with the established
and validated methods used at the Nordic Reference Laboratory for Genomic Blood
Group Typing in Lund, Sweden, including PCR-RFLP5 and PCR-ASP.6
Sequencing of GBGT1. Oligonucleotide primers used in this study were designed
using the human GBGT1 sequence ENST00000372040 in Ensembl and synthesized
by Invitrogen (Invitrogen, Carlsbad, CA). PCR was performed with primer pairs as
described in Table S2. Amplification was performed in a reaction volume of 20 µL
with 0.5 µmol/L of each primer, 2 nmol of each dNTP, and 100 ng of genomic DNA.
The thermostable enzyme used was 0.5U from the Expand High Fidelity PCR
System in the supplied buffer 2 with a final Mg2+ concentration of 1.5 mM according to
the manufacturer (Roche Molecular Systems, Pleasanton, CA). After an initial
denaturation step at 95°C for 2 min was followed by 35 cycles of denaturation (95°C
for 20 s), annealing (60°C for 35 s) and extension (72°C for 1 min for exons 1-6 and 2
min for exon 7) and a final extension at 72°C for 2 min. All amplification products
were separated by high-voltage electrophoresis on 3% agarose gels (Seakem, FMC
Bioproducts, Rockland, ME) stained with ethidium bromide (0.56 mg/L gel, Sigma
Chemicals, St. Louis, MO). Products were purified using the Qiaquick gel extraction
kit (Qiagen GmbH, Hilden, Germany), sequenced with the BigDye terminator kit v1.1
(Applied Biosystems, Foster City, CA) and analysed on a 3130 Avant/Genetic
analyser (Applied Biosystems). For cis/trans assignment PCR fragments were cloned
in a TOPO TA Cloning vector (Invitrogen) according to the manufacturer’s
instructions and subsequently sequenced with M13 primers included in the kit.
RNA, cDNA preparation and transcript analysis. Buffy coats from the two Apae
individuals were frozen in Trizol® (Invitrogen) immediately upon receipt. Five in-house
control samples were frozen in parallel. Bone marrow from an apparently healthy
donor was obtained following informed consent. CD34-positive cells from primary
bone marrow were enriched and cultured towards erythroid development as
previously described7. RNA was extracted from the thawed Trizol aliquots according
to the manufacturer’s instructions. cDNA was synthesized using the High Capacity
Svensson/Hult et al.
5
RNA-to-cDNA kit (Applied Biosystems) and the GeneAmp® PCR System 2700
(Applied Biosystems).
Real-time quantitative PCR was performed on 3 µL of cDNA with TaqMan probes
and a sequence detection system (Model 7500, Applied Biosystems), according to
the manufacturer's instructions. Exon boundary 2 to 3 was detected with a TaqMan
gene expression assay (Hs 01063930_m1, Applied Biosystems). All samples were
run in triplicate. Transcript target quantities were normalized to Beta Actin (Assay
Hs99999903_m1, Applied Biosystems). For analysis the sample with the lowest cycle
threshold (CT) value was used as calibrator. We considered as positive the results
from any sample with at least two detected (CT < 40) values within the triplicate.
Detailed information on PCR-ASP settings. Five pmol of each primer (1; i6:838F -
ex:7:887A-R, 2;ex:7:363A-F - ex7:1139R) and 0.5 pmol each of the internal positive
control primers (JK-F3-L and JK-R3-L) was used in each reaction. For primer details
see Table S2. The primers were mixed with 100 ng of genomic DNA, 2 nmol of each
dNTP, 0.5 U of DNA polymerase (AmpliTaq Gold, Perkin Elmer/Roche Molecular
Systems, Branchburg, NJ), glycerol, and cresol red at final concentrations of 5 and
0.01 percent, respectively, in the buffer supplied. The final reaction volume was 10
µL. Thermocycling was performed with a PCR system (GeneAmp 2700, Perkin Elmer
Cetus, Norwalk, CT). For PCR-ASP, the following cycling conditions were used: Initial
denaturation at 96°C for 7 minutes was followed by 32 cycles at 94°C for 30 seconds,
65°C (1) or 63°C (2) for 30 seconds, 72°C for 1 minute and 30 seconds, and a final
extension 72°C for 2 minutes. PCR products were separated electrophoretically on 2
to 3% agarose gels (Seakem, FMC Bioproducts, Rockland, ME) stained with
ethidium bromide (0.56 mg/L gel, Sigma Chemical Co., St. Louis, MO) after high-
voltage electrophoresis at 150 to 160 V and visualized on a UV light board (Multi
Image Light cabinet, software Alpha View version 3.0.3.0, Alpha Innotech, Cell
Biosciences, Santa Clara, CA).
Svensson/Hult et al.
6
Supplemental Method 3
Flow cytometry
RBCs and transfected cell line MEG-01 were tested by flow cytometry. The cells
were washed three times in phosphate-buffered saline (PBS), and 10 µL packed and
washed RBCs were suspended in 400 µL PBS. A 96-well plate (NUNCTM Apogent,
Denmark) was used for sample preparation: approximately 500,000 RBCs were
added to each well containing a total volume of 50 µL. For anti-Forssman testing
RBCs were fixed for 10 min by the addition of 100 µL of 0.1% glutaraldehyde to
reduce agglutination of antigen-positive cells. Incubation was performed at room
temperature under constant mixing. The plate was then centrifuged at 300 x g for 1
min and the supernatant discarded.
Different volumes of primary antibody were added to each well (anti-Forssman 25 µL,
plasma 20 µL, eluate 10 µL) and PBS were added to a total volume of 50 µL. The plate
was incubated for 10 min at room temperature under constant mixing and then
incubated for an additional 50 min at 4oC. The cells were washed twice with 150 µL
PBS. Another 50 µL PBS and 5 µL of secondary antibody were added, incubated for 10
min in darkness at room temperature under constant mixing and washed twice with 150
µL PBS. Finally, the RBCs were resuspended in 300 µL PBS and transferred to 5 mL
BD FalconTM plastic tubes (BD Biosciences, MA).
Flow cytometric analysis was performed on a FACScan/FACSCalibur flow cytometer
(Becton Dickinson) using FACSflowTM (BD Biosciences, Erembodegem-Aalst,
Belgium) sheath fluid. From a sample volume of 300 µL, 10,000-50,000 events were
collected at a flow rate of 60 µL/min. Log fluorescence data were gated on a linear
forward scatter versus linear side scatter dot plot. The analysis gate was set to
include the viable part of the cell population, excluding deformed and aggregated
cells i.e. cells that were high on side scatter/ forward scatter. When testing MEG-01
7AAD was added to exclude nonviable cells. Appropriate controls were included in
each run. For RBCs FL1 detection was included in all dot plots to avoid the risk that
autofluorescence (e.g. developing in RBCs transported under suboptimal conditions)
would be interpreted as a weak positive signal. FL1 and FL2 PMTs were adjusted to
ensure that the negative control RBCs fell within the set FL1 and FL2 markers.
Svensson/Hult et al.
7
Supplemental Method 4
Blood group serology
Native and papainised RBCs from Apae donors were tested (including control RBCs of
blood group A and O) with a variety of ABO reagents, anti-A (n=16) and anti-A,B
(n=8). Lectin studies were performed as part of the original serological study to
exclude known forms of polyagglutination (see reference 13 in the main manuscript),
and were not repeated here. Testing was performed by both gel column agglutination
and in tubes. Gel card; 50 µL of ABO reagent and 25 µL of a 3% RBC suspension
were incubated in neutral gel cards (50520, DiaMed/Bio-Rad, Cressier, Switzerland)
and spun in a gel card centrifuge for 10 min. Tubes; One drop of ABO reagent and
one drop of a 3% RBC suspension were incubated for 20 min at room temperature
and then centrifuged for one minute. Grading was done according to standard blood
bank practice.
The plasma from Apae donors was previously (reference 13 in the main manuscript)
shown to exhibit the expected antibodies found in group O plasma. To identify donors
with a strong anti-Forssman in their plasma, crossmatch was performed against
RBCs from the two Apae donors. Native and papainised RBCs were incubated with
plasma from random blood donors. RBCs in a 0.8% suspension incubated with
plasma in ID-card (50531) LISS/Coombs’ gelcards (DiaMed/Bio-Rad) incubated at
37ºC for 20 min and then centrifuged in a gel card centrifuge for 10 min. In addition,
RBCs in a 3% suspension were incubated in glass tubes at 4ºC (native cells) or room
temperature (papainised RBCs) for 1 h and then centrifuged. Tube tests were graded
both macro- and microscopically according to standard blood bank practice. Eluates
were prepared according to Judd8 using Apae RBCs and plasma that gave a strong
reaction in serological testing with native Apae RBCs. Appropriate controls were tested
in parallel as described8. Eluates were tested against human (phenotypes A1, A2, B,
O and Apae) and animal (from sheep and dog) RBCs.
Hemolysin testing (adapted from Mollison: Blood Transfusion in Clinical Medicine,
10th edition, 1997) was performed by mixing one drop of 10% RBC saline
suspension with 2 drops of freshly drawn serum. The samples were incubated for 30
minutes at 37º and then centrifuged for 3 minutes at 1000 x g and the supernatants
H. Clausen Denmark 26 Anti-AB Polyclonal Human DiaMed Cressier,
Switzerland Hemagglutination
27 Anti-AB Polyclonal Human Immucor Norcross, USA Hemagglutination 28 Anti-AB Polyclonal Human Biotest Dreieich, Germany Hemagglutination 29 Anti-AB Monoclonal IgM Mouse F125 Dominion Dartmouth, Canada Hemagglutination 30 Anti-AB Monoclonal IgM Mouse BIRMA-1 ES-4
ES-15 Immucor Norcross, USA Hemagglutination
31 Anti-AB Monoclonal IgM Mouse BD63/85 Biotest Dreieich, Germany Hemagglutination 32 Anti-AB Monoclonal IgM Mouse GAMA110/112 Immucor Norcross, USA Hemagglutination 33 Anti-AB Monoclonal IgM Mouse ES-4/ES-15 Sanquin Amsterdam,
Netherlands Hemagglutination
34 Anti-AB 2-39 Monoclonal IgG3 Mouse HW5 ETS Bretagne, France
TLC-EIA
35 Anti-AB 2-40 Monoclonal IgM Mouse CL178 ETS Bretagne, France
TLC-EIA
36 Anti-AB 2-41 Monoclonal IgM Mouse BH517 ETS Bretagne, France
TLC-EIA
37 Anti-AB 2-38 Monoclonal IgM Human HIRO-40 Japanese Red Cross Centre
Osaka, Japan
TLC-EIA
38 Anti-Galactosyl-A
Monoclonal IgM Mouse HH8 HH9
Kind gift from H. Clausen
Copenhagen, Denmark
TLC-EIA
39 Anti-ALeb Monoclonal IgM Mouse HH3 Kind gift from H. Clausen
Copenhagen, Denmark
TLC-EIA
40 Anti-Lea Monoclonal IgM Mouse LM 112-161/78 FR 2.3
Biotest Dreieich, Germany TLC-EIA
41 Anti-Leb Monoclonal IgM Mouse LM 129-181/96 FR 2.10
Biotest Dreieich, Germany TLC-EIA
42 Anti-X2 Monoclonal IgM Mouse TH2 Kind gift from
H. Clausen Copenhagen, Denmark
TLC-EIA
Lectins 43 Helix pomatia Sigma Saint Louis,
Missouri, USA Hemagglutination
44 Helix pomatia, biotin-labelled
Sigma Saint Louis, Missouri, USA
TLC-EIA
(Table S1 -
p.2)
Secondary, AP-conjugated
Used with primary antibody # and lectin
45 Anti-rat Monoclonal IgM Goat SAB-211I Nordic Biosite Täby, Sweden TLC_EIA 1 46 Anti-mouse Polyclonal IgG,A,M Goat Sigma Saint Louis,
Missouri, USA TLC-EIA 3-4; 18-25;
34-36; 38-42 47 Anti-human Polyclonal IgG,A,M Goat Sigma Saint Louis,
Missouri, USA TLC-EIA 37
48 Streptavidin Sigma Saint Louis, Missouri, USA
TLC-EIA 44
Secondary,
FITC-conjugated
49 Anti-human IgM
Polyclonal F(ab’)2 Rabbit Dako Glostrup, Denmark Flow cytometry Plasma/eluate
Secondary,
PE-conjugated
50 Anti-mouse kappa
Monoclonal IgG1 Rat X36 Becton Dickinson
San José, USA Flow cytometry 3, 4
51 Anti-rat IgM Polyclonal F(ab’)2 Goat Beckman Coulter
Paris, France Flow cytometry 1
(Table S1 - p.3)
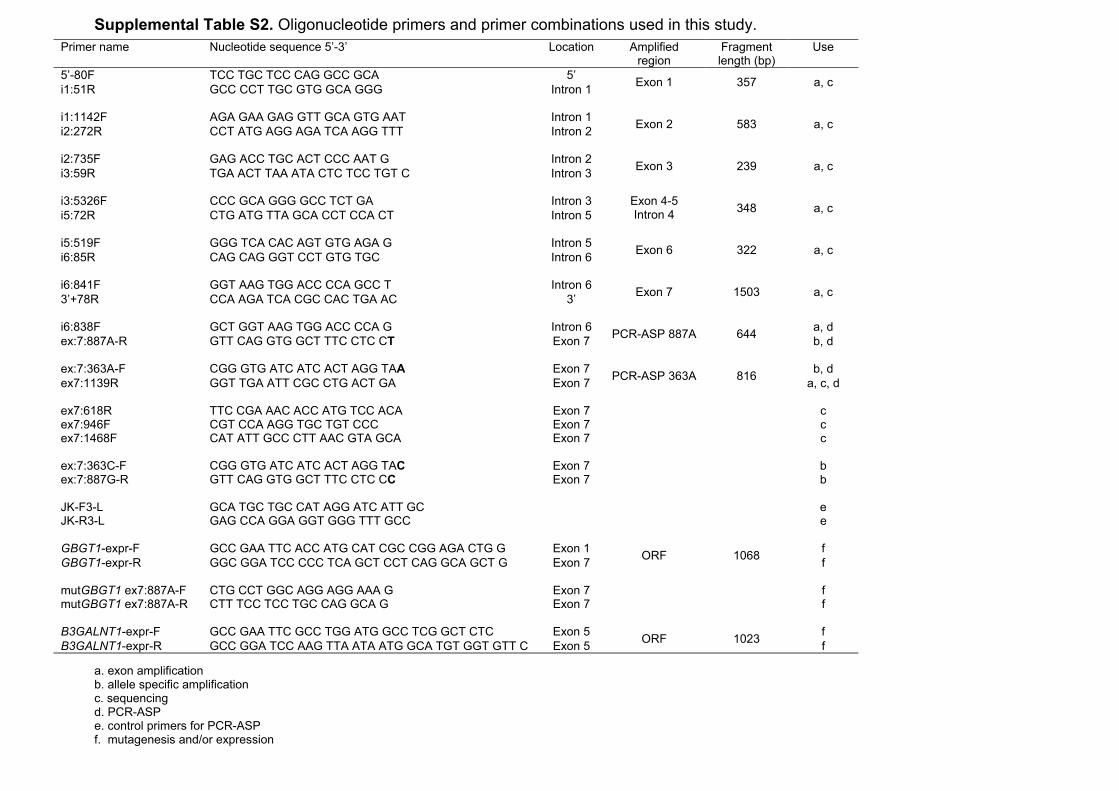
Supplemental Table S2. Oligonucleotide primers and primer combinations used in this study.
a. exon amplification b. allele specific amplification c. sequencing d. PCR-ASP e. control primers for PCR-ASP f. mutagenesis and/or expression
Primer name Nucleotide sequence 5’-3’ Location Amplified region
Fragment length (bp)
Use
5’-80F TCC TGC TCC CAG GCC GCA 5’ Exon 1 357 a, c i1:51R GCC CCT TGC GTG GCA GGG Intron 1 i1:1142F AGA GAA GAG GTT GCA GTG AAT Intron 1 Exon 2 583 a, c i2:272R CCT ATG AGG AGA TCA AGG TTT Intron 2 i2:735F GAG ACC TGC ACT CCC AAT G Intron 2 Exon 3 239 a, c i3:59R TGA ACT TAA ATA CTC TCC TGT C Intron 3 i3:5326F CCC GCA GGG GCC TCT GA Intron 3 Exon 4-5
Intron 4 348 a, c i5:72R CTG ATG TTA GCA CCT CCA CT Intron 5 i5:519F GGG TCA CAC AGT GTG AGA G Intron 5 Exon 6 322 a, c i6:85R CAG CAG GGT CCT GTG TGC Intron 6 i6:841F GGT AAG TGG ACC CCA GCC T Intron 6 Exon 7 1503 a, c 3’+78R CCA AGA TCA CGC CAC TGA AC 3’ i6:838F GCT GGT AAG TGG ACC CCA G Intron 6 PCR-ASP 887A 644 a, d ex:7:887A-R GTT CAG GTG GCT TTC CTC CT Exon 7 b, d ex:7:363A-F CGG GTG ATC ATC ACT AGG TAA Exon 7 PCR-ASP 363A 816 b, d ex7:1139R GGT TGA ATT CGC CTG ACT GA Exon 7 a, c, d ex7:618R TTC CGA AAC ACC ATG TCC ACA Exon 7 c ex7:946F CGT CCA AGG TGC TGT CCC Exon 7 c ex7:1468F CAT ATT GCC CTT AAC GTA GCA Exon 7 c ex:7:363C-F CGG GTG ATC ATC ACT AGG TAC Exon 7 b ex:7:887G-R GTT CAG GTG GCT TTC CTC CC Exon 7 b JK-F3-L GCA TGC TGC CAT AGG ATC ATT GC e JK-R3-L GAG CCA GGA GGT GGG TTT GCC e GBGT1-expr-F GCC GAA TTC ACC ATG CAT CGC CGG AGA CTG G Exon 1 ORF 1068 f GBGT1-expr-R GGC GGA TCC CCC TCA GCT CCT CAG GCA GCT G Exon 7 f mutGBGT1 ex7:887A-F CTG CCT GGC AGG AGG AAA G Exon 7 f mutGBGT1 ex7:887A-R CTT TCC TCC TGC CAG GCA G Exon 7 f B3GALNT1-expr-F GCC GAA TTC GCC TGG ATG GCC TCG GCT CTC Exon 5 ORF 1023 f B3GALNT1-expr-R GCC GGA TCC AAG TTA ATA ATG GCA TGT GGT GTT C Exon 5 f
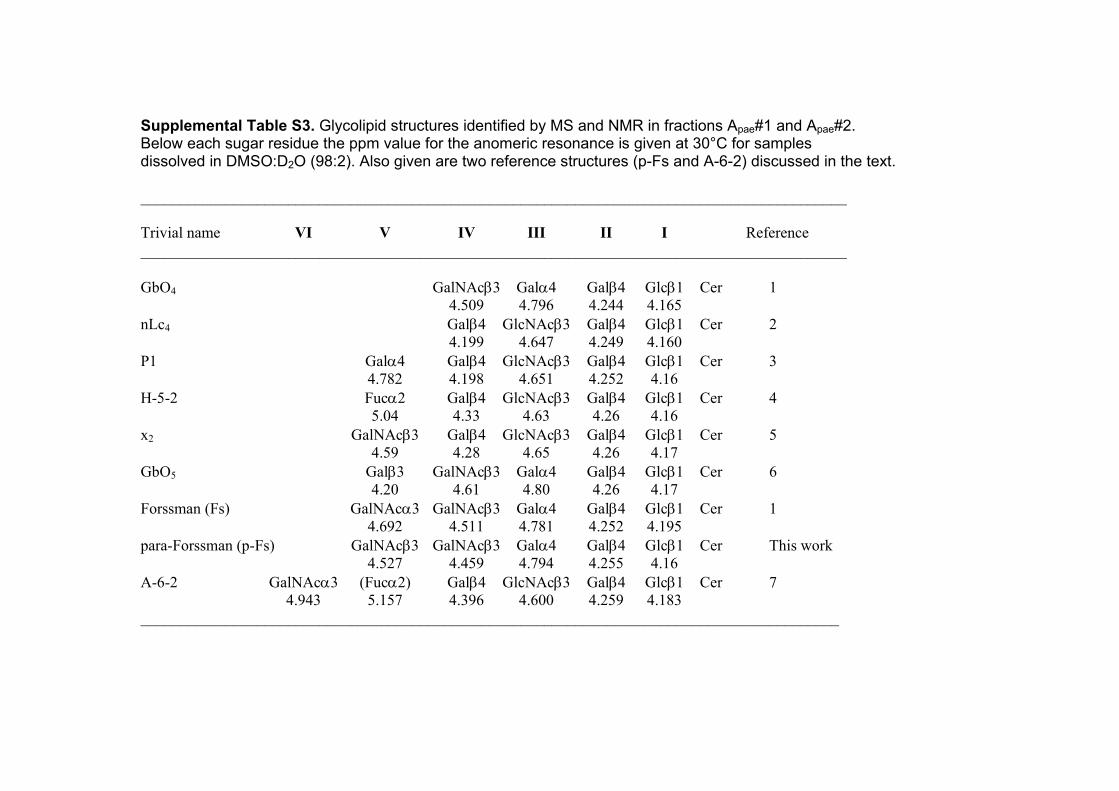
Supplemental Table S3. Glycolipid structures identified by MS and NMR in fractions Apae#1 and Apae#2. Below each sugar residue the ppm value for the anomeric resonance is given at 30°C for samples dissolved in DMSO:D2O (98:2). Also given are two reference structures (p-Fs and A-6-2) discussed in the text. ___________________________________________________________________________________________ Trivial name VI V IV III II I Reference ___________________________________________________________________________________________ GbO4 GalNAcβ3 Galα4 Galβ4 Glcβ1 Cer 1 4.509 4.796 4.244 4.165 nLc4 Galβ4 GlcNAcβ3 Galβ4 Glcβ1 Cer 2 4.199 4.647 4.249 4.160 P1 Galα4 Galβ4 GlcNAcβ3 Galβ4 Glcβ1 Cer 3 4.782 4.198 4.651 4.252 4.16 H-5-2 Fucα2 Galβ4 GlcNAcβ3 Galβ4 Glcβ1 Cer 4 5.04 4.33 4.63 4.26 4.16 x2 GalNAcβ3 Galβ4 GlcNAcβ3 Galβ4 Glcβ1 Cer 5 4.59 4.28 4.65 4.26 4.17 GbO5 Galβ3 GalNAcβ3 Galα4 Galβ4 Glcβ1 Cer 6 4.20 4.61 4.80 4.26 4.17 Forssman (Fs) GalNAcα3 GalNAcβ3 Galα4 Galβ4 Glcβ1 Cer 1 4.692 4.511 4.781 4.252 4.195 para-Forssman (p-Fs) GalNAcβ3 GalNAcβ3 Galα4 Galβ4 Glcβ1 Cer This work 4.527 4.459 4.794 4.255 4.16 A-6-2 GalNAcα3 (Fucα2) Galβ4 GlcNAcβ3 Galβ4 Glcβ1 Cer 7 4.943 5.157 4.396 4.600 4.259 4.183 __________________________________________________________________________________________
References to Supplemental Table S3. 1. Dabrowski J, Hanfland P, Egge H. Structural analysis of glycosphingolipids by high-resolution 1H nuclear magnetic resonance spectroscopy. Biochemistry. 1980;19(24):5652-5658. 2. Clausen H, Levery SB, Kannagi R, Hakomori S. Novel blood group H glycolipid antigens exclusively expressed in blood group A and AB erythrocytes (Type 3 chain H). J Biol Chem. 1986;261(3):1380-1387. 3. Diswall M, Ångström J, Karlsson H et al. Structural characterization of α1,3-galactosyltransferase knockout pig heart and kidney glycolipids and their reactivity with human and baboon antibodies. Xenotransplantation. 2010;17(1):48-60. 4. Holgersson J, Jovall PÅ, Samuelsson BE, Breimer ME. Structural characterization of non-acid glycosphingolipids in kidneys of single blood group O and A pigs. J Biochem. 1990;108(5):766-777. 5. Thorn JJ, Levery SB, Salyan MEK et al. Structural characterization of x2 glycosphingolipid, its extended form, and its sialosyl derivatives: Accumulation associated with the rare blood group p phenotype. Biochemistry 1992;31(28):6509 6517. 6. Kannagi R, Levery SB, Ishigami F et al. New globoseries glycosphingolipids in human teartocarcinoma reactive with the monoclonal antibody directed to a developmentally regulated antigen, stage-specific embryonic antigen 3. J Biol Chem. 1983;258(14):8934-8942. 7. Clausen, H, Levery SB, McKibbin JM, Hakomori S. Blood group A determinants with mono- and difucosyl type 1 chain in human erythrocyte membranes. Biochemistry 1985;24(14):3578-3586.
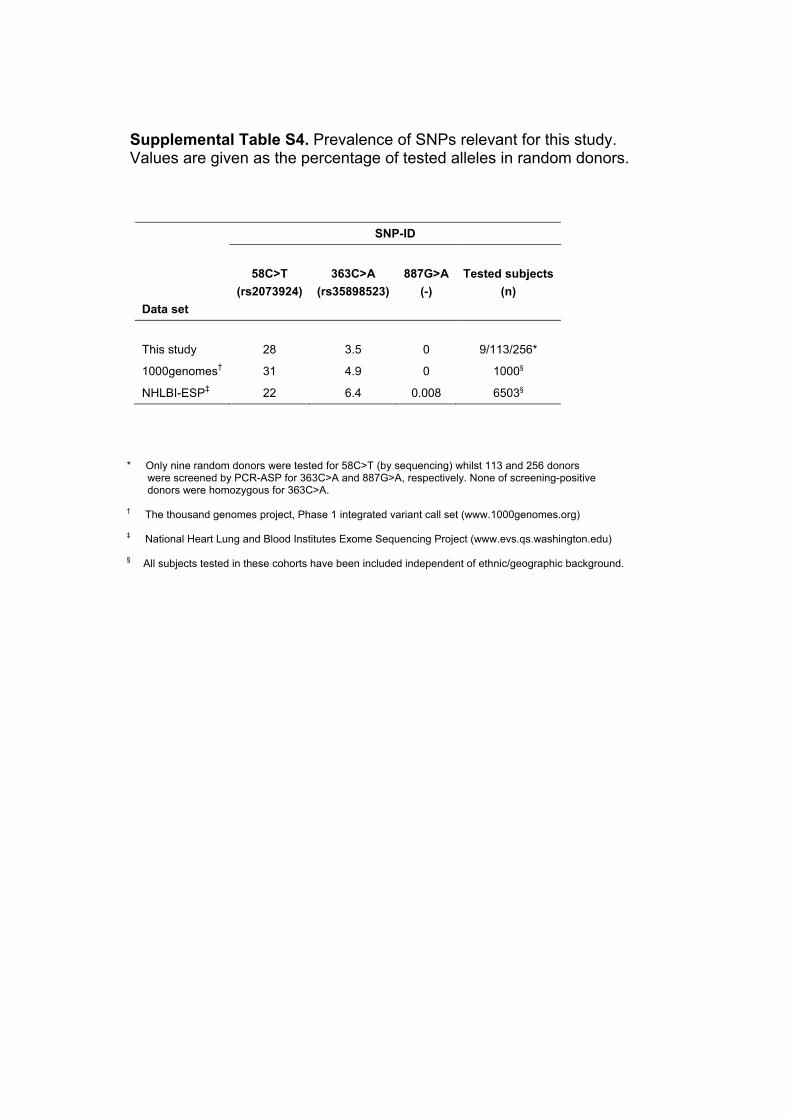
Supplemental Table S4. Prevalence of SNPs relevant for this study. Values are given as the percentage of tested alleles in random donors.
SNP-ID
Data set
58C>T
(rs2073924)
363C>A
(rs35898523)
887G>A
(-)
Tested subjects
(n)
This study
28
3.5
0
9/113/256*
1000genomes† 31 4.9 0 1000§
NHLBI-ESP‡ 22 6.4 0.008 6503§
* Only nine random donors were tested for 58C>T (by sequencing) whilst 113 and 256 donors were screened by PCR-ASP for 363C>A and 887G>A, respectively. None of screening-positive donors were homozygous for 363C>A. † The thousand genomes project, Phase 1 integrated variant call set (www.1000genomes.org) ‡ National Heart Lung and Blood Institutes Exome Sequencing Project (www.evs.qs.washington.edu) § All subjects tested in these cohorts have been included independent of ethnic/geographic background.
Svensson/Hult et al.
SUPPLEMENTAL FIGURE LEGENDS
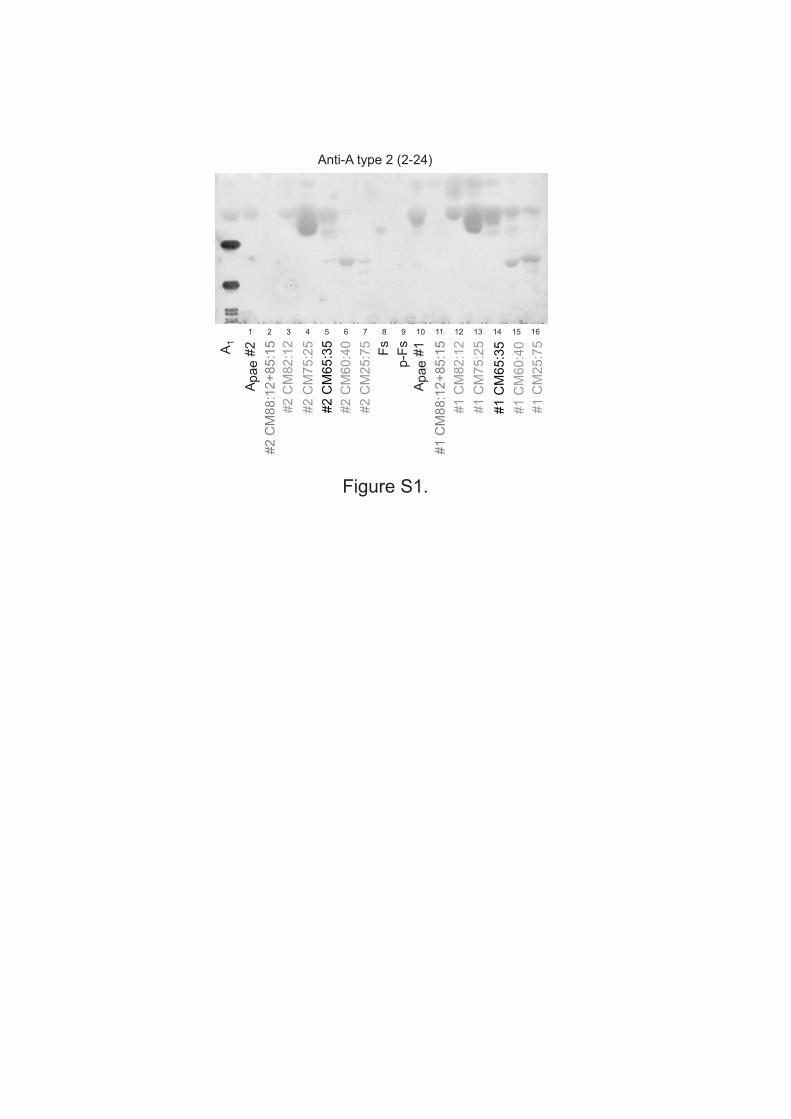
Figure S1. Extended thin layer chromatography analysis.
Monoclonal anti-A type 2, 2-24 (clone NaM200-16C5) activity against total glycolipids
and concentrated glycolipid column fractions.
Figure S2. Sequencing and PCR analysis of the GBGT1 gene.
DNA sequencing chromatograms highlighting two regions of particular interest in
GBGT1, including consensus and variant human samples at and around nucleotide
position 887 (left) and 363 (right). The upper middle panel shows the GBGT1
sequence from a gorilla. The same result was obtained for the other non-human
primates tested (not shown: baboon, gibbon, chimpanzee, macaque and orangutan).
In the lower middle panel, gel electropherograms of products obtained following
PCR-ASP assays to detect the two new mutations (887G>A and 363C>A) detected
in exon 7 of the GBGT1 gene are shown. For 887G>A, the lanes are labelled as
follows: Apae#1; pos = Apae#2 as positive control, i.e. a donor with 887G>A; neg =
negative control, i.e. DNA from a random blood donor lacking 887G>A; H2O = water
control; M = molecular size marker ΦX174 DNA/HaeIII. For 363C>A the lanes are
labelled as follows: Apae#1; pos = random blood donor with 363C>A as positive
control; neg = random blood donor lacking 363C>A as negative control; H2O = water
control; M = molecular size marker ΦX174 DNA/HaeIII.
Figures S3 and S4. Pedigrees with phenotype and genotype information for the two unrelated Apae families studied.
Traditional pedigree symbols are used to depict the family members and their
relationships. The investigated propositi (Apae#1 in Fig.S3 and Apae#2 in Fig.S4) are
indicated by arrows. Phenotypes (non-italics) and genotypes (italics) are given below
the symbols. Family members were typed by PCR-ASP for both the 887G>A
(activating) and 363C>A (truncating) mutations in GBGT1. In the individuals
heterozygous for both mutations their location in trans was verified by sequencing of
allele-specific fragments. None of the samples were homozygous for these
mutations. Black and white symbols represent family members with and without the
Svensson/Hult et al.
Apae phenotype, respectively. The grey square indicates an individual positive for the
887G>A substitution (based on a DNA sample from saliva) whilst no blood sample
was obtained and the phenotype has therefore not been verified.
Figure S5. Semi-quantification of GBGT1-mRNA levels.
Analysis of GBGT1-mRNA by real-time PCR. Forssman (GBGT1) transcript levels
were normalized to an appropriate house-keeping gene, beta-Actin. Diagram (a) and (b) represent two different experiments where all samples were tested in triplicate.
The sample displaying the lowest CT value, i.e. the highest level of transcripts, was
set to 100%. The displayed values were calculated as 2-[delta] [delta]CT and
expressed as % of the highest value. CT is the threshold value for the number of
cycles required for the signal to reach a set level. The error bars represent the
standard error of the mean (S.E.M.) for the four samples with common phenotypes.
(a) Erythroid bone marrow culture on day 9 vs. peripheral blood from four different
donors with common phenotypes; (b) Results from peripheral blood from the same
four donors as in (a) compared to Apae#1 and Apae#2.
Anti-A type 2 (2-24)
Figure S1.
A1
Apae
#2
#2 C
M88:1
2+
85:1
5
#2 C
M82:1
2
#2 C
M75:2
5
#2 C
M65:3
5
#2 C
M60:4
0
#2 C
M25:7
5
Fs
p-F
s
Apae
#1
#1 C
M88:1
2+
85:1
5
#1 C
M82:1
2
#1 C
M75:2
5
#1 C
M65:3
5
#1 C
M60:4
0
#1 C
M25:7
5
1 2 3 4 5 6 7 8 9 10 11 12 13 14 15 16
Human consensus 887G
Human Apae#1 887G>A
(Arg296Gln)
Gorilla consensus 887G
Human consensus 363C
Human Apae#1 363C>A
(Tyr121Stop)Apae#1 pos neg H2O M
PCR-ASP 887G>A
Apae#1 pos neg H2O M
PCR-ASP 363C>A
Figure S2.
Apae#1O1O1GBGT1887G/A363C/A
A
AA1O1GBGT1887G/G363 C/A
ApaeO1O1GBGT1887G/A363C/A
O
OO1O1GBGT1887G/G363C/A
nt
AA1O1GBGT1887G/G363C/A
nt
A AA1O1GBGT1887G/G363C/A
I
II
IIIA
A1O1GBGT1887G/G363C/A
Figure S3:Apae#1 Pedigree
n.t.O1O1GBGT1887G/A363C/C
Apae#2O1O1vGBGT1887G/A363C/C
ApaeO1O1vGBGT1887G/A363C/C
O
†
OO1O2GBGT1887G/G363C/C
OO1O1vGBGT1887G/G363C/C
OO1vO1vGBGT1887G/G363C/C
I
IIO
O1O1vGBGT1887G/G363C/C
Apae
III
nt
Figure S4:Apae#2 Pedigree
0102030405060708090
100
BM n=1 Blood n=4
% o
f hig
hest
exp
ress
ion
0102030405060708090
100
Blood n=4 Apae#1 Apae#2
% o
f hig
hest
exp
ress
ion
a
b
Figure S5.
GBGT1-mRNA from peripheral blood in common vs. Apae phenotypes
GBGT1-mRNA from bone marrow vs. peripheral blood
Apae#1 Apae#2