Embed Size (px)
Citation preview

LOAN DOCUMENT
3
PHOTOGRAPH THK SHEET
UJVEL INVENTORY
DOCUMENT nrärnncATioN
3 Wf l 99fr
DISTRIBUTION STATEMENT A Approved for Public Release
Distribution Unlimited
DISTRIBUTION STATEMENT
illWIIWITl NIK
imc nuc UNANNOUNCE» JUSTIFICATION
T
DISTRIBUTION/
AVAILABILITY CODES
DISIUBVnOM AVAILABBJIY AND/OR SHOAL
B±
DATE ACCESSIONED
DISTRIBUTION STAMP
DATE RETURNED
20000211 037 DATE RECEIVED IN DTIC REGISTERED OR CERTIFIED NUMBER
PHOTOGRAPH THIS SHEET AND RETURN TO DTIC-FDAC
DTKJ3^70A
[gpO QUALITY. ßKSQCIBÖ 4.
DOCUMENT MtOCESSINC SHEET
LOAN DOCUMENT
H A N D L E
Iw I T H
C A R E
MW«JIIMM«UIVimtt6Wnf mxxuEXHAurrm.
AFRL-ML-T Y-TR-1999-4552
THE EFFECTS OF CARBON PARTICLES ON AQUEOUS PHASE PULSED STREAMER
CORONA
DAVID R. GRYMONPRE
FLORIDA STATE UNIVERSITY & FAMU-FSU COLLEGE OF ENGINEERING
DEPARTMENT OF ENGINEERING 2525 POTTSDAMER STREET
TALLAHASSEE FL 32310-6046
Approved for Public Release: Distribution Unlimited
M& iM0M$mW$$&
AIR FORCE RESEARCH LABORATORY MATERIALS & MANUFACTURING DIRECTORATE AIRBASE & ENVIRONMENTAL TECHNOLOGY DIVISION TYNDALL AFB FL 32403-5323
NOTICES
USING GOVERNMENT DRAWINGS, SPECIFICATIONS, OR OTHER DATA INCLUDED IN THIS DOCUMENT FOR ANY PURPOSE OTHER THAN GOVERNMENT PROCUREMENT DOES NOT IN ANY WAY OBLIGATE THE US GOVERNMENT. THE FACT THAT THE GOVERNMENT FORMULATED OR SUPPLIED THE DRAWINGS, SPECIFICATIONS, OR OTHER DATA DOES NOT LICENSE THE HOLDER OR ANY OTHER PERSON OR CORPORATION; OR CONVEY ANY RIGHTS OR PERMISSION TO MANUFACTURE, USE, OR SELL ANY PATENTED INVENTION THAT MAY RELATE TO THEM.
THIS REPORT IS RELEASABLE TO THE NATIONAL TECHNICAL INFORMATION SERVICE (NTIS). AT NTIS, IT WILL BE AVAILABLE TO THE GENERAL PUBLIC, INCLUDING FOREIGN NATIONS.
THIS TECHNICAL REPORT HAS BEEN REVIEWED AND IS APPROVED FOR PUBLICATION.
■0 ~h /\e^
>EPH D. WANDER, PhD 'rograni Manager
CHRISTINE WAGEN Chief, Environmental Td
.'v^/V AhjL-j ULME, Lt Col, USAF, BSC ology Development Branch
RANDY L?GROsk Col, USAF,^BSC Chief, Airbase & Environmental Technology Division

REPORT DOCUMENTATION PAGE Form Approved OMB No. 0704-0188
Public reporting burden for this collection of information is estimated to average 1 hour per response, including the time for reviewing instructions, searching existing data sources, gathering and maintaining the data needed, and completing and reviewing the collection of information. Send comments regarding this burden estimate or any other aspect of this collection of information, including suggestions for reducing this burden, to Washington Headquarters Services, Directorate for information Operations and Reports, 1215 Jefferson Davis Highway, Suite 1 204, Arlington, VA 22202-4302, and to the Office of Management and Budget, Paperwork Reduction Project (0704-01 88), Washington, DC 20503.
1. AGENCY USE ONLY (Leave blank) 2. REPORT DATE
2 Nov 1998
3. REPORT TYPE AND DATES COVERED
Master's Thesis: January 1996 - January 1998 4. TITLE AND SUBTITLE
The Effects of Carbon Particles on Aqueous Phase Pulsed Streamer Corona
6. AUTHOR(S)
Grymonpre\ David R.
5. FUNDING NUMBERS
F08635-93-C-0020 PE: 6022F Project Number: 1900-A35B
7. PERFORMING ORGANIZATION NAMEISI AND ADDRESS(ES)
Department of Chemical Engineering Florida State University & FAMU-FSU College of Engineering 2525 Pottsdamer Street Tallahassee FL 32310-6046
8. PERFORMING ORGANIZATION REPORT NUMBER
9. SPONSORING/MONITORING AGENCY NAME(S) AND ADDRESS(ES)
AFRL/MLQE (Dr. Joe Wander) 139 Barnes Drive, Suite 2 Tyndall AFB, FL 32403-5323
10. SPONSORING/MONITORING AGENCY REPORT NUMBER
AFRL-ML-TY-TR-1999-4552
11. SUPPLEMENTARY NOTES
POC: Joseph D. Wander, Ph.D, AFRL/MLQE, (850) 283-6240
12a. DISTRIBUTION AVAILABILITY STATEMENT
Approved for Public Release: Distribution Unlimited 12b. DISTRIBUTION CODE
13. ABSTRACT (Maximum 200 words)
Pulsed streamer corona technology utilizes a non-thermal plasma high voltage discharge to break down various airborne and aqueous phase organic pollutants. Pulsed streamer corona discharge in a reactor using a point-to-plane electrode geometry has been studied with well-mixed aqueous solutions containing various salts (sodium chloride, potassium chloride, and calcium chloride) and particles in suspension (powdered activated carbon, porous silica gel, non-porous glass spheres, and elemental copper). The result that solution conductivity governs the electrode breakdown voltage is independent of both the salt composition and the particle properties (i.e., total surface area, particle size, conductivity, and dielectric constant). Powdered activated carbon in aqueous suspension also dramatically reduces the reactor electric power as a function of applied voltage. Elemental analysis using PIXE (proton-induced x-ray emission) of the activated carbon and the water leachate from washed activated carbon, coupled with pulsed corona treatment experiments using washed activated carbon, show that interactions of activated carbon with potassium salts are responsible for the lower reactor power. With the lower power consumption, greater amounts of contaminants can be removed at a lower power usage. The combination of pulsed corona and activated carbon enhances phenol removal through bulk reactions, adsorption, and corona-induced surface reactions. Primary oxidation products of phenol were also measured. A reaction and diffusion model was derived to analyze the phenol decomposition with combined bulk liquide and particle surface reactions.
14. SUBJECT TERMS
Pulsed streamer, corona, plasma, carbon particles, aqueous 15. NUMBER OF PAGES
186 16. PRICE CODE
17. SECURITY CLASSIFICATION OF REPORT
UNCL
18. SECURITY CLASSIFICATION OF THIS PAGE
UNCL
19. SECURITY CLASSIFICATION OF ABSTRACT
UNCL
20. LIMITATION OF ABSTRACT
UL Standard Form 298 (Rev. 2-89) (EG) Prescribed by ANSI Std. 239.18 Designed using Perform Pro, WHS/DIOR, Oct 94

UNCLASSIFIED SECURITY CLASSIFICATION OF THIS PAGE
CLASSIFIED BY:
DECLASSIFY ON:
11 SECURITY CLASSIFICATION OF THIS PAGE
UNCLASSIFIED

Preface
This thesis was prepared by Florida State University (FSU), Department of Chemical Engineering, under a subcontract with Applied Research Associates (contract No. F08635-93- C-0020), for the Air Force Research Laboratory (AFRL), Airbase and Environmental Technology Division, Tyndall AFB, FL 32403. The work was performed from January 1996 to January 1998. The AFRL project officer was Joseph D. Wander, Ph.D.
This thesis is submitted to the Defense Technical Information Center for publication exactly as it was submitted to Florida State University. This format does not conform to the usual style standards for AFRL reports but is acceptable.
I

The members of the Committee approve the thesis of David Grymonpre
defended on February 11,1998.
Approved:
Michael H. Peters Chair, Department of Chemical Engineering
Bruce R. Locke Professor Directing Thesis
Ronald J. Clark Committee Member
Eric Kalu Committee Member

To
Annette
in
ACKNOWLEDGEMENTS
I thank my thesis advisor, Dr. Bruce R. Locke, for his help and guidance for
the past several years. I also thank Dr. Ronald J. Clark, and Dr. Eric Kalu for serving
on my thesis committee. A special thanks goes to Wright C. Finney for being a thesis
committee member as well as for all of the laboratory help over the years.
Financial support and equipment was given by the United Stated Air Force,
Tyndall A.F.B., and Applied Research Associates, Panama City, FL.
I acknowledge the continuing support of this project by the Department of
Chemical Engineering, FAMU-FSU College of Engineering. Additionally, I would
like to thank the Department of Nuclear Services and the Department of Physics at
Florida State University for providing experimental equipment and facilities to
conduct some of our experimental corona runs. The help of Lori McFadden on the
Scanning Electron Microscope in the Florida State University Department of Biology
was greatly appreciated.
The Graduate students Swaminathan Kalyana, Giridhar Sathiamoorthy, and
Craig Galban, as well as the undergraduate students Stephen White, Howell Hanson,
Shawn Goldstein, and Jason Maxwell provided assistance in the laboratory.
IV

TABLE OF CONTENTS
List of Tables vii List of Figures xi Abstract xv
Chapter Page
1 INTRODUCTION 1
1.1 Research Objectives 2
2 LITERATURE REVIEW 4
2.1 Corona Discarges 4
2.2 Types of Corona Discharges 5
2.3 Applications of Electrical Discharges 5
2.4 Electric Breakdown Theory for Liquids 9
2.5 The Oxidation of Phenol 17
2.6 Activated Carbon 18
3 EXPERIMENTAL METHODS 23
3.1 Pulsed Power Supply 23
3.2 Pulsed Corona Reactor 24
3.3 Experimental Procedure for Physical Effects Experiments 26
3.4 Analytical Instrumentation 28
v

3.5 Experimental Procedure for Chemical Effects Experiments 29
3.6 Experimental Procedure for Adsorption Experiments 32
4 MODEL FORMULATION AND SOLUTIONS 33
4.1 Problem Definition 34
4.2 Case I - Reaction in Closure, No Mass Transfer 36
4.3 Case II - No Reaction in Closure,
No Mass Transfer (Rectangular Geometry) 43
4.4 Case II - No Reaction in Closure,
No Mass Transfer (Spherical Geometry) 47
4.5 Case III - No Reaction in Closure, Mass Transfer 52
5 EXPERIMENTAL RESULTS & DISCUSSION 58
5.1 Particle Effects on Breakdown Voltage 58
5.2 Scanning Electron Microscopy Results 61
5.3 PIXE Analysis 63
5.4 Particle Effects on Reactor Power Consumption 64
5.5 Phenol Removal 69
5.6 Comparison of Experimental and Theoretical Results 75
6 CONCLUSIONS 79
7 DIRECTIONS FOR FURTHER STUDY 83
APPENDIX 136
REFERENCES 164
BIOGRAPHICAL SKETCH 169
VI
Page
LIST OF TABLES
Table
1. Comparison ofthe Constants for the 3 Model Cases 87
2. Summary of Experimental Results (Physical Effects) 88
3. Elemental Analysis (PIXE) of Activated Carbon and Glass Spheres. 89
4. Summary of Experimental Results (Chemical Effects) 90
Al. Power Consumption for 1 g/L Unwashed Carbon in DI Water 137
A2. Power Consumption for 2 g/L Unwashed Carbon in DI Water 138
A3. Power Consumption for No Particles and 140 uS/cm NaCl Solution 13 8
A4. Power Consumption for 1 g/L Washed Carbon and 14 uS/cm NaCl Solution 139
A5. Power Consumption for 2 g/L Washed Carbon and 14 uS/cm NaCl Solution 139
A6. Power Consumption for 1 g/L Washed Carbon and 140 uS/cmNaCl Solution 140
A7. Power Consumption for 2 g/L Washed Carbon and 140 uS/cm NaCl Solution 140
A8. Power Consumption for 1 g/L Washed Glass Spheres and 14 uS/cm NaCl Solution 141
A9. Power Consumption for 1 g/L Washed Glass Spheres and 140 uS/cmNaCl Solution 141
Vll
AlO. Power Consumption for No Particles and 140 uS/cm CaCl2 Solution 142
All. Power Consumption for 1 g/L Washed Carbon and 14 uS/cm CaCl2 Solution 142
A. 12 Power Consumption for 2 g/L Washed Carbon and 14 uS/cm CaCl2 Solution 143
Al3. Power Consumption for 1 g/L Washed Carbon and 140 nS/cmCaCl2 Solution 143
A14. Power Consumption for 2 g/L Washed Carbon and 140 uS/cm CaCl2 Solution 144
Al 5. Power Consumption for 1 g/L Washed Glass Spheres and 14 uS/cm CaCl2 Solution 144
A16. Power Consumption for 1 g/L Washed Glass Spheres and 140 uS/cm CaCl2 Solution 145
A17. Power Consumption for No Particles and 140 uS/cm KC1 Solution 145
Al 8. Power Consumption for 1 g/L Washed Carbon and 14 uS/cm KC1 Solution 146
A. 19 Power Consumption for 2 g/L Washed Carbon and 14 uS/cm KC1 Solution 146
A20. Power Consumption for 1 g/L Washed Carbon and 140uS/cmKCl Solution 147
A21. Power Consumption for 2 g/L Washed Carbon and 140 uS/cm KC1 Solution 147
A22. Power Consumption for 1 g/L Washed Glass Spheres and 14 uS/cm KC1 Solution 148
A23. Power Consumption for 1 g/L Washed Glass Spheres and 140 uS/cm KC1 Solution 148
Vlll

A24. 46 kV Corona Treatment with No Washed Carbon Phenol Removal 149
A25. 46 kV Corona Treatment with No Washed Carbon Catechol Formation 149
A26. 46 kV Corona Treatment with No Washed Carbon Hydroquinone Formation 150
All. 46 kV Corona Treatment with No Washed Carbon Resorcinol Formation 150
A28. 57 kV Corona Treatment with No Washed Carbon Phenol Removal 151
A29. 57 kV Corona Treatment with No Washed Carbon Catechol Formation 151
A30. 57 kV Corona Treatment with No Washed Carbon Hydroquinone Formation 152
A31. 57 kV Corona Treatment with No Washed Carbon Resorcinol Formation 152
A32. 46 kV Corona Treatment with 1 g/L Washed Carbon Phenol Removal 153
A3 3. 46 kV Corona Treatment with 1 g/L Washed Carbon Catechol Formation 153
A34. 46 kV Corona Treatment with 1 g/L Washed Carbon Hydroquinone Formation 154
A3 5. 46 kV Corona Treatment with 1 g/L Washed Carbon Resorcinol Formation 154
A36. 57 kV Corona Treatment with 1 g/L Washed Carbon Phenol Removal 155
A37. 57 kV Corona Treatment with 1 g/L Washed Carbon Catechol Formation 154
A38. 57 kV Corona Treatment with 1 g/L Washed Carbon Hydroquinone Formation 156
IX
A3 9. 57 kV Corona Treatment with 1 g/L Washed Carbon Resorcinol Formation 156

LIST OF FIGURES
Figure Page
1. Pulsed Power Supply Circuit Diagram 91
2. Pulsed Power Supply, Voltage vs. Time Waveforms 92
3. Liquid Phase Reactor I (Without Jacket) 93
4. Liquid Phase Reactor II (Jacketed Reactor) 94
5. The Effects of Surface Reactions on the Closure Problem (kp=10"V1) 95
6. The Effects of Surface Reactions on the Closure Problem (kp=10"3s"1) 96
7. The Effects of Surface Reactions on the Closure Problem (kp=10"1s"1) 97
8. Rectangular vs. Spherical Geometry in Model Formulation 98
9. The Effect of Mass Transfer Resistance on the Theoretical Model (Kmt= 1 m/s) 99
10. The Effect of Mass Transfer Resistance on the Theoretical Model (Kmt=10"3 m/s) 100
11. The Effect of Mass Transfer Resistance on the Theoretical Model (Km,=l(r6 m/s) 101
12. The Effect of the Surface Reaction Rate on the Bulk Solution Concentration 102
XI
13. Voltage Waveforms for Various Solutions 103
14. Current Waveforms for Deionized Water 104
15. The Effect of Particle Concentration on Breakdown Voltage 105
16. SEM Photograph of Unwashed Activated Carbon 106
17. SEM Photograph of Washed Activated Carbon 106
18. SEM Photograph of Unwashed Corona Treated Activated Carbon... 107
19. SEM Photograph of Washed Corona Treated Activated Carbon 107
20. The Effect of Washed Activated Carbon in a CaCb Solution on the Reactor Power Consumption 108
21. The Effect of Washed Activated Carbon in a NaCl Solution on the Reactor Power Consumption 109
22. The Effect of Washed Activated Carbon in a KC1 Solution on the Reactor Power Consumption 110
23. The Effect of Different Salt Solutions on the Reactor Power Consumption Ill
24. The Effect of Different Salt Solutions and 1 g/L Washed Activated Carbon on the Reactor Power Consumption 112
25. The Effect of Different Salt Solutions and 2 g/L Washed Activated Carbon on the Reactor Power Consumption 113
26. The Effect of Different Salt Solutions and 1 g/L Washed Activated Carbon on the Reactor Power Consumption 114
27. The Effect of Different Salt Solutions and 2 g/L Washed Activated Carbon on the Reactor Power Consumption 115
28. The Comparison of Unwashed Activated Carbon and Washed Activated Carbon in a KC1 Solution on the Reactor Power Consumption 116
29. The Effect of Different Salt Solutions and 1 g/L Washed Glass Spheres on the Reactor Power Consumption 117
Xll

3 0. The Rate of Phenol Adsorption onto 1 g/L Washed Activated Carbon 118
31. The Degradation of Phenol at 46 kV 119
32. The Degradation of Phenol at 57 kV 120
33. Phenol Removal at 46 kV with and without 1 g/L Washed Activated Carbon 121
34. The Degradation of Phenol at 46 kV and 1 g/L Washed Activated Carbon 122
35. Phenol Removal at 57 kV with and without 1 g/L Washed Activated Carbon 123
36. The Degradation of Phenol at 57 kV and 1 g/L Washed Activated Carbon 124
37. Catechol Formation at Various Conditions 125
38. Resorcinol Formation at Various Conditions 126
39. Hydroquinone Formation at Various Conditions 127
40. Byproduct Formation at 57 kV and 1 g/L Washed Activated Carbon 128
41. Phenol Adsorption Equilibrium onto 1 g/L Washed Activated Carbon. 129
42. Rate Determination for Phenol Decomposition at 46 kV 130
43. Rate Determination for Phenol Decomposition at 57 kV 131
44. The Comparison of Experimental and Theoretical Results at 46 kV 132
45. The Comparison of Experimental and Theoretical Results at 57 kV 133
46. The Comparison of Experimental and Theoretical Results at 46 kV and 1 g/L Washed Activated Carbon (kp= 0.00045 s"1) 134
Xlll
47. The Comparison of Experimental and Theoretical Results at 57 kV andl g/L Washed Activated Carbon (kp= 0.00175 s"1) 135
Al. HPLC Calibration for Phenol 160
A2. HPLC Calibration for Catechol 161
A3. HPLC Calibration for Hydroquinone 162
A4. HPLC Calibration for Resorcinol 163
XIV
ABSTRACT
Pulsed streamer corona technology utilizes a non-thermal plasma high voltage
discharge to break down various airborne and aqueous phase organic pollutants.
Pulsed streamer corona discharge in a reactor using a point-to-plane electrode
geometry has been studied with well-mixed aqueous solutions containing various
salts (sodium chloride, potassium chloride, and calcium chloride) and particles in
suspension (powdered activated carbon, porous silica gel, non-porous glass spheres,
and elemental copper). The result that solution conductivity governs the electrode
breakdown voltage is independent of both the salt composition and the particle
properties (i.e., total surface area, particle size, conductivity, and dielectric constant).
Powdered activated carbon in aqueous suspension also dramatically reduces the
reactor electric power as a function of applied voltage. Elemental analysis using
PIXE (proton-induced x-ray emission) of the activated carbon and the water leachate
from washed activated carbon, coupled with pulsed corona treatment experiments
using washed activated carbon, show that interactions of activated carbon with
potassium salts are responsible for the lower reactor power. With the lower power
consumption, greater amounts of contaminants can be removed at a lower power
usage. The combination of pulsed corona and activated carbon enhances phenol
removal through bulk reactions, adsorption, and corona-induced surface reactions.
XV

Primary oxidation products of phenol were also measured. A reaction and diffusion
model was derived to analyze the phenol decomposition with combined bulk liquid
and particle surface reactions.
XVI

CHAPTER 1
INTRODUCTION
Recently, there has been an increased interest in the efficient and cost
effective removal of organic contaminants from groundwater and wastewater.
Hazardous organic contaminants such as phenol, benzene, and PCBs are found in
surface and subsoil water sources and also in treated sewage effluent. Several sources
contribute to this problem including leaking petroleum tanks, landfill and cropland
runoff, and illegal industrial waste dumping. Federal and state laws now mandate
that these contaminants be removed and that clean water be returned to the
environment.
Investigations in the field of removing organic contaminants from aqueous
solutions have included using advanced oxidation technologies such as direct
ozonation (Eisenhauer, 1968, Neigowski, 1953), supercritical oxidation (Krajnc, et
al., 1996, Thornton, et al., 1992, Thornton et al., 1991), UV photolysis (Sun, et al.,
1993), and ultrasonification (Petrier, et al., 1994). Over the past decade, another
technology involving the use of a pulsed streamer corona discharge in the liquid
phase (Clements et al., 1985; Sharma et al., 1993; Joshi et al., 1995; Goheen et al.,
1992) has been found to be an effective way to remove organic contaminants from
aqueous solutions. This technique utilizes chemical radicals and highly reactive
I

molecules (e\ »OH, H«, H2O2, O3) produced from a pulsed streamer corona discharge
that is sustained in an aqueous phase medium. Preliminary studies at the FAMU-FSU
College of Engineering have demonstrated the complete degradation of phenol in
solution (Sharma, 1993), and the determination of the rates of formation of hydrogen
peroxide, hydroxyl radicals, and aqueous electrons (Joshi, 1994). Elsewhere,
activated carbon has been used previously to adsorb organic compounds from both
gas-phase and liquid-phase waste streams (Bansal, et al., 1988, Brandt, et al., 1988).
1.1 Research Objectives
The principal objective of the present work is to investigate the effects of the
addition of several different types of particles to the aqueous phase pulsed streamer
corona reactor, concentrating on both the physical and chemical characteristics of the
discharge. It has been observed in our laboratory that the addition of particles to a
test solution affects the physical characteristics (i.e., streamer length, intensity,
number of streamers, and breakdown voltage) of the streamer corona discharge. The
particles used for this investigation included activated carbon, solid glass spheres,
porous silica gel, and elemental copper dust. The activated carbon and the glass
spheres were also suspended in various salt solutions. The different salt solutions
used were potassium chloride, calcium chloride, and sodium chloride.
To investigate the chemical effects of the added carbon particles, experiments
were conducted to measure the degradation of phenol in the corona reactor. These
phenol experiments were conducted at several applied voltages as well as by varying
the amount of the washed activated carbon suspended in the reactor. Theoretical
models for the bulk and particle phase reaction and diffusion in the particle were
2

derived, solved using averaging methods, and the solutions were compared to the
experimental results.
In this thesis, a literature review in Chapter II will give the background of the
pulsed corona process. The experimental equipment, methods, and procedures will
be discussed in Chapter III. In Chapter IV, a model of the bulk and surface reactions
and diffusion in the particle will be given. The results of a number of experiments
will be presented and discussed in Chapter V. Chapter VI will give the conclusions
and Chapter VII will discuss future experimental and theoretical work.
CHAPTER 2
LITERATURE REVIEW
2.1 Corona Discharge
A corona is a type of electrical discharge. It is formed when an electric
potential is applied between two non-uniform electrodes where a dielectric medium is
placed between the electrodes. The electrical discharge occurs in the dielectric
medium between the electrodes. Corona onset begins when the discharge initiates in
the dielectric medium. The corona onset voltage depends on the type of electrodes
used as well as on the physical properties of the dielectric material between the two
electrodes. At voltages greater than the onset voltage, a corona is formed. As the
applied voltage increases, the corona discharge grows in size. At dielectric
breakdown, the applied voltage is high enough to produce a direct current channel
(spark) that bridges the two electrodes. At the breakdown voltage, the system
essentially short-circuits. The breakdown voltage is also dependent upon the
geometry of the electrodes as well as on the physical properties of the dielectric
medium.
2.2 Types of Corona Discharge
There are several different types of corona discharges (summarized by
Sharma, 1993, Creyghton, 1994, Kalyana, 1997). These corona discharges can be
either negative or positive polarity, and have one of several electrode geometries,
point to plane and wire to cylinder being the most prominent. These corona
discharges can be produced in any insulating medium such as air, water, transformer
oils, and liquid hydrocarbons. For most electrode configurations with a positive
polarity electrical field, the corona discharge starts as a burst pulsed corona. As the
electrical field increases, the discharge becomes a streamer corona and finally a single
spark bridges the gap between the two electrodes (Chang et al., 1991). If the electric
field has negative polarity for a point to plane electrode geometry, the corona
discharge starts as a Trichel pulse corona and proceeds to a glow corona, pulseless
corona, and then a spark discharge where dielectric breakdown occurs at a high
enough applied electric field. The Trichel pulse corona initiates with a pulse
repetition of 2 kHz when the negative polarity electrical field is high enough to
produce ionization. This type of corona is very uniform in its discharge repetition
rate as well as the size and magnitude of the corona discharge.
2.3 Applications of Pulsed Electrical Discharges
Pulsed corona discharges are under extensive investigation and development
in the field of air and water pollution remediation. Gas-phase pulsed corona
discharges have been shown to remove NOx and SOx from industrial waste streams
(Kalyana, 1996, Clements et al, 1989). In the liquid-phase, pulsed corona discharges
have been shown to remove several organic species such as phenol, methylene blue,
5

toluene, and benzene from wastewater streams (Sharma, et al., 1993, Goheen et al.,
1992, Lubicki et al., 1996b). In the aqueous phase, it is assumed that the pulsed
corona discharge injects electrons into the solution. The injected electrons then
collide with the water molecules. If the energy of the electrons is high enough, the
water molecule is broken apart forming a hydrogen atom and a hydroxyl radical. The
hydroxyl radicals are highly oxidizing; however, they also quickly combine to form
hydrogen peroxide.
Pulsed corona discharges have been shown to be useful in the degradation of
organic dyes (Goheen et al., 1992). A reduction in the color of methylene blue,
malachite green and new coccine was observed after pulsed corona treatment. This
reactor had a point-to-plane geometry where the point electrode was in the gas phase
directly above the liquid and the liquid surface served as the ground electrode. The
applied voltage, the discharge current, the electrode spacing, and the oxygen
composition in the gas phase affected the removal of the dyes. Increasing the applied
voltage and shortening the electrode gap distance increases the electric field. The
increased applied voltage led to more electrons that were injected into the gas phase,
resulting in more formation of reactive species. At high oxygen composition in the
gas phase, significant quantities of ozone were produced. This ozone then diffused
into the liquid phase and reacted either directly with the organic or producing a
hydroxyl radical. The hydroxyl radical then attacked the organic dyes.
This work was continued by Sharma et al., (1997) where the group
investigated the formation of ozone in the gas phase and measured the nitric acid
formed in the aqueous phase. The ozone is produced in the gas phase and then
dissolved into the aqueous phase. Ozone was concluded to be the major oxidant in
the solution phase. The group also optimized the point-to-plane gap distance to be
1.5 cm and gave results for the oxidation of methylene blue and carbon tetrachloride.
Similar to the works by Goheen et al., (1992) and Sharma et al., (1997),
Hoeben et al., (1997) used a pulsed electric discharge where the discharge electrode
was located above the surface of the aqueous solution. This group used 31 point
electrodes instead of a single discharge electrode. Hoeben et al., looked at the
removal of phenol and atrazine in aqueous solutions using this electrode
configuration. At an applied voltage pulse of 30 kV and a pulse frequency of 50 Hz,
90% of the phenol was converted to oxidation products in 100 minutes and 50% of
the atrazine was removed in 300 minutes. The proposed reaction pathways were
hydroxyl radials attacks, but the results from Sharma et al., (1997) indicate that
dissolved ozone might be the primary oxidant in this case.
Creyghton (1997a) conducted experiments using electrode configurations
where the discharge electrode was submerged in the aqueous solution and also where
the discharge was located in air above the liquid. For both discharge electrode
positions, the opposite electrode was separated from the water using a glass insulator.
When the discharge electrode was immersed in the liquid, oxygen was bubbled in
through a hollow discharge needle. This led to the production of hydroxyl radicals in
the aqueous phase as well as ozone produced in the gas bubbles that absorb into the
aqueous phase. When the discharge electrode was oriented in the gas phase, surface
streamers were observed.
The destruction of different particles has been investigated using a pulsed
corona (Mikula, et al., 1997). This group investigated the effects of a pulsed
electrical discharge on the shattering of titanium dioxide particles and different wood
particles such as pine needles and sawdust. The electric discharge occurred between
point electrodes (with an electrode radius of 2.5 mm) and a gap distance of 7 mm.
The pulsed discharge increased the number of titanium dioxide particles and reduced
the size of these particles. Also, the wood products were broken down. In the
sawdust, acid hydrolysis increased with an increase in the number of pulses applied,
indicating that there was a larger surface area resulting more micropores were
available for the acid to attack. The destruction was attributed to the discharge
creating shock waves and sound waves.
A pulsed streamer corona has also been investigated for the inactivation of
microorganisms (Sato et al., 1996). The reactor used had a point-to-plane electrode
geometry with a 5 cm electrode gap distance, with both electrodes in the aqueous
phase. Sato investigated the lethal effects of the pulsed corona for yeast cells at an
applied voltage of 19 kV and a pulse frequency of 50 Hz. He showed that as time
was increased, the survival of the yeast cells decreases. Sato concluded that the
destruction of the yeast cells was due to reactions of the hydrogen peroxide with the
cell membrane.
One of the factors affecting the effectiveness of these processes is the voltage
at which the electrode system reaches electrical breakdown. This phenomenon occurs
when the voltage applied to the system is large enough to bridge the two electrodes
and cause the system to break down. For more conducting liquids such as water, the
breakdown strength of the liquid (the lowest applied electric field that would cause
complete breakdown) is lower than that of more insulating liquids such as transformer
oil.
At applied fields of less than the breakdown strength of the liquid,
prebreakdown phenomena are observed. This manifests itself as a partial discharge,
or streamer, that does not completely bridge the two electrodes. This prebreakdown
phenomenon is also observed before the electrical breakdown occurs. Electrical
breakdown can be affected by the temperature and pressure of the system, the
conductivity of the solution, the particles found in the solution, and the electric field
applied to the solution.
Lubicki, et al. (1996a,b) investigated the feasibility of using a pulsed electric
discharge in water as a sterilization process. In this investigation, they looked at the
effect of solution conductivity on the breakdown voltage of the solution. The
conclusion from this work is that the breakdown voltage decreased for increasing
conductivity. The salt used was copper sulfate.
Another group investigating water sterilization was Mizuno et al. (1990).
This group investigated the inactivation of viruses using pulsed high electric fields.
Virus inactivation was observed at applied electric fields of 30 kV/cm applied
between 60-120 pulses. Using an electron microscope, the core of the virus
containing RNA and DNA was damaged by the electrical discharges.
2.4 Electrical Breakdown Theories for Liquids
Creyghton (1994) summarized many different models on how
streamers are formed in the gas phase. Streamers are a single discharge channel
9

emanating from the high voltage electrode. Creyghton also discusses the maximum
stable electrical field in gas phase discharge. When the electric field applied to a
system is higher than the maximum stable field, the primary streamer reaches the
anode and a secondary streamer is formed. He refers to this secondary streamer as an
arc, which is considered to be the electrical breakdown or breakdown. The conditions
that govern the maximum stabile field are the charge density of the medium, the
electric field, and the propagation velocity of the streamer. It is possible that
additional parameters as well as those proposed for the gas phase discharges also
govern the breakdown in the liquid phase.
There are several theories on the electrical breakdown of liquids. First, there
is the hypothesis of a thermal breakdown that is usually associated with pulsed
electric fields of a microsecond or longer. The electric breakdown theory is
associated with pulsed input of less than one microsecond pulse width for liquids with
high electron mobility such as the liquid noble gasses. Both have been proposed as
mechanisms for electrical breakdown but neither has been proven exclusively
(Sharbaugh, et al., 1978). Techniques such as oscilloscope traces, shadowgraph
photography, and ultrafast photography have been employed to further investigate
both of these phenomena (Klimkin, 1981, Klimkin, 1990, Klimkin, 1992, Klimkin, et
al, 1979, Kuskova, 1983, Wong et al., 1977). In the following paragraphs, a
summary will be given for each of these breakdown mechanisms and will also discuss
some of the physical principles involved.
In the thermal breakdown mechanism theory, the electric pulse heats the
liquid to form bubbles and then a Townsend electron avalanche causes the discharge
10

in the gas (bubble) phase (Devins, et al., 1981). Several experimental results would
tend to favor this theory. It has been shown experimentally that the breakdown
strength of liquids decreases with increased temperature (Kok, 1961). Bubbles will
form in the liquid if the local temperature of the liquid causes the liquid to boil and
thus form the micro-bubbles where the gas phase discharge would take place.
Sharbough (1978) first estimated the heat input, W (units of energy per unit
volume per unit time), to 1 cm3 of hexane liquid per microsecond of applied voltage
(Devins, et al., 1981). For hexane the breakdown field is about 1.6 MVcm'1. The
current density, j, in the liquid has been measured to be on the order of 1 to 10 Acm"2.
Then,
W = E|ocalj local (2.1)
and
W = 20 cal cm"3 us"1 = 40 cal g"1 us"1 (2.2)
The amount of heat required to increase the temperature of m grams of liquid from
the ambient temperature Ta to the boiling point Tb and then to vaporize it is
AH = m[cp (Tb - Ta) + Lb] = 100 cal g"' (2.3)
where cp is the average specific heat and Lb is the latent heat of vaporization. This
equation has been calculated for hexane. Thus, for hexane, if the voltage pulse
duration is more then 2.5 us, there is enough energy for the formation of a vapor
bubble.
For water, the breakdown voltage is 300 kV/cm (Jones and Kunhardt, 1995a)
and the average power density applied to an electrical discharge is on the order of 108
Wem* of 24 cal g"1^'1. The energy required for vapor bubble formation is
11

619 cal g"1, which would indicate that the pulse would need to be 26 u.s long to form a
vapor bubble. When the applied voltage is introduced to a liquid at a higher
temperature, the heat necessary to form a vapor phase is less due to a decreasing
difference between ambient and boiling temperature. Thus, the bubble forms sooner
and the electron avalanche forms much quicker, leading to lower breakdown strength
as the temperature rises.
It has been shown experimentally that the breakdown strength of liquids
increases as the ambient pressure increases (Jones and Kunhardt, 1995b). From the
argument used in the previous paragraph, the breakdown strength decreased due to
the temperature of the liquid increasing. If the liquid was kept at a constant
temperature and the pressure was increased, the boiling point would then rise with the
pressure. This increased boiling temperature would then increase the difference
between the boiling point and the ambient temperature. With this increase in boiling
point, it would require more energy to heat and vaporize the liquid, requiring the
electric discharge to have a longer pulse width. This effect of increasing pressure
would then cause the breakdown strength of the liquid to increase.
Other evidence supporting the role of bubble formation involves ultra fast
photography and shadowgraph techniques (Klimkin, 1981, Klimkin, 1990, Klimkin,
1992, Klimkin, et al., 1979). In some studies, shock waves were observed using a
Schlieren system, possibly indicating the formation of a gaseous cavity (Klimkin,
1992). Sonic, current, and light signals occur simultaneous with the onset of
breakdown (Klimkin, 1990). It is believed that the sonic signal comes from the gas
phase and the light signals are then produced by electrical discharges in the gas phase.
12

Prebreakdown streamers were observed to scatter light and to decay into large
bubbles as time went on. For viscous liquids, the electrical discharge was observed
microscopically and the formation and growth of a gas bubble was observed.
There are discrepancies in the thermal bubble mechanism. In the
observations of the scattered light, the time at which the light occurred was 5 jxs after
the applied discharge. This mechanism says nothing about how the bubbles precede
or follow local breakdown. It is still not clear whether the bubbles lead to breakdown
or if the breakdown leads to bubbles. The Townsend electron avalanche theory
developed for gas phase discharge predicts that the discharge initiates from the
cathode, whereas the discharge in the liquid phase initiates from the anode. Further,
the temperature dependence of the intensity of the light pulses is opposite to that
expected for a change in surface (expansion of a bubble).
As stated above, the theory of thermal bubble formation does not explain
dielectric breakdown in liquids where the applied voltage is sustained for less than a
microsecond. The other common theory is more of an electric method (Wong, et al.,
1977). This theory assumes that the current is initiated from the field emission and
then current grows by electron multiplication, similar to that of the Townsend
breakdown in gases, but occurring in the liquid. The resulting positive ions enhance
the cathodic field and lead to extremely high currents. Once the electrons are injected
into the liquid, they gain strength from the applied electric field. It is assumed that
the field is high enough that the electrons will gain more energy from the field than
they will lose in non-ionizing molecular collisions with the liquid. These electrons
then gain enough energy to start to ionize the liquid molecules and then form the
13

electron avalanche. The energy of the electron is highly dependent on the mean free
path of the electron. When this number is low, there will be higher energy losses
from non-ionizing collisions. Likewise, the higher the mean free path, the longer the
applied field has to energize the electron before it ionizes a molecule.
Again, there has been experimental data in support of the electric breakdown
theory. There has been experimental evidence of electrons having energies higher
than 2.5 eV from the emission of light under high electrical stress (Kok, 1961). This
electron energy is high enough to cause the liquid molecules to ionize. This is
evidence for the production of highly energetic electrons, but it does not differentiate
between electrons produced in a gas or a liquid.
Furthermore, there is experimental evidence that when the phase is changed
from a liquid to a gas at the critical temperature in SFö, CO2, and hexane, there is
continuity in the breakdown strength (Sharbaugh et al., 1978). The breakdown
strength is a measure of the liquid breakdown voltage. The higher the breakdown
strength for a given liquid medium, the higher the applied voltage is necessary to
cause breakdown. This indicates that the mechanism for the breakdown is the same
for both phases, and gives some credence to the electric effect because in both the gas
phase and the liquid phase both have collisional ionization mechanisms (electron
avalanches). This collisional ionization has also been observed in monatomic
molecules such as Xenon and liquid Argon. It is thought that polyatomic molecules
such as hydrocarbons would cause higher electron energy losses and might allow the
creation of high-energy electrons necessary for the electron avalanche.
14
Experimental evidence that does not support the electric theory of breakdown
has also been shown. The theory does not deal with the pressure dependence
consistently. Even with high-pressure changes in the liquid, the mean free path
should not change very much for a nearly incompressible fluid and thus the electric
strength of the liquid should not change very much. For a change of 25 atm, the
breakdown strength increases about 50% for hydrocarbons.
Another theory of the liquid breakdown is the suspended particle theory (Kok,
1961, Zhekul, 1983). Many liquids such as transformer oil contain high levels of
particles on the order of 1 um and smaller. They are present in virtually all liquids at
some size and concentration. This theory bases the liquid breakdown process on
particle interactions with the electrical field. The suspended particles are assumed to
have a dielectric constant that is larger than that of the liquid. As a result of an
applied electrical field, the electrical forces in the direction of the electrical stresses
move the particles. Eventually, the particles will form a "string" that will connect the
anode and the cathode and a discharge will take place along this path. This theory is
dependent upon the size and concentration of the particles, the viscosity of the liquid,
and the duration of the electric pulse. The size of the particles as well as the viscosity
of the liquid determines the friction losses of the particle motion through the liquid.
The duration of the electric pulse affects the time allowed for the electrophoretic
motion of the particle. This process has been shown experimentally in some systems
of transformer oil with added metallic particles. Although there is electrophoretic
motion of particles in virtually every liquid system, it does not predict the observed
dependence of temperature on the breakdown strength of the liquid.
15

Recently, Jones and Kunhardt have described a model focusing on the time
from the voltage pulse initiation to breakdown (Jones and Kunhardt, 1995a). The
features of this model start with the formation of a low-density region like a bubble.
This bubble is formed by nucleation near one of the electrodes where local heating is
taking place due to high electric field currents. Then, an electron avalanche develops
when the density of the bubbles reach a critical value, Nc, which is 1020 cm"3. When
the local field caused by the avalanche reaches the magnitude of the applied field, it
hinders growth of the avalanche. As the electron avalanche grows, the electrons heat
the region as they propagate, and thus lower the density of the area that they are
growing into. This then allows for the electron avalanche to begin again in a new
region. This cycle of local heating, density lowering, electron avalanche growth, and
retardation then propagates the front across the gap. The time lag before breakdown
is broken up into four different times. These are
Xbd = Xnuc + Tex + Tor + Xr (2.4)
where xbd is the time to breakdown, xnUc is the time for the heating of the liquid and
the formation of a nucleation site , tex is the time for the growth and expansion of the
nucleation site until it reaches the critical density (Nc) so that electron ionization can
take place, and xar is the time for the growth of the electron avalanche until the local
space charge retards its growth. xr is the time for the interval between the retardation
of the bubble in which the electron avalanche takes place and than the subsequent
bridging of the gap by the propagation of the ionizing front.
Electrons ahead of the ionization front are continuously injected into the
liquid side of the interface. These electrons then heat the liquid, causing nucleation
16

and growth, and then cause the electron avalanche to occur ahead of the front. The
power deposited by these electrons is dependent on the trailing ionization column
because this determines the energy flow from the electrode. Thus the resistance of
the trailing column determines the heating rate of the liquid just ahead of the
ionization front, and thus the speed of the ionization front. The rate of growth of the
electron density at the front is determined by the ionization time, ii« l/(avd), where
vd is the electron drift velocity. Again with the parameters used above, the time is on
the order of picoseconds. This would then lead to a growth in the ionization time x,.
Jones concludes that the growth observed experimentally is much slower than this,
and thus the heating of the liquid ahead of the ionization front needs additional time.
2.5 The Oxidation of Phenol
Phenol oxidation is a very well studied process. Phenol degradation has been
observed in supercritical water (Thornton, et al., 1991, Thornton et al., 1992, Krajnc,
et al., 1996), by sonication (Pettier, et al., 1994), by ozonation (Niegowski, 1953,
Eisenhauer, 1968), by UV photolysis (Sun, et al., 1993), and by pulsed streamer
corona (Sharma et al, 1993). In most of these works, the oxidation of phenol was
achieved through reaction with a hydroxyl radical. The hydroxyl radical
electrophillically attacks the phenol to form the primary products catechol, resorcinol,
and hydroquinone. The hydroxyl radical then reacts with the primary products to
produce muconic and fumuric acids as well as other organic acids. These organic
acids then get oxidized to form the smaller organic acids such as oxalic and formic
acid. The final end products of the hydroxyl radical oxidation of phenol are carbon
dioxide and water.
17
In the pulsed streamer corona, hydroxyl radicals are produced as well as high
concentrations of hydrogen peroxide. Fenton's reaction has been used in several
works (Joshi, 1994, Joshi, et al., 1995, Sharma, 1993, Sharma et al., 1993, Sun, et al.,
1993, Zepp, et al., 1992) to convert hydrogen peroxide to hydroxyl radical using the
following reactions
hv
Fe^ + H202 -+ OH« + OH- + Fe^, (2.5)
which is the Fenton's reaction and
hv
H202 -► 20H« (2.6)
which is the photo-Fenton's reaction. These reactions have been shown to work best
at low pH. Both reactions have been observed in UV photolysis where hydrogen
peroxide is injected into the waste stream and subjected to UV light ((Sun, et al.,
1993, Zepp et al., 1992).
Fenton's reaction has also been shown to occur in pulsed streamer corona
(Sharma et al., 1993, Joshi et al., 1995). Without the addition of ferrous ions to
promote Fenton's reaction, there was little degradation of phenol. With ferrous ions
added, significant degradation of phenol occurred.
2.6 Activated Carbon
Activated carbon is a form of carbon that has been treated to have a very high
porosity. The raw materials used most for the processing of activated carbon are
lignite, coal, wood, coconut shells, and petroleum residues (Kinoshita, 1988). These
materials are carbonized by heating them in the absence of oxygen. These particles
18

are then activated by chemical activation or gas activation. Chemical activation
involves the addition of inorganic chemicals to the raw materials during carbonization
to dehydrate the organic molecules. Gas activation requires that the carbonized
substance be heated in steam to oxidize the surface sites. There is a large
concentration of ash (15 -20%) left in the activated carbon after processing. This ash
is usually water soluble and composed of aluminum, iron, magnesium, and calcium
silicates.
The process used to make activated carbons leads to particles with very high
total surface area ranging from 450 m /g to over 1500 m /g (Kinoshita, 1988, Bansal,
et al., 1988). The pore size is typically in the range of 1 - 100 nm in diameter. The
different pore diameters correspond to different applications. For example, the
smaller pore sizes would be used in gas phase applications and the larger pore sizes
would be used for liquid phase applications.
Activated carbons are used for the removal of organic pollutants from air and
water (Jankowska, et al., 1991, Bansal, et al., 1988). This is due to the fact that
activated carbon is a superb adsorbent. Other applications of activated carbon include
solvent recovery, deodorizing, decolorizing, and gas separation. Most of these
processes require that after the activated carbon has been used, it must be regenerated.
This is sometimes accomplished by heating the carbon and burning off the adsorbed
materials.
Activated carbon has been shown to decompose hydrogen peroxide in an
electrochemical process (Bansal, et al., 1988, Jankowska, et al., 1991). This
decomposition occurs both on the surface of the carbon as well as in the solution.
19

The rate at which this happens increases with increasing pH as well as with increasing
temperature. Experimental evidence has shown that when activated carbon is given
an electrical potential (i.e., as an electrode in an electrochemical system), it can
oxidize ferrous ions to ferric ion as follows,
Fe2+->Fe3+ + e" (2.7)
(Bansal, et al,. 1988). This oxidation might lessen the effects of Fenton's reaction in
the solution.
Little work has been done to study reactions of organic species occurring on
the surface of the activated carbon. Vidic et al. (1993) reported the polymerization of
phenol on the surface of activated carbon. This occurred only for the case where
molecular oxygen was present in the system. This polymerization increased the
adsorption capacity of the activated carbon. The amount of polymerization of phenol
adsorbed on to the surface of the activated carbon was dependent on the amount of
oxygen present.
Logemann et al., (1997) uses a catalyst to promote advanced oxidation
reactions on the surface of a catalyst with the brand name ECOCLEAR. The
composition of the catalyst is not given but the material has high adsorptive
properties. The ECOCLEAR process involves a bed of the catalyst upon which the
contaminated liquid is circulated. Ozone is then bubbled into the reaction chamber.
It is postulated that the ozone is adsorbed onto the catalyst surface as an 0» radical
and then reacts with an adjacent contaminant adsorbed on the surface of the
ECOCLEAR. Arguments are given that the process does not use hydroxyl radicals
20

and that the reaction takes place on the surface of the catalyst, although the
supporting evidence does not necessarily agree.
Hydroxyl radicals are easily formed at high pH but do not form as readily at
lower pH. Experiments were conducted at three different pH values where at low pH,
the decolorization of sulfuric acid was studied, and at neutral and high pH, the
removal of COD and AOX from industrial waste streams was conducted to see if
hydroxyl radicals played any part in the reaction. At the low pH, the time to reach
94% removal was 7.7 h at a 1.0 g/L ozone dose, and 16.7 h at a 1.9 g/L ozone dose.
At the neutral pH, it took 3.8 h to convert 44% of the COD and 63% of the AOX at a
1.4 g/L ozone dose. At the high pH, 46% COD conversion and 81% AOX conversion
were achieved in 3.1 h at an ozone dose of 1.6 g/L. It is difficult to conclude the
effect of pH because more than one variable is changing from one experiment to the
next, but it seems that the reaction takes place much slower at the low pH and
increases as the pH is increased, indicating that hydroxyl radicals might be present in
the reaction. The increase in reaction time with an increase in ozone dose at the
lower pH might also indicate that the reaction does not depend on the amount of
ozone present, which would contradict the proposed mechanism of reaction.
The authors also conclude that the reactions take place on the surface of the
catalyst because solution temperature does not have much effect on the rate of
conversion. They reported an experiment that observed the decolorization of a waste
stream at 20°C and 80°C. With similar ozone doses, the color removal was 100%
after 1.3 h at 80°C and 98% after 2.4 h at 20°C. This indicates that the reaction
proceeds twice as fast at the higher temperatures, which might indicate that the
21
reactions take place in the liquid phase according to the author's arguments. The
process in which this reaction takes place is difficult to evaluate with the data given,
the lack of information on the catalyst, and without the analysis of the reaction
products.
22

CHAPTER 3
EXPERIMENTAL METHODS
3.1 Pulsed Power Supply
A schematic of the pulsed power supply used is shown in Figure 1. The unit
is composed of two modules: 1) a commercial transformer-rectifier, and 2) a pulse
forming network. The transformer- rectifier is a Universal Voltronics 0-100 kV DC,
50 mA high voltage power supply. The transformer-rectifier set uses a 208 V, single
phase alternating current input. Internal rectifiers were removed from the circuit,
giving a 0-100 kV AC variable voltage output.
The second module takes the AC voltage from the transformer-rectifier set
and forms a short pulsed voltage output. The transformer-rectifier high voltage first
goes through a series of high voltage resistors that limits the current that goes through
the rest of the circuit. A series of diodes then half-wave rectifies the alternating
current source. An array of capacitors (2700 pF) stores the charge. Connected next in
the circuit is a rotating rod high voltage spark gap that rotates at 1800 rpm, which
aligns the rod electrode with the two sphere electrodes twice in each rotation, leading
to an alignment frequency of 60 Hz. When the spark gap aligns, the charge stored in
the capacitors is discharged across the gap and sent into the liquid-phase reactor. The
23

pulsed corona is then formed discharging from the high voltage point electrode, and
the discharge grows towards the ground plane electrode.
Figure 2 shows the transformation of the voltage waveform within the pulse
forming circuit. Entering the pulse forming circuit is an alternating current voltage
waveform that is a typical sinusoidal wave. After leaving the diodes, the voltage
waveform becomes half-wave rectified. At this point, the negative component of the
sinusoidal wave is removed. During the cycle when the spark gap is not aligned, the
capacitors charge. As the spark gap aligns, the capacitors discharge across the gap
into the reactor. As indicated, the expected voltage pulse has a very fast rise time on
the order of 20 ns, and then an exponential decay. The voltage pulse width is
dependent on the type of solution in the reactor and is in the range of 1 fj.s to 1 ms.
3.2 Pulsed Corona Reactor
The pulsed corona reactor shown in Figure 3 was used for investigating the
physical effects of the addition of the various particles to aqueous solutions. This
reactor consisted of a 1 L glass vessel with an opening, ported top. The high voltage
input for the discharge point electrode comes in at the top of the reactor through a
glass U-tube. Inside of the reactor, the end of the high voltage wire inside the U-tube
is attached to a hypodermic needle with a mechanically sharpened tip. The high-
voltage pulse is discharged into the solution at this point electrode. The stainless steel
ground plane is located in the solution 5 cm directly above the point electrode. The
ground plate is attached to an earth ground. There is a magnetic stirrer at the bottom
of the reactor vessel to ensure a well-mixed solution. This reactor did not have any
cooling mechanism to keep the reactor at constant temperature. This was not needed
24

due to the very short duration of the experiments carried out in this reactor. The
temperature of the solutions during these experiments varied only 1-3 °C.
The pulsed corona reactor shown in Figure 4 was used for the experiments
investigating the chemical effects of the addition of activated carbon and various salts
to aqueous solutions. The reactor consists of a 1 L glass vessel with an opening,
ported top that also had an outer water jacket to keep the solution at a constant
temperature. The cooling water flowed around the jacket and kept the temperature of
the reactor vessel at 20.0 °C. High voltage is introduced into the reactor through a
glass tube penetrating the reactor side wall. The tube enters the reactor and bends at a
90° angle at the center towards the top of the reactor. At the end of this tube, a fitted
glass cap contains a mechanically sharpened 1mm diameter stainless steel wire.
Again, this point electrode is connected to high voltage. The stainless steel ground
plane electrode is located in the solution 5 cm directly above the point electrode. This
ground electrode is attached to an earth ground. There is a magnetic stirring bar at
the bottom of the reactor to keep the solution well mixed. There are three open ports
on the lid of the reactor used for taking samples during the experiments.
The particles used in this study were activated carbon (obtained from Fisher
Scientific, 75 - 300 um particle size), spherical silica glass beads (obtained from
Potter Industries, 110-180 urn diameter, 53-78 um diameter, 30-60 urn diameter, and
25 urn and finer diameter particle size), porous silica gel (Supelco, Davison Grade 12
mesh size 100/120), and copper particles (Fisher, 35-40 um diameter particle size).
The activated carbon and the smallest size glass spheres were used both in an
25

unwashed and a washed state. The unwashed particles were used in the state that they
were supplied. The washed particles were thoroughly rinsed before use. The
treatment consisted of adding 50 g of the particles to 5 L of deionized water and
mixing the suspended particles for two hours. The particles were then filtered using 1
urn filter paper and dried at 105 °C. This process was repeated seven times at which
point the wash solution conductivity was that of deionized water, or 1 ^iScm"1, which
indicated that all of the salts on the surface of the carbon washed off.
Salts were added to some experimental solutions to achieve certain solution
conductivities. Other organic species were added to the solutions and particle
suspensions for testing the removal fraction using pulsed streamer corona. The salts
and other chemicals used throughout the study were reagent grade potassium
chloride, calcium chloride, sodium chloride, ferrous sulfate, phenol, resorcinol,
hydroquinone, catechol, acetic acid, and acetonitrile (all obtained from Fisher
Scientific). All chemicals were used as they were received from the manufacturer.
3.3 Experimental Procedure for Physical Effects Experiments
To investigate the physical effects of the addition of particles on the pulsed
streamer corona, the following procedure was used. First, 1 L of deionized water was
added to the reactor. Then the desired amount of particles and salts were added to the
deionized water and the magnetic stirrer was engaged to suspend the particles and
mix the salt solution. Before pulsed corona treatment, initial measurements of
conductivity (Cole-Parmer Model 1484-10 conductivity meter), pH (Fisher Accumet
950 pH meter), and temperature (standard mercury thermometer) were recorded.
The reactor was then connected to the high voltage pulsed power supply,
26

which was engaged and set to 10 kV dial voltage. Dial voltage is the pulsed voltage
that is indicated on the front of the power supply. The dial voltage is not a true
measurement of the actual pulsed voltage. At 10 kV, a Tektronix TDS 460 fast
digital storage oscilloscope was used to analyze voltage and current waveform
characteristics. A Tektronix P6015A high voltage probe wired in parallel with the
input of the pulsed power to the reactor was attached to the oscilloscope to record the
voltage waveform. The reactor current waveform was measured in series with the
ground using a P6021 Tektronix current probe. The reactor electric power was
calculated by integration of the product of voltage and current by the oscilloscope.
The waveform properties analyzed were maximum peak pulsed voltage, voltage rise
time, voltage pulse width, maximum current, and power, as well as the average
current read on a dc ammeter. Visual observations of the streamer properties such as
length, thickness, color, and quantity were also noted.
After these measurements were taken, the voltage was increased in increments
of2.5kV. At each voltage step, the same measurements were taken. The voltage
was increased until breakdown (or sparkover) between the point and plane electrodes
were achieved. At this stage, a single spark bridges the two electrodes causing the
system to short circuit. At breakdown, the voltage is quickly turned off in order to
not damage any of the electrical circuitry. A the conclusion of each experiment, final
readings of conductivity, pH, and temperature of the solution were measured.
For the investigation of the physical effects of the added particles, the
following particles and salts were used. Aqueous suspensions of particles alone (no
salts added) were conducted with 1,2,4, and 6 g of the unwashed activated carbon, 1,
27
and 2 g of the washed carbon, 1,2, and 5 g of the <25 ^m unwashed glass spheres, 1
and 2 g of the <25 urn washed glass spheres, 1 and 2 g of the 30 - 60 um glass
spheres, 1 and 2 g of the 52 - 78 urn glass spheres, 1 and 2 g of the 110 - 180 urn
glass spheres, 1 and 2 g of the silica gel, and 2 and 5 g of the copper particles.
Salt solutions (without particles) were made with potassium chloride at 14 and
140 jiScm"1 (adding 1 mL and 10 mL of a 0.1 M potassium chloride stock solution to
1 L deionized water), calcium chloride at 14 and 140 uScm"1 (adding 0.5 mL and 5
mL of a 0.1 M calcium chloride stock solution to 1 L deionized water), and sodium
chloride at 14 and 140 fiScm'1 (adding 1 mL and 10 mL of a 0.1 M sodium chloride
stock solution to 1 L deionized water). Combinations of the salt solutions and the
particles were made at both concentrations of the washed activated carbon and each
of the six salt solutions individually. Additionally, experiments were done with the
combination of both the <25 (am washed glass beads and each of the six salt solutions
individually. All experiments were repeated at least three times to ensure that the
error was less than 5-7 % (using a 95% confidence interval, see Appendix).
3.4 Analytical Instrumentation
Samples of 1) the unwashed activated carbon, 2) the solution resulting from
the suspension of the unwashed activated carbon, and 3) the solution resulting from
the suspension of the unwashed glass spheres were sent to PIXE Analytical
Laboratories (1380 Blounstown Highway, Tallahassee, FL, 32304) for elemental
analysis. PIXE is elemental analysis using proton induced x-ray emission. The
solutions for the carbon and glass leachate were obtained from the first solution in the
28

washing procedure mentioned above. The carbon sample was sent in the form
received from the manufacturer.
Scanning electron microscopy (SEM) was conducted on several activated
carbon samples in the Department of Biological Sciences, Florida State University,
Tallahassee, FL. Samples of unwashed activated carbon, washed activated carbon,
corona treated unwashed activated carbon, and corona treated washed activated
carbon were analyzed. The corona treatment consisted of suspending 1 g of the
carbon in 1 L deionized water, and treating the solution at an applied voltage of 46
kV (maximum applied voltage) for 10 minutes. The carbon was then filtered out,
dried, and sent for analysis. The SEM apparatus also had an x-ray emission apparatus
incorporated with the SEM. The x-ray emissions qualitatively analyze the elements
present on the surface of the carbon. The x-ray emissions apparatus was not
calibrated to give quantitative results of the concentrations of these elements.
3.5 Experimental Procedure for Chemical Effects Experiments
To investigate the effects of the activated carbon particles on the chemistry of
the induced reactions, a Perkin-Elmer HPLC was used for the analysis. Aqueous
samples were injected into a Supelcosil C18 column (25.0 cm X 4.6 mm) in a mobile
phase of 0.5% acetic acid, 5.0% acetonitrile, and 94.5% deionized water. The flow
rate of the mobile phase was 1.0 mL per minute. A Perkin-Elmer LC80
Spectrophotometer attached to the HPLC analyzed the separated solution at a
wavelength of 280 nm. The recorded peaks were identified and quantified from a set
of calibration standards of phenol and the primary oxidation byproducts catechol,
hydroquinone, and resorcinol. The phenol and resorcinol were calibrated with 5,10,
29
25, 50, and 100 ppm standard solutions. The catechol was calibrated with 5, 10, 25,
and 50 ppm standard solutions. The resorcinol was calibrated with 5, 10, and 25 ppm
standard solutions. The calibration curves for these compounds can be found in the
Appendix.
The experiments focusing on the chemical aspects of the activated carbon in
aqueous suspension were performed in the jacketed reactor. As stated before, the
temperature of the water in the cooling jacket was kept constant at 20.0 °C. 1 L of
deionized water was first added to the reactor. To the deionized water, 10 ml of a
10,000 ppm phenol solution was added to obtain a 100 ppm phenol solution in the
reactor. In all of the experiments this was the starting phenol concentration. Also,
0.1348 g of ferrous sulfate (FeS04«7H20) was added to the reactor on each run to
promote Fenton's reaction. This addition of ferrous sulfate corresponds to a 485 mM
solution which is the optimal level found experimentally by Sharma et al., (1993).
Two samples were taken before treatment and injected in to the HPLC. The
initial solution was sampled to measure the conductivity, pH, and temperature before
the experiment. If particles were used in the experiment, they were added at this
point. The reactor was then attached to the high voltage and then the power was
turned on and the applied voltage was set to the treatment voltage level. During the
trial, ~2 mL liquid samples were taken out of the reactor at 1,2,4, 6, 8,10, and 15
minutes treatment time. This was done by placing a syringe having Tygon tubing at
the end inside one of the sampling ports on the reactor lid. The tubing was lowered
under the ground electrode and the sample was taken. The sample was then
transferred to a sample bottle by removing the Tygon tubing and placing a syringe
30

filter (0.6 um pore size) on the end of the syringe, and then injecting the sample into
the bottle. The samples were then analyzed by the HPLC within two hours of
sampling.
During the corona treatment, measurements of the maximum peak voltage,
voltage rise time, voltage pulse width, maximum current, and power were recorded
from the oscilloscope. After fifteen minutes, the corona was turned off. Post-corona
measurements of the conductivity, pH, and the temperature of the solution were then
recorded.
There were five different experimental conditions used to determine the
chemical effects of adding carbon particles to the pulsed streamer corona reactor.
The initial phenol concentration for all of the experiments was 100 ppm and the
ferrous sulfate concentration was 0.1348 g/L for all of the experiments. First, an
experiment was conducted to determine the rate of adsorption of the phenol on to the
surface of the activated carbon. For this, 1 g/L of the washed activated carbon was
suspended in deionized water in the reactor and pulsed corona was not used. This
allows for adsorption to occur with no reactions taking place. Two experimental
conditions were investigated without the addition of activated carbon to determine the
rate of reaction of the phenol and the formation of byproducts without any interaction
with the activated carbon particles. These were conducted at the two corona
treatment voltages of 46 kV and 57 kV. Finally, two experimental conditions
combined the corona-induced reactions and the adsorption and possible surface
reactions of the activated carbon. 1 g/L washed activated carbon was suspended in
deionized water in the reactor and the corona treatment voltages were 46 kV and 57
31
kV. At each experimental condition, 3 trials were made to ensure that the error was
less than 5-7 % (using 95% confidence interval, see Appendix).
3.6 Experimental Procedures for Adsorption Experiments
Experiments were performed to measure the adsorption equilibrium constant
for the adsorption of phenol onto the washed activated carbon. This was done with
25, 50, and 100 ppm phenol solutions, and with 1 g/1 washed activated carbon
suspended in solution. An initial sample of each phenol solution was injected into the
HPLC before adding the washed activated carbon. After adding the washed activated
carbon, the particles were mixed and suspended in the solution for one hour. During
this time, the solution was kept at 20.0 °C using the jacketed reactor. After one hour,
a final sample was injected into the HPLC for analysis.
32

CHAPTER 4
MODEL FORMULATION AND SOLUTION
Reaction and diffusion in porous media is of continuing interest for chemical
engineers. The processing of many materials involves heterogeneous reactions taking
place on the surface of catalysts. These problems also occur in various organs,
tissues, and other cellular materials. Different models have been developed to
analyze the problem. One model used a set of random spheres to estimate the
structure of the porous media. Another model was developed to represent the
porous particle as a random set of capillary tubes modeling the pores in the catalyst.
Due to the complex nature of the porous catalysts, a volume averaging
technique was developed by Whitaker (1967), and expanded by Ochoa, et al. (1986),
Ryan, et al. (1981), Whitaker (1987), and Whitaker, (1991). This technique begins
with phase averaging the species continuity equation in the catalyst pores. The
resulting volume averaged equations could be solved to determine a profile of the
phase average concentration within the particle. One advantage of this method is that
the specific geometry of the internal pores is not needed except to determine the
effective diffusion. In the present work, the governing phase averaged equations are
again averaged in the cross section of the particle using the appropriate length scale.
33

This requires a solution of the closure problem. The closure problem first relates the
phase averaged concentration to the cross-sectional area average concentration and a
concentration deviation variable. The equation for the deviation variable is then
solved. Finally, the resulting set of ordinary differential equations is solved
analytically to find the cross-sectional area averaged concentration as a function of
time.
4.1 Problem Definition
The reaction and diffusion problem will provide a theoretical representation of
the experimental system that combines the reactions induced by the pulsed streamer
corona in the bulk as well as the surface reaction, mass transfer, and adsorption
associated with the activated carbon particles. For the model, only one reactive
species is considered, although generalization to the multicomponent case is under
development. Phenol will represent this species in the experimental system.
The phenol is in the bulk liquid phase initially, and the solution is well mixed
so that the phenol concentration is uniform throughout the reactor. At time 0,
activated carbon particles are suspended in the reactor and the pulsed corona
treatment begins. The particles are evenly distributed throughout the reactor. A
boundary layer forms around the particle and becomes a mass transfer resistant layer.
The phenol diffuses from the bulk phase through the mass transfer layer, and then
through the particle. The aqueous phase pulsed corona produces reactive species in
the bulk and possibly on the surface that react with the phenol. For the model, these
reactions are assumed to be first-order and irreversible. Reactions are assumed to
34

take place on the surface of the activated carbon as well. Again, these reactions are
considered to be first-order and irreversible.
Three cases will be considered. First, the case with no mass transfer will be
solved. The first case will also consider the reaction term in the closure problem.
The second case will assume the reaction term in the closure term to be negligible,
while neglecting mass transfer. The second case will be solved in both rectangular
geometry as well as spherical geometry. The third case will consider the mass
transfer resistant case without the reaction term in the closure problem. A
comparison of the three cases will also be given.
x=0 x=X
/'"'" c (x =
±u
Mass transfer Layer
Porous Activated Carbon
35

4.2 Case I- Reaction in Closure, No Mass Transfer
For a first approximation, many identical particles are suspended in a well-
mixed solution containing one species, c. The resulting material balances are the
species continuity equations in the bulk phase,
where cb is the concentration in the bulk solution, and kb is the reaction rate in the
bulk phase, D is the effective diffusion coefficient in the particle phase, V is the fluid
volume, and A is the external surface area of all the particles. The value of A then
represents the surface area of all the particles suspended in the bulk solution. The
first term in Equation (4.1) is the accumulation term, the second term is the mass flux
from the bulk phase to the particle phase, and the third term is the reaction in the bulk
phase. The species continuity equation in the particle phase is
— = D—° dt dx
= Z)^T-V (4-2)
where c is the concentration in the particle, and kp is the effective reaction rate in the
particle. The first term in Equation (4.2) is the accumulation term, the second is the
diffusion through the particle, and the third is the reaction term in the particle.
The boundary and initial conditions are as follows
cl=*= Kc*\*=x (4.3)
£U=° (4.4)
cb(t = 0) = cb0 (4.5)
36
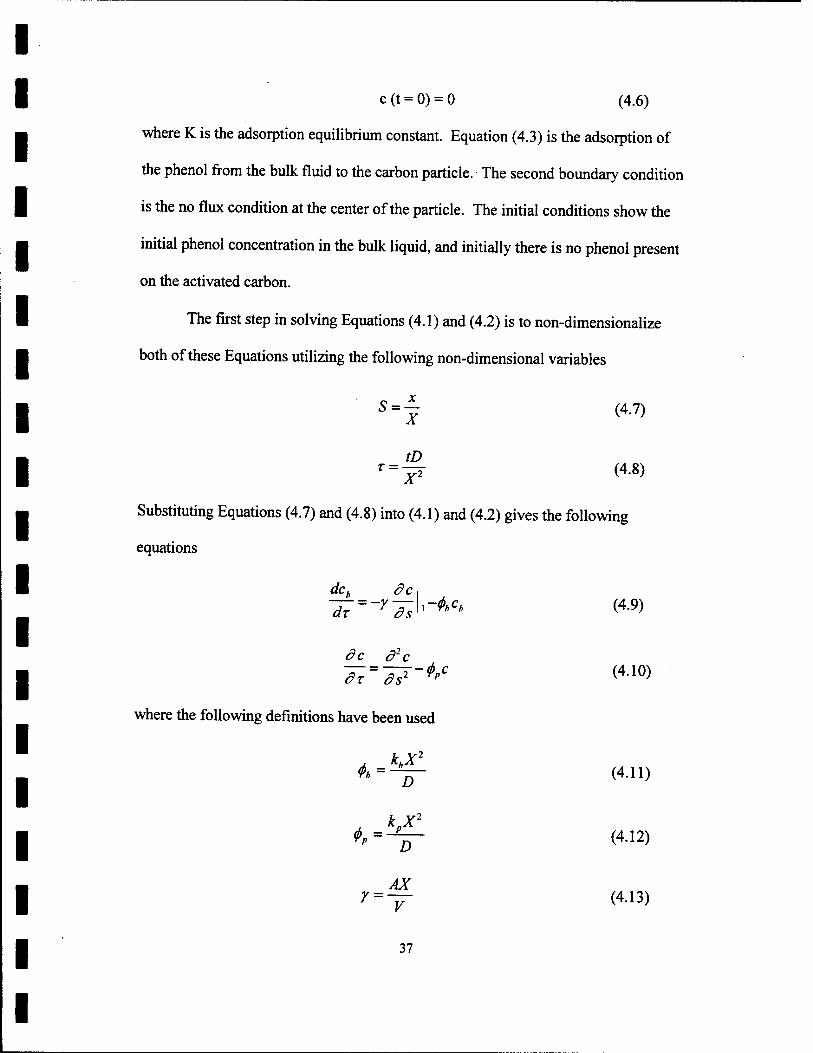
c(t = 0) = 0 (4.6)
where K is the adsorption equilibrium constant. Equation (4.3) is the adsorption of
the phenol from the bulk fluid to the carbon particle. The second boundary condition
is the no flux condition at the center of the particle. The initial conditions show the
initial phenol concentration in the bulk liquid, and initially there is no phenol present
on the activated carbon.
The first step in solving Equations (4.1) and (4.2) is to non-dimensionalize
both of these Equations utilizing the following non-dimensional variables
C1 X
S-j (4.7)
tD T = JT (4-8)
Substituting Equations (4.7) and (4.8) into (4.1) and (4.2) gives the following
equations
dch dc | -^=~yysl-^ (4.9)
dx ds
where the following definitions have been used
D
dc d2c ^ = ^J-^C (4-10)
(4.11)
(4.12)
AX r = — (4.13)
37

The initial conditions (4.5) and (4.6) remain the same and the boundary conditions are
now
c|,= *4 (4.14)
— o=0 (4.15) OS
Equation (4.10) represents the concentration at a particular point in the
particle. A macroscopic averaging technique is used to simplify the particle phase
equations. The following is the definition of the macroscopic average
{c)=\cds (4.16)
Applying this average to Equation (4.10) gives
d<c> dc\
Equations (4.17) and (4.9) are now solved using a closure technique. To do
this we relate the average concentration in the particle to the point concentration by
using Gray's decomposition (Gray, 1975) according to
c=<o+c (4.18)
where c is the point deviation from the average. We now use this identity to subtract
Equation (4.17) from Equation (4.10) to get
« rf2c dcx
38

This equation takes into account the fact that the partial differential with respect to s
of < c> is zero, and assumes that the time derivative of the deviation variable is
negligible. This assumption is valid when (Whitaker, 1991, Ryan et al., 1981)
tD R -^r»l (4.20)
which in our case is satisfied. For t = 900 s, D = 3.3 X 10"8 m2/s, and R = 0.0002 m
(values corresponding to those used in experiments, see Appendix), the left-hand side
of Equation (4.20) is 750. Applying the average of Equation (4.18), the following
equation results
<c>=0 (4.21)
The following boundary equation results from the previous boundary Equation (4.15)
< c> +c\, = Kc„ (4.22)
At this point we propose the following solution for the deviation variable
(Ochoa, et al., 1986),
c=<of(s) + g(s) (4.23)
Applying this to Equation (4.19) gives
d2f d2g dfx dz\ 0=<c>^+^-<c>*l'-il'-*><c>'-^ <4-24> First we will solve the g-field of this equation. The g-field separates in the following
way
d2e ds.x 0=^-ii>-^ <4-25» with the following equations resulting from the previous boundary equations
39

^=Kch (4.26)
f|o=0 (4.27)
and that average of the g-field is zero (Ochoa, et al., 1986)
< g >= 0 (4.28)
The general solution to Equation (4.25) is
*<,)«V*+V^--r*l. <f>D ds (4.29)
Boundary condition (4.27) gives
A=BX (4.30)
Boundary condition (4.26) gives
dn ds A= JLT=- (4-31) 2 cosh^
Finally, the condition in (4.28) gives
dg\ — l=-¥Kch (4.32)
where
^tanhJ^
*"**&-& (433)
The f-field is solved in a similar manner. The equation for the f-field is
^-f|.-^-0 (4.34)
with the following condition (Ochoa, et al., 1986)
40

< / >= 0 (4.35)
and the following boundary equations
l+f(l) = 0 (4.36)
0 = 0 (4.37)
Again, the general solution for an equation of this form is
f(s) = A'e^ + B'e-^-^l (4-38)
Applying Equation (4.37) to the previous equation gives
A* = B* (4.39)
And from Equation (4.36) the integration constant is
1 # -1 A =^ ZTr (4-40) 2 cosh Jfp
Finally the following equation results from Equation (4.35)
^1.=^ (4.41)
in which y/ is defined as Equation (4.33).
Now that the solutions have been given for the g-field and the f-field, the two
results can be combined to obtain
dc\ — \x=y/<c>-y/Kch (4.42)
Putting this back into Equations (4.9) and (4.17), the following set of differential
equations are obtained
41

dx =W-(f>p)<c>-y/Kch (4.43)
dch — = -yy/ <c> +{yKy/-<f>h)ch (4.44)
Before presenting the general solution for the system of equations, the
following definitions will help simplify the end results
Wmyr-+, (4.45)
Y s -Ky/ (4.46)
X s -yy/ (4.47)
Zm-iKyy-l) (4.48)
Qsi(W-Z) (4.49)
T = - iJ(Z + W)2+4XY (4.50)
With these definitions, the general solution to Equations (4.43) and (4.44) are
< c> (r) = CyQ+T)T + C[e(Q-T)r (4.51)
ch(T) = C/Q+T)r+C2e{Q-T)t (4.52)
Using the initial conditions in (4.5) and (4.6), the following equations are obtained
Ci + C2 = Cbo (4.53)
C,* = -C2* (4.54)
The other two boundary equations necessary to solve Equations (4.51) and (4.52)
arise when Equations (4.41) and (4.42) are solved at x = 0 to get
^T^U-ft«, (4-55) dx
42
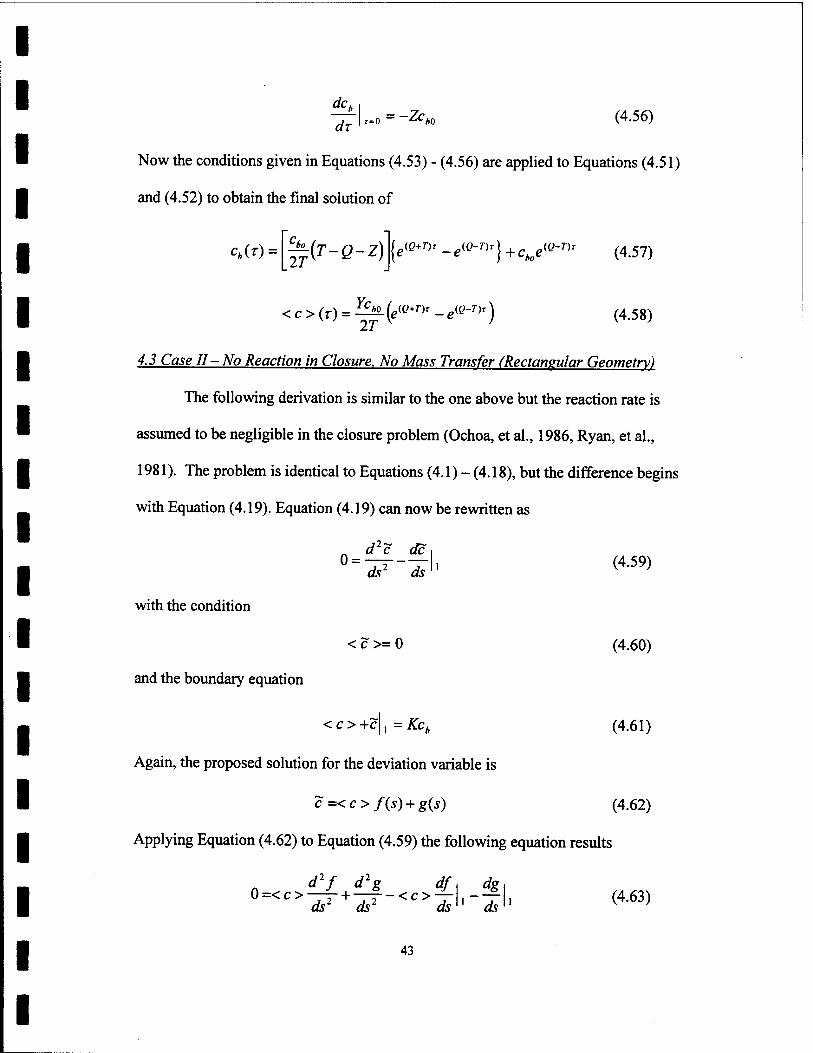
dch I — \Tm0=-Zch0 (4.56)
Now the conditions given in Equations (4.53) - (4.56) are applied to Equations (4.51)
and (4.52) to obtain the final solution of
c*(r) = 2T ^(T-Q-Z) {e^< -e^}+choe
(^ (4.57)
Yck < c > (r) = ih<L(e^T* -e^'T)T) (4.58)
4.3 Case II-No Reaction in Closure. No Mass Transfer (Rectansular Geometry)
The following derivation is similar to the one above but the reaction rate is
assumed to be negligible in the closure problem (Ochoa, et al., 1986, Ryan, et al.,
1981). The problem is identical to Equations (4.1) - (4.18), but the difference begins
with Equation (4.19). Equation (4.19) can now be rewritten as
n d2c dcx
°'1F-^' (4-59)
with the condition
and the boundary equation
< c >= 0 (4.60)
<c>+c|,=Äcd (4.61)
Again, the proposed solution for the deviation variable is
c=<of(s) + g(s) (4.62)
Applying Equation (4.62) to Equation (4.59) the following equation results
d2f d2g df< dg> 0=<c>-f+ -f-<c>-f ,--f , (4.63) dsl dsl ds]' ds[l v '
43
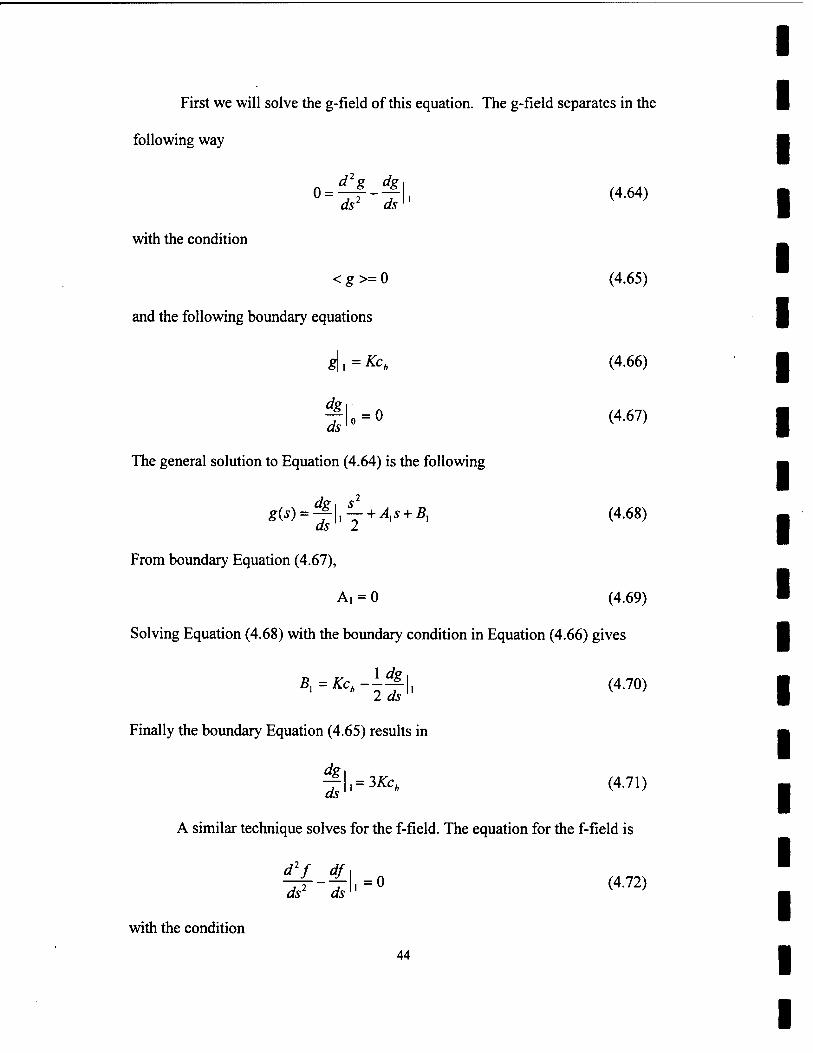
First we will solve the g-field of this equation. The g-field separates in the
following way
d2gdg ds2 ds o = -rf—f-l. (4-64)
with the condition
< g >= 0 (4.65)
and the following boundary equations
g\, = Kch (4.66)
dg\ ^|.-0 (4.67)
The general solution to Equation (4.64) is the following
s(*) = :rli4r+4*+Äi (468) as 2
From boundary Equation (4.67),
A, = 0 (4.69)
Solving Equation (4.68) with the boundary condition in Equation (4.66) gives
Bx =J& *% (4.70) 2 ds
Finally the boundary Equation (4.65) results in
dg\ fsl=3Kc» <4-71) A similar technique solves for the f-field. The equation for the f-field is
d2f df\ ^-il,=0 (4.72)
with the condition
44

< / >= 0 (4.73)
and the boundary equations
l+f(l) = 0 (4.74)
^|o=0 (4.75)
The general solution to Equation (4.72) is
dsu 2 (4.76)
Applying the boundary condition in Equation (4.75) gives
A* = 0 (4.77)
and the following results from applying boundary Equation (4.74)
a-.-i-Ifl, (4,s,
Finally, applying boundary condition (4.73) the following solution is derived
^1,-3 (4.79)
From the combination of Equation (4.79) and (4.71) as in the previous case gives
^-|,=-3<c>+3£c4 (4.80)
Putting this solution back into Equations (4.9) and (4.17) gives the following
system of differential equations
-^P = (-3-^)<o+3Äcr4 (4.81)
-^ = 3r<o-(3rK + (ßh)ch (4.82)
45

For these differential equations, the following definitions are different than the ones
shown in the first case
W = (-3-<f>p) (4.83)
Y = 3K (4.84)
X = 3y (4.85)
Z^QyK + fa) (4.86)
For this case, Equations (4.83) - (4.86) can be inserted into Equations (4.49) - (4.59)
to obtain the solution for this case.
From the solutions from Case I (where the reaction term is solved within the
closure problem) the limiting case is
limy(kp-*0) = -3 (4.87)
This limiting value applied to Equations (4.44) - (4.48) gives terms identical to
Equations (4.83) - (4.86). For very small values of kp, the surface phase reactions are
negligible in the closure problem.
The effect of the reaction term in the closure can be seen further in Figures 5,
6, and 7. These figures compare the theoretical results for Case I and Case II. Figure
5 compares the two cases with kP=0.00001 sec*1. At this small surface reaction rate,
the two cases are identical. At this small of a reaction rate, the assumption that the
surface reaction rate is negligible in the closure problem is valid. Figure 6 shows the
comparison of Case I and Case II for a surface reaction rate of 0.001 sec"1. Again, the
two cases match up almost identically indicating that at this rate constant, the
assumption in Case II is still valid. Figure 7 shows the comparison of the two cases
46
when the particle surface reaction rate is increased to 0.1 sec"1. At this reaction rate,
the assumption that the reaction rate is negligible in the closure is still valid. The two
cases predict a similar concentration profiles. The validity of Case II depends on the
surface reaction rate on the particle, which is valid when the rate is less than 0.1 sec"1.
Above this, the two cases considered begin to deviate from each other, although the
particle reaction rate is high enough to cause both the bulk and particle concentrations
to go to zero very rapidly (figure not shown).
4.4 Case II- No Reaction in Closure. No Mass Transfer (Spherical Geometry)
The derivation for this case begins with the species continuity equation in the
bulk phase given in Equation (4.1) and in the particle phase given by
dt r2 dr
f 2 dc
* ~dr)kpC (488)
where r is the radial term. The initial conditions are identical to those in Equations
(4.5) and (4.6) and the boundary equations are
c\r=R=Kch\r=R (4.89)
-rU=° (4-90> or
where R is the radius of the particle. Equation (4.88) must now be non-
dimensionalized. This is done using the definitions
S=r- (4.91)
z = ^ (4.92)
Applying these definitions to Equations (4.1) and (4.88) gives Equations (4.9) and
47

dz s2 ds\ 2dc) A s Ts)-*>c (4.93)
which use the definitions
A _khR
2
D
tp" kPRl
D
y _AR
V
(4.94)
(4.95)
(4.96)
and have initial conditions (4.5) and (4.6) and the boundary Equations in (4.14) and
(4.15). A macroscopically averaged particle equation is used to simplify Equation
(4.93) and is defined as
<c>= >= \cs2ds o
Applying Equation (4.97) to (4.93) gives the following
(4.97)
d<c> dc*
dx ds = ~z:U-tp<c> (4.98)
As done previously, Gray's decomposition (Equation (4.18)) is used and
Equation (4.98) is subtracted from Equation (4.93) to give
0-4- s2 ds
( 8c_
ds HE. ds
(4.99)
This equation again neglects the time variation in the deviation variable (Equation
(4.20)). The boundary equations for Equation (4.99) are given in Equations (4.21)
and (4.22). A solution to Equation (4.98) is given by
c=<c> f(s) + g(s)
48
(4.100)

Applying this to Equation (4.98) gives
0 = —— s <c>— \ +—— f .2 dg^
s' &l ds) s ds ds \ «•> J <C>T-|'-T-|' (4-101> ds ds
The reaction terms in Equation (4.101) are again neglected in the closure problem.
First, the g-field of this equation will be solved. The g-field of Equation
(4.101) separates into
_ 1 d(,dg) dg 0 = ^-— s2^-
s ds\ ds ds
with the condition
(4.102)
<g>=0
and the boundary equations
dg\ — = 0 dsU "
The general solution to Equation (4.102) is the following
From boundary Equation (4.105),
A,=0
Solving Equation (4.106) with boundary condition (4.104) gives
1 " 6dsU
Finally the condition in Equation (4.103) results in
(4.103)
(4.104)
(4.105)
(4.106)
(4.107)
(4.108)
49

% = 9£cA (4.109) as
The equation for the f-field is separated from Equation (4.101) to give
J__d_ s2 ds
( idf\ df\ =0 (4.no) ds) ds
with the condition
</>=0 (4.111)
and the boundary equations
l+f(l) = 0 (4.112)
df\ ~f o=0 (4.113) ds
The general solution to Equation (4.110) is
f(s) = ^-\X-A's-1+B' (4.114) ds 6
Applying the boundary Equation in (4.113) gives
A* = 0 (4.115)
and the following results from applying boundary Equation (4.112)
**=-l-if|, (4.116) 6 ds
Finally, applying boundary condition (4.111) the following solution is derived
^|,=-9 (4.117) ds
From the combination of Equation (4.117) and (4.109) as in the previous case
gives
50

—|, = -9<o+9Kch (4.118)
Putting this solution back into Equations (4.9) and (4.98) gives the following system
of differential equations
dC> =(-9-<t>p)<o+9Kch (4.119)
-± = 9y<c> -{9yK + <f>h)ch (4.120)
For these differential equations, the following definitions are different than the ones
shown in the first case
^-(-9-#,) (4.121)
Y = 9K (4.122)
X = 9r (4.123)
Z=(9}K+^) (4.124)
For this case, Equations (4.121) - (4.124) can be inserted into the Equations (4.49) -
(4.58) to obtain the solution for this case.
Figure 8 compares the solution obtained for the rectangular and spherical case
of the model derivation where the reaction term is assumed to be negligible in the
closure problem. As seen in this figure, the is almost no difference in the solution
when the geometry of the problem is changed from rectangular to spherical. Even
though the constants for the spherical case differ from the constants for the
rectangular case by a factor of 3, the final solution combines the constants in a way to
51
show almost no difference between the two. All farther references to Case II shall
refer to the solution with rectangular coordinates.
4.5 Case III-No Reaction in Closure, Mass Transfer
The previous two cases considered the problem without mass transfer
resistance of the reactive species from the bulk solution to the carbon particle. When
a particle is suspended in a liquid, a thin boundary layer forms around particle. In this
layer, mass transfer limits the diffusion through the region. This case will include the
effects of mass transfer resistance for the case of a mono-component system and as in
Case II, the reaction term will be left out of the closure problem.
The material balance in Equation (4.1) and the species continuity equation in
Equation (4.2) govern the behavior in this system. The mass transfer resistance is
incorporated into the boundary equation
-AD^\x__x=AKmMX)-Kch) (4.125) ax
where Kmt is the mass transfer coefficient. The other boundary equations and initial
conditions in Equations (4.4) - (4.6) remain the same. The non-dimensional form of
Equation (4.125) is given as
ADdc ,= AKml(cV-Kch) (4.126)
R ds
Applying the definition of the average, Equation (4.126) using the non-dimensional
terms in Equations (4.7) and (4.8) gives
ADdc, , ~~R~~ds~\x= AK*,'(<c>+?\i-Kc>) (4-127)
The equation for the g-field is
52

0 = ds2 ds '
with the condition
and the boundary equations
<g>=0
(4.128)
(4.129)
8U =
Ddgi
"" * R dsu
(4.130)
ds\ — =0
The general solution to Equation (4.128) is the following
Boundary Equation (4.131) gives
A, =0
and from the boundary Equation (4.130)
(4.131)
(4.132)
(4.133)
Bl=Kch- dg_
ds
( D 1^ + _ KRKml 2j
Finally the boundary condition in Equation (4.129) results in
dsU KmlR + 3D
Similarly the equation for the f-field is
(4.134)
(4.135)
d2f df. r2-±ls=0
dfl ds'
with the condition
(4.136)
53

</>=o (4.137)
and the boundary equations
/!,=
^1 -K RdsU ""
K.
dsu = 0
(4.138)
(4.139)
The general solution to Equation (4.136) is
Applying the condition in Equation (4.139) we obtain
A* = 0
and applying boundary Equation (4.138) gives
(4.140)
(4.141)
dsl
1 D 2 RK
-1 (4.142) ml J
Finally, applying the boundary condition in Equation (4.137) the following solution is
derived
dsU
( IRK.
{RKml+3D, (4.143)
Combining Equations (4.135) and (4.143) gives
dc_<
ds^
( -2RKml
RKml+3D) <c> + (4.144)
Inserting this solution back into Equations (4.9) and (4.17) gives the following
system of differential equations
54
d <c>
dz
-3RK. (
RKml+3D rp -<f>„ \<c> + 3KK...R \
K„„R + 3D)
dt
AR23Kml
VRK...+3VD, <c>-
3AR2KK_ + <f>* VRKml+3VD j
(4.145)
(4.146)
For these differential equations, the following definitions are
W = [RKml+3D Wp j
Y =
X =
3KKmlR
KKmlR + 3D
AR2^Kml
VRKml+3VD
Z = ( 3AR2KK ml
VRKml+3VD + <t>b
Q^i(W-Z)
T = -^(Z + W)2+4YX
(4.147)
(4.148)
(4.149)
(4.150)
(4.151)
(4.152)
These constants in Equations (4.147) - (4.150) reduce to those in Equations (4.83) -
(4.86) when Kmt gets large. These constants are then used in Equations (4.51) -
(4.58) to obtain the complete solution to the problem.
As stated in Table 1, Case I reduces to the limiting case of Case II as kp goes
to zero and Case III reduces to the limiting case of Case II as Kmt gets very large.
Figures 9,10, and 11 show the comparison between Case II and Case III when the
mass transfer coefficient is varied keeping all of the other parameters identical.
Figure 9 compares the two cases with a mass transfer coefficient of 1 m/s. The two
55
sets of curves are virtually identical. A mass transfer coefficient of 0.001 m/s is
shown if Figure 10. Again, the model predicts results that seem identical for both
Case II and Case III. Only when the mass transfer coefficient is decreased to 1 x 10"6
m/s is there a difference in the two cases, as shown in Figure 11. Case II is therefore
a valid approximation at low values of kp under 10 sec"1 and for mass transfer
coefficients above 0.001 m/s. For the experimental conditions in the pulsed streamer
corona reactor, the mass transfer resistance is estimated to be 4 x 10"6 m/s (Frossling,
1938, Sitaraman, et al, 1963, see Appendix) and therefore Case III will be used to
compare the theoretical model to the experimental results.
Figure 12 shows the effect of the surface reaction rate on the bulk phase
concentration. These results were calculated using the solution for Case III using a
mass transfer resistance coefficient of 4 x 10"6 m/s. The range of surface reaction rate
constants is from 0.0001 sec'1 to 10 sec"1 differing by powers of 10. At the two
lowest surface reaction rate constants, 0.0001 sec"1 and 0.001 sec"1, the bulk phase
concentration is limited by the slow surface reactions. The curves for these values
represent the bulk phase reactions, the adsorption, and the mass transfer to the
particle. The surface reaction is slow enough that the particle is saturated with the
reacting species. As the surface reaction rate is increased to 0.01 sec"1, the reaction
rate is fast enough to show a decrease in the bulk concentration. As the surface
reaction rate increases to 0.1,1, and 10 sec"1, there is a decrease in the bulk phase
concentration from previous values of the surface reaction rate due to faster reactions
on the particle. The bulk concentration, however, remains the same for these three
values of the surface phase reaction rate. At these rates, the system is mass transfer
56
limited. The reacting species is not getting to the particle fast enough, and then reacts
almost instantaneously on the surface of the particle.
57

CHAPTER 5
EXPERIMENTAL RESULTS & DISCUSSION
5.1 Particle Effects on Breakdown Voltase
Figure 13 shows the voltage waveform patterns for the solutions containing
100 mL pure deionized (DI) water, 1 g/L unwashed activated carbon particles in 1000
mL DI water and 1 g/L <25um unwashed glass spheres in 1000 mL DI water. All
three of these waveform patterns were recorded at an applied voltage of 46 kV.
These waveforms show that the voltage decay time for the carbon and glass in water
suspension cases is greater than for the case of the DI water. The voltage waveform
for both the glass spheres and carbon particle cases are very similar to each other and
show no significant differences. Figure 14 shows the current pulse for the deionized
water case, which has a peak current of 45 A. The decay of the current pulse
oscillates due to the capacitance and inductance of the circuit.
Figure 15 summarizes the breakdown voltage for all the experiments with
particles present in suspension Conducted in this study as a function of the quantity of
particles. The presence of unwashed activated carbon in suspension clearly has a
distinct effect on the breakdown voltage, and the dependence of this breakdown
voltage on the amount of activated carbon is also very important. The <25 jam
58

unwashed glass spheres in suspension was the only other particle type to show an
increase in breakdown voltage with an increase in particle quantity, although the
magnitude of the increase for the glass beads is significantly less than that of the
activated carbon. Suspensions with larger glass spheres showed a decrease in the
effect of particle quantity as seen in this figure. The presence of any quantity of
copper dust or silica gel in suspension had no effect on the breakdown voltage in the
range studied, although they also showed a slightly smaller breakdown voltage than
the deionized water. The presence of washed activated carbon did not have any effect
on the aqueous suspension breakdown voltage.
Qualitative observations were also made noting the size, quality, and quantity
of the streamers produced in suspension for varying concentrations of all types of
particles. In comparison to the no particle case, the addition of unwashed activated
carbon particles to the DI water in the reactor increased the length of the observed
streamers. The streamers also had a magenta color in the presence of the carbon
particles. The glass spheres and the silica gel particles in suspension produced longer
streamers than the case without particles. The number of streamers observed were
smaller and the intensity of the streamers was lower for the glass spheres and the
silica gel particle cases compared to the unwashed carbon particle case. For the
smallest glass spheres (<25 um and finer), the corona discharge was clouded from
view due to the large number of particles in suspension. This was also true for the
case of copper dust in suspension, where only the glow of the corona was observable.
The most significant finding of these results is the increased breakdown
voltage due to the addition of the unwashed activated carbon and the addition of the
59

smallest diameter unwashed glass spheres to DI water. The main physical properties
of the particles include surface area, dielectric constant, and solution conductivity,
each that might contribute to the effects seen in the different particle suspensions.
An increased breakdown voltage of aqueous suspensions containing unwashed
activated carbon particles was thought to be explained by the electronic nature of the
carbon particle. By the electronic nature, both the particle conductivity and dielectric
constant are considered. Activated carbon is a relatively good conductor compared to
the glass spheres and the silica gel particles. Copper dust particles were used to
investigate a highly conductive particle in the pulsed streamer corona reactor. The
presence of copper particles lowered the voltage at which breakdown occurred
compared to the case of DI water alone, in contrast to the opposite effect for the
presence of the carbon particles. This difference in breakdown voltages for
conducting particles would predict that the conductivity of the particle itself does not
contribute to the breakdown voltage as greatly as initially thought.
The voltage waveforms shown in Figure 13 are similar to previous studies
(Clements et al., 1985) where a rapid, nanosecond rise was followed by an
exponential voltage decay. Clements observed that the voltage decay time decreased
with increasing solution conductivity. Clements also showed an increase in voltage
decay time of 500 -1000 \is when the conductivity of the solution was decreased
from 10 fiS/cm to 1 u.S/cm at an applied voltage of 25 kV. The same pattern is
observed in the voltage waveforms in Figure 13. For the case of DI water alone (the
lowest conductivity case), the decay time of the voltage was the longest of the three.
The conductivity of the solutions increased with the addition of carbon particles and
60
glass spheres, thus the voltage decay time decreased. The conductivity of the
solutions containing glass spheres and the unwashed carbon particles was 22 uScm"1
and 80 uScm" respectively. The waveforms corresponding to solutions containing
glass spheres and the unwashed carbon particles had similar voltage decay time.
Clements et al. (1985) obtained photographs that showed that the number of
streamers varied with the solution conductivities. At the lower conductivities, they
observed more streamers than at the higher conductivities. This pattern was not
observed in the present study with the addition of particles to aqueous solutions. For
the case of the addition of unwashed carbon particles, the conductivity of the solution
increased with increasing concentrations of particles. The addition of unwashed
activated carbon particles to the solution also resulted in an increased number of
observed streamers. In Clements work, the conductivity was increased from 1
uScm"1 to 10 uScm"1 using solutions of KOH. The addition of glass spheres and
silica gel particles in the present work did not change the number of streamers
compared to the case of DI water alone. The difference here between the Clements
work and the present work is due to the nature of the different particles.
5.2 Scanning Electron Microscopy Results
As shown in Figure 16, the surface of unwashed activated carbon particles
were observed using scanning electron microscopy. Numerous pores are present on
the surface of the unwashed activated carbon. Also, white "dust" particles can be
noticed all over the surface of the particles. This dust could be the ash remaining
from the processing of the activated carbon. Attached to the SEM apparatus is an x-
ray emissions apparatus that can scan a very small area of the sample. An overall
61

scan of an unwashed activated carbon particle (not focusing in on a single dust
particle but an area that included several dust particles on the carbon surface) showed
that the elements potassium, silicon, sulfur, and chlorine were present on the surface.
The instrument was not calibrated to give quantitative results, but it could only
determine that the elements were there in a high enough concentration for the
equipment to observe it (detectable limit is not known). An emissions scan was then
specifically focused on one of the dust particles and the elemental result was similar
to the overall scan of the surface. The emissions data indicates that the elemental
properties of the dust particles are the same as those of the unwashed activated carbon
particles and cannot be salt crystals.
Figure 17 shows the surface of a washed activated carbon particle sample.
There is no observable change in the pore structure of the activated carbon particles
after washing. The amount of dust particles present on the surface of the activated
carbon decreases with washing. X-ray emission analysis indicated the presence of
potassium on both a wide area scan and a spot scan of one of the dust particles. This
indicates that the cleaning process removes most of the potassium from the surface of
the activated carbon. The decrease in the dust particles could be the result of the
water solubility of the ash (which is primarily silicates of aluminum, magnesium, and
iron).
SEM pictures of the unwashed and washed activated carbon after a 10 minute
46 kV treatment are shown in Figures 18 and 19, respectively. After the pulsed
corona treatment, there is no noticeable difference in the pore structure or any pore
diameter change in the surface of the carbon. In both cases, there is a large reduction
62

in the number of the dust particles on the surface of the activated carbon. From the x-
ray emissions analysis, there was no potassium on either sample. The only element
observed on both samples was silicon.
5.3 PIXE Analysis
PIXE (proton induced x-ray emissions) analysis was performed on 1) the
unwashed activated carbon, 2) the solution resulting from a suspension of the
unwashed activated carbon, and 3) the solution resulting from a suspension of the
unwashed <25 urn glass spheres. These results are shown in Table 3. The unwashed
activated carbon had levels that were above 10 ppm by weight of phosphorous, sulfur,
potassium, calcium, copper, and strontium. Potassium accounted for almost 1% of
the total weight of the unwashed activated carbon particle sample. When the
unwashed activated carbon particle sample was suspended in deionized water,
potassium was the highest concentration element in the aqueous phase solution. In
addition, the carbon leachate has high concentrations of sodium, silicon, phosphorous,
chlorine, potassium, and calcium, all above 1 ppm by weight. In the solutions formed
from the suspension of the unwashed glass spheres were high levels of sodium,
silicon, sulfur, chlorine, and calcium in concentrations above 1 ppm by weight, but
interestingly, no potassium.
To compare to the results of the PIXE analysis and the electrical breakdown
studies, varied experimental conditions were used to look at the effects of the
different salt solutions by themselves and also in combination with the washed
activated carbon and the washed glass spheres. From the PIXE analysis of the carbon
leachate, potassium and sodium had the highest concentration and calcium also had
63

one of the highest concentrations in the solution. The glass sphere leachate had a
high concentration of sodium. Both solutions had a significant concentration of
chlorine. The salts used in the pulsed corona experiments were potassium chloride,
calcium chloride, and sodium chloride. These salts were then investigated in solution
both with and without washed activated carbon and washed glass sphere suspensions.
5.4 Particle Effects on Reactor Power Consumption
Figure 20 shows the results for power consumption under pulsed corona
treatment for a combination of the calcium chloride solution at a constant
conductivity and different concentrations of washed activated carbon. The
experimental conditions used were 140 uScm"1 calcium chloride solution and three
washed activated carbon concentrations of no particles, 1 g/L, and 2 g/L. For all three
of the curves, as the applied voltage (peak voltage on the oscilloscope) is increased,
the reactor power consumption increased as expected. At the highest applied voltage
of 67 kV, the reactor power consumption was around 2000 mJ/pulse. At the higher
applied voltages, the combination of the 2 g/L washed activated carbon and the 140
uScm" calcium chloride solution showed slightly lower power consumption.
A similar graph is shown in Figure 21. This shows the reactor power
consumption for pulsed corona treatment of no particles, 1 g/L, and 2 g/L washed
activated carbon in combination with a 140 uScm"1 sodium chloride solution. Again,
as the applied voltage increases, the reactor power consumption increases for all
cases. At an applied voltage of 67 kV, the power consumption for all conditions is
slightly over 2000 mJ/pulse. This result is almost identical to that of the calcium
chloride solutions.
64

Figure 22 shows the power consumption for pulsed corona treatment of the
combination of different concentrations of washed activated carbon and potassium
chloride solutions. The potassium chloride concentration was held constant to give
140 fiScm"1 and the particle concentrations were 0 g/L, 1 g/L, and 2 g/L washed
activated carbon. For the case of no particles, the power consumption at the higher
applied voltages was over 2000 mJ/pulse. This is similar to all of the calcium
chloride and sodium chloride cases mentioned previously. The curves for the 1 g/L
and 2 g/L washed activated carbon with the potassium chloride solution had a lower
slope and also showed a reactor power consumption of under 1000 mJ/pulse at the
higher applied voltages. The power consumption for the combination of the
potassium salt and the washed carbon is less than half of all the other cases tried. It
does not seem that the amount of washed activated carbon in the range studied has
any effect on the power consumption, as long as both the washed activated carbon
and the potassium chloride solution are present in the solution.
The next figure, Figure 23, gives a comparison of the pulsed corona
experiments with no particles and salt solutions of similar conductivities. The curves
for no particles with 140 uScm"1 conductivity solutions of potassium chloride, sodium
chloride, and calcium chloride are shown. All three of these conditions gave almost
identical results. At the higher applied voltages above 60 kV, the reactor power
consumption is slightly over 2000 mJ/pulse. This shows that without any added
particles, the power consumption is similar for all of the cases.
Figure 24 gives the power consumption for the three different salt solutions in
combination with 1 g/L washed activated carbon. The curves for the 140 ^Scm"1
65

sodium chloride solution with carbon and the 140 u.Scm"' calcium chloride solution
with carbon are similar. At the higher applied voltage, they both have high power
consumption of over 2000 mJ/pulse. The only experimental condition to have
significantly lower power consumption is the case of the 1 g/L washed activated
carbon in combination with the 140 uScm*1 potassium chloride solution. As stated
above, the reactor power consumption is under 1000 mJ/pulse at the highest applied
voltage for the combination of the potassium salt and the washed activated carbon.
When the carbon concentration is increased to 2 g/L, similar results are achieved, as
shown in Figure 25.
The trend of lower power consumption for pulsed corona treatment of the
combination of potassium chloride and washed activated carbon is also noticed at a
lower salt solution conductivity as shown in Figures 26 and 27. Figure 26 shows the
reactor power consumption at different applied voltages for 1 g/L washed activated
carbon in combination with either 14 uScm"1 sodium chloride solution, 14 u-Scm"1
calcium chloride solution, or 14 uScm"1 potassium chloride solution. Figure 27
shows the same three solution conditions, but the washed activated carbon
concentration is increased to 2 g/L. For the experiments containing the sodium and
calcium salts with the two carbon concentrations, the power was about 500 mJ/pulse
at the higher applied voltages. The reason the power is lower at lower conductivities
(14 u-Scm"1 vs. 140 fiScm"1) is that the resistivity of the water is increased, the current
(V=IR) is reducer, which lowers the reactor power consumption. The power
consumption for the potassium salt with the carbon increased to 130 mJ/pulse and
220 mJ/pulse at the higher applied voltages for the 1 g/L and 2 g/L washed activated,
66

carbon respectively. Again, the power consumption in the reactor is lower for the
combination of the washed activated carbon and the potassium chloride solution,
compared to carbon and either of the other two salts. The reason for the difference in
power consumption for the 1 g/L washed activated carbon with the potassium
chloride solution and the 2 g/L washed activated carbon with the potassium chloride
solution is not known at this time.
Figure 28 shows the power consumption for pulsed corona experiments using
suspensions of 1 g/L and 2 g/L unwashed activated carbon in deionized water, and
compares this to suspensions of 1 g/L and 2 g/L washed activated carbon in a 140
uScm"1 potassium chloride solution. Solutions containing suspensions of the
unwashed activated carbon showed power characteristics higher than those of the
washed activated carbon particles suspended in the KC1 solution at the higher
voltages, although the power characteristics were lower than those of the salt
solutions without any particles. The higher power consumption of the unwashed
activated carbon suspensions compared to the washed activated carbon suspensions,
both in potassium chloride, may be due to the additional salts that are present in the
unwashed activated carbon.
Figure 29 shows the power consumption for the combination of the washed
<25 ^m diameter glass spheres and the three higher conductivity salt solutions. This
figure shows that the calcium chloride, sodium chloride, and potassium chloride salts
in combination with the glass spheres have similar reactor power consumption. At
the higher applied voltages, the reactor power reaches 2000 mJ/pulse. This result is
similar to that of the salt solutions by themselves, and both the combination of the
67
sodium chloride and calcium chloride salts with the washed activated carbon. A
reduced power was observed for the combination of the potassium chloride and the
washed activated carbon compared to the combination of the potassium chloride and
the < 25 urn diameter washed glass spheres. Again, the reduced power consumption
is specific to only the combination of the washed activated carbon and the potassium
chloride salt.
Activated carbon is a well-known adsorbent for a range of organic and
inorganic compounds. It can also adsorb some inorganic ions and it may affect
reactor power through reduction of current carrying species. It is clear that washed
activated carbon in aqueous suspension does not reduce reactor power in the presence
of any salt species except salts of potassium. These results are highly reproducible
and cannot be accounted for by changes in the surface or pore structure of the
activated carbon as observed by scanning electron microscopy. In addition, particles
of other types such as porous silica gel with large internal surface area do not affect
the reactor performance through changes in power levels.
One method for the commercial production of activated carbon requires
chemical activation at high temperatures and pressures in the presence of potassium
hydroxide or potassium chloride, sulfate, or bicarbonate salts (Bansal, et al., 1988).
The activation process creates a high surface area pore structure in which the surface
of the carbon particles consists of stacks of flat aromatic sheets crosslinked in a
random manner. Carbon readily interacts with oxygen and to a lesser degree
hydrogen, nitrogen, and sulfur, through resonance-stabilized unpaired electrons. A
number of acidic surface groups are also present. Potassium is also known to form
68
graphite intercalation compounds by penetrating the lattice of graphitic materials
(Brandt, et al., 1988). These graphite intercalation compounds of potassium are well
studied; however, the structure of activated carbon in general does not contain as
extensive a lattice structure as graphite. The exact natures of the interaction of
potassium with activated carbon and its effect on the electrical properties of a high
voltage discharge are not known. This may lead to further work to investigate how
the potassium interacts with the activated carbon.
5.5 Phenol Removal
The rate of adsorption of phenol onto washed activated carbon in deionized
water suspension is shown in Figure 30. The experimental conditions for this figure
are a starting concentration of 100 ppm phenol, 485 mM ferrous sulfate, and 1 g/L
washed activated carbon. No voltage was applied to the reactor. Phenol removal
from the solution was 74%. The amount removed represents the adsorption of the
phenol to the surface of the activated carbon. Under these conditions, there are no
byproducts formed. This indicates that there are no reactions on the surface of the
carbon when there is no applied voltage.
Figure 31 shows the phenol removal results for the experiments with no
particles in suspension added at an applied pulsed treatment oltage of 46 kV. The
concentrations of the different species are all normalized to 1 by dividing all of the
concentrations by 100 ppm. As indicated in the figure, 28% of the phenol is removed
in 15 minutes of pulsed corona exposure. Concurrently, 10 ppm catechol, 2 ppm
resorcinol, and 1 ppm of hydroquinone are formed. This accounts for 84% (by
moles) of the carbon initially present. The remaining 16% of the carbon is assumed
69
to be other less complex oxidation products of the phenol such as formic acid, oxalic
acid, and other organic acids.
For the above experimental case of 46 kV applied pulsed corona voltage and
no carbon particles in suspension, the average power in the reactor was 800 mJ/pulse,
(Table 4). This corresponds to a contaminant removal efficiency of 2.3 g/kWhr
calculation in Appendix). The solution conductivity increased during the run from an
initial conductivity of 120 fiScm"1 to a final conductivity of 176 nScm"1. This rise in
the conductivity can be justified by the conversion of the ferrous ions (Fe2+) to the
ferric ions (Fe3+) in the Fenton's reaction.
Figure 32 shows the results for the degradation of phenol at 57 kV pulsed
corona voltage with no particles present in suspension. Under these conditions, 40%
of the phenol is oxidized, mostly to 16 ppm catechol, 5 ppm hydroquinone, and 2
ppm resorcinol. These primary byproduct compounds account for 80% (by moles) of
the initial carbon. Again, the remaining carbon has be accounted for in other phenol
oxidation products not analyzed in this study. There is a higher conversion of phenol
at higher voltages (57 kV vs. 46 kV), and higher concentrations of the oxidation
products are produced at the higher applied voltage. It has been shown previously
(Joshi, 1994) that at higher voltages, there are an increased number of radical species
that initiate the phenol oxidation.
The power consumption and solution conductivity of the experiment at 57 kV
pulsed corona exposure with no added particles in suspension is found in Table 4.
The conductivity of the solution went from an initial value of 120 u-Scm"1 to a final
value of 200 u-Scm"1. This is a higher final conductivity at 57 kV than the previous
70

case of 46 kV (176 uScm"1). At 57 kV, more hydrogen peroxide is produced, and
therefore more of the ferrous ions are converted to ferric ions. Ferric ion production
leads to a higher concentration of the hydroxyl radicals to increase the conversion of
the phenol. The reactor power consumption under these conditions is 1100 mJ/pulse,
which is much higher than the previous case at 46 kV as expected. The removal
efficiency at 57 kV is 2.4 g/kWh, comparable to the removal efficiency at 46 kV.
Figure 33 shows the phenol removal for the cases of 1) 46 kV and no particles
added, 2) no applied voltage andl g/L washed activated carbon, and 3) the
combination of 46 kV applied voltage with 1 g/L washed activated carbon. As stated
previously, after 15 minutes, the experimental condition of 46 kV applied voltage and
no carbon resulted in the removal of 28% of the phenol from the bulk solution, while
the experimental condition of no corona and 1 g/L washed activated carbon showed a
76% phenol removal. The combination of 46 kV corona treatment and 1 g/L washed
activated carbon resulted in 78% phenol removal from the bulk solution. A slight
increase in the removal is observed using a combination of corona and compared to
carbon by itself.
Although it seems in the above experiment that most of the phenol is being
adsorbed onto the surface of the carbon, Figure 34 indicates that there are significant
oxidation products being formed. Analysis shows that 6 ppm catechol, 1 ppm
hydroquinone, and 1 ppm resorcinol are formed. These levels are slightly lower than
for the case of 46 kV alone (no particles). Catechol, resorcinol, and hydroquinone all
adsorb quite readily to the activated carbon and it is assumed that there is a significant
level of these compounds on the activated carbon after 15 minutes.
71

The reactor power consumption for the combination of 46 kV pulsed corona
treatment and washed activated carbon in suspension was 830 mJ/pulse, which is
higher than that for the corona alone (Table 4). The power efficiency was 6.27
g/kWhr for this case, much higher than the case using only pulsed corona treatment.
The conductivity of the solution increased from an initial value of 120 uScm"1 to a
final value of 141 uScm"1. This ending conductivity is lower for the combination of
the carbon and corona than for the corona alone. This might indicate that either less
hydrogen peroxide is being produced in the pulsed streamer corona with the addition
of the activated carbon, the carbon is converting the ferric ion back to the ferrous ion,
or that ions are being adsorbed on to the activated carbon.
The experimental results combining pulsed corona treatment in the presence
of washed activated carbon particles suggests the possibility of surface reactions
occurring on the activated carbon. The activated carbon adsorbs 76% of the phenol
in the bulk solution, reducing the amount of phenol in the bulk phase. Similar
reduction in the oxidation products should be seen if only bulk phase reactions are
occurring. From the oxidation products measured in the bulk phase, there was only a
small decrease in the amount of oxidation, not a 76% decrease in byproducts expected
for only bulk phase reactions. Some of these products have been adsorbed onto the
surface of the carbon. Preliminarily, these results indicate possible surface reactions.
Figure 35 shows the results of 1) 57 kV pulsed corona treatment with no
washed activated carbon particles in suspension, 2) no corona with carbon particles,
and 3) 57 kV applied voltage with carbon particles. With the 57 kV corona treatment
alone, the phenol removal is 40%, while for the 1 g/L washed activated carbon alone,
72

the phenol removal is 76%. For the combination of both the 57 kV corona treatment
and the 1 g/L washed activated carbon, the phenol removal is increased to 89%.
There is a greater enhancement of the combination of the carbon and corona at 57 kV
than at 46 kV.
Figure 36 shows the oxidation products formed with the combination of 57 kV
corona treatment and 1 g/L washed activated carbon. After the 15-minute treatment
time, phenol concentration drops from 100 ppm to 11 ppm, and catechol formation is
6 ppm, hydroquinone formation is 2 ppm, and resorcinol formation is 4 ppm. Again,
there will be a significant amount of each of these species adsorbed on to the carbon,
causing a reduction of the amount f the byproducts able to be detected in the solution.
The total amount of oxidation products is similar (and possibly higher) to that of the
bulk phase reactions alone, indicating that the adsorbed phenol is also reacting. This
result strengthens the notion of surface reactions occurring on the activated carbon.
The power consumption and conductivity change for the combination of 57
kV applied voltage and 1 g/L washed activated carbon are given in Table 4. For this
experimental condition, the reactor power consumption is 1370 mJ/pulse. The overall
power efficiency for this case was 4.33 g/kWhr. The conductivity of the solution
increased from 120 uScm"1 to 170 uScm"1 after the 15-minute treatment. The final
conductivity is lower for the combination of both the 57 kV applied voltage and the 1
g/L washed activated carbon than for the 57 kV corona treatment without particles.
Again, this could be due to reduced hydrogen peroxide formation resulting in a lower
conversion of ferrous ions to ferric ions, or that the activated carbon catalyzes the
reaction of ferric ions to ferrous ions or adsorption of the ions by the activated carbon.
73

Figure 37 gives the summary for all of the experiments where catechol was
formed. The case of 46 kV pulsed corona treatment with no carbon present shows a
production of 11 ppm catechol over the 15 minute treatment time. For the 57 kV case
with no carbon, the catechol increased from 0 ppm to 16 ppm over the 15-minute
interval. Similarly, for the case of 46 kV pulsed corona treatment with 1 g/L washed
activated carbon, the catechol continuously increased to 6 ppm over the 15-minute
treatment time. Unlike the following three conditions, the 57 kV applied voltage with
the 1 g/L washed activated carbon experiment shows an increase in the catechol
concentration to 7 ppm at 8 minutes, which then decreases to 6 ppm at 15 minutes.
This final condition indicates an increase in the overall rate of reaction of the
degradation of the catechol.
Similar trends are seen in the concentration of resorcinol for the four different
experiments as seen in Figure 38. The formation of resorcinol in the cases of 46 kV
with no carbon, 57 kV with no carbon, and 46 kV with 1 g/L washed activated carbon
all increased continuously over the 15-minute treatment time to 2.1 ppm, 2.3 ppm,
and 1.5 ppm, respectively. The case of 57 kV corona treatment with 1 g/L washed
activated carbon gave a resorcinol concentration of 1 ppm after 8 minutes, which then
decreased to 0.5 ppm after 15 minutes.
Figure 39 shows the hydroquinone concentration for the four experimental
cases. The overall trend for all experimental cases for pulsed corona treatment with
washed activated carbon was for hydroquinone to increase continuously over the 15-
minute treatment time. A summary of the phenol primary oxidation products at 57
kV applied voltage and 1 g/L washed activated carbon is given in Figure 40. This
74

figure shows the increase in the concentration for both the catechol and the resorcinol
over the first 8 minutes of the experiment and then a decrease in both concentrations
over the final 7 minutes of the experiment. Contrary to this, the hydroquinone
continues to increase over the entire 15 minutes of the experiment.
If the activated carbon increased the formation of the hydroxyl radicals in the
bulk phase, this would increase the rates of reaction for all of the species and not just
two of the three. Surface reactions might explain the selective increase in the
degradation of catechol and resorcinol. Hydroquinone, catechol, and resorcinol all
adsorb onto the carbon at similar rates. The mechanism of the surface reactions
would have to be one that targets both the catechol and the resorcinol to increase the
overall rates of reaction and not target the hydroquinone. Further analysis of the
products other than catechol, hydroquinone, and resorcinol needs to be done to obtain
the true mechanism of the surface reactions.
5.6 Comparison of Experimental and Theoretical Results
To compare the theoretical model to the experimental results, several
constants need to be determined. Figure 41 shows the experimental results that
determine the adsorption equilibrium constant for phenol on the washed activated
carbon. This constant is obtained from the slope of this curve over the concentrations
of interest. For this work, the value of 424 (ppm bulk)/(ppm surface) was used.
Another constant in the theoretical model that can be experimentally
determined is the kinetic rate of reaction for the phenol oxidation in the bulk phase.
This is accomplished by using the experimental data obtained from the phenol
breakdown for the 46 kV and 57 kV pulsed corona treatment voltages without any
75
carbon particles added to the solution. The rate of reaction is assumed to be a first-
order reaction. Figures 42 and 43 show the natural logarithm of the concentration
divided by the initial concentration versus time. The slope of the best-fit line is then
the reaction rate constant. At 46 kV the phenol reaction rate constant is 0.0004 sec'1,
and at 57 kV the phenol reaction rate constant is 0.0006 sec"1. Although at 57 kV the
first-order rate constant is a good fit to the data, the first-order fit for the 46 kV case is
not as good and may be accounted for by the slower initiation reactions.
Other parameters used in the theoretical model were the activated carbon
particle radius, the total outer surface area of the activated carbon particles, the
volume of the reactor, and the effective diffusivity. The manufacturer provided the
total surface area for the activated carbon. The effective diffusivity was estimated
(Satterfield, 1970, see Appendix) from typical parameters for activated carbon (most
properties were not given by the manufacturer). The values used in the model were
0.0002 m for the particle diameter, 0.024 m for the total outer surface area, 0.001 m
for the volume of the reactor, 3.3 x 10"8 mV1 for the effective diffusivity, and 4 x 10"6
m/s (Frössling, 1938, Sitaraman, et al., 1963, see Appendix) for the mass transfer
resistance coefficient.
Figures 44 and 45 show the results of the fit of the theoretical and
experimental cases for the 46 kV and 57 kV pulsed corona treatments without any
added particles. The adsorption equilibrium constant (K), in this model was set to 0.
In both cases, the experimental data and the theoretical model match very well. This
shows that the first-order reaction rate approximation is valid and the results from the
model are valid.
76

The goal of comparing the theoretical model to the experimental data is to
determine whether or not there are reactions taking place on the surface of the
activated carbon. The only parameter in the theoretical model that can vary is the
kinetic reaction rate on the particle surface. All of the other parameters are set at the
values mentioned above. To fit the theoretical model to experiments, adjustments
were made to the value of kp until the experimental data and the theoretical model
matched as closely as possible. Figure 46 show the best-fit theoretical curve and the
experimental data for the combination of 46 kV pulsed corona exposure with 1 g/L
washed activated carbon. The value of kP that was used to determine the best fit for
the model was 0.00045 sec"1. The model fit shows that the particle surface reaction
rate is in the same order of magnitude of the bulk phase reactions. The model also
predicts that after 15 minutes treatment time, the concentration of the phenol on the
surface of the carbon particles is around 50 ppm.
Figure 47 shows the experimental data for the 57 kV pulsed corona voltage
with 1 g/L washed activated carbon, and the best-fit curve predicted by the theoretical
model. The particle surface reaction rate from the model is 0.00175 sec"1. At the
higher applied voltage (57 kV), the surface reaction rate is three times larger than the
bulk phase reaction rate. For smaller rates of surface phase reactions, theoretical
results over 15 minutes would be higher then the values obtained experimentally.
The model also predicted a phenol concentration on the surface to be approximately
35 ppm for these conditions. The theory deviates from the experimental values
because the model accounts only for the reaction with phenol and no other reactive
species. In reality, the primary phenol byproducts also react with the reactive species
77

induced by the corona. Expanding the model to the multicomponent version should
alleviate this problem.
This leads to the conclusion that surface phase reactions are occurring on the
carbon particles. These surface reactions are induced by the pulsed streamer corona
because they only occur when the pulsed corona treatment is turned on. The
combination of bulk phase reactions and surface phase reactions will lead to the
enhanced removal and breakdown of the organic contaminants found in the reactor.
The surface phase reactions on the activated carbon particles will lead to the in-situ
regeneration of the activated carbon. The process itself will clean the contaminants
off of the activated carbon surface.
78
CHAPTER 6
CONCLUSIONS
This study has shown that the presence of activated carbon in aqueous
suspension has a dramatic qualitative and quantitative effect on the nature of the
pulsed electrical discharge and the removal of phenol. The addition of unwashed
activated carbon to deionized water can increase the possible operating pulsed voltage
in the reactor from 40 kV to over 100 kV by increasing the voltage at which
breakdown occurs. In contrast, the addition of washed activated carbon particles had
no effect on the breakdown voltage. The smallest (<25 urn) glass spheres also
showed the trend of increasing the breakdown voltage, but to a smaller degree than
that of the unwashed activated carbon. The larger size glass spheres did not have any
effect on the breakdown voltage. The addition of high surface area silica gel particles
to deionized water in a pulsed streamer reactor does not show effects comparable to
that of the activated carbon. The addition of highly conductive copper particles also
failed to have effects comparable to the activated carbon; they were found to slightly
lower the sparkover voltage from that found with deionized water.
PIXE analysis showed very high levels of potassium on the unwashed
activated carbon in concentrations of 1% by weight. In the leachate solution from the
79
unwashed activated carbon, there were high concentrations of potassium, sodium,
calcium, and chloride. The leachate solution from the unwashed glass spheres had
high levels of sodium and chlorine. Results from SEM and x-ray emissions showed
that the unwashed activated carbon contained potassium on the surface, and after the
carbon was washed, the element potassium was not present. Also, SEM showed
"dust" particles that appeared on the unwashed activated carbon but the number of
these dust particles decreased upon washing and corona treatment.
When the solution conductivity of deionized water reactor samples was
increased by the addition of various salts, the breakdown voltage was increased. The
addition of washed activated carbon particles to the salt solutions gave the same
breakdown voltage as the salt solution alone. This leads to the conclusion that the
breakdown voltage is controlled by the conductivity of the solution and not by the
type of particle present.
There was a significant physical effect of the presence of activated carbon in
suspension, however. The combination of washed activated carbon and a potassium
chloride solution gave a power consumption that was 50% less than any other
combinations at the higher applied voltages. This phenomenon is both particle
specific as well as salt specific. The unwashed activated carbon also showed lower
power consumption, but not as low as the washed activated carbon together with the
potassium salt.
The chemical effects showed that without activated carbon particles in
suspension, phenol removal in 15 minutes is 26% for a 46 kV corona treatment and
40% for the 57 kV corona treatment. For these cases, catechol, resorcinol, and
80
hydroquinone formation occurred. Without the activated carbon present, the pathway
for removal is through oxidation reaction. When the activated carbon is present and
there is no corona treatment, the amount of phenol adsorbed onto the washed
activated carbon is 76% in 15 minutes. For the combination of the washed activated
carbon and pulsed corona treatment, the phenol removal was enhanced to 78% and
89% for 46 kV and 57 kV pulsed corona treatments, respectively. These cases
showed significant primary phenol byproduct formation through catechol, resorcinol,
and hydroquinone. For both cases, adsorption and reactions are taking place.
An enhanced removal of phenol occurred in the case of the combination of
washed activated carbon and pulsed streamer corona. Analysis of the phenol
breakdown products indicates possible reactions occurring on the surface of the
activated carbon. These surface reactions are specific to increasing the rate of
reaction for the catechol and the resorcinol but not the hydroquinone. It has also
been shown that with the combination of corona treatment and activated carbon, the
removal of the phenol is enhanced through adsorption as well as reactions induced on
the surface of the carbon and in the bulk solution. With the surface reactions, the
contaminants that are adsorbed onto the carbon are ultimately removed and the
carbon is regenerated.
The first-order reaction rate constants for the phenol oxidation without carbon
present are 0.0004 sec"1 and 0.0006 sec"1 for applied voltages of 46 kV and 57 kV,
respectively. The phenol-washed activated carbon adsorption equilibrium constant is
454 (ppm bulk)/(ppm on surface).
The comparison between the experimental data and the theoretical model
81
indicates that surface reactions are taking place. At 46 kV, the surface reaction rate
constant of phenol breakdown is 0.00045 sec"1, which is the same order of magnitude
as the bulk phase reaction rate. At 57 kV, the surface reaction rate constant of phenol
breakdown is 0.00175 sec"1, which is 3 times larger than the bulk phase reaction rate.
82

CHAPTER 7
DIRECTIONS FOR FURTHER STUDY
Future work can proceed in several different ways. These would include
further work on the modeling of the chemical reactions and more experiments looking
at the chemical and physical aspects of aqueous phase pulsed streamer corona with
the addition of the carbon particles.
To this point, the reaction and diffusion model presented included only one
component. This model can be extended to a two component system where the two
reactions taking place are in series. This model could then be extended to include i-
components. After this, a more rigorous model needs to address the actual pathways
of the phenol reactions. The reactions that occur on the carbon particle surface also
need to be included, if different than those occurring in the bulk phase. As mentioned
before, the breakdown of phenol leads to several primary byproducts by means of
parallel reactions. The model needs to be modified to include parallel reactions
instead of series reactions to better account for the true nature of phenol oxidation.
To further investigate the chemical effects of the added carbon particles, more
experiments need to be done to look at the breakdown of phenol. The present work
observed the addition of washed activated carbon only. The degradation of phenol
83

now needs to be investigated with the addition of unwashed activated carbon as well
as the addition of the potassium ions to a suspension of unwashed carbon particles in
aqueous phenol. This might help in understanding the role of the potassium ions that
leach off of the unwashed activated carbon as well as isolating the effects of the
potassium and the activated carbon.
Further, the induced Fenton's reaction was conducted at an optimal value
obtained from Sharma (1993). This value was optimized for an initial concentration
of 1 ppm. This might be the optimal value for starting at a higher level of phenol,
such as that 100 ppm which this study uses as an initial concentration. The iron
concentration needs to be re-evaluated for this phenol concentration.
The problems that exist with comparing the experimental data to the
theoretical model are that we assumed that the bulk reactions under pulsed corona
conditions remain the same with and without the addition of carbon particles, and that
the adsorption equilibrium remains the same with and without the corona discharge.
These assumptions need to be validated experimentally. To do so, a chemical
compound needs to be found that adsorbs onto the carbon but does not react under the
oxidizing conditions of pulsed corona treatment. This will enable us to determine if
the adsorption equilibrium constant is affected by the corona. Next, there needs to be
a way to determine the effects of the added particles on the bulk phase reactions.
This could be possible if there was an oxidizable compound that did not adsorb onto
the carbon, or if there was a suitable particle other than the carbon that could be
added to the reactor to simulate the physical effects of the added carbon particles but
84

with out the adsorption effects. This would determine if there are any changes in the
bulk phase reactions with and without the added carbon particles.
Another point of interest would be to consider both the physical and the
chemical behavior of different forms of activated carbon. The variations of the
activated carbon could include different pore sizes, different total surface area, and
most importantly, activated carbon made by different means of activation. The
activated carbon used in these experiments was activated by treatment with potassium
hydroxide. Many other chemicals are used in the activation of carbon. These could
lead to studying ions other than potassium that might increase the power efficiency.
Also, different pore sizes could change the diffusion and reaction rates inside the
particle and possibly enhance the phenol decomposition.
The reactor used in this study needs to be optimized to obtain the highest
removal of phenol using the least amount of power. Variations in the amount of
carbon, the ferrous ion concentration, the potassium ion concentration, the applied
voltage, and the flow of oxygen should be investigated. If the power efficiency of
this process can be increased to 20 g/kWhr, this process would be economical at the
industrial level (Creyghton, 1997b). The optimization can be extended to the design
of a flow reactor. This flow reactor could have multiple pulsed corona points where
some discharge points have oxygen flowing through the corona (for ozone formation)
and others have no oxygen flowing through the needles (hydrogen peroxide
formation). These multiple discharges could control the ratio of ozone and hydrogen
peroxide formation. Optimization of this ratio could lead to high power efficiencies.
85

Different experimental techniques could also be used to make observations
not yet attained. One of these is the ultra-high speed photography. This could be used
to measure the velocity of the streamer propagation as well as observing the
interaction of the streamers with the particles. Monochronometers could detect the
light emitted by the plasma. This technique could help in identifying different
reactive species produced in the plasma as well giving local electron temperatures.
Now that it has been shown that there is a significant effect of the combination
of the potassium ion and the carbon particles, a theoretical interpretation of these
results needs to be obtained. This would begin with all of the governing equations of
an electrical discharge in a three-phase system. These equations would then need to
be solved under unique sets that would account for all species (liquid, gas, solid, and
plasma) and for all of the reactive species created by the discharge. In combination
with this, a steamer propagation model would also need to be included to show the
interaction of the streamer with the carbon particles. This combined with the
experimental results should answer some of the remaining question regarding the role
of the activated carbon in the pulsed streamer corona.
86
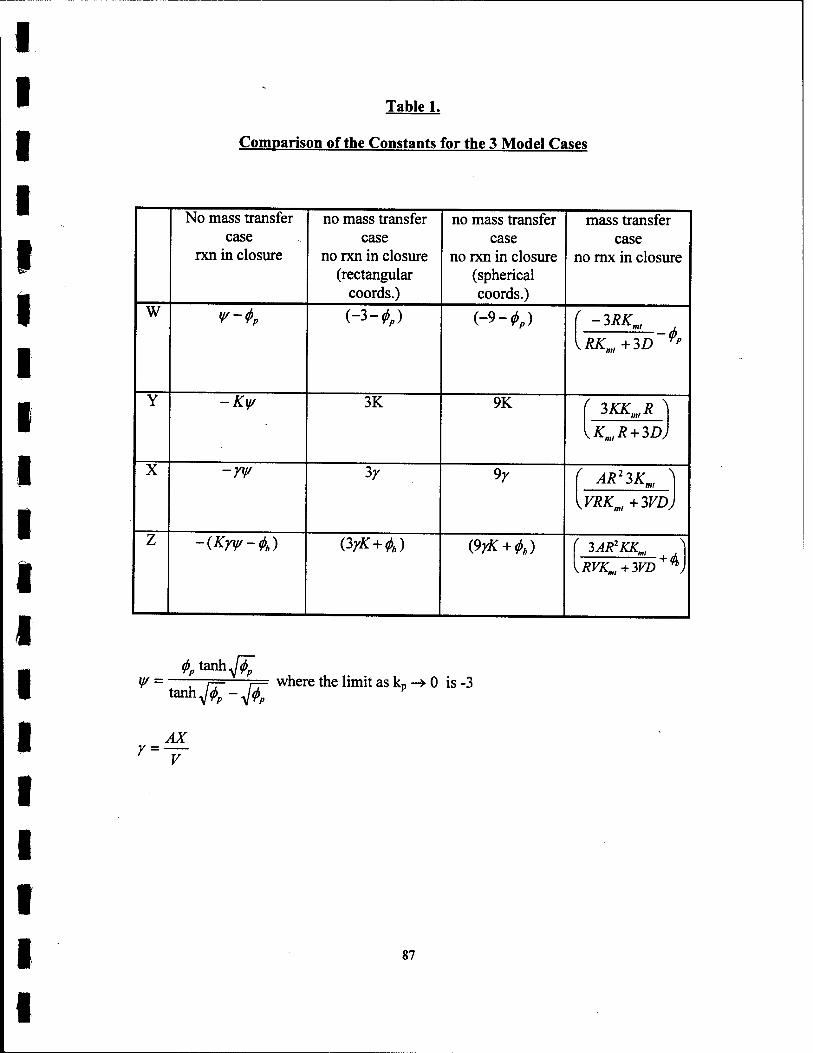
Table 1.
Comparison of the Constants for the 3 Model Cases
W
X
No mass transfer case
rxn in closure
v-i.
-K\ff
-rw
-(Kyv-h)
no mass transfer case
no rxn in closure (rectangular
coords.)
("3-<0
3K
3r
(3* +A)
no mass transfer case
no rxn in closure (spherical coords.)
(-9-<U
9K
9y
&* + *>)
mass transfer case
no rnx in closure
-3RK. T+, KRKml+3D r"
3KKmlR "
KmlR + 3Dj
\ AR23K„
VRKml+3VDj
3AR2KK_. }
RVK.+WD + <
^tanh^ V ~'.—;—rr n= where the limit as kp -> 0 is -3
tanhV^"V^
r = AX
87
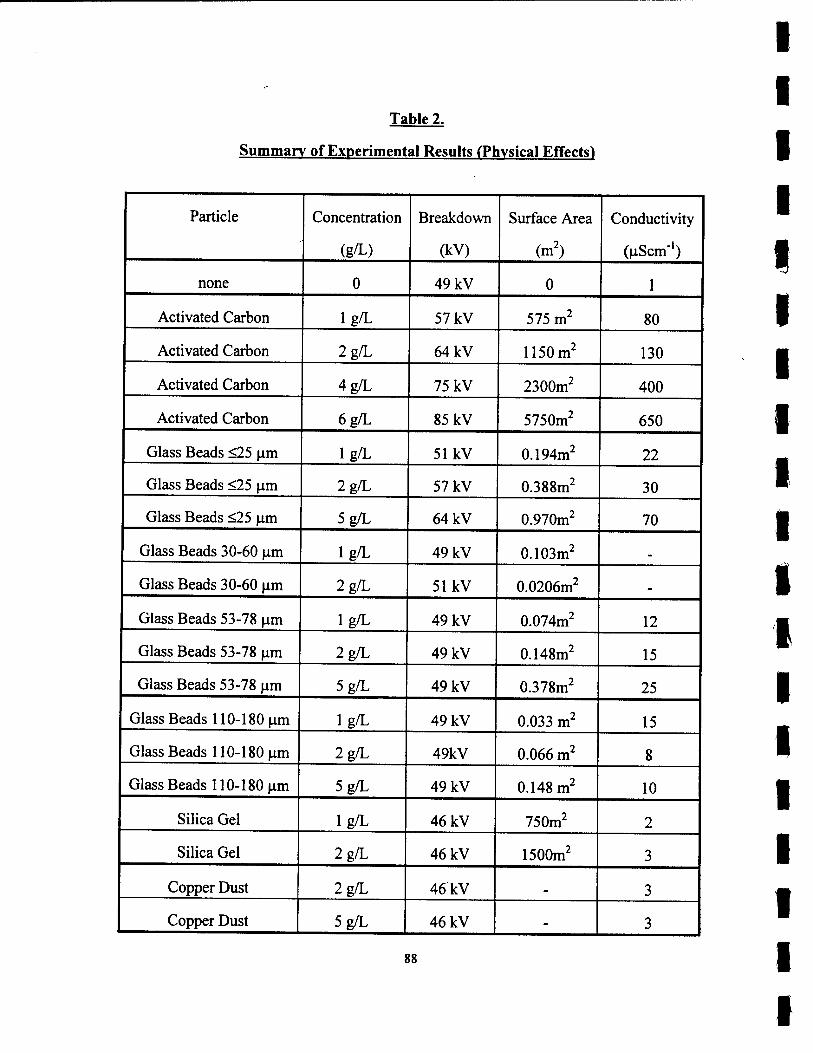
Table 2.
Summary of Experimental Results (Physical Effects)
Particle Concentration
(g/L)
Breakdown
(kV)
Surface Area
(m2)
Conductivity
(uScm"1)
none 0 49 kV 0 1
Activated Carbon lg/L 57 kV 575 m2 80
Activated Carbon 2 g/L 64 kV 1150 m2 130
Activated Carbon 4 g/L 75 kV 2300m2 400
Activated Carbon 6 g/L 85 kV 5750m2 650
Glass Beads <25 urn lg/L 51 kV 0.194m2 22
Glass Beads <25 um 2 g/L 57 kV 0.388m2 30
Glass Beads <25 jam 5 g/L 64 kV 0.970m2 70
Glass Beads 30-60 um lg/L 49 kV 0.103m2 _
Glass Beads 30-60 urn 2 g/L 51 kV 0.0206m2 _
Glass Beads 53-78 urn lg/L 49 kV 0.074m2 12
Glass Beads 53-78 urn 2 g/L 49 kV 0.148m2 15
Glass Beads 53-78 urn 5 g/L 49 kV 0.378m2 25
Glass Beads 110-180 urn lg/L 49 kV 0.033 m2 15
Glass Beads 110-180 urn 2 g/L 49kV 0.066 m2 8
Glass Beads 110-180 um 5 g/L 49 kV 0.148 m2 10
Silica Gel lg/L 46 kV 750m2 2
Silica Gel 2 g/L 46 kV 1500m2 3
Copper Dust 2 g/L 46 kV _ 3
Copper Dust 5 g/L 1 46 kV - 3
88
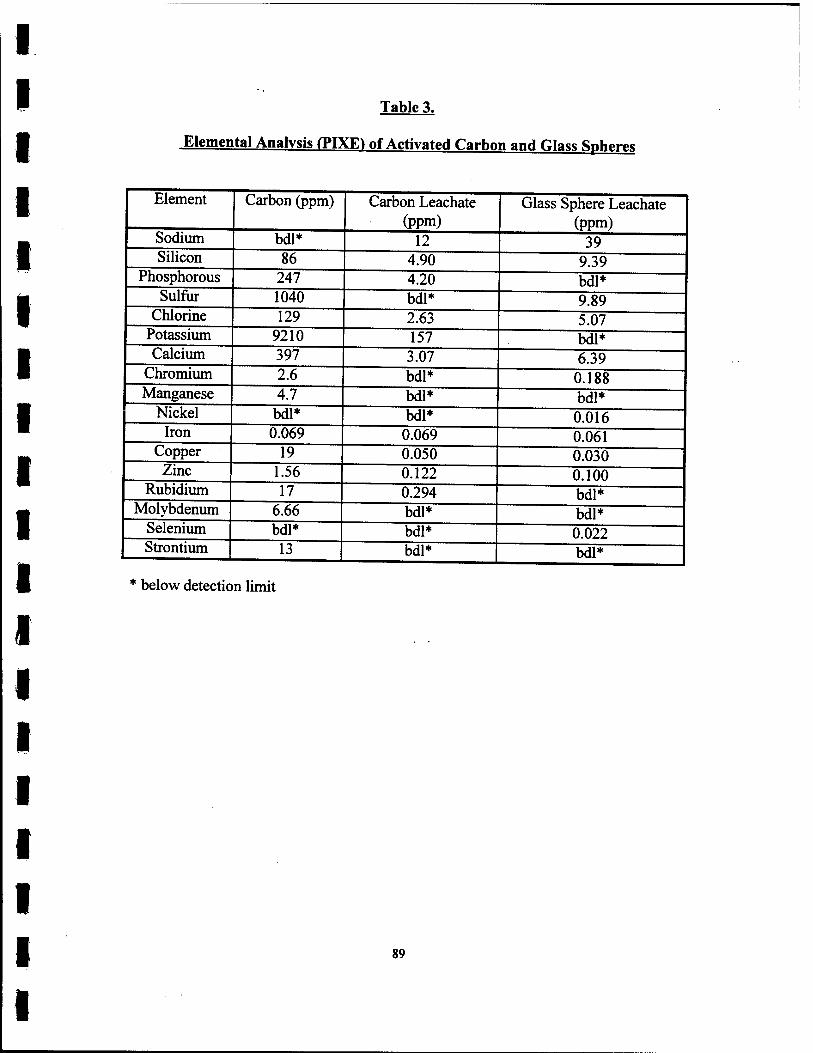
Table 3.
Elemental Analysis (PIXE) of Activated Carbon and Glass Spheres
Element Carbon (ppm) Carbon Leachate (ppm)
Glass Sphere Leachate (ppm)
Sodium bdl* 12 39 Silicon 86 4.90 9.39
Phosphorous 247 4.20 bdl* Sulfur 1040 bdl* 9.89
Chlorine 129 2.63 5.07 Potassium 9210 157 bdl* Calcium 397 3.07 6.39
Chromium 2.6 bdl* 0.188 Manganese 4.7 bdl* bdl*
Nickel bdl* bdl* 0.016 Iron 0.069 0.069 0.061
Copper 19 0.050 0.030 Zinc 1.56 0.122 0.100
Rubidium 17 0.294 bdl* Molybdenum 6.66 bdl* bdl*
Selenium bdl* bdl* 0.022 Strontium 13 bdl* bdl*
* below detection limit
89

Table 4.
Summary of Experimental Results (Chemical Effects)
Condition 46 kV No Carbon
57 kV No Carbon
46 kV 1 g/L Washed
Carbon
57 kV 1 g/L Washed
Carbon Initial
Conductivity 120 uS/cm 120 uS/cm 120uS/cm 120 uS/cm
Final Conductivity
176 uS/cm 200 uS/cm 141 uS/cm 170uS/cm
Phenol Removed
28% 40% 78% 89%
Power per Pulse 800 mJ/pulse HOOmJ/pulse 830mJ/pulse 1370mJ/pulse
Power Efficiency
2.3g/kWhr 2.4 g/kWhr 6.3 g/kWhr 4.3 g/kWhr
90

o
o
U
Ö
u 09
03 « 00
d
0 B9
o CD
S *- >s fa
=5 ,5 1 o o co
o>(/) CO
LJ- L. CM fa
d CD 1 X
d O
£ o E M O
% CM
d fa
CO
fa E d
"O o o cs
»H fa 00 d
j
CD »H M J> o CO ■* o d 1 CO o HJ h
CO o 03 o *J o CO co N « CO
1! II II II II II CJ < K o u Ü CO
91

V
HVAC
INPUT
HALF-WAVE RECTIFIED AC
CAPACITOR VOLTAGE
HV PULSED OUTPUT
t = (msec)
SPARK GAP POLE POSITION
CHARGING CONDITION
STROBE LAMP
s<5 V^TV^ V ^>^ Chorging eyck \ \S \
Sine Wave 60 Hz
Positive (+) .Bias
putM width ~1m
^i- N
i—i—i—i—i—i—h
After Diodes -» t
At Capacitors
After Spark Gap.
Time Scale ■* t
« BJ 115 16.7 JOB 2&0 3U 3U
rod ball n^ AN /
Or 90" 180" 270-
charge discharge charge discharge
ON OFF ON OFF
FIGURE 2
PULSED POWER SUPPLY
VOLTAGE VS. TIME WAVEFORMS
U
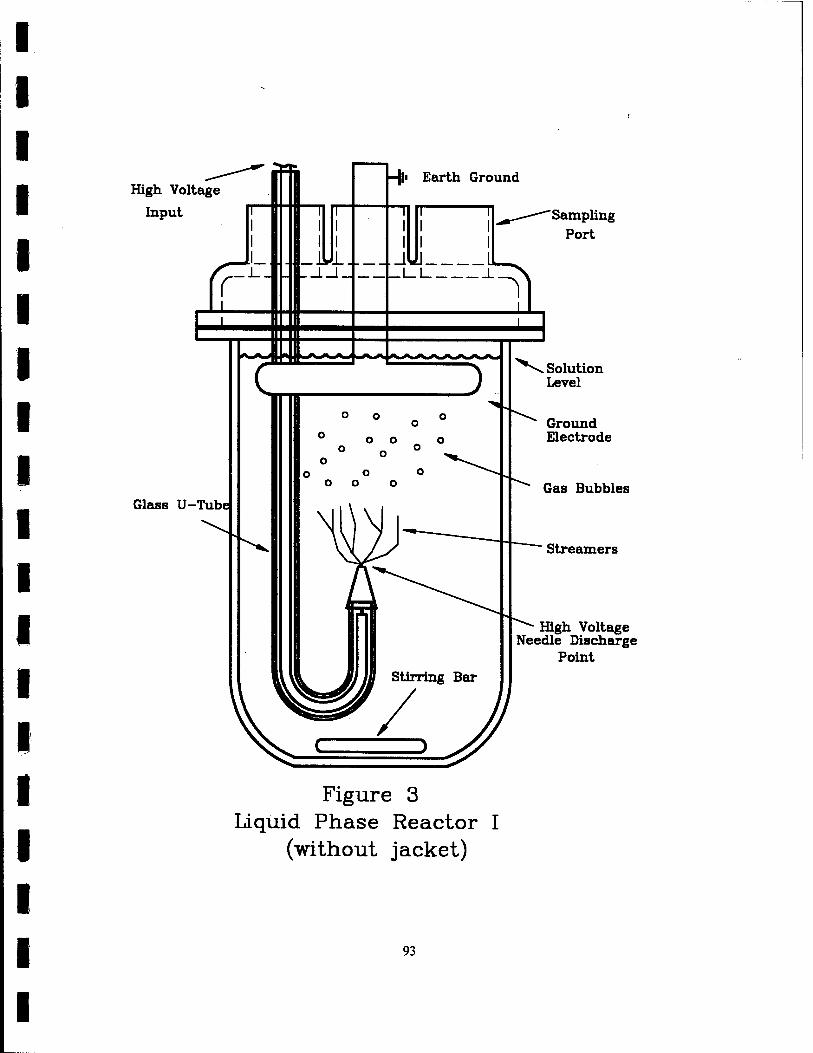
High Voltage
Input
Earth Ground
Glass U-Tube
Sampling Port
Figure 3 Liquid Phase Reactor I
(without jacket)
Solution Level
Ground Electrode
Gas Bubbles
Streamers
High Voltage Needle Discharge
Point
93
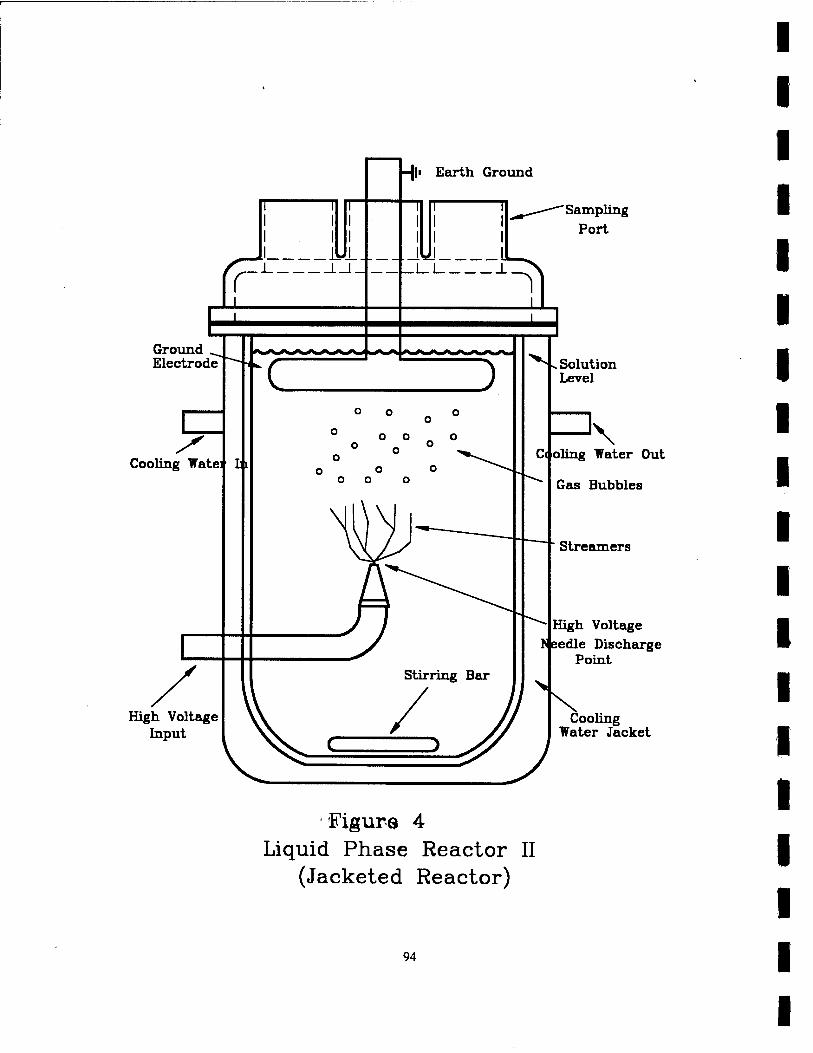
—§!■ Earth Ground
Ground Electrode
Cooling Wate:
High Voltage Input
v Solution Level
Sampling Port
\ Cioling Water Out
Gas Bubbles
Streamers
High Voltage tyeedle Discharge
Point
Cooling Water Jacket
Figure 4 Liquid Phase Reactor II
(Jacketed Reactor)
94
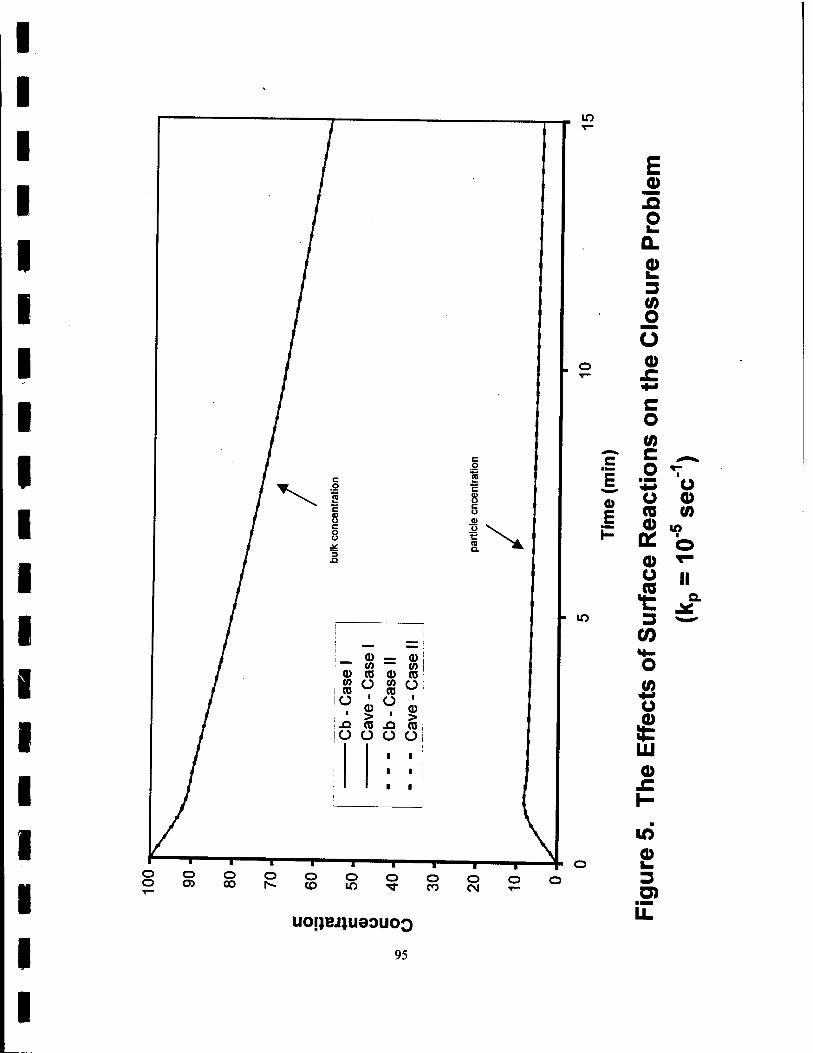
in
. o
E ©
O
0) 3
o o 0
i_ <D _ <D ~ <n — <n <D re <u TO
% o 8 o i ■ 2 ■ 51 ■Q (S £ (0
IO O O Oi
0)
IN. 0) E
■ in
II
C o 0) c ^ O T
o o
0 o ■E 3
CO
o 0) o
LU 0)
I-
o in o o
CO o CM
UOIJBJiUeOUOQ
95
IT)
2 3
Li.

in
.g 'S ä -2
E
i
< < < c s C
( ~ ( X> (
? ! 3 c
1) n
■ D >
- -
- C
b-C
ase
II -
- -
Cav
e -
Cas
e:
■ • ■ 1
in
o o o o o o o o o o O) 00 1^ CD m ^ CO CM
E a> n o
0) i_ 3 0) o o
CD
c o tf) c ^ O T *= o ü 0) (0 w
* b ü
CO
II
o (/>
O
LÜ 0
0)
3
UO!JBJ;U90UOQ
96
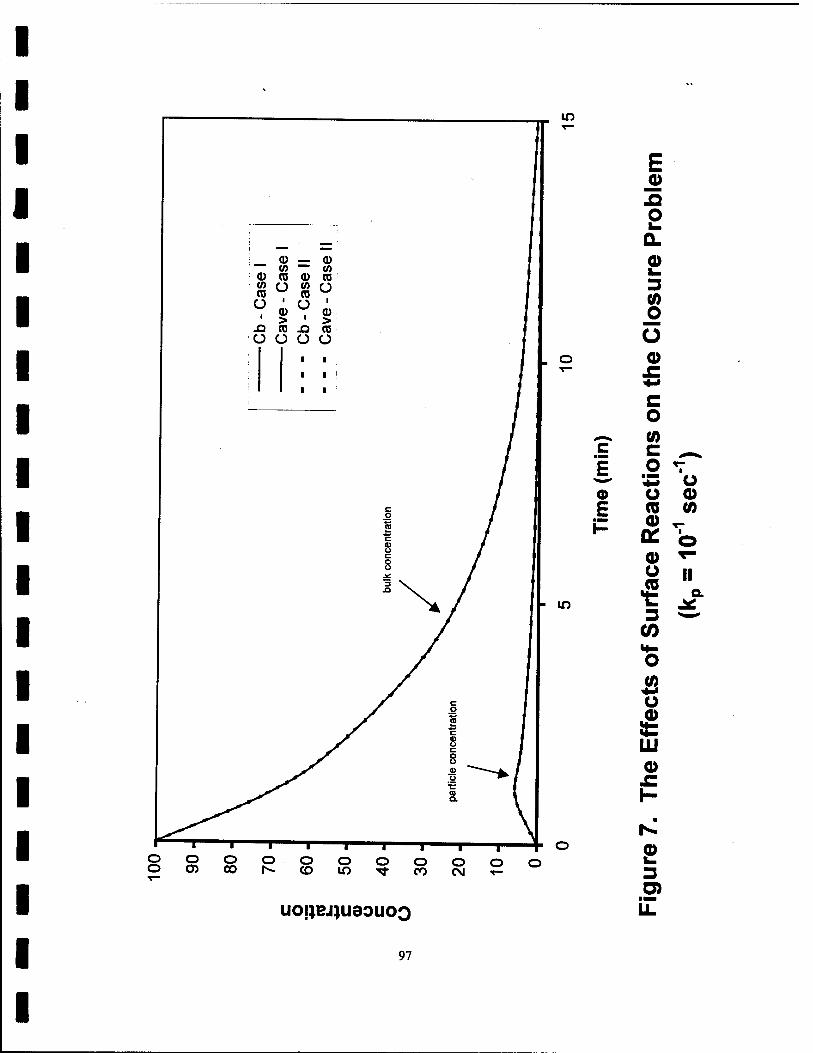
in
^™ I^B
CD «■■■ (1) ■ .. (0 ™" CO CD (0 (1) as CO co O CO
OS O O o 1
(U CD 1 > ' >
.Q CO X3 CO O O o o
. o
£ -2 E
m
E
o
£ 3 CO o a 0
c o (0 c ^ O T
■j3 o O 0) CO (0 a> ,- a: o <D o
3 CO
o a
LU 0
0)
3 CD
II
UO^BJJUaOUOQ
97

in
. o
c o ü . 0) u
'•E CO Q.
iS CD aJ Q.
.8 * £ OT
> ' > -O CD JD CD O O O O
o lO
O o CO
o CM
c
E
in
Q) E o a> O ^_ (0 o C
■ 1^ o 0 +J XI (0 a 3 (0 E to k. > o k. LL (0 ^^
3 O) c (0
0
o *-» o c 0) "~
tt
00 a> 3 G)
Li.
uo.ijejjeuouoQ
98

in
. o
c o o« J) Ü
'■E n a.
= (1) — d) — ui — tn a> CD <D as 8 o 8 ° o ' o ' ■ 5 ■ 5i
-Q CO .Q CO o o o o ■ ■ ■ I !
■ m
c mmm
E
E
0) o c CO *-• ^^ CO CO ii^
CO 0 E fc ^ u. ii CD CO c
E
CO N,,,,'
1- ^^
co CO
0
CO O s S o ^rf ■^■i
£ o
LU CD 0)
1- 0 XI
■ 4-i O) c £ o 3 D)
■ ■IB
U.
o CO
o CM
uo!iej}U90uoQ
99
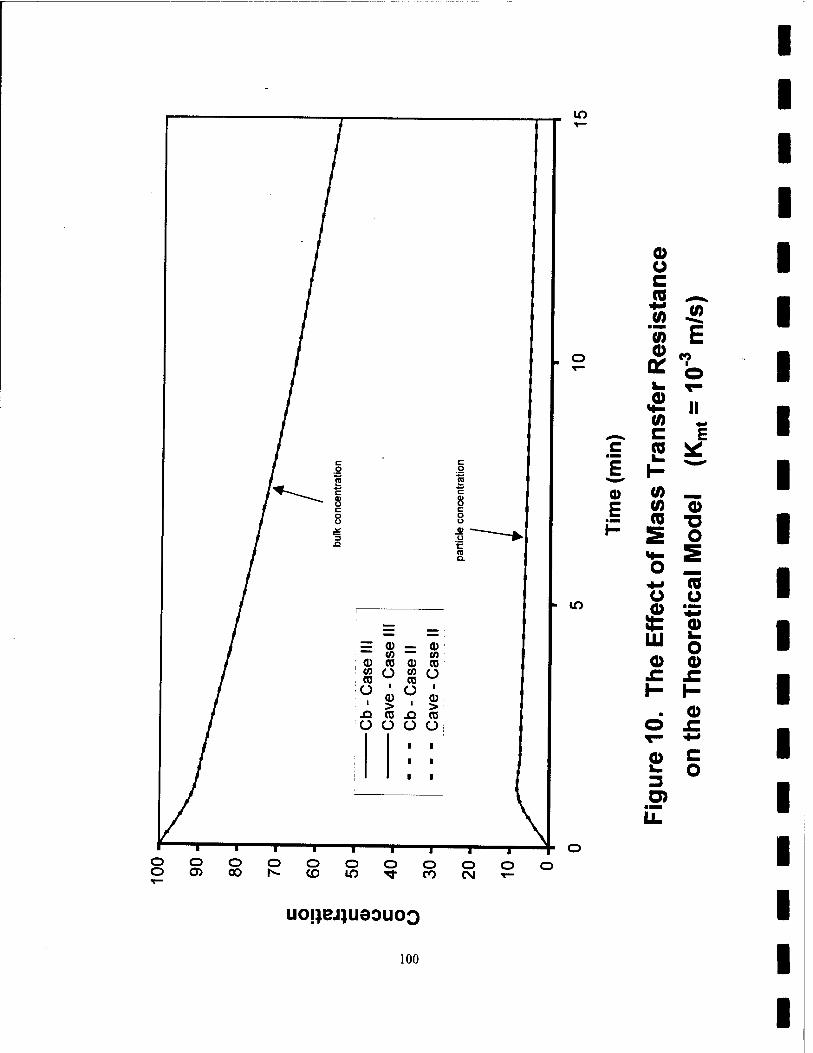
m
0 O c 3 2 o
R c o u <D u t: ra Q.
(1) « (0 CO
<D (0 0) (0 CO CO
O CO (0 o
O i CD >
O CD >
J3 CO .a CO O O O Oi
■ lO
E
w
«o
0)
^ C E .E S5 * £ £ ~
w 0) (0 "O S o «•- s o 4_l (0 o u £ 0) UJ o o Q> XI XI H 1-
■ 0) o XI ^^ *-»
a) c o
3 O)
uojjejjueouoQ
100

w
. o
c o CD
c « c o u 0) Ü
•tr (0 Q.
_ "■" ■«■B
] ™ a) mmtm 0) CO
mmm (/>
<D CO a> (0 CO CO
O co o o
1 > ■ ■> .a (0 .Q (0 o O o O jU U U CJ
1 I ■ ' ■ III
C
I E
lf)
o o o O OJ CO
o in
o o CO
o CM
0) o c (0 ^,—
(ft (0
(ft E 0) to
b k ^™ a>
II 0) ** c E JO *
co mi^m
(0 0) (0 ■Ö s o s o ^ (0 o o £ © LU o 0) 0)
£ 3 Ö) il
0
c o
UO.UBJiUaOUOQ
101
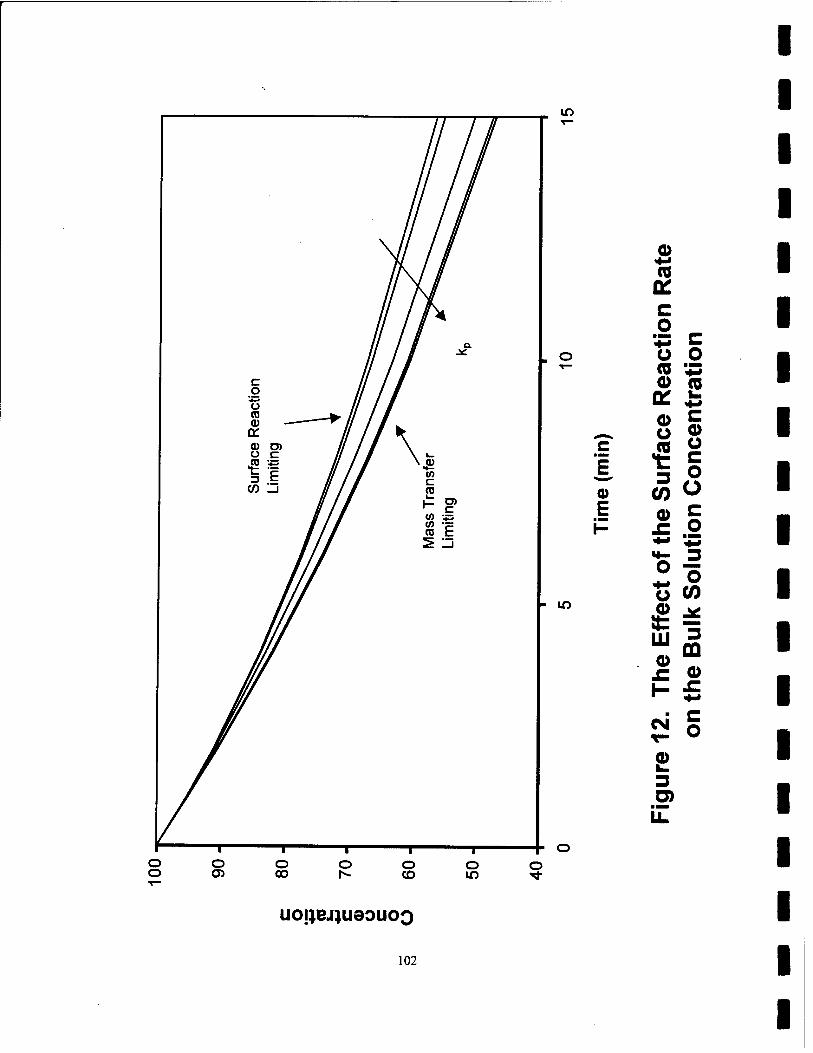
in
. o
0 E
- m
0) +•* (0 tf
c o
£3 c O o CO 0) (0
Of v.
0 C o Q) (0 O
CO
C o o
0 c +*
o ll_ 3 o o o (0
£ ^
LU 3 CD
0) £ 0)
si § CD
3 D) li.
uo;;ej}U33uoo
102

(a) Deionized Water
Peak
Voltage
(kV) 30 .
20-
10
0
t
500
r 1000 1500 2000 2500 3000
(b) Unwashed Activated Carbon
1000 -löUU 2000 2500
(c) Unwashed Glass Spheres
i
3000
500 1000 1500 2000 2500
Time (\xs)
—i
3000
Figure 13. Voltage Waveforms for Various Solutions 103
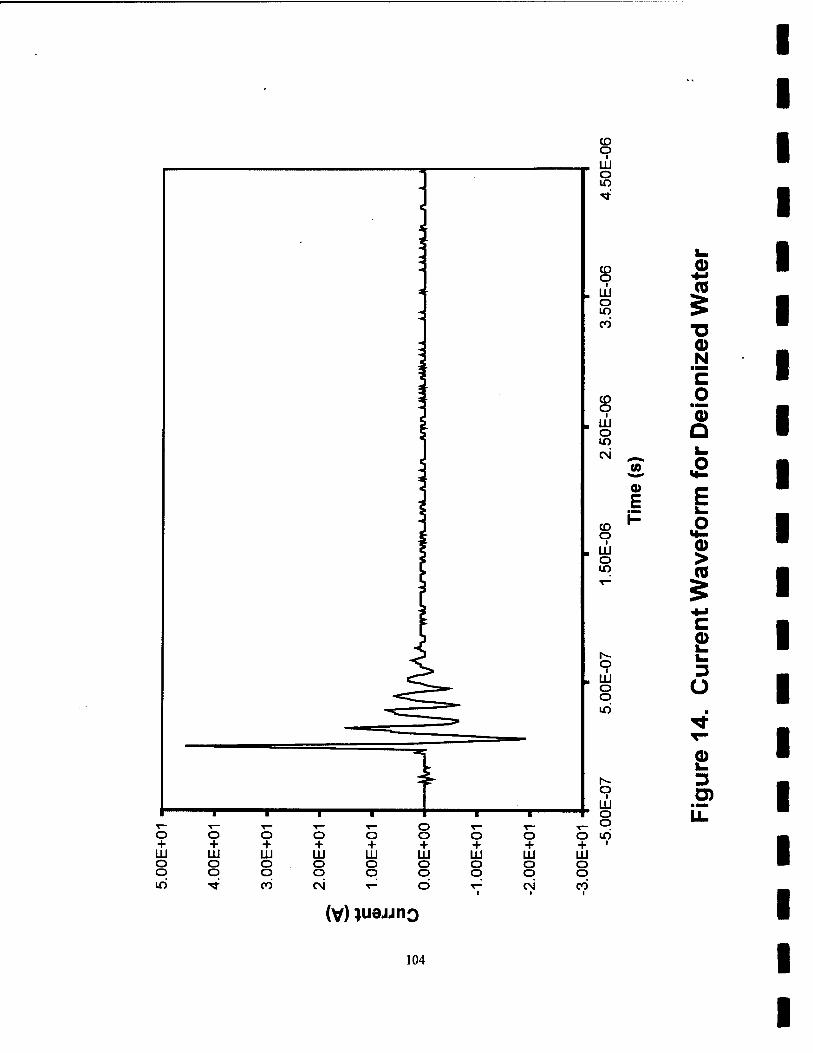
CD O UJ O in
CD O
LU O
(0
5 CO
o N c
(0 o o UÜ o
0 Q
10 CN
"u> P «^
0> F E
L. CO l- P O **-
i
III 0 o > in (0
5 C 0) u
o LU O o o in
o LU o o iri
£ 3
(V) »uejjno
104

CD
iß
1 1
CO
l
, (0 T3 f» co CD x:
CD CO
c Q. CO 1
o (/) CO .a fl> c 1
CO CO CO O o
O ■a CD *■*
CD
(U
o ■o CD
CO
T3 CD sz CO CO
5
(0 o CD
CO
CO <D ü
j
! CO j CD !
Ü CO l_ •> r "Ö ! < •D CD
(0
5 c
E E 3.
< "O CD
CO a. "CD
O
co ; a. I
Q-i CD 3. CO x: en «s in 1
§ o a.
c Z>
CM V
o 05
O i
3 c o
co re +j c 0 U c o o
CM
O lO O lO o O) 00 00 s s mo m o
co co in io lf5 o
(A>|) eße^OA UMop>|eaig
0)
(ü
o
(0
m c o c o
2 c o c o o o r (0 a.
o
LU O
H
lO
<D 3 O) U-
105
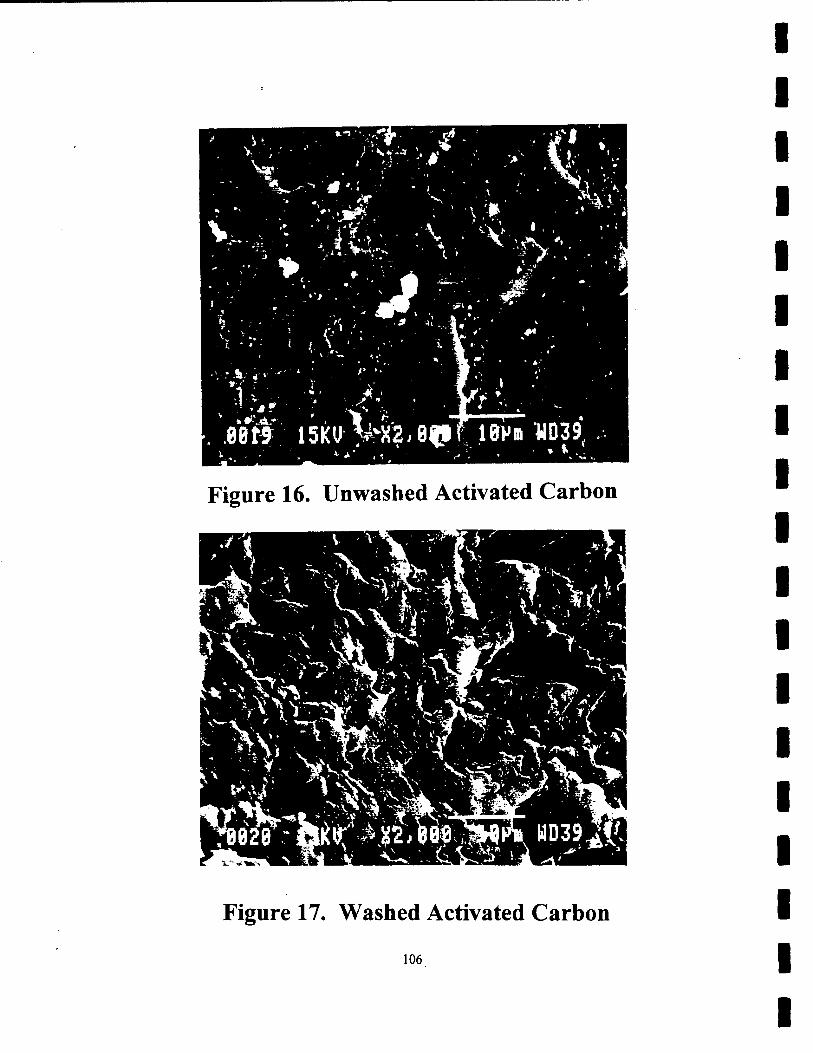
Figure 16. Unwashed Activated Carbon
Figure 17. Washed Activated Carbon
106
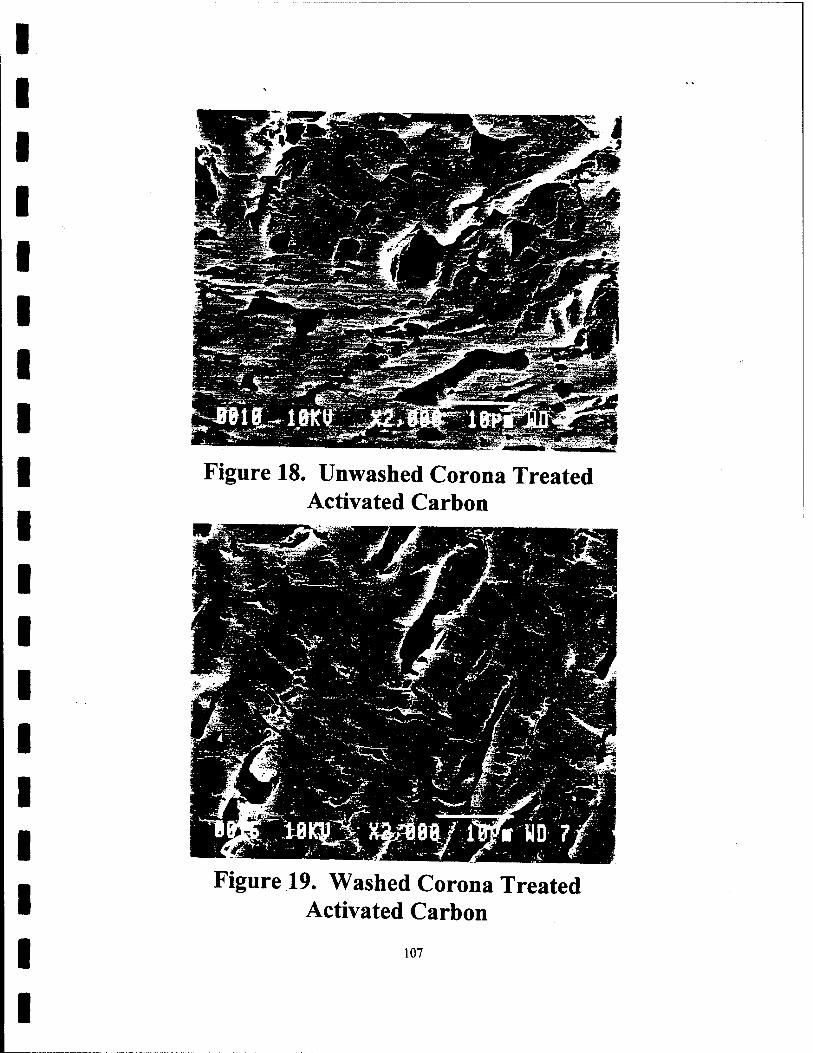
Figure 18. Unwashed Corona Treated Activated Carbon
Figure 19. Washed Corona Treated Activated Carbon
107
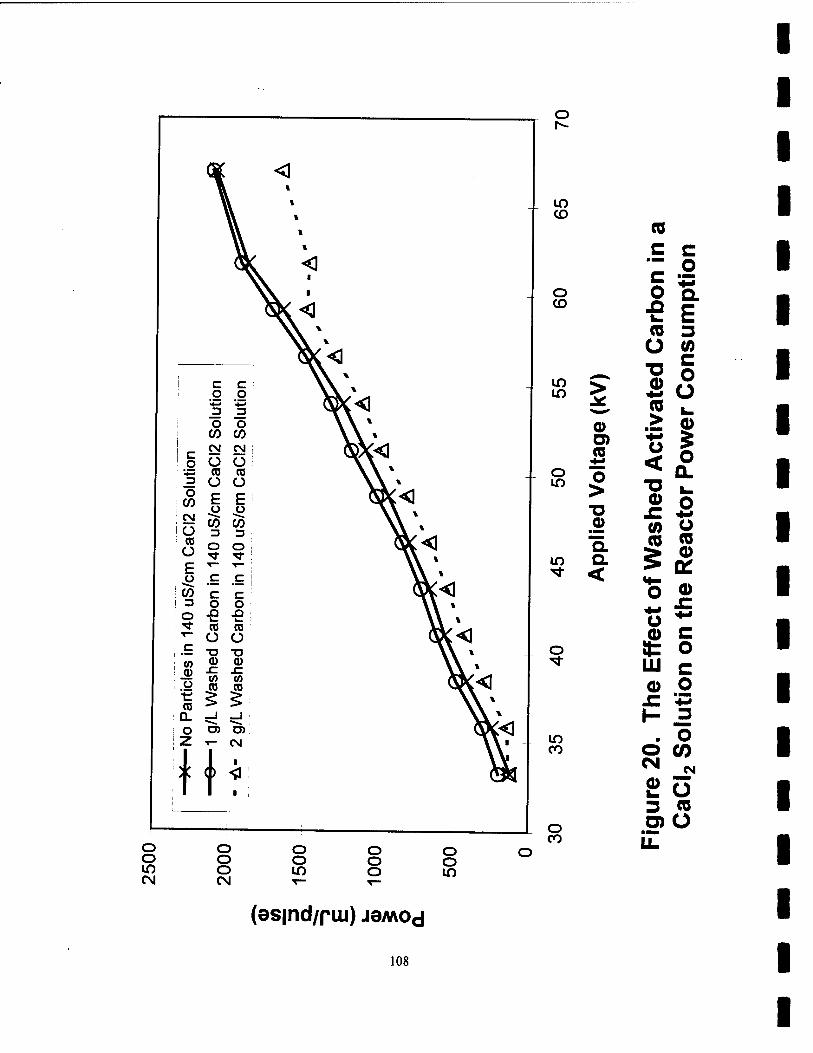
o
O o in CM
c g
o CO CNJ
o CO O E
CO 3
O
O
CO Q. o
Hi
3 3 O O
CO CO CM CM o O CO CO O O E E ü o
CO CO 3 3 O O ■<r -<fr
c o
JQ
c o
CO CO o o ■O TJ CD CD sz j=
ii
O O O CM
CD
o CD
m > .* ^^ <D D> (0 #-•
o in O
> ■Ö 0>
i^^ a in a <*- <
o
m CO
o o in
o o o
o CO
o o in
CO
c c
II
■I I <£ © o
5 0 a: o ©
° ~ <!> c
it o HI c a> .2
■C *3 I- 3
. O O (0
£ Ö 3 CO 0)0
CM
(es|nd/piu) javwod
108

d
! C «= *^. g .2 «\ *-* ^2 jJV . 3 3 i *^WC O ° ! cCv CO CO %\\
1 c - Ö ° 1 <K^ ! O (0 (0 1 ^&K\
'*-» Z z \\ 3
i o E E ^, i co .o ■£? ! ">D£ ; — CO CO ^A u 3 3 W
(0 z O o "* •sr
E .o
▼"" ▼~
c c « S5 c c 3 o o O xa ^ JD
^~ (0 (5 T—
1 O O i c T3 TJ
U) <D <D jj) £ £ i » (0 (/) i o .5? JP : 't:
: co £ £ D. _J -J
i o O) Ö) ! 11 ! z
■ I eg
i 1 ■ ■ i T * 1 ■
o
o o in CM
CD
o CD
LO LO >
^^ 0 O) (0
4-> O in o
> ■o ©
■ MB ^^■1 a
in Q. <*■ <
o
m CO
o o o CM
o o in
o co o o o
o o in
CO
.E c c .2
it CO 3 O w a> o
0) o 5« CO
0
O 0) *■* JZ o +*
8= o w c 0 O
^ I - o
CN J» CD O 3 «
(es|nd/puj) je/wod
109

o
10 CD
c c o o *-* *-J
3 3 O O
' CO CO c: o o o * * 3 E E o o o Ui CO CO — 3 3 u O O
E <>
■*- T-
c C •~" •"" CO c c 3 o o O I—
X3 : i— i
M" (0 (0 T'' o O c ■o "O (/) (1) (D 0) .c .c
V) U) Ü 5? S?
£ £ Q_ _J _l
o CD
in ^
© O) OS *■* o
to o > ■o 0
mwmm
Q. in Q. -*- <
o
in CO
o o in CM
o o o CM
o o in
o CO
(0 c — c c o o *= n a. !u E
V c <B o w O > i.
< o O k. .c o </> +■* s S > w
?* ° a> Ü £ 0 it c
£ o
£ o
o o o o o in
(es|nd/piu) jewvod
110
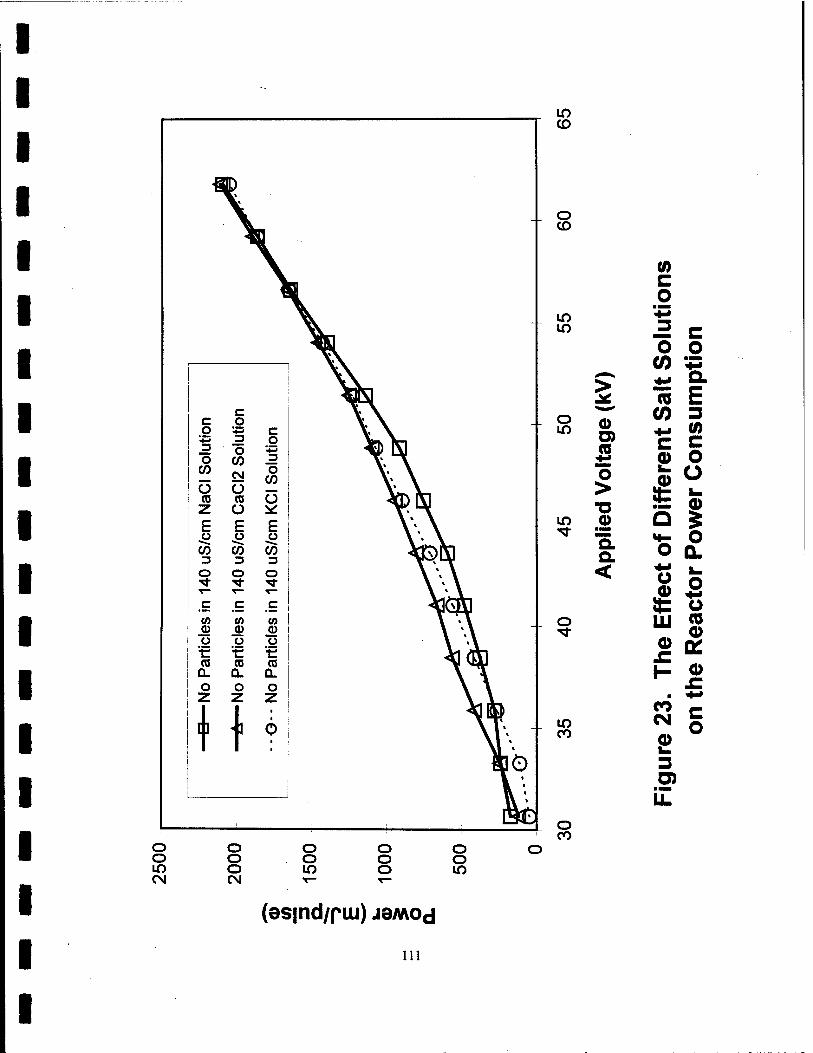
\\
c v\ c 0 \ \ g ^f2 c %» % *3 3 0 3 O *-* ^VJi 1 ml O CO 3 V \
CO CM 0 CO %* %
Ö O %* % ra CO Ö Z O ^ \* ^l E E E
% % %
.0 ,0 ü \ m
CO CO CO 3fyr^nn 3 3 3 iL* 1 0 O 0 m m
■«a- "<fr ■<r \ » \ ^ T— ^ \ * \ c c c "NüGKI (O tn (0 \ *• \ (D <o <D % * » Ü 0 O m * %
■■c ■C ■■c (C (0 (0 a. Q. Q. \ *» 0 O O
1 Z Z
6 ■
\ 1 1
■V
1 Mfli ,
in CD
o CD
10 in
o m
in
>
0) CD <0
o > •o .2 Q. Q. <
o
in CO
to c 0 ^ 3 c O 0
C0 *■» Q.
(0 E (0 3 ^_l CO c c 0) 0 0 0 it 0) Q £ *- 0 O Q. +ri ^ O iff
0 St 0 LU (0
0) 0 ■C
tt
1- 0 -C
■ 4-« CO CM c
0 O b. 3 O) u.
o o in CM
o o o CM
o CO
o o m o o o
o o in
(es|nd/puj) je/wod
in

© %
»
© i
© c L %
! c g 1 .2 '^ c \ X. *
• mm
2 3 O
.2 « ÖH © ! o CO 3 \ \ *
co
lo CM
O
O CO
\ Kl © «3 CO Ö X T*. 1 z O :*:
1 E ! .O
E o
E \ la © : co CO CO \ \ * i 3 3 3 \ \ * i O o O <l H © 1 "*■ M- "fr ! ^—
▼~ T- \ \ * •- c c
\ \ * C
i o c o
c ! o : O0
-O .Q n \ \ * fc- 1— ^. ' CO CO CO \ \ * ! O o Ü <l m © T3 T3 TJ
CD CD CD \ \ * - - J= x: SI : CO CO CO ! \ \ i
II I 1: \ m® ! _l _J _J
\ \ * i °> D) O) km® ■ T— T- T-
1 I \ \ *" 1 1 1
it 1 Q • ^b®
o 1^
o o LO CM
O O O CM
LO CO
O CO
LO LO
O LO
LO
>
CD O) CO
*>*
o > ■o o Q. a <
o
LO CO
o CO
o o LO
o o o o o LO
c o a E
£ c CO o tf) a O 0)
,5 o O DL
CO L. ä 5 CO o
CO CO ^ a> c a: £ a,
Q o
° § o
LU 0)
CO O
©
>
(es|nd/piu) jeMOd
o
3 0 D) JZ
0) CO
O)
CM
Li.
112

o
o o 10 CM
c c o o *■* c
*l—- 3 o 3 o o CO 3
CO CM O CO o O
CO CO o z O * E E E o o a
CO CO CO 3 3 3 o O o "* ■*r "* ^~ T-
C C C
c c c o o o .a .a X5
i— i_ CO CO CO O O Ü ■D TJ "O I a) 03 CD x: JZ .C : CO CO CO i s? J> CO !
<: £ £ _l _J _l :
O) o> O) | CM CM CM !
11 f o o o CM
0
0
CD
O CD
LO LO
O LO
LO Q. Q. <
o
LO CO
o o LO
o o o
o CO
o o LO
(es|nd/puj) jeMOd
a E
_ 3
£ c CO o to O = .- O CD
R o o a. CO k. *- o
a> CU O Ö) CO CO as 0 o c a: > a> 0) ■D £ £
Q o
5 i £ io LU W
"D 0) 0)
H «
CM O
3 0) D) £
E 8
CM
113
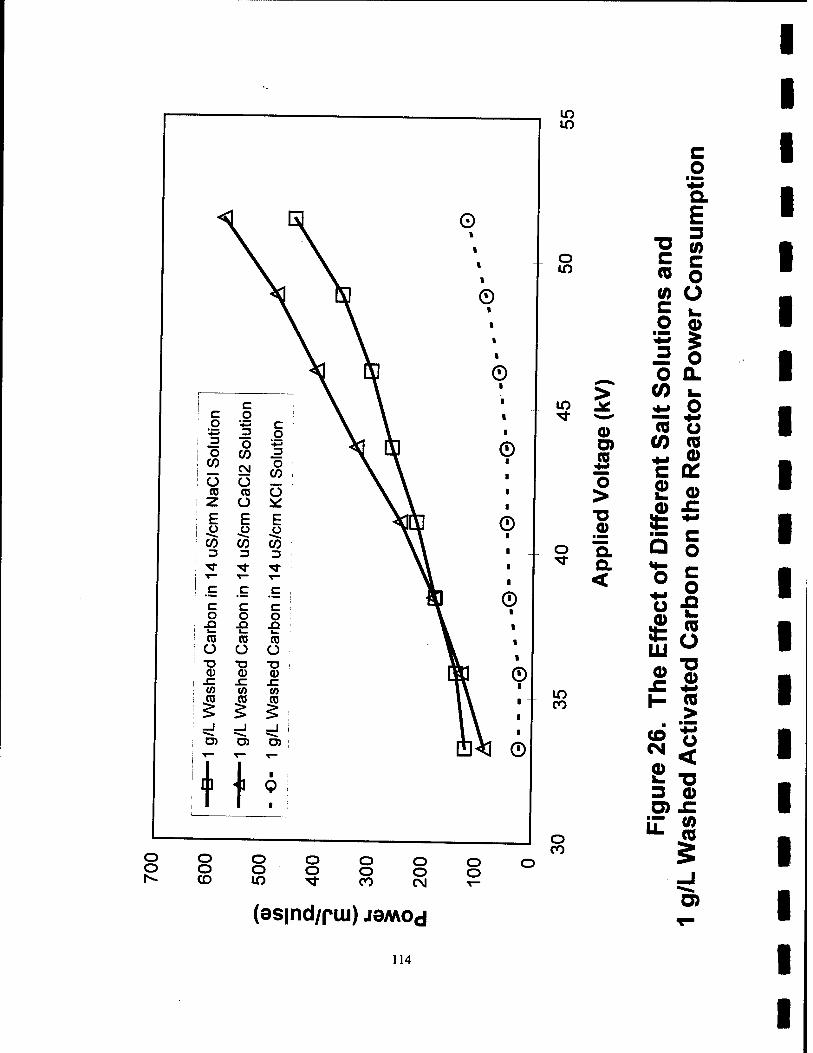
LO lO
o o
i c : c o ; o £5 C ' ^ 3 o i 3 O ^
i ° CO 3 CO o CN CO
; O o (0 05 C) Z Ü *: E E E ü a Ü
CO CO CO 3 3 3
■<r ■f Tl- ■*— ^~ T—
c c c ; c c c ; o o o .a x> JD
1— i_ ' «J (0 CD Ü o O ■D <D
T3 CD
X3 CD
; CO CO CO
if 1 1 i -J ;-i —J i ! D) O) D)
H i Q ■
o
o O) CO
o >
.2 ^ Q.
<
in CO
o o CD
o o in
o o o o CO
o o CM
CO o o o
(es|nd/pui) jeywod
c o *-* a E
_ 3 ^ CO £ c CO o a) a O (j)
II o a.
co «-
"c5 o CO (Ü
c a:
5 §
uL CD
u ° » 'S Hg
■ IS
v- T3 3 0 Ö) £
E !8
Ö)
114

in in
o o CD
CO CO CO j O O Ü ! "o TJ -a a> a> a> i .C SZ S2 tO (0 10
III o> o> o>
CM N CM
o o m o o
; c
i C o o *-» c
■ L-f^ 3 o : 3 o i o CO 3
w CM o CO
i Ü Ü CO CD o
! Z O * 1 E E E o o o
CO CO CO 3 3 3
"<a- TT ■<r T— T— T—
C c c c c c i o o O i .a .Q X> !
o m
in
o
© D) CO
O > ■o
Q. a <
in CO
o o CO
o o CM
o o -1 8 CO o
a E
_ 3
£ c
ft O o a>
II o a.
CO i. *- o co o (0 (0
o
Q »*- O
c o c o
5-S UJ
■
CO O
a) CO >
Ü <
(es|nd/pui) jeywod
3 0
= 8
D) CN
115

i c c
] o o i *-» *-* 1 3 3 [ O O
CO CO
O o * ^
k. t—
1 1 b .o CO 3
b .o CO 3
Q Q o o _c _c Tj" T
c c C c o o *~ .a .Q c c
1— >_ o o (0 (D JD .Q U U 03 ro ■D T3 O O .c .c T> ■D u) </) (1) <D (0 CO £ JZ 5 c
5 c
(0
3 3 §« £ O) O) O) Ö)
ooooooooo ooooooooo OOCD^CNOCOCD^-CN
o
CD
o CD
ID
o ID
ID
o
ID CO
o CO
>
o Ö) W
o > ■o 0)
Q. a <
(es|nd/pui) ja/wod
Ü.2
Si c c (0 o C Ü O i.
■8 >
■o u. J> o
> 8
Si
i <= E .2
•So c » S o 5 « E •- o c O O a> ■£
■- Ü
£ >
il < 116
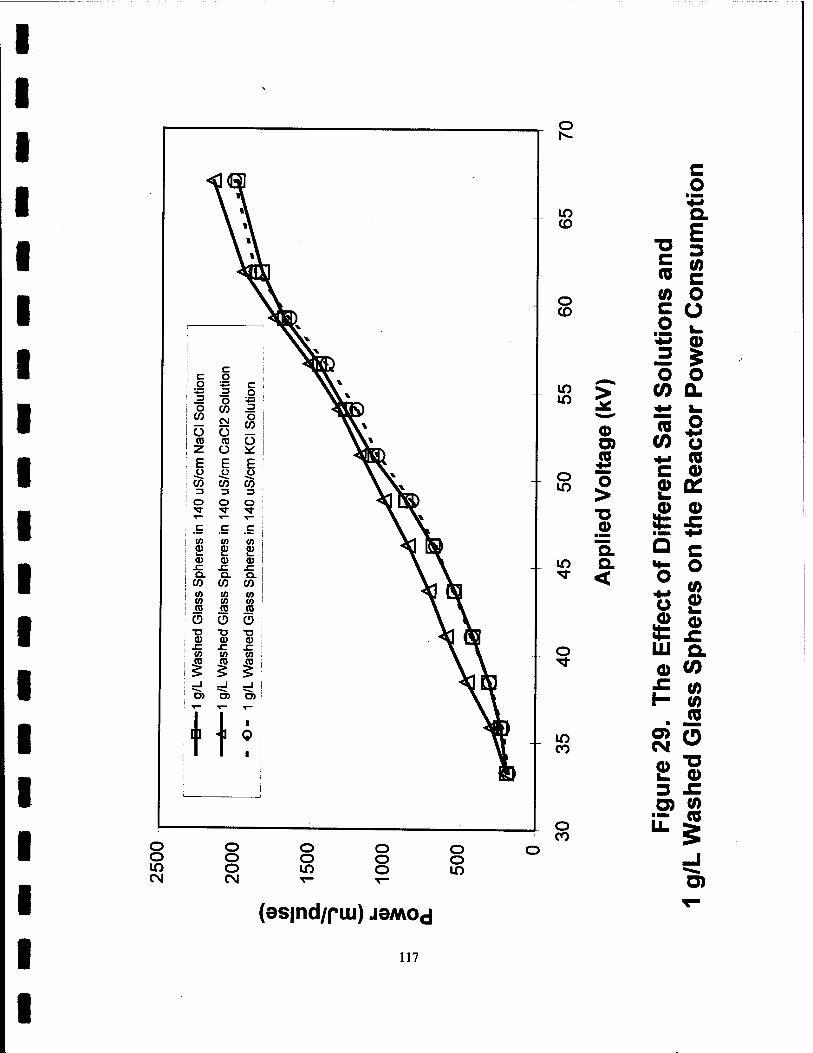
o 1^-
o o in c\i
g
o to Ö
CD 2 E o w 3 O
c o *■*
_3 o w
CN
o O E .o CO 3 O
c o
_3 O
CO
Ö
E ü
CO 3 O
O o o CN
in CO
o CD
! .£ c c i CO CO CO i cu cu cu '■ L- k_ c.
0) CU cu .n J= 4= °- Q. Q. 1 CO CO CO i 0) CO CO ! w CO CO
(0 ra CO | \
! Ü Ü O : > i T3 ■o "O '• i Q) CU cu ! £ x: f !
CO CO CO : ip CD CD ;
£ £ £ _J _J _l 1 O) O) O) I
t i ■
1 i 1 1
i
in in >
"^^ © o> (0 +rf o
in o > ■D 0)
in "3-
a Q. <
o
in CO
o o m
o oo
o o o
o o in
C o a
m W «0 c
tn o
If o o
co a.
o (0
c o 0) 2 0)
CO
c a)
I a o *■•
Ü
£ UJ _ 0) CO
I- 0) JE
3 £
Eg O)
(as|nd/pui) je/wod
117

lO
E H
if)
c o c o
*J C a o o JQ
tf> W "o o < ■o o 0)
4-* c (0 a> > x: ■ ■M
£L o H-> < O "Ö 0 a> (0 a: (0 a> g 1- -j
HI ■
o SJt
CO a) k. 3 O)
LL
(peziiBuuou) uoj)ej)U93uoo
118

to
! <D c o ' c O
o 3 c o c
.c CT Ü o a) O 1_
o j <u T) CO ! -C (0 >. CD a. O I a:
\a\ I
■B-^fl S
Q 30
Ö »3
a*]
o c a>
— a.
E
O C o
mmim
(0 "O 2 a) Q 0)
CO
Q) 3 D)
LL
ÖÖÖÖÖÖÖÖÖ (pezjieuijou) uosjejjueouoo
119

■a—<&* in
CD C o c o
o 3 c x: CX Ü
■ c u CD
O o (U *-* ■D CO sz CO >. (D Q. O X £
\ ■ 1 4
1
G 93
D )»:i
Q )):l
Cp)jl
ÖH *. i S3
O)COh--(Diq^j;c0CslT- ööööööööö
(peziieiujou) uopejiueouoo
io *-* CO
o c
E O
E
i- io
c o +■* (0
£ D)
a 0
CM CO
£ 3 D)
« o
120

lO
3 O
5
w
CU c -C o
> o c warn ■* T5 E to 0)
o 'S > E mm "= o r- 5<
O T3 E 2 © ■£ K g öS 0) ^ £ Ö) Q- T-
co CO <D t. 3 D)
LL
(pezi|Biujou) uoijBjjueouoo
121

<D c o c O
O 3 c r CT Ü o
c O 1_ o
<D *-* ■D (0 x: ra >. tt) CL Ü I DC
I □ 1 1
m
m
"fr _ *- £ (0 o — n c * o O Jr ~o CL <D c
E •s| c -^ 0)
E o o » <
H
rada
he
d
D) (0 0 <C Qg O _i
(D (0 3
tö) II
« O
(peziiBLUJOu) uouejjueDuoQ
122

03 C
2 o o o
>
c c o o
-Q Si > en a. O O
■D ■o <D (D
c x: JZ o .a m
Ui (/)
i 1 O _i _J o O) O)
I I
□ I!
m
c E o E
m
3 O
c CO c .c o
£ en > O
w 'S IS £
is t* Cfl
cu o s c o -J .c Ö) Q_ *-
if) CO o 3 O) U-
(pezjieuijou) uo;;ej;ueouoo 123

"O c CO
> J* h- V) *- E (0 o _ .Q ° IS o O
c £ EL <D
■s| E c -^ LI o o 1™ 53 <
rada
he
d
D) 0) a> co Q 5 © _j
XZ ■**». H öl
to CO 0 L. 3 D)
(pezjieujjou) uo^Bjjueouoo
124
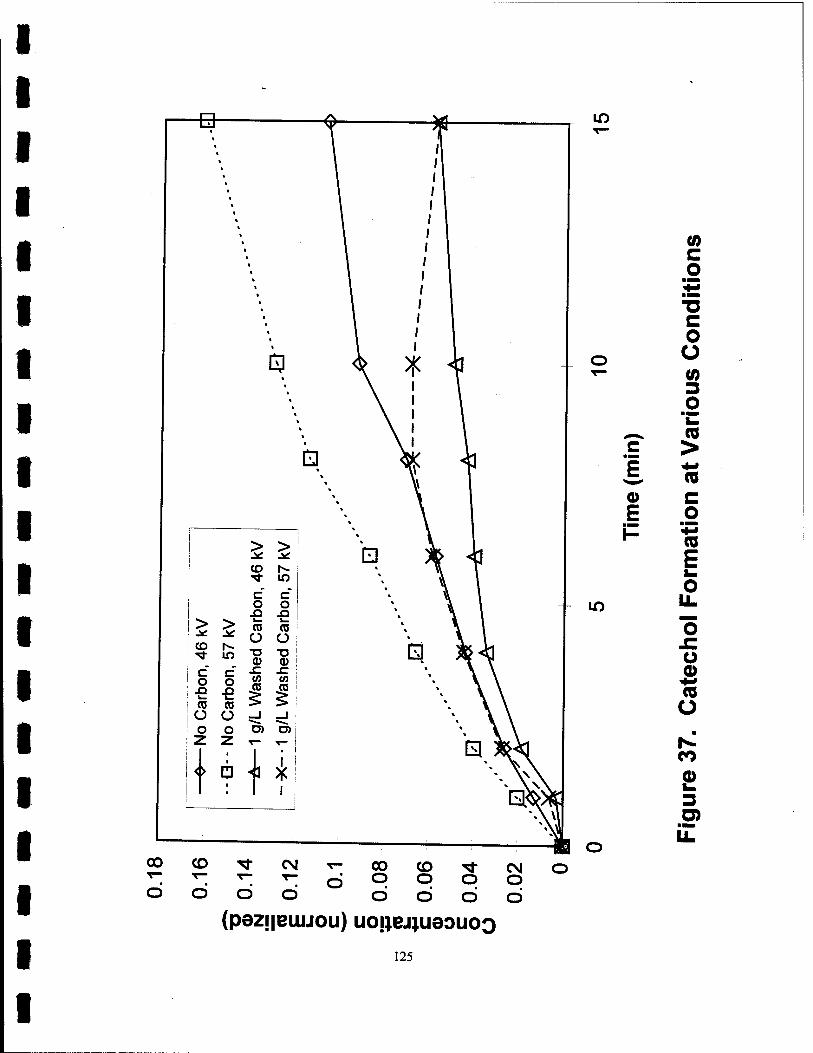
■B
oo
d
in
c I o E H
m
(0 c o
o o (0 3 o
>
c o ts E o
LL
O 0
*§-» (0 O
■
CO
o 3 Ö)
CO CD ^f CM p O O O Ö Ö Ö Ö
(pazfieujjou) uoijejjuaouoo 125

in
> > J£ JX
1 CO h- i
1 "<fr lO !
c C i o o £} .Q :
> > l_
TO -2£ ^ O O i CO T3
0 ■o i cu
r r x: j= ' o n CO
o
(0 1 to ;
i! O O _i _l 1 o o O) O)
lO CM O
CM O
lO
o Ö
o O
lO o o
c
E
in
(ft c o
c o Ü
3 o (0
(0 c o (0 E
o c O
o w
00 CO
0) 3
(pazjieuujou) uojjBjjueouoo
126
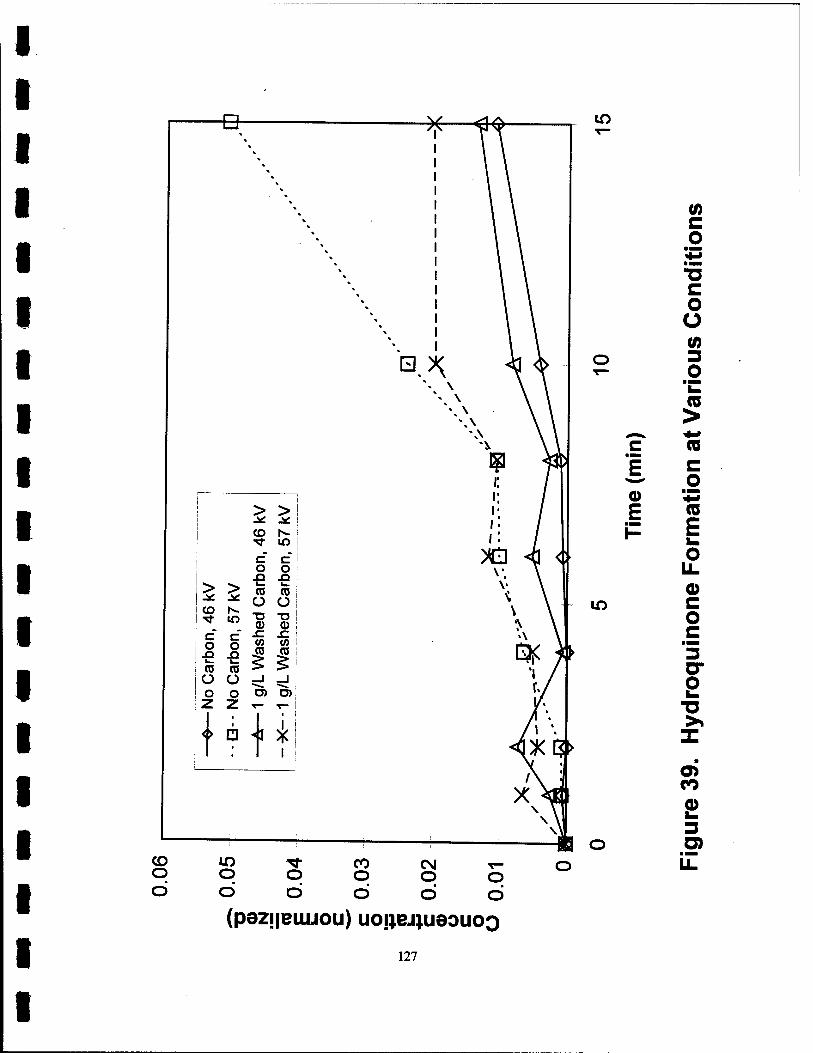
■B-
CD h-
c c o o .a X2
> > 1— en
i— CO J£ J£ O C)
CO CD
"D CD
r c SI x: o
CO
o
CO i V)
i O O _J _i o o CD CO z z
H + X
CD O o o
lO
c E CD E
lO
(0 c o
c o a a) 3 O
■ ■■i
(Ü
(0 c o +■» (0 E o
LL 0) C o
o
CO 0 k. 3 Ö) iZ
o o o o o (pezjieuijou) uoßejiueouoo
127

00 o
in
E
m
■u c CO > .*
i^ c m o 4-» CO
n %m
CO c O o ■ö CO o E CO
> o +*
LL o +■» < O 3 (1)
O (0 Q. 10
00 _l ■"■••»
o D3 Tf T-
o
D)
(pezjieiujou) uoijej^uaouoQ
128
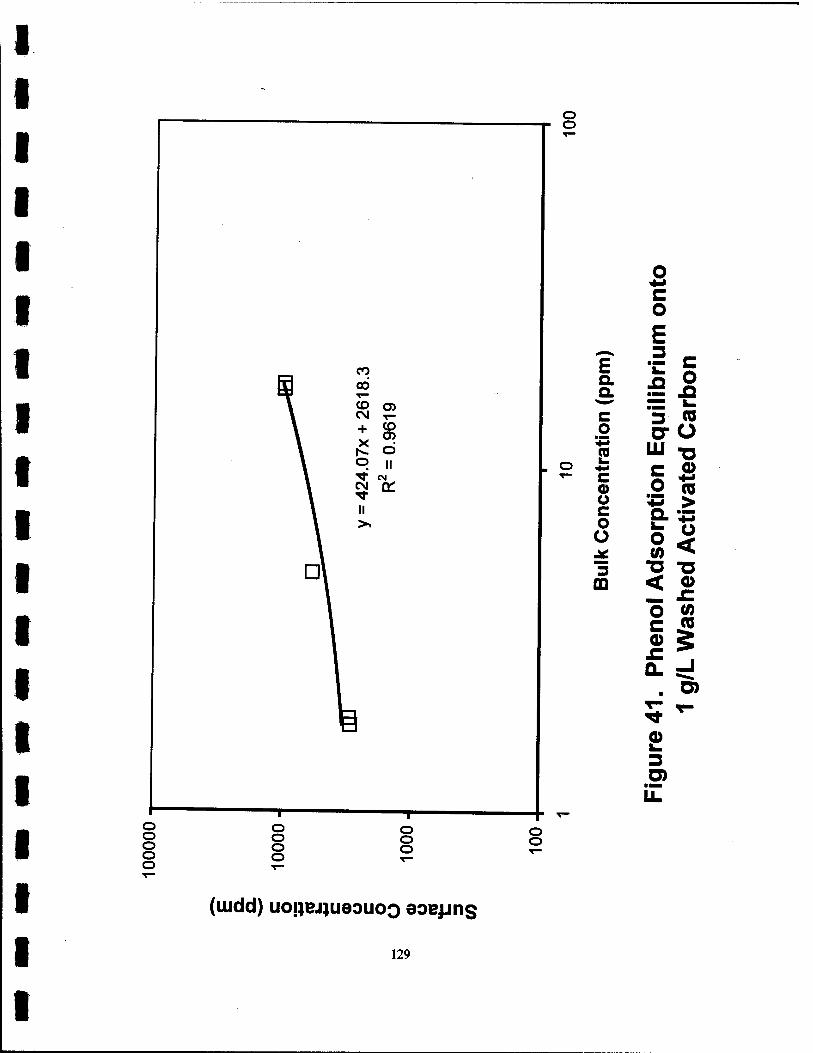
o o
o o o o o
c o E
^». 3 — E a 51 a := -Q
*■-" ■ ■IB ^™
c 3 CO o crO 5 UJ -u
o £ c © *" C s +"• <D .2 w Ü '<? > C o o
sorp
A
cti
3 ■ö T3 m < 0>
__ £ O (0 c <5 • 5
**'
"* *" <D
D)
o o o o o o o
o o
(uidd) uoijBijueouoo aoejjns
129

o E
>
w c o
o a E o o 0) Q Ö c
c o w c E k. a> <D Q a> (0
a) 3 O)
(OQ/0) u|
130
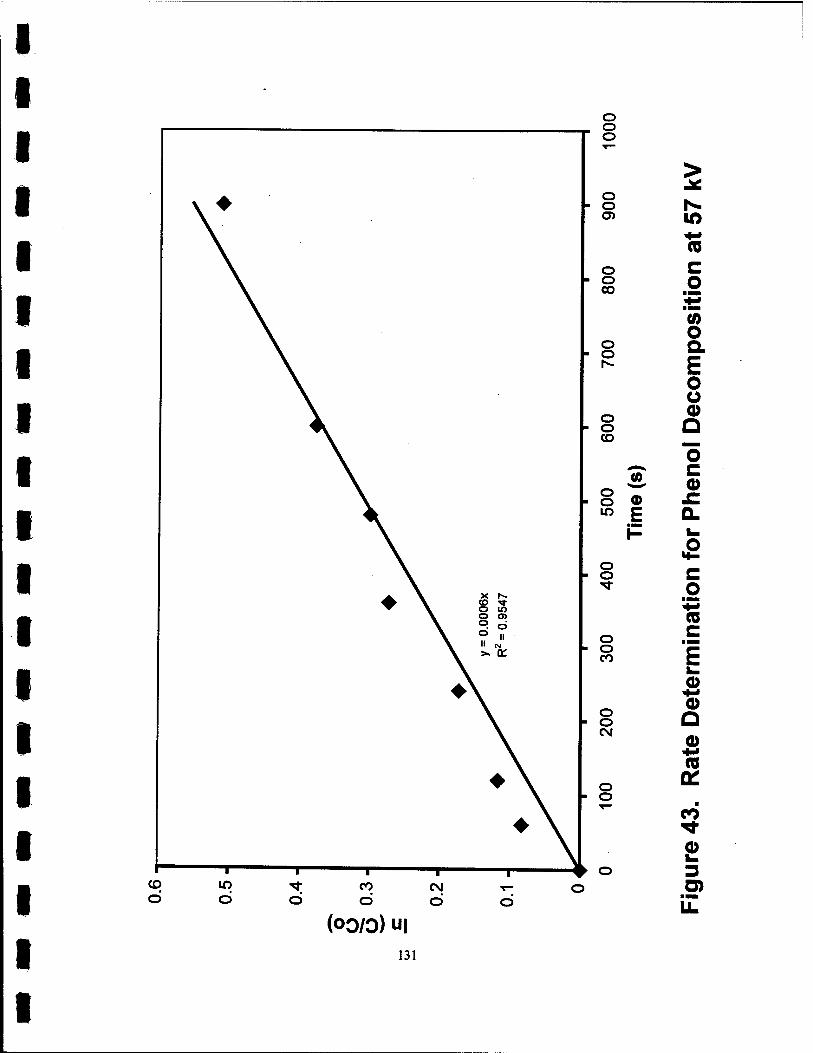
CD d
o o o
o o
o o 00
1^ w IS c o
o o (oo/o) U|
r ö
(0 o
o o a
E o o
o o Q CO
o '3T
c_> o fl) JZ 10 E Q.
1- £ o o c M" o
o c o CO E
ft. o o o Q CM a>
o fc o
o
CO
£ 3 Ö) iZ
131

in
D . o
D
<*^ c <D
£> E o 0) <D Q.
-C X Y- LU
1 D
D
o E
m
(0 o ^ 0 L. o 0 £ K "Ö c (0
^M
CO *■* c 0 E
■ 1MB > l_ mm\ 0 Q. (O X ^t
HI (0 l$M
o (0 <^dl
c o c/>
3 (0 0
m.
(0 tt
Q. E o o 0
o CO
o in
o o CO
o T o
0 3 O iZ
(uidd) uo!jej;ueouoo
132
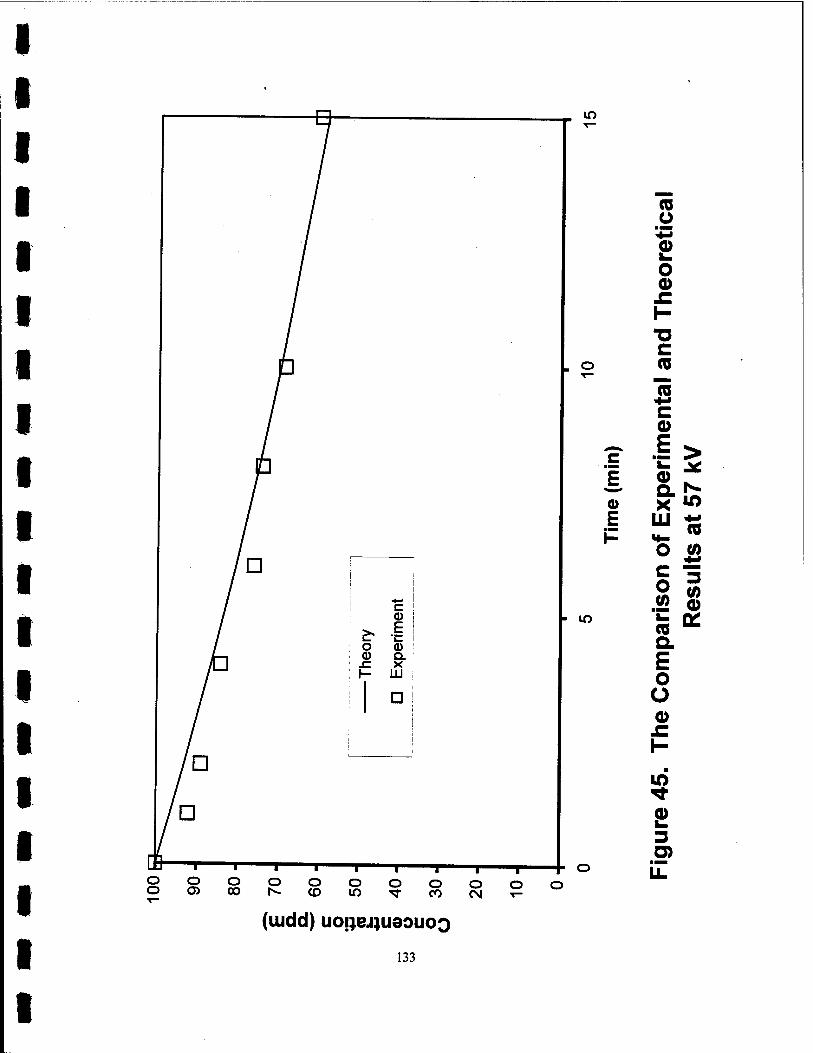
in
. o
0) E
i
*■*
c (1)
£> 1 o CD CO Q. .c X 1- UÜ i
m
o o
o o oo
o o CO
o io
o o CO
o CM
(Ü O
Q>
O CD
c (0
J5 c <D
!>
o tn
is* Q. E o o 0
0 w. 3 D)
(tudd) uojjejjueouoQ
133

4-> c <a ^
E o a> 0) Q. sz X \- 111
10
0)
. o
■ lO
o o o o o o o o o o o> 00 r^- CD IT) Tf CO (N
3 tf) 0 tt
75 o ^ C 0 O o 0 (0
Ü
73 C
73 0
4-« (0 (0
^_ > (0 ■ ■Hi
nin)
ent o
<
T E 73 o> .= 0
Tim
Exp
er
0) (0
I^I
o -1 ^i^
c CD o ^ (/>
73 (0 C Q. CO
E > o J£
o <o 0 ^t
\- (0
<d <* o 3 D)
o 0 0) m
ii Q.
(uidd) uoijejjUGouoQ
134

in
1 c <D
1
1 £* 1 o 0) <D Q. -C X 1- LU
| D
. o
o E
■ m
o o o o o o o o o o o o> 00 N- (O m ^r CO CM
CO
3 CO 0 tt _ (0 o © C
o o .Q 0 L.
H CO Ü
■o "O c 0 CO CO
■» > CO
c mmm
0 <
E "D ■1^ 0 0 £ Q. CO X iS
LU ä t^
o i ^^^
c D) o CO T™
■ ■M ■u CO c a CO E > o ^c o N. 0 lO
t^ +* 1- CO
■
<fr
0
3 Ö)
o 0 CO IO
II
UO!)ej)U93UOQ
135

APPENDIX
Nomenclature (from Model Formulation):
A total external area of all particles in suspension c particle phase concentration Cb bulk phase concentration Cbo initial bulk phase concentration < c> average particle concentration c particle phase spatial deviation variable < c > average of particle phase spatial deviation variable D effective particle diffusion constant f(s) f-field variable <f> average f-field g(s) g-field variable < g > average g-field kb bulk phase reaction rate constant kp effective particle phase reaction rate constant K adsorption constant Kmt mass transfer resistance coefficient r spatial variable, spherical coordinates s non-dimensional spatial variable t time V bulk phase volume x spatial variable, rectangular coordinates <(>b Thiele modulus, bulk phase <I>P Thiele modulus, particle phase t non-dimensional time variable
136

Table Al. Power Consumption for
1 g/L Unwashed Carbon in DI Water
Applied Voltage
(kV)
Power (nWs)
Power (HWS)
Power (fiWs)
Power (nWs)
Avg. Power (mJ/pulse)
95% Confidence
28 0 - ■ - - 2 .
31 1 - - - 5 - 33 1 1 - 2 12 6 36 2 2 2 3 21 6 38 3 7 9 4 57 26 41 - 20 30 - 250 98 44 30 32 34 30 313 17 46 41 44 47 46 444 24 49 59 60 52 61 579 39 51 74 76 83 74 768 41 54 90 93 - 93 921 17 57 - 116 - - 1160 -
137

Table Al. Power Consumption for
2 g/L Unwashed Carbon in DI Water
Applied Voltage (kV)
Power (jiWs)
Power (jiWs)
Power (liWs)
Avg. Power (mJ/pulse)
95% Confidence
31 - 1 2 14 3 33 - 2 2 23 3 36 - 11 9 102 17 38 24 22 22 220 14 41 36 38 33 355 25 44 48 52 48 498 28 46 61 69 63 661 47 49 80 86 81 836 37 51 94 99 96 973 25 54 111 118 111 1146 44 57 132 134 133 1333 13 59 148 150 148 1488 15 62 152 167 156 1616 91
Table A3. Power Consumption for
No Particles and 140 \\Slcm NaCl Solution
Applied Voltage (kV)
Power (HWS)
Power (fiWs)
Avg. Power (mJ/pulse)
95% Confidence
31 18 17 174 4 33 22 26 238 43 36 28 28 278 4 38 38 37 376 16 41 48 48 480 8 44 59 60 594 12 46 75 76 754 4 49 91 92 914 12 51 109 119 1142 98 54 138 141 1394 35 57 163 165 1642 20 59 188 185 1864 24 62 212 207 2094 43
138

Table A4. Power Consumption for
1 g/L Washed Carbon and 14 ^iS/cm NaCl Solution
Applied Voltage (kV)
Power (^iWs)
Power (nWs)
Avg. Power (mJ/pulse)
95% Confidence
31 12 12 124 _ 33 14 15 142 12 36 18 19 182 12 38 22 22 218 4 41 27 26 266 4 44 32 30 306 20 46 38 35 362 27 49 45 - 452 -
Table A5. Power Consumption for
2 g/L Washed Carbon and 14 ^S/cm NaCl Solution
Applied Voltage (kV)
Power (^Ws)
Power (nWs)
Avg. Power (mJ/pulse)
95% Confidence
31 13 13 128 4 33 15 15 148 4 36 18 19 184 8 38 22 23 224 12 41 27 28 276 12 44 32 33 324 4 46 38 38 380 -
139

Table A6. Power Consumption for
1 g/L Washed Carbon and 140 nS/cm NaCl Solution
Applied Voltage (kV)
Power (nWs)
Power (nWs)
Avg. Power (mJ/pulse)
95% Confidence
31 16 16 164 .
33 21 20 206 4 36 29 28 286 4 38 40 39 392 8 41 50 48 488 24 44 63 64 634 4 46 82 81 814 4 49 103 100 1016 24 51 121 122 1214 12 54 143 144 1434 12 57 165 163 1640 16 59 185 182 1834 27 62 202 202 2022 4
Table A7. Power Consumption for
2 g/L Washed Carbon and 140 nS/cm NaCl Solution
Applied Voltage (kV)
Power (laWs)
Power (nWs)
Avg. Power (mJ/pulse)
95% Confidence
31 18 17 173 6 33 22 21 216 8 36 30 28 290 12 38 40 38 390 12 41 51 48 495 25 44 66 67 662 12 46 85 86 856 16 49 107 105 1062 20 51 126 123 1245 33 54 144 152 1480 78 57 168 171 1698 27 59 190 192 1908 24 62 209 215 2118 59
140

Table A8. Power Consumption for
1 g/L Washed Glass Spheres and 14 j^S/cm NaCl Solution
Applied Voltage (kV)
Power (nWs)
Power (nWs)
Avg. Power (mJ/pulse)
95% Confidence
31 15 15 150 4 33 17 17 172 - 36 21 22 214 4 38 26 26 258 4 41 30 31 308 8 44 35 35 348 _ 46 41 40 408 8 49 46 - 456 -
Table A9. Power Consumption for
1 g/L Washed Glass Spheres and 140 ^S/cm NaCl Solution
Applied Voltage (kV)
Power (nWs)
Power (nWs)
Avg. Power (mJ/pulse)
95% Confidence
31 19 18 185 6 33 23 22 223 10 36 31 30 302 12 38 42 41 412 8 41 54 53 535 10 44 68 67 676 16 46 87 85 857 22 49 110 111 1101 10 51 128 130 1287 22 54 145 147 1461 18 57 169 168 1684 8 59 184 182 1828 16 62 200 202 2012 16
141

Table AlO. Power Consumption for
No Particles and 140 ^iS/cm CaCl2 Solution
Applied Voltage (kV)
Power (nWs)
Power (HWS)
Avg. Power (mJ/pulse)
95% Confidence
31 11 12 115 10 33 25 24 247 6 36 43 41 421 18 38 54 56 550 20 41 65 66 657 14 44 81 80 807 6 46 97 94 957 25 49 105 110 1074 47 51 122 125 1236 31 54 147 146 1463 14 57 163 166 1645 29 59 189 190 1893 6 62 214 211 2126 27
Table All. Power Consumption for
1 g/L Washed Carbon and 14 |aS/cm CaCl2 Solution
Applied Voltage (KV)
Power (fiWs)
Power (nWs)
Avg. Power (mJ/pulse)
95% Confidence
31 8 9 84 8 33 12 13 126 12 36 16 18 172 24 38 24 25 244 8 41 34 33 336 8 44 41 41 409 2 46 50 48 492 16 49 59 58 587 6
142
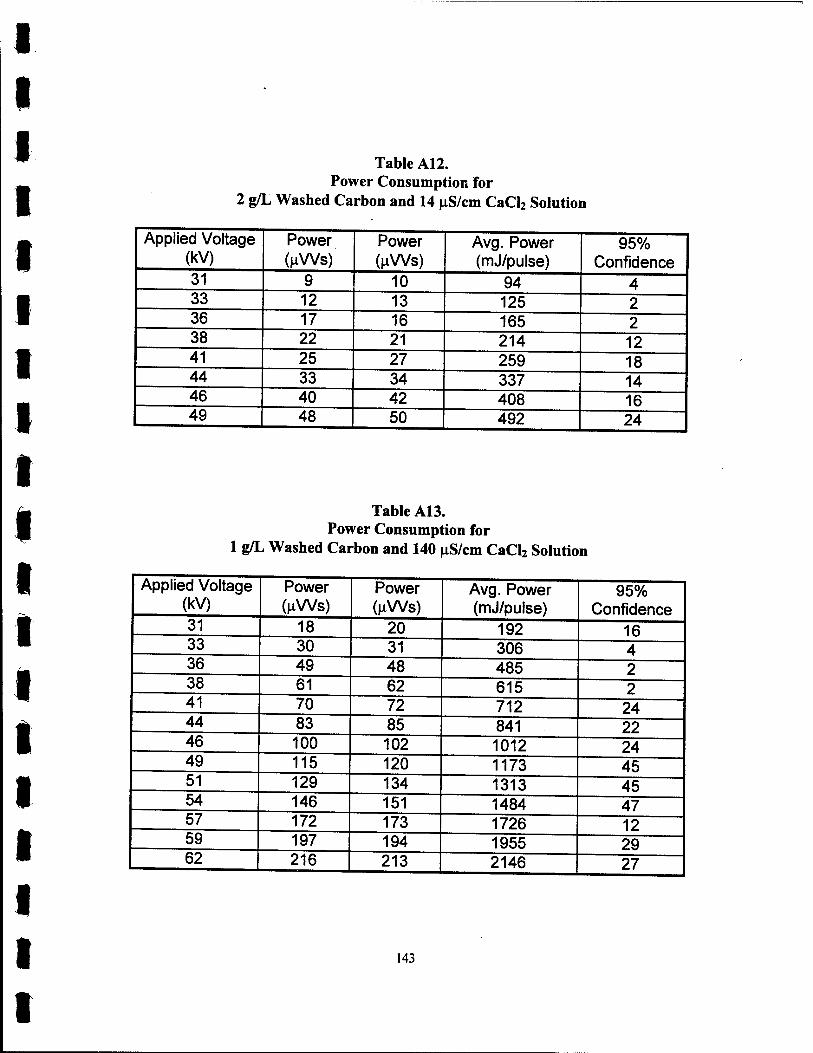
Table A12. Power Consumption for
2 g/L Washed Carbon and 14 |iS/cm CaCl2 Solution
Applied Voltage (kV)
Power (nWs)
Power (nWs)
Avg. Power (mJ/pulse)
95% Confidence
31 9 10 94 4 33 12 13 125 2 36 17 16 165 2 38 22 21 214 12 41 25 27 259 18 44 33 34 337 14 46 40 42 408 16 49 48 50 492 24
Table A13. Power Consumption for
1 g/L Washed Carbon and 140 \iS/cm CaCl2 Solution
Applied Voltage (kV)
Power (nWs)
Power (nWs)
Avg. Power (mJ/pulse)
95% Confidence
31 18 20 192 16 33 30 31 306 4 36 49 48 485 2 38 61 62 615 2 41 70 72 712 24 44 83 85 841 22 46 100 102 1012 24 49 115 120 1173 45 51 129 134 1313 45 54 146 151 1484 47 57 172 173 1726 12 59 197 194 1955 29 62 216 213 2146 27
143

Table Al4. Power Consumption for
2 g/L Washed Carbon and 140 nS/cm CaCl2 Solution
Applied Voltage (kV)
Power (nWs)
Power (nWs)
Avg. Power (mJ/power)
95% Confidence
33 4 - 40 _ 36 17 13 148 39 38 29 25 270 43 41 40 42 414 20 44 52 57 542 51 46 66 69 672 31 49 81 82 814 12 51 93 99 960 55 54 112 118 1148 63 57 130 132 1306 20 59 149 151 1498 20 62 168 170 1691 25
Table A15. Power Consumption for
1 g/L Washed Glass Spheres and 14 nS/cm CaCl2 Solution
Applied Voltage (kV)
Power (^iWs)
Power (nWs)
Avg. Power (mJ/pulse)
95% Confidence
31 11 7 90 43 33 15 12 132 31 36 20 17 185 25 38 26 24 248 24 41 34 32 326 20 44 42 41 412 8 46 50 50 500 8 49 60 62 612 24
144

Table A16. Power Consumption for
1 g/L Washed Glass Spheres and 140 nS/cm CaCl2 Solution
Applied Voltage (kV)
Power (nWs)
Power (^Ws)
Avg. Power (mJ/pulse)
95% Confidence
31 18 20 190 20 33 30 28 289 22 36 46 45 454 12 38 60 59 592 8 41 71 72 712 8 44 85 85 850 4 46 101 101 1010 4 49 116 117 1166 4 51 132 131 1316 8 54 151 152 1512 8 57 175 174 1746 12 59 196 195 1954 4 62 214 219 2164 47
Table Al 7. Power Consumption for
No Particles and 140 nS/cm KC1 Solution
Applied Voltage (kV)
Power (^iWs)
Power (liWs)
Avg. Power (mJ/pulse)
95% Confidence
31 4 6 48 24 33 11 11 112 36 29 24 263 53 38 45 38 415 65 41 58 54 558 35 44 73 69 710 35 46 91 88 896 24 49 106 109 1072 31 51 122 124 1232 16 54 141 145 1429 41 57 164 167 1656 31 59 186 187 1866 12 62 206 204 2050 20 I
145

Table A18. Power Consumption for
1 g/L Washed Carbon and 14 nS/cm KC1 Solution
Applied Voltage (kV)
Power (nWs)
Power (fiWs)
Avg. Power (mJ/pulse)
95% Confidence
31 - 2 24 - 33 - 2 24 - 36 - 4 44 - 38 5 5 50 4 41 5 5 52 - 44 6 7 68 8 46 8 10 94 20 49 13 14 132 8
Table A19. Power Consumption for
2 g/L Washed Carbon and 14 \iS/cm KC1 Solution
Applied Voltage (kV)
Power (nWs)
Power (nWs)
Avg. Power (mJ/pulse)
95% Confidence
31 6 6 62 4 33 7 7 70 4 36 9 8 87 10 38 11 11 110 4 41 12 12 122 4 44 14 14 142 4 46 18 18 176 - 49 22 22 220 -
146

Table A20. Power Consumption for
1 g/L Washed Carbon and 140 ^S/cm KC1 Solution
Applied Voltage (kV)
Power (fiWs)
Power (fiWs)
Avg. Power (mJ/pulse)
95% Confidence
31 2 4 28 24 33 5 7 60 24 36 10 14 124 39 38 18 22 200 31 41 25 27 260 24 44 30 32 308 24 46 36 41 384 47 49 43 47 452 39 51 52 55 536 31 54 62 63 628 8 57 71 72 716 8 59 83 82 824 16 62 93 91 920 16
Table A21. Power Consumption for
2 g/L Washed Carbon and 140 nS/cm KC1 Solution
Applied Voltage (kV)
Power (nWs)
Power (nWs)
Avg. Power (mJ/pulse)
95% Confidence
31 11 10 105 2 33 13 12 123 6 36 16 17 165 2 38 21 22 215 2 41 29 28 283 6 44 35 34 343 6 46 46 44 450 20 49 53 52 523 14 51 59 58 587 6 54 66 66 662 4 57 76 79 773 25 59 85 87 861 22 62 93 96 947 33
147

Table A22. Power Consumption for
1 g/L Washed Glass Spheres and 14 |aS/cm KC1 Solution
Applied Voltage (kV)
Power (nWs)
Power (|iWs)
Avg. Power (mJ/pulse)
95% Confidence
33 9 9 90 - 36 17 18 173 6 38 20 21 206 12 41 26 27 264 8 44 32 32 318 4 46 39 38 385 10
Table A23. Power Consumption for
1 g/L Washed Glass Spheres and 140 nS/cm KC1 Solution
Applied Voltage (kV)
Power (nWs)
Power (nWs)
Avg. Power (mJ/pulse)
95% Confidence
31 17 18 173 6 33 20 22 208 16 36 29 30 297 14 38 42 43 424 8 41 54 55 544 8 44 66 67 664 8 46 83 83 829 2 49 107 106 1064 12 51 122 120 1210 20 54 143 140 1415 29 57 168 165 1666 27 59 190 188 1890 20 62 204 203 2033 14
148
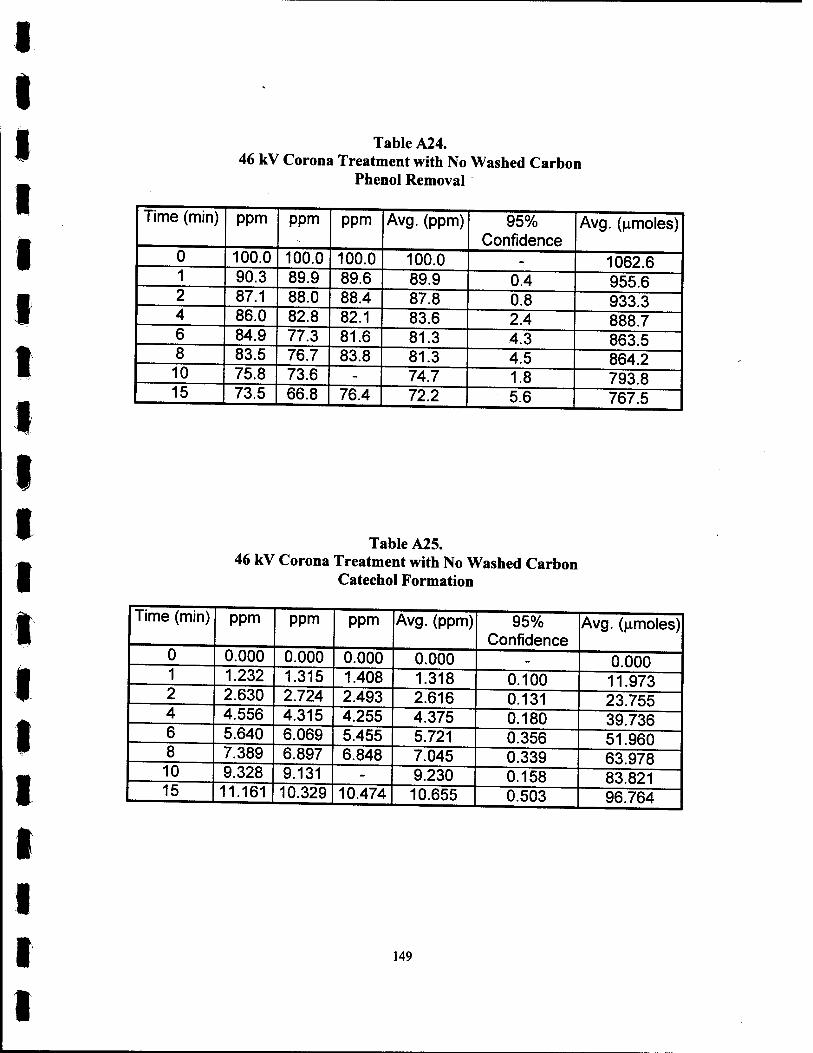
Table A24. 46 kV Corona Treatment with No Washed Carbon
Phenol Removal
Time (min) ppm ppm ppm Avg. (ppm) 95% Confidence
Avg. (nmoles)
0 100.0 100.0 100.0 100.0 - 1062.6 1 90.3 89.9 89.6 89.9 0.4 955.6 2 87.1 88.0 88.4 87.8 0.8 933.3 4 86.0 82.8 82.1 83.6 2.4 888.7 6 84.9 77.3 81.6 81.3 4.3 863.5 8 83.5 76.7 83.8 81.3 4.5 864.2 10 75.8 73.6 - 74.7 1.8 793.8 15 73.5 66.8 76.4 72.2 5.6 767.5
Table A25. 46 kV Corona Treatment with No Washed Carbon
Catechol Formation
Time (min) ppm ppm ppm Avg. (ppm) 95% Confidence
Avg. (nmoles)
0 0.000 0.000 0.000 0.000 - 0.000 1 1.232 1.315 1.408 1.318 0.100 11.973 2 2.630 2.724 2.493 2.616 0.131 23.755 4 4.556 4.315 4.255 4.375 0.180 39.736 6 5.640 6.069 5.455 5.721 0.356 51.960 8 7.389 6.897 6.848 7.045 0.339 63.978 10 9.328 9.131 - 9.230 0.158 83.821 15 11.161 10.329 10.474 10.655 0.503 96.764
I I
149

Table A26. 46 kV Corona Treatment with No Washed Carbon
Hydroquinone Formation
Time (min) ppm ppm ppm Avg. (ppm) 95% Confidence
Avg. (nmoles)
0 0.000 0.000 0.000 0.000 - 0.000 1 0.064 0.075 0.061 0.067 0.008 0.605 2 0.004 0.003 0.002 0.003 0.001 0.027 4 0.006 0.009 0.005 0.007 0.002 0.061 6 0.052 0.065 0.068 0.062 0.010 0.560 8 0.093 0.117 0.099 0.103 0.014 0.935 10 0.379 0.453 - 0.416 0.059 3.778 15 0.991 1.246 1.000 1.079 0.164 9.799
Table A27. 46 kV Corona Treatment with No Washed Carbon
Resorcinol Formation
Time (min) ppm ppm ppm Avg. (ppm) 95% Confidence
Avg. (^moles)
0 0.000 0.000 0.000 0.000 - 0.000 1 0.318 0.319 0.348 0.328 0.019 2.982 2 0.587 0.590 0.614 0.597 0.017 5.422 4 1.038 1.123 0.955 1.039 0.095 9.433 6 1.305 1.392 1.239 1.312 0.087 11.915 8 1.671 1.624 1.433 1.576 0.143 14.313 10 1.843 2.001 - 1.922 0.126 17.455 15 2.131 2.124 1.924 2.060 0.133 18.706
150

Table A28. 57 kV Corona Treatment with No Washed Carbon
Phenol Removal
Time (min) ppm ppm ppm Avg. (ppm) 95% Confidence Avg. (nmoles) 0 100 100 100 100.0 - 1062.6 1 90.7 91.2 94.3 92.1 2.2 978.3 2 86.2 84.8 96 89.0 6.9 945.7 4 82.3 82.7 87.6 84.2 3.3 894.7 6 75.8 74.9 77.8 76.2 1.7 809.3 8 71.2 74.5 76.7 74.1 3.1 787.7 10 68.2 69.2 68.5 68.6 0.6 729.3 15 61.5 60.4 58 60.0 2.0 637.2
Table A29. 57 kV Corona Treatment with No Washed Carbon
Catechol Formation
Time (min) ppm ppm ppm Avg. (ppm) 95% Confidence
Avg. (nmoles)
0 0 0 0 0.000 - 0.000 1 2.185 2.156 1.728 2.023 0.290 18.373 2 3.899 3.83 4.23 3.986 0.242 36.203 4 6.651 6.69 6.416 6.586 0.168 59.810 6 8.834 8.545 8.634 8.671 0.167 78.749 8 10.995 11.239 11.89 11.375 0.524 103.303 10 12.969 12.74 13.065 12.925 0.189 117.380 15 17.119 15.53 15.767 16.139 0.970 146.569
151
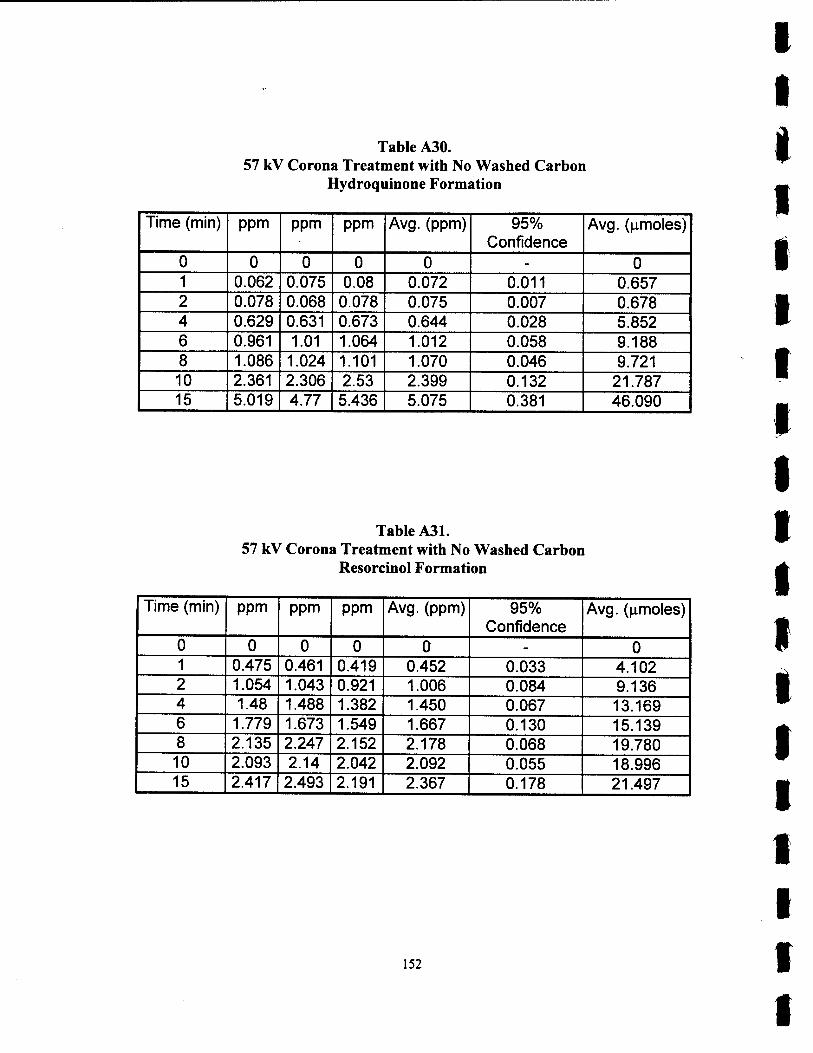
Table A30. 57 kV Corona Treatment with No Washed Carbon
Hydroquinone Formation
Time (min) ppm ppm ppm Avg. (ppm) 95% Confidence
Avg. (nmoles)
0 0 0 0 0 - 0 1 0.062 0.075 0.08 0.072 0.011 0.657 2 0.078 0.068 0.078 0.075 0.007 0.678 4 0.629 0.631 0.673 0.644 0.028 5.852 6 0.961 1.01 1.064 1.012 0.058 9.188 8 1.086 1.024 1.101 1.070 0.046 9.721 10 2.361 2.306 2.53 2.399 0.132 21.787 15 5.019 4.77 5.436 5.075 0.381 46.090
Table A31. 57 kV Corona Treatment with No Washed Carbon
Resorcinol Formation
Time (min) ppm ppm ppm Avg. (ppm) 95% Confidence
Avg. (nmoles)
0 0 0 0 0 - 0 1 0.475 0.461 0.419 0.452 0.033 4.102 2 1.054 1.043 0.921 1.006 0.084 9.136 4 1.48 1.488 1.382 1.450 0.067 13.169 6 1.779 1.673 1.549 1.667 0.130 15.139 8 2.135 2.247 2.152 2.178 0.068 19.780 10 2.093 2.14 2.042 2.092 0.055 18.996 15 2.417 2.493 2.191 2.367 0.178 21.497
152
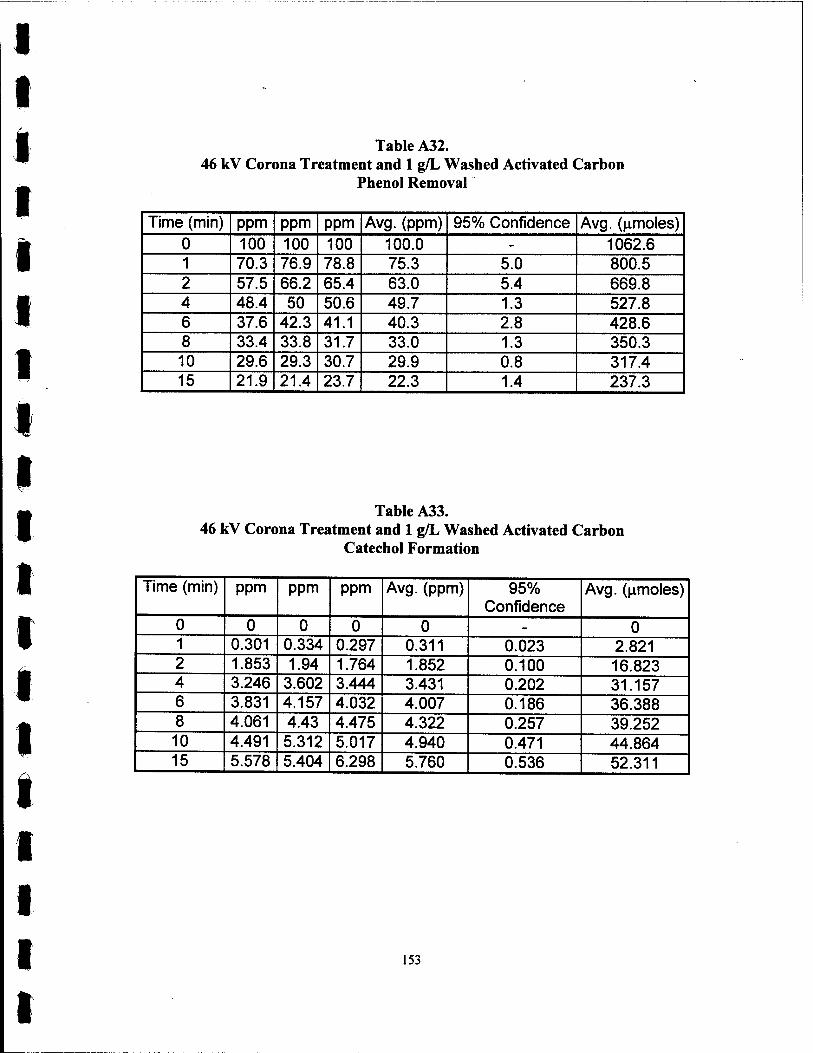
Table A32. 46 kV Corona Treatment and 1 g/L Washed Activated Carbon
Phenol Removal
Time (min) ppm ppm ppm Avg. (ppm) 95% Confidence Avg. (fimoles) 0 100 100 100 100.0 - 1062.6 1 70.3 76.9 78.8 75.3 5.0 800.5 2 57.5 66.2 65.4 63.0 5.4 669.8 4 48.4 50 50.6 49.7 1.3 527.8 6 37.6 42.3 41.1 40.3 2.8 428.6 8 33.4 33.8 31.7 33.0 1.3 350.3 10 29.6 29.3 30.7 29.9 0.8 317.4 15 21.9 21.4 23.7 22.3 1.4 237.3
Table A33. 46 kV Corona Treatment and 1 g/L Washed Activated Carbon
Catechol Formation
Time (min) ppm ppm ppm Avg. (ppm) 95% Confidence
Avg. (i^moles)
0 0 0 0 0 - 0 1 0.301 0.334 0.297 0.311 0.023 2.821 2 1.853 1.94 1.764 1.852 0.100 16.823 4 3.246 3.602 3.444 3.431 0.202 31.157 6 3.831 4.157 4.032 4.007 0.186 36.388 8 4.061 4.43 4.475 4.322 0.257 39.252 10 4.491 5.312 5.017 4.940 0.471 44.864 15 5.578 5.404 6.298 5.760 0.536 52.311
153
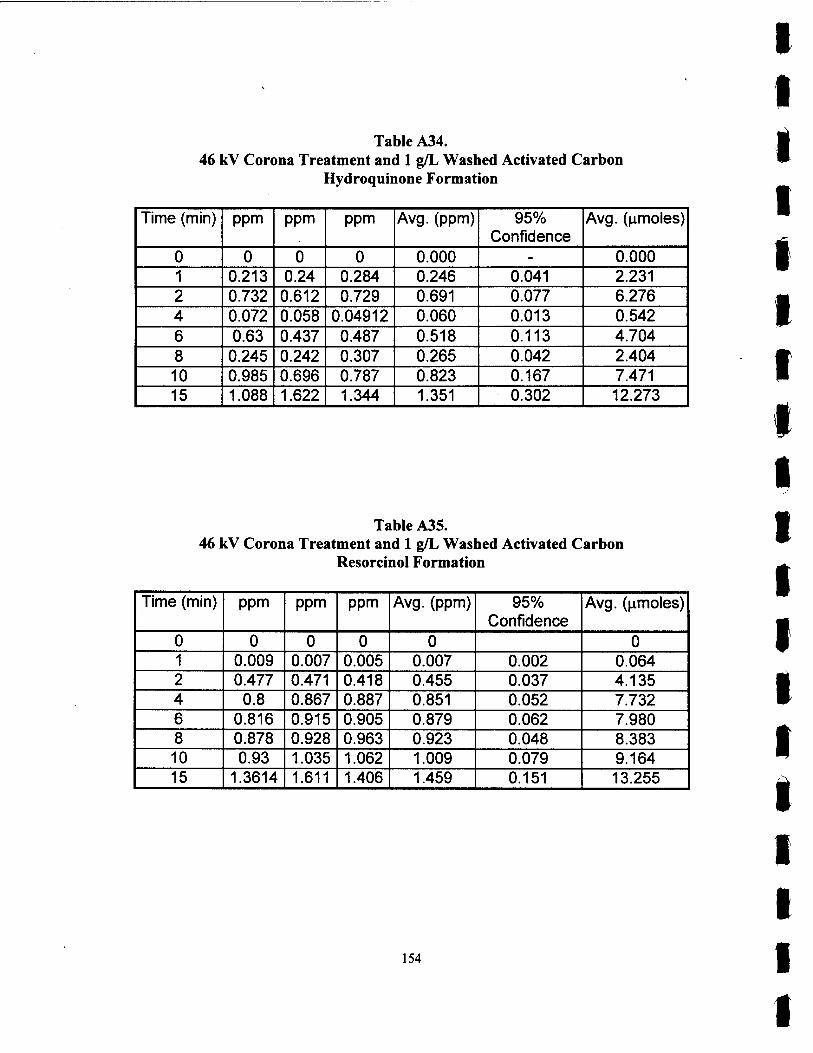
Table A34. 46 kV Corona Treatment and 1 g/L Washed Activated Carbon
Hydroquinone Formation
Time (min) ppm ppm ppm Avg. (ppm) 95% Confidence
Avg. (nmoles)
0 0 0 0 0.000 - 0.000 1 0.213 0.24 0.284 0.246 0.041 2.231 2 0.732 0.612 0.729 0.691 0.077 6.276 4 0.072 0.058 0.04912 0.060 0.013 0.542 6 0.63 0.437 0.487 0.518 0.113 4.704 8 0.245 0.242 0.307 0.265 0.042 2.404 10 0.985 0.696 0.787 0.823 0.167 7.471 15 1.088 1.622 1.344 1.351 0.302 12.273
Table A35. 46 kV Corona Treatment and 1 g/L Washed Activated Carbon
Resorcinol Formation
Time (min) ppm ppm ppm Avg. (ppm) 95% Confidence
Avg. ((xmoles)
0 0 0 0 0 0 1 0.009 0.007 0.005 0.007 0.002 0.064 2 0.477 0.471 0.418 0.455 0.037 4.135 4 0.8 0.867 0.887 0.851 0.052 7.732 6 0.816 0.915 0.905 0.879 0.062 7.980 8 0.878 0.928 0.963 0.923 0.048 8.383 10 0.93 1.035 1.062 1.009 0.079 9.164 15 1.3614 1.611 1.406 1.459 0.151 13.255
154

Table A36. 57 kV Corona Treatment and 1 g/L Washed Activated Carbon
Phenol Removal
Time (min) ppm ppm Avg. (ppm) 95% Confidence Avg. (nmoles) 0 100.0 100.0 100.0 - 1062.6 1 74.4 78.8 76.6 4.3 813.9 2 58.0 61.3 59.7 3.2 633.8 4 39.0 41.3 40.2 2.3 426.6 6 32.7 33.1 32.9 0.4 349.6 8 25.7 27.0 26.4 1.3 280.0 10 19.9 20.9 20.4 1.0 216.8 15 10.6 11.1 10.9 0.5 115.3
Table A37. 57 kV Corona Treatment and 1 g/L Washed Activated Carbon
Catechol Formation
Time (min) ppm ppm Avg. (ppm) 95% Confidence Avg. (nmoles) 0 0 0 0 - 0 1 0.607 0.641 0.624 0.033 5.667 2 2.627 2.783 2.705 0.153 24.566 4 4.297 4.587 4.442 0.284 40.341 6 5.733 6.004 5.869 0.266 53.297 8 6.617 7.019 6.818 0.394 61.920 10 6.444 7.253 6.849 0.793 62.197 15 5.639 5.848 5.744 0.205 52.161
155

Table A38. 57 kV Corona Treatment and 1 g/L Washed Activated Carbon
Hydroquinone Formation
Time (min) ppm ppm Avg. (ppm) 95% Confidence Avg. (lamoles) 0 0 0 0 - 0 1 0.675 0.632 0.654 0.042 5.935 2 0.447 0.402 0.425 0.044 3.855 4 0.493 0.531 0.512 0.037 4.650 6 1.242 1.092 1.167 0.147 10.598 8 1.121 0.989 1.055 0.129 9.581 10 2.062 1.897 1.980 0.162 17.977 15 2.115 1.941 2.028 0.171 18.418
Table A39. 57 kV Corona Treatment and 1 g/L Washed Activated Carbon
Resorcinol Formation
Time (min) ppm ppm Avg. (ppm) 95% Confidence Avg. (nmoles) 0 0 0 0 - 0 1 0.027 0.028 0.027 0.001 0.250 2 0.464 0.515 0.490 0.050 4.446 4 0.726 0.777 0.752 0.050 6.825 6 0.785 0.817 0.801 0.031 7.275 8 0.939 1.019 0.979 0.078 8.891 10 0.743 0.777 0.760 0.033 6.902 15 0.382 0.445 0.414 0.062 3.755
156

Calculations
For Power Consumption:
46 kV, No Carbon (800 mJ/pulse, 28 mg phenol removed in 15 minutes)
2.3- 8 kWhr
0.028g
800 mJ
pulse ^-I(l5min(60-^Y60^^1| WmJJK \ min A s ) lOOOmJ
XkWhr
3.6xl06J
For Error Analysis:
Standard Deviation = "£*'-£»' n(»-l)
Confidence = x ± a ( <r^
\yfnj
where n is the number of samples, x is one sample, 3c is the average of all the
samples, a is the factor related to the confidence interval of interest (1.96 for 95%
confidence interval) and a is the standard deviation.
For Power per Pulse:
(1 V/1000 V Voltage Probe, 1 V/10 A Current Probe)
io£^ = 10(1000^X10^)-^- = 100-^- pulse pulse pulse
157
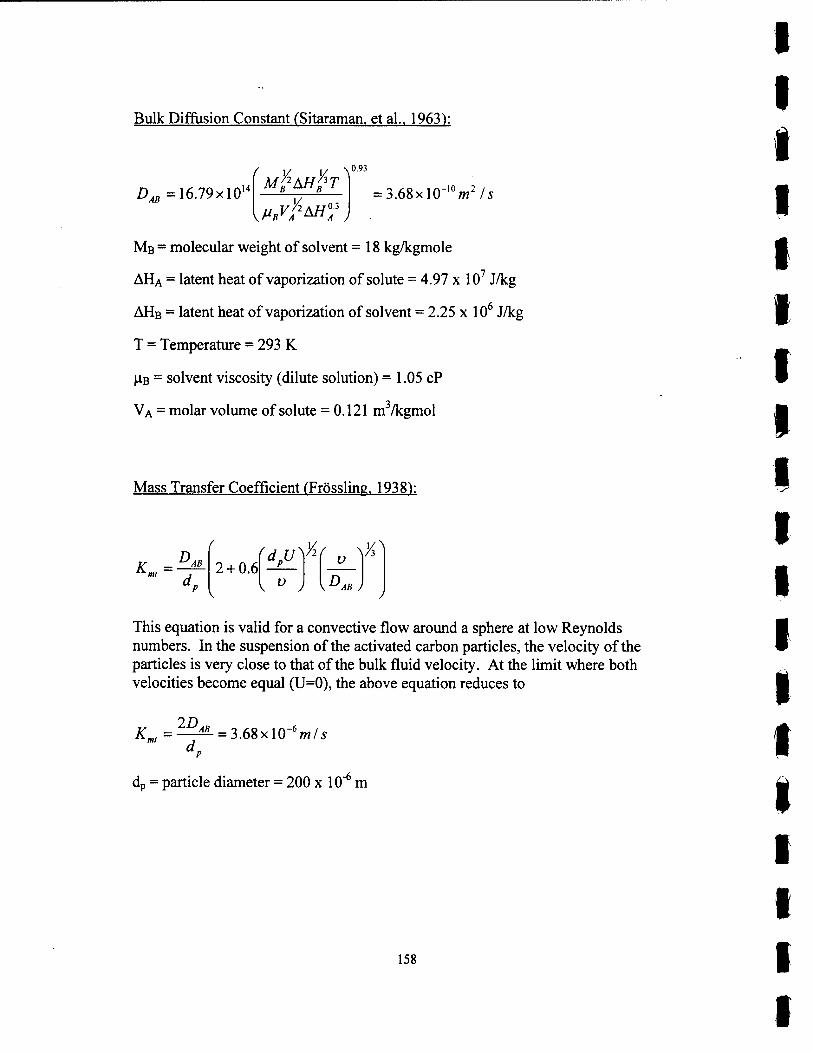
Bulk Diffusion Constant (Sitaraman, et al„ 1963):
DM =16.79x10 14 ( v v ^93
M{2AH?T
r0.3 = 3.6Sx\0-wm'/s
MB = molecular weight of solvent = 18 kg/kgmole
AHA = latent heat of vaporization of solute = 4.97 x 10⁷ J/kg
AHB = latent heat of vaporization of solvent = 2.25 x 10⁶ J/kg
T = Temperature = 293 K
UB = solvent viscosity (dilute solution) = 1.05 cP
VA = molar volume of solute = 0.121 m3/kgmol
Mass Transfer Coefficient (Frössling. 1938):
A „„ - —-— ( (.
2 + 0.6 ^uY2f v \A VA
\ v J \DAB j
This equation is valid for a convective flow around a sphere at low Reynolds numbers. In the suspension of the activated carbon particles, the velocity of the particles is very close to that of the bulk fluid velocity. At the limit where both velocities become equal (U=0), the above equation reduces to
ID Kml =—^- = 3.68xl0_6m/5
dp = particle diameter = 200 x 10"6 m
158

Effective Diffusion in Particle fSatterfield. 1970)
£„=194 £2 r T ^
tSpE KMAJ = 13x\Q-*m1 Is
s = particle porosity = 0.5
T = particle tortuosity = 2
S = particle surface area = 1100 x 103 m2/kg
PB = particle density = 1.2 x 10³ kg/m3
T = temperature = 293 K
MA = molecular weight of phenol = 94 g/mole
159

o CM
O O
o c
Ü 00
a OL a ^ £ c o c
o ■■■§ o CD p ^B»
k. (0 c CD 13 O ■^n
C CO o Ü
O o O
■
o < CM CD
3 O)
o o o o o o o o o o o o o o o o o o o o o o o o o o o o o o o o o o o o o o o o o o r- CD ID -*- CO CM r—
B9JV
160

X O) •^- ro u> O) o> o> 1^ o o CM ii II eg
>> cc
o CD
O 10
o O o o o o o O o o o o o o o o o o o o o o o o o o o o o o o o o o o o CM o 00 CO "5J- CN
o Ü ""5T ,_«, 0)
E a
CO a "■"" t, c o o
o mmtm c CO 2 o
<*•* ■ MB
c a> ü c
2 n
o mmm
o CN
Ü CO a o -i Q. X
o <
£ 3 D)
B9JV
161

X ID in ■fl- IX) o> co <T> r-~ CM O CM II II CM
>< en
o CO
in CM
o CM ^
E a a c o
in +3 - £ +■■ C <D U C o
_ Ü
in
0 C o c
■ ■■I
3
o Urn
c o +■» CO k. A
O Ü _i Q_ X
CO < o 3 D)
o O o o o o o O o o o o o o o o o o o o o o o o o o o o o o o o o o o o CD in ^ CO CM
eaiV
162
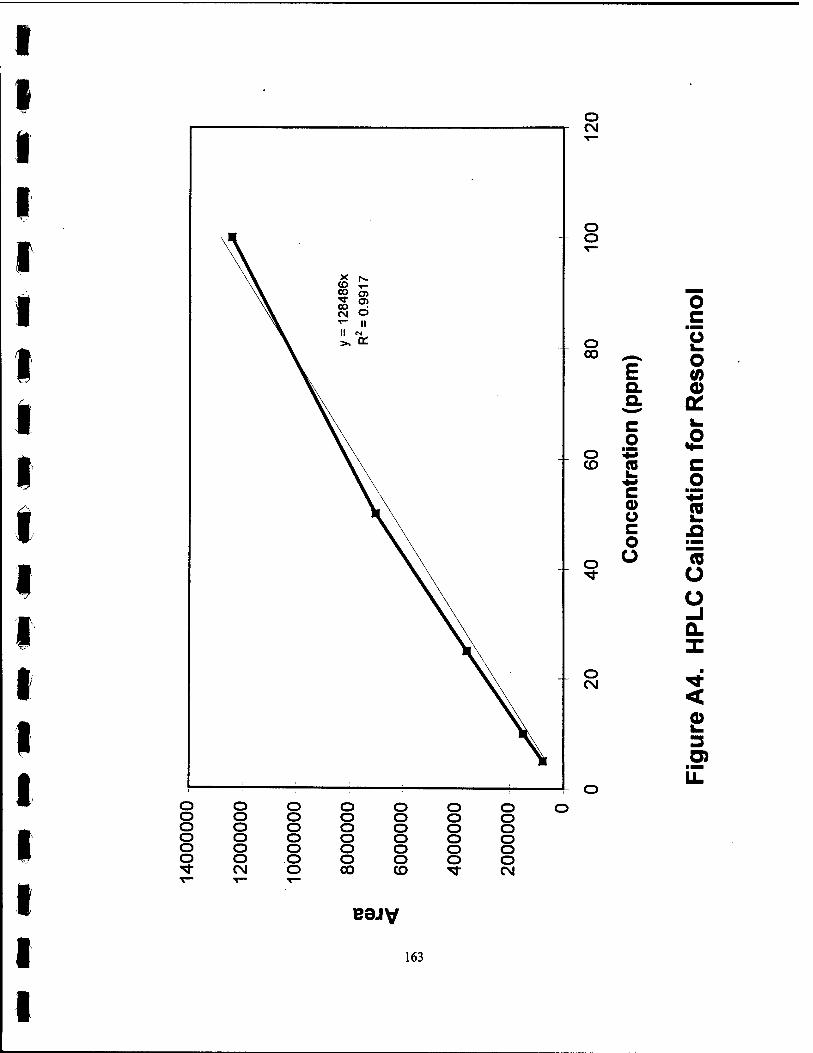
I I I I I 1 I I I I
I I I I I 1 I I
o CM
O O
o c o o 00 -—«» o £ (ft
Q. CD a tt
c o £
CJ +■» CO J° c k. o
c ^ a> (0 o c JD o •^■i
o Ü CO O Ü
Q. X
o CN
■
< g> 3 G)
LL
o o o o o o o o o o o o o o o o o o o o o o o o o o o o o o o o o o o o o o o o o o "fr CM o 00 CO -^ CM
eaiv
163

REFERENCES
Bansal, R.C., Donnet, J.B., and Stoeckli, F., 1988; Active Carbon, Marcel Dekker, Inc., New York.
Brandt, N.B., Chudinov, S.M., and Ponomarev, Y.G., 1988; Semimetals 1. Graphite and its Compounds, North-Holland, Amsterdam.
Chang, J.S., Lawless, P.A., and Yamamoto, J., 1991, Corona Discharge Processes, IEEE Trans. Plasma Sei., 19, p. 140.
Clements, J.S., Sato, M, and Davis, R.H., 1985: Preliminary Investigation of Prebreakdown Phenomena and Chemical Reactions Using a Pulsed High Voltage Discharge in Water. IEEE Trans. IndAppl. IA-23, p. 1372.
Clements, J.S., Mizuno, A., Finney, W. C, and Davis, R. H., 1989: Combined Removal pf SO2, NOx, and Fly Ash from Simulated Flue Gas Using Pulsed Streamer Corona, IEEE Trans. On Ind. Appl, 25 (1), p. 62.
Creyghton, Y.M.L., 1994: Pulsed Positive Corona Discharges, Fundaental Study and Applications to Flue Gas Treatment. CIP-DATA Kononkijke Biblitheck, Den Haag, The Netherlands.
Creyghton, Y.M.L., 1997a: Direct Plasma Treatment of Polluted Water, Abstracts from The Fourth International Conference on Advanced Oxidation Technologies for Water and Air Remediation, p. 58.
Creyghton, Y.M.L., 1997b: Personal Correspondence.
Devins, J.C., Rzad, S.J.,and Schwabe, R.J., 1981 breakdown and Prebreakdown Phenomena in Liquids, J. Appl. Phys., 52 (7), p.4531.
Eisenhauer, H.R., 1968: The Ozonation of Phenolic Wastes., Journal WPCF, 40(11), p.1887.
Fogler, H.S., 1992: Elements of Chemical Reaction Engineering. Pretince Hall, Englewood Cliffs, New Jersey.
164
1 I

Frössling, N., 1938, Beitr. Geophys., 52, p. 170.
Gohenn, S. C, Durham, D. E., McCulloch, M, and Heath, W. O., 1992: The Degradation of Organic Dyes by Corona Discharge, Proceedings of the Second International Symposium Chemical Oxidation: Technology for the Nineties, p. 356.
Gray, W.G., 1975: A Derivation of the Equations for Multicomponent Transport, Chem. Eng. Sei., 30, p. 229.
Hoeben, W.F.L.M., Van Veldhuizen, E.M., Claessens, H.A., Rutgers, W.R., 1997: The degradation pf Phenol and Atrazine in Water by Pulsed Corona Discharges, Proceedings of the 13th ISCP, Beijing, p. 1843.
Jankowska, H., Swiatkowski, A., Choma, J., 1991:Active Carbon. Ellis Horwood, New York, 1991.
Jones, H. M, and Kundhardt, E. E., 1995, Development of Pulsed Dielectric Breakdown in Liquids. Journal of Physics D: Applied Physics, 28 , p. 178- 188.
Jones, H.M., and Kunhardt, E.E., 1995: Pulsed Dielectric Breakdown of Pressurized Water and Salt Solutions, J. Appl. Phys., 77 (2), p.795.
Joshi, A.A., 1994: Formation of Hydroxyl Radicals, Hydrogen Peroxide, and Aqueous Electrons by Pulsed Streamer Corona Discharge in Aqueous Solutions, M.S. Thesis, Florida State University, Tallahassee, FL.
Joshi, A.A., Locke, B.R., Arce, P., and Finney, W.C., 1995: Formation of Hydroxyl Radicals, Hydrogen Peroxide and Aqueous Electron by Pulsed Streamer Corona Discharge in Aqueous Solution, J. Hazardous Materials, 41(1) 3 (1995).
Kalyana, S., 1996: The Removal of NOx Using a Pulsed Streamer Corona Discharge in the Presence of Ethylene. M.S. Thesis, Florida State University, Tallahassee, FL.
Kinoshita, K., 1988: Carbon. Electrical and Phvsicochemical Properties. John Wiley And Sons, United States.
Klimkin, V. F., and Ponomarenko, A. G., 1979: Interferometric Study of Pulsed Breakdown in a Liquid. Sov. Psys. Tech. Phys. 24(9), p. 1067.
165
Klimkin, V. F., 1990: Mechanisms of Electric Breakdown of Water from Pointed Anode in the Nanosecond Range. Sov. Psys. Tech. Phys. 16(2), 14 p.6.
Klimkin, V. F., 1991: A Multiframe Ultrafast Laser Schlieren System for the Observation of Pre-breakdown Phenomena in Liquids in the Nanosecond Range. Sov. Psys. Tech. Phys. 36(9), p.375.
Klimkin, V.F., 1992: A Multifram Ultrafast Laser Schlieren system for the Observation of Pre-breakdown Pheomena in Liquids in the Nanosecond Time Range, Sov. Phys. Tech. Phys. 36(9) p.975.
Kok, J.A., 1961, Electrical Breakdown of Insulating Liquids, Phillips Tech. Lib., Cleaver-Hum, London.
Krajnc, M., and Levee, J., 1996: On the Kinetics of Phenol Oxidation in Supercritical Water. AIChE Journal, 42(7), p. 1977.
Kuskova, N. I., 1983: Mechanism of Leader Propagation in Water. Sov. Psys. Tech. Phys. 28(5),p.591.
Logemann, F.P., and Annee, J.H.J., 1997: Water Treatment with a Fixed Bed Catalytic Ozonation Process, Wat. Sei. Tech., 35 (4), p.353.
Lubicki, P., Cross, J. D., Jayaram, S., Staron, J., and Mazurek, B., 1996: Effect of Water Conductivity on its Pulse Electric Strength, Conference Record of the 1996 IEEE International Symposium on Electrical Insulation, Montreal, Quebec.
Lubicki, P., Jayaram, S., Cross, J.D., and Al-Arainy, A.A., 1996: Pulsed Corona Discharge for Advanced Oxidation in Water Purification Technology. 1996 IEEE Annual Report - Conference on Electrical Insulation and Dielectric Phenomena, San Fransico, CA.
Mizuno, A., Inoue, T., Yamaguchi, S., Sakamoto, K., Saeki, T., Matsumoto, Y.,and Minamiyama, K., 1990: Inactivation of Viruses using Pulsed High Electric Field, Conference Record of IEEE/IAS Annual Meeting, pp 713-719.
Mikula, M., Panak, P., and Dvonka, V., 1997: The Destruction Effect of Pulse Discharge in Water Suspensions. Plasma Sources Science Technology, 6, p. 179.
Neigowski, S.J, 1953: Destruction of Phenols by Oxidation with Ozone. Industrial and Engineering Chemistry, 45(3), p.632.
166
1 1 I I I I I I I I I I 1 I 1 I 1 I I
Ochoa, J.A., Stroeve, P., and Whitaker, S., 1986: Diffusion and Reaction in Cellular Media. Chemical Engineering Science, 41(12), p. 2999.
Petrier, C, Lamy, M., Francony, A., Benahcene, A., David., B., Renaudin, V., and Gondrexon, N., 1994: Sonochemical Degradation of Phenol in Dilute Aqueous Solutions: Comparison of the Reaction Rates at 20 and 487 kHz. Journal of Physical Chemistry, 98, p. 10514.
Ryan, D., Carboneil, R.G., and Whitaker, S., 1981: A Theory of Diffusion and Reaction in Porous Media. AIChE Symposium Series, 77(202) p. 46.
Sato, M., Ohgiyama, T., and Clements, J.S., 1996: Formation of Chemical Species and their Effects on Microorganisms using a Pulsed High Voltage Discharge in Water. IEEE Transactions on Industry Applications, 32, p. 106.
Satterfield, C.N., 1970, Mass Transfer in Heterogeneous Catalysis. MIT Press, Cambridge, Mass.
Sharbaugh, A.H., Deinvs, J.C.,and Rzad, S.J., 1978: Progress in the Field of Electric Breakdown in Dielectric Liquids, IEEE Trans. Electr. Insul., EI-13(4) 249.
Sharma, A. K., 1993: High Voltage Pulsed Streamer Corona Discharges for the Removal of Organic Contaminants From Aqueous Solutions, M.S.. Thesis, Florida State University, Tallahassee, FL.
Sharma, A. K., Locke, B. R., Arce, P., Finney, W. C, 1993, A Preliminary Study of Pulsed Streamer Corona Discharge for the Degradation of Phenol in Aqueous Solutions. Hazardous Waste & Hazardous Materials, 10 (2), p. 209.
Sharma, A.K., Camaioni, D.M., Josephson, G.B., Goheen, S.C., and Mong, G.M., 1997: Formation and Measurement of Ozone and Nitric Acid in a High Voltage DC Negative Metallic Point-to-Aqueous-Plane Continuous Corona Reactor, J. Adv. Oxid. Technol., 2 (1), p. 239.
Sitaraman, R., Ibrahim, S.H., and Kuloor, N.R., 1963. J. Chem. Eng. Data, 8, p. 198.
Sun, Y., Pignatello, J.J., 1993: Photochemical Reactions Involved in the Total Mineralization of 2,4-D by Fe3+/H202/UV. Environmental Science and Technology, 27(2), p.304.
Thornton, T.D., and Savage, P.E., 1992: Kinetics of Phenol Oxidation in Supercritical Water. AIChE Journal, 38(3), p.321.
167

Thornton, T.D., LaDue, D.E., and Savage, P.E., 1991: Phenol Oxidation in Supercritical Water: Formation of Dibenzofuran, Dibenzo-p-dioxin, and Related Compounds. Environmental Science and Technology, 25, p. 1507.
Vidic, R. D., Suldan, M. T., and Brenner, R. T., 1993 : Oxidative Coupling of Phenols on Activated Carbon : Impact on Adsorption Equilibrium. Environ. Sei. Techno!. 27, p. 2085.
Whitaker, S., 1967:Diffusion and Dispersion in Porous Media. J. A.I.Ch.E., 13, p. 420.
Whitaker, S., 1987: Mass Transport and Reaction in Catalyst Pellets. Transport in Porous Media, 2, p.269.
Whitaker, S., 1991: The Method of Volume Averaging: An Application to Diffusion and Reaction in Porous Catalysts. Proceedings of the National Science Council, Part A: Physical Science and Engineering, Taipei, Taiwan.
Wong, P., and Forster, E. O., 1977: High-Speed scliieren studies of Electrical Breakdown in Liquid Hydrocarbons, Can. J. Chem., 55, p. 1890.
Zepp, R.G., Faust, B.C., Hoinge, J., 1992: Hydroxyl Radical Formation in Aqueous Reactions (pH 3-8) of Iron (II) with Hydrogen Peroxide: The Photo-Fenton Reaction. Environmental Science and Technology, 26(2), p.313.
Zhekul, V.G.,and Rakovskii, G.B., 1983: Theory of Electrical Discharge Formation in a Conducting Liquid, Sov. Phys. Tech. Phys., 28(1), p.4.
168
I 1 I I I
I I
f
I I 1 I I I I
BIOGRAPHICAL SKETCH
£ David Grymonpre was born in Denver, Colorado on May 29, 1972. He grew
up travelling around the United States and Canada. He graduated from Pike High
■ School in Indianapolis, Indiana during 1990. In the fall of 1990, he started a long,
productive career at Florida State University. He graduated in 1995 with a Bachelor
of Science degree in Chemical Engineering. While he was an undergraduate student,
he began working for Dr. Bruce Locke on pulsed corona treatment of airborne and
|| aqueous wastes. Also during his undergraduate years, David was involved in music,
playing the bassoon in several orchestras in Georgia and Florida, as well as
performing several solo and chamber recitals.
w Continuing on at Florida State University, he is currently finishing the degree
of Master of Science in Chemical Engineering. After finishing this degree, David
plans to pursue his doctorate in Chemical Engineering, again attending Florida State
University. His hobbies include fishing, golf, and beer brewing. He plans to attend
several more football seasons at Florida State University in hopes of one more
National Championship.
169