Embed Size (px)
Citation preview

Document of The World Bank
Report No: ICR0000573
IMPLEMENTATION COMPLETION AND RESULTS REPORT (IDA-37080)
ON A
CREDIT
IN THE AMOUNT OF SDR 3.8 MILLION (US$ 5 MILLION EQUIVALENT)
TO THE
REPUBLIC OF MONTENEGRO
FOR A
EMERGENCY STABILIZATION OF ELECTRICITY SUPPLY
IN THE REPUBLIC OF MONTENEGRO PROJECT
December 17, 2007
Sustainable Development Department Europe and Central Asia Region South Central Europe County Unit
Pub
lic D
iscl
osur
e A
utho
rized
Pub
lic D
iscl
osur
e A
utho
rized
Pub
lic D
iscl
osur
e A
utho
rized
Pub
lic D
iscl
osur
e A
utho
rized
Pub
lic D
iscl
osur
e A
utho
rized
Pub
lic D
iscl
osur
e A
utho
rized
Pub
lic D
iscl
osur
e A
utho
rized
Pub
lic D
iscl
osur
e A
utho
rized

CURRENCY EQUIVALENTS
(Exchange Rate Effective 10/12/2007)
Currency Unit = Euro 1.00 Euro = US$ 1.41 US$ 1.00 = 0.70 Euro
FISCAL YEAR
January 1-December 31
ABBREVIATIONS AND ACRONYMS
AMR Automated Meter Reading AMR&B Automated Meter Reading and Billing DSM Demand Side Management EPCG Electric Power Company of Montenegro ERP Enterprise Resource Planning System ERR Economic Rate of Return FMIS Financial Management Information System FRR Financial Rate of Return LIC Learning and Innovation Credit IRR Internal Rate of Return M&E Monitoring and Evaluation PAD Project Appraisal Document PMU Project Management Unit SAC Structural Adjustment Credit TSS Transitional Support Strategy TTL Task Team Leader
Vice President: Shigeo Katsu Country Director: Orsalia Kalantzopoulos Sector Manager: Charles Feinstein
Project Team Leader: Husam Beides ICR Team Leader: Husam Beides

REPUBLIC OF MONTENEGRO
EMERGENCY STABILIZATION OF ELECTRICITY SUPPLY PROJECT
CONTENTS
Data Sheet A. Basic Information B. Key Dates C. Ratings Summary D. Sector and Theme Codes E. Bank Staff F. Results Framework Analysis G. Ratings of Project Performance in ISRs H. Restructuring I. Disbursement Graph
1. Project Context, Development Objectives and Design............................................... 12. Key Factors Affecting Implementation and Outcomes .............................................. 43. Assessment of Outcomes ............................................................................................ 84. Assessment of Risk to Development Outcome......................................................... 145. Assessment of Bank and Borrower Performance ..................................................... 156. Lessons Learned ....................................................................................................... 167. Comments on Issues Raised by Borrower/Implementing Agencies/Partners .......... 17Annex 1. Project Costs and Financing.......................................................................... 18Annex 2. Outputs by Component ................................................................................. 19Annex 3. Economic and Financial Analysis................................................................. 23Annex 4. Bank Lending and Implementation Support/Supervision Processes ............ 24Annex 5. Beneficiary Survey Results ........................................................................... 25Annex 6. Stakeholder Workshop Report and Results................................................... 26Annex 7. Summary of Borrower's ICR and/or Comments on Draft ICR..................... 27Annex 8. Comments of Cofinanciers and Other Partners/Stakeholders....................... 28Annex 9. List of Supporting Documents ...................................................................... 29
MAP

i
A. Basic Information
Country: Montenegro Project Name:
Emergency Stabilization of Electricity Supply Project (Montenegro)
Project ID: P077473 L/C/TF Number(s): IDA-37080 ICR Date: 12/18/2007 ICR Type: Core ICR
Lending Instrument: LIL Borrower: FEDERAL REPUBLIC OF YUGOSLAVIA
Original Total Commitment:
XDR 3.8M Disbursed Amount: XDR 3.8M
Environmental Category: C Implementing Agencies: EPCG Cofinanciers and Other External Partners: B. Key Dates
Process Date Process Original Date Revised / Actual Date(s)
Concept Review: 03/15/2002 Effectiveness: 02/25/2003 02/25/2003 Appraisal: 06/18/2002 Restructuring(s): Approval: 08/15/2002 Mid-term Review: 12/31/2003 Closing: 08/31/2005 06/30/2007 C. Ratings Summary C.1 Performance Rating by ICR Outcomes: Satisfactory Risk to Development Outcome: Low or Negligible Bank Performance: Satisfactory Borrower Performance: Satisfactory
C.2 Detailed Ratings of Bank and Borrower Performance (by ICR) Bank Ratings Borrower Ratings
Quality at Entry: Satisfactory Government: Satisfactory
Quality of Supervision: Satisfactory Implementing Agency/Agencies: Satisfactory
Overall Bank Performance: Satisfactory Overall Borrower
Performance: Satisfactory

ii
C.3 Quality at Entry and Implementation Performance Indicators Implementation
Performance Indicators QAG Assessments (if any) Rating
Potential Problem Project at any time (Yes/No):
No Quality at Entry (QEA):
None
Problem Project at any time (Yes/No):
Yes Quality of Supervision (QSA):
None
DO rating before Closing/Inactive status:
Satisfactory
D. Sector and Theme Codes
Original Actual Sector Code (as % of total Bank financing) Power 100 100
Theme Code (Primary/Secondary) Access to urban services and housing Primary Primary Infrastructure services for private sector development Primary Primary E. Bank Staff
Positions At ICR At Approval Vice President: Shigeo Katsu Johannes F. Linn Country Director: Orsalia Kalantzopoulos Christiaan J. Poortman Sector Manager: Charles M. Feinstein Hinderikus Busz Project Team Leader: Husam Mohamed Beides Dejan R. Ostojic ICR Team Leader: Husam Mohamed Beides ICR Primary Author: James Sayle Moose F. Results Framework Analysis Project Development Objectives (from Project Appraisal Document) (From Development Credit Agreement) The objectives of the Project are: (a) to test whether and to what degree electric power distribution consumers will improve payment discipline and participate in a loss reduction program, in response to an introduction of remote metering, automated billing and demand side management in pilot areas served by EPCG; and (b) to strengthen the financial management capacity of EPCG. Revised Project Development Objectives (as approved by original approving authority) No revisions.

iii
(a) PDO Indicator(s)
Indicator Baseline Value
Original Target Values (from
approval documents)
Formally Revised Target Values
Actual Value Achieved at
Completion or Target Years
Indicator 1 : Technical losses no higher than 6% in pilot areas. Non technical losses no higher than 2% in pilot areas. Collections 100% in pilot areas.
Value quantitative or Qualitative)
(i) Losses 15%-49% (ii) Collections 50%-92%
None
(i) 3%-10% (please see table 4 in the ICR). (ii) 68%-715% (please see table 5 in the ICR)
Date achieved 06/30/2003 12/31/2003 10/31/2007 Comments (incl. % achievement)
No specific targets were set in the Project Appraisal Document. The objective of te Project was to test the degree to which losses will be reduced in pilot areas and collections improved.
(b) Intermediate Outcome Indicator(s)
Indicator Baseline Value
Original Target Values (from
approval documents)
Formally Revised
Target Values
Actual Value Achieved at
Completion or Target Years
Indicator 1 : Adoption of M&E plan Value (quantitative or Qualitative)
M&E Plan No Plan No Revisions Adopted Plan
Date achieved 08/15/2002 09/30/2002 09/30/2002 04/30/2004 Comments (incl. % achievement)
Plan was far more elaborate than originally planned and done by outside consultants which took additional time.
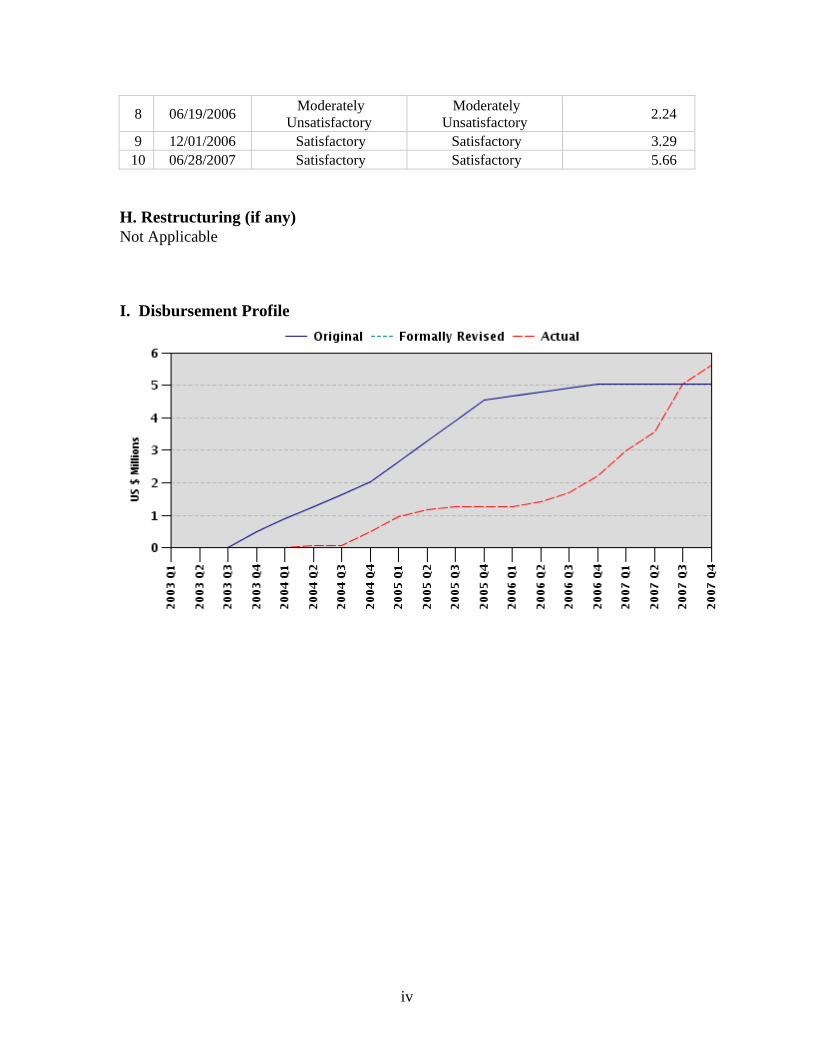
G. Ratings of Project Performance in ISRs
No. Date ISR Archived DO IP
Actual Disbursements (USD millions)
1 12/18/2002 Satisfactory Satisfactory 0.00 2 06/23/2003 Satisfactory Satisfactory 0.00 3 12/29/2003 Satisfactory Satisfactory 0.00 4 06/24/2004 Satisfactory Satisfactory 0.48 5 12/22/2004 Satisfactory Satisfactory 1.19 6 05/25/2005 Satisfactory Satisfactory 1.28 7 06/30/2005 Satisfactory Satisfactory 1.28
iv
8 06/19/2006 Moderately Unsatisfactory
Moderately Unsatisfactory 2.24
9 12/01/2006 Satisfactory Satisfactory 3.29 10 06/28/2007 Satisfactory Satisfactory 5.66
H. Restructuring (if any) Not Applicable
I. Disbursement Profile

1
1. Project Context, Development Objectives and Design
1.1 Context at Appraisal Country Background Following the difficult economic and social conditions of the early and mid 1990s, Montenegro (then a part of the Federal Republic of Yugoslavia and since 2006 an independent country) launched an ambitious reform program. The reform, launched in the late 1990s, aimed at macroeconomic stabilization, rapid normalization to a market economy, normalization of relations with foreign creditors and integration with regional, EU and world markets. Fiscal retrenchment was supported by an IMF program that helped reduce the fiscal deficit from 8 percent of GDP in 2000 to about 5 percent in 2003. Inflation fell to single digits by 2002 and further thereafter. While progress had clearly been made by the time of this project in 2002, nonetheless, the remaining reform agenda was then substantial including reforming the public sector and strengthening the country’s infrastructure sector. Of major concern was the performance of the energy sector which had been a constraint to growth and macroeconomic stability. Sector Background The energy infrastructure was characterized by considerable decapitalization due to lack of investment and deferred maintenance which were in turn due to the poor operational and financial performance of the Electric Power Company of Montenegro (EPCG) and the chronic setting of low electricity prices by the state. The energy sector was a drain on fiscal resources and would continue to be so without major reform of tariffs. In addition, declining production, poor collection and high losses in the distribution network were major factors contributing to EPCG’s poor cash flow as it struggled to pay for electricity imports and meet the growing demand. While EPCG was able to improve its collection rate from 80% in 1997 to about 88% in 2003, such a level of collection was still much below standard utility practices. Furthermore, during the last ten years the condition of the distribution network deteriorated because of the lack of maintenance and investments and the loading of the network components practically doubled. While these factors contributed to a significant increase in technical losses, the overall increase in distribution losses from 13 percent in the early 1980s to almost 25 percent in 2000 was primarily driven by increasing commercial losses including illegal consumption of electricity. In response to a major shortage of electricity, which caused rolling blackouts in the winter of 2001-2002, the Government of Montenegro (GoM) and EPCG adopted a “Program for Stabilization of EPCG” placing an emphasis on the financial recovery of EPCG and demand side management (DSM). The Program combined the introduction of a new tariff system, loss reduction programs to reduce losses in EPCG networks, modernization of the financial management system of EPCG, and subsequent restructuring and commercialization of this vertically integrated electricity company.

2
Rationale for Bank Involvement The Bank’s program in Montenegro was guided by the framework of the Transitional Support Strategy Update (TSS) prepared in 2001 and updated in August 2002 and by a Structural Adjustment Credit (SAC1). The objectives of the TSS were restoring macroeconomic stability and balance, stimulating near term growth, creating a basis for a sustainable supply response, improving governance and building effective institutions. In addition, SAC1 focused on reforms to enhance fiscal sustainability, including reforms of public expenditure management, pensions, the energy sector, labor markets and business development. Due to the poor financial situation of the energy sector, improvement of the performance of the energy sector was and is crucial to sustain economic development in Montenegro. Excessive technical and commercial network losses were (and are still) one of the major contributing factors to the poor financial health of EPCG and therefore needed to be addressed as a top priority of the “Program for Stabilization of EPCG”. This Emergency Stabilization of Electricity Supply Project was designed to support the new Program and to complement the policy reforms supported by structural assistance. The Project was planned to provide financing to pilot mechanisms that have proven effective in other transitional economies in: 1) improving the sustainability of power utilities through reducing losses in the utility networks; 2) increasing their collections and 3) improving the company’s financial and accounting processes and practices. The new technologies to improve the operation of EPCG included: 1) installing state-of-the-art consumer meters with automatic meter reading (AMR) capacity to eliminate electricity losses and theft; and 2) installing a modern Financial Management Information System (FMIS) to improve the accounting and financial processing at EPCG and to facilitate its future unbundling and restructuring.
1.2 Original Project Development Objectives (PDO) and Key Indicators The Project Development Objectives were to: 1) test whether distribution consumers will reduce illegal use of electricity and increase payment rates in response to the introduction of remote metering, automated billing and demand side management in pilot areas and 2) strengthen the financial management capacity of EPCG. Key performance indicators included; (i) reduction of distribution losses and (ii) improved collection ratios.
1.3 Revised PDO (as approved by original approving authority) and Key Indicators, and reasons/justification The Project Development Objectives were not revised.
1.4 Main Beneficiaries The Government of Montenegro was the borrower of the Credit which was on lent to EPCG, therefore making EPCG the direct beneficiary of the Credit. It was expected that the implementation of the Project’s two components in conjunction with improvements in procurement methods through the adoption of the Bank’s competitive bidding procedures,

3
would provide experience with modern equipment, systems and procedures to EPCG’s staff and management. This was (and still is) essential for future restructuring of EPCG and the development of loss reduction programs to improve the company’s financial situation. An improved financial situation for EPCG would facilitate its commercialization and will enable the company to provide the reliable electricity supply to the public necessary for sustained economic development.
1.5 Original Components The project consisted of the following two components: 1. Power Distribution Pilots: This component provided funding for the supply and installation of AMR equipment needed for remote meter reading, automated billing and demand side management in twenty one selected distribution pilot areas in the cities of Podgorica, Niksic, Herceg Novi and Bijelo Polje. This component also funded the rehabilitation of the low voltage networks where the new meters were installed as well as technical assistance for design, procurement, training and implementation of the pilot projects. 2. Financial Management System: This component provided funding for the supply and installation of a computer-based Financial Management Information System (FMIS) in all the functional entities of EPCG. The component also funded technical assistance for design, procurement, training and implementation of the FMIS in EPCG. Annex 2 provides detailed information about the two components.
1.6 Revised Components The project original components were not revised.
1.7 Other significant changes
The only significant change was that EPCG’s cofinancing, which was estimated at US$ 2 million in the PAD, rose to about US$ 4 million due to project delays and subsequent large increase in the world market prices of metals, cables, equipment and materials.
Due to the longer period required (than initially estimated) for project implementation and operational acceptances of the AMR and FMIS systems, the Closing Date of the Credit was extended three times to December 30, 2006, February 28, 2007, and June 30, 2007.
While it did not have a significant impact on the project, in 2006 Montenegro became an independent county and the Credit was then assumed by the Republic of Montenegro instead of the Federal Republic of Yugoslavia.

4
2. Key Factors Affecting Implementation and Outcomes
2.1 Project Preparation, Design and Quality at Entry a. Soundness of Background Analysis The project focused on the main issues damaging EPCG at the time of the project’s conception. These were the quite high distribution losses, which were 21.7% in 2001, and the relatively low collection rate of about 88%. These, combined with moderate tariffs, lead to a shortage of funds for the company since it was effectively collecting for only 65-70% of the electricity it was supplying. In addition, the accounting/financial side of the company needed strengthening as the country transitioned to a market economy and the company prepared for possible unbundling and privatization. The Project was developed as part of the Bank’s support to the “Program for Stabilization of EPCG” and specifically to support EPCG in preparing for sector reform through learning about the potential of modern computer based technologies to reduce distribution losses, improve collections and strengthen EPCG’s financial management. Given the relatively sophisticated metering and communications technology (Automatic Meter Reading – AMR), the automatic billing, and the computer based Financial Management Information System (FMIS) (all of which were new to EPCG), this Project was proposed as a pilot project under the Learning and Innovation Credit (LIC). The idea of such credit is that if the pilot project is fully successful it could then be scaled up and replicated. The automated metering and billing systems would be replicated in other distribution areas while the FMIS was viewed as the first module in a more general Enterprise Resource Planning ( ERP) system which would further improve EPCG’s performance. b. Assessment of the Project Design The Project was designed as a Learning and Innovation Credit focusing on applying new technologies to improve the financial and operational performance of EPCG. The two components were selected based on: 1) the urgent need to reduce losses in the EPCG distribution network and improve collections; and 2) the need to introduce computer based applications to improve financial and accounting processing in EPCG. Given that the AMR and FMIS systems were new applications to EPCG, two international consultants were retained to assist in preparing the design and technical requirements for the two components and to assist EPCG during project tendering and implementation. In addition, given the importance of the AMR system and its learning objective, the Project required that EPCG hire from its own resources independent consultants to prepare the Monitoring and Evaluation Plan for the Project and after completion of this component to evaluate the applied AMR technology and its results on distribution losses. Also EPCG was required to establish and fund a project management unit (PMU) in the company to: 1) prepare a project implementation plan, 2) implement the project, 3) carry out procurement, and 4) provide regular reports on the project. Finally, the Project design supported financing a portion of the distribution networks rehabilitation where the new

5
AMR meters were to be installed and envisaged EPCG making available about US$ 2 million to co-finance network rehabilitation. While somewhat complex given the small size of the project, this design was necessary to ensure that the pilot was properly implemented and results documented. However, the ICR team believes that in retrospect, given the complexity of the project design and implementation and the need for sequential tender of project activities, the project’s implementation period should have been longer than originally planned to allow complete and successful implementation of the project and avoid any need for extension. c. Adequacy of Government Commitment at Entry EPCG was the Project implementing agency and main beneficiary. As such the Government’s role in the project design and implementation was limited. However, the Government of Montenegro was committed to support energy sector reforms as specified in the Bank’s Structural Adjustment Credits, SAC 1 and SAC 2. SAC 2 was under implementation during most of the period when this project was being implemented and under the terms of that Agreement the Government had agreed to improve the financial condition of EPCG, largely by increasing the tariff to its dominant customer and by restructuring the company. d. Adequacy of EPCG Commitment at Entry EPCG made a major commitment to the project which is discussed in the assessment of design (section b) above. This commitment consisted of an initial allocation of US$ 2 million of funds which in fact turned out to be about US$ 4 million. It also consisted of the establishment and funding of the PMU, agreement to hire consultants to prepare the monitoring and evaluation plan and the completion report, and regular reporting on the project. This high level of commitment is considered adequate and shows the high level of support the project had in EPCG. e. Assessment of Risks The environmental and social risks were considered to be low which turned out to be the case. Another six risks were mentioned in the PAD in the risk section and mostly these turned out to be low also. The main risk turned out to be implementation delays resulting largely from the sequential nature of the project procurement and implementation activities. The project was sequential in that EPCG needed to hire first two design consultants for the project components and a consultant to design the monitoring plan for the project before procurement could start for the Project’s AMR and FMIS components.
2.2 Implementation The project was not restructured. However, as mentioned above its implementation was slower than anticipated in the PAD. There are several reasons for this. The main ones are discussed above. In addition, EPCG initially did not make available the required co-

6
financing for the project which was important for funding the low voltage and medium voltage cables required by the new meters and for the development of the Local Area Network needed for the installation of the FMIS systems. Later in the project EPCG provided the necessary funding and in fact ended up providing more funds than initially thought to be necessary. Finally, EPCG staff was not familiar at the beginning of the Project with the technology, either the FMIS or the automated meters and meter reading. Given these various constraints, the initial estimate that the project could be completed in 3 years was optimistic. From the Bank side, three Task Team Leaders (TTLs) were in charge of the Project at different times, though this is normal in Bank Operations with the rotation of the TTLs. However, it impacted the Bank’s oversight of project implementation during the period when the procurement activities were underway. Nevertheless, the Bank Project teams established strong working relations with EPCG and intensified their supervision activities especially during the final stages of the implementation activities where the Bank Project team visited Montenegro almost every two months to follow up with EPCG on the Project implementation. With EPCG’s intensive efforts and focus on implementation activities, the project was completed successfully with 3,778 meters installed which represents about 1.3% of the total distribution consumers in Montenegro. Similarly 14 FMIS systems were successfully installed covering all EPCG functional entities.
2.3 Monitoring and Evaluation (M&E) Design, Implementation and Utilization a. Monitoring and Evaluation (M&E) Design A fairly elaborate monitoring and evaluation plan was developed and completed in 2004 by a consultant hired by EPCG as required by the Project. The M&E plan involved measuring and calculating several electrical parameters in the distribution areas where the new metering systems were to be installed including losses and collections ratios. The areas could then be compared both before and after the meters were installed. Also similar distribution areas where meters were not installed were selected and these were monitored for comparison purposes. The M&E plan includes monitoring the fourteen output indicators in pilot areas before and after the installation of the new meters. In addition, the M&E plan defined a methodology for evaluating the impact of installing the AMR meters in pilot areas by assessing the outcome indicators. b. M&E Implementation The developed M&E plan included a computer database for recording, on a monthly basis, the measured output indicators in the pilot areas, as well as in other areas used for comparisons. The regional distribution offices were responsible for measuring the required indicators in their pilot areas and recording them in the database. Measurements were taken before and after the installation of the meters. The M&E plan included large numbers of indicators which in the longer term will help EPCG in evaluating the impact of the AMR system when more extensive measurements will be available from the AMR

7
system. However, in the short term after the installation of AMR system, the focus of the evaluation was mainly on the impact of the new AMR system on the main indicators related to system losses and collections. The status of project implementation was also monitored on a regular basis as it progressed and regular quarterly progress reports were submitted by EPCG to the Bank. This monitoring was basically about the status of meter and FMIS installations, the amount of funds spent and issues delaying implementation. In addition, and as part of the M&E plan, surveys of EPCG consumers as well EPCG staff were carried out before the start of the Project implementation, and when the new AMR meters became operational, surveys were undertaken again of both consumers and staff in order to review the results of the new metering technology. c. M&E Utilization The implementation schedules developed for the Project’s two components were used by EPCG, project suppliers and the Bank team to monitor the progress of the AMR and FMIS systems installations. To ensure that the systems were fully installed and successfully deployed in a timely manner without any further delays, problematic issues that occurred during the implementation of the AMR and FMIS projects were promptly addressed by joint EPCG, supplier and Bank teams and mitigated. In addition, EPCG fulfilled the Project requirement and hired an evaluation consultant to assess the impact of the new AMR systems installed in the pilot areas. Based on measurements and results obtained before and after installing the new meters, the consultant prepared an assessment report that includes an evaluation of the applied AMR metering technology and the impact of its installation on pilot area losses. The report also includes surveys of consumers and EPCG staff to test their acceptance of the new technology. The report prepared by the evaluation consultant also includes an “Action Plan for Pilot Project Expansion”. The plan calls for 12 months of monitoring the results of the pilot project and then its phased expansion to cover 144,526 customers in other areas of the country. The areas to be done first would be selected depending primarily on the estimated value of loss reductions and collection improvements compared to costs.
2.4 Safeguard and Fiduciary Compliance There were no significant environmental or social safeguards issues associated with the project, which mainly involved new meters and FMIS systems, and it was rated a C. a. Financial Management The financial management aspects of implementation were satisfactory. FM function for the project was adequately staffed by a qualified and experienced specialist. Audit reports were submitted timely to the World Bank with some exceptions and any weaknesses

8
identified by the auditors were subsequently addressed. The final audit report on project financial statements covering the period from January 1 2006 to June 30 2007 is still to be submitted. In addition, audit report on EPCG entity financial statements for the year 2007 also needs to be submitted to the World Bank by June 30 2008. Quarterly Financial Monitoring Reports (FMRs) were timely submitted to the Bank. The World Bank Financial Management Specialist performed substantive procedures during the supervision, and obtained assurance with respect to reliability of FMRs. Detailed transactions review was made part of financial management supervision of the project and found that internal controls and procedures were appropriately applied in practice.
b. Procurement
Despite implementation delays in the first two years, EPCG completed all procurement in accordance with the Bank’s procurement guidelines. This took longer than expected, as discussed in sections 2.1 and 2.2 above, mainly due to the fact that the design required that important procurement proceed sequentially, which at the same time put pressure on EPCG procurement staff who were initially not well experienced in Bank Procurement procedures.
2.5 Post-completion Operation/Next Phase This pilot project is likely to be replicated elsewhere in the EPCG system. It has successfully reduced the company’s distribution losses and increased collections in the distribution pilot areas. The consultant who prepared the evaluation report recommended that the metering and automatic billing program be gradually expanded from the current 3629 customers to cover an additional 144,526 low voltage customers at which point it would cover a little over half of such customers in the country. The main constraint to this expansion is likely to be the cost.
3. Assessment of Outcomes
3.1 Relevance of Objectives, Design and Implementation This pilot project remains highly relevant to EPCG and other power utilities suffering from high network losses and poor collections. It showed that losses can be sharply reduced and collections improved by adopting new technologies and procedures (See below). The lessons learned from the design and implementation of the AMR System will assist EPCG, as well as other utilities with similar conditions to EPCG, in defining and implementing the proper loss reduction and collection improvement strategy necessary to improve their financial situation. In addition, improving the financial capacity of EPCG by installing the FMIS systems in all of its functional entities will facilitate further financial and accounting unbundling of EPCG. Furthermore, implementation of lessons learned from application of new metering technologies will also support the government objective of reducing power losses in the distribution networks as required by the draft Development Strategy for the Energy Sector prepared in 2007.

9
3.2 Achievement of Project Development Objectives The achievement of the Project Development Objectives is rated satisfactory. The achievement of individual objectives and their associated outcomes based on the performance indicators are outlined below: Project Development Objective – 1) to test whether collections would be increased and losses reduced by the introduction of remote metering, automated billing and demand side management The overall achievement of this objective is rated highly satisfactory because the AMR system was successfully implemented and 3767 meters are now installed and reducing losses and improving collections in 21 EPCG distribution areas. A consultant hired by EPCG prepared a report assessing the AMR project implementation, results and technology and recommending a strategy for scaling up the project. The table below shows the reduction in losses as a result of the AMR Pilot Project as reported by the consultant. It compares losses in the project pilot areas in 2003 and 2007 and also compares losses in comparator areas which did not have the pilot projects in 2003 and 2007. The table shows the range of total losses in the pilot and non-pilot areas. The results are very clear. Losses drop sharply in the pilot areas while in the non-pilot areas the trend is less clear but probably losses are increasing. The decrease in losses in the pilot areas appears to be both a reduction in technical losses and non-technical losses.
Table 3: Initial Measurements of Reduction in Electricity Losses due to Project Region Pilot Projects Areas Non-Pilot Project Areas 2003 losses % 2007 losses %(1) 2003 losses % 2007 losses % Podgorica 15%-26% 3.5%-8% 17%-26% 11%-44% Niksic 44%-49% 2.5%-12% 21%-50% 12%-42% Bijelo Polje 15%-29% 1% 16%-32% 9%-50% Herceg Novi 18% 1.5%-2.5% 18%-20% 24%-28%
(1) The results include anomalies of negative values for losses (4 pilot areas) or of extremely low losses (2 pilot areas) because at the time of taking these measurements not all the meters were properly configured. These losses values were not reported above.
While the overall results concerning losses are clear from the available data, these results are based on only three months measurements obtained immediately after the meter installation was completed while testing was still underway. Therefore the evaluation consultant recommended that further analysis be performed based on 12 months measurements to confirm the benefits of the AMR system. EPCG, however, continued to evaluate the results of the AMR system and reported the following loss data in the pilot areas based on six months of measurements. This includes all pilot areas although some of the pilot areas are combined. The loss data information

10
in the table clearly shows that the AMR system is an effective solution for reducing losses in distribution networks. In addition, the results below show that the impact of the system should be evaluated over a longer period and not only immediately after its installations.
Table 4: Losses in Pilot Areas Six Months Average (March –October 2007)
Pilot Areas
Years P1 P2 P3 P4 P5 P6 P7 P8 P9 P10 P11 P12 P13 P14 P15 16 P17 2003 Losses
(%) 15 20 16 21 20 22 23 16 26 19 49 44 49 29 15 18 18
2007 Losses (%)
3.6 2.8 2.1 9.7 26.1 11 15 4.7 1.8 2.7 7.5 3.7 5.3 4.2 1.2 0.4 3.0
(1) Losses above 10% in some pilot areas are due to the fact that not all meters are connected to the AMR system. Despite the fact that available data on improvement in collections, at the time the consultant’s report was prepared, was limited to the pilot areas (10 out of 21) in Podgorica, where 54 % of the meters were installed, the reported data below show that a significant improvement in collections has occurred in these pilot areas partly due to EPCG disconnecting non-paying consumers using the remote connection/disconnection capability of the AMR system. This data is shown in the table below and is for December 2003 and March 2007. The fact that collections were greater than 100% in March 2007 is due to the fact that some customers were paying overdue bills in that month. Most of the pilot areas in Podgorica reported an improvement in collection rates reaching up to 100%. In one pilot area with a high concentration of commercial consumers, the collection rate in March 2007 was 715% due to these consumers paying a large part of their old debt after they were disconnected by EPCG.
Table 5:Improvement in Collections in Pilot Project Areas
Region Pilot Projects Areas 2003 Collections % 2007 collections %
Podgorica 50%-91% 68%-715% EPCG also later provided more data on collection improvements in 17 consolidated pilot areas based on comparing the average six months (March 2007-October 2007) consumer debts for electricity with consumer debts in the pilot areas as of December 2006, before any of the AMR meters were installed. These debts are shown as months of average electricity consumption payable. The decrease in debt occurs because overdue bills are being paid as well as current bills.
Table 6: Customer’s Accumulated Debt in Pilot Areas (Months of debt)
Pilot Areas Period P1 P2 P3 P4 P5 P6 P7 P8 P9 P10 P11 P12 P13 P14 P15 16 P17 December 2006
Debt in average number of months
13.6 11.8 12.2 13.7 11.1 11.8 13.3 8.9 9.1 12.9 11.6 12.1 17.7 11.42 7.9 7.1 4.9
March-October 2007
Debt in average number of months
8.0 6.0 7.16 11.8 5.7 7.4 10.6 3.3 6.8 8.7 11.5 10.3 19.2 13.4 8.1 4.6 3.4

11
The above table shows that consumer debts have significantly decreased in most pilot areas due to improved collections. This is especially true for pilot areas in cities. However, in other pilot areas, especially in rural areas, collection has also improved but less. This is because in rural or low income areas EPCG is exercising more restraint in disconnecting consumers to improve collection. Project Development Objective – 2) strengthen the financial management capacity of EPCG The overall achievement of the objective is satisfactory since fourteen Financial Management Information Systems (FMIS) were installed and now are in operation in all EPCG functional entities as shown in Annex 2. Furthermore about two hundred end users were trained on using the new system. The new FMIS will improve the financial and accounting processes at EPCG, improve information availability and will further facilitate the financial and accounting unbundling of the company. These unbundling activities have picked up speed after the complete installation of the FMIS in EPCG in February 2007.
3.3 Efficiency This is a pilot project and its objectives were to see whether new technologies including remote meter reading, automatic billing and demand side management would reduce losses and increase collections. Also it was designed to see if the installation of FMIS systems in the major units of EPCG would strengthen its financial management. Because it is a pilot project under a Learning and Innovation Credit, the PAD does not contain any measures of economic efficiency such as an ERR or FRR. Nevertheless estimated paybacks from the metering program were calculated by the consultant before the project was implemented and an estimate made of these paybacks after the project was completed. The initial estimated payback period for all of the pilot areas was 2.1 years. The actual result as calculated by the consultant was 3.5 years. Both of these payback periods are reasonable and correspond to quite acceptable rates of return. The primary reason for the longer actual payback period is the higher than expected cost of installing the meters and setting up the metering systems. This in turn is due to project delays and increases in the cost of cables and cabinets needed for installation of the meters. Further analysis was performed by the evaluation consultant to assess the economic benefits of scaling up the AMR system as part of an action plan for the system. The consultant calculated the payback periods in different region of EPCG (excluding the pilot areas). The table below shows the payback for all of the distribution areas.

12
Table 7:First Phase AMR System Scale Up: Payback periods
MB
TS e
quip
men
t Cos
t
Tota
l AM
R in
vest
men
t
Payb
ack
perio
d - v
ar. a
)
Payb
ack
perio
d - v
ar. b
)
Dis
tribu
tion
Are
a
No.
of T
rans
form
er su
bsta
tions
(MB
TS)
No.
of c
onsu
mer
s mil. € mil. € years years
Niksic 185 19453 2.803 10.206 2.7 1.6
Cetinjie 81 6736 1.252 3.865 3.0 1.9
Podgorica 541 61355 8.424 31.631 3.6 2.1
Kilasin 25 2950 0.383 1.550 4.0 2.3
B.Polje 74 9270 1.127 4.673 4.2 2.4
Kotor 76 10908 1.163 5.318 4.9 2.6
Pljevja 65 9377 1.031 4.612 5.5 2.9
Ulcinj 73 6104 1.099 3.471 5.8 3.2
Bar 130 18373 2.018 8.980 7.7 3.7
H.Novi 112 19643 1.723 9.142 18.4 6.0
Budva 122 15322 1.837 7.661 19.1 6.4
Rozaje 35 3601 0.535 1.952 -167.1 15.4
Zabljak 30 1828 0.465 1.220 -7.9 -9.1
Tivat 68 8203 1.030 4.176 -9.9 -14.8
Mojkovac 17 2857 0.265 1.392 -10.2 -15.9
Berane 77 13429 1.153 6.241 -17.7 399.4
Sektor - var.1 1711 209409 26.308 106.089 5.7 3.0
Sektor - var.2 1250 144526 19.552 74.322 3.9 2.5 The action plan for AMR system scale up calls for further monitoring of the system and a phased scaled up starting with the regions with the lowest payback period as shown in the table above and probably stopping with the Bar distribution area. This provides the maximum benefits of the system. In addition, it is expected that the cost of scale up per meter will be relatively lower than that cost of the pilot AMR system due to:
• No investment in AMR Control Center will be needed as the existing AMR center of the pilot project is designed for up to 100,000 meters;
• Availability of trained utility personnel; • Need for minimum support from consultants; and • Larger scale of AMR system installation will lower the cost of meters.

13
Taking the above factors into consideration, the payback period for the AMR system scale up will be lower as shown in the last column (var-b ) of the above table compared with the payback periods without considering the above factors (var-a)
3.4 Justification of Overall Outcome Rating Rating: Satisfactory. This project is rated satisfactory on the basis of its high relevance (as described in Section 3.1), satisfactory achievement of its development objectives ( as described above), as well as the satisfactory implementation of the Project’s two components. Furthermore, the results of the AMR system and the lessons learned from its implementation will now enable EPCG to prepare and implement the appropriate strategy for loss reduction. The new FMIS systems will also enable EPCG to improve its financial and accounting processes.
3.5 Overarching Themes, Other Outcomes and Impacts (a) Poverty Impacts, Gender Aspects, and Social Development The project seeks to promote socially responsible behavior and to introduce metering and billing systems which are more transparent and less subject to manipulation by consumers or meter readers. It also reduces the implicit subsidies to non paying consumers which often belong to a better-off part of the population. Surveys of consumers were done both before the project began and after, and they show that in both cases around 85% of the consumers polled preferred the new metering and billing systems. (b) Institutional Change/Strengthening EPCG will be strengthened by the experience with the new metering and billing technology and also by the introduction of the new FMIS systems. The introduction of this new technology and these new systems has required considerable training. Also the introduction of the new FMIS systems makes unbundling of EPCG easier, in order to conform better to the Energy Community of South East Europe Treaty. In addition, EPCG’s capacity to carry out procurement using World Bank’s guidelines has been tremendously strengthened and EPCG staff members who worked on the project procurement activities have gained good experience in the Bank’s procurement procedures. Lessons learned from the delays, which occurred during the early stage of the Project, have helped EPCG in the preparation of the Bank’s new credit (the ECSEE –APL3 Montenegro Project) and in early preparation of the tender documents for the components to be financed by the new loan. (c) Other Unintended Outcomes and Impacts (positive or negative) There were no major unintended impacts other than those reported above.

14
3.6 Summary of Findings of Beneficiary Survey and/or Stakeholder Workshops Results of surveys undertaken by EPCG before this project began and after it was completed to test consumer acceptability of the new metering technology indicate that most consumers (around 85%) expected to be satisfied and were satisfied with the new metering and billing systems. For households living in single family houses (the great majority of the consumers) the percentage was 88%. However, it was 75% for households living in apartments and 87% for commercial customers. In addition, a survey was also undertaken by EPCG to test the reaction of EPCG staff to the new technology. The survey shows that the reaction was overwhelmingly positive. 97% of the staff polled thought that the pilot project represented a significant contribution to the modernization of EPCG and 92% of staff thought that cooperation with foreign partners and consumers had been satisfactory. The only area of substantial dissatisfaction was on training where 40% of the staff thought they had not been adequately trained while 60% thought they had, indicating that the applications of new technology may require additional training of the utility staff to enable them to efficiently utilize the new system. In addition, EPCG and the Bank teams are currently cooperating in developing a joint presentation that can be used by both teams to disseminate the results of the AMR pilot projects.
4. Assessment of Risk to Development Outcome Rating: low The overall level of risk to the development outcome is rated as low on the basis that the successful implementation of the Project’s two components and application of new modern technology will ensure that the outcomes of the Project in terms of reducing losses in pilot areas and improving EPCG financial capacity are sustainable. However, there is a risk involved in whether new metering systems will be widely introduced in EPCG’s distribution network due to the high cost associated with scaling up the AMR Project. EPCG will have to weigh this investment against all of the other priority investments it has. In addition, a risk may arise related to the ability of the users of the new FMIS system to utilize the system effectively and to overcome their resistance to change the existing procedures replaced by the new FMIS. Mitigation measures have already been taken as more than two hundred users have been trained in using the new FMIS in the last few months. In addition to user training, senior management’s support and instruction that the new system be used in all financial and accounting activities will be necessary to ensure that the system is fully utilized by EPCG.

15
5. Assessment of Bank and Borrower Performance
5.1 Bank Performance (a) Bank Performance in Ensuring Quality at Entry Rating: Satisfactory. At the time of appraisal, the scope of this Learning and Innovative Credit was very relevant to EPCG and Montenegro and was designed to assist EPCG in improving its financial performance. The Bank team that prepared the project worked closely with EPCG in defining the project scope and outlined the learning objectives of the project. The design, although complex at the time of appraisal, was reasonable considering the objectives and the relative lack of experience of EPCG. The Bank team included in the scope of the project sufficient funds for hiring design and implementation consultants to assist EPCG in implementing the two components of the Project. (b) Quality of Supervision Rating: Satisfactory The Bank teams carried out on a regular basis formal supervision missions on all aspects of procurement implementation and financial management reporting. EPCG and the Bank teams established good working relations that subsequently enabled the teams to address and mitigate the implementation problems that occurred. Intensive supervision and continuing involvement by the Bank teams was instrumental in ensuring that the project’s two components were successfully implemented. Furthermore, to ensure that all components were successfully implemented and deployed and the learning from the results of the AMR project occurred, the Bank team supported extensions of the Closing Date for the Credit. (c) Justification of Rating for Overall Bank Performance Rating: Satisfactory. The rating for overall Bank performance is based on the Project’s satisfactory quality at entry and satisfactory quality of supervision carried out by the Bank teams as described above.
5.2 Borrower Performance (a) Government Performance Rating: Satisfactory. The Government was not involved in the details of the project design and implementation. However, the Government had always stressed that the Project should be successfully

16
implemented and supported extensions of the Credit to ensure that the components financed by the Credit were completed and their intended outcomes were achieved. In addition and over the course of the project, the Government initiated a reform process for the energy sector that aimed at restructuring EPCG, supporting the privatization and commercialization of the aluminum smelter KAP (consumes about 1/3 of the electricity demand in Montenegro) and requiring KAP to gradually import on its own account increasing portions of its electricity consumption from the regional market. This has gradually relieved EPCG from some of its supply obligation to KAP, which has in turn improved EPCG’s financial performance. In addition, sector reform over the course of the credit included signing and ratifying the Energy Community of South East Europe Treaty, creation of the Energy Regulatory Agency and approval of a new tariff methodology that resulted in establishing in June 2007 a new unbundled transmission tariff and a new retail tariff for Montenegro. Despite this progress, the government is aware that further progress is needed to complete the full unbundling of EPCG and to establish a policy for private sector participation in development of the energy sector. (b) Implementing Agency or Agencies Performance Rating: Satisfactory. EPCG was the implementing agency for this project and its performance is rated satisfactory. This rating is based on EPCG’s commitment to the project during all of its stages and its readiness to undertake a pilot project that involved application of new technology for learning purposes in order to ascertain the best solution for its chronic problems of high losses and poor collections. Despite delays in implementation activities during the early stages of the Project and additional costs needed to implement the Project, EPCG senior management and technical staff remained committed to the successful deployment and implementation of the components financed under this Credit and the full disbursement of the Credit. (There was a 99% disbursement ratio). EPCG’s commitment to the Project was manifested by it making available additional funds to co finance the project, expediting local procurement activities financed by EPCG, establishing a dedicated Project Management Unit for project implementation and management, and hiring from its own resources a consultant to assess the results of the AMR project and prepare a strategy for its expansion. (c) Justification of Rating for Overall Borrower Performance Rating: Satisfactory
6. Lessons Learned The main lessons learned from the design and implementation of the Project, as well as its achievements, are the following:
• Application of modern metering technology provides utilities suffering from high
network losses and poor collections with a means of mitigating these problems. However for any metering project to be effective, it should be accompanied with

17
an investment program of rehabilitation of LV networks and feeders where the metering project is implemented. Given the associated cost of modern metering and network rehabilitation, utilities are advised to gradually expand new metering technology in areas that will yield the highest benefits as determined by a cost/benefit analysis performed for the metering project.
• Significant costs will be associated with the initial stage of an AMR System project. However, costs of subsequent scale up stages of the AMR system may be lower due to increased implementation efficiency by utility staff and the economies of scale.
• To avoid delays in project implementation, adequate time and effort is required to develop a suitable design for a proper metering system, tender packages, the bid evaluation process, and to develop a realistic plan for project implementation.
• The development of a close working relationship between the Bank Teams and EPCG and the system suppliers was critical for successfully implementing the components financed by the Credit and achieving the project development objectives. This also enabled the Bank Team to deepen its engagement and dialogue with EPCG as well as with the Government on issues related to sector reform.
7. Comments on Issues Raised by Borrower/Implementing Agencies/Partners (a) Borrower/implementing agencies A final draft of the ICR was shared with the Ministry of Economic Development. The Ministry indicated its satisfaction with the ICR. EPCG’s comments on this ICR are included in Annex 7. (b) Cofinanciers None (c) Other partners and stakeholders None

18
Annex 1. Project Costs and Financing
(a) Project Cost by Component (in USD Million equivalent)
Components Appraisal Estimate (USD millions)
Actual/Latest Estimate (USD
millions)
Percentage of Appraisal
POWER DISTRIBUTION PILOTS 3.4
6.0 [5.0]*
176%
FINANCIAL MANAGEMENT SYSTEM 2.3
3.1
[2.6]* 135%
Total Baseline Cost 5.7
9.1 [7.6]*
160%
Physical Contingencies 0.80 NA NA
Price Contingencies 0.50 NA NA
Total Project Costs 7.0
9.1 [7.6]*
160%
Project Preparation Fund 0.0 0.0 NA Front-end fee IBRD NA NA NA
Total Financing Required 7.0 9.1 [7.6]* 160%
* Figures given in [ ] are in Euro, which are the actual as the PMU recorded in Euro all the project expenditures over the years 2003-2007. Since the exchange rate for the Euro changed over this period, the ICR team assumed an average of 1.2 for Euro/US$ exchange rate.
(b) Financing
Source of Funds Type of Cofinancing
Appraisal Estimate
(USD millions)
Actual/Latest Estimate (USD )
@ June 30, 2007
Percentage of Appraisal
Borrower 2.00 3.5
175%
International Development Association (IDA) 5.00
5.6**
112%
** IDA actual financing is larger in US dollar than the appraisal estimate due to the appreciation of the SDR vs. US$

19
Annex 2. Outputs by Component
Component 1: Power Distribution Pilots The Power Distribution Pilots component included the supply and installation of equipment needed for remote metering, automated billing and demand side management (all referred to as an AMR system). The purpose of the AMR system was to test whether and to what degree the electricity consumers in Montenegro would improve their discipline in electricity payments and participate in the program of loss reduction, in response to the introduction of the AMR systems in the pilot regions. In addition to the AMR systems, this component also included the rehabilitation of the low voltage networks in the pilot areas where the new AMR meters were installed. The rehabilitation of the networks was implemented as Phase 1 of this component while the implementation of the AMR system was implemented as Phase 2. The total costs of Phase 1 and Phase 2 were about Euro 5 million of which the World Bank credit financed Euro 2.22 million and EPCG financed Euro 2.78 million. The network rehabilitation of Phase 1 involved mainly replacing and expansion of existing cables and overhead networks as well as distribution transformers in the pilot areas. The aim of this work was to reduce technical losses in the network and the design and implementation of this network rehabilitation followed the utility’s normal design and implementation practices. Thus this rehabilitation was carried out in the same manner irrespective of the type of new meters to be installed. On the other hand, the focus of the AMR Systems Component ( Phase 2) was on the impact of the implementation of modern metering technology on reducing the non-technical losses. The AMR system consists of the following three components, as illustrated in Figure 2-1 below:
• Digital electricity meters with telecommunication interfaces which are installed at the consumer and transformer feeders to measure energy consumption, store the recorded data, identify and register any unauthorized meter handling and limit the load and exercise control actions (e.g. connect and disconnect) according to the commands from the control center;
• Communication systems including two-way communications between meters and the AMR control center through concentrators. Concentrators are placed in special meter cabinets in the feeders of the transformers of the pilot areas, with the task of collecting the metering data and sending the data to the control center. DLC (Distribution Line Carrier) technology is applied for communication between meters and concentrators over distribution network low voltage lines. Public mobile GSM/GPRS communication technology is applied for communication between concentrators and the AMR control center;
• The computer control center (AMR Center) in Podgorica provides automated collection, processing and storage of metering data from all meters in the pilot

20
areas. The collected data are transferred from the AMR center to the billing system for billing and tariff management and for remote connection to the financial and accounting systems at EPCG. In addition, the deployment of the system is aimed to facilitate further accounting and management unbundling of EPCG.
Figure 2-1 Conception of AMR system structure The implementation of the AMR system included installing 3767 meters (representing about 1.3% of low voltage consumers and about 300 meters more than was originally planned) in 21 pilot areas (transformer areas) of the following distribution regions ( ED) of EPCG which are also shown in Figure 2-2:
• ED Podgorica - 10 transformer areas with 1976 meters at consumer’s premises and 72 meters at transformer feeders
• ED Nikšić - 6 transformer areas with 677 meters at consumer’s premises and 27 meters at transformer feeders
• ED Bijelo Polje - 2 transformer areas with 353 meters at consumer’s premises and 15 meters at transformer feeders and
• ED Herceg Novi - 3 transformer areas with 636 meters at consumer’s premises and 24 meters at transformer feeders.

21
Figure 2-2 AMR Meter Installation in EPCG network
Component 2: Financial Management Information System The installed FMIS systems consist of hardware, software and communication systems. The hardware is relatively standard consisting of workstations, servers, data storage etc. The primary software provided include modules for;1) General Ledger, 2) Accounts Payable, 3) Accounts receivable, 4) Cash Management, 5) Fixed Assets Accounting, 6) Inventory Management,7) Project Accounting, 8) Consolidation, and 9) Financial and management Reporting. A Human Resource Management module was also installed at EPCG headquarters.
FMIS systems are now installed and deployed in all EPCG functional entities as summarized in Figure 2-3 and more than 200 users have been trained in using the new system.

22
Figure 2-3: Summary of FMIS Installation Locations
EPCG Units/Functional Entities with FMIS Systems
HEAD OFFICE
ELEKTROGRADNJA
GENERATION Headquarters
Hydro power plant PERUCICA
Hydro Power Plant PIVA
Thermal Power Plant PLJEVLJA
TRANSMISSION Headquarters
DISTRIBUTION Headquarters
DU BAR
DU NIKSIC
DU PLJEVIJA
DU PODGORICA
DU BIJELO POLJE
SUPPLY Headquarters
Source : EPCG Du= Distribution Unit

23
Annex 3. Economic and Financial Analysis Since this is a pilot project implemented through a Learning and Innovation Credit, there is no estimate of its economy efficiency in the PAD. However, the consultant working for EPCG made a calculation of the payback from installing the AMR system which is shown below. It shows, for the four regions with pilot projects, the estimated costs of installing meters and the estimated payback periods as well as the actual costs of installing meters and actual payback periods. The difference in payback periods is mostly, but not solely, due to the actual cost of installing meters being considerably higher than the estimated costs.
Payback Periods and Unit Costs of Meter Installations Estimated Actual Region Payback Period
Years Installation Costs
€/ meter Payback Period
Years Installation Cost
€/ meter Pod Orica 2.0 323 2.0 672 Niksic 2.1 300 4.9 769 Herceg Novi 2.4 291 n.a. 642 Bijelo Polje 2.0 319 7.7 872 Weighted Average
2.1
308 3.5 642
There is not a unique relationship between the payback period and the IRR. However, if it is assumed that the investments in meters occur over two years and that the benefits consist of a fixed amount starting in the third year and continuing for 17 years then a payback period of 2.1 years would correspond to an IRR of about 40% while a payback period of 3.5 years would correspond to an IRR of around 25%. Both of these are good rates of return.

24
On Annex 4. Bank Lending and Implementation Support/Supervision Processes
Task Team members
Names Title Unit Responsibility/ Specialty
Lending Dejan .R. Ostojic Task Team Leader ECSSD
Supervision/ICR Husam Beides Task Team Leader ECSSD Angelica A. Fernandes Procurement Analyst ECSPS Miroslav Frick Operations Analyst ECSSD Surekha Jaddoo Operations Analyst ECSSD Aleksandar Crnomarkovic Financial Management Specialist ECSPS Gennady Pilch Sr. Counsel LEGES Kirsten Burghart Propst Counsel LEGEM Nicholay Chistyakov Senior Finance Officer LOAFC Egli Illic Disbursement Analyst LOADM Poonam Rohatgi Program Assistant ECSSD Silvia Mauri Consultant ECCU4 David Kennedy Former Task Team Leader ECSSD Jim Moose Consultant – ICR Primary Author ECSSD
(b) Staff Time and Cost Staff Time and Cost (Bank Budget Only)
Stage of Project Cycle No. of staff weeks USD Thousands (including
travel and consultant costs) Lending
FY02 3 42.15 FY03 5 27.10 FY04 0.00 FY05 0.00 FY06 0.00 FY07 0.00
Total: 8 69.25
Supervision/ICR FY02 0.00 FY03 7 52.45 FY04 11 52.23 FY05 6 28.86 FY06 11 43.56 FY07 12 46.91
Total: 47 224.01
Note: Staff time and cost up to FY07 automatically generated by Portal and may not reflect actual, which is also no longer available in SAP.

25
Annex 5. Beneficiary Survey Results A survey of consumers was done both before the AMR project began and after it was completed. Also there was a survey of EPCG staff done after the project was completed. The survey of consumers done after the project was completed had 10 questions which were to be answered yes or no. Three types of consumers were identified, households living in single family homes, households living in apartments and commercial establishments. Most of the respondents ( 473 out of 684) were households living in single family houses and the percentages below refer to this category of consumers in Podgorica although the other categories of consumers and other regions were similar. The survey showed that consumers thought that the new remote metering and automatic billing systems led to; 1) improved quality of electricity supply (84%), 2) reduced electricity theft (91%), 3) fewer incorrect bills ( 67%), and 4) was generally more modern and acceptable (88%). Therefore, the new metering technology clearly appears to be preferred by most consumers. A survey of EPCG staff was also carried out on how the implementation of the project was viewed and whether it was a success. Generally staff were quite enthusiastic with, for example, 90%-100% of surveyed staff in all four regions stating yes when asked: 1) “Do you see your own interest and perspective in further AMR system expansion ” , 2) “Do you believe that the Project realization represents a significant contribution to EPCG modernization” and 3) “Has satisfactory cooperation with consumers been achieved” . However only about 60% of EPCG staff indicated satisfaction with the training provided on the new technology. Therefore, it can be concluded from the results of surveying EPCG staff that they are supportive of the new AMR system and the application of new technology to EPCG; however, improved training, in using the new technology would be necessary for the staff working in the distribution functional entities, both in headquarters and in the regions.

26
Annex 6. Stakeholder Workshop Report and Results No workshop but stakeholders were polled. Results of the surveys are described Annex 5 above. In addition, EPCG and the Bank teams are currently cooperating in developing a joint presentation that can be used by both teams to disseminate the results of the AMR pilot projects.

27
Annex 7. Summary of Borrower's ICR and/or Comments on Draft ICR EPCG has no substantial comments regarding the Final Draft of ICR, finding that it has addressed all important topics in a fully comprehensive and right-to-the-point manner. However, EPCG would like to express here its appreciation and feeling of being privileged to have had the opportunity of implementing the Emergency Stabilization of Electricity Supply in the Republic of Montenegro Project in cooperation with the World Bank, in particular because it was one among the first projects that were financed by the World Bank in Montenegro, after unfortunate development of events in the Balkans during the 1990. Its pioneering nature, complexity of its objectives, and the initial inexperience of EPCG staff in WB procedures, make the successful outcome of the Project even more precious. EPCG would also like to stress here its special appreciation and gratitude to the professionals who contributed to the success of this joint endeavor, and in particular to the Project Task Team Leaders: Mr. Dejan Ostojic who designed the Project in 2002, Mr. David Kennedy who made the Project move from its stand-still in mid-2003 and get the momentum needed to solve crucial obstacles that had to be surpassed to enable the Project’s smooth further implementation, and to Mr. Husam Beides who helped the Project during the critical final stages in 2005 and 2006 and made the Project reach its successful end. In addition to the good working relations established between EPCG and the Bank teams in Washington, establishment of strong relations between the Project and the WB Country Office in Belgrade must also be mentioned. EPCG appreciates readiness of its personnel to assist the Project promptly in addressing numerous administrative, procedural and procurement issues, in particular assistance received from Mr. Miroslav Frick, who spared no time or effort to provide all necessary contacts, documents or advice whenever they were needed for the Project. In view of all stated in the ICR and in the above comments, EPCG looks forward to continuation of cooperation with the World Bank through possible new projects that would either be the follow-up of the Emergency Stabilization of Electricity Supply in the Republic of Montenegro Project, or projects in other areas of mutual interest.

28
Annex 8. Comments of Cofinanciers and Other Partners/Stakeholders None

29
Annex 9. List of Supporting Documents Project Appraisal Document. August 2002 Project Monitoring and Evaluation Plan. April 2004. Project Status Reports and Implementation Status Reports. 2004-2007 Mission Aide Memoires. 2006-2007 Montenegro Joint Portfolio Review Report, March 2007 EPCG Quarterly Progress Reports, 2004-2007 Evaluation Consultants Reports including AMR final Report and Annexes as well as report on Action plan for AMR system expansion. July 2007 Additional Information with updated measurement provided by EPCG. November 2007