Embed Size (px)
Citation preview
DOCUMENT RESUME
ED 315 515 CE 053 754
AUTHOR Bartel, Ann P.TITLE Utilizing Corporate Survey Data to Study Investments
in Employee Training and Development.INSTITUTION Columbia Univ., New York, NY. Inst. on Education and
the Economy.SPONS AGENCY National Assessment of Vocational Education (ED),
Washington, DC.PUB DATE Feb 89NOTE 19p.; Paper presented at the Conference on
Employer-Sponsored Training (Alexandria, VA, December1-2, 1988). Set in small type. For related documents,see ED 283 020, ED 290 881, ED 299 412, ED 297 150,CE 053 752-774, and CE 053 783-797.
PUB TYPE Reports - Research/Technical (143)Speeches /Conference Papers (150)
EDRS PRICE MFO1 /PCC1 Plus Postage.DESCRIPTORS *Corporate Education; *Cost Effectiveness; Employer
Attitudes; Employer Employee Relationship; *LaborEconomics; *Labor Force Development; Models; *On theJob Training; Postsecondary Education; *ResearchMethodology; Research Needs
ABSTRACTVery little is known about how companies make
decisions about budgets for training. Previous research on employeetraining has focused on the impact of training on an individual'ssuccess in the labor market. Economists have also studied whyemployers are more likely to train certain persons than others. Thisstudy, on the other hand, uses a unique data base on human resourcepractices in U.S. businesses (the Columbia Business School HumanResources Survey) to study the variation in the training effortacross companies. A simple economic model is used to derive severaltestable hypotheses about the variables that can explain why somebusinesses invest more in employee training than others. The role offirm characteristics as well as characteristics of the company'sindustry are studied. The model correctly predicted that largebusinesses, those with nigh capital-labor ratios, and those with ahigh proportion of internal promotions were more likely to haveformal training programs. In the case of cost, however, the modelperformed poorly. Further research is needed to obtain alternativemeasures of the extent of train :ng and its cost-effectiveness interms of the organization. (KC)
*******hh* h * * 7177*7****7*******777777*****1,7**I7*777777 7** 777 7777** r.
Reproductions supplied by EDRS are the best that can be made *
from the original document. *
* k * * * * ******************************* * * Y. * * * * * h. * * * * * *
UTILIZING CORPORATE SURVEY DATATO STUDY INVESTMENTS
IN EMPLOYEE TRAINING ANDDEVELOPMENT
Ann P. BartelColumbia University
Graduate School of Business
February 1989
U.5 DEPARTMENTOF EDUCATION
COlif.e of Educat.onal Research and IfhP,Ovrnenl
EDUCATIONAL RESOURCEURCES INFORMATiONCENTER (EC)/h4s document has been TeprOduCed aS
,ece,ved born ihe person of organzalnn
orginaling it
C NinOf Changeshave been made to " W ove
fePiOduction Quality
niNs dor.Ponf sot v, Of Own, stated'
e`V,
,nent do not nece,eweSer,1 011,c,a,
OI P Dosd,on ttr Vg)licy
This paper was prepared for the Conference on Employer-sponsored Training held in Alexandria, Virginia, onDecember 1-2, 1988, and sponsored by the Institute on Education and the Economy, Teachers College,Columbia University, New York, New York, and funded by the National Assessment of Vocational Educationof the U.S. Department of Education.
Views or conclusions presented are those of the authors, and are not necessarily endorsed by the NationalAssessment of Vocational Education or any other sponsors or funding organizations.
The Institute on Education and the EconomyTeachers College, Columbia University
New York, NY 10027
2BEST COPY AVAILABLE
INTRODUCTION
According to the May 1988 issue of Training Magazine, U.S. ceganizations with fifty or moreemployees spent $32 billion on formal programs for employee training and development. Although humanresolute managers argue that training is critical for developing a prod active workforce, very link is !mownabout how companies make decisions about budgets for trainiag, Previous remelt by labor economists onemployee training has focused on the impact of training on an individual's pecceas in the labor market, Le,,.how training raises the individual's wage and reduces the probability of layoff Economists have also studiedwhy employers are more likely to train certain individuals than others, and, in particular, have shown thatindividuals who are expected to stay with the firm are more likely to receive training. Hence, economicresearch on training has heed's concerned with the impact of investments in training on the distribution ofearnings. Likewise, research on training by industrial and crganizational ps)chologists has been conducted atthe individual level, focusing on the impact of training on the employee's cognitive skills, work effort, andmorale.
This paper, on the other hand, considers the organization as the unit of observation. Althougheconomic models of training decisions are framed in terms of a company's calculation of the costs andbenefits of such training, empirical work has never been able to test this model directly on companyperformance. Researchers have been forced to make inferences about company performance based on data onthe careers of individuals. By utilizing a unique database on human resource practices in U.S. businesses, Iam able to study the variation in the training effort across companies. A simple economic model is used toderive several testable hypotheses about the variables that can explain why some businesses invest more inemployee training than others. The role of firm characteristics as well as characteristics of the company'sindustry are sridied. The results of this research should prove useful for forecasting how a company'sdecision to invest in training might be affected by such factors as technological change, government subsidiesfor training and the extent of competition in the product market.
In the next section of the paper, the Were= on employee training is summarized in order to showthe types of data available to researchers who have previously studied the topic of employee training. In thethird section, I describe the survey I am using, the Columbia Business School Human Resources Survey, anddiscuss its strengths and weaknesses relative to other databases that have been used for the study of employeetraining. The fourth section, Determinants of Company Training Programs, specifies a simple model that istested with the survey data. The final section discusses directions for future research.
LITERATURE REVIEW
In this section of the paper, I summarize the literature that exists on the subject of employee trainingand development. In preparing this summary, I have reviewed work by economists and industrialpsychologists as well as the results of previous surveys of corporate training programs.
Economists
Economists who study on-the-job training have primarily been interested in modelling who receivestraining and how it affects the individual's growth in earnings over his worsting life. Examples of thisliterature are the studies by Mince- (1983, 1987), Brown (1983), Lillard and Tan (1986), Pergamit andShack-Marquez (1986), Barron, Black and Lowenstein (1987, 1988) and Lynch (1988). These studies usedata from national surveys such as the Panel Study of Income Dynamics, the N...tional Longitudinal Surveys(NLS), the Current Population Survey, and the Employment Opportunities Pilot Project. Information ontraining from the first three data sets is obtained directly from the individuals who are surveyed.
For example, in the Panel Study of Income Dynamics, which was used by Mincer andBrown, individuals are asked "On a job like yours, how long would it take tl:e averageperson to become fully qualified?" and "Are you learning skills on the current job whichcould lead to a better job or promotion?"
The National Longitudinal Surveys, which were used by Mincer, Lillard, and Tan, andLynch, contain a variety of training questions depending on the particular cohort that was
surveyed. For example, for older NLS cohorts, the seining questions are To you receive orIlse additional training (other than schooling training) on your job?" and "What was thelongest type of training you have had since the last interview?" For the NLS youth cohort,however, information is provided on all training spells in the respondents' working life; andit is possible to separate company training from apprenticeship training. The individuals inthis survey were first interviewed in 1978 when they were between the ages of 14 and 21and have been re-surveyed every year or two since that time
The January 1983 Current Population Survey. used by Lined and Tan, and Pergamit andShack-Marque; contains the following question on rehab* °What training was needed toget the current or last job and what training is needed to improve skills on the current job ?'
Finally, the 1980 Employment Opportunities Pilot Project (EEOPP) Date" used by Barronet al, is unique in that it surveys employers. The employers were asked to provideinformation on the amount of on-the-job training provided their moat recently hired worker,as measured by the number of hours typically spent by various personnel in training thisindividual.
The main findings of this research can be summarized briefly: individuals who receive training arelikely to be young, white males. Most studies also find that the more educated individuals receive moretraining than the less educated. Private sector veining is found to play a significant role in the wagedetermination and career patterns of young workers; individuals with more training have significantly largerwage growth and longer job tenure. The data from the EOPP Survey also show that individuals who receivedmore training in their first three months of employment have significantly faster productivity growth duringtheir first two years with the employer.
Industrial Psychologists
Industrial psychologists have studied the effects of employee training utilizing experimental methodsand case studies. They have measured the effectiveness of training in one of four ways: (1) subjectivelearning (judgments of course participants or trainers); (2) objective learning (results on standardized tests); (3)subjective behavior (changes in on-the-job behavior, as perceived by course participants, peers or supervisors);and, least commonly of all, (4) objective results (tangible indicators such as reduced costs, improved qualityor quantity of output). An excellent survey of studies conducted by industrial psychologists on the subject ofmanagerial training is provided in Burke and Day (1986). They review seventy articles that evaluated theeffectiveness of training programs for managerial or supervisory personnel in various companies. In all ofthese studies, the individual is the unit of observation and individuals who received training are compared tothose who were not in the training program. The comparisons are made on the basis of scores on skill orknowledge tests, performance rankings, ratings during role play, and survey ratings by subordinates. Only ahandful of these studies evaluated training programs in terms of objective results. The best example of thelatter type of study is the one conducted by Russell. Terborg and Powers (1985) in which 62 retail storesbelonging to the same international merchandising organization were the units of observation. They foundthat sales volume per employee was positively and significantly correlated with the percentage of salespersonnel who received training in basic sales procedures and with the sales personnel's perceptions of theemphasis given training in the store.
The main problem with these studies is that each one is limited to a relatively small group ofindividuals (normally between 50 and 100) in one company so that it is difficult to generalize the findingsbeyond the company under study. Although Russell et al. examined 62 companies, they are in the sameindustry and belong to the same organization. In her critique of the psychological research, Ingots (1987)accuses the researchers of minimal cross-referencing: "They do not look for common themes acrosscompanies, but focus on the specific case at hand." She concludes that this tine of research has left us witha limited and fragmented knowledge about the role of training in corporations.
2
Surveys of Corporate Training Programs
Information on investments in employee training can also be obtained from surveys that areconducted by various orpnizarions. For example, each year, Lakewood Research, a division of LakewoodPublications, the publisher of Training Magazine. conducts a survey of U.S. organized= with 50 or moreemployees. Respondents are asked for information on the stratum their organization budgets for formaltraining, the number of individuals who receive 11.1 during the year, and the number of hours of trainingthey receive. The information (tom approximatedy 2, 00 respandeent is extrapolated by Lakewood Researchtea universe of 230,000 organizations and reported In sigma figures only. Par example, the results of the1987 survey, published in May 1988, indicate that $32 billion was budgeted for formal training that year with38,1 million workers scheduled to receive 1.2 billion holm of training. The survey also described the typesof ling (e.g. management skills, technical skills, clerical sldfis, sales skills, etc.) provided by therespwadent companies and showed how these differ across industries and size of firm.
A second example of a corporate survey is the study prepared by The Conference Board in 1975(L.usterrnan, 1977). It surveyed 2800 companies that had at least 500 employees and received usableresponses from 610 firms. Them data were then extrapolated to the universe of 7600 firms. Information onper employee expenditures for formal in-house training, tuition aid and other outside training was obtained.The main findings of this study were that the companies spent an average of $60 per employee on the threetypes of training, $48 of which was spent on formal in-house training large companies spent more peremployee than small companies; and the share of the training budget attributed to formal in-house trainingrose from 47% for the firms in the smallest size category to 87% for the firms in the largest size category.Convening the 1975 expenditures to 1987 dollars would produce an expenditure of $93 per employee onformal in-house training.
In 1985, The Conference Board surveyed 218 companies to obtain information on changes incorporate education and training that had occurred in the previous five yeas (Lusts ratan, 1985). While thisnew report did not contain any cost information, it discussed how the training function had increased inimportance at the surveyed companies. A larger proportion of employees in all major job categories wereinvolved each year in formal training as compiled to five years earlier. The companies reported that theywere strengthening and widening the role of corporate training departments and were using more sophisticatedmethods to evaluate the need for and to =NS the impact of employee training.
A third example of a corporate survey is the one conducted by the Battelle Human Affairs ResearchCenter in 1987 (Seat Johnson, McLaughlin, and Zimmerle, 1988). This group mailed a questionnaire to 100U.S. companies randomly selected from all private-for-profit companies having at least 1,000 employees.While the response raw was excellent (61%), the survey collected data only on management training. Theinformation is in the form of categorical variables such as the company's use of formal on-the-job training,minoring, job-rotation, training needs assessment, and training evaluation systems. The survey also collectedinformation on the reasons companies give for selecting various training program approaches (e.g. external vs.internal), and the process used to select participants for these programs. The major finding from this surveyis that 89% of the companies reported using formal training/education programs, with usage of this trainingpositively correlated with company size. In spite of the prevalence of formal training. there was limitedevidence of systematic evaluations of management training by the companies in this sample.
General Observations
As this literature review has revealed, what we know about employee training is the following:
it has positive career impacts on the individuals who receive it;that U.S. companies spend a fair amount on formal training; andmany case studies conclude that employee training is effective in improving job performance.
What is lacking, however, is a clear understanding of why some companies invest heavily in employeetraining and others do not. To date, no one has been able to study the variation in training across businessesand to describe the factors that determine that variation; with the exception of the EOPP survey, the focus has
3
always been on variation In training across individuals. It is the purpose of the current research to shift thefocus of analysis to the company that is making the maining decision.
THE COLUMBIA BUSINESS SCHOOL HUMAN RESOURCES SURVEY
In 1987, the Industrial Relations Research Center of the Columbia Business School conducted asurvey of human resources policies and practices in Americas businesses. A questionnaire was sent to theexecutives responsible for 7,765 business units during the time period covering Fall 1986 through Spring1987. The name and address of the executive in charge of each unit was obtained from the Compustat datafiles.
Response rate. Responses were received from 854 business units (11 percent response rate),although useable data wars received from only 493 business snits (6.4 percent overall response rate).Although this response rate is low, it is not sub:modally different from the response rates obtained byanalysts who conducted much less comprehensive surveys of organizations' Human Resource Management(HRM) policies (for example, see Hitt & Ireland, 1986). The businesses in the Columbia survey are smallerthan those used in the Battelle survey discussed above. Fifty - percent of air businesses have fewer than 900employees; twenty -five percent have fewer than 240 employees. The Battelle survey only included businesseswith at less 1,000 employees and this may, in part, explain why their response rate was so high, we didindeed have a better response rase from larger business units. Responding business units tended to be largerthan non respondents and they reported significantly higher sales, operating income, capital expenditures, assets.and equity than nonrespondenu. The industrial disuibudons of the two groups were very similar.
Data collected. The survey inanunent sent to COMPUSTAT business units elicited detailed datapertaining to 1986 on orpnizations' HRM policies and practices covering various occupational groups (1)managers; (2) unionized and (3) nonunion professional and technical workers; (4) unionized and (5) nonuniorclerical workers; and (6) unionized and (7) nonunion manufacmring and production workers. Information ontraining and development selection, evaluation, and compensation policies; and communication and employeeinvolvement policies was obtained for each of these groups. In addition, the business units providedinformation about their overall human resource planning.
The data from the human resources survey have been merged with the data on the COMPUSTATfiles. Hence, for each of the business units in the survey, we have information on capital expenditures, valueof assets. operating income, research and development expendimres, and net sales. Demographiccharacteristics of the business's employees are proxied by the characteristics of the employees in theorganization's industry and geographic labor market, as reported in the Current Population Survey data. Inaddition, for the business units in the manufacturing sector, we have information on the following attributes ofthe business unit's four-digit SIC category: concentration ratio, value of exports, value of imports, value ofthe capital stock, value of inventories, value of shipments, total factor productivity, energy expenditures, andnumber of employees. Dar, i on these variables are available for the time period 1958-1984 inclusive.
On the subject of employee training and development, the survey asks several questions as theypertain to each of the seven occupational groups. The questions for each of these groups are:
(t) Does your business have a formal employee training and development program?
(2) If yes, when was the program instituted?
(3) If yes, who participates in decisions about the types of training and development programundertaken by your business?
(4) What was the approximate cost of formal training and development programs per employeein your business last year?
What indicators are used to assess employee training and development (e.g., employeeopinions, productivity on the job, cost-benefit analysis)?
5)
4
While our response ram is low relative to those of the survey! %if corporate training programsdiscussed in the previous section, our survey clearly surpasses the others in teams of the wealth of detail thatis available on the company's human resource policies and economic characteristics. As I show in the nextsection of the paper, these data are critical elements of a model of corporate investments in employeetraining. The earlier studies that utilized corporate surveys were not concerned with hypothesis testingregarding variation in the training effort amoss businesses and, hence, could conduct a less intensive datacollection effort while concentrating on maximizing sample size. The Columbia Business School Survey tookan alternative wench, namely, the need to collect a large amount of information from each respondent inorder to be able to systematically study how and why ti;enan resource policies and practices differ acrossAmerican businesses.
Results
Table 1 reports mean values for training questions (1), (3), and (4) above for each of the sevenoccupational groups. Formal training programs are used in one-third to one-half of the businesses in oursample, depending on the occupational soup under study. These training programs have been in existencelonger for unionized employees than for nommic.tized workers. Unfonunattly, data on the cost of formalveining per employee were reported by only a small percentage of the businesses in the sample. However,these data can be utilized to make a rough estimate of the total amount that the average business spent ontraining. Assuming that it had the average number of employees in each employee category, the averagebusiness would have spent about $5.5 million on (mining in 1986. Multiplying this figure by the number ofbusinesses in the COMPUSTAT filet (including those without useable names and addresses for executives)would result in a total expenditure of $55 billion for 1986.
Table 2 provides information on the prevalence of formal training programs across industrycategories. A training index is defined as the sum of the responses to the questions regarding the presence ofa formal training program for the seven occupational categories divided by the sum of seven dummy variablesindicating the presence of employees in each of the seven occupational categories. As Table 2 shows, themean value of the training index is .412, with a low of .083 in the entertainment services industry and a highof .635 in the transportation industry. We also see that retail trade and the finance and insurance industryhave above average values for the training index.
As the data in Table 1 indicated, many companies with formal training programs did not respond tothe question regarding the cost of formal training per employee. Since this variable is particularly importantfor measuring variation in training intensity across business, we need to explore why some businessesanswered chi' question and others did not. In particular, the existence of selectivity bias must be considered.Table 3, where the businesses are divided into four quartiles based on number of employees, provides moredetail ca this issue by showing how the response rate varied across occupation groups and across sizecategories. Each entry in Table 3 shows, for each occupation, the percentage of businesses with a formaltraining program that reported cat of training for that program. The entries in parentheses show thepercentage of businesses with formal trifling programs for that occupation. The data show no clear pattern.While the response rate initially rises with size, it falls off for the very large businesses. Although theselarge organizations are most likely to have formal training programs, they either do not have, or choose not toreport, information on the cost of training. The entries in Table 3 are highly correlated across occupations.In other words, if a company reports training costs for one occupation, it reports it for the others as well.Indeed, the correlations across occupations are all above .75, and, in many cases, exceed .9. This suggeststhat firm characteristics aside from size may be important in explaining the response race.
To test this hypothesis, I estimated a binary logic model on the subset of firms that reported having aformal training program for the particular occupation under study; the depcndent variable equals one if thebusinesses reported cost of training information, and equals zero if it did not (see Table 4). Three categoriesof variables are used. The first describes the economic characteristics of the business unit and includesSIZEthe number of employees; ROAreturn on assets, calculated as the ratio of net income to identifiableassets; and CAPLAB - -the capital-labor ratio, calculated as the ratio of capital expenditures to the number ofemployees. The second category describes the business's human resource policies and includes YRPGMthe
5
year in which the training proviso was instituted: and POLICYan index measuring the degree ofsophistication of the bulbuls' unit's human resource policiee' The third category is a set of industrydummies where the excluded category is fimuice, innuance and real estate? The binary logic results areshown in Table 4 for managers and the duce nonunion =wisdom; sample sizes were too small for theunionized occupational categorise. There is no evidence in Table 4 of any systematic relationship between thebusiness's economic characteristics and the probability of repotting training con information; neither SIZE norROA ha significant effects and CAPLAB is significant in only one equation. Businesses with moresophisticated human resource policies are not more likely to report cost information, and in one case, are evenless likely to report it. The year the training program was instituted is significant in only one case. Finally,the industry variables appear to be the most important in this table. For example, businesses in the retailindustry and in the business services industry are more lately to report cost information than those in thefinance and insurance industry.
DETERMINANTS OF COMPANY TRAThITNG PROGRAMS
In this section of the paper, I show how a simple model can be specified and estimated to explainthe observed variation in the presence of formal employee training programs across the businesses in oursample, Since the purpose of this paper is not to provide a rigorous econometric analysis of corporatetraining activities but rather to provide a new direction for research on training, this analysis is necessarilypreliminary, but suggestive of the way in which corporate survey data can be used
A Basic Framework
Using the assumption that the buinesses in our =mile are profit-maximizers, we can derive severaltestable hypotheses about the determinants of company training expenditures. The company's profits aredefined as gross sales minus wages, training expenditures, and all other expenditures on inputs:
(I) n * - - rK
where P a the price of the product X, X a the quantity of output produced, w the wage rate, L. la thequantity of labor utilized, t training expeadituree per unit of labor. K a composite index of all otherfactors of production, and r a the per unit cost of this composite index.
Maximizing 11 with respect to t, training expenditures per unit of labor, results in the followingcondition:
(2)t L
which simply states that the business will choose that level of t where the marginal return from an additionaldollar spent per worker on paining just equals its marginal con, According to the left-hand side of equation(2), the marginal return from an additional dollar spent per worker will be higher in those businesses wherethe average product of labor is more sensitive to investments in training. Equation (1) can be modified CO
1 The index is defined as follows. The organization receives one point for each yea answer to thefollowing questions: (1) Does the organization have a formal written HRM plan? Does the organizationformally evaluate policies developed in the following HRM areas: (2) Work organization and job design?(3) Employee selection and staffing? (4) Employee training and development? (5) Communication andparticipation programs? (6) Performance appraisal? (7) Compensation? (8) Union-management relations?(9) Employee relations?
' The industry variables are NONDUR -- nondurable manufacturing, CUR--durable manufacturing,TRANSPtransportation, WHTRADEwholesale trade, RETAILretail trade, BUSSERV-- business and repairservices and PERSERV-- personal services.
describe the company's maximization problem as one of maximizing the discounted flow of future profits, Inthis rase, tile marginal return on a current expenditure on training will equal the discounted sum of increasesin dic average product of labor over the expected working life (1 of the company's employees:
(3) TE L a) 1il at LWe can derive several hypotheses about the variation in per worker training expenditures across
businesses by considering which factors are Likely to lad to a greater sensitivity of the average product oflabor to training apenditures. First is the degree of technological change in the firm. Companies that areintroducing new technology need higher levels of human capital in order to implement the u:chnolnity andreap its benefits.
At certain sages In the change process they meet this need by increasing their training. Theproductivity of labor in this type of company will be more sensitive to training because the potential forlearning is greater. A second variable to study is the average tenure of the workers in the company. Asequation (3) indicates, the payoff from training is higher in those companies where employees are likely tostay longer. Third, the role of company size needs to be considered. As the literature review indicated,previous surveys have shown that large companies spend more per employee an formal training than smallcompanies. If tenure is longer, on average, in large companies than small ones, this could explain she role ofsize. If this is not the case, then, according to equation (2), the only way to explain the role of size is toargue that labor productivity is more sensitive to training in large firms than in smaU ones. There are twopossible explanations. The ant is based on the argument that it is more difficult to monitor workerproductivity in large firms. According to this view, training is more critical in large firms than small firms,because workers are more likely to shirk there. A second explanation relies on the notion of public goods.Instead of expressing training expenditures as the product of per worker expenditures and the number ofworkers. we could simply write total training expenditures, T. Then the marginal return from an additionaldollar spent on T will be greater in law firms because a one dollar increase in T will increase theproductivity of all wasters. While this is a somewhat extreme case, it is consistent with a perhaps morerealistic notion that there are 'economies of scale' in the provision of raining one supervisor can teach aclass of trainees and each trainee could learn as much as he would have in a private raining sessionFinally, product competition should play a role in the firm's calculation of the returns to training. Forexample, a company that is facing tough ompetition from domestic competitors or from foreign companiesmay increase its investments in employee training as a way of improving produce quality and loweringproduction cost.
Empirical Specificadon
The hypotheses discussed above are tested on the survey data using two dependent variables: (1) abinary variable that equals one if the business has a formal training and development program, and zerootherwise; and (2) the per worker expenditure on formal employee training and development. Each of thesevariables is measured separately for the seven occupation groups, and then a composite index is created forthe business as a whole. The independent variables are measured as follows.
First, the degree of technological change in the business is measured in several ways. I use theratio of R&D expenditure: to sales (RDRATIO) and the ratio of capital expenditures to the number ofemployees in the business (CAPLAB). These two variables are calculated from the COMPUSTAT files. Thethird way in which the degree of technological change is measured is based on the response to the followingsurvey question: "Is your organization currently using automation (through greater use of personal computers)as a strategy 1.0 improve your position in the marketplace?' Respondents used a scale of one to five toindicate how important this strategy was for their organization (AUTOMATE). The size of the business isobtained directly from the survey responses vi the questions regarding number of workers in eachoccupational category (SIZE). When this was unavailable. information on the number of employees wasobtained from the COMPUSTAT files. The average tenure of employees in the business was not available onthe survey, but was proxied by the response to the following question: To the best of your knowledge, about
7
9
what percentage of your nonentry level jobs have been filled from internal soured in recent years? Thisvariable (INTPROM) should be 'eighty conelated with average tenure, since businesses that rely on internalpromotions will have long tenure employees compared to businesses that him from the outside. The variationin the extent to which the businesses screen job candidates may also play a role in the decision to train.Presumably, organizations that benefit ham trained ViOrkefl will screen applicants more carefully in order toreduce training cods, A variable measuring whether or not job candidates ate required to take a written orother formal test of shill (SCREEN) is used and is expected to be positively caretated with training.
Information an product competition is only available for the businesses in the manufacturing sectorand refers to the four-digit SIC category of which the business it a member. Hence. these variables are notspecific to the business itself and can only serve u a rough proxy for the business's true characterisdcs. Thefirst, the concentration ratio in the industry (CRATTO), is a measure of the extent of domestic competition.There are two problems with this variable. First, the latest dam for which it is available is 1982, and,second, it can be argued that even in industries with high concentration radar, dm degree of competitionbetween the leaders in the industry can be very intense. The second variable, the ratio of the value ofimports in the industry to the value of shipments (IMPRATIO), is used to measure the degree of foreigncompetition that the domestic firms face.
Results
Table S contains the results of estimating a binary logic model where the dependent variable equalsone if the business reported that it had a formal training and development program for the particularoccupational group under may, and zero otherwise. The predictions of the model are generally confirmed.The three indicators of technological change, LCAPLAB, RDRATIO, and AUTOMATE, are always positive,but only LCAPLAB is significant. The size of the business, LSIZE, is always positive and is significant insix of the seven equations. Unfortunately, whether this is due to the "shirking' problem or to economies ofscale in the provision of training cannot be determined. The proxy for average tenure of employees.INTPROM, the proportion of nonentry jobs that are filled through internal sources, is positive and significantfor all employee groups except etched'. This could reflect the reduced importance of specific training forthis group. Finally, SCREEN is positive in all equations and significant in six of them. There appears to bea positive correlation between training and intensity of screening.'
In Table 6, the training index, defined as the sum of the responses to the questions on the presenceof training programs far the seven occupational groups divided by the sum of seven binary variables on thepresence of these occupations, is used as the dependent variable. The advantage of this variable is that all ofthe businesses can be included in the equation. The results in Column (1) show that the three indicators oftechnological change are positive. Although LCAPLAB is still the only one that is significant, the effects ofRDRATIO and AUTOMATE on the training index are reasniably close to significance. The weak effects inthe clisaggregated analyses become stronger when the groups are merged. The other variables, LSIZE,SCREEN, and INTPROM remain positive and significant in this framework. Columns (2) and (3) show theresults of estimating the training index equation on the sample of businesses in the manufacturing industry.The main difference here is that LCAPLAB is no longer significant' The two product market variables aretried alternatively in columns (2) and (3) but neither is significant.
Finally, Table 7 reports the results of estimating equations on the per worker cost of formal trainingprograms. As can be seen, the samples are extremely small here, and were even smaller for the excludedoccupation groups. In column (5), the dependent variable is a training cost index which is an average of theresponses to the four training cost questions. The results in this table arc very weak and indicate that trainingcost data of the type collected in the Columbia Business School Survey may be very unreliable. The factthat the predictions of the model were borne out for the binary dependent variable but not for the cost
Barron, et al. (1988) observed the same result in their analysis of the EOPP data set.
This is not because of the inclusion of CRATIO or L'aRATIO. When the column (1) specificationwas estimated for the manufacturing businesses, LCAPLAB was not significant.
8
10
variable indicates that the businesses in our sample may have been unable 10 calculate accurately the costs offormal training.
SUMMARY AND DIRECTIONS FOR FURTHER RESEARCH
This paper has argued the importance of utilizing corporate survey data to study invesumets inemployee training and development. 11 review of previous research showed that most studies of traiuingrely on data provided by individuals and therefore focus on the variation in raining sans individuals and itsimpacts on their career advancement. Although economic models of rifting decisions am framed in terms ofa company's calculation of the cow and benefits of such paining, empirical work has never been able to testthis model direcdy on company behavior. The dam collected from prior mrveys of corporate alining havenot been suitable for hypothesis testing because these surveys neglected to obtain information on economiccharacteristics that are impalas elements of a model of employee alining.
The Columbia Business School Human Resources Survey is much better suited to an analysis of thevariation in training across U.S. business& It has the significant advantage of providing the researcher withdetailed information on the company's human resource policies and its economic characteristics as was shownabove in Determinants of Company Training Programs, this type of information is essential for hypothesistesting regarding the factors that explain why some companies are more likely to invest in training thanothers. On the subject of employee training, the survey collected information on (1) whether or not thebusiness had a fennel employee training and development progam; and (2) the approximate cost of formaltraining and development programs per employee in the year prior to the survey. The results from the surveyshow that businesses will respond to (parka (1), but only 4011 of those businesses with a formal trainingprogram responded to the cost questicia. My analysis of the determinants of responding showed that therewas no clear pattern; the probability of responding was not significantly correlated with any economiccharacteristics or human resource policies of the business units.
The econometric analysis of the determinants of the vitiation in training across businesses showedthat the predictions of the behavioral model were supported when the binary dependent variable was utilized.For example, large business* those with high capital-labor race, and those with a high proportion ofinternal promotions were more likely to have formal training programs. In the case of the cost measure,however, the model performed poorly. This, in conjunction with the low response rate for the cost question,suggests that the cost question may not be suitable for obtaining information on the training effort in U.S.businesses. Indeed, this analysis has already led to ow making plans to conduct a follow-up survey ofrespondents in order to obtain alternative measures of the extent of training. We plan to experiment withquestions regarding the number of hours spent by various personnel in training a newly hired worker as wellas the number of months that elapse between the date of hire and the date at which the individual isconsidered "fully trained,"
9
11
References
Barron, L, Black, D. and Lowenstein, M., "Employer Size: The Implications for Search, Training, CapitalInvestments, Starting Wages and Wage Growth," Journal of Labor Economics, January 1987.
"Job Max ltIng and On-die-Job Training." February 1988.
Brown, James, "Are Those Paid Mae Really No More Productive? Measuring the Relative Importance ofTenure as On-the-Job Training in Explaining Wage Growth," Princeton Industrial Relates Papers,1983.
Burke, Michael L and Russell R. Day, "A Cumulative Study of the Effectiveness of Managerial Training,"Journal of Applied Psychology, 1986, Vol. 71. No. 2.
Carnevale, Anthony, The Learning Eno. Ase: A Report on the Size and Scope of Training," Training andDevelopment Journal, January 1986.
Hitt, Michael A. and R. Duane Ireland, "Relationships among Corporate Level Distinctive Competencies,Diversification Strategy, Corporate Structure and Performance," Journal of Management Studies,July 1986.
Ingols, Cynthia A., "Management Education: Articulating the Unspoken, Riding the Herd, Wasting Money, orPreparing for Tomorrow?" in Leslie S. May, Carol Ann Moore and Stephen J. Zammit, eds.,Evaluating Rusin= and Industry Training, Kluwer Academic Publishers, Boston, 1987.
Lillard, Lee and Hong Tan, "Private Sector Training: Who Gets It and What Are Its Effects?", RandMonograph R- 3331- DOL/RC, 1986.
Lusterman, Seymour, Education in Industry, The Conference Board, 1977.
Trends in Corporate Education and Training, The Conference Board, 1985.
Lynch, Lisa, "Private Sector Training and Its Impact on the Career NM= of Young Workers," unpublishedpaper, Massachuseas litstitute of Technology, October 1988.
Mincer, Jacob, "Union Effects: Wages, Turnover, and Job Training," in Research in Labor Economics, 1983.
"Job Training, Wage Growth and Labor Turnover," unpublished paper, Columbia University,November 1987.
Pergamit, M. and J. Shack-Marquez, "Earnings and Different Types of Training," mimeo, Bureau of LaborStatistics and Board of Governors of the Federal Reserve, 1986.
Russell, James, S., James R. Terborg and Mary L Powers, "Organizational Performance and OrganizationalLevel Training and Support," Personnel Psychology, 1985.
Saari, Lise M., Terry IL Johnson, Steven D. McLaughlin and Denise M. Zimmerie, "A Survey ofManagement Training and Education Practices in U.S. Companies," Personnel Psychcic,y,Winter 1988.
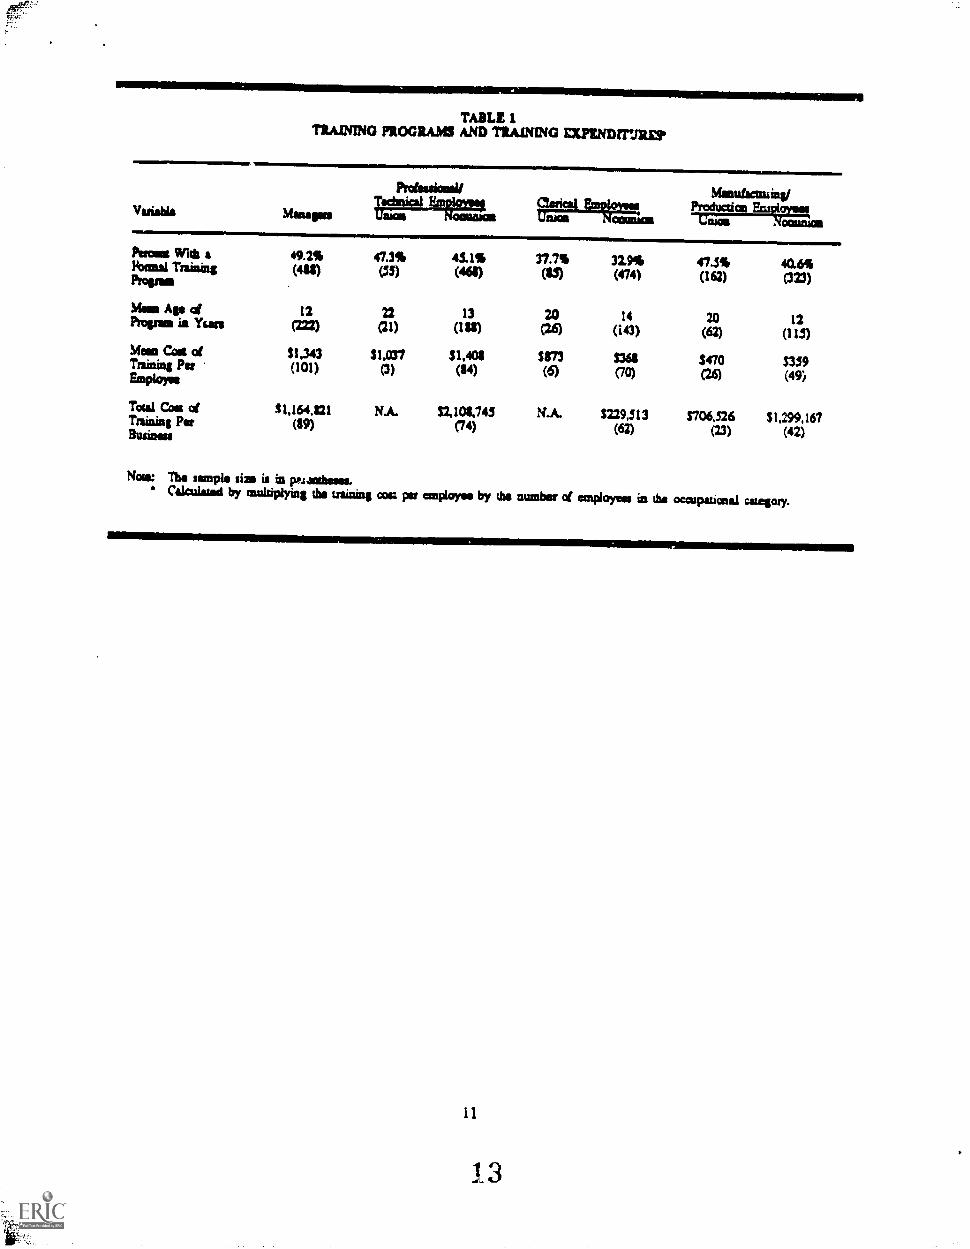
TABLE 1TRAINING PROGRAMS AND TRAINING EXPINDfrast
Ptciassimmll
Variable Mumps ascetesPerces With a 49.2% 47.3% 45.1%Formal Training (05) (46$)Prelims
Maas Ap of 12 n 13Previa in Asa (2n) al) (1 a)
Mew Con of $1,343 $1,037 $1,4011Train* Pet (101) (3) (84)&Vlore
Total Con of $1,164,1121 N.A. S2,104,745Triali81$ Pat (89) (74)&ulnas
eioa ant=aaNIsmtsfaansias/
Productias Et11011121Voice minks
37.7% 32.9% 47.5%(474) (162)
20as)
$871(6)
40.6%0123)
14 20 12(143) (62) (115)
s368 $470 $359(70) (26) (49)
N.A. S729,513 $706,526 $1,299,167(62) (23) (42)
Nose: The sample size is in pr4antbeses.Calculated by multiplying the inkling con par employes by tba number of employees in the ocavaiond category.
11
13
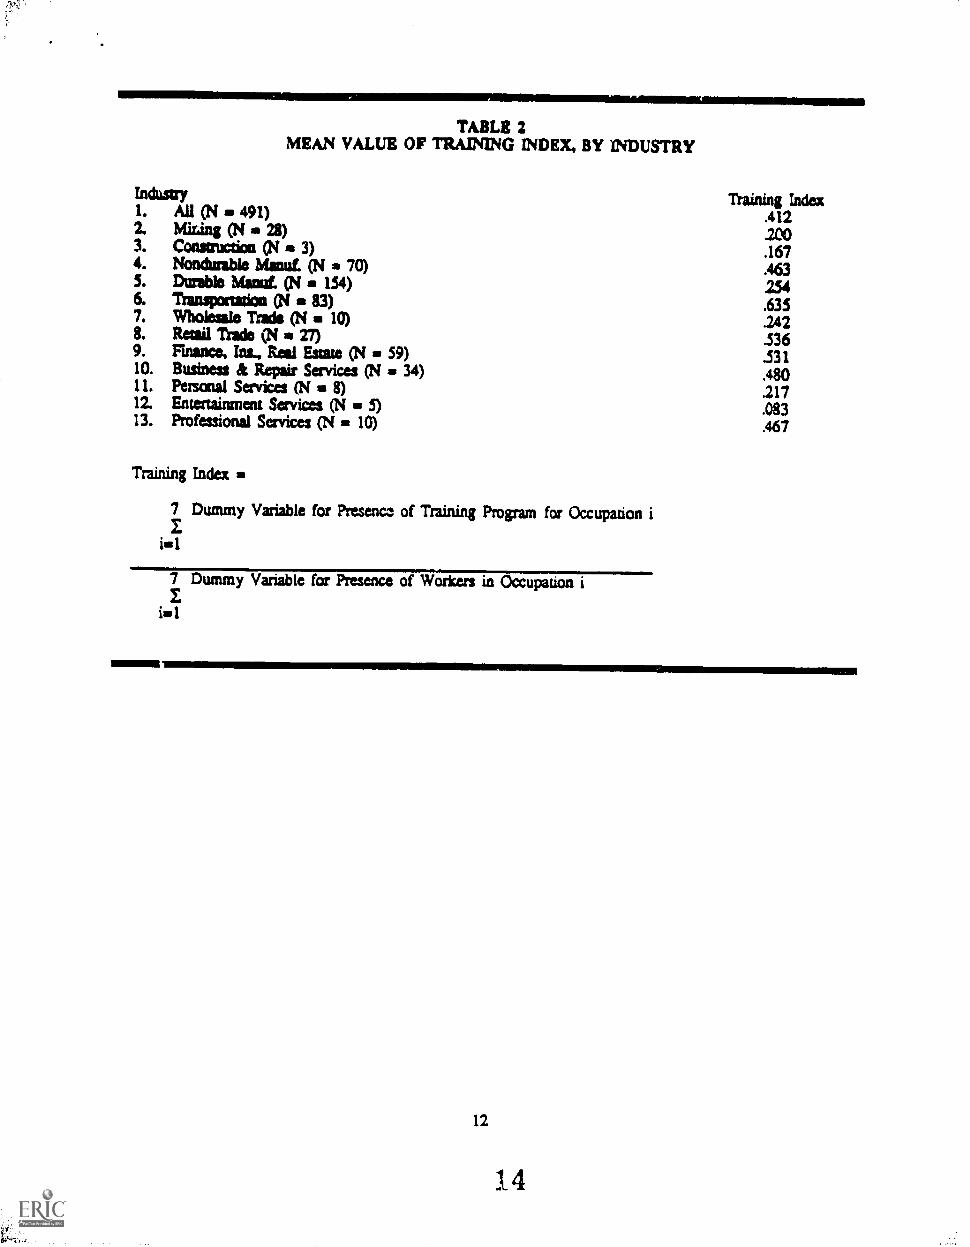
TABLE 2MEAN VALUE OF TRAJNING INDEX, BY INDUSTRY
Industry Training Index1. All (N 491) .4122. Miring (N 28) .2003. Construction (N - 3) .1674. Nondurable ManuL (N 70) .4635. Durable Mena (N 154) 2546. Transportation (N 83) .6357. Wholesale Tide (N 10) .2428. Retail Trade (N is 27) .5369. Finance, Ins., Real Estate (N 59) .53110. Business & Repair Services (N 34) .48011. Personal Services (N 8) 21712. Entertainment Services (N in 5) .08313. Professional Services (N = 10) .467
Training Index
7 Dummy Variable for Presence of Training Program for Occupation iIingl
7 Dummy Variable for Presence of Workers in Occupation iZ
iml
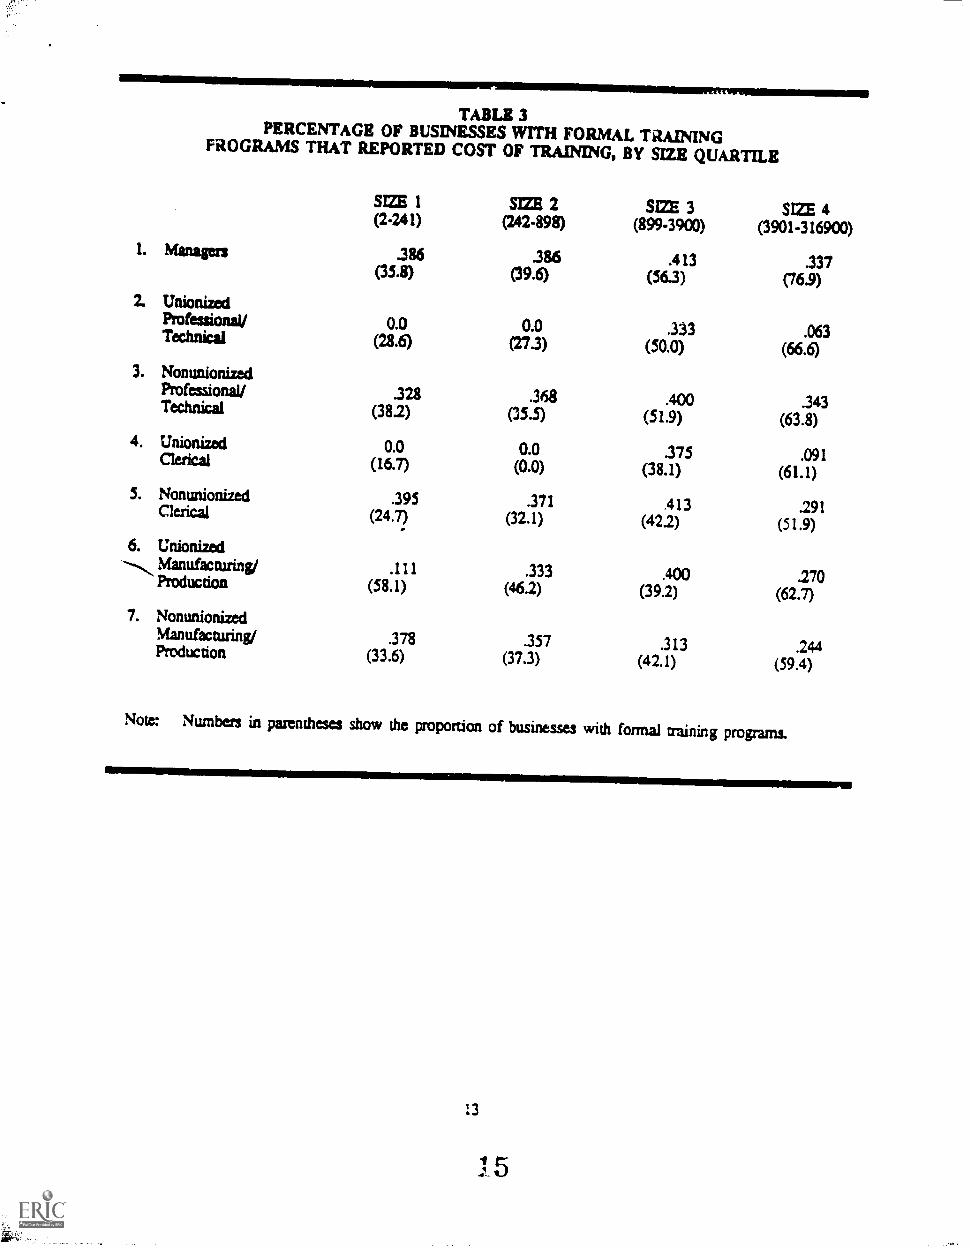
TABLE 3PERCENTAGE OF BUSINESSES WITH FORMAL TRAINING
PROGRAMS THAT REPORTED COST OF TRAINING, BY SIZE QUARTILE
SITE 1(2. 241)
SIZE 2(242-898)
SUE 3(899.3900)
SIZE 4(3901-316900)
1. Managers .386 .386 .413 .337(35.8) (39.6) (56.3) (76.9)
2. UnionizedProfessional/ 0.0 0.0 .333 .063Technical (28.6) (213) (50.0) (66.6)
3. NonunionizedProfessional/ .328 .368 .400 .343Technical (38.2) (35.5) (51.9) (63.8)
4. Unionized 0.0 0.0 .375 .091Clerical (16.7) (0.0) (38.1) (61.1)5. Nonunionized .395 .371 413 .291Clerical (24.7) (32.1) (42.2) (51.9)6. Unionized
---..... Manufacturing/ .111 .333 .400 .270Production (58.1) (462) (39.2) (62.7)7. Nonunionized
Manufacturing,/ .378 .357 .313 .244Production (33.6) (37.3) (42.1) (59.4)
Note: Numbers in parentheses show the proportion of businesses with formal training programs.
111111111111M,=1=11111111EMNIIMIIIIMII
13
4
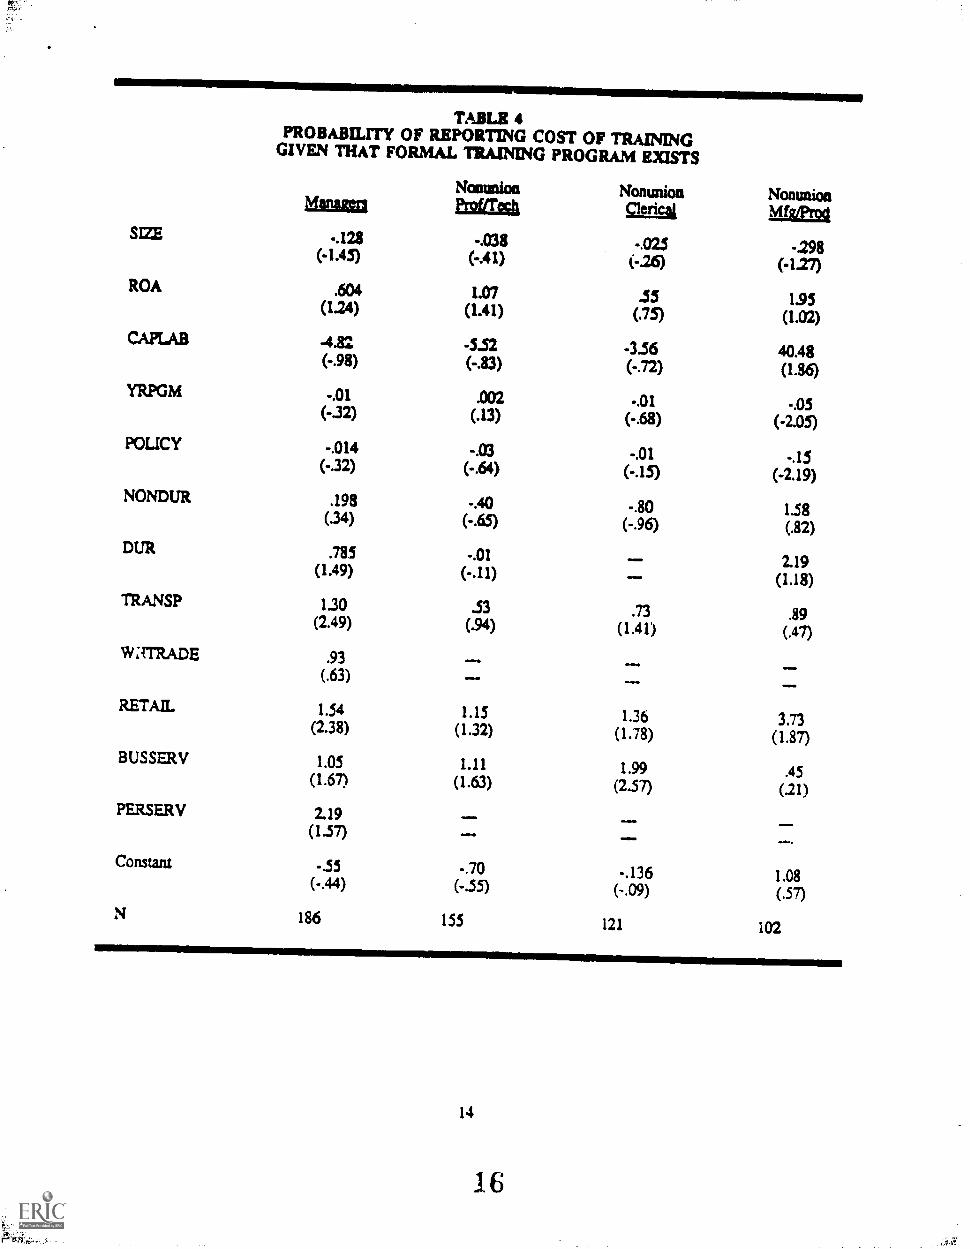
TABLE 4PROBABILITY OF REPORTING COST OF TRAINING
GIVEN THAT FORMAL TRAINING PROGRAM EXISTS
Munn Nonunion NonunionCIericak
Nontmionkliaold
SIZE -.128 -.038 -.025 -298(4.45) (-.41) (-26) (-127)ROA .604 1.07 .55 1.95(124) (1.41) (.75) (1.02)
CAPLAB 4.82 -5-52 -156 40.48(-.98) (-.83) (-.72) (136)
YRPGM -.01 .002 -.01 -.05(-32) (.13) (-.68) (-2.05)
POLICY -.014 -.03 -.01 -.15(-.32) (-.64) (-.15) (-2.19)NONDUR .198 -.40 -.80 1.58(34) (-.65) ( -.96) (.82)DUR .785 -.01 - 2.19(1.49) (-.11) - (1.18)TIIANSP 130 .53 .73 .89(2.49) (.94) (1.41) (.47)
lisi;TTRADE .93 - N.Mie 1(.63) =.10
RETAIL 1.54 1.15 1.36 3.73(2.38) (1.32) (1.78) (1.87)BUSSERV 1.05 1.11 1.99 .45(1.67) (1.63) (2.57) (.21)PERSERV 2.19
=.111.0.=NOM
(1.57)
Constant -.55 -.70 -.136 1.08(-.44) (-.55) (-.09) (.57)
N 186 155 121 102
14
16
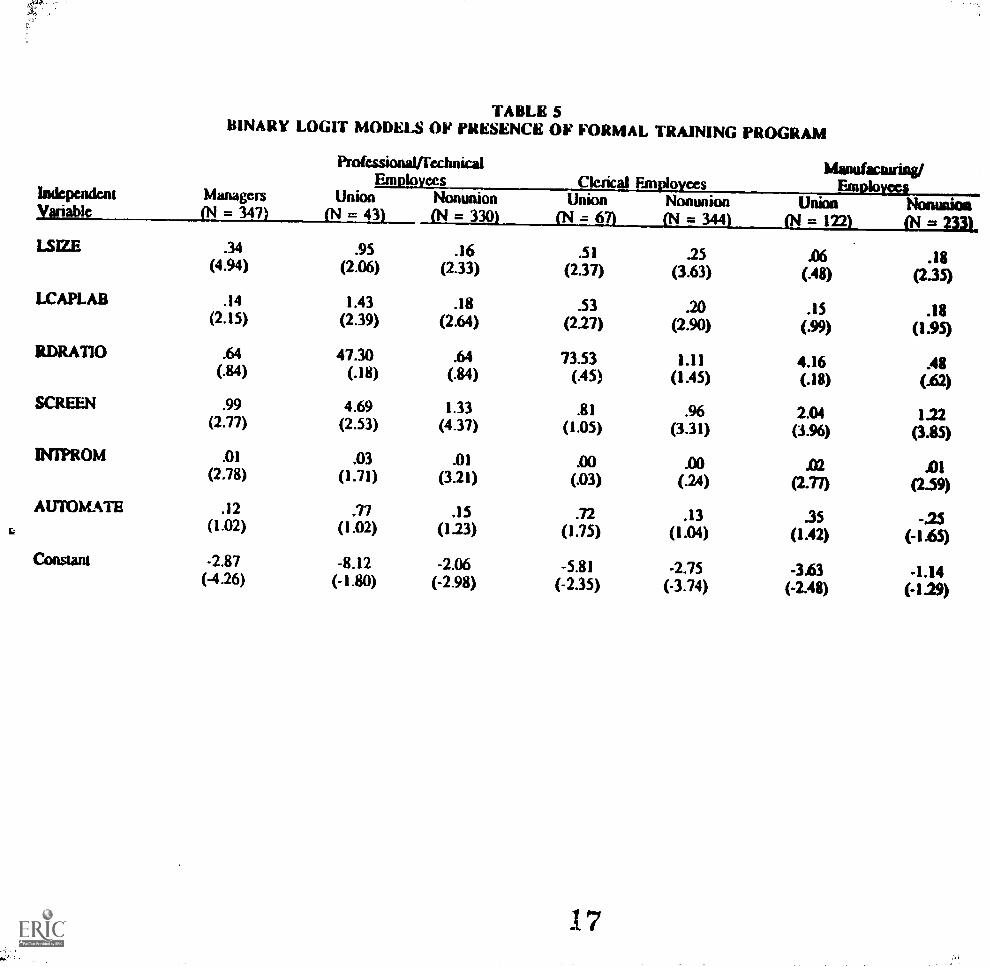
TABLE 5BINARY LoGrr MODELS OF PRESENCE OF FORMAL TRAINING PROGRAM
Professional/Technical Manufacnuing/Employees Clerical Employees 'EmployeesIndependent Managers Union Nonunion Union Nonunion Union NonunionVariable (N = 347) = 43)
22- )ESIZE .34 .95 .16 .51 .25 .06 .18(4.94) (2.06) (2.33) (2.37) (3.63) (.48) (2-35)LCAPLAB .14 1.43 .18 .53 .20 .15 .18(2.15) (2.39) (2.64) (2.27) (2.90) (99) (1.95)
itDRA710 .64 47.30 .64 73.53 1.11 4.16 .48(.84) (.18) (.84) (.45) (1.45) (.18) (-62)SCREEN .99 4.69 1.33 .81 .96 2.04 1.22(2.77) (2.53) (4.37) (1.05) (3.31) (3.96) (3.85)
IN1PROM .01 .03 .01 .00 .00 .02 Al(2.78) (1.71) (3.21) (.03) (.24) (2.77) (2.59)
AUTOMATE .12 .77 .15 .72 .13 .35 -.25(1.02) (1.02) (1.23) (1.75) (1.04) (1.42) (-1.65)
Constant -2.87 -8.12 -2.06 -5.81 -2.75 -3.63 -1.14(-4.26) (-1.80) (-2.98) (-2.35) (-3.74) (-2.48) (-1.29)
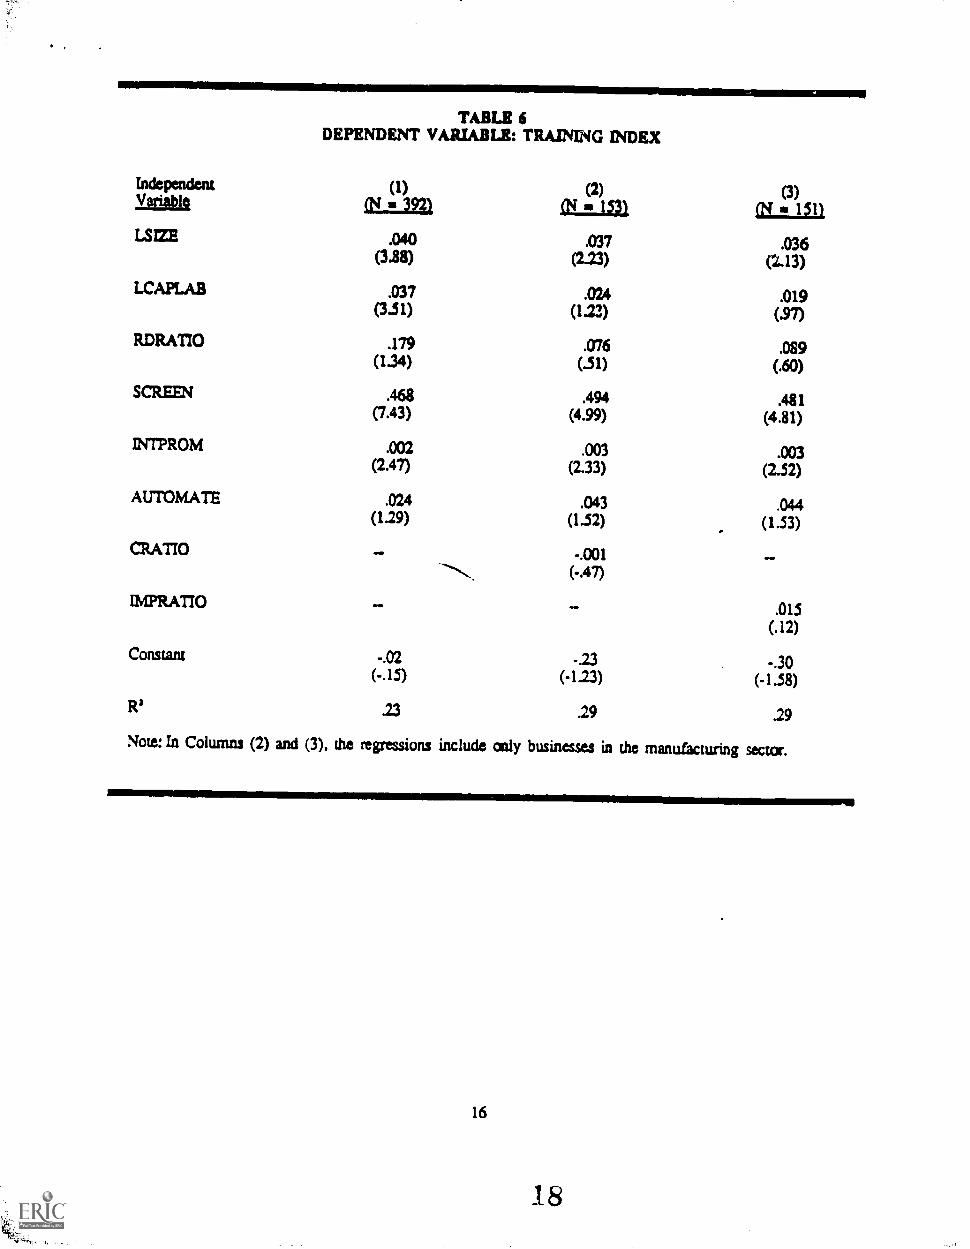
TABLE 6DEPENDENT VARIABLE: TRAINING Dam
Independent (1) (2) (3)balt = 3921 1531 (N 111)
LS2E .040 .037 .036(3.88) C2-23) (2.13)
LCAPLAB .037 .024 .019(3.51) (1.33) (.97)
RDRATIO .179 .076 .089(1.34) (.51) (.60)
SCREEN .468 .494 .481(7.43) (4.99) (4.81)
INTPROM .002 .003 .003(2.47) (2.33) (2.52)
AUTOMATE .024 .043 .044(1.29) (1.52) (1.53)
CRATIO wiNt -.001( -.47)
IMPRATIO .015(.12)
Constant -.02 -.23 -.30( -.15) (-123) (-1.58)
.23 .29 .29
Note: In Columns (2) and (3), the regressions include only businesses in the manufacturing sector.
16
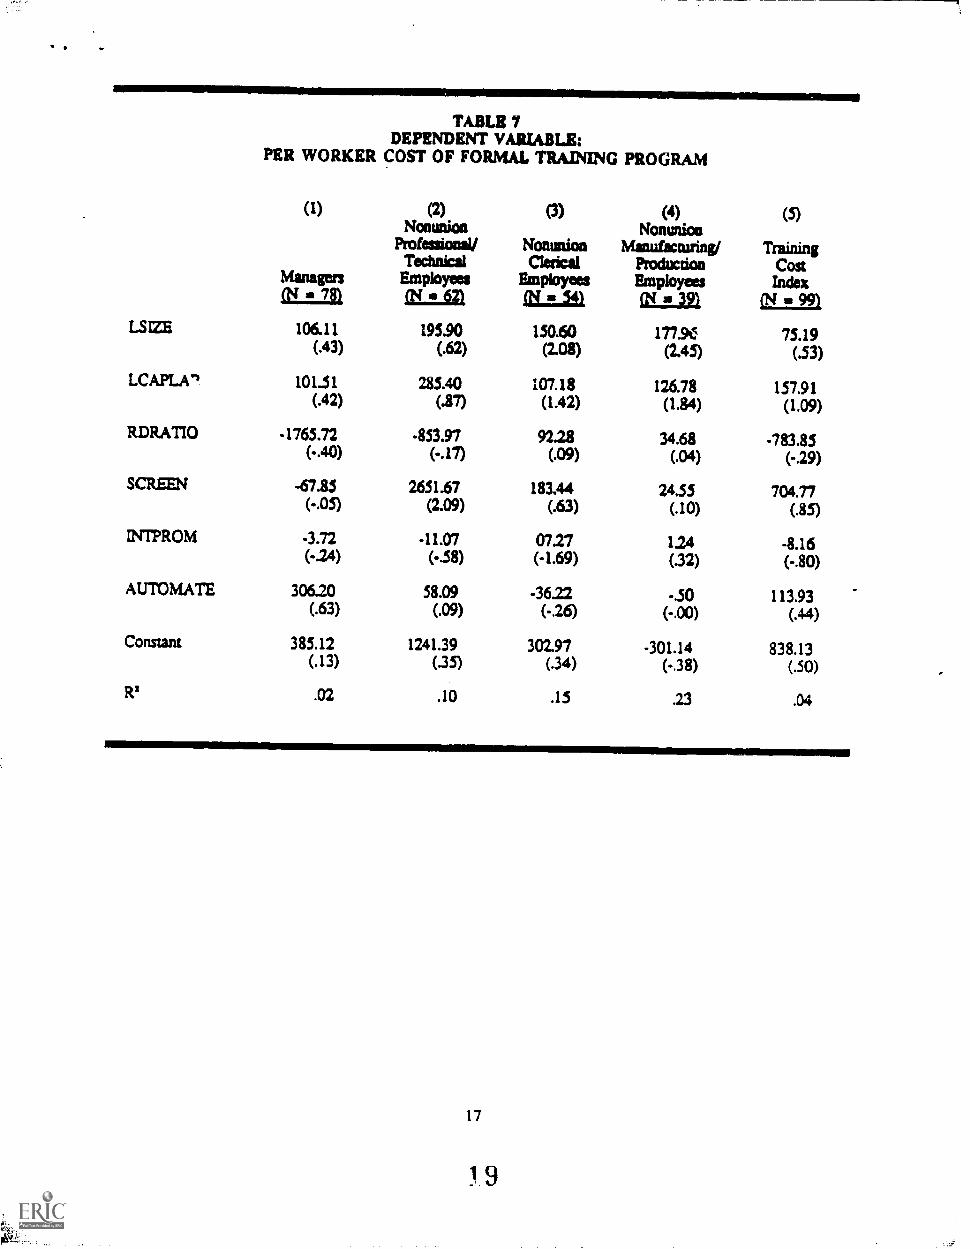
TABLE 7DEPENDENT VARIABLE:
PER WORKER COST OF FORMAL TRAINING PROGRAM
(1)
Managers
(2)Nonunion
Professional/Technical
Employeesg4 41 621
(3)
NonunionClerical
Employees
(4)Nonunion
Manufacturing/ProductionEmployeesa
(5)
TrainingCostIndex
a ...us.22)
106.11 195.90 150.60 177.911 75.19LS(.43) (.62) (2.08) (2.45) (.53)
LCAPLA71 101.51 285.40 107.18 126.78 157.91(.42) (.87) (1.42) (1.84) (1.09)
RDRATIO -1765.72 -853.97 92.28 34.68 -783.85(-AO) (-.17) (.09) (.04) (-.29)
SCREEN -67.85 2651.67 183.44 24.55 704.77(-.05) (2.09) (.63) (.10) (.85)
INTPROM -3.72 -11.07 0727 124 -8.16(-.24) (-.58) (-1.69) (.32) (-.80)
AUTOMATE 30620 58.09 -3622 -.50 113.93(.63) (.09) ( -.26) (-.00) (.44)
Constant 385.12 1241.39 302.97 -301.14 838.13(.13) (35) (.34) (..38) (.50)
11.2 .02 .10 .15 .23 .04
17
1.9