Embed Size (px)
Citation preview

ED 025 430By-Hive ly. Wells, 11Programmed Correspondence Courses in Algebra and Geometry for Inservice Teacher Training: Field Studies.
Final Report.Minnesota State Dept. of Education. St. Paul. Minnesota National Laboratory.Spons Agency-Office of Education (DHEW). Washington. D.C. Bureau of Research.
Bureau No- BR- 5-0924Pub Date Aug 68Contract- OEC 6-10-134Note- 155p.EDRS Price MF-S0.75 HC-S7.85Descriptors- *Algebra Curriculum. Effective Teaching. *Geometry. Grade 9. Grade 10. Grade 11. Inservice
Teacher Education Mathematics. Mathematics Teachers. Programed Instruction. *Secondary School
Mathematics. Teacher EducationThis longitudinal study is one of a series which is devoted to the task of
evaluating new, secondary school mathematics curricula. This series of studies hasinvolved ninth and eleventh grade teachers teaching a new mathematics curriculum
(School Mathematics Study Group. University of Illinois Committee on SchoolMathematics. or Ball State Program) in schools in five state (Minnesota. North andSouth Dakota. Iowa. and Wisconsin). While teaching the new curricula, some of theteachers were provided with an in-service training course in foundations of modernalgebra. This report concerns attempts (1) to separate the effects on studentperformance attributable to the new curricula from effects attributable to theteachers. and (2) to relate differences in teacher effectiveness to differences insubject matter knowledge as measured by performance in the in-service trainingcourse. Among the findings reported are (1) teacher effects tended to dominatecurriculum effects. and (2) relations were found between gains of classes andgeneral measures of teachers' subject-matter competence. (RP)
DOCUMENT RESUME
24 SE 005 860

FINAL REPORTBureau No. 5-0924
Contract No. OE 6-10-134
PROGRAMMED CORRESPONDENCE COURSES IN ALGEBRA AND GEOMETRY
FOR INSERVICE TEACHER TRAINING: FIELD STUDIES
E D025430
August, 1968
U.S. DEPARTMENT OFHEALTH, EDUCATION, AND WELFARE
Office of EducationBureau of Research
U.S. DEPARTMENT OF HEALTH, EDUCATION & WELFARE
OFFICE OF EDUCATION
THIS DOCUMENT HAS SEENREPRODUCED EXACTLY AS RECEIVED FROM THE
PERSON OR ORGANIZATION ORIGINATING IT. POINTS OF VIEW OR OPINIONS
STATED DO NOT NECESSARILYREPRESENT OFFICIAL OFFICE OF EDUCATION
POSITION OR POLICY.

PROGRAMMED CORRESPONDENCE COURSES IN ALGEBRA AND GEOMETRY
FOR INSERVICE TEACHER TRAINING: FIELD STUDIES
Bureau No. 5-0924-Contract No. OE 6-10-134
Wells Hively II
August, 1968
The research reported herein was performed pursuant to a
contract with the Office of Education, U. S. Department
of Health, Education, and Welfare. Contractors undertak-
ing such projects under Government sponsorship are encour-
aged to express freely their professional judgment in the
conduct of the project. Points of view or opinions stated
do not, therefore, necessarily represent official Office
of Education position or policy.
Minnesota National LaboratoryMinnesota State Department of Education
Saint Paul, Minnesota

CONTENTS
ACKNOWLEDGEMENTS
INTRODUCTION 1
CHAPTER 1A Study of the Relative Effectiveness of High School Algebra
Teachers in Relation to Measures of Their Proficiency in Founda-
tions of Modern Algebra
Method 5
Results 11
Discussion 15
Conclusions 16
CHAPTER 2Responses of High School Geometry Teachers to a Programmed
Correspondence Course in Foundations of Modern Geometry 18
CHAPTER 3Content Analysis of the Programmed Course in Algebra for
12,achers in Relation to Modern High School Curriculum Material . 21
RECOMMENDATIONS 0 0 4 0 23
SUMMARY 25
REFERENCES 26
LIST OF FIGURES
FIGURE PAGE
1. Geographic Distribution of Project Participants: 1961-62
through 1965-66 29
2. Frequency Distribution of Pretest Median Scores for 9thGrade Classes in 1961 (Conventional curricula only) 30
3. Frequency Distributions of Pretest Median Scores for 9thgrade Classes in 1962 31
4. Frequency Distributions of Pretest Median Scores for 9thGrade Classes in 1963 32
5. Frequency Distributions of Pretest Median Scores for 9th
Grade Classes in 1964 33
Frequency Distributions of Pretest Median Scores for llthGrade Classes in 1961 (Conventional curricula only) 314

LIST OF FIGURESFIGURE PAGE
7. Frequency Distributions of Pretest Median Scores for llthGrade Classes in 1962 35
Frequency Dtstributions of Pretest Median Scores for llthGrade Classes in 1963 36
9. Frequency Distributions of Pretest Median Scores for llthGrade Classes in 1964 37
TABLELIST OF TABLES
PAGE
1. Number of gth and llth Grade Classes in Five-State Projectby Year, Phase, Grade, and Curriculum 38
2. Oreanization of Content in Two Editions of the ProgrammedCourse in Algebra for Teachers 39
3. Summary of Data from Which Posttest Regressions on STEPPretest Were Calculated 40
4. Relative Stability of Median Pretest Scores for ClassesTaught by the Same Teachers. in Consecutive Years 41
Medians of Median Pretest Scores for Classes Taught bythe Same Teachers in Consecutive Years 42
6. Pretest Scores of Classes Taught by Teachers Who Did andDid Not Volunteer for the Algebra Course in 1963-64 43
Pretest Scqyes of Classes Taught by Teachers Who Did andDid Not Return the First Unit in 1964-65 44
8. Correlations between Teachers' Scores and Median PretestScores of Their Classes in the Same Academic Year 45
9. Correlations between Teachers' Working Times and MedianPretest Scores of Their Classes in the Same Academic Year. . . 46
10. Relative Stability of Median Posttest Deviation Scores(STEP) for Classes Taught by the Same Teachers in Con-secutive Years 47
11. Medians of Median Posttest Deviation Scores (STEP) forClasses Taught by the Same Teachers in Consecutive Years . . . 48
12. Posttest Deviation Scores (STEP) of Classes Taught byTeachers Who Did and Did Not Volunteer for the AlgebraCourse in 1963-64 149

LIST OF TABLES
TABLE PAGE
13. Posttest Deviation Scores (STEP) of Classes Taught byTeachers Who Did and Did Not Return the First Unit in
1964-65
14. Correlations between Teachers' Scores and Median Posttest
Deviation Scores (STEP) of Their Classes in the Same
Academic Year
15. Correlations between Teachers' Workiiag Times and Median
Posttest Deviation Scores (STEP) of Their Classes in the
Same Academic Year
16. Relative Stability of Median Posttest Deviation Scores Ob-
tained from MNL Tests for Classes Taught by the Same Teachers
in 1964-65 and 1965-66
50
51
52
53
17. Relative Stability of Median Posttest Deviation Scores Ob-
tained from MNL Tests for Classes Taught by the Same Teachers
in 1964-65 and 1965-66, within Experimental Curricula 53
18. Correlations of Median Posttest Deviation Scores Obtained
from MNL Tests for Experimental and Coni!rentional Classes
Taught by the Same Teachers 54
19. Posttest Deviation Scores (MNL) of Classes Taught by Teachers
Who Did and Did Not Return the First Unit in 1964-65 54
20. Correlations between Teachers' Scores in 1964-65 and Median
Posttest Deviation Scores (MNL) of Their Classes in the
Same Year
21. Correlations between Teachers' Working Times in 1964-65 and
Median Posttest Deviation Scores (MNL) of Their Classes in
the Same Year
55
55
22. Rank-Order Correlations between Teachers' Scores in 19 64-65
and Median Posttest Deviation Scores of Their Classes in
1965-66 56
23. Rank-Order Correlations between Teachers' Working Times in
1964-65 and Median Posttest Deviation Scores of Their
Classes in 19 65-66 56
24. Correlations between Teachers' Scores in 1964-65 and Median
Posttest Deviation Scores (MNL) of Upper and Lower AbilityStudents.in Their Classes in the Same Year. 57
25. Correlations between Teachers' Working Times in 1964-65 and
Median Posttest Deviation Scores (MNL) of Upper and Lower
Ability Students in Their Classes in the Same Year 57
iv

LIST OF TABLES
TABLE
26. Numbers of Tenth-grade Teachers Returning Each Unit of
the Programmed Correspondence.Course in Geometry, Novem-
ber, 1965 to April, 1967
APPENDIX AClasses taught by 9th and llth grade teachers during each
year of their participation in the Five-State Project A-1
APPENDIX BMinnesota National Laboratory Mathematics Tests for grades
Nine and Eleven
APPENDIX CContingencies in content between Minnesota National Labora-
tory Course in Algebra for Teachers and: 1) Dolciani, M. P.,
Berman, S. L., & Freilich, J. Modern Alg,pbra, Book One. Boston:
Houghton Mifflin, 1962. 2) Dolciani, M. P., Berman, S. L., &
Wooton, W. Modern Algebra and Trigonometry, Book Two, Boston:
Houghton.Mifflin, 1963 C-1

ACKNOWLEDGEMENTS
The contributions of the following people are gratefully
acknowledged:
Paul C. Rosenbloom, who conceived the project.
The teachers who participated in it.
The cooperating State Supervisors of Mathematics in NorthDakota, South Dakota, Minnesota, Iowa, and Wisconsin.
Philip Carlson, who carried out the content analyses for
Chapter Three.
Mrs. Sara H. Page, who carried the main burden of the dataanalysis and edited the report.
Miss Mary Tiller, who typed it.
Members of the Minnesota National Laboratory staff, who gaveconsultation, particularly. James J. Ryan, and Ronald Weitzman.
vi
"1Y', . ',MTV%

14.
INTRODUCTION
This study is one of a series, carried out by the Minnesota
National Laboratory since 1961, devoted to evaluating the major,
new, secondary-school mathematics curricula. This series of studies
has involved teachers in Minnesota, North Dakota, South Dakota, Iowa,
and Wisconsin, and has therefore come to be called the "Five-State
Project". Other reports in the series include Ericksen & Ryan, 1966;
Kraft, 1963; Ryan, 1966, 1968a, 1968b; Ryan & Rising, 1966a, 1966b;
Wright, 1967.
The practical problem to which the present study was directed.is
as follows. How do the characteristics of mathematics teachers cur-
rently in service affect the introduction of new mathematics curricula?
Specifically, what is the role of the teachers' knowledge of the foun-
dations of the modern subject matter? A sizeable sample of ninth and
eleventh-grade mathematics teachers in the Upper Midwest was followed
as they began to teach a new curriculum (SMSG, Illinois, or Ball State),
and their classes were tested for several consecutive years. At the
same time, some of the teachers were furnished with an inservice-train-
ing course in foundations of modern algebra. This report concerns at-
tempts to separate the effects on student performance attributable to
the new curricula from effects attributable to the teachers, and to re-
late differences in teacher effectiveness to differences in subject-
matter knowledge as measured by performance on the inservice-training
course. The longitudinal nature of the study made it possible, in ad-
dition, to estimate the effects of experience with a new curriculum on
the teachers' effectiveness with the same materials in later years, and
also (since some teachers continued to teach a "conventional" class aswell) to estimate the effects of experience with a new curriculum on
the teachers' effectiveness with conventional materials./ An attempt
was made to estimate the effects of the program of inserVice-training
itself upon the effectiveness of the teachers, but that turned out to
be impossible within the limits of the procedures used.
A companion study was planned, utilizing an inservice-training
course in foundations of modern geometry, but, for reasons outlined
in Chapter Two, sufficient data could not be gathered on teachers'
performances in the geometry course to provide interpreteae correla-
tions with the performances of students.
The research program was based on a rather traditional concept
of "curriculum materials" and of the role of a teacher in a self-con-
tained classroom. The curriculum materials are thought of as syllabi
which suggest, but do not specify completely, the activities of the
teacher and the students. The teacher is expected to "follow" the
text but to modify and supplement as he sees fit. This arrangement
represents a midpoint on the range between a purely programmed, or self-
instruction, curriculum (where there would be few teacher effects) and
a situation in which each teacher concocts his own course materials
,

(where teacher effects would be maximized). The current trend in cur-
riculum research and development is away from this general, teacher-
syllabus situation toward systems of instruction in which more speci-
fic roles of the teacher are defined in relation to the roles of speci-
fic materials and devices. In the latter context, research on teacher
effectiveness tends to focus upon specialized teacher roles rather than
on the search for the "ideal teacher"(c.f. Getzels and Jackson, 1963,
p.533). However, the teacher-syllabus situation typifies current educa-
tional practice in secondary mathematics and is likely to continue to
do so for some time to come. Therefore, it is important to assess what-
ever global effects may be operating in this situation, to provide school
administrators information to guide them in introducing new mathematics
programs and in selecting and training teachers to teach them, as well
as to guide the allocation of resources for further curriculum develop-
ment and teacher training. If, for example, one found little difference
among curricula in their effects on student performance but large and
stable differences among teachers, one might be tempted to step up
activities in selection and training of teachers. If, on the other hand,
the effects of curricula were large and teacher differences small, or if
teacher effects diminished quickly with experience, one might be tempted
to distribute promising curricula widely without worrying too much about
related problems of teacher preparation. If neither curricula nor teach-
ers had pronounced and consistent effects (a not uncommon finding in ed-
ucational research) one might reason that a more prr2cise specification
of the activities composing the curricula is needed, along the lines of a
"systems" approach.
For typical discussions of teacher and curriculum effects in re-
lation to new mathematics and science programs see the Review of Educa-
tional Research, Vol 34, No. 3, June 1964; also the conference report
edited by Rosenbloom (1964). For an excellent review of the literature
and a description of the line of thinking leading up to the present
series of studies see Torrance et al. (1966).
Related Research
The following reviews and critical analyses of the literature on
characteristics of teachers were found especially useful: Ackerman (1954),
Barr (1948), Biddle and Ellena (1964), Castetter, Standlee, and Fattu
(1954), Domas and Tiedeman (1950), Gage (1963), Gage and Unruh (1967),
Getzels and Jackson (1963), LeFevre (1967), Mitzel and Gross (1956), Ra-
binowitz and Travers (1953), Remmers et al. (1953), and Watters (1954).
The present study falls into the "criterion-of-effectiveness paradigm"
as distinguished from the "teaching-process paradigm" by Gage (1963). That
is, knowledge of the foundations of modern algebra is conceived to be a
relatively stable, measurable characteristic of teachers which manifests
itself in a variety of actions appropriate to a variety of situations. No
attempt is made to observe what the teachers actually do with their-stu-
dents: measures of the hypothetical characteristic are simply correlated
with measures of student performance. Previous studies of this type have
not been notably informative. There are at least three possible reasons

why: (1) the generality of the effects studied; (2) the lack of longi-
tudinal studies; and (3) inadequacy of the measures used.
In summarizing his 1963 review, Gage concluded:
we developAt theimply that,in terms of
ft...we may make better progress if'micro-criteria' of effectiveness.very least, such an approach would
effectiveness be sharply specifiedsubject matter and grade level."
Despite this recommendation, our review of the literature since 1960
turned up only nine studies of teacher effectiveness which were specif-
ically directed to mathematics. Of these, studies utilizing direct
measures of teadhers' subject-matter competence were found only at the
elementary-school level.
Weak and conflicting findings from the secondary-school surveys
of Leonhardt (1963) and Sparks (1960) tend to support Rosenbloom's
(1961) claim that information taken from mathematics-teachers' records
(training institutions, course credits, years of experience, etc.) is
of little or no use in predicting relative effectiveness. Studies by
Clark (1968) and Lampela (1966), in which teachers were given tests of
mathematics achievement, showed no correlations with students' mathe-
matics achievement in grades 2, 4, 5, 6, and 7. However, Bassham (1962)
found significant positive correlations between measures of teachers'
knowledge of mathematics and students' gains in sixth grade. Dickens
(1966) and Hand (1967) found that inservice-training in modern mathe-
matics for elementary school teachers had no effect upon pupil achieve-
ment. However, Houston and DeVault (1963) found positive correlations
between teachers' gains in an inservice program and gains of their
students. There is little in these studies, however, which may be gener-
alized to the new, high-school, mathematics programs.
Despite the enormous literature on teacher characteristics, and
the implicit assumption that these characteristics are relatively
stable over time, we found only one study in which mathematics teachers
were followed for more than one year. Kraft (1963) found that gains on
the STEP test did not provide stable indices of relative teacher ef-
fectiveness in grades 10, 11, and 12 across successive years (a finding
which was confirmed in the present study).
In the entire literature, we succeeded in finding only one other
longitudinal study of relative teacher effectiveness (Morsh, Burgess,
& Smith, 1956). Before putting much faith in correlations of teacher
characteristics with measures of teachers' effectiveness, it seems rea-
sonable to ask how stable are the measured differences in teachers'
effectiveness under particular field conditions. The closely related
problem of developing adequate measures of student (and teacher) subject-
matter knowledge is discussed at some length in later sections of this
report.
3

Chapter 1
A STUDY OF THE RELATIVE EFFECTIVENESS OF HIGH SCHOOL ALGEBRA TEACHERS IN
RELATION TO MEASURES OF THEIR PROFICIENCY IN FOUNDATIONS OF MODERN ALGEBRA.
The general purpose of this study was to gather descriptive,
longitudinal data from ninth and eleventh grade classes partici-
pating in the Five-State Project and to look for relationshipsbetween performance of the classes and the subject-matter compe-
tence of the teachers. The following specific questions were ex-
amined:
1. Do some teachers ordinarily have better incoming students
than others? That is, is there some stability from yearto year in the entering ability of mathematics classes
taught by particular teachers in particular schools in
comparison with other teachers in other schools? One
would expect to find relatively.stable differences in
incoming performance due to socio-economic and geographic
selective factors, but the magnitude of these differences
is not known.
2. Is there aw apparent trend in the entering ability of
students in successive years?
3. Do more mathematically able teachers tend to have more
mathematically able students? This might happen, for
eicample, if socio-economic and geographic selectivefactors operated similarly on both students and teachers.
4. Do some teachers consistently teach better than others?
That is do the gains of students in classes taught by
particular teachers tend to be stable from year to yearin relation to the gains of students in classes taught
by other teachers? If stable differences are found are
they related to the curricula used by the teachers?
5. Is there any trend in the gains over successive years?
.An upward trend might be expected, for example, if the
teachers profited from the experience of teaching a modern
curriculum.
Is there any relationship between the teachers' subject
matter competence, as measured by performance on the in-
'service-training course, and their effectiveness as measur-
ed by the gains of their classes?
Note that these questions are interrelated. The overall pattern
is more important than the statistical significance of any particular
set of comparisons.

Method
SamRle of Teachers
The population of ninth and eleventh-grade teachers participating
in the Five-State Project was composed by asking for volunteers from
among teachers in Minnesota, North Dakota, South Dakota, Iowa and Wis-
consin to teach one of four possible modern-mathematics secondary-school
curricula: the SMSG, Illinois, Maryland, and Ball State Programs. The
request for volunteers was sent through the cooperating State Depart-
ments of Education of the neighboring states. A condition upon entry'
was that the teachers should not have taught a "modern" mathematics curz
riculum before. This population was formed in 1961. During the acade-
mic year 1961-62 all teachers continued to teach the "conventional" cur-
riculum then in use at their school while their classes were tested.
During the academic year 1962-63, the teachers were asked to teach a
class using one of the experimental texts while continuing to teach a
class from their conventional text (schools were asked to assign stu-
dents to these two classes at random). Many teachers, however, were
unable to do this and instead taught only an experimental class. In
1963-64 some of the teachers moved up with their classes to the next
grade, teaching either an experimental class or both an experimental
and conventional class as before. Other teachers remained at the same
grade level and taught either experimental or experimental and conven-
tional classes to other groups of incoming students. They continued
to follow this pattern in 1964-65. Approximately 20% of the teachers
discontinued work in the project each year and these were replaced by
additional recruitment as follows. In 1962, a "second phase" of teach-
ers entered the project following the pattern established by the teach-
ers in Phase One. A third phase was added in 1963 and a fourth in 1964.
Table 1 summarizes the participation and Figure 1 shows the geographic
distribution of the participants over the period 1961-62 through 1965-
66. Appendix A lists the year of participation and curricula taught
by each teacher, together with the name and location of his school.
It is important to remember that teachers volunteered to partici-
pate in the project and chose the experimental curricula they would
like to teach. This was basically a naturalistic, rather than an ex-
perimental study.
Measurement of Teacher's Subject-Matter Competence
Content of the inservice-training course. The course_of_inservice-
training in foundations of modern algebra (produced under a separate grant.
._ _
from the National Science Foundation) was programmed for self-instruction
-the teiCheis via *the- Coriiiiondence StUditePartmentOf -the
University Rif 'Minnesota:C-riptfon of ff -Content- by
eiráuthoi'Ancel C. Mewborn, Univer6ity of North-Carolina.
.The oourse is designed to raise the level of competence
in algebra of secondary school teachers of mathematics The
content 1ms not chosen with any particular "modern" curriculum
or text in mind; however the main factor in the choice of topics
5

was the relevance of these topics to material usuallY
taught in high school algebra. .The course is keyed
more closely to the content of high school algebra,i.e., to the algebra of the real number system, than
are most courses designed for teacher training. Thereis little emphasis on abstract algebraic systems ---groups, rings, fields, etc. --- for their own merit,although examples of these are presented to clarifythe algebraic properties of the real number system.
Considerable emphasis is placed on the logical
structure of algebra. The real number system is de-veloped from a set of axioms, and most of the import-ant properties of the system which are studied in highschool algebra are derived as theorems from the axioms.Much emphasis is placed on the relationships existingbetween various real number properties and on conceptswhich tend to unify, or tie together, these properties.Very little emphasis is placed on the development ofmanipulative skills, since it is assumed that thosetaking the course will already possess these skills.Thus, for example, it is assumed that the student is
able to perform the steps in solving linear or higherdegree polynomial equations, but that he may not fullyunderstand the logical reasoning involved in the pro-
cess. The emphasis is on the logical basis for the
process. One notable exception to the above is inthe solving of inequalities. Here the student is givenconsiderable practice in the manipulative skills in-volved.
A great deal of effort is devoted to teaching thenature of proof in algebra. The student is expectedto learn to construct for himself proofs of many of theeasier theorems. He is also expected to be able to fol-low the steps in proofs of more difficult theorems whenthey are presented to him. The ability to constructproofs is not a primary goal of the course. Thus it is
not so important that the student be able to prove thatif a 0, the equation ax = b has a unique solution asthat he understand how this theorem is related to thetheorem that the equation a + x = b has a unique solu-tion. Having the student construct proofs of these twotheorems is regarded as an effective technique for teach-ing him this relation.
No separate treatment is given to logic or logicalreasoning in connection with the construction of proofs.The few essential ideas of logic are worked into the
basic material. For example, instead of a detailed treat-ment of "proof by contradiction", examples of this kind

1,10,4,415%
of proof are given and the essential details of the nature
of such a proof are pointed out in connection with the ex-
amples. Within reasonable bounds, emphasis is placed on
preciseness in formulating definitions and in stating
theorems.
The course begins with a brief discussion of sets, re-
lations, and functions. The algebra of sets -- unions., inter-
section, complementation, etc. -- is not considered essential for
the-development-of high school algebra and is-not included
in the course. A relation is defined as a set of ordered
pairs, and a function is defined as a special kind of re-
lation. These notions are illustrated by numerous examples
taken from high school algebra and, in some instances, high
school geometry. Many of these examples are used to illus-
trate how functions and relations may be defined by equa-
tions and inequalities. The method of defining a function
by specifying its domain and a rule of correspondence is
emphasized.
A rather detailed development of the real nudber sys-
tem is given, beginning with the field axioms for the real
numbers._ Examples of_algebraic systems different from-the realiEiring Aiy of tfé1èThitfo-
ducèd to help clarify these propertids: Or-def.-axioms for
the real number system are introduced and an extended
discussion of inequalities and absolute values, based on
these axioms, is included. Finally, the completeness of
the system of real nudbers is given by the least upper bound
axiom. This is used to give a precise meaning to infinite
decimal expansions.
Following the development of the real numbers separate
treatments are given to the natural numbers, integers, and
rational numbers. Each of these is defined axiomatically
as a subsystem of the real number system. Included is an
extensive discussion of mathematical induction.
The complex nudbers are defined in terms of real num-
bers. In this, as in earlier sections, there is a strong
geometric orientation.
After a brief discussion of the algebra of real func-
tions on a set there is an extensive treatment of polyno-
mials. Here there is great emphasis on the unique factor-
ization properties which are introduced earlier in connect-
ion with the system of integers. The parallel existing be-
tween the domain of integers and the domain of real poly-
nomials is emphasized.
7

In the part of the course farthest removed from the
usual high school curriculum some elementary properties
of equivalence relations and groups are derived. This is
the only place in the course where a type of algebraic
system is treated, to any appreciable degree, abstractly(i.e., outside the context of some particular example).
Finally, it should be emphasized that the course is
designed for the teacher of algebra to help clarify for
him the foundations of high school algebra. The presen-
tation is not considered appropriate for the high school
student, nor is the course appropriate as a model for the
design of a high school algebra course. It is hoped that
the increased understanding gained from this course will
help the teacher to utilize more effectively one of the
existing texts designed for a high school course.
Two versions of the course were administered: the first during
the academic year 1963-64 and the second, revised version during the
academic year 1964-65. (A report of the development and evaluation
of the course is available from the Minnesota Academy of Science,
3100 38th Avenue South, Minneapolis, Minnesota 55406.) Table 2 pre-
sents a breakdown of the course content in the two versions. Al-
though the content was not substantially changed in the revised ver-
sion it was divided into shorter units of instruction, each followed
by a shorter test, but supplemented by occasional review tests over
larger sections.
Administration of the inservice-training course. Early in the
fall of 1963 a letter was sent to all teachers in Phases One and Two
(see Table 1) asking for volunteers to work on the course. This let-
ter included a short description of the content and indicated that it
would be equivalent to a three quarter-hour, upper-level, college mathe-
matics course. Of the 147 ninth and eleventh-grade teachers then par-
ticipating in Phases One and Two, 76 volunteered. For reasons unre-
lated to the present study these were randomly divided into two groups
stratified according to grade, phase, and experimental curriculum. The
1963 edition of the algebra program was sent to one of these groups and
a letter was sent to members of the other group thanking them for vol-
unteering but telling them that they would receive a revised edition
of the program in 1964. The selected teachers were then sent the first
unit of material. After completing the unit and taking the unit test
they returned both the unit and test to the Correspondence Study Depart-
ment. They were then sent the next unit together with a fresh copy of
the first unit to use for review. The test for the first unit was sent
to a grader and returned with comments. This usually took from one to
two yeeks. This procedure continued until the teacher had finished all
seven units. He was then sent an extensive final examination to take
at home and a shorter final examination to take under the supervision
of his school principal.

In the fall of 1964 the revised edition was sent to all of the
teachers then participating in the Five-State Project who had not al-
ready worked on the 1963 edition. Volunteers were not solicited: the
first unit of the course was simply sent, together with a letter re-
questing the teacher to work on the course as much as possible. The
method of administration was the same as in 1963 except that the first
three units were sent at the same time. When the teacher returned Unit
1 he was sent Unit 4 together with a fresh copy of Unit 1, and so on.
This kept them from having to wait for new materials.
All tests were graded by a member of the team of writers who de-
veloped the course, with the assistance of graduate students in Mathe-
matics at the University of Minnesota.
Specific measures. Several measures were extracted from the per-
formance of teachers on the correspondence course. Because of differ-
ences in course format and administration procedures, these measures
are parallel but not exactly the same for the two versions.
1. Volunteering (1963-64). Whether or not a teacher volunteered
to take the course presumably reflects his need for subject-
matter help. (This is a nominal variable consisting of two
categories.)
2. Returns of the first unit (1964-65). This applies only to
teachers in Phases Three and Four who did not have the pre-
vious opportunity to volunteer. It is comparable to volun-
teering except that the teachers were probably able to form
a better judgment of the content and difficialty of the course
from an examination of the first three units. If they did not
elect to work on the course, it could have been either because
they did not feel the need or because the material appeared
too difficult. (Also a nominal variable of two categories.)
3. Score on the test for the first unit (1963). This score re-
flects both mathematical ability and prior training. To the
extent that it correlates with performance on tests over sub-
sequent units in the course, it may be thought of as reflect-
ing the teacher's ability to learn the new material. The
average correlation of the test for the first unit with the
tests for the following five units was .62. (An ordinal scale
of 38 points.)
4. Total score through Test A (1964). This measure is comparable
to the one preceding except that, because the unit tests were
shorter in the revised version, it was necessary to sum across
the first section in order to obtain scores which were relative-
ly reliable as predictors of subsequent performance. The aver-
age intercorrelation of total scores for the four sections of
the 1964 version was .54. (An ordinal scale of 83 points.)

from., Orra
5. Working time on the first unit (1963-64). Each teacher main-tained a log of the time it took to work through each unit ofthe course. In general, working times were uncorrelated withtest performance but rather well intercorrelated in themselves,indicating stable individual differences among the teachrJrs.Working time may thus serve as another possible index of sub-ject matter competence: two teachers may learn essentiallythe sane amount from the course but one may learn fLater thanthe other. The average intercorrelation of working time onthe first unit with working time on the other five units ofthe course was .40. (A ratio scale with units of 30 minutes.)
6. Working time on the first unit (1964-65). This measure isIdentical to the one preceding. The average intercorrelationof working times on the first unit with working times on theother 13 units of the course in 1964 was .70. Note that re-vision of the course increased the reliability of the workingtimes as measures of individual differences while decreasingthe reliability of the test scores. In 1964 there was a slighttendency for long working times to be associated with higherscores. This is reflected in an average correlation for the14 units of .23. (A ratio scale with units of 5 minutes.)
Measures of Student Performance
The classes of each teacher were routinely tested at the begin-ning of the fall and late in the spring with machine-scoreable, grouptésts. The test used in the fall was the mathematics section of theSequential Tests of Educational Progress (STEP). Both the ninth andeleventh grades received Form 2A. These constituted the pretest peas-_ures, reflecting a large component of general mathematics ability.Form 2B of the STEP test was given in the-spiging as-a pinttest duringeach year from 1961 through 1964. This was supplemented in 1964 by aspecial set of tests constructed by the Minnesota National Laboratoryto sample a range of specific modern mathematics content at both theninth and eleventh grade levels. In 1965 revised forms of the Minne-sota National Laboratory tests were given and the STEP posttests werereplaced by the Cooperative Mathematics Tests (COOP). The COOP testsgiven in the ninth grade were Structure of the Number System (Form A)and Algebra I (Form B). Those used in the eleventh grade were Alge-bra II (Form A) and Algebra III (Form A).
Specific measures.
1. Median and range of pretest raw scores for each class. Theseare treated as points on an ordinal scale. (In general, tofacilitate the interpretation of a large number of comparisons,for some of which it was unsafe to assume normal distributionsof scores, the median has been used as the estimate of centraltendency and nonparametric statistics have been applied.)
10
N

2. Median posttest raw scores of classes, corrected for regression
on the STEP pretest. This was done by calculating the regres-sion of each posttest on the pretest, utilizing the scores fromall students in a given grade who had taken a given pair of pre-and posttests, in all years in which that pair of tests was
given. Table 3 lists each of the posttests for which a regres-sion equation was obtained, the years over which the data werepooled, the numbers of students involved, and the equations ob-
tained. These equations were used to predict the median post-test score to be expected from each class, given the median pre-test score, under the assumption that the conditions under whichthey worked were uniform. The deviation of the observed, medianposttest score from the score predicted from the regression equi-
tion was chosen as the best general measure of relative varia-tion in teaching conditions. A class taught by a particularlyeffective teacher (or an effective curriculum) would be expect-ed to yield a large positive deviation score. These scores arealso treated as points on an ordinal scale.
Results
Pretest Data
Distributions and relative stability. Figures 2 through 9 show thedistributions of pretest scores for classes taught by ninth and eleventh-grade teachers during the period 1961-62 through 1964-65. By using Ap-pendix A one can examine the relationship between entering ability andgeographic location.
Table 4 shows the relative stability of pretest scores for classestaught by the same teachers in consecutive years. The groups were formedby taking the largest number of ninth-grade conventional classes taughtby the same teacher in two consecutive years (9C-2) and for three consecu-tive years (9C-3); then doing the same thing for the ninth-grade experi-mental classes (9E-2, 9E-3), and so on for the eleventh grade. With theexception of the eleventh-grade conventional classes there was consider-able stability in the rank ordering of the classes by pretest scoresacross consecutive years. Some teachers did ordinarily have better in-coming students than others.
Trends. Table 5 shows the group trends in pretest scores in termsof the median of the class medians obtained in each year. In both ninthand eleventh-grade groups there was little variation and no apparent trendacross years.
Relation of teacher characteristics to pretest scores. In Table 6the median pretest scores of classes taught during the academic year1963-64, by teachers who volunteered for the inservice-training coursein algebra, are compared with those of classes taught by teachers whodid not volunteer. In Table 7 the median pretest scores of classes taughtduring the academic year 1964-65, by teachers who returned at least thefirst unit of the course, are compared with those of classes taught byteachers who did not return any units. There were no significant dif-
11

ferences or systematic patterns in either year: teachers' interest
in the inservice-training course does not appear to have been re-
lated to the entering ability of their classes.
Table 8 shows Correlations between teachers' scores on the firstunits of the inservice-training course and the median pretest scoresof their classes, for those teachers who worked on the course in either
1963-64 or 1964-65. Table 9 shows similar correlations using theteachers' working times on the first unit. None of the correlations
in either table are significant. In general, there were no systematicrelationships between these measures of teachers' subject-matter com-petence and the entering ability of their students. Within the rangeof ability represented by the teachers who chose to work on the in-
service-training course, there is no evidence that more mathematicallyable teachers tended to have more nmthematically able students.
Posttest Data Obtained from the STEP Tests
Relative stability. Table 10 shows the relative stabiliti ofposttest deviation scores for classes taught by the same teachers inconsecutive years, utilizing the same groups as in Table 4. A compar-ison of these tables shows that the posttest deviation scores (which
are supposed to reflect systematic effects of instruction) were much
less stable than the pretest scores. As measured by the STEP te:A,few teachers consistently taught better than others. This was the casedespite the fact that, in this analysis, differences among teachers wereconfounded with differences in curricula (within experimental and con-ventional groups).
Trends. Table 11 shows the group trends in posttest deviationscores on the STEP test, utilizing the same groups presented in Table 5.Since the curricula used by the teachers remained the same during thesesuccessive years, changes in the deviation scores may be interpreted asrough indices of changes in the teachers' effectiveness. (Although
some teachers may not have taught consistently better than others, allof them might have become more effective through experience with thenew curricula.) The trend for ninth-grade conventional classes wasdownward, but that for the experimental classes was upward. No system-atic trends were apparent in the eleventh grade.
Relations of teacher characteristics to deviation scores. In Table12 the median posttest deviation scores of classes taught during theacademic year 1963-64, by teachers who volunteered for the inservice-training course, are compared with those classes taught by teachers whodid not volunteer. In Table 13 the median posttest deviation scores ofclasses taught during the academic year 1964-65, by teachers who return-ed at least the first unit are compared with those of classes taught Ivteachers who did not return any units. In group 9C, teachers who didnot volunteer for the inservice-training course had classes who achievedsignificantly more.than classes of teachers who volunteered. This find-
ing (which is plausible in that the volunteers might be accurately ex-pressing their need) was not supported by the overall.pattern of groupdifferences. In general teachers' interest in the inservice-training
1 , ,
12

course was not very systematically related to their effectiveness in
teaching either conventional or experimental curricula, as measuredby the STEP test.
Table 14 shows correlations between teachers' scores on the firstunits of the inservice-training course and the posttest deviationscores of their classes. The correlations were symmetrically distri-buted around zero. Within the range of teachers who chose to work onthe inservice-training course there was no relation between this mea-sure of subject-matter competence and effectiveness as measured by the
STEP tests.
Table 15 shows correlations between teachers' working times onthe first unit of the inservice-training course and the posttest devia-tion scores of their classes. These correlations were low, but system-atically negative, indicating a mild relationship in which more rapidprogress through the inservice-training course was associated with great-er effectiveness.
Posttest Data Obtained from the Minnesota National Laboratory Tests
-
Relative stability.. Tests especially constructed by the MinnesotaNational Laboratory (MNL) to sample the content of the modern mathematicsprograms were administered as posttests in the academic year 1964-65 andrevised versions of the same test- were administered again as posttestsin 1965-66. Table 16 shows the relative stability of the deviation scoresobtained from these tests for classes taught by the same teachers in thesetwo consecutive years. Comparison with Table 10 shows that the resultsobtained from the MNL tests were more stable than those obtained from theSTEP test. As measured by the MNL tests, some teachers did teach consis-tently better than others.
In the foregoing table, teacher effects are confounded with the ef-fects of different curricula. Table 17 shows the relative stability ofthe posttest deviation scores obtained from the MNL tests, separately foreach of the experimental curricula. The magnitudes of the correlationcoefficients obtained within curricula were approximately the same as those_ _ _
obtained by pooling across curricula, except in the Illinois program._ _ _ _ _ _ _ _ _ _ _ _ _ _ _The relative stability of the scores appears to have been primarily dueto effects associated with the teachers rather than to effects associatedwith the different curricula.
Another way of looking at the pervasiveness ct the teacher effects,in relation to effects of different curricula, is to correlate the post-test deviation scores for experimental and conventional classes taughtby the same teachers. These data are shown in Table 18. In the ninthgrade, it appears that some teachers taught better than others no matterwhat curriculum they taught. The eleventh-grade data are difficult tointerpret because of the small number of classes involved.
13

Relationshi of teacher characteristics to deviation scores. In
Table 19 the median, posttest deviation scores obtained from the MNLtests from classes taught during the academic year 1964-65 by teacherswho returned at least the first unit of the inservice-training course
are compared with those of classes taught by teachers who did not re-
turn any units. The results are similar to those obtained from theSTEP tests (Table 13) in that no interpretable pattern is apparent.Table 20 shows correlations between teachers' scores on the first units
of the inservice-training course and the median, posttest deviation
scores of their classes obtained from the MNL tests in the same academic
year. A comparison with Table 14 shows that the results from the MNLtests yielded more consistent positive correlations, although none were
significant. Table 21 shows correlations between teachers' workingtimes on the first unit of the course and the median posttest deviationscores of their classes obtained from the MNL tests in the same academic
year. Comparison with Table 15 shows a similar trend toward low negative
correlations.
Relationship of teacher characteristics to posttest _performance of
classes in 1965-66. The correlations presented above were carried out
on measures obtained from teachers and students during the same academic
years. If the characteristics of teachers, measured by their performanceon the inservice-training course were relatively stable, they should yieldsimilar correlational patterns with student achievement in subsequent
years. Table 22 shows correlations of teachers' scores on the firstunits of the inservice-training course (in .1964-65) with the median
posttest deviation scores of their classes in 1965-66. The correlations
show no interpretable pattern: the mild positive trend previously ob-tained (Table 20) did not hold up across the following year.
Table 23 shows similar correlations for teachers' working times onthe first unit of the course. The pattern of negative correlations is
again apparent, and the magnitudes are somewhat greater. Teachers whoworked through the inservice-training course rapidly appeared to havebeen consistently somewhat more effective than those who worked slowly.
Interactions between teacher characteristics and student ability.It is plausible to suppose that a teacher who knows a good deal aboutalgebra might pass more of his knowledge on to upper-ability studentsthan to students of lower ability. Correlations between measures ofteachers' knowledge and students' gains might therefore be higher forupper-ability students than for the class as a whole. Bassham (1962)
found such an effect in elementary-school mathematics. To explore thispossibility, classes were subdivided into upper and lower ability groupsby splitting each class at its median on the pretest. Some separate
correlations were then run for these subgroups. The results for the
MNL tests are shown in Tables 24 and 25.

Table 24 shows correlations between teachers' scores and students'
gains. In 9C and 11E, the correlations for the subgroups mirrored the
correlations for classes as shown in Table 20. In 9E and 11C, the cor--
relations were hisher for the lower-ability subgroups.
Table 25 shows correlations between teachers' working times and
student gains (compare Table 21). In all grades and curricula negative
correlations were larger for the lower-ability subgroups than for those
of upper-ability. Overall, the previously discussed correlations be-
tween the measures of teacher subject-matter competence and student gains
were somewhat greater for lower than for upper-ability students.
The results of this study place a great deal of emphasis upon the
achievement tests constructed by the Minnesota National Laboratory.
Trends obtained from the STEP test tended to agree with those obtained
from the MNL tests, but were less pronounced and stable. An examination
of the items from the MNL tests, copies of which appear in Appendix B,
shows them to be much more directly content-relevant than the items in
the STEP tests. The MNL tests represent a sample of specific knowledge
and skill rather than a test of general problem solving.ability. Thus,
the results of the foregoing studies indicate that some teachers rather
consistently communicate more, relatively specific, subject matter than
others. The fact that these differences among teachers held up across
experimental and*conventional curricula suggests that many teachers were
cgrrying over a considerable amount.of "modern" content into their con-
ventional courses. The fact that the differences were equally pronounc-
ed within the experimental curricula themselves suggests, however, that
it is not so much a matter of carry-over as of domination of curriculum
effects by teacher effects.
The items in the MNL tests had-not been selected according to sta-
tistical criteria (e.g. item-test correlations). Therefore, they.repre-
sent a more heterogeneous variety of skills and abilities than cOmmOnly
found in standardized tests of mathematics achievement. This hetero-
geneity may make them more sensitive to specific teaching conditions.
In general, one can argue that the procedures of statistical item selec-
tion tend to create homogeneous tests, with heavy loadings on basic
mathematical ability, and that such testi are necessarily insensitive
to differences among specific teaching procedures or curricula. Betts
(1935) made this point some time ago, but the problem of content sampling
vs. normative scaling remains a basic unresolved issue in the construction
oftests for curriculum evaluation (see, for example, Review of Educa-
tional Research, VOl. 34, No. 3, June, 1964, p. 302).
It is important to note that the MNL tests were generally diffi-
cult. The means and variances were relatively low. It is possible
that the obtained results represent relatively trivial differences in
specific content which certain teachers typically covered and other
teachers did not. Preliminary analysis of the items reveals no obvi-
ous artifacts of this sort, but further detailed analysis is needed.

The present report is not the place for such an analysis. It is
'hoped that a technical report on these tests will soon be publish-
ed by the Minnesota National Laboratory.
Unfortunately, no longitudinal data were collected with the
COOP tests. It would be interesting to compare the results from
them with the results from the MNL tests. In general, it is unfor-tunate that the bulk of the longitudinal data'vere collected with
the STEP tests. Revisions in the MNL tests made it impossible tofollow trends across the two years in which the tests were given,and therefore the important question of whether a teacher's effec-tiveness may change through exposure to a modern mathematics cur-
riculum could not be examined with anything but the insensitive
STEP test.
Conclusions
The data from the eleventh grade showed less consistent pat-terns than did the data from the ninth grade, partly because ofdifferences in the nuthbers of classes involved. Therefore the fol-lowing conclusions apply most directly to ninth-grade algebra classes.
Stable'differences in the effectiveness of teachers, measuredin terns of a rather direct content sampling of general curriculumgoals, were found. These manifested themselves both in correlationsacross successive years and in correlations'between modern and con-ventional classes taught by the same teachers. The magnitudes ofthese correlations were relatively substantial, when one takes intoconsideration the general noise-level of field studies of this type.
_Mild but consistent relations.were found between measures ofrelative teacher effectiveness and general measures of teachers' sub-ject-matter competence, i.e., the relative speed and thoroughness withwhi6h teachers themselves learned new mathematics content. These re-
lations between relative teacher effectiveness and subject-matter com-petence were somewhat more clearly reflected in the performance oflower-ability students than in those of upper-ability (an unexpected
finding). It was impossible to determine, from these studies, whatother characteristics of the teachers, besides subject-matter com-petence, contributed to the differences in their effectiveness.
The results of these studies say.very little about the .effectsof specific training or experience upon relative teacher effectiveness.Results using the STEP test did not show that experience with a moderncurriculum improved teachers' effectiveness, either in the modern cur-
--riculum itself or in a conventional curriculum. However, the patternof other evidence suggests that the STEP test is insensitive to nearlyall independent variables, Longitudinal, experimental studies incor-porating more effective testing procedures are needed to further invest-igate the effects of specific teacher training or experience.. In gen-eral, the results of these studies suggest that (in the typical teacher-

syllabus situation) emphasis upon selection and training of teachers
is at least as important as the development of new syllabi.
17
ffl'aUtatri41141411454240416,-401,64110WAt...c.,'""--

Chapter 2
RESPONSES OF HIGH SCHOOL GEOMETRY TEACHERS TO A PROGRAMMED
CORRESPONDENCE COURSE IN FOUNDATIONS OF MODERN GEOMETRY.
A. study of the relative effectiveness of tenth-grade geometryteachers, in relation to their performance on a programmed correspon-dence course in foundations of modern geometry, was planned as a com-panion to the foregoing study of ninth and eleventh-grade algebrateachers. However, the programmed course.in geometry turned out tobe too difficult for the sample of teachers to whom it was sent. Toofew teachers succeeded in completing enough units to provide usablemeasures of relative subject-matter competence.
The following is a description of the course written by the sen-ior author, Murray. S. Klamkin Ford !cientific Laboratory. The course
_I(developed under a grant from ihe Naiional Science Foundation) is still,
Undergoing revision.(InfOiniitfoii-ibbilt- if7Millie'cittained from the-iditine'icitli-Academy of Science, 3100 38th:Ave. South; Minneapolis* 6, Minn.)
The course is not designed with any particular text inmind. Topics were chosen mainly foetheir relevance to ma-terial taught in high school geometry. However, a priiaryaim of the course is to treat geometry across a broad fron-tier, indicating its connections with other branches of mathe-matics. Therefore, much material has been included which isnot usually mentioned in a high school geometry course, e.g.,vector geometry; area, volume, and measure; continuity; con-vexity; symmetry; and inequalities and maxima and minima.
A variety of physical motivating material has been in-cluded, wherever possible, in order to enable students toobtain an intuitive "feel" for the basic concepts. Precise-ness in formulating definitions and in stating theorems isstressed, but there has been a conscious attempt to prevent"rigor mortis" from setting in. For example, when provingtheorems in the unit on plane separation the student is ex-pected to make explicit all the steps involving plane separ-ation axioms even if they may be intuitively obvious, but"simple" steps involving material from previous units, maybe sketched in.
The final unit of the course includes a large amount ofmaterial on "Problem Solving a la Polyer. These problemsolving materials, which are intended to be used concurrent-ly with the other units of the course; provide an extensive
18
introduction to problem solving strategies together with awide variety of "open-ended" problems.
A.brief description of the cOntents is as follows:
Unit I
Unit IIUnit III
Unit IV
Unit V
Unit VI
Unit VII
Unit VIII
Unit IX
Unit X
Unit XIUnit XII
IntroductionList of Problems
- IncidenceDistanceBetweenessCollinear SetsPlane SeparationCongruenceAngular MeasureCongruent TrianglesPerpendicular Lines and PlanesGeometric InequalitiesThe Parallel Postulate andLobachevskian GeometryRiemannian GeometryGeometry and Physical SpaceEUclidean GeametryParallel Lines and Planes in Three DimensionsDihedral Angles and Perpendicular PlanesPolygonsInterior and ExteriorPolygonal RegionsPolyhedral AnglesPolyhedra
- Similarity in 2 and 3 DimensionsHomotheticityCircles and SpheresSpherical GeometryGeometrical Constructions
AreaDimensionality and UnitsEquidecomposition and EquicomplementationLimitsVolumeProblem SolvingA. Patterns:
(a) Psychological Blocks(b) Symmetry(c) Relaxation(d) Induction(e) Inequalities and Maxima and Minima(0 Continuity(g) Convexity
Non-Euclidean Geometries
19

..1
B. Philosophy and Applications(a) Orthogonal Projection(b) Conical Projection and Principle of Duality(c) Inversion(d) Equivalence Classe(e) Miscellaneous Tran
of Transform Theory:
sforms
In the fall of 1965 the course wss sent to approximately sixty tenth-grade teachers participating in the Five-S ate Project and also to a sam-ple of 199 tenth-grade teachers from the Five-State Project area, who werenot then participating in the project. The latter sample was chosen as
follows. Announcements were sent (through the cooperating State Depart-ments of Education) to all High School superintendents in the five states.675 teachers applied. Only teachers who were going to be teaching tenth-grade geometry during the 1965-66 ac demic year were considered eligible.There were 465 of these, from which a random sample proportional to thenumber of high school teachers in each state was randomly drawn: 64
teachers from Minnesota, 49 from Iowa, 11 from North Dakota, 11 from SouthDakota, and 64 from Wisconsin.
The course was administerment of the University of Minndescribed for the Programmedbers of teachers returning e
d through the Correspondence Study Depart-esota following a procedure similar to thatCourse in Algebra. Table 26 shows the num-
ach unit from November, 1965 to April, 1967.
20

CONTENT
IN
Chapter 3 .
ANALYSIS OF THE PROGRAMMED COURSE IN ALGEBRA FOR TEACHERS
RELATION TO MODERN, HIGH-SCHOOL CURRICULUM MATERIAL
The research reported in Chapter 1 dealt with very general measuresof teacher subject-matter competence and student performance in algebra.A detailed analysis of these relationships,.in terms of specific conceptsand processes, is badly needed to supplement study of the general rela-tionships. As part of the present project, it was proposed that such ananalysis be initiated by carrying out a detailed study of the connectionsbetween the contents of the Minnesota National Laboratory's Algebra Coursefor Teachers and the contents of one or more of the modern, high-schoolcurricula. It was orginally proposed that this be done with the SMSG,ninth and eleventh-grade algebra courses, but it was decided that a morepractical approach would be to perform the analysis on widely used com-mercial textbooks which paralleled the SMSG courses rather closely. The
textbooks chosen were Modern Algebra: Structure and Method - Book I byDolciani, Berman, and Freilich; and Modern AlBebra: Structure and Method -Book Two by Dolciani, Berman, and Wooton (both published by Houghton-Mifflin).
Appendix C contains the results of this content analysis in the formof tables of contingencies between detailed topic headings in the texts.This analysis was carried out by a member of the writing team for theMinnesota National Laboratory course. The contingencies have been scaledas follows. Where the topics covered were identical Or equivalent,_ _ . _ _ _
the cell in the table representing the interiection was marked with
-the-letter A. -Where the -toiAci Were closely relate-d-, the-cell was Mark=--
èd with the letter B. (Usually this meant that the treatment of the topicwas more general in the course for the teachers than in the course for thechildren.) Where the topics were distantly related, the cell was markedwith the letter C.
Clusters of entries show blocks of mutally related content. By fol-lowing columns in the tables, one can see how particular material in thecourse for the teachers is related to the range of material in the coursesfor the children, and by following rows, one can do the reverse. Summingacross columns and rows is a convenient way of summarizing the generalrelations. Such summaries are presented in Appendix C, pages C-12 -general, the pattern of contingencies shows that most of the material inthe MNL course is related to topics from Dolciani et al., Book 2. The
major exception is Unit 14, on Equivalence Relations and Groups. Othertopics, for which specific contingencies were not recorded, are system-atically related to topics where substantial contingencies were noted.

For example, although "The Algebra of Real F4nctions" and "Polynomial
Functions" were not specifically related to material in Book 2, they
are systematically connected to other material on polynomials which
was.
Although nearly all of the material in the MNL course is related
to material .in Book 2, not all of the material in Book 2 is related
to that in the MNL course. Unrelated topics include exponential func-
tions and logarithms, trigonometric functions, arithmetic and geometric
progressions, and probability.
The contingencies between topics are fewer, and less direct, for
Dolciani et al., Book 1. They are scattered, however, so that few topics
in the course for the teachers and the course for the children are com-
pletely unrelated.
How might a content analysis of this type help in investigating
specific relationships between teacher subject-matter competence and
student performance? Its main function is to aid in constructing tests
and in making predictions. Where a contingency between topics,is cate-
gorized as identical or equivalent (class A), the performance of teachers
and students can be measured with the same test items and correlated in "
a straightforward way: if Teacher X knows the topic and Teacher Y does
not, are the students in Teacher X's class more likely to learn it than
the students in the class taught by Teacher Y?
Where the topics are classified as related, but not equivalent
(class B or class C) there may be two advantages for the teacher who
possesses the more general knowledge. (1) He may be able to explain
or answer questions more precisely than he otherwise would, and be less
inclined to make inappropriate generalizations, mistakes or contra-
dictions. This might result in better performance of his students on
the restricted topics in their curriculum. This possibility may be
tested in a straightforward way: if Teacher X knows more of a given
topic than Teacher Y, do students in his class learn more of a given,
more restricted topic than those in a class of Teacher Y? (2) Knowing
the additional related material may make it possible for the teacher
to "expand" the topic in the curriculum he is teaching, to provide en-
richment to advanced students, and so forth. Testing this possibility
is more complicated, because the teacher is, in effect, altering the
curriculum for some students, and it is necessary to construct new
test materials to cover these possible alterations.
22

RECOMMENDATIONS
The results of the present studies emphasize the importance, forsystematic curriculum development and evaluation, of relatively large,longitudinal studies incorporating continuous development of new mea-
sures. An item for "research planning" was originally included in theproposal for this project to provide for a conference of mathematicians,researchers and educators devoted to the next generation of experimen-
tation along these lines. Staff changes in the Minnesota National Lab-
oratory make such a conference unfeasible at present. Consequently,the following notes are included here for the benefit of those who mightwish to carry on further research and development along these lines.
It now seems most reasonable to begin with a single curriculum,such as is represented by the Dolciani et al. texts, and to deduce,from examination of this curriculum, the important related areas of"higher" mathematics. Following a content-sampling rationale for con-structing achievement tests, the next step would be to create sizabletest-item podas to cover topics in the curriculum, on one hand, and inthe related areas of higher mathematics, on the other. (These should,
of course, cover proof and problem-solving skills as well as routinecontent.) Items could then be drawn from these pools to create testsfor the students and tests for the teachers, each stratified by topic.At the same time, tentative hypotheses of the following form ought tobe developed: if Teacher A does better than Teacher B on Topic C,then students of A should do better than students of B on Topic C'.
In order to control for experience, it would prdbably be wisestto start with first-year teachers and to follow them longitudinallyfrom that time on. It would be necessary to ask the teachers to usethe dhosen curriculum or to carry out experimentation in school sys-tems which had adopted it. With close cooperation of the school sys-tem, it ought to be possible to ask the teachers to subject themselvesroutinely to an examination each year at the beginning of the Fallterm. The students may then be tested at the end of the Spring term,and appropriate correlations computed.
It will be necessary, of course, to control for student ability.This may be done by testing the children at the beginning of the Fallterm with a test of mathematical aptitude (and perhaps also with atest of prerequisites for the specific curriculum). If circumstancespermit, these data might be used to stratify the students acrossteachers' classes. If the practical problems in this are insurmount-able, then a procedure similar to the present regression analysiswould have to be used. It does not seem impossible to set up themechanics for carrying out routine longitudinal studies, following allthe new teachers of mathematics in one or more school systems for aperiod of several years.
23

Special training programs may be introduced into this long-
itudinal context. For example, a selected sample of teachers mightbe contracted to spend the summer working on a course of instructionsimilar to that represented by the MNL Algebra Course. Effects ofthis training could then be assessed on the longitudinal baselineand in comparison with a control group of teachers who were not ex-posed to the same training program. (The most elegant study wouldcompare the results from groups of teachers who were given differentsummer training programs, from which different effects upon studentswere predicted.)
Such a study should certainly incorporate other measures ofteachers and students than those directly derived from content ana-lysis of the curriculum, e.g., attitude and interest inventories,etc. (See Torrance, 1966).
To the extent that the chosen curriculum suggests specializedteachers' roles, this research should concentrate upon measures ofeffectiveness, and characteristics of teachers, specifically relatedto those roles. Longitudinal research of this type ought to involvecontinued, systematic alteration of both the curriculum and the mea-sures in such a way as to provide developmental flexibility coupledwith longitudinal continuity. This is a difficult, but not impos-sible, balance to achieve.
The practical outcome of a research and development program ofthis sort would be the development of inservice-training programsfor teachers geared to specific curricula, texts, or systems of in-struction. Under such a procedure teachers might very well "check-out" or become "certiried" for work with specific curricula in moreor less the same way that airline pilots are certified to fly par-ticular types of aircraft. This research probably ought to be cen-tered in school systems where the mathematics teachers and super-visors can become committed to it, rather than having it superimposedfrom outside. It results in a relatively subtle kind of teacherevaluation in terms of pupil performance.
214

SUMMARY
1,C
Ninth and eleventh-grade mathematics teachers in the Upper_Midwest were followed as they began to teach a new mathematicscurriculum (eitlier SMSG, Illinois, Oi Ball State), lalmi theirclasses were tested for several consecutive years. During thistime some of the teachers were furnished with an inservice-train-ing course in foundations of modern algebra. Attempts were madeto separate the effects on student performance attributable tothe new curricula from effects attributable to the teachers, andto relate differences in teacher effectiveness to differences insubject-matter knowledge as measured by performance on the in-
.
service-training course.
Rank-orders of teachers, in terms of gains made by theirclasses, were significantly correlated across successive years.Some teachers consistently taught more than others did.
Teacher effects tended to dom., te curriculum effects. Whenthe same teachers taught boththeir rank-orders in terms ofsignificantly correlated withby the conventional classes.
modern and conventional classes,gains by the modern classea weretheir rank-orders.in terms of gains
_Mild_but_consistent relations were found between gains of_ _
classes and general measures of teachers' subject-matter compet-ence, viz, the relative speed and thoroughness with which teachersthemselves learned new mathematics content. Surprisingly, theserelations were somewhat more clearly reflected in the performanceof lower-ability students than in those of upper-ability.
The above findings were based mainly on data from a specialset of achievement tests in ninth and eleventh-grade mathematicsprepared by the Minnesota National Laboratory, tests which repre-sent broad samples of modern-mathematics content, rather thanscales of general mathematical ability. Results from the STEPtest (a test of general ability) showed similar, but weaker trends.
A content analysis Of the inservice-training course in alge-bra was carried out in relation to a popular, modern, ninth and-eleventh-grade text series (Dolciani et al.), and a future line ofresearch, based upon such detailed analyses, was proposed.
A companion study of tenth-grade geometry was not carried tocompletion because of difficulties with the inservice-trainingcourse.
25
./1

References
1. Ackerman, W. I. Teacher competence and pupil change. HarvardEducational Review, 1954, 24, 273-289.
2. Barr, A. S. The measurement and prediction of teaching effi-ciency: A summary of investigations. Journal of Experimen-tal Education, 1948, 16, 203-283.
Bassham, H Teacher understanding and pupil efficiency in mathematics_ _ _ _ _ _
A study of relationship._ Arithmetic Teacher, 1962, 9, 383-387._ .
4. Betts, G. L. Pupil achievement and the NS trait in teachers.In H. M. Walker (Ed.), The measurement of teachir4 proficiency.New York: MacMillan, 1935. Pp. 144-237.
Biddle, B. J., and Ellena, W. J. Contemporary research on teachereffectiveness. New York: Holt, Rinehart and Winston, 1964.
Castetter, D. D., Standlee, L. S., and Fattu, N. A. Teachereffectiveness: An annotated bibliography. Bulletin of theInstitute of Educational Research at Indiana University, 1954,1, No. 1.
Clark, J. F. A study of the relative effectiveness of some in-service programs in modern mathematics on second and seventhgrade teachers in nine northeastern California counties. Dis-sertation Abstracts, 1968, 28, 2578A.
8. Dickens, C.H. Effect of in-service training in elementary-schoolmathematics on teachers' understanding and teaching of mathe-matics. Dissertation Abstracts, 1966, 27, 1684A-1685A.
9. Domas, S. J., & Tiedeman, D. V. Teacher competence: An an-notated bibliography. Journal of Experimental Education,1950, 19, 101-218.
10. Ericksen, G. L., & Ryan, J. J. Effects of experimental programson pupil achievement - interim report. Technical report 66-4.St. Paul: Minnesota National Laboratory, State Department ofEducation, November, 1966 (mimeo.)
11. Ferguson, G. A. ponparametric trend analysis. Montreal: McGillUniversity Press, 1965.
12. Gage, N. L. Paradigms for research on teaching. In N. L. Gage(Ed.), Handbook of research on teaching. Chicago: Rand McNally,1963.
13. Gage, N. L. & Unruh, W. R. Theoretical formulations for researchon teaching. Review of Educational Research, 1967, 37, 358-370.

14. Getzels, J. W. & Jackson,
characteristics. In N.
on teaching. Chicago:
P. 14. The teacher's personality and
L. Gage (Ed.), Handbook of researchRand McNally, 1963.
15. Hand, E. F. EvaluatIon of a large-scale mathematics in-serviceinstitute for elementary teachers. Dissertation Abstracts,
1967, 28, 2118k-2119A,
16. Houston, W. R. & DeVault, M. V. Mathematics in-service educa-
tion: Teacher growth increases pupil growth. Arithmetic
Teacher, 1963, 10, 243-247.
17. Kraft, C, H. Student achievement gains as measures of teacher
effectiveness. Technical report Code XXXVIII-B-255. St. Paul:
Minnesota National Laboratory, State Department of Education.
April, 1963. (mimeo.)
18. Lampela, R. M. An investigation of the relationship between teacher
understanding and change in pupil understanding of selected con-cepts in elementary school mathematics. Dissertation Abstracts,
1966, 27, 1549A-1550A.
19. LeFevre, C. Teacher characteristics and careers. Review of Ed-
ucational Research, 1967, 37, 433-447.
20. Leonhardt, E. A. An analysis of selected factors in relation to
high and low achievement in mathematics. Dissertation Abstracts,
1963, 23, 3689-3690.
21. Mitzel, H. E., & Gross, C. F. A critical reviewof pupil growth criteria in studies of teacherDivision of Teacher Education Board of Hi:her
of the developmenteffectiveness.Education of the
City of New York. Research Series, 195 No. 31.
22. Morsh, J. E., Burgess, G. G., & Smith, P. N. Student achievement
as a measure of instructor effectiveness. Journal of EducationalPsychology, 1956, 47, 79-88.
23. Rabinowitz, W., & Travers, R. M. W. Problems of defining and as-
sessing teacher effectiveness. Educational Theory, 1953, 3, 212-
219.
24. Remmers, H. H. (Chairman), Barr, A. S., Bechdolt, B. V., Gage, N. L.,Orleans, J. S., Pace, C. R., & Ryans, D. G. Second Report of the
Committee on Criteria of Teacher Effectiveness. Journal of Educa-
tional Research, 1953, 46, 641-658.
25. Review of Educational Research, 1964, Vol. 34, No. 3.
27
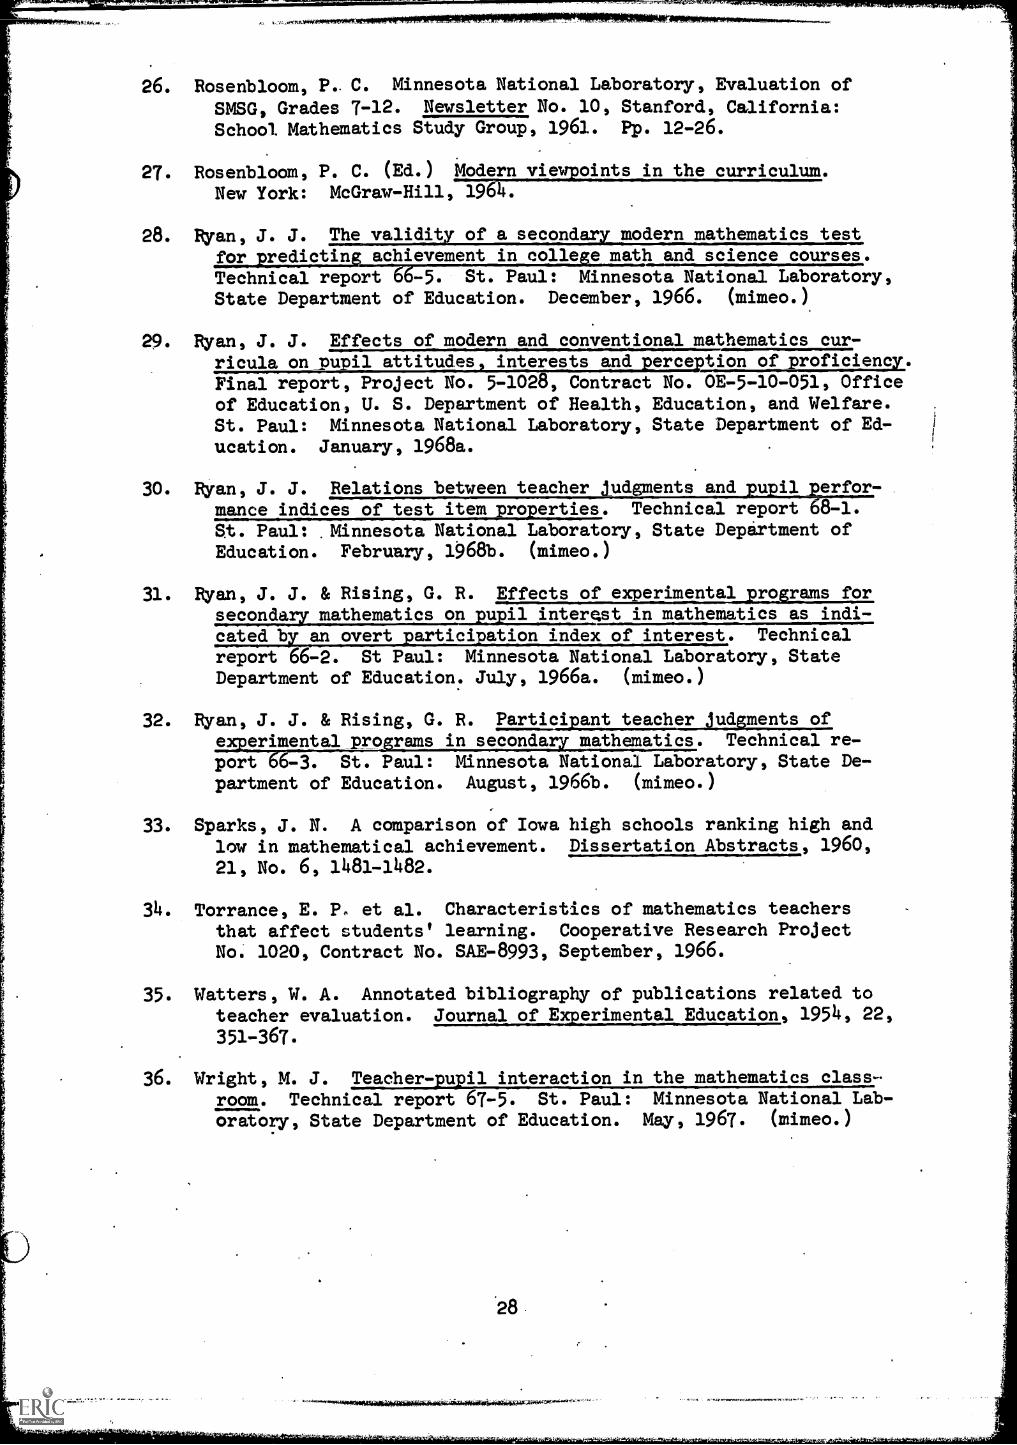
26. Rosenbloom, P. C. Minnesota National Laboratory, Evaluation of
SMSG, Grades 7-12. Newsletter No. 10, Stanford, California:School Mathematics Study Group, 1961. Pp. 12-26.
27. Rosenbloom, P. C. (Ed.) Modern viewpoints in the curriculum.
New York: McGraw-Hill, 7564.
28. Ryan, J. J. The validity of a secondary modern mathematics testfor predicting achievement in college math and science courses.Technical report 66-5. St. Paul: Minnesota National Laboratory,State Department of Education. December, 1966. (mimeo.)
29. Ryan, J. J. Effects of modern and conventional mathematics cur-ricula on pupil attitudes, interests and perception of proficiency.Final report, Project No. 5-1028, Contract No. 0E-5-10-051, Officeof Education, U. S. Department of Health, Education, and Welfare.St. Paul: Minnesota National Laboratory, State Department of Ed-ucation. January, 1968a.
30. Ryan, J. J. Relations between teacher judgments and pupil perfor-mance indices of test item properties. Technical report 68-1.St. Paul: Minnesota National Laboratory, State Department ofEducation. February, 1968b. (mimeo.)
31. Ryan, J. J. & Rising, G. R. Effects of experimental programs forseconda mathematics on u interest in mathematics as indi-cated by an overt participation index of interest. Technicalreport 66-2. St Paul: Minnesota National Laboratory, StateDepartment of Education. July, 1966a. (mimeo.)
32. Ryan, J. J. & Rising, G. R. Participant teacher judgments ofexperimental programs in secondary mathematics. Technical re-port 66-3. St. Paul: Minnesota National Laboratory, State De-partment of Education. August, 1966b. (mimeo.)
33. Sparks, J. N. A comparison of Iowa high schools ranking high andlow in mathematical achievement. Dissertation Abstracts, 1960,21, No. 6, 1481-1482.
34. Torrance, E. P et al. Characteristics of mathematics teachersthat affect students' learning. Cooperative Research ProjectNo. 1020, Contract No. SAE-8993, September, 1966.
35. Watters, W. A. Annotated bibliography of publications related toteacher evaluation. Journal of Experimental Education, 1954, 22,
351-367.
36. Wright, M. J. Teacher-pupil interaction in the mathematics class-roam. Technical report 67-5. St. Paul: Minnesota National Lab-oratory, State Department of Education. May, 1967. (mimeo.)
28

Grand Forks:D
NORTH DAKOTA
49Bismark
MINNESOTA
o
St. VI,
49.494
Minfleapiolis
S.
.WISCONSIN
oPierre
.
SOUTH DAKOTA
Milwaukeg,
NI
Madison...
Vermillion
.
IOWA
Des Moines
.
qr
Iowa City
C)
Fig. 1.
Geographic Distribution of Project Participants,
1961-62 through 1965-66.

399
353
347
343
341
334
329
4o6
425
327
400 4ol
383
348
316
384 357
428
381
340
505
263
418
365 337
385
426
355
324
350
255
377
360
344 325
359
504
331
382
358
349
315
335
235
326
262
328 232
336
376
346
389
410
386
233
266
228
338
229
332
231
226
230
265 227
261
264
234
333
12
13
115
117
18
19
20
21
22
23
225
227
28
29
30
31
32
33
3
Median Raw Score of Class on STEP Pretest (Form 2A)
Fig. 2.
Frequency distribution of pretest median scores for 9th grade classes in1961
(Conventional curricula only).
Classes are identified by teacher I.D. numbers
(See Aprendix A).

Conventional Curricula
751
722
694
707 743 676
591 689 505
642
338 569 426
619 617
328 344 340
240 331 228 310
7073
14
729
717
730
711
739
688
708
721
675
664
629
713
666
761
655
425
701
648
718
644
703
377
656
632
687
618
758
667
358
651
400
683
615
737
740
384
264
608
327
680
360
734
685756.
761
332
325
639
227
357
677
255
662
359
278 347
13
14
15
16
17
18
91
20
21
Median Raw Score of Class
22
23
on STEP
24
25
26
27
28
29
30
Pretest (Form 2A)
Experimental
Curricula
337 386
331 338 310 265
400
425
428
1406
360
426
"41T
390
357
'541
-i3314
332
505
377
431
385
343
325
504
384
350
327
389
264
$97
358
TPT
300
278
-37(5-
75 328
229
228
-07
-336
335
324
359
347
240
439
344
234
227
326
714 .235
761
255
13
14
15
16
17
18
19
20
21
22
23
24
25
26
27
28
29
30
Median Raw Score of Class on STEP Pretest (Form 2A)
Fig. 3.
Frequency distributions of pretest median scores
for 9th grade classes in 1962.
Classes are identified by teacher I.D. numbers (See Appendix A).
I.D. numbers
of teachers simultaneously teaching experimental and conventional classes are
underlined.

Conventional Curricula
863
858
849
847
844
834
830
815 860 827
797 839 762
734
788 816 718
505 853 777 794 687
332 831 766 772 685
328 793 711 737 68o 826
608 865 677
7-6
739 TJV 730 648 803
331 240
-47
358 350
131
151
17
18
19
227
384
261
722
20
21
22
23
751
694
225
819
800
667
835
729
866
767
703
644
227
28
29-30
Median Raw Score of Class on STEP Pretest (Form 2A)
Experimental Curricula
730
711
Z-6
7666
68o 701 722 618
608 676
7572
406
735
747
525.
300
358
331
619 337 382 225 240
758
683 718
761 737 685
390 675 739 734 729 TiPT
384 591
7672
703
767
TO
426
639 629 777 TX
694
326 328 717. 615 644 7E347 389
227 202 428 355 255 726 263 350
13
115
117
18
19
20
21
22
23
Median Raw Score
225
227
28
29
30
of Class on STEP Pretest (ForM 2A)
31
32
33
3
362
2614
44o
31
32
33
3
Fig. 4.
Frequency distributions of pretest median scores for 9th grade classes in 1963.
Classes are identified by teacher I.D. numbers (See Appendix A).
I.D. numbers
of teachers simultaneously teaching experimental and conventional classes
are
underlined.

ua
Conventional Curricu3a
900 769 803
863
892
906 835
694
886 895
8857517 773 Tg
819 894 849
853 800 777 177
TT 332 TN sos 363 350 Ter 227
876
6 T.3"768
639
730
384
718
231
762
3137
776 739
767
703
13
114
15
117
18 1920
.21
22
23
24
25
227
28
29
30
31
32
33
3
Median Raw Score of Class on STEP Pretest (Form 2A)
Experimental Curricula
900
839
803
735
850
849
739
858
930
797
920
865
730
853
777
772
863
769
673
830352
384
813
762
324 591
609
229
800
332ET 337
224
202
793
73-1
773-
5117
18
19
20
21
22
917
834
831
815
773
819 734
7617Y
737 635
906 686 628
179-6 639 438
761 TT 363
835
718
694
326
231
703
505
263
227
282
23
24
25
26
818
710
261 680 685
27
28
29
30
Median Raw Score of Class on STEP Pretest (Form 2A)
929
794
767
264
350
31
32
33
34
Fig. 5.
Frequency distributions of pretest median scores for 9th grade classes in
1964.
Classes are identified by teacher I.D.(numbers (See AppendixA).
I.D. numbers
of teachers simultaneously teaching experimental and conventional classes are
underlined.

429
481 423 371
239
394
291 296 292
16
17
18
19
20
21
22
23
214
25
26
27
28
29
30
31
392
378
374
294
293
310
290
240
245
244
289.295
32
33
34
35
36
37
Median Raw Score of Class on STEP Pretest (Form 2A)
Fig. 6.
Frequency distribution of pretest mediafi scores for llth grade classes in 1961.
(Conventional curricula only).
Classes are identified by teacher I.D. numbers
(See Appendix A).

Conventional Curricula
598 64o
702
612
568
705
590
583
292
18
19
20
21
22
23
225
2
Experimental Curricula
745
716
671 759
593 749
571 748 691
614 557 375 567
699
293
TT
E 7
47290 291 576 714
27
28
29
30
31
32
33
34
35
36
37
38
39
Median Raw Score of Class on STEP Pretest (Form 2A)
394
296
292
245
244 290 371
458
395
557
375
291 374 295 378 293
19
20
21
22
23*
225
227
28
29
30
31
32
33
335
36
37
38
39
Median Raw Score of Class on STEP Pretest
(Form 2A)
ola
659
45
Fig. 7.
Frequency distributions of pretest median scores for llth grade classes in 1962.
Classes
are identified by teacher I.D. numbers
(See Appendix A).
I.D. numbers of teachers simul-
taneous1y teaching experimental and conventional classes are underlined.

pg
Conventional Curricula
769
841
855
*840
764
859
625 749
854
824
71-6
.83
280
5 79
1745 691 : 818 702 821
845
306
748MT 673: 781 593 699
778
292 19 375 -27 759 583 557
19
20
21
22
23 g 25
26
27
28
29
30
Experimental Curricula
Median Raw Score of Class
*640
238
296 568 245
19
20
21
22
23
225
2
862
810
804
802
659
31
32
33
34
35
36
37
38
39
40
41
42
43
44
on STEP Pretest
(Form 2A)
759 749
67977f48
UT 716
583 Ti7 691
590
378 557 78
306 612 292 392 452
419
699
702
295
7456
29
2981
271
236
375
244
27
28
29
30
332
33
335
337
339
01
Median Raw Score of Class on STEP Pretest
(Form 2A)
I
Fig. 8.
Frequency distributions of pretestmedian scores for llth grade classes in
1963.
Classes
are identified byteacher I.D. numbers (See Appendix
A).
I.D. numbers of teachers simul-
taneous1y teaching experimental and
conventional classes are underlined.

LA)
Conventional Curricula
855
910 1TIT
.
884 745
902
907 841
874
612 375 781 759 TRY
622.
583 821 879 854
593 117177E 419WE 870
582 862 899
20
21
22
23
24
25
26
27
28
29
30
31
32
33
34
35
36
37
38
39
40
41
42
43
44
Median Raw Score of Class on STEP Pretest (Form 2A)
Experimental Curricula
836
8141
907
296
568
926
811
764
931
854
782
749
590
232
902862
825
824
821
.437
419
855
748
910 69l
775
583
593 612
20
21
22
23
24
25
26
27
28
29
30
31
32
33
928 903
899
781 840 458 810 812
W 671 235 244 375 236 802
897
34
35
36
37
38 -3903--
Median Raw Score of Class on STEP Pretest (Form 2A)
Fig. 9.
Frequency distributions of pretest median scores for llth grade classes in 1964.
Classes
are identified by teacher I.D. numbers
(See Appendix A).
I.D. numbers of teachers simul-
.taneously teaching experimental and conventional classes are underlined.

Table 1
Number of 9th and llth Grade Classes in*Five-State
Project by Year, Phase, Grade, and Curriculum
1961-62 1962-63
GradePhase 1
ConventionalBall StateIllinoisSMSG
Totals
9 11
120 38
0 0
0 0
0 0
Classes:N = 158Teachers:N = 158
9 11 9 11 9 11
34 11
20 8
18 0
29 14
Classes:N = 134Teachers:N = 89
14 6
10 9
9 0
13 9
Classes:N = 70Teachers:N = 50
10 3
8 5
4 0
7 8
Classes:N = 45Teachers:N = 32
9 11
5 2
3 6
3 0
4 4
Classes:N = 27Teachers:N = 20
Phase 2ConventionalBall StateIllinoisSMSG
GradeConventionalBall StateIllinoisSMSG
56 260 0
0 0
0 0
Classes:= 82
Teachers:N = 82
19 12
13 8
10 0
13, 10Classes:N = 85*Teachers:N = 54
10 12
7 75 0
7 8Classes:N = 56Teachers:N = 34
7 2
4 4
4 0
5 1
Classes:N = 27Teachers:N = 18
Phase 3ConventionalBall StateIllinoisSMSG
35 220 0
0 0
0 0
Classes:
N = 57Teachers:
N = 57
Phase 4ConventionalBall StateIllinoisSMSG
14 9
6 6
6 0
16 11
Classes:N = 68Teachers:N = 45
6 1
2 0
3 06 4
Classes:N = 22Teachers:N = 15
12 10
3 73 0
5 4
Classes:N = 44Teachers:N = 34
5 32 5
4 0
6 3
Classes:N = 28Teachers:N = 20
1961-62 1962-63 1963-64 1964-65 1965-66
9 11 9 11 9 11 9 11 9 11
120 38
0 0
0 0
0 0
Classes:N = 158Teachers:N = 158
,
90 3720 8
18 0
29 14
Classes:N = 216Teachers:N = 171
68 40
23 17
19 0
26 19
Classes:N = 212Teachers:N = 161
46 34
24 25
18 0
35 31Classes:N = 213Teachers:N = 145
23 8
11 15
14 0
21 12
Classes:N = 104Teachers:N = 73
38

Tdble 2
Organization of Content in Two Edition's of the
Programmed CouVse in Algebra for Teachers
Title Content
1963 1964
Unit 1 Introduction Preview of course content,working instructions, etc.
Unit 2 Unit 1 Sets, Relations, Functions
Unit 3 Unit 2 Algebra of Real Numbers
Unit 3 Algebraic Systems I
Test A Test over Units 1-3
Unit 4 Unit 4 Order in the Real Number System
Unit 5 Equations and Inequalities
Unit 6 Absolute Value
Unit 7 Completeness of the Real Number System
Test B Test over Units 4-7
Unit 5 Unit 8 Natural Numbers
Unit 9 Integers
Unit 10 Rational NuMbers
Unit 6 Unit 11 Complex Nunbers
Test C Test over Units 8-11
Unit 12 Algebra of Real Functions
Unit 13 Polynomials
Unit 7 Unit* 14 Equivalence Relations and Groups
Test D Test over Units 12-14
Note: Each unit, in each edition, was followed by a unit test. Section
Tests A, B, C, and D appeared only in the'1964 edition.
39

Grade
Table 3
Summary of Data from Which Postiest Regressions
on STEP Pretest Were Calculated
Posttest
Years Number of Obtained
Given Students Equation
9
9
9
9
9
11
11
13.
13.
11
STEP(2B) 1962,3,4,5 10,956 = 9.2205 + .7598x
MNL9(First 1965 2,873 i = 2.3431 + .2582x
version)
COOP(Nunber 1966 1,486 i = 6.1266 + .5976x
system)
COOP(Algebra I) 1966 1,486 if = 10.5519 + .5959x
MNL9(Revised) 1966 1,486 i = 2.7625 + .2225x
STEP(2B) 1962,3,4,5 4,4/6
MNL11(First 1965 1,431
version)
COOP(Algebra 1966 736
II)
COOP(Algebra 1966 736
III)
VMI11(Revised) 1966 736 ; = .3155 + .1942x
= 11.9206 + .7175x
i = 1.3516 + .1484x
i = 7.4232 + .5030x
; = 2.4438 + .4410x

Table 4
Relative Stability of Median Pretest Scores for Classes
Taught by the Same Teachers in Consecutive Years
Grou.
Years ofConsecuti
Partici.ation1
Number ofClasses2
Rank OrderCorrelationor AverageCorrelation Si nificance
9C-2
9C-3
1962,63
1962,63,64
33
17
= .42rs
rav
= .42s..
p < .02
p < .05
9E-2
9E-3
1962,63
1962,63,64
24
10
= .46rs
2' =sav
.73
p < .05
p < .01
11C-2
11C-3
1963,64
1962,63,64
19
10
r = .15
rsay
= .13
n.s.
n.s.
11E-2
11E-3
1963,64
1962,63,64
19
5
rs= .73
r = .80....
,
p < .01
p.< .01
1 Academic years designated by year of fall term.
2 Within each group, the number of classes is equal to the number of
teachers. The classes in 9C-3 form a subset of those in 9C-2, etc.,
so these groups are not independent. C and E curricula are not in-
dependent, since about half the teachers taught both a C and an E
class. Grades are independent.
1 Levels for rsaar from Ferguson (1965).
43.

1,
Table 5
Medians of Median Pretest Scores for ClassesTaught by the Same Teachers in Consecutive Years
GroupNumber ofClasses2 1962
Year11963 1964
,
9C-2 33 23.50 22.00
9C-3 17 23.50 22.00 23.50
9E-2 24 22.48 22.50
9E-3 10 25.00 22.25 23.58
11C-2 19 32.00 30.67
11C-3 10 32.62 32.00 30.75
11E-2 19 . 33.33 32.50
11E-3 5 32.00 34.00 .36.50
1 Academic years designated by year of fall term.
2 Within each group, the number of classes is equal to the number ofteachers. The classes in 9C-3 form a subset of those in 9C-2, etc.,so these groups are not independent. C and E curricula are not in-dependent, since about half the teachers taught both a C and an E
class. Grades are independent.
42

Table 6 .
Pretest Scores of Classes Taught by Teachers Who Did
and Did Not Volunteer for the Algebra Course in 1963-64
Grade
Teachers WhoVolunteered
Teachers WhoDid Not Volunteer
Curriculum
,
NumberofClasses
Medianof ClassMedians
Rangeof ClassMedians
NumberofClasses
Medianof ClassMedians
Rangeof ClassMedians
9 c 25 21.33 15.62 to 8 24.00 19.67 ta
27.20. 27.00
9 E 47 23.25 14.67 to 19 24.00 17.00 to
33.62 28:50
11 C 12 32.12 29.50 to 7 32.12 31.33 to
43.70 34.50 1
4
11 E 22 33:29 22.75 to 13 33.50 28.75 041.00 40.75 j.

Grade
9
9
11
11
Table 7.
Pretest Scores of Classes Taught by Teachers Who Did
and Did Not Return the First Unit in 1964-65
Curriculum
Teachers Who Teachers Who
Returned First Unit Did Not Return First Unit
NumberofClasses
Medianof ClassMedians
Rangeof ClassMedians
NumberofClasses
Medianof ClassMedians
Rangeof ClassMedians
12
21.75
22.87
10
16
30.96
33.50
15.75 to23.00
13.25 to27.00
25.50 to38.30
20.00 to1110.00
15
22
19.83
21.59
13.70 to29.12
13.00 to33.75
9
27.50
31.17
24.00 to29.25
24.00 to44.00
**.

Table 8
Correlations between Teachers' Scores and Median Pretest
Scores of Their Classes in the Same Academic Year.
Year Grade CurriculuM
Number ofClasses
j Rank OrderCorrelation
1963 9 c 7 -.37
9 E. 15 .12
_
11 C See Note 1
11 E 9 .55
-
1964 9 c 7 .43
9 E 15 .20
11 c lo .15
11 E 15 .44.
1 Insufficient number of classes for analysis.

Table 9
Correlations Between Teachers' Working Times and Median PretestScores of Their Classes in the Same Academic Year
Year Grade CurriculumNumber ofClasses
Rank OrderCorrelation1
1963 9
9
C
E
7
15
.31
.o6
11
11
C
E
See Note 2
9 -.20
1964 9
9
...C
E
13
21
.39
.21
11
11
C
E
. 17
24
-.23
-.16
1 Shortest time and lowest score assigned lowest ranks.
2 Insufficient number of classes for analysis.

Table 10
Relative Stability of Median Posttest Deviation Scores (STEP) for
Classes Taught by the Same Teachers in Consecutive Years
Group
Years ofConsecutiveParticiution1
Number ofClasses2
Rank OrderCorrelationor AverageCorrelation Significance
9C-2 1962,63 30 r = .52s
p < .01
9C-3 1962,63,64 16 rSay
= .26 n.s.
9E-2 1962,63 23 r5 = .18 n.s.
9E-3 1962,63,64 10 rsav
= .12 n.s.
11C-2 1963,64 19 rs= .27 n.s.
11C-3 1962,63,64 10 rsav
= .31 n.s.
11E-2 1963,64 18 r .15.
s= n.s.
11E-3 1962,63,64 5 rsav
= -.40 n.s.
1 Academic years designated by year of fall term.
2 Within each group, the number of classes is equal to the number of
teachers. The classes in 9C-3 form a subset of those in 9C-2, etc.,
so these groups are not independent. C and E curricula are not in-
dependent, since about half the teachers taught both a C and,an E
class. Grades are independent.
47

Table 11
Medians of Median Posttest Deviation Scores (STEP) .for_
Classes Taught by the Same Teachers in Consecutive Years.
NuMber of Yearl Significance
1:214) Classes2 1962 1963 1964 of Trends3
9C-2 30 1.60 -.30 p < .01
9C-3 16 1.60 .55 -.14 p < .01
9E-2 23 -.02 .18
9E-3 10 -.28 .12 1.15 n.s. (p = *..1
11C-2 . 19 -.27 .71 n.s.
11C-3 10 .80 .00 1.00 n.s.
11E-2 18 -.53 ...49 n.s:
11E-3 5 .62 .42 -.11 n.s.
1
2
Academic years designated by year, of fall term.
Within each group, the number of classes is equal to the number of
teachers. The classes in 9C-3 form a subset of those in 9C-2, etc.,
so these groups are not independent. C and E curricula are not in-
dependent, since about half the teachers taught both a C and an E
class. Grades are independent.
3 S-statistic (Ferguson, 1965).

Table 12
Posttest Deviation Scores (STEP) of Classes Taught by Teachers WhoDid and Did Not Volunteer for the Algebra Course in 1963-64
Grade
9
Curriculum
Teachers WhoVolunteered
Teachers WhoDid Not Volunteer
NumberofClasses
Medianof ClassMedians
25
47
3 7 1
.15
Rangeof ClassMedians
Number Medi'an
of of ClassClasses Medians
Rangeof ClassMedians
-3.36 to3.o4
-12.44 to3.88
19
2.551
.38
-.97 to5.54
-51.64 to2.89
11
12
22
.14
.45
-2.80 to2.22
-2.30 to.3.64
13
.27
.10
-2.67 to1.78
-5.29 to2.96
1 Difference between volunteers and non-volunteers significant at.01 level by the Mann-Whitney U test.
19

.-17
Table 13
Posttest Deviation Scores (STEP) of Classes Taught byTeachers Who Did and Did Not Return the First Unit in 1964-65
Grade Curriculum
Teachers Who -
Returned First UnitTeachers Who Did
Not Return First Unit.
NumberofClasses
Medianof ClassMedians
Rangeof ClassMedians
NumberofClasses
Medianof ClassMedians
Rangeof ClasMedians
9 C 7 .68 -3.15 to 15 -.86 -2.46 t3.68 4.91
9 E 12 .32 -3.50 to 22 -.58 -3.04 t10.71 7.90
_.
11 C 10 -.38 -5.72 to 5 5.69 -3.65 t5.28 7.86
11 E 16 2.47 -9.44 to 9 .72 -5.97 t9.73 . 5.69
_ ,
50

Table 14
Correlations between Teachers' Scores and Median Posttest
Deviation Scores STEP) of Their Classes in the Same Academic Year
Year Grade Curriculum
*Number
ofClasses
Rank Order I
Correlation
1963,64 9
9
c
E
7
15
-.26
.10
11
11 E
See Note 1
9
.
.00
1964,65 9
9
c
E
.7
15 .22
11
11
C
E
10
15
.37
-.16
1 Insufficient number of classes for analysis.
53.

Table 15
Correlations between Teachers' Working Times and Median Posttest
Deviation Scores (STEP) of Their Classes in the Same Academic Year
Year Grade Curriculum
NuMber ofClasses
Rank OrderCorrelation1
1963,64 9
9
c
E
7
15
-.22
.00
11
11
c
E
See Note 2
9 -.11
1964,65. 9
9
c
E
13
21
-.11
-.20
I
11
11
,
c
E_
. 17
24
,
-.32
...21
.
1 Shortest time and lowest score assigned lowest ranks.
2 Insufficient number of teachers for analysis.
52

Table 16
Relative Stability of Median Posttest Deviation Scores Obtained from MNL,
Teits for dlasses Taught by the bame Teachers in 1964-65 and 1965-66
Group
Number ofClasses
Rank OrderCorrelation Significance
9C 16 45 p < .05
9E 31 43 i < .01
,
11C 7 .39 n.s.
11E 16 ..56 p < .05
Table 17
Relative Stability of Median Posttest Deviation Scores Obtainedfrom MNL Tests for Classes Taught by the Same Teachersin 1964-65 and 1965-66, within Experimental Curricula
Grade CurriculumNumber ofClasses
Rank OrderCorrelation
9
9
9
11
11
Ball State
Illinios
SMSG
Ball State
SMSG
8
12
9
7
.48
.14
. 4 6
. 57
.64
53

Table 18
Correlations of Median Posttest Deviation Scores Obtained from MNL Testsfor Experimental and Conventional Classes Taught by the Same Teachers
Grade Year
Number ofPairs ofClasses
Rank OrderCorrelation SigELELIEMPIt__
p < .01
n < .05)r
n.s.
n.s.
9
9
11
11
1964-65
1965-66
1964-65
1965-66
17
15
5
5
.73
.57
-.20
.3o
Table 19
Posttest Deviation Scores (MNL) of Classes Taught by TeachersWho Did and Did Not Return the First Unit in 1964-65
Grade
Teachers WhoReturned First Unit
Teachers Who DidNot Return First Unit
Curriculum
NumberofClasses
Medianof ClassMedians
Rangeof ClassMedians
NumberofClasses
Medianof ClassMedians
-Rangeof ClassMedians
9
9
C
E
7
12
-1.15
-.20
-2.66 to.73
-2.40 to4.19
15
22
-.48
-.48
-3.91 to2.89
-1.69 to3.05
11
11
C
E
9
15
-.65
.00
-2.57 to2.16
-2.43 to2.71
5
9
.31
-.11
-1.80 to1.87
-1.57 to1.76
_
54
Table 20
Correlations between Teachers' Scores in 1964-65 and Median Posttest
Deviation Scores (MNL) of Their Classes in the Same Year
Grade Curriculum
Number ofClasses
,
Rank OrderCorrelation
9 c 7..,
_
.5o
9 E 15 .21
11 C 9 .35
11 E 14 34
Table 21
Correlations between Teachers' Working Times in 1964-65 and Median
Posttest Deviation Scores (MNL) of Their Classes in the Same Year
Grade Curriculum
Number ofClasses
Rank OrderCorrelation1
9 C 13
9.
E 21 -.06
11 c 15 -.24
11 E 22 .03
-
1 Shortest time and lowest score assigned lowest ranks.
55

Table 22
Rank-Order Correlations between Teachers' Scores in 1964-65 andMedian Posttest Deviation Scores of Their Classes in 1965-66
Grade CurriculumNumber ofClasses
TestCOOP Num. Sys. COOP Alg. I MNL 65
9 C 5 .38 -.18 .22
9 E 8 .10 .35 -.30
COOP Alg,s, II COOP Alg. III MNL 6511 C See Note 1
11 E 7 -.21 -.14 -.14
-
1 Too few classes for analysis.
Table 23
Rank-Order Correlations between Teachers' Working Times in 1964-65and Median Posttest Deviation Scores of Their Classes in 1965-661
Number ofGrade Curriculum Classes COOP Num. Sys.
9
. 9
7
12
. o6
-.12
11
11
5
9
COOP Alg. II- 6o
-.13
TestMNL65_:
-.58
-.63
COOP Alg. I
-.15
-.16
COOPAtg. III MNL 65
.05
-.5o
-.15
1 Shortest time and lowest score assigned lowest ranks.
56

Table 24
Correlations between Teachers' Scores in 1964-65 andMedian Posttest Deviation Scores (MNL) of Upper and Lower
Ability Students in Their Classes in the Same Year
Grade Curriculum
Nuthber
ofClasses
Rank-OrderCorrelations
Studentsbelow Pre-test Medianof Class
Students ator abovePretest Medianof Class
9
9
c
E
7
15
.46
34
:50
.09
11.
11
C
E
9
13
.90
43
..13
.43
Table 25
Correlations between Teachers' Working Times in 1964-65and Median Posttest Deviation Scores (MNL) of Upper andLower Ability Students in Their Classes in the Same Year
Grade Curriculum
NumberofClasses
Correlations1,
Studentsbelow Pre-test Medianof Class
Students ator abovePretest Medianof Class
9
9
c
E
13
21
-.12
-.14
.09
.10 .
11
11,
.C
E
15
21
.L.42
.
-.13
.
-.17.
.03
1 Shortest time and lowest score assigned lowest ranks.
57

Table 26
Numbers of Tenth-grade Teachers Returning Each Unit of the ProgrammedCorrespondence Course in Geometry, November, 1965 to April, 1967 '
Unit
2
3
5
Number of Teachers
74
35
13
10
8
6 8
7 7
8 7
9 6
10 5
11 5
1 The course was originally sent to 260 teachers.
58

Appendix A: Classes taught by 9th and llth grade teachers during
each Year of their participation in the Five-State
Project.
Note: C = Conventional class; E = Experimental class. Key to
Experimental Curricula:
A - Ball State Teachers College Experimental Mathematics Program
B University of Illinois Committee on School Mathematics
C - University of Maryland Mathematics Project
D - School Mathematics Study Group
Key to school codes follows on A-9.
Classes for which adequate test data were not obtained have beenomitted from the tables.
A-1

Grade 9
TeacherCode
224225229230231264324334
335336343344346
355357362363384389400h2642844o504505
591608
615618619629632644680693694722729734767772
797831
839850
SchoolExperimentalCurriculum
Academic Year
1961-62 1962-63 1963-6 1964-65 1965-66
114098001
163
AAAA
E.
099 A CE CE151 A CE
217 A CE225 A CE226 A156 A232 A209 A CE
162 A242 A182 A CE
.E
245 A246 A CE CE260 A CE CE CE
265 A276 A CE246 A CE CE298 A308 A350 A351 A CE CE CE4o6 A412 A CE CE374 A030 A417 A398 A4o0 A418 A CE431 A CE CE445 A446 A CE CE CE463 A CE459 A CE467 A CE CE CE486 A CE CE488 A522 A CE148 A510 A498 A
A-2

Grade 9 (cont.)
TeacherCode School
ExperimentalCurriculum 1961-62 196 -63
Academic Year
1963-64
876 585
920 576
930 580933 578226 043227 155228 165261 147278 183325 206328 220
337 2273140 229341 230348 235358 243365 248382 258386 262410 285416 290425 263639 047656 393675 436676 207683 44o701 449718 461730 466
737 469
739 4717140 472768 474794 520813 535815 537819 541830 550890 474894 595896 561900 563906 568628 098
AAAA
'B
A-3
CECECECECECE
CECE
CE
CE'E
CE
CE
CE
CE
CE
CE
CE
CECECECECE
1964-65I 1965-66
CE
CE
CE
CE
CECE
CE
CECE
CE
CE.CE
CE
CECE
CE
CE
CE
CECE
CE

Grade 9 (cont.)
TeacherCode School
ExperimentalCurriculum
Academic Year
1961-6 1962-63 1963-6)4 1964-65 1965-66
202232234
235
138161129159'
240 176 CE CE
255 038 CE CE.
262 148263 149265 153 CE CE
282 187 CE
300 189
304 202
310 184 CE
326 218 CE CE CE
327 219 CE
331 223 CE CE
332 224 CE CE CE CE
333 202338 172 CE
347 234 D. C. CE
350 237 CE CE CE
359 198 CE
360 224 CE
377 247 CE
381 257385 261390 266
397 2734o6 281431 301438 255
439 307
600 409,
609 413 CE
617 416
635 417 CE CE
648 411 CE
655 424 CE
666 345
667 430 CE
677 437 CE
685 442 CE CE
686 443687 429 CE CE
703 431 CE CE
A-4

Grade 9 (cont.)
TeacherCode School
ExperimentalCurriculum
Academic Year
1961-62 1962-63 1963-64 1964-65 196-5-66
710 454 D E711 455 D C CE
735 468 D E758 48o D C E761 482 D C E E E762 178 D C CE769 130 D . CE CE
773 490 D CE CE
777 493 D C CE CE
793 227 D C E800 525 D C CE CE803 527 D C CE CE818 540 D E834 552 D C .E E835 . 553 D C CE E849 487 D C CE853 500 D C CE858 502 D C E063 505 D C CE865 500 D C E885 591 D C. CE915 216 D CE917 574 D E E929 48o D E866 274 c
875 584 - c
886 587 - c
892 593 c
895 581 c

Grade 11
TeacherCode School
ExperimentalCurriculum
Academic Year
1961-62 1962-63
236 179 A238 166 A245 174 A281 186 A290 195 A292 197 A336 156 A378 254 A391 267 A392 268 A419 293 A423 263 A452 317 A568 391 A576 397 A587 14014 A593 404 A659 425 A671 434 A716 459 A741 472 A748 474 A749 475 A764 064 A789 516 A791 518 A821 542 A824 545 A841 512 A855 501 A870 582 A897 497 A899 038 A907 569 A916 573 A926 577 A927 578 A931 580 A232 161 D235 159 D240 176 D244 175 D271 164 D291 196 D293 189 D
A-6
CE
CECE
CE
CE
CECE
1.963-64 1 1964-65 [ 1965-66
CE
CE
CE
CE. CECE
.E
CECE CECE
CECE
CECE CECE.0 CE
CE
CE
CECE
CECECE
CE

Grade 11 (cont.)
TeacherCode School
ExperimentalCurriculum
Academic Year
1961-62 ] 1962-63 1963-64 1964-65 1965-66
295296306310311
373.
198199204184207203
DDDDDD
CE
374 236 D CE
375 253 D CE CE CE
379 255 D CE
394 270 D
395 271 D
398 274 D429 299 D458 320 D481 334 D
557 172 D CE CE
582 401 D CE
583 150 D CE CE
590 400 D612 150 D CE CE
614 007 D
64o 400 D
691 442 D CE CE
699 448 D CE CE
702 425 D CE
745 299 D CE CE
759 477 D CE CE
769 130 D
778 174 D781 492 D CE
782 495 D802 526 D810 533 D
811 534 D812 516 D818 540 D825 546 D836 508 D840 511 D845 479 D
854 500 D CE
862 504 D CE CE
874 496 D
879 587 D CE
A-7

Grade 11 (cont.)
TeacherCode School
ExperimentalCurriculum -i9i.-23962-6314l9i4-651965-6
Academic Year
884 587 D C CE
902 565 D CE
903 566 D E E
910 502 D CE
928 579 D C
,832 543 - C
A-8

SchoolCodeNumber School Town State
1 Academy of Holy Angels
7 Aurora-Hoyt Lakes H.S.
30 Cook County High School
38 Edina-Morningside Sr. H.S.
43 Faribault Junior H.S.
47 Glenwood High School
64 Lakeville High School
76 Morris Junior H.S.
98 C. Sandberg Jr. H.S.
99 Sebeka High School114 Stillwater Jr. H.S.129 Wayzata High School
130 West Senior H.S.138 Wells Senior High School
147 Manson Community H.S.148 L.D.F. Community H.S.149 Aurelia Community H.S.150 Richfield Senior H.S.151 Jefferson Community H.S.153 Bedford Community H.S.155 Richfield West Jr. H.S.
156 Schleswig Community H.S.
159 Pine River H.S.161 Marian High School162 Mount Ayr Community H.S.163 Herman High School164 Graettinger Community H.S.165 South High School166 St. Adrian High School
172 Shenandoah Community H.S.
174 Columbia Heights H.S.
175 Robbinsdale High School
176 Sandstone High School
178 Barnesville High School
179 Aitkin High School182 Bennett Community H.S.183 Lynnville-Sully Community H.S.
184 West High School186 Columbus Community H.S.
187 Lenox Community H.S.189 Clinton Community H.S.195 New Hampton Community H.S.196 Roosevelt High School
197 Lincoln High School198 Maurice-Orange City Comm. H.S.
199 Lake View-Auburn Community H.S.202 Watertown Junior High School203 Watertown Senior High School204 Central High School
A-9
MinneapolisAuroraGrand MaraisEdinaFaribaultGlenwoodLakevilleMorrisMinneapolisSebekaStillwaterWayzataMinneapolisWellsMansonLeGrandAureliaRichfieldJeffersonBedfordRichfieldSchleswigPine RiverMarianMount AyrHermanGraettingerMinneapolisSt. AdrianShenandoahMinneapolisRobbinsdaleSandstoneBarnesvilleAitkinBennettSullyDavenportColumbus Jct.LenoxClintonNew HamptonDes MoinesDes MoinesOrange CityLake ViewWatertownWatertownAberdeen
Minn.Minn.Minn.Minn.Minn.Minn.Minn.Minn.Minn.Minn.Minn.Minn.Minn.Minn.IowaIowaIowaMinn.IowaIowaMinn.IowaMinn.Minn.IowaMinn.IowaMinn.Minn.IowaMinn.Minn.Minn.Minn.Minn.IowaIowaIowaIowaIowaIowaIowaIowaIowaIowaIowaS.D.S.D.
S.D.

SchoolCodeNumber School Town State
206 Sheldon Community High School Sheldon Iowa
207 Burt Community High School Burt Iowa
209 Boone Community High School Boone Iowa
216 Melcher-Dallas Community H.S. Melcher Iowa
217 Moravia Community H.S. Moravia Iowa
218 Yankton Junior High School Yankton S.D.
219 Sudlow Junior High School Sudlow Iowa
220 Gladbrook Community High School Gladbrook Iowa
223 Centerville Ind. High School Centerville Iowa
224 Monroe Junior High School Aberdeen S.D.
225 North High School Des Moines Iowa
226 Primghar Community High School Primghar Iowa
227 Spirit Lake Community High School Spirit Lake Iowa
229 Dows Community High School Dows Iowa
230 Sumner Community High School Sumner Iowa
232 So. Winneshiek Community H.S. So. Winneshiek Iowa
234 State Center Community H.S. West Marshall Iowa
235 Fonda Community High School Fonda Iowa
236 Osage Community High School Osage Iowa
237 Brookings Junior High School Brookings S.D.
242 Oakland Ind. School Oakland Iowa
243 Franklin Junior High School Franklin Iowa
244 Traer-Clutier Community H.S. Traer Iowa
245 South Junior H.S. Grand Forks N.D.
246 Williston Junior High School Williston N.D.
247 Jamestown Junior High School Jamestown N.D.
248 Janesville High School Janesville Iowa
253 Brookings High School Brookings S.D.
254 Central High School Grand Forks N.D.
255 Mayville High School Mayville Wisc.
257 Reeder High School Reeder N.D.
258 Goodrich High School Goodrich N.D.
260 Wahpeton High School Wahpeton N.D.
261 West Fargo High School Fargo N.D.
262 Trenton High School Trenton N.D.
'263 Central High School Devils Lake N.D.
265 Valley Junior High School Grand Forks N.D.
266 Waupaca High School Waupaca Wisc.
267 Elk Mound High School Elk Mound Wisc.
268 Wilmot High School Wilmot Wisc.
270 Sun Prairie High School Sun Prairie Wisc.
271 Owen-Withee Senior High School Owen Wisc.
273 Ashland-Ondossagon High School Ashland Wisc.
274 Edgerton H1,gh School Edgerton Wisc.
276 Webb High School Reedsburg Wisc.
281 Onalaska High School Onalaska Wisc.
285 Central High School Superior Wisc.
290 Turtle Lake High School Turtle Lake Wisc.
293 Greendale High School Greendale Wisc.
A-10
,
SchoolCodeNumber School Town
298 Hazen High School Hazen N.D.
299 Jamestown High School Jamestown N.D.
301 Glenfield High School Glenfield N.D.
307 South High School Sheboygan Wisc.
308 Ashland Junior High School Ashland Wisc.
317 Alma High School Alma Wisc.
320 Unity High School Milltown Wisc.
334 Beresford High School Beresford S.D.
345 Oskaloosa Junior H.S. Oskaloosa Iowa
350 Emmetsburg Community School Emmetsburg Iowa
351 Wilton Community H.S. Wilton Jct. Iawa374 Arch. Murray Memorial H.S. St. Paul Minn.
391 Lake Park High School Lake Park Minn.
393 Mabel High School Mabel Minn.
397 Falls High School International Falls Minn.
398 Clara City Public School Clara City Minn.
400 Lincoln High School Thief River Falls Minn.
401 Luverne High School Luverne Minn.
404 Fairmont High School Fairmont Minn.
406 Wabasso High School Wabasso Minn.
409 Trimont Senior High School Trimont Minn.
411 Chisholm Junior High School Chisholm Minn.
412 Mahnomen High School Mahnomen Minn.
413 Fridley High School Minneapolis Minn.
416 Excelsior Jr. High School Excelsior Minn.
417 Eveleth Jr. High School Eveleth Minn.
418 Backus Junior High School International Falls Minn.424 North Branch H.S. North Branch Minn.
425 Ames Senior High School Ames Iowa429 Iowa Falls Comm. Jr. School Iowa-Falls Iowa
130 Paullina Community School Paullina Iawa431 Central Junior Hlgh school Ames Iowa434 Sac Community High School Sac City Iowa436 Mallard Community School Mallard Iowa
437 LeMars Community School LeMars Iowa44o Collins Community School Collins Iowa442 Washington High School Cherokee Iowa443 St. Boniface High School New Vienna Iowa445 Hamburg Community School Hamburg Iowa446 Murray Community School Murray Iowa448 Iowa Falls Sr. High School Iowa Falls Iowa449 Gilmore City-Bradgate Comm. Sch. Gilmore City Iawa454 Monroe Senior High School Monroe Wisc.455 Washington High School Manitowoc Wisc.459 West Bend High School West Bend Wisc.
461 Merrill Junior High School Merrill Wisc.
463 Mukwonago Union H.S. Mukwonago Wisc.466 Algoma High School Algoma Wisc.
467 Neilsville High School Neilsville Wisc.
A-11
SchoolCodeNumber . School Town State
468 Turtle Mt. Comm. School Belcourt N.D.
469 Mandan Junior H.S. Mandan N.D.
471 Kenmare High School Kenmare N.D.
472 Bishop Ryan High School Minot N.D.
474 Valley City High School Valley City N.D.
475 Central High School Grafton N.D.
477 Rapid City High School Rapid City S.D.
479 St. Mary High School Dell Rapids S.D.
480 O'Gorman High School Sioux Falls S.D.
482 Washington Junior H.S. Rapid City S.D.
486 Johanna Junior H.S. New Brighton Minn.
487 Lincoln High School Alma Center Wisc.
488 St. Anthony Village H.S. Minneapolis Minn.
490 Sanford Junior High School Minneapolis Minn.
492 St. Francis High School St. Francis Minn.
493 Columbia Heights Jr. H.S. Columbia Hts. Minn.
495 Wheaton High School Wheaton Minn.
496 Greenway High School Coleraine Minn.
497 Southwest High School Minneapolis Minn.
500 Pulaski High School Pulaski Wisc.
501 Valders High School Valders Wisc.
502 Beloit Memorial High School Beloit Wisc.
504 Ripon Senior High School Ripon Wisc.
505 Cadott High School Cadott Wisc.
508 St. Mary High School ichardton N.D.
510 Leeds High School Leeds N.D.
511 Watford City High School Watford N.D.
512 Napoleon High School Napoleon N.D.
516 Anamosa Community School Anamosa Iowa
518 Ocheyedan Community School Ocheyedan Iowa
520 Perry Community School Perry Iowa
522 Marcus Community School Marcus Iowa
525 Central City Comm. School Central City Iowa
526 Farragut Community School Farragut Iowa
527 Northwood-Kensett Comm. Sch. Northwood Iowa
533 Monticello Community School Monticello Iowa
534 Orange-Township Cons. School Waterloo Iowa
535 Garrison Cons. School Garrison Iowa
537 Carson-Macedonia Comm. Sch. Carson Iowa
540 Correctionville Ind. School Correctionville Iowa
541 Adel Community School Adel Iowa
542 Atlantic Community School Atlantic Iowa
543 South Hamilton Comm. School Jewell Iowa
545 Sergeant Bluff-Luten Comm. Sch. Sergeant Bluff Iowa
546 Durant Community School Durant Iowa
550 Lincoln Central Comm. School Gruver lova
552 Prairie City Community School Prairie City Iowa
553 Milford Community School Milford Iowa
561 Lutheran High School Mayer Minn.
563 Bemidji Jr. High School Bemidji Minn.
A-12
-

SchoolCodeNuMber School Town State
565 Canby High School Canby Minn.
566 Bagley High School Bagley Minn.
568 East Troy Comm. H.S. East Troy Wisc.
569 St. Francis High School St. Francis Wisc.
573 Postville Comm. H.S. Postville Iowa
574 Lawton High School Lawton Iowa
576 Shellsburgh High School Shellsburgh Iowa
577 Tioga High School Tioga N.D.
578 Miller High School Miller S.D.
579 Spearfish High School Spearfish S.D.
580 Belle Fourche H.S. Belle Fourche S.D.
581 Gettysburg Junior H.S. Gettysburg S.D.
582 Little Falls High School Little Falls Minn.
584 Schiocton High School Schiocton Wisc.
585 Oakfield High School Oakfield Wisc.
587 Marshalltown High School Marshalltown lava
591 North Junior High School Fort Dodge Iowa
593 New Salem High School New Salem N.D.
595 Kimball High School Kimball S.D.
A-13

Appendix B: Minnesota National Laboratory Mathematics Tests for gradesnine and eleven.
1964 Edition Page B-2
1965 Edition Page B-39
B-1

MinnesAa. National LaboratoryState Department of EducationMathematics Section
Code: MOCVIIIB- -336
Minnesota National Laboratory Mathemaics Tests
(1964 Edition)
INSTRUCTIONS FOR ADMINISTRATION
NOTE: Please gaLcompletely before the mad gulWaild to administerthese tests.
GEMERAL INFORMATION:
There are several forms of the Minnesota National Laboratory Mathematics Tests ateach of several grade levels as indicated below.
GRADE LEVEL FORM
7 & 8 1 A &B9 2 C & D10 3 E F
& 12 4 Jo & L
These tests have been constructed to cover the mathematics content typicallyincluded at eadh indicated grade level. The objective in this regard has been toselect test items covering the general and most central principles and conceptsintroduced at a given grade level which are common to both conventional and modernmathematics programs. This means that the content of test forms at one grade levelwill not overlap with the content of forms for a lower grade level.
Because the tests are focused on the content at a given grade level, pupils arelikely to experience some difficultT with the test Ella to having been exposed tothe content covered in that grade. This will probably lead to expressions ofunfamilarity and difficultT by pupils after taking the pretest forms in the fall,whith, however, will not be the case for the forms to be administered in the spring.
ADMINISTRATION PROCEDURES: (Please read before the period scheduled for the test)
1. Pass out the testing materials. Each pupil should receive one copy of the test,one Hark Sense Answer Card, one special electrographic mica and several pieces ofgmtglimptup. (The latter is quite important so the pupil will not find itnecessary to write on the test booklet itself)
2. Instruct pupils to print their name only in the space provided on the Mark SenseAnswer Card. Pupils are not to put their names on the test booklet and they arenot to put anything other than their names and answers on the Answer Card.
3. Instruct the pupils to read the following test instructions to themselves whileyou read them aloud. Following these.instructions are a number of specific pointson questions that pupils might ask. You should read these (to yourself) prior toadministering the test.
B-2

GENERAL INSTRUCTIONS:
This is a test of how well you understand and can apply what you have learned
about mathematics. You are to read and try to answer each of these questions
even though some Of the questions may be about things you have not yet studied.
Do not make any marks on the test booklet itself.
You are to indicate your answer only on the Answer Card using the special
electrographic pencil you haVe.been.given.
Do your figuring only on the scratch paper you, have been given.
First, print your name in the space provided on the Answer Card. Ndw, read
carefully the test procedures given below.
Test Prodedures:
1. Read each item carefUlly and completely, think about the problem and do
any figuring youwant on the scratch paper.
2. Read the alternative answers carefully and select the one correct answer
for each question.
3. Indicate your answer on the Answer Card by blackening the space over and
around the letter (A, 13, Cs etc.) of the answer you have chosen, using the
electrographic pencil. Be sure that the row inwhich you mark the answer has
the same nuMber as the question. If you wish to change an answer, be sure to
erase the previous answer completely.
4. Since your score depends upon the nuMber of correct answers that youmark,
you should try to answer each question. However, do not spend too much time
on any one item. If ypu have difficulty determining the correct answer, makethe most careful guess you can and go.on to the next item. If you finishbefore time is called, you can go back and work: the items that were more diffi-cult. Try to.doas men ae you can.
If you have any questions about what you are to do, ask your teacher mil.
Do not begin imAding until the teacher tells you to start.
As soon as the questions have been answered the pupils may begin. They should be
allowed Alminutes.fram the time they begin to complete the test.
Answer any questions the pupils have concerying the procedures in terms of theinformation given in the instructions or in the supplementary information givenbelow.

SUPPLEMENTA.....11.../NFORMAION OR TEST ADMINISTRATO S:
1. Since the pupils score is the number of correct answers, there is no penaltqfor guessing. Pupils should be cautioned to guess carefully, however.
2. If pupils finish before time is called they should cover their Answer Cards withthe test booklets and remain quiet.
3. TiMe should be called 45 minutes, after the signal to begin was given.
4. The Answer Cards and test booklets should be collected separately and the AnswerCards from each class should be kept separate.
5. It is suggested that foneas.the:test you point out that many of .the testitems were difficult because they concerned topics and materials the pugls havenot yyt studied. You might further point out, such a test is necessary to providean indication of how much is learned when a test like this is given at the end ofthe semester. These comments should be made staz after the test has been adminis-tered.
6. Please return all copies of the test booklets because 'these booklets will bereused for other classes for the spring testing.
If there are any questions as to procedures for administration of this testplease contact: Dr. James J. Ryan
Minnesota National LaboratoryState Department of EducationSt. Paul 1, MinnesotaTelephone: 373-4011
PLEASE NOTE: This set of test booklets is to be used for each of the classesparticipating in the Evaluation of Secondary Mathematics CurriculaProgram.

Codes XXXVIII-B328
General Instructionst
MINNESOTA NATIONAL LABORATORY
MATHEMATICS TEST
LEVEL TWO FORM C
(Grade Nine, 1964 Edition)
Thii is a test of how well you understand and can apply what you have learned aboutmgthematics. You are to read and try to answer sash of these questions, even thoughsome of the questions may be about things you have not yet studied.
Do not make any marks on the test booklet itself.
You are to indicate your answer only on the Answer Card using the special electra.,graphic pencil you have been given.
Do your figuring only on-the scratch paper you have been given.
First, print your name in the space provided on the Answer Card.
'Now, read carefully the test.procedures given below..
Test Procedurest
1. Read each Item carefully and completely, think about the problem and doany figuring you want on the scratch paper.
2. Read the alternative answers carefully and select the one correct answerfor each question.
3. -Indicate your answer on the Answer Card by blackening the space over andaround the letter (A, B, C. etc.) of the answer you have chosen, usingthe electrographic pencil. Be sure that the row in which you mark theanswer had the same number as.the question. If you wish to change ananswer, be sure to erase the previous answer completely.
4. Since your score depends upon the number of correct answers that you mark,you should try to answer each.question. However, do not spend too muchtime on any one item, If you have difficulty determining the correctanswer, make the most careful guess you can and go on to the next item.If you finish before time is called, you can go back and work on theitems that were more difficult. Try to do as well as you can.
If you have any ouestions about what you are to do, ask your teacher now.
Do not begin working until the teacher tells you to start.
B-5

Given that a and b are the coordinatei of two points on the number line, whichone of the following expressions gives the coordinates of the point midway betweenthem? O 6
A.a + b
,F:-.47 8.2
b + 2aC. D. PriTT b - a
2
Which one of the following is equivalent to the expression 4(k + 4)3 ?
A. 4k + 7 B. 4k + 12 C. 7k 28 D. 4(k 4) (k 4)3 E. 12k 48
t,.
If the'area of a triangle is 48 and the altitude is less than or equalto 12,which one of the following is true of the base?
A. The base Li greater than or equal to 4. ,
B. The base is greater than 4 and less than 6.C. The base is greater than or equal to 8..D. The base is less than or equal to 4.E. The base is less than or*equal to 8.
If y ig an odd number, what is true of the expression
A. It is odd if a is even.B. It is even if a is even.C. It is odd if a is odd.D. It is always even.E. It is always odd.
y2 11.1 ay
5. Which one of the following is *not the graph of a function y f(x) ?
A. B.
E.
C. D.

Which one of the following represents the graph of the equation y x + 1 ?
A. B.
7. Which one of the'following is true?
A. 45.5!' al 209 B. 44 4. 44 48 C. (44)2 416 D. 44,54
4,44 168
Consider the following table defining.the operation 4 A a
Which one of the axioms below does not apply to the system? a a
A. Commutative law. a 0B. Closure principle.C. Associativelaw.D. Uniqueness principle.E. Transitive property.
a cGiven F --+-- and d is kb, which one of the expressions below is equivalentb d
B. US-1-g ka + c
B-7
a + kcD.
ka + cE.
kb

10. Which one of the following is the graph of the intersection of the following'system of equations:
) x2
y < 2
B.
11. The sum a + b is qmaller than a and also smaller than b. Which one of thefollowing statements is correct?
A. Both a and b are positive.B. Both a and b are negative.C. a is positive and b is negative.D. a is negative and b is positive.E. One of the numbers is zero.
12. The larger of two numbers is .17 more than twice the smaller number. If thelarger number is divided by the smaller number, the quotient is 3, with aremainder of 7. If x is the smaller number, which one of the following equationsshould be used to determine x ?
A. 2x - 17 0 10x B. 2x + 17 3x + 7
'2x - 17 10

13. Consider the following two statements about a.2-digit number we wish to find.
1. The product of the digits is 14 and their sum is 9.
2. If the number were doubled, the resulting number would be a 3-digit number.
Which of the statements above must be used to solve the problem?
A. Only statement 1.
B. Only statement 2.
C. Both statement 1 and statement 2.
D. Either statement 1 or statement 2.
E. More information is needed to find the number.
14. If (x)(x - 4) -3, which one of ihe following paiis of substitutions for xmakes the equation true?
A. x -3 or x 1 B. x 0 0 or x 4 C.- x 0 -3 or x 0 4 .
D. x 0 or x 0 1 E. x 3 or x 0 1
.c
15. Define, form, two nuMbers a and b
:lab-least common multiple of a and bi
a8b0greatest common divisor of a and b.
What is the value of (3 5) 8 (3 12) ?.
A. 3 B. 5 C. 12 D. 15 E. 60
16. If* lx yl x and y 0 0, what is the value of y.?
A. 2x B. x C. -2x D. x Ix E. + x
1.7. Consider the following proof:
a2 b2
a2 b2 0
(a - b)(a + b) 0a - b 0.0 or a + b 0.ageb or ame -b
The proof ihows that:
A. A difference of squares, a2 b2, is factorable is (a + b)(a b).
B. s2 b2 and a 0 b are not equivalent sentences.C. If the product of two factors is zero, one of the factors must be equal to zero.
D. If a2 b2, then a b.
If a se b, then a2 as b2.B - 9

,r4
18. What value or values of b will make x 1 a solution of the following equation?
X2 + 2b2X 5b 4. 1 s 0
A. Only -- Only 0 C. 1 and 2 D. 0 and 2 E. Only 11
2 2
19. The operation A is defined for ordered pairs of integers as followst
(aob) A (cod) me (a - co b + d) where + and - are the usual operations of
addition and subtraction.
Why is.the operation A not commutative?
A. Subtraction is not commutative.B. No operation concerning integers is comMutative.C. The system is closed.D. Commutativity involves,only two elements.E. b + d = d + b
20. For what values of x is the following inequality true?
A. x > 0
x2 + 1 < 2x + 1
0 < x or x > 2 C. x > 2 D. x < 2 E. 0 < x 2
21. What is the smallest integer x which satisfies the following inequality?
5
7 .44
A. -10 B. 10 C. 9 D. -9 E. 11
122. To whicn one of the following expressions is
ab
A. a -.Lk 4-1-17; B. 2 %lb C.ab b a
B-10
J7;7; ab3 equivalent?
D. 174.7t5r E. a + b
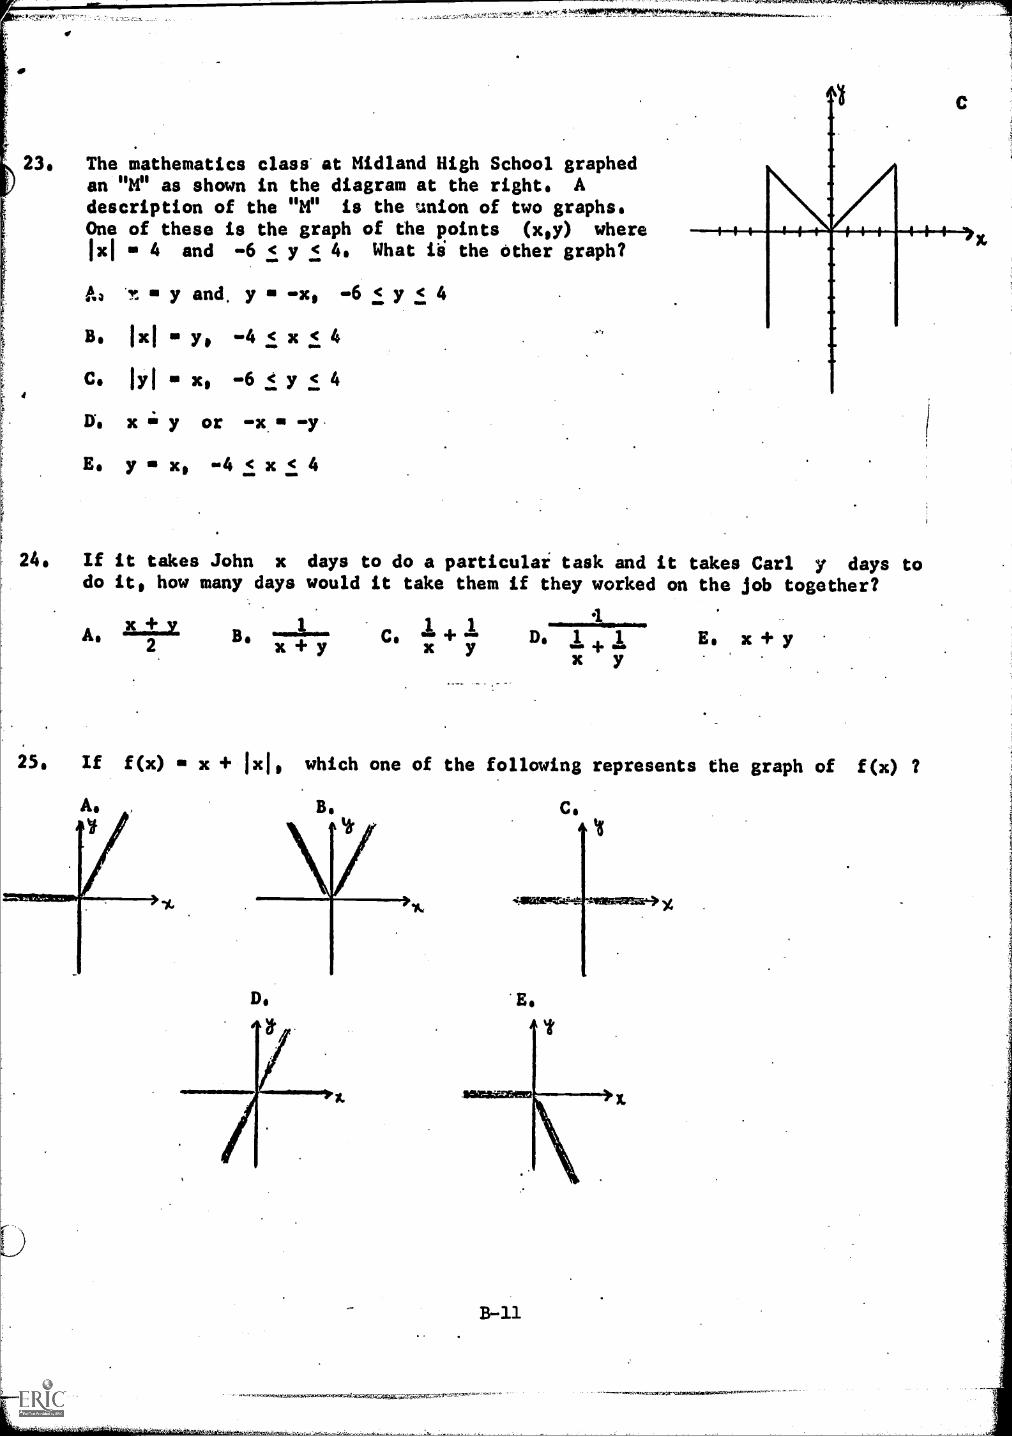
23. The mathematics clast at Midland High School graphedan "M" as shown in the diagram at the right. Adescription of the "NP is the union of two graphs.One of these is the graph of the points (xoy) whereI'd 4 and -6 < y < 4. What ii the Other graph?
ta 'm ea y and. y -xo -6 < y < 4
B. Ixl yo -4 < x < 4
C. lyl xo -6 < y < 4
U. x y or -x.gl y.
E. y xo -4 < x < 4
4
24. If it takes John x days to do a particulai task and it takes Carl y days todo it, how many days would it take them if they worked on the job together?
4C. Do Is .1. J. E. x + yA. x.--1-42.
2
1B.x + y
25. If f(x) x + !xi, which one of the following represents the graph of f(x) ?
B. C.
E.
B-3.1

Code: XXXVIII-B-329
General Instructions:
This is a test of howmathematics. You aresome of the questions
MINNESOTA NATIONAL LABORATORY
. MATHEMATICS TEST
LEVEL TWO FORM D
(Grade Nine, 1964 Edition)
well you understand and can apply what you have learned aboutto read and try to answer auk of these questions, even though
may be about things you have not yet studied.
Do not make any marks on the test booklet itself.
You are to indicate your answer only an the Answer Card using the special electro-graphic pencil you have been given.
Do your figuring only on the scratch paper you have been given.
First, print your.name in the space provided on'the Answer Card.
;Alow, read carefully the test procedures given below.
Test Procedures:
1. Read each item carefully and completely, think about the problem and doany figuring you want on the scratch paper.
Read the alternative answers carefully and select the one correct answer.for each question.
3. Indicate your answer on the Answar Card by blackening the space over andaround the letter (A, B, C, etc.) of the answer you have chosen, usingthe electrographic pencil. Be sure that the row in which you mark theanswer has the same number as the question. If.you wish to Change ananswer, be sure to erase the previous answer completely.
4. Since your score depends upon the number of correct answers that.you mark,
you should try to answer each question. However, do not spend too muchtime on any one item. If you have difficulty determining the correctanswer, make the most careful guess you can and go on to-the next item.
If you finish before time is called, you can go back and work on theitems that were more difficult. Try to do as well as you can.
If you have any questions about what you are to do, ask your teacher now.
Do not begin working until the teacher tells you to start.
.B-12
.kam6.7.00.17KA,,414404*--
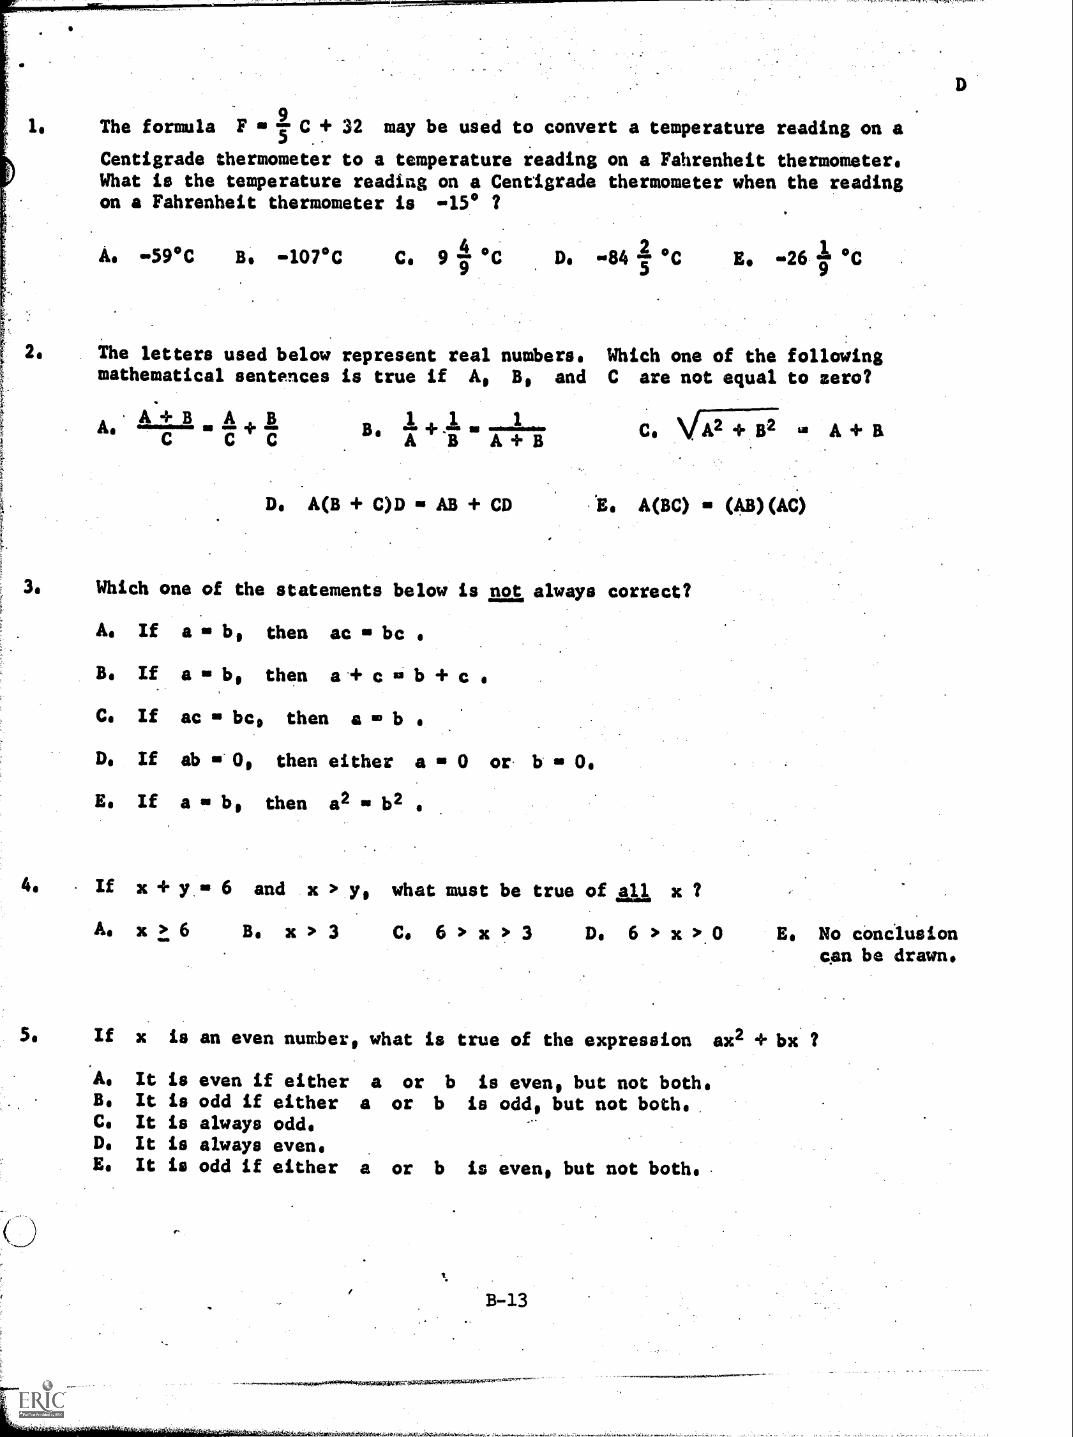
9The formula F C + 32 may be used to convert a temperature reading on a
5 .
Centigrade thermometer to a temperature reading on a Fahrenheit thermometer.What is the temperature reading on a Centigrade thermometer when the readingon a Fahrenheit thermometer is .45° ?
A. -59°C B. -107°C C. 9
The letters used below represent real numbers.mathematical sentences is true if A, B, and
'A+B ABA. ----- +
AC C CB. 1 46.1 1
B A+ B
D. A(B + C)D AB + CD
Which one of the statements below is not always
A. If a ee b, then ac bc
B. If a b, then a + c b + c
C. If ac bey then a b
D.
E.
If ab 09 then either a 0
If a b, then a2 b2
or b en 0.
26st9
Which one of the followingC are not equal to zero?
C. VA2 + B2 is A + B
E. A(BC) se (AB) (AC)
correct?
If x + y ee 6 and x > y, what must be true of all x ?
A. x > 6 B. x > 3 C. 6 > > 3 D. 6 > x >. 0
If x is an even number, what is true of the expression ax2 + bx ?
A. It is even if either a or b is even, but not both.B. It is odd if either a or b is odd, but not both.C. It is always odd.D. It is always even.E. It is odd if either a or b is even, but not both.
B-13
No conclusioncan be drawn.

6. Look at the three equations given below:
1.(x 4. 3)2 x2 + 6x + 9
2. x2 3x 2
3. 3 x2 x2 2
Which one of the statements below is true about ihese equations?
A. 1 is true for some veJues of xo 2 is true for every valUe of xo and
3 is never true.
B. 1 is always true, 2 is true for some values of x, and 3 is never true.
C. Each equation is true for every value of x.
D. Each equation has exactly twa solutions.
E. 1 and 3 are true for sone values of x, and. 2 is never true.
7. One fifth of the sum of 12 and a certain number equals one fourth of the sum'of 6. and twice the number. Which one of the following can be solved to findthe number?
6A.
n 6 + 2n5 4
12 + 3 + nt4
5 4
E. 5(12 + n) r 4(6 + 2n)
84 Which one of the following systems is closed?
A. The set (0,162,36...) where the operation is subtraction.
B. The set of perfect squares where the operation is addition.
C. The set (0) where the operation is addition.
D. The set of odd integers where the operation is subtraction.
E. The set of positive even integers where the operation is division.
B-114

What is the sum of 720 and 721 ?
A. 741 D. 1441 c 49420 D. 8.720 E. 20741
10. What is the complete solution of x(x - 4) a 3(x 4) ?
A. 3 B. 0 or 4 C. 3 or 4 D. 0 E. There are an infinite number
of solutions.
11. If x 0 0, which one of. the following is equivalent'to
A. 3 B. C. x + 2
Jr
12. Which one of the following is alwaim true if a, b, and c are elements of
?
c cA. If .a > b, then <
a b
B. If a > b > c, thena b c
...t....C. /f a > b > c, then
1 <
(a + c) (a + b)
D. If a > b > c, then
E. If a > b, thena b
13. What is the value of x in the following equation? - 8x >6 2 3
1A. x
8C. x < 0 D. x. > 0
B-15
x <.1
8

14. Given two real numbers, let s represent the operation of squaring the firstnumber and then adding this product to the second number.
15.
Examples! asbima.+ b
bsamb2 + a
Which one of the following statements is true?
A. The operation a is commutative only.
B. The operation s is associative only.
C. The operation a is both commutative and associative.
D. The system is not closed.
E. The operation a is not associative nor commutative.
The diagram at the left above is the graph of the line 3y m 2x + 6. Inthe diagram at the right above the x- and y- axes have been reversed,the line still remains in the same position. What is the equation of theline with reference.to the new axes?
A. 3y m 2x + 6
B. 2y w 3x + 6
C. 3x gs -2y - 6
D. 3x m -2y + 6
E. 3x =I 2y + 6
but
16. The base of a triangle has the same length as the side.of a square. Asecond side of the triangle is twice as long as the base, and the thirdside of the triangle is 12 inches shorter than three times the base. If
the perimeter of the triangle equals that of the square, what is the peri-meter of the square?
A. 24 inches B. 12 inches C. 36 inches D. 16 inches E. 20 inches
B-16

17. If (x 1)(x k) x2 + x + ko what is the value of k ?
A. 1 B. 2 C. 3 D. 2 E. -1
18. Which one of the graphs below is the graph of yiX
B.
19. The mathematics class atIgidland High School grapheda "W" as shown in the diagram at the right. Adescription of the "W" is the unicn of two graphs.'One of these is the graph of the points (xoy) where1314 4 and < y < 6. What is the other graph?
A. lyl xo < y < 6
B. y x and y -at, rat < y < 6
C. I I,x, yo -4 <. y < 6
D. x y or
E. -
so .1
< x < 4
20. If i) f(xoy) 1 when x > yoii) f(xoy) so 0 when x yo
iii) f(xoy) 1 when x < yo
what ts the value of f(3,0) + f(3,3) + f(0,3) ?
A. 12 B. 9 C. 0 D. 3 E. 6
B-17

21. What must be true of all values of x which satisfy the inequality
(x + 2)(x - 3) < 0 ?
A. x -2 B. x > 3 or x < -2 C. x < -2 D. < x < 3
or x < 3
22. If Ix + yl x and y 0 0, what is the value of y?
E. +x
23. .A boy can paint a fence in 5 hours and his brother can paint it in 3 hours.How long will it take to paint the fence if the brothers work.together?
7A. 4 hours B. 2 hours C. 8 hours D. 1 -.hours E. 1 hours8
'24. What values of x satisfy both of the following inequalities?
x2 < 9 and x + 3 < 1
A. us3 < x < -2 B. 2 < x < 3 C. -3 < x < 2 D. -2 < x < 3
E. The two solution sets have no elements in common.
25. Addition and multiplication for 'remainder 3" arithmetic are defined by thefollowing tables:
0 1 2
0 000.0. 1 2
2 0 2 1
A linear equation ax + b c can be solved in this system. For example, ifx + 2 1, then x = 2. What is the solution of x in this system for theequation 2x + 1 m 2 ?
A. 0 B. 3 C. 1 D. 0 or 1 E. 2

Code: XXXVIII-B-330
MINNESOTA NATIONAL LABORATORY
MATHEMATICS TEST
LEVEL FOUR FORM J
(Grade Eleven, 1964 Edition)
General Instructions:
This is a test of how well you understand and can apply what you have learned about
mathematics. You are to read and try to answer each of these questions, even though
some of the questions may be about things you have not yet studied.
Do not make any marks on the test booklet itself.
You are to indicate your answer only on the Answer Card using the special electro...
graphic pencil you have been given.
Do your figuring only on the scratch paper you have been given.
First, print your name in the space provided on the Answer Card.
Now, read carefully the test procedures given below.
Test Procedures:
1. Read each item carefully and completely, think about the problem and do
any figuring you want on the scratch paper.
2. Read the alternative answers carefully and select the one correct answer
for each question.
3. Indicate your answer on the Answer Card by blackening the space over and
around the letter (A, B, C, etc.) of the answer you have chosen, using
the electrographic pencil. Be sure that the row in which you mark'the
answer has the same number as the question. If you wish to change an
answer, be sure to erase the previous answer completely.
4. Since your score depends upon the number of correct answers that you mark,
you should try to answer each question. However, do not spend too much
time on any one item. If you have difficulty determining the correct
answer, make the most careful guess you can and go on to the next item.
If you finish before time is called, you can go back and work on the
items that were more difficult.. Try to do as well as you can.
If.you have any questions.about what you are to do, ask your teacher now.
Do not begin working until the teacher tells you to start.
B-19

1. What type of function is f(x) if the sum of the coordinates is 5 for each andevery point that lies on the graph of f(x) ?
A. A constant function.
B. A logarithmic function.
C. A quadratic function.
D. A cubic function.
E. A linear function.
Given that logio 2 .3010 and log10.3 in .4771, what is the approximate
value of 10810 12 ?
A. 1.8060 B. 1.9084 C. 1.0791 D. 1.1032 E. 1.2476
3. Which one of the following graphs is the most accurate representation of thegraph of f(x) (x + 3)(x - 3)(x - 4)(x + 2) ?
A. 20 B. lOw C.
ONCircle 0 has a radius of 10 inches. AB subtendsa central angle, A0B whose measure is two radians.What is the measure in inches of AB ?
20w _
3D.
B-20
E. 6w.

Which one of the following expressions is equivalent to 22x
(23+ 2
x+3) ?
A. 26x
+ 2(2x2+6x)
B. 46x
+ 4(2x2+6x)
25x
+ 23x+3
D. 22x2+12x
E. 22x+
3+ 2
3x+
3
1
36. What is the value of (5)(16 )(2 ) ?
A. 5 IV B. 160 C. 5 8/72- D. 10 E. 20
7. For which values of x is it true that cos2x sin2x cos2x + sin2x ?
A. No valued of
B. Only 00
C. n--2
where n 0, + 1, + 2,
D. nw where n 0, + 1, + 2,
3wE. + n21r where n + 1, + 2,
2
8. Solve the following equation for x: x log 5 log 25
A. log 20 B. log 5 C. 5 D. 2 E. The base must be known before thproblem can be solved.
9. The.graph on the right is a sketch.of a period forwhich one of the following functions?
A. y 2 sin x + cos x + 1
B. y 2 sin x
C. y - cos x
D. y gis sin(x + 1)
E. y 1 + sin x B-23.

10. The circle shown in the drawing has its center at 0and a radius whose measure is 10 units. If thecosine law is used, what is the length of chord AB ?
A. 8 B. 10 C. 2 41-0 D. (2 1/5) COS X E. 10 4 2 - 2cos x
11. Now should the fraction --;.=1-72: be written so that the denominator is rational?+ 42
A. /I- /2 B. )5-+ J,2 C. D. =Li E.6
12. Consider the equation 2x2 + 7x - 8 kx. For what value of k will the roots ofthis equation be of the same numerical value but opposite in sign?
A. 8 B. 7 C. D. -4 E. None of these
13. Consider the following quadratic equation: (3x)2- 12(3
x) + 27 is 0
What are the values of x that make the equation true?
A. 9 and 3-
B. 6 + 315-
C. 1 and 2
D. 1 and 1
E. None of the preceding is correct.
14. If f(x) 4x2 + 4x + k and f(4) 22 0 what is f(k) ?
A. 21 B. 0 C. 36 D. 48 E. 4x2 + 4x +2
15. What is the solution set of 2x2 + 7x - 4,< 0 ?
A. -4 c x < 1
B.
1C. x < - or x < 4
2
1D. x < or x < -4
2
1E. x > or x < -4
2
B-22

16. Which one of the expressions given below is equivalent to
A.2 sin A1 + cos A
B. 1
C.
D.
E.
1 - cos A1 + cos A
sin A + 1 - cos A1 + cos A + sin A
sin A - 11 - cos A
sin A
1 + cos A
1 - cos Asin A
17. A geometric progression has x as its first term and y as its second term.
What is the fifth term of this progression?
180
A.4 3
Zo. x3
B. L.. E.Ce. a + 4(y x) D.
x3 x4
.111
yl.
ealameam emaw 0111m. 111/
UN IT
-->
'X.
ZLINITs
.The equation of a line in the xy-rectangular coordinate system is y = 2x + 4
What is the equation of this line with reference to a uv-rectangular coordinate
system, if the u-axis is parallel to the x-axis and 1 unit above it, and
the v-axis is parallel to the y-axis and 2 units to the right of the y-axis?
A. v = 2u + 4 B. v = 2u + 5 C. v = 2u + 6 D. v = 2u + 7
E. = 2u + 8
B-23

- ' "".",*4*"''')".""
19. Which one of the following graphs best describes the graph of y Ix + 11 ?
B.E.
20. If f(x) = x + 1 and g(x) x2, what is g(f(x)) f(g(x)) ?
A. 0 B. 2x C. 1 D. x2 a. (X 1) ge(x + 1) - fox2
21. What is the smallest positive angle 0 such that 0° < 0 < 360° when the following
condition exists: cot 0 = IT?
A. 330° B. 240° C. 210° D. 150? E. 120°
22. Which one of the following is not an axiom for complex numbers? Assume x, y, andz represent complex numbers,
A. x+y=y+ x
B. xy = yx
C. (x + y) + z = x + (y + z)
D. If x < y, and y < z, then x < zo
E. If x y and y = z, then x z.
12 f(3)23. A periodic function has the following values: f(0) = 2, f(-2 ) = = -1,
2'
1 1f(4) is 2
'f(6 ) -le What is the value of f(-3) ?
2 2
A. 1 B. -1 C. 2 D. 22
B-24

24. The geometric figure with a given perimeter P that encloses the.greatest possiblearea is a circle of circumference P. If we consider only triangles, then thetriangle with perimeter P that encloses the greatest possible area is the trianglewhose sides are of equal length. If only figures of four sides are considered; thenthe figure.with perimeter P that encloses the greatest possible area is a square.
On the basis of the informationlima above which one of the following statementsis true?
A. The area of a triangle is less than the arei'of a square.
B. The area of a triangle is equal to that of a square if and only if theirperimeters are equal.
C. The area of a triangle is less than the area of a circle if and only if thecircle passes through all three vertices of the triangle
25.
D. The area of a square is less than the area of a circle only 'if their perimetersare equal.
E. If the perimeter of a circle is the same as that of a triangle, then the area ofthe triangle is less than the area of the circle.
Note that the axes and graphs of the equations
x2 + y2 as 1 and x y split the plane into twelvedistinct regions, six of which are in the interior
and six in the exterior of the circle. Which of these
regions satisfy the inequalities
y > 0, .x2 + y2 > 1, and y > x ?
A. 1, 2, 6 B. 1 only C. 1, 6. D. 7,12 E. 2 only
B-25

Code: XXXVIII -B -331
MINNESOTA NATIONAL LABORATORY
MATHEMATICS TEST
LEVEL FOUR FORM K
(Grade Eleven, 1964 Edition)
General Instructions:
This is a test of how well you understand and can apply what you have learned aboutmathematics. You are to read and trk to answer each of these questions, even thoughsome of the questions may be about things you have not yet studied.
Do not make any marks on the test booklet itself.
You are to indicate your answer only on the Answer Card using the special electro-graphic pencil you have been given.
Do your figuring only on the scratch paper you have been given.
First, print your nama in the space provided on the Answer Card.
Now, read.carefully the test procedures given below.
Test Procedures:
1. Read each item carefully and completely, think about the problem and doany figuring you want on the scratch paper.
Read the alternative answers carefully and select the one correct answerfor each question.
3. Indicate your answer on the Answer Card by blackening the space over andaround the letter (A, B, C, etc.) of the answer you have chosen, usingthe electrographic pencil. Be sure that the row in which you mark theanswer has the same number as the question. If you wish to change ananswer, be sure to erase the previous answer completely.
4. Since your score depends upon the number of correct answers:that you mark,you should try to answer each question. However, do not spend too muchtime on any one item. If you have difficulty determining the correctanswer, make the.most careful guess you can and go on to the next item.If you finish before time is called, you can go back and work on theitems that were more difficult. Try to do as well as you can.
IL you have any questions about what you are to do, ask your teacher now.
Do not begin working until the teacher tells you co start.
B-26

1. Which one of the following is the expression for sin 879° when it is
expressed in terms of a function of a first quadrant angle?
A. sin 21' B. cos 21° C. sin 69° D. ...sin 69° E. a-sin 21°
2. If p and q are the roots of the equation x2 + bx + c.10 0 then what is
the value of p + q ?
A. b B. -b D. c b2 4ac4 b + c
3. If lx - 11 2, what number (or numbers) does x represent?.
A. 3 only B. 1-1 only C. -3 only D. -1 or 3 E. Cannot be.
determined.
4. Given the graph of the equation y x2 - 2x - 3 ,
as shown in the drwaing, which values of x satisfy
the inequality x2 - 2x - 3 > 0 ?
A. X > 3
B. < X < 3
C.
D.
E.
X > -1 or x > 3
x > .3 or x < -1
X < -1 or x < 3
5. WhiCh one of the following is equivalent tolog a + log b
1 B. 2ab
C.a + b
D. log '(a.b). - log a - log b
6. If log ab 2, what is the value ofY
y?
abA. B. 10 C. ab2 D. 2ab E. 4a7
2
B-27
1.226.1.1:11.ask,

7. If f(x) m 711 sin(2x + w), what is the period of f(x) ?
A. 22
C. 7w D.
8. What values of t make the expression (t2 1)2x2 + (t - 1)x + t + 1 a quadraticfunction?
A. All real values of t.
B. All real. values of t except t le
C. All real values of t except t -1.
D. All real values of t except t 1 and t -1.
E. All real values of t except -1 < t < 1.
9. If the symbol sin..-1
x is used to represent the inverse sine of.x, what is the
value of cos(sin-1 -1 n I(
-.5) if we restrict the range of sin x .. > x > . g2 - 2(
OD B.2
C.6
D.if
E. 4:?t1(-.5)
6
10. If x2 > y2 and y > 0, which one of the following inequalities expresses arelationship between x and y that is always true?
A. ç>y B. x > + yv2
C. x > D. x > y or x < -y
E. x < y Or x > -y
.11. Which one of the following equations, when graphed for one period, will have anappearance as shown in the sketch at the right?
A. y sin(-x)
B. .y cos(-x)
C. y -cos x
D. y -1 + sin x
E. y sin x + cos xB-28

12. Suppose a.coordinate system is constructed as follows: We let our reference system
consist of one line segment with end points A and B and a length of 10 unit
Let point P be any point in the planes Let x be the distance that P is fro'
A and y be the distance that P is from B. Thus the location of point P
is given by specifying the ordered pair (x, y)4 In this coordinate system what is
the graph of the equation y 3 ?
A4 A single point
B. .1W points
C. One line parallel to segment AB
P. Two parallel lines
E. A circle
134 Which one of the following pairs of inequalities has a graphical
solution as indicated by the shaded region of the graph at tbe right?
A. x2 y and y < x -3
B. x2 > y and y > 3
C. y 1, x2 and y < 2x -6
P. y > x2 and y < 3 -x
E. x2 > y and y < 6 -2x
144 If we.know two angles and one side as shown in the diagram
the right, what is x ?
A. 6 sin 200
B46 sin 20°
sin 35°
C. 6 sin 35°
D. 6 sin 35°sin 20°
E. sin 20°6 sin 35°
at
B-29
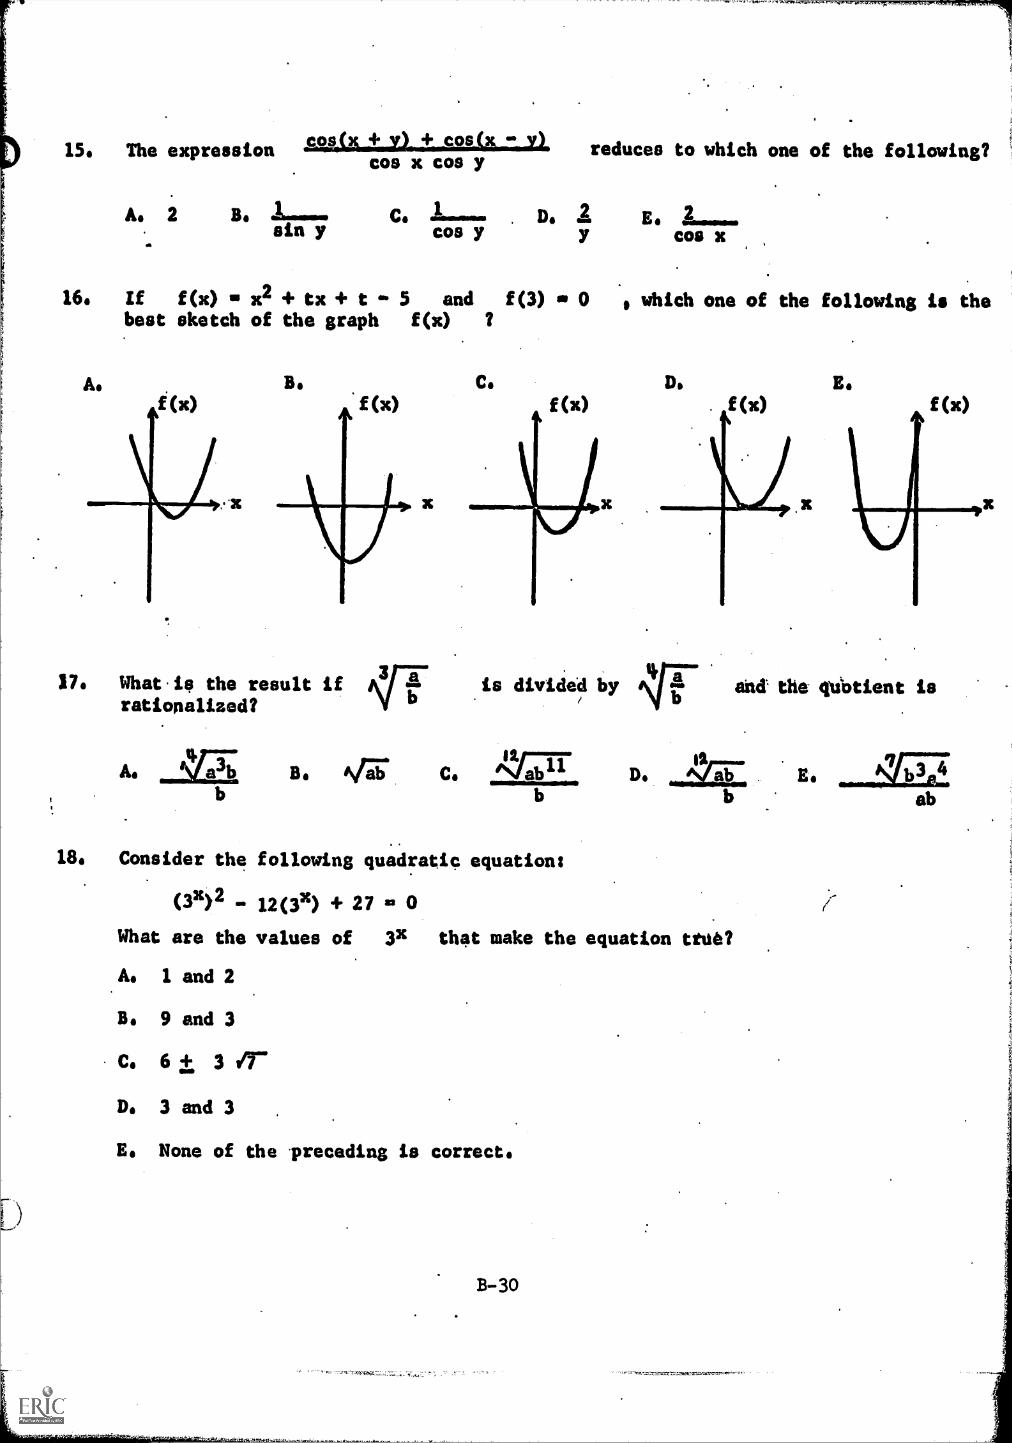
15. The expression
A. 2
SMILLIJULSOLLIZALcos x cos y
reduces to which one of the following?
C. . D. 2 E. 2cos y y COO X
16. If f(x) x2 + tx + t 5 and f(3) 0 9 Which one of the following is thebest sketch of the graph f(x) ?
A. B.
f(x)
174 What.ie the result ifrationalized?
D E.
f(x) f(x)
.is divided by and the qubtient is/ b
A. hY:57; B. c. 4faTfrb
18. Consider the following quadratic equation:
(0)2 12(33) + 27 = 0
What are the values of 3x that make the equation ttuê?
A. 1 and 2
B. 9 and 3
C. 6 + 3 ir
D. 3 and 3
E. None of the preceding is correct.
11,
B-30
ab
19. How many values of x satisfy the equation cos 2x 0 if 0 < x < 3600 ?
A. 4 B. 3 C. 2 D. 1 E. 0
20. The volume of a sphere varies as the cube of its radius. If three solid metalspheres of radii a, b, and c respectively are combined to form a largersolid sphere, what is the radius of this sphere?
A. (a + b +
íaB.
+ b + cy3
a + b + cC.
3
D. ZriE77171T7T
Va3 + b3 + C3
3 fx2 4. 5021. How do you write the expression 2
x+ 2' ' if 2x is removed as a common
factor?
A. 2x(23 + 2x+5)
B. 2x(23 + 2x245)
Cs 2x(22x
+ 2x2+4x
)
D. 2x(13 + 1x4.5)
Be 2x(22x 2x+5)
22. What is x if the numbers 1, x, and -1 form a geometric progression?
A. + 1 B. -1 C. 0 D. E. +
) 23. If (x + 51) (2 - 71) a 2 + yi, what is x + y ?
A. 2 B. 8 C. 16 D. 32 E. .121 - 4 +. y2

24. At a cafeteria counter a man has to choose between two items of food. The table
below lists the four possible decisions he might make:
Food A
take not take not take not take not
x x x x
Food B x x x x
Case I ,Case II Case III Case IV
If he goes to a third item, he may either take it or not. This doubles the total
number of decisions, since each of the decisions in the table may be paired with
taking the third item (4 possibilities) or not (4 possibilities). How many
possible decisions might he make if N items of food are offered and he takes
lit least one item?
A. 2N
1 B. 2N-1
C. 2 D. 3N
E. Not enough information is give
25. Dividing a number by 3 + fT gives the same results as if the numbet were
multiplied by which one of the following?
A6 7 7
B. -3 - 4-37
C. - -4 2
D. ---13 4-2--
E. 3 -
B-32
(1,

Codes XXXVIII-B-332
MINNESOTA NATIONAL LABORATORY
MATHEMATICS TEST
LEVEL FOUR FORM L
(Grade Eleven, 1964 Edition)
General Instructions:
This is a test of how well you understand and can apply what you have learned aboutmaihemaLics. You are to read and try to answer each of these questions, even thoughsome of the questions may be about things you have not yet studied.
.
Do not make any marks on the test booklet itself.
You are to indicate your answer only on the Answer Card using the Special electro-graphic pencil you have been given.
Do your figuring only on the scratch paper you have been given.
First, print your name in the space provided on tlie Answer Card.
Now, read carefully the test.procedures given below.
Test Procedures:
1. Read each item carefully and completely, think about the problem and doany figuring you want on the scratch paper.
2.. Read the alternative answers carefully and select the one correct answerfor,each question.
3. Indicate your answer on the Answer Card by blackening the space over andaround the letter (A, B, C, etc.) of the answer you have chosen, usingthd electrographic pencil. Be sure that the row in which you mark theanswer has the same number as the question. If you wish to change ananswer, be sure to erase the previous answer completely.
4. Since your score depends upon the number of correct answers that.you mark,you should try to answer each question. However, do not spend too muchtime on any one item. If you have difficulty determining the correctanswer, make the most careful guess you can and go on to the next item.If you finish before time is called, you can go back and work on theitems that were more difficult. Try to do as well as you can.
If you have any questions about what you are to do, ask your teacher now;
Do not begin working until the teacher tells you to start.
B-33

1. A line passes through the'point (2,1) and has a slope of. 3. What is theordinate of a point on this line if its abscissa is 4 ?
A. 7 B. 6 C. 5 D. 4 E. 3
2. What is the product of 47(7)-(7.7). and jiiTi;"A. + 2413 B. 2 TIT C. 2i ,FiT D. -2i JIT E. -2,F5
3. Given the graph of a function f(x) :
A.
Which one of the following graphs is the graph of -f(x)?
B. C.
4(%) 4(0
4. What are the factors of (a 3)2 (b 4)2 ?
As a + 3 and b - 4
B. a + b - 1 and a. + b - 1
C. a + b + 1 and a - b - 7
D. a + b - 1 and a - b - 1
E. a + b - 1 and a - b + 7
5. What is the sum of the roots of the equation x(x + 1) -.12 ?
A. 1 B. -1 C. 7 D. 11 E. 23
6. If x < l, what is a simplification of the expression I2x - 31 + 13 - 2x1 ?
A. 0 B. 4x - 6 C. 6 - 4x D. 6 E. 4x
B-34-,....,....4,,37,=4....0;214W-VAW:

The following table gives numbers from 2.0 to 8.0 and their logarithms to'
-.the base 10 correct to two decimal places. What is the value of 10
6according
to the table?
No. kg No. Itsa2.5 .40 445 .65
3.0 ..48 5.0 470
3.5 .54 5.5 .74
4.0 .60 6.0 678
11.24. 'WA.
6.5 .81
7.0 .85
7.5 .88
8.0 .90
.25 B. -4.0 C. .078 D. 7.078 E. .040
Which one of the following expressions is equivalent toa n ( 90° - w)
.?cos (90° - w)
A. tan w B. sin w C. cos w cot(90° w) E. cot w
9. What is the.product (x-1
+ y-1
)(x + y) where x 0 0, y 0 0, and x 0 y ?
As 11 B.xy
1
(x + y)2C. E.
x2 y 2
10. What must be true of k if the equation 7x2 + kx + k - 3 = 0 has 0 as one root?
k = 7 B. .k < 1 C. k = 3 D. k2 - 28k +84 = 0 E.kO
11. How many terms are there in the product (a + b)7 (a + b)8 ?
A. 15 B. 16 C. 17 D. 57 E. 9
12. If (a,b) A (c,d) = (a - c, b + d) and (3,2) A (0,0) = (x,y) A (3,2), what is (xa)
A. (0,0) B. (-3,-2) C. .(3,1) D. (6,0) E. (2,3)
At how many points doe: graph of y = x2 - 5 intersect the graph of x2 + y2 = 25
A. 4 B. 3 C. 2 D. 1 E. 0
B-35

14. We have 7 uniforms with different numbers on them to give to give to 4 footballplayers. In how many different ways can we distribute them?
A. 4 B. 961 C. 2401 D. 28 E. 840
15. The equation y a X2 - 4x + 3 defines a function. Let x be any element of thedomain and y be the corresponding element of the range. If the domain is theset of all real numbers, what is the range of the function?
y > 0 B. y < 0 C. y > -1 D. y > 3 E. All real numbers'
16. Let a, b, and c be the three sides of a triangle with a = 2, b = 3, andc 4. Let angle A be the angle opposite side a. What is- cos A ?
A. B. IL4 3
C.2
Do E.
.17. If 0 < x < 360°, how many values of x satisfy the equation sin2x m sin x ?
A. 3 B. 1 C. 2 D. 5 E. 6
18. What is the solution of =L < 3 ?
2 2B. x > -0 or x > C. x > D. x > -- or X < 03 3 3
20 < x <
3
i.-
19. If f(x) x + 7, and g(x) is the inverse of f(x), what is g(3).?
A. is- B. -10 C. -4 D.10 10
E. 4
20. What must be true of 'k if the graph of the function 32 + 2x + k intersectsthe x-axis ?
A. k 01
B. k > 0 C. k <3
B-36
D. k > 1 E.

21. Which ono of the following equations has a graph asshown in the sketch at the right?
A. y = sin2x B. y = cos2x
D. y = sin E. y = cos f
y = sin(90° x)
22. In circle 0, iq is 5 units in length. The radius ofthis circle is 10 units in length. What is the measureof angle 0 ?
2w - 1 5nA. B.4 12
D.5w + 3
E. .......6 10
23. Suppose we have 60 feet of fencing available to enclose a rectangular yard thatwill have a house serving as one side of the yard. We.notice (see table below)that the area enclosed will depend upon how this 60 feet of fencing is used.
o us e YAR Dlh
te
lamath Width Area
50 ft. 5 ft. 250 sq. ft.40 ft. 10 ft. 400 sq. ft.30 ft. 15 ft. 450 sq. ft.
Which one of the following conclusions is correct?
A. The maximum area Will be obtained if the yard is square.4.
B. The area of a rectangle is greater than the area of a square.
C. The area of the yard continuesito increase as its width increases.
D. The maximum area will be obtained if the length is twice the width of the yard.
E. The area can be made as large as we choose.
B-37
4.4

24. Which one of the following is a sketch of the graph of y
a > 0 but a 0 1 ?
A. B. C.
logaxa
D. E.
where
%se
25. By definition, i2 -1. Consider the following three statements.
1. If i > 0, then i2 > 0 since the square of a positive number is positive.
Since i2 c -1, we have -1 > 0.
2. If i < 0, then i2 > 0 again since the*square of a negative number positiv
and, since i2 = -1, we have -1 > 0 again.
3. i 0 0 -)
Al a result of the above statements and definition, which one of the followingstatements can definitely be stated as a theorem?
A. All complex numbers are positive.
1"ne complex numbers can not be ordered.
C. -1 > 0 in the complex number field.
D. i TT is the square root of a positive number.
E. A number of the form a + bi, where a and b are real, is positive ornegative depending upon whether a and b are positive or negative.
. B-38
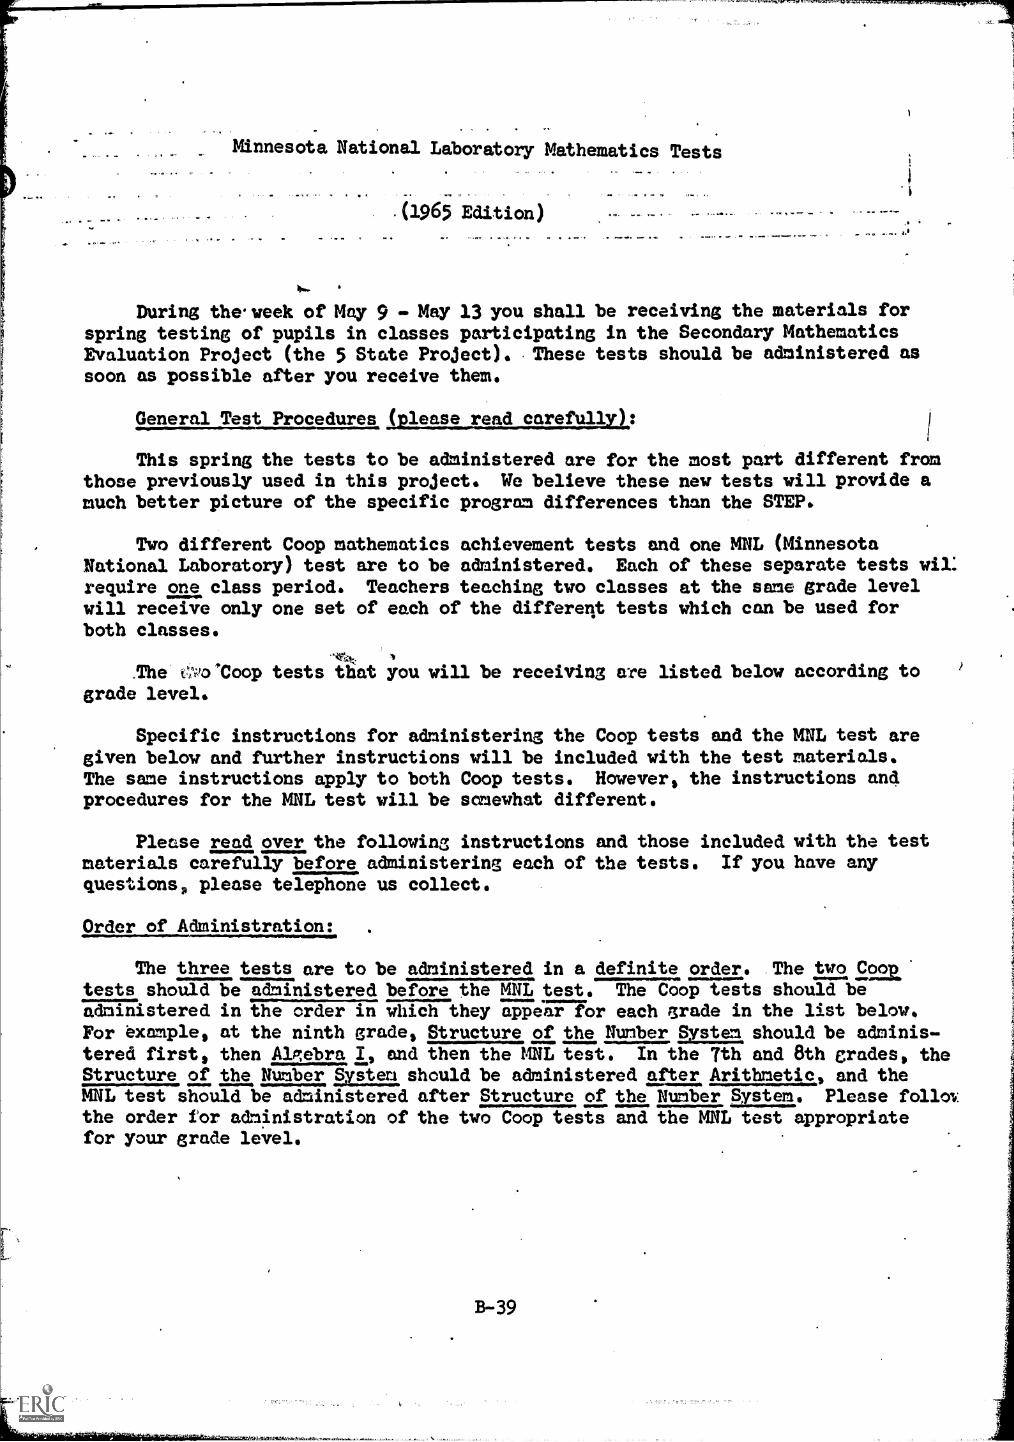
Minnesota National Laboratory Mathematics Tests
During the.week of May 9 - May 13 you shall be receiving the materials forspring testing of pupils in classes participating in the Secondary MathematicsEvaluation Project (the 5 State Project). These tests should be administered assoon as possible after you receive then.
General Test Procedures
This spring the tests to be administered are for the most part different fromthose previously used in this project. We believe these new tests will provide amuch better picture of the specific program differences than the STEP.
Two different Coop mathematics achievement tests and one MNL (MinnesotaNational Laboratory) test are to be administered. Each of these separate tests wil:require one class period. Teachers teaching two classes at the same grade levelwill receive only one set of each of the different tests which can be used forboth classes.
,qnt
.The tvo'Coop tests that you will be receiving are listed below according tograde level.
Specific instructions for administering the Coop tests and the MNL test aregiven below and further instructions will be included with the test materials.The same instructions apply to both Coop tests. However, the instructions andprocedures for the MNL test will be somewhat different.
Please read over the following instructions and those included with the testmaterials carefully before administering each of the tests. If you have anyquestions, please telephone us collect.
Order of Administration:
The three tests are to be administered in a definite order. The two camtests should be administered before the MNL test. The abp tests should beadministered in the order in which they appear for each grade in the list below.For example, at the ninth grade, Structure of the Nunber System should be adminis-tered first, then AlRebra I, and then the MNL test. In the 7th and 8th erades, theStructure of the Number System should be administered after Arithmetic, and theMNL test should be administered after Structure of the Number System. Please follolthe order for administration of the two Coop tests and the MNL test appropriatefor your grade level.
B-39

Answer Cards Identification:
You will be receiving, as before, mark-sense answer cards on which pupils areto record their answers. Since the name of the test is not on the answer cards,the answer cards have been color coded. It is very important that the correctanswer cards be used with each test. For the Coop tests, each answer card has asingle colored stripe along one border. The colored stripe that goes with eachCoop test is indicated in the list of tests below. The MNL answer cards have twobroad colored stripes (red & blue) in the middle of each card. Please use thecorrect color answer cards with each test.
Each pupil will only need one answer card for each test.
Grade Test Answer card (Border Color)
.7 & 8 Arithmetic YELLOWStructure of the
Number System BROWNMNL Test (Special MNL Answer Card)
9 Structure of theNumber System PINK
Algebra I BLUEMNL Test (Special MNL Answer Card)
10 Geometry I GRAYGeometry II GREENMNL Test (Special MEL Answer Card)
11 Algebra II PURPLEAlgebra III ORANGEMNL Test (Special MNL Answr Card)
For all of these tests, we would like you to encourage the pupils to do thevery best they can. An adequate assessment of the different secondary mathematicsprograms depends upon pupils' performing as well as they can on these tests.
Test Instructions for the Coop and MNL Tests:
cons Tests
Specific instructions for administerins these tests will be included wit.the test materials. These instructions should be followed exactly as given withthe following exceptions:
1. Instead of answer sheets, answer cards are to be used.
2. Pupils are to put only their names on the answer cards.
Note: Pupils are to be allowed exactly 40 minutes working time on eachCoop test.
B-I40

MIL Tests -
Specific instructions for the MNL tests are on the test forms themselves.Particularly note.:the following:
1. The MNL tests should be distributed with the answer cards at the verybeginning of the class period.
2. Pupils should fill in all information requested at the top of theMNL test answer card (name, sex and birthdate).
3. The instructions on the test forms should be read aloud at the sametime that the pupils read the instructions to themselves.
h Pupils should be given the full remainder of the class period to workthe MNL tests.
5. For each MNL test, pupils are to make two responses to each question -a first and a second response. The first and the second responses are to
be indicated in different places on the answer cards. The first response
is to be the answer a pupil thinks is the most nearly correct alternative.The second response is to be the answer the puDil thinks is the next mostnearlycorrect alternative.
In other words, a pupil's first response represents the answer that hewould choose if only one response were required. The second response
represents the pupil's next best choice among the.remainin3 alternatives.
Pupils are always to make both responses, Le, make a second choice eventhough they feel their first choice was the only correct choice. If a
pupil does not make a second choice, his first choice will not count.
There is however, only one correct answer to each question.
6. Any questions pupils have as to test procedures should be answered onan individual pupil basis.
Packaging & Returning Materials:
Please return all copies of each of the tests immediately after you havefinished administering them. Those teachers who are teaching both a control and anexperimental class should take care that the test materials of their two classesdo not get mixed up in any way. Note: The answer cards will be in individualenvelopes, properly identified for each test. Please return the answer cards inthe designated envelopes. You will find return postage enclosed with the materialsfor your convenience.
Please write the following below the stamp:
SPECIAL FOURTH CLASS MAILOBJECTIVE TEST MATERIAL

MINNESOTA NATIONAL LABORATORY
MATHEMATICS TEST
FORM C
(Grade Nine, 1965 Edition)
Read these instructions carefully.
Print your full name (last name first), grade (7, 8, 9, 10, 11, or 12), and7arM or Frgthe spaces provided on your IBM answer card.
Look at your IBM answer card. Note that there are two columns for youranswers. One column is labeled 1st choice, and the other column is labeled2nd choice. When you work a problem, you may obtain two answers, one whichyou think is most likely correct and another which you think is next mostlikely correct. If so, you are to mark the first answer in the columnlabeled 1st choice and the second answer in the column labeled 2nd choice.Even if you.do not have a second choice, guess one and mark your guess inthe colum labeled 2nd choice. If you do not have a first or a secondchoice, guess them both and mark one guess in the column labeled 1st choiceand the other guess in the column labeled 2nd choice. In other words, makesure that you mark two answers in the appropriate columns to every,question.Using the electrographic pencil given you, make your marks heavily and sothat they fill the entire spaces over and around the letters correspondingto your answers.
Do not write in the test booklet. Use scratch paper to do your figuring.You will have the remainder of the class hour to complete the test. If youhave any questions, raise your hand; your teacher will come to jou as soonas possible. Now begin.
B-42

1. The sum a + b is smaller than a and also smaller than b. Which one
of the following statements is correct?
A, Both a and b are positive.
B. Both a and b are negative.
C. a is positive and b is negative.
D. a. is negative and b is positive.
E. One of the numbers is zero.
2. Which one of the following is equivalent to the expression 4(k + 4)3?
A. 4k + 7 B. 4k + 12 C. 7k + 28 D. 4(k + 4) (k + 4)3
E. 12k + 48
3. Suppose that a and b are the coordinates, respectively, of two points
on a number line (see diagram at right).
Which one of the following is an expression for athe coordinate of the point midway between them?
a + b b + 2a b - a
A. )1,7-771. B. 2 C. 2 D. /a2+b2 E. 2
4. Suppose x(x 4) = -3. For which pair of values of x below will sub-stitution of either value make this equation true?
A. x = -3 or x = 1 B. x = 0 or x = 4 C. x = -3 or x = 4
D. x = 0 or x = 1 E. x = 3 or x = 1
5. If y is an odd number, what is true of the expression y2 + ay?
A. It is odd if a is even.
B. It is even ff a is even.
C. It is odd if a is odd.
D. It is always even.
E. It is always odd.
B-43

6.a c
Suppose F = + and d = kb. Which one of the expressions below is
equivalent to F?
7
a + kcA. ------- B.
k(a + c) ka + cC.
The larger of two numbers is 17 moreWhen the larger number is divided byis 3$ with a remainder of 7. If x
of the following equations should be
D.a + kc ka + c
E.kb
than twice the smaller number.the smaller number, the quotientis the smaller number, which oneused to determine x?
A. 2x - 17 = 10x B. 2x + 17 = 3x + 7 C.3x
= 72x + 17
D. 2x + 17 = 3x2 + 7x E. 2x - 17 = 10
8. What value or values of b will make x = 1 a solution of the following
equation?
A.
x2 + 2b2x - 5b + 1 = 0
2B. 0
1C. 7 or 2 D. 0 or 2 E. 2
9. Definition: I-al = al = a if a > 0 and 1-al = lal = -a if a < 0.
Thus, the equation x-yl = x implies not only that x > 0 but also that,
if y 0 0, y is equal to
A. 2x B. x C. -2x D. x Ix1 E.
10. What is the smallest integer x which satisfies the following inequality?
(Integers are positive or negative whole numbers.)
A. -10 B. 10
B-104
D. -9 E. 11

11. A portion of the graph at the right is a
graph of the following inequality:
x2 < 2x
For what values of x is this inequality true?
A. x > 0 B. x < 0 C. x < 0 and x > 2
D. x < 2 E. 0 < x < 2
12. Let L be the lealLamlamilli122. of 3 and 5 and G be the greatest
common divisor of 3 and 12. What is the greatest common divisor of L
and G?
A. 3 B. 5 C. 12 D. 15 E. 36
13. The area A of a triangle is equal to one half the product of its altitude
1a and its base b; that is, A = Fah. If A = 1i8 and a < 12, which one
of the following statements is true?
A. b > 4 B. 4 < b < 8 C. b > 8 D. b < 4 E. b < 8
14. Which one of the following is a graph of the intersection of the following
system of inequalities? (Intersections are indicated by
y > x2 shaded areas.)
A.
D.
y < 2
B. C.
B-45

15. We wish to find a 2-digit number. The product of the two digits is 20
and their sum is 9. If the numbers were doubled, the resulting number
would be a 3-digit number. What is this 2-digit number? (Hint: Let
x designate one digit and y the other; then set up simultaneous
equations.)
A. 54 B. 27 C. 145 D. 72 E. 36
16. Which one of the following is a graph of the equation y = x + 1? (Hint:
try a few values of x, like x = 0 or x = 1 or x = -1.)
A. B.
E.
C. D.
17. Definition: y is a function of x - in symbols, y = f (x) - if there
corresponds to each possible value of x only one value of y. Which
one of the following cannot be a graph of y = f (x)?
A. C.
B-46
D. E.

18. Consider the table at the right defining the a
make this operation commutative, what lettera a
or letters should be in the missing cell?
operation A. For example, a A b = c. To
A
A. a B. b C. c D. a + b E. ab
19. To which one of the following expressions is
A.a + bab
/a3b +Ab3ab
equivalent?
B. /77777 C. T7+-irv/a b
D. 471777 E. a + b
20. Working steadily and alone, John takes x days and Carl takes y days
to build a fence. How many days would it take them if they each started
at a different end and worked toward each other? (Hint: First find what
fraction of the fence they could build together in one day.)1
A. B.1
C. + --1 1 1 1
D. + E. x + y2 x + y x y x y

MINNESOTA NATIONAL LABORATORY
MATHEMATICS TEST
FORM D
(Grade Nine, 1965 Edition)
Read these instructions carefully.
Print your full name (last name first), grade (7, 8, 9, 10, 11, or 12), and
mrork or FrIlithe spaces provided on your IBM answer card.
Look at your IBM answer card. Note that there are two columns for your
answers. One column is labeled 1st choices and the other column is
labeled 2nd choice. When you work a problem, you may obtain two answers,
one which you think is most likely correct and another which you think is
next most likely correct. If so, you are to mark the first answer in the
column labeled 1st choice and the second answer in the column labeled 2nd
choice. Even if you do not have a second choice, guess one and mark your
guess in the column labeled 2nd choice. If you do not have a first or a
second choice, guess them both and mark one guess in the column labeled
1st choice and the other guess in the column labeled 2nd choice. In other
words, make sure that you mark two answers in the appropriate columns to
every, question. Using the electrographic pencil given you, make your marks
heavily and so that they fill the entire spaces over and around the letters
corresponding to your answers.
Do not write in the test booklet.You will have the remainder of theyou have any questions, raise your
soon as possible. Now begin.
Use scratch paper to do your figuring.class hour to complete the test. Ifhand; your teacher will come to you as
B-48

1. If x is an even number, what is true of the expression ax2 + bx?
A. It is even if either a or b is even, but not both.
B. It is odd if either a or b is odd, but not both.
C. It is always odd.
D. It is always even.
E. It is odd if either a or b is even, but not both.
2. Which one of the following mathematical sentences is true if A, B, and C
are not equal to zero?
A +B_AB 1 1 1B. 4. 1; A + B
C. TA-2-77---B2 = A + B
D. A(B + C)D = AB + CD E. A(BC) = (AB) (AC)
Definition: The set of numbers (a, b, c) is closed with respect to the
arithmetic operation A if a A b, a A c, and b A c are equal to
either a, b, or c.
Which one of the following sets is closed?
A. The set (0,1,2,3,...) with respect to subtraction.
B. The set of perfect squares with respect to addition.
C. The set (0) with respect to addition.
D. The set of odd integers with respect to subtraction.
E. The set of positive even integers with respect to division.
4. Look at the three equations below:
1, (x 4. 3)2 = -2 e+ vx + 9
2. x2 - 3x = -2
3. 3 4. x2 = x2 .2
B-49
7,

Which one of the following statements about these equations is true?
A. 1 is true for some values of x, 2 is true for all values of
x9 and 3 is true for no values of x.
B. 1 is true for all values of x, 2 is true for some values of
x, and 3 is true for no values of x.
C. Each equation is true for all values of x
D. Each equation has exactly two solutions.
E. 1 and 3 are true for some values of x, and 2 is true for
no values of x.
5. One fifth of the sum of 12 and a certain number equals one fourth of
the sum of 6 and twice the number. The solution of which one of the
following equations will yield the number?
12 6A.
12 + n 6 + 2nB. =
12 + n 3 + nC. =
5
E. 5(12 + n) = 4(6 + 2n)
6. The formula F = 9 C + 32 may be used to convert a temperature reading5
on a Centigrade thermometer (C) to a temperature reading on a Fahrenheit
thermometer (F). What is tne temperature reading on a Centigrade thermometer
when, the reading on a rahrenheit thermometer is - 13 ?
E. -25oCA. -85°C B. -1 C C. 9 C D. -8.6°C
7. Which one of the statements below is not always correct?
A. If a = b, then ac = bc.
B. If a = b, then a + c = b + c.
C. If ac = bc, then a = b.
D. If ab = 0, then either a = 0 or b = O.
E. If a = b, then a2 = b2.
B-50(1)

8. Which one of the following is always true if a, b, and c are positive
integers (1,2,3, ...)?
A. If a > b, then 5- < ca b
1B. If a > b > c, then
1 1. 1+
a b b
C. If a > b > c, then1 1
1777 < 37.717b a
D. If a > b > c, then >c c
1 1E. If a > b, then
a b
The diagram at the left above is the graph of the line 3y = 2x + 6.In the diagram at the right above the x and y axes have been re-versed, but the line still remains in the same position. What is theequation of the line with reference to the axes in their new positions?
A. 3y = 2x + 6
B. 2y = 3x + 6
C. 3x.= -2y - 6
D. 3x = -2y + 6
E. 3x = 2y + 6
10. If f(x,y) = 1 when x > y,ii) f(x,y) = 0 when x = y, and
iii) f(x,y) = -1 when x < y,
what is the value of f(3,0) + f(3,3) + f(0,3)?
A. 12 B. 9 C. 0
B-5l
D. 3 E. 6

11. For what value or values of x is the equation x(x - )s) = 3(x . 4) -true?
A. 3 B. 0 or 4 C. 3 or 4 D. 0 E. 0 or 3
12. The base of a triangle has the same length as the side of a square. A
s-econd side of the triangle is twice as long as the base, and the third
t;ide of the triangle is 12 inches shorter than three times the base. If
the perimeter of the triangle equals that of the square, how many inches
long is the base of the triangle?
A. 6 B. 12 C. 16 D. 24 E, 36
5 113. What value or values of x satisfy the inequality - - 8x >
1?
1 1A. x = -11- B. x > B- C. x < 0
1x > 0 E. x < -1-30
14. Addition (+) and multiplication (0 are defined by the following tables:
+ 0 .1 2
0 0 2
1 1 2 o
2 1 2 0 1
0 1 2
0 0 0 0
1 0 1 2
2 0 2 1
A linear equation ax + b = c can be solved by using these tables. For
example, if x + 2 = 1, then x = 2. Using these tables, what is the value
of x in the equation 2x + 1 = 2?
A. 0 B. 3 C. 1 D. 0 or I E. 2
15. Uhich one of the graphs below could be the graph of y =
A.
A Y
B. C. E.
B-52

16. If (x - 1) (x - k) = x2 + x + k, what is the value of k?
A. 1 B. 2 C. 3 D. -2 E. -1
17. What values of x satisfy the inequality
(x + 2) (x - 3) < 0?
A. x > -2 B. x > 3 or x < -2
D. -2 < x < 3 E. x < 3
C. x < -2
18. What value or values of x satisfy both of the following inequalities?
x2 < 9 and x + 3 < 1
19. If x 0, which one of the following is equivalent to 47 + i47?
14-c
A. 3 B. ,r5" C. x + 2 D. 47 E. 5
20. What is the sum of 720 and 721?
741 B. 1441 C. 49420 D. 8(720) E. 2(741)
B-53

MINNESOTA NATIONAL LABORATORY
MATHEMATICS TEST
FORM G
(Grade Eleven, 1964 Edition)
Read these instructions carefully.
Print your full name (last name first), grade (r, 8, 9, 10, 11, or 12), and
70714 or Firrai the spaces provided on your IBM answer card.
Look at your IBM answer card. Note that there are two columns for your
answers. One column is labeled 1st choice, and the other column is
labeled 2nd choice. When you work a problem, you may obtain two answers,
one whicn you think is most likely correct and another which you think is
next most likely correct. If so, you are to mark the first answer in the
column labeled 1st choice and the second answer in the column labeled 2nd
choice. Even if you do not have a second choice, guess one and mark your
guess in the column labeled 2nd choice. If you do not have a first or a
second choice, guess them both and mark one guess in the column labeled
1st choice and the other guess in the column labeled 2nd choice. In other
words, make sure that you mark two answers in the appropriate columns to
every question. Using the electrographic pencil given you, make your marks
heavily and so that they fill the entire spaces over and around the letters
corresponding to your answers.
Do not write in the test booklet. Use scratch paper to do your figuring.
You will have the remainder of the class hour to complete the test. If
you have any questions, raise your hand; your teacher will come to you as
soon as possible. Now begin.

1. rf lx . 11 = 2, wilat number (or numbers) does x represent?
A. 3 only B. -I only C. -3 only D. -1 or 3 E. 2 only
2. What type of function is f(x) if the sum of the coordinates is
5 for each and every point that liez on the graph of f(x)?
3.
A. A constant function.
B. A logarithmic function.
C. A quadratic function.
D. A cubic function.
E. A linear function.
Suppose we have 60 feet of fencing available to enclose a rectaLgular
yard that will have a house serving as one side of the yard. We notice
(see table below) that the area enclosed will depend upon how this 60
feet of fencing is used.
2,
Length Width Area
50 ft. 5 ft. 250 sq. ft.
40 ft. 10 ft. 400 sq. ft.
30 ft. 15 ft. 450 sq. ft.
Which one of the following conclusions is correct?
A. The maximum area will be obtained if the yard is square.
B. The area of a rectangle is greater than the area of a square.
C. The area of the yard continues to increase as its width increases.
D. The maximum area will be obtained if the length is twice the width
of the yard.
E. The area can be made as large as we choose.
4. If log ab = 2, what is the value of y?
abA. --- B. 10 C. ab2 D. 2ab E. la"
2
B-55

5. What values of t make the expression (t2 1)2x2 (t 1) t 1
a quadratic function?
A. All real values of t.
B. All real values of t exceit t = 1.
C. All real values of t except t = -1.
D. All real values of t except t = 1 and t = -1.
E. All real values of t except -1 < t < 1. .
6. Which one of the following pairs of inequalities has a graphicalsolution as indicated by the shaded region of the graph at theright?
A. x2 > y and y < x - 3
B. x2 > y and y > 3
C. y > x2 and y < 2x - 6
D. y > x2 and y < 3 . x
E. x2 > y and y < 6 - 2x
7. Consider the graph of the equation y = x2 - 2x - 3shown in the drawing. Which values of x satisfythe inequality x2 - 2x - 3 > 0?
A. x > 3
B. -1 < x < 3
C. x > -1 or x > 3
D. x > 3 or x < -1
E. x < -1 or x < 3
Which one of the following is the most accurate representation of thegraph of f(x) = (x + 3)(x - 3)(x - 4)(x ± 2)?
B.. C.
B-56
D.

Note that the axes and graphs of the equations2 -
X2 + y - and x = y split the plane into
twelve distinct regions, six of which are in
the interior and six in the exterior of the
circle. Which of these regions satisfy the
inequalities
0, x2 Al. y2 > 19 and Y > X ?
A. 1, 2, 6 B. 1 only C. 1, 6 D. 7, 12
10. If f(x) = x + 7, and g(x) is the inverse of f(x), what is g(3)?
1 1A. -- B. -10 C. -4 D. -
16E. 14
10
What are the factors of (a 4. 3)2
A. a + 3 and b - 4
B. a +.b - 1 and a + b - 1
C. a + b + 1 and a - b - 7
D. a + b - 1 and' s. - b - 1
E. a + b - 1 and a - b + 7
(b 4)2 ?
log (ab)12. Which one of the following is equivalent to log a + log b
A. 1 B. 2 C.a + bab
D. log (oh) - log a - log b
1 1
13. What is the value of (5)(166)(23)? (Hint: Start by substituting
24 for 16.)
A. 5 ITE B. /DT C. 5 1867 D. 10 E. 20
14. If x2 > y2 and y > 0, which one of the following inequalities
expresses a relationship between x and y that is always true?
A. x > y B. x > + y C. x > D. x > y or x < - y
E. x < y or x > - y
B-57

15. Consider the operation A. If (a,b) A (c,d) = (a c, b + d) and
(3,2) A (0,0) = (x,y) A (3,2), to what is (x,y) equal?
A. (0,0) B. (-3,-2) C. (3,2) D. (6,0) E. (2,3)
16. How many terms are there in the product (a + b)7 (a + b)8?
A. 15 B. 16 C. 17 D. 57 E. 9
17. What must be true of k if the graph of the function 3x2 + 2x + k
intersects the x-axis? (Hint: Find the value of k for which the
graph of the function intersects the x axis at one point; then
draw the graph.)
A. k = 0 B. k > 01 1
C. k <3
D. k > 1 E.3
18. To which one of the following expressions is the product (x-1 + y-I)(x + Y)-1
equivalent?
1 1
xyB. Gc.A.
C. 1
19. The equation y = x2 - 4x + 3 defines a function. If x may be any
real number, what values may y be?
20.
A. y > 0 B. y 4 0 C. y > -1 1). y > 3 E. y 1 -3
MIMI =MEP .111 MIMEO
2 Units
-->
The equation of a line in the xy-rectangular coordinate system is
y = 2x + 4. What is the equation of this line with reference to a
uv-rectangular coordinate system, Y° the u-axis is parallel to the
x-axis and 1 unit above it and if the v-axis is parallel to the
y-axis and 2 units to the right of it? (Hint: Start by substituting
v + 1 for y in the equation of the line.)
A. v = 2u + 4 B. v = 2u + 5 C. v = 2u + 6 D. v = 2u + 7
3. v = 2u + 8
B-58

Appendix C: Contingencies in content between Minnesota NationalLaboratory Course in Algebra for Teachers and:
Dolciani, M. P., Berman, S. L., & Freilich, J.Modern Algebra, Book One. Boston: HoughtonMifflin, 1962.
2) Dolciani, M. P., Berman, S. L., & Wooton, W.Modern Algebra and Trigonome.cry, Book Two.Boston: Houghton Mifflin, 1963.

ME, Algebra Course for Teachers
Topics (See key on Page C-12)
2 3 4Unit 1 5 6
1 2 3 8 1 2 3 4 6 1 2 3 4 1 2 3 1 1 1 2
1 C
2 B
3 B
4 B
5 C
6 B
C
2
3 B
I;
5
6 B
1 B
2 BB BB3 .BB BB4 C C C B
5 C C
1.
2.
3
I; B C C
5 B
6 C B C
7 C C C
8 C B C
9
10 C
1
2 'B B
3 B
4
5
C-2

, ,
MNL Algebra Course for Teachers
Topic (See Key on i'age C-12,)
Unit 8 9 . 10 11 12 13
1 2 3 4 5 6 7 1 2 3 4 5 6 1 2 3 4 5 1 2 3 4 1 2 1 2 3 4 5 6 1 2 3 4
1
2
3
4 4 .
5.
.
.
6.
,
1
2 C
3J . .
5 .
.;
6 C
1
2
) 3. .
.
C C
C C
It
5.
C
1 B
_ .
2
3,
C
It C
5
6 C
7 C
8 C B .
9
10
1
2
3 .
4 -
.
5 B
6
C-3

MNL Algebra Course forTeachers
Topics.(See Key on Page C-12)
2 3 4 5 6 7Unit
.c)
A
2
3
1
2
3
5
1
1 2 3 4 5 6 7 8 1 2 3 4 5 6 1 2 3 4 1 2 3 1 1 1 2
B B
B
1
2
3
5
6
1
2
3
14
1
2
3
14
1
2
3
5
6
C B
B B
C C
C
C C

t
H
0 fie01:11 0A >,cd co+,0 0.14 CO
Ul0 0H0 PiA 0
E-I
"ch
MNL Algebra Course for TeachersTopics (See Key on Page C-12)
Unit 8 9 13 114
1 2 3 4 5 6 7 1 2 3 4 5 6 1 2 3 4 5 1 2 3 4 1 2 1 2 3 4 5 6 1 2 3 k
1 CBB CC
2 CBB CC .
3 .C BBB CC ,
14_.......
1
2 ,
- .
3 .t
14,
5 i
1 c c c
2 -
. .
4,,
5
6.
.
.
,7
1
2 .
3
C C _
,
.14
1 1
2.
3
I.
.
,
,
14,
1 AB B C,
2
3
14
.`, B
C B
.
,
.
,
5
6

MNL Algebra Course for Teachers (continued)
Topics"(See Key on Page C-12)
Unit 1 2 3 4 5 6 7
1 2 3 It 5 6 7 8 1 2 3 4 5 6 1 2 3 It 1 2 3 1 1 1 2
1 C B B
2 C C
3
1,
2
3
1
2
3
4.
.
- ,
C-6

MNL Algebra Course for Teachers
Topics (See Key on Page C-12)
9 10 11Unit 8
12 13 114
12314567 1 2 3 4 5 6 123145 1 2 3 4 1 2 1 2 3 4 6 1 2 3 4
1
2
3,.
1
2
3B
,.
1
2.
3
4A ,
C-7

MNL Algebra Course for Teachers
Topics (See Key on Page C-12)
2 3'Unit
oJ
1 6
1 2 3 4 5 6 7 8 1 2 i 4 5 6 1 2 3 1. 2 3 1 1 1 2
1 A .
2A CC
3C CCBIt B B B
5 B B B.
.
1 B
2 C "C C C B
3 C C BBBB14 C B
5.
.
.
6 .,
1 C C.
2
3 C CCCB4 . .
1 C C
2 C C C
3
4 C
5
6
1 .C
2 I CC CBC3 CC C -B
It C C
5 C C C C
6
1 C A
2 CCAAB3 CCBIt C C C.
5 .
1 C B. C
2.
.
3 C
It C
,
c-; 8
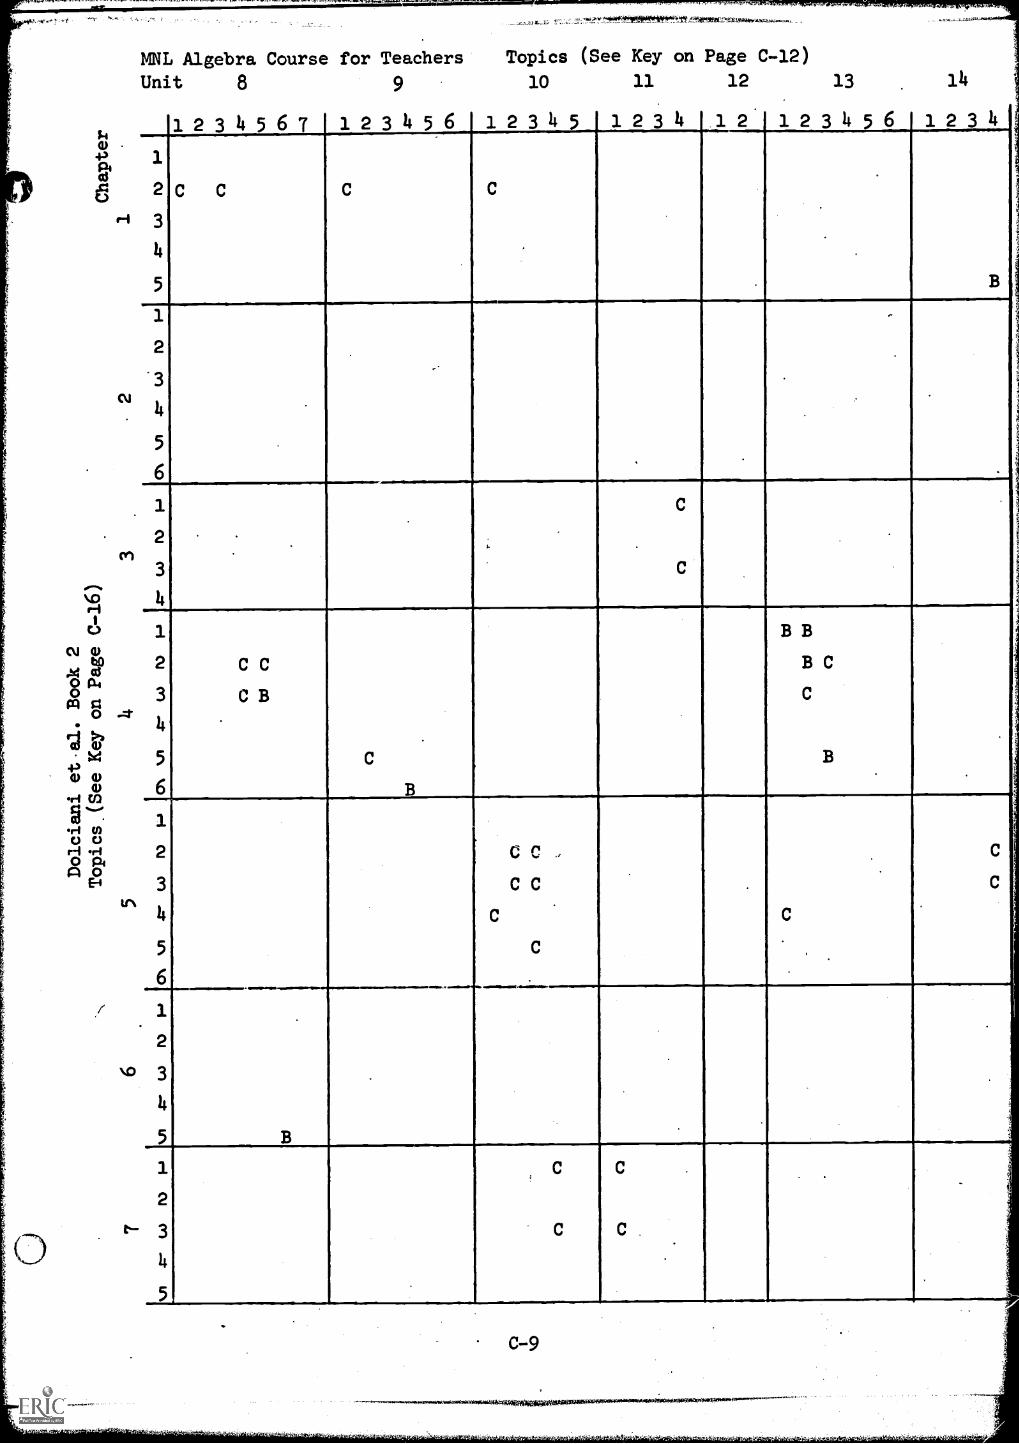
cJ
cti
C.)
(I)
X VO a40
Xi'.1.
4.1W W
r1gW
O 0o PIA 0
t11
MNL Algebra Course for Teachers Topics (See Key on Page C-12)
Unit 8 9 10 11 12 1 3 14
1 2 3 4 5 6 7 1 2 3 4 5 6 1 2 3 4 5 1 2 3 4 1 2 1 2 3 4 6 1 2 3 4
1
2 C C C C
3
4
5
1
2
.3
4
5
6
1
2
3
4
1 B B
2 C C B C
3 C B C .
4.
.
5 C B
6 B
1
2 C C ,
3 C C
4 C
5 C.
6 .
1 . i
.
2
3 . .
4
5
1 C_
2
3 C C..
4
5
C-9

MNL Algebra Course for Teachers
Topics (See Key on Page C-12)
ri
Unit 1 2 3 5 6
1 2 3 4 5 6 i 8 1 2 3 4 5 6 1 2 3 4 1 2 3 1 1 1 2
1
2 CCB3 B
.11
1
2,
3
4 ..
1 C C
.
'
.2
3 .
.
4
5 _
1 .
2
1 C C .
2 C
31 _1
2
3
4.
.
5
1
2 . .
.
3
4 -.
1 A
2
3 .A
4 C
5 C ..
1 C
2 .
3 .............____
C-10

MNL Algebra Course for Teachers
Topics (See Key on Page C-12)
Unit 8 9 10 11 12 13 14
ON
3
4
1
2
3
4
1
2
5
C
C

Key to Topics from MNL Algebra Course for Teachers
Frequency of Contingencies withTopics from Dolciani et al.
Unit 1: Sets, Relations, and FunctionsSets
Book 1C
2
A B
3Ordered Pairs and Cartesian Products 3Relations 3Functions 2 1Functional NotationInverse of a FunctionComposition of FunctionsImplicitly Defined Functions
Unit 2: Algebra of Real NumbersOperations 4Properties of Real Number Operations 3Field.Theorems for the Real Number System 6Modular Arithmetics 1Definition of a GroupSubtraction and Division 14 3
Unit 3: Algebraic SystemsTheorems on Additive and Multiplicative Inverses 2 1s
MatricesTheorems on Fractions 2 2_Isomorphism of Systems
Unit 4: Order in the Real Number SystemOrder Ptu1ate-Order
3 1Properties 1 1
Order Theoreno-
Unit 5: Equations and InequalitiesSolution of Equations and Inequalities 8 5
Unit 6: Absolute ValueAbsolute Value
Unit 7: Completeness of the Real Number SystemCompleteness of the Real Number System 1Decimal Expansions
C-12
Book 2A B
2.
1 1 7
1 1 5
1 1
1
1
3 5
2
11 3
1
6 1.
1

Unit 8: Natural NumbersDefinition of the Set of Natural Numbers
Well-Ordering and Mathematical Induction
Alternate Definition of NPrime NumbersPrime FactorizationCountabilityThe Archimedean Property
Unit 9: IntegersDefinition of the Set of IntegersDivision with RemainderDecimal Representation and Use of Other Bases
Euclid's AlgorithmPrime IntegersCountability
Uhit 10: Rational NumbersDefinition of the Set QOperations and Their Propertiesptoperties of the System of Rational NumbersCompleteness and the Rational NumbersComparison of Systems of Numbers
Unit 11: Complex Numbers
Frequency of Contingencies withTopics from Dolciani et al.
Book 1C
Book 2
A B A C
1
11
1 2
1 1 11
1
1 14 1
1 1
1
1
1 2
1 2
3
1 2 2
2
Complex Numbers: Definition and Basic Operations 1
Isomorphism of a Subsystem of.0 with the Systemof Real Numbers
Conjugate of a Complex NumberGraphing and Absolute Value
Unit 12: Algebra of Real FunctionsAlgebra of Real FunctionsPolynomial Functions
Unit 13: Polynomials
1
3
1 3
Z.
Polynomials 3 1
Algebra of Polynomials 3 2
Division Theorem for Polynomials, Factoring 1 2
Remainder and Factor Theorems 1 1
Rational and Complex Polynomials 3 2
Polynomials over other Fields 3
Unit 14: Equivalence Relations and GroupsProperties of RelationsEquivalence Relations and Equivalence Classes
GroupsOther Properties of a Group
C-13
44
2
12
1
1
1
2

Key to Topics from Dolciani et
Chapter 1: Symbols and SetsNumbers - Order RelationsEqualityInequalityGrouping Numbers in SetsPunctuation Marks in Algebra
al. Book 1
Frequencies of Contingencies withTopics from MNL Algebra Course
A
1
1
1
1, 1
Extra: Arithmetic of Sets: Intersectiori 1
Chapter 2: Variables and Open SentencesEvaluating Algebraic ExpressionsFactors, Coefficients, and ExponentsSolving Open Sentences 1Thinking with VariablesSolving Problems - Open SentencesExtra: Sets - Union of 1 1
Chapter.3: Axioms, Equations, and ProblemSolving'Axioms of Equality 1Addition Properties of Numbers 2Multiplication, Division Properties of 2
NumbersSolving 1st Degree Equations 1 3
. Extra: Algebra of Logic crld Sets 3
Chapter 4: The Negative NumbersDirected NuMbers 1Comparing Numbers (<,>) 1Addition on Number Line 2Opposite of a Number (Inverse) 1 4Absolute Value 1
Subtracting Directed Numbers 1 3Multiplying Directed NumbersDividing Directed Numbers 2 3AveragesExtra: Clock Arithmetic 1
Chapter 5: Equations, Inequalities, andProblem Solving
Transforming Equations 1Properties of Inequality 2Pairs of Inequalities 1Analysis of ProblemsNumber System Structure 1Extra: Systems of Numeration
Chapter 6: Working with PolynomialsAdding and Subtracting Polynomials. 2 3Multiplication of Polynomials 2 3Division of Polynomials 3 3Extra: Negative Exponents
C-14

1,
Chapter 7: Special Products and FactoringDistributive Property - Factoring 2
Quadratic Trinomials 1
Extension of Factoring 2
Solving Equations by Factoring 1
Extra: Scientific Notation
Frequencies of Contingencies withTopics from MNL Algebra Course
A
Chapter 8: Working with FractionsFractions and Ratios (Algebraic)
Per CentMultiplying and Dividing FractionsAdding and Subtracting FractionsComplex FractionsFractions in Open SentencesExtra: Divisibility of Integers
11
1
1
Chapter 9: GraphsOrdered Pairs - Points in Plane 1 1
Linear Evations - Straight Lines 2
Inequalities and Special Graphs 2
Extra: The Sieve of Eratosthenes 2
Chapter 10: Sentences in Two Variables
Solving Systems - LinearPairs of Linear InequalitiesAdditional ProblemsExtra: Diophantine Equations
11
Chapter 11: The Real NuMbersSystem of Rational Numbers 2 1
Irrational Numbers 1
Radical ExpressionsReal Number System 1 6
Radical EquationsExtra: Algebraic Fallacies
Chapter 12: Functions and VariationRelations and Functions 2 1
Variation - Direct and Inverse 2
Extra: Linear Programming
Chapter 13: Quadratic Equations and
InequalitiesGeneral Methods - Solving Quadratic
EquationsSolution of Quadratic InequalitiesExtra: Factor Theorem,
Chapter 14: Geometry and Trigonometry
GeometryTrigonometryVectorsExtra: Complex Numbers
C-15
1
1
11

Key to Topics from Dolciani et al. Book 2
Frequencies of Contingencies withTopics from MNL Algebra Course
A
Chapter 1: Sets of Numbers; AxiomsSets 1
Set Relations 1
Variables 1
Real Number Field Axioms 3
Real Number Theorems 5
6
3
Chapter 2: Open Sentences in One VariableEquivalent Expressions 1
Equivalent Equations 1 14
Equivalent Inequalities 14 2
Combining Expressions 1 1
Solving Word ProblemsExtra: More about Proof
Chapter 3: Systems of Linear Open Sentencf:JLinear Equations and Their Graphs 3
Linear Equations - Propert.ies of Lines'Linear Inequalities 1 5
Extra: Linear Programming
Chapter 4: Polynomials and FactoringProducts of Polynomials 2 3Factoring Polynomials 1 6
Greatest Common Factors and Least 1 2
Common MultiplesSolving Equations by Factoring 1
Division of Polynomials 1 1
Extra: Euclid's Algorithm 1
Chapter 5: Rational Numbers and ExpressionsZero and Negative ExponentsRational Algebraic ExpressionsRational Number Operations
.Polynomials - Rational CoefficientsFractional EquationsExtra: Congruences
1
1
1
764
5
1
Chapter 6: Relations and FunctionsRelations 1 1
Functions 2 1 2
Linear Functions 1 2
Quadratic Functions and Relations 3Extra: Denumerability 1
Chapter 7: Irrational NuMbers and Quadratic
EquationsReal Roots of Real Numbers 1
Radicals - OperationsQuadratic Formula 3Quadratic Inequalities 1
Extra: Continued Fractions
C-16

Frequencies of Contingencies withTopics from MNL Algebra Course
AChapter 8: Quadratic Relations and Systems
Distance in PlaneQuadratic Relations - Conic SectionSolving Quadratic SystemsExtra: Conic Sections
Chapter 9: Exponential Functions and Lo6arithmsRational and Real ExponentsExponential FunctionsLogarithmic FunctionsCalculation Using Logs
Chapter 10: Trigonometric Functions and ComplexNumbers
Trigonometric FunctionsApplying Trigonometric FunctionsAdding and Resolving VectorsComplex NumbersComplex Numbers and Quadratic Equations
Chapter 11: Trigonometric Identities andFormulasTrigonometric IdentitiesExtra: Trigonometric Form of Complex Numbers
Chapter 12: The Circular Functions and TheirInverses
Circular FunctionsInverse Trigonometric FunctionsExtra: Irrational Trigonometric Values andLogarithms
Chapter 13: Progressions and BinomialExpansions'
Arithmetic ProgressionsGeometric ProgressionsGeometric SeriesBinomial ExpansionExtra: Mathematical Induction
Chapter 14: Polynomial FunctionsPolynomial Functions - Complex NumbersRemainder and Factor TheoremsFundamental Theorem of AlgebraExtra: Analytic Proofs
1
1 21
1
2
1
2
2
21
11
1
Chapter 15: Matrices and DeterminantsMatrix Operations 1Determinant of a MatrixInverse of a Matrix (2 x 2) 1Solving of Linear Systems by 1
DeterminantsCramer's Rule 1
C-17

Chapter 16: Permutation, Combinations,and ProbabilityPermutationsCombinationsProbability
C-18
Frequencies of Contingencies withTopics from MNL AlAebra Course
A
1

"IrAFFITIRISP,
-.."44.4 4 *4,
(TOP)
001
100101
102
103
200
300310
320330
340350400
500501
600601
602603604605606
607
800801802803804805806807808809810811.812813814815816817818819820821
822
OE 6000 (REv. 9-66)'ERIC ACCESSION NO..
CLEARINGHOUSEACCESSION NUMBER
OEPARTMENT OF HEALTH. EDUCATION. AND WELFAREOFFICE OF EOUCATION
ERIC REPORT RESUME
IS DOCUMENT COPYRIGHTED? YESRESUME DATE P.A. T.A.
08 -07- 68 ERIC REPRODUC TION RELEASET YES gm
NO
NO
TITLEA Study of the Relative Effectiveness of High School Algebra Teachers in
Relation to Measures of Their Proficiency in Foundations of Modern Algebra.Final Report.
PERSONAL AUTHORIS)Hively, Wells .
INSTITUTION ISOURCE) Minnesota National'Laboratory, Minnesota State Depart-ment of Education, St. Paul,, MijMesota
SOURC E CODE
REPORT/SERIES NO.OTHER SOURC E SOURCE CODE
OTHER REPORT NO.OTHER SOURCE SOURCE CODE
....m.OTHER REPORT NO.
PUB*L. DATE 08 21 68 CONTRAC T/GRANT NUMBER OE 6-PAGINATION. ETC.
153 p.
RETRIEVAL TERMS
Modern mathematicsAlgebraNinth GradeEleventh GradeTeacher CharacteristicsSubject-matter Competence
Achievement TestingEvaluationCurriculumInservice TrainingProgrammed Instruction
IENIIED T-
F-
RS Ball State Teachers College Experimental.Mathematics Program, University,e on S hen Mathematics at ematics Stud G
ABSTRACT
Ninth and eleventh grade teachers were followed as they began to teach a-newmathematics curriculum (SMSG, Illinois, or Ball State). Their classes were testedfor several consecutive years with a variety of achievement tests. Some teacherswere given a programmed correspondence course in foundations of modern algebra.
Rank orders of the teachers by gains of their classes were significantly cor-related across successive years: some were consistently more effective than others.When the same teachers taught both modern and conventional classes, their rankorder by gains in modern classes were significantly correlated with their rankorder by gains in conventional classes: Teacher effects tended to dominate cur-riculum effects. Mild but consistent relations were found between gains of classesand the relative speed and thoroughness with which teachers themselves learned newmathematics content through the programmed correspondence course.