Embed Size (px)
Citation preview
DOCUMENT RESUME
ED 074 621 EA 005 021
AUTHOR Hickrod, G. Alan; Chaudhari, RameshTITLE A Longitudinal Study of Fiscal Equalization in
Illinois.INSTITUTION Illinois State Univ., Normal. Dept. of Educational
Administration.PUB DATE Feb 73NOTE 39p.; Paper presented at American Educational
Research Association Annual Meeting (58th, NewOrleans, Louisiana, February 26-March 1, 1973)
EDRS PRICE MF-$0.65 HC-$3.29DESCRIPTORS Economic Status; Educational Finance; Educational
Research; *Equal Education; *Equalizat .on Aid;Expenditure Per Student; *Property Taxes; SchoolTaxes; *State Aid; *Tax Rates
ABSTRACTFiscal data were analyzed for a nine-year period
(1963-1971) for all school districts in Illinois. Two hypotheses weretested relative to two different definiticns of equalization"permissible variance,' and ufiscal neutrality." Support was given tothe notion of increasing interdistrict equality relative toexpenditures and tax effort. Support was also given to the hypothesisthat grants-in-aid have done little to change the proportion of totalfunds available to the poorer students of the State. (Author)
FILMED FROM BEST AVAILABLE COPY
U S DEPARTMENT OF HEALTHEDUCATION & WELFAREOFFICE OF EDUCATION
THIS DOCUMENT HAS MEN 13I.1.1,OL/CFD EXACILI AS RECEIVED f ROMTHE PERSON OR 01 ANU' AT ION ()MOINATING IT POINTS OF .14 0, OR OPINIONS STA UT, DO NOT NECESSARU,REPRESENT OFFICIAL 0IfICE 01 EDT)CATION POSITION OR
A LONGITUDINAL STUDY OF FISCAL EQUALIZATION IN ILLINOIS*
G. Alan Hickrod and Ramesh Chaudhari
with assistance from:
Daniel Jaw-Nan Hou and Venancio Garagan
Department of Educational AdministrationIllinois State University
Normal, Illinois
A paper prepared for the 1973 Annual Meetingof the American Educational Research Association
New Orleans, Louisiana
We are indebted to Illinois State University for facultyresearch grant #752-72-32 which supported a part of theexpenses connected with this study.
Introduction
This study was undertaken for two reasons. First,
some of the data reported herein was used for various
studies prepared for the Superintendent's Advisory Committee
on School Finance. The Advisory Committee has produced four
volumes of studies which will contribute to knowledge con-
cerning school finance and, perhaps, also contribute to
fiscal reform in Illinois.(1) Second, should the Courts
move in the direction of applying a "reasonable basis" test
to state school finance systems, and there is some recent
evidence to indicate that this might occur,(2) it is likely
that there will also be a demand for more longitudinul
fiscal studies. This would arise because the Courts nay
wish to inquire what the "track record" of the legislative
and executive branches of state government has been rela-
tive'to such public policy goals as: (a) reducing fiscal
disparities among school districts, and (b) encouraging the
equalization of educational opportunity. A state which can
demonstrate that it has moved "with all deliberate speed,"
through the years toward these goals, might well receive
different treatment at the hands of the Court than a state
which can show little or no progress toward the same goals.
1
2
To make. this judgment, however, thq Courts dust first
establish some justifiable standard of "fiscal equaliza
tion." This will not be an easy task.
Operational Definitionsand Hypotheses
In an earlier study Hickrod, Chaudharil and Tcheng
established four models of fiscal equalization; that is,
"permissible variance, inverse allocation, fiscal neutral-
ity, and fiscal intervention." In that prior study we
reviewed the relevant normative and empirical literature
supporting each of these four theoretical constructs.(3)
In this paper we have selected two of these definitions,
e.g., permissible variance and fiscal neutrality, framed
hypotheses in terms of these constructs, and then tested
the hypotheses on the basis of a time series of data in a
single state, Illinois. We also conducted some exploratory
non-hypothetical investigation concerning fi$eal effort
among school districts.of different wealth.
As Johns has stated there is no agreeMent con-
cerning the most appropriate method of defining and
measuring "equalization of educational oPPorklility" and
only very limited agreement on defining and measuring
. "fiscal equalization."(4) The notion of a "permissible"
or "allowable" variance is found in the work Of Arthur
Wise(5) and also it is implied in some of the computations
3
of the National Educational Finance Project.(6) There are
several difficulties with the concept as Wise has himself
pointed out. First, no one can say with certainty how much
variation is "permissible." That is, we have no norms to
judge whether a state has, or has not, exceeded the limits
of "allowable" variation. As of this writing we have no
judicial pronouncement at the state level equivalent to
Judge Skelly Wright's ruling that there could be no more
than a five per cent variation between expenditure levels
of individual schools within a single school district.(7)
Second, and far more important, there is no agreement on
what to measure; that is, inputs such as expenditures,
services, tax rates, etc. or outputs such as achievement
test scores and continuation rates. Third, various
statistical techniques are available to monitor inequality
and each researcher seems to select that measure which is
most familiar to him.(8)
In spite of the l_mitations of the notion of
"permissible variance" we believe the concept has some
intuitive appeal to the Courts and to state legislatures
and have therefore used it in the Illinois studies.
Lacking a good output measurement in Illinois we selected
three input measures that will probably be of interest to
the Courts, e.g., expenditure per pupil, property valuation
per pupil, and two types of tax rates. Upon reviewing the
123
4different types of statistics used to describe dispersion
in a set of data we find that the coefficient of variation;
that is, the standard deviation divided by the mean and
multiplied by 100 is the most popular choice and according-
ly have used that descriptive statistic in this portion of
the study. In Illinois three types of districts are
present; elementaries, high schools, and units (K-12).
Since it would mix applss and oranges to pool these differ-
ent types, especially with regard to fiscal characteristics,
separate time series have been established for each district
type.
To frame a longitudinal hypothesis we have drawn
upon both studies of school finance in metropolitan areas,
and upon a single national study which provided evidence
on fiscal variation within each of the fifty states. It
was over a decade ago that Jesse Burkhead established an
hypothesis of "increasing fiscal homogeneity" on the basis
of studies he had conducted in the Cleveland metropolitan
area.(9) Basically this hypothesis holds that with the
passage of time school districts will become more alike
with regard to expenditure levels, tax rates, property
valuations per pupil, and other fiscal characteristics.
This hypothesis assumes that the locational decisions of
businessand industry, plus the movements of people in
selecting their places of residence will act, at least in
5
the long run, to level out fiscal differences between
school districts. Empirical support for this notion has
certainly been uneven, but it is not disproved at this
point in time.(10) Not an inconsiderable stumbling block
is an answer to the question of just what constitutes, "in
the long run"? Second, at the state level the most exten-
sive data on input variation within individual states
comes from the national study by Harrison and McLoone.(11)
This study concluded that we probably are moving toward
greater expenditure equality if the geographic area
studied was that of the entire United States, and the same
trend held for a majority of states. On the basis of
these prior studies of fiscal disparity, plus some random
speculation about the possible effects of collective bar-
gaining in recent years, we established an hypothesis of
decreasinz fiscal inequalitz anion`; school districts.
Our second hypothesis is drawn from literature and
Court decisions of more recent vintage. A number of recent
decisions have highlighted an emerging principle of "fiscal
neutrality."(12) In its most basic form this principle
holds that, "school district expenditure shall not be a
function of wealth other than the wealth of the'state."
Unfortunate] y there has been more legal and philosophical
diScussion of this notion than mathematical and statistical
specifications of the construct. A descriptive statistic

6
used extensively in the field of economics and known
variously as the "Gini Coefficient, Gini Index, and Index
of Concentration," is probably as acceptable as any other
measurement technique, and may have some advantages over
other techniques currently in use among fiscal analysts.(13)
The Gini numbers are purely relative; that is, they have
meaning only when comparing different years or different
distributions of funds within a single year. In general,
as these numbers become smaller there is more fiscal
neutrality in the state system, and as they become larger
there is less fiscal neutrality in the state system. A
graphic presentation of the data, the Lorenz curve, can be
used in conjunction with the Gini coefficient and when this
is done the diagonal L.5 degree line represents complete
fiscal neutrality. This interpretation, however, depends
upon what variables are used on the vertical and horizontal
coordinates of that graph. Under certain situations, for
example when using state aid as one of the variables, the
larger the coefficient the greater the distribution of
funds to poorer districts. We have prepared an appendix to
this paper giving the mathematical derivation of the coeffi-
cient, an illustration of the curves, and the computational
procedure for those who are interested in such details.
To frame a longitudinal hypothesis we, have relied
upon Coons, Clune, and Sugarman.(14) The investigations
7conducted by these authors have led them to believe that
the political compromises necessary to pass formula legis-
lation result in distributions that are deliberately
"flawed," that is, distributions that give more funds to
the than the designers of the formulas
intended prior to the "horse trading" necessary in most
state legislatures. Similar conclusions are reached by
Grubb and Michelson.(15) We were unable to discover,
however, any empirical work which could cast light on
whether individual states were moving toward greater fiscal
neutrality or away from greater fiscal neutrality and hence
a further motivation for this paper. Persuaded by the
forceful rhetoric of advocates Coons, Clune, and Sugarman
we decided that the inevitable conflict between the affluent
schools and the poor schools probably produces something of
a "status quo" as far as the sharing of total expenditures
is concerned. Accordingly, we established an hapthesis of
no improvement in fiscal neutrality with the passaze of
time.
Findings: Simple Disparity
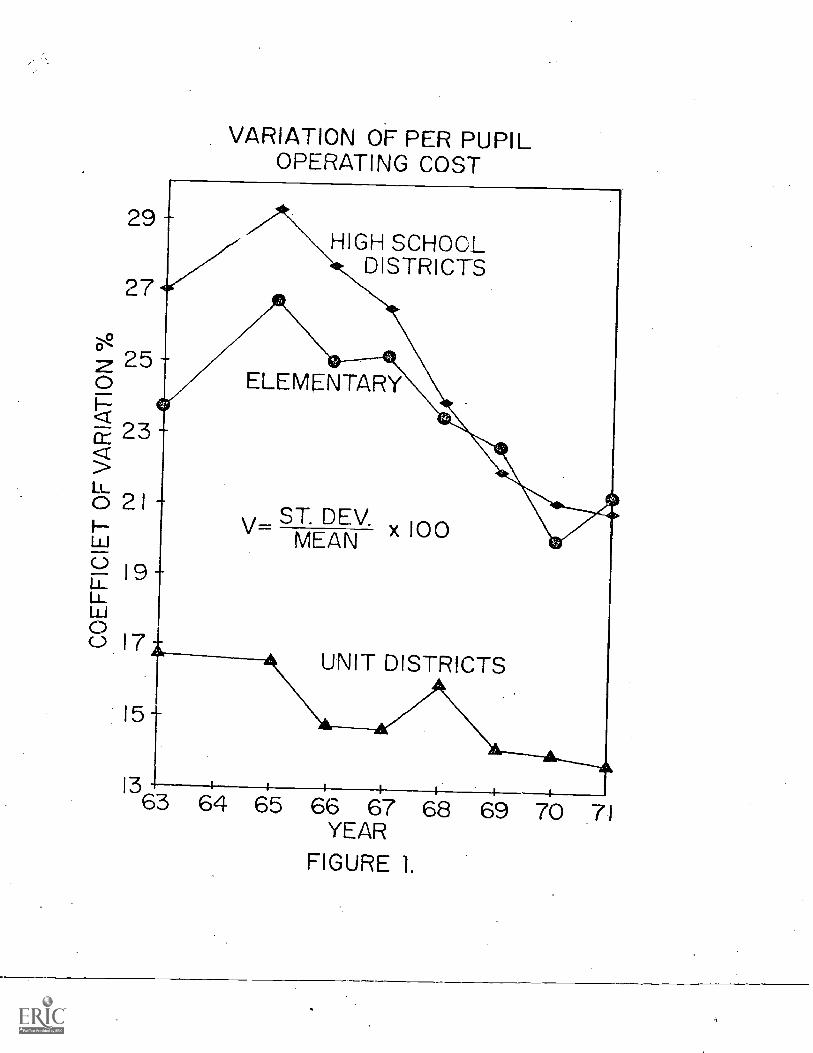
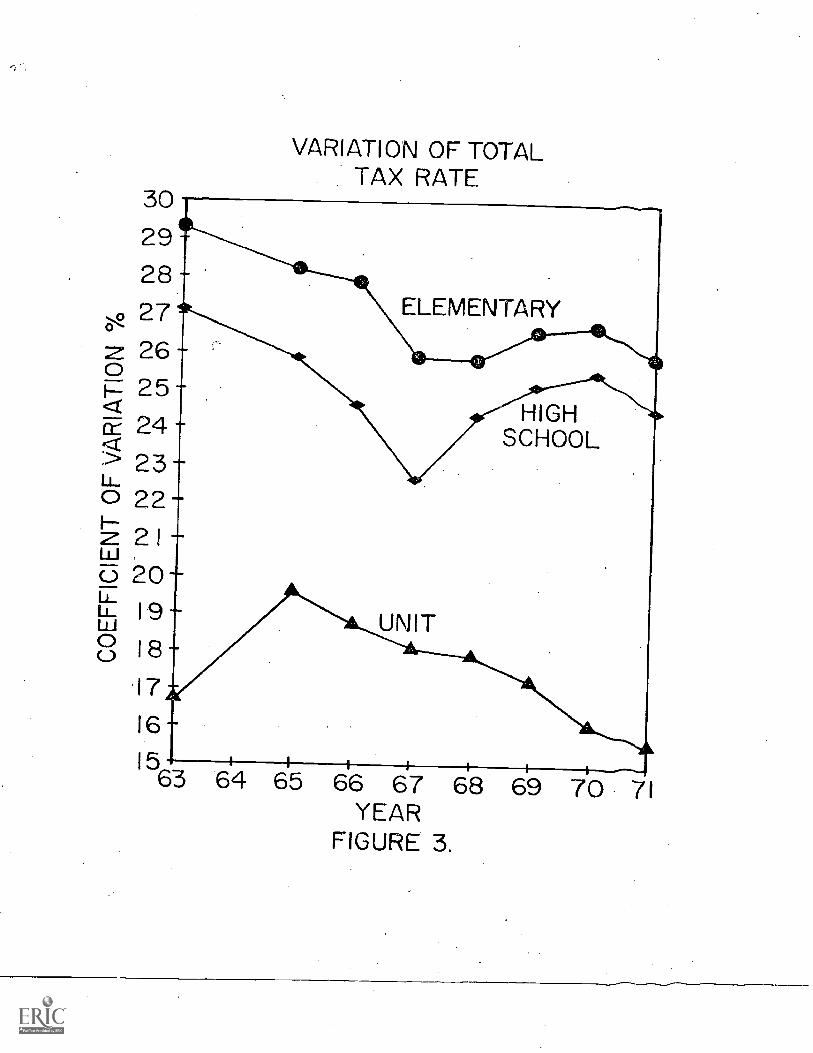
The results of the simple, disparity analysis are
presented in figures one through four. The downward sloping
line in the graphs indicates that the value of the coeffi-
cient of variation has been falling and that school districts
8
in Illinois are becoming more alike with the passage of
time. In figure one we can see that this is true for
current operating expenditures per pupil especially for the
period 1965 through 1971. In an area that sorely needs
some good news we are pleased to indicate this fairly
optimistic finding. If expenditures are related to the
level of goods and services provided, and if these expendi-
tures make at least some small difference in students'
achievement then there was probably greater equality of
educational opportunity at the end of the period in Illi-
nois than at the beginning of the period. These are, to
be sure, monumental ifs, and currentresearch does not
reassure one that the assumptions are valid. (16) Nothing
here tells us why expenditures are becoming more alike among
school districts, only that they are. Figures two and 'three
tell us that the same phenomenon-has occurred relative to
tax effort. There is therefore Jess tax inequality at the
end of the period than at the beginning of the period.
The current very strong demand for local property tax re-
lief in Illinois may well be more of a response to the
overall level of taxes than to the inequality of tax effort
among districts.
One causal element we can at least rule out at this
point. Both the phenomena of decreasing disparity in
expenditures and decrea'sing disparity in tax effort could
9
be takil:g place if school districts were becoming more
alike with regard to wealth as measured by property valua-
tion per pupil. However, the data of figure four-guggest
that this is probably not an important factor. Unit dis-
tricts were about as unequal with regard to wealth at the
end of the time period as they were at the beginning of the
time period and elementary districts were more unequal with
regard to wealth than they were at the beginning of the
time period. Only the high school districts illustrate a
reduction of variation in wealth. Parenthetically this
also tells us that if the goal of the school district
reorganization in recent years in Illinois has been to re-
duce wealth disparities that reori;arization has succeeded
only with regard to high school districts. Of course the
variance in property valuations among school districts is
affected by complex locational decisions of individuals
and corporations and not solely by school district reorga-
nization.
We find, therefore, that our first hypothesis is
supported with regard to expenditures and tax effort but
not with regard to property valuation per pupil. At least,
the evidence on this last variable is mixed. This leads
us to speculate that the forces working to equalize
expenditures and tax effort may not be related to those
forces affecting property valuations per pupil. It is
entirely possible that some sort of "demonstration effect"

10
enhanced now by more rapid means of communication is causing
school district expenditures to become more alike with the
passage of time. Speculation of this sort was advanCed
some time ago by Benson.(17) It is also possible that
collective bargaini/ ,=; by teachers organizations plays an
important role in this increasirig equality of expenditure
levels. News concerning salary settlements travels very
fast in Illinois and this may well have had an overall
leveling effect en experidituros throughout the state. Of'
course, we have no way of testing such speculation within
the design of the investigation reported here.
Findinc;s: Fiscal Neutrality
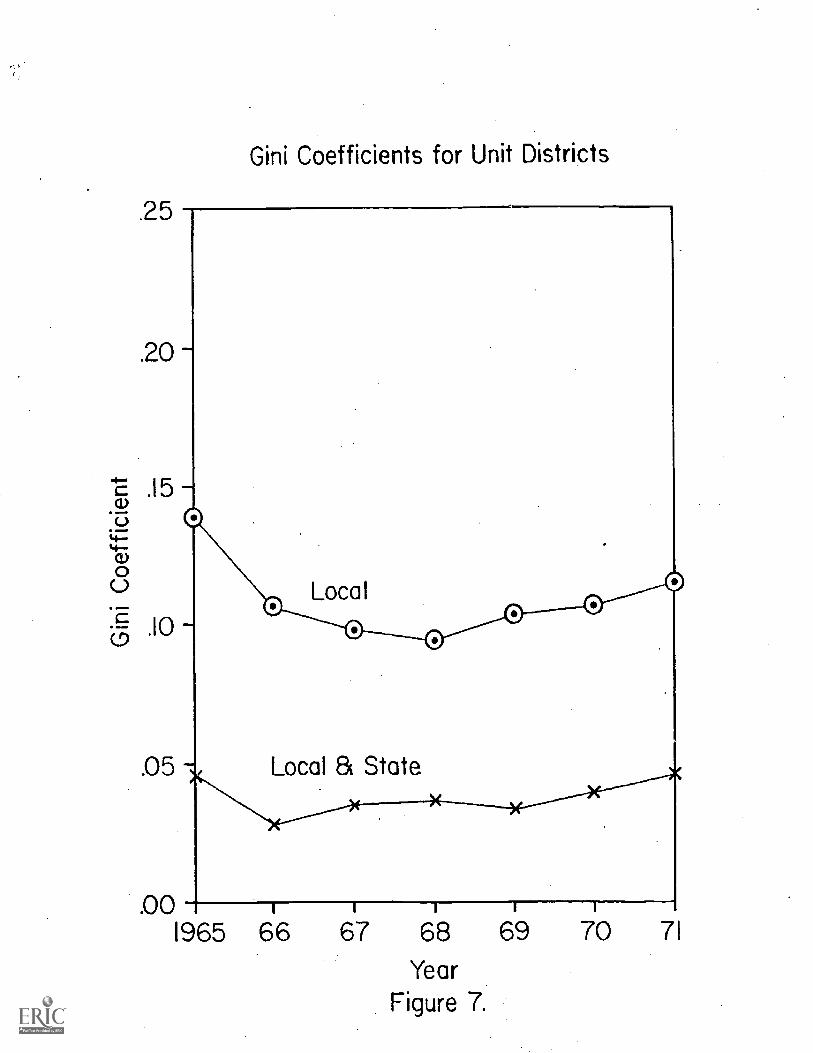
Firurcs five, six, and seven illustrate the data on
fis..;a1 neutrality. Gini coefficients were computed for
both locally raised revenue and for the combination of state
funds plus locally raised. Thus the difference between the
upper and the lower lines on the graphs represent the
contribution state funds have made to fiscal neutrality at
any given point in time. The lower the Gini value, the
greater the fiscal neutrality with absolute fiscal neutrality
constituting the base of the vertical axis. In a rather
loose sense, the upper line represents what the fiscal
neutrality picture would have been like had there been no
state aid at al') and expenditures had been a function
11
entirely of local wealth variations and local willingness
to spend. The values of the Gini coefficients we hay
computed for Illinois tend to be slightly smaller tha
those reported for fifteen other states by Grubb and
Michelson.(18) For example, these researchers report a
Gini value of .0792 for Louisiana in 1969. Our comparable
Gini values for Illinois for the same year are: .0314 for
units, .0513 for elementaries, and .0595 for high schools.
However, some differences in defining state or local funds,
or some computational differences, could well account for
differences of this magnitude and we would therefore be
hesitant to draw any conclusions from the smaller size of
the Illinois coefficients.
As was expected the greatest departure from abso-
lute fiscal neutrality occurred among the elementary dis-
tricts in Illinois. It happens that the 1969 data cited
above are an exception to this rule. Returning for a
moment to figure four one can easily see why this would
probably be true; e.g., the local wealth variation is much
greater for elementary districts in Illinois than for unit
districts and high school districts. A decreasing fiscal
neutrality due to local wealth and/or local willingness to
spend variations can be documented for high school districts
and elementary districts but an increasing fiscal neutrality
caused by local wealth and/or willingness to spend
12
variations can be observed for unit districts. That is,
the upper lines in figures five and six are positively
sloped while the upper line in figure seven is negatively
sloped. However, our interest in these upper lines is not
nearly as great as is our interest in the bottom lines
which display the combined effects of both state and local
funds. Federal aid is not reflected in any of the data
reported here.
Figure six shows a slight improvement in fiscal
neutrality for students in elementary districts in Illinois
during the period under investigation; however, all of this
improvement was prior to 1968 and there has, been no improve-
ment since that date. Figures five and seven indicate
virtually the same amount of fiscal neutrality for students
in unit districts and high school districts at the end of
the period as existed at the beginning of the period. We
thus believe that our second hypothesis has also been sus-
tained. There has been no marked improvement in fiscal
neutrality, at least as we have operationally defined this
concept, in Illinois during the years from 1965 to 1971.
It should be stressed that the data displayed in figures
five, six, and seven are intended to cast light upon the
combined effect of both state and local funds since the
formulation, "expenditure shall not be a function of
wealth, other than the wealth of the state," is also focused
13
upon this combined effect. However, the legislature may
well be interested in the effect of the state funds alone,
particularly in the effect of the general purpose rrants-
in -aid which, in most states, are deliberatelv ,.1c1 to
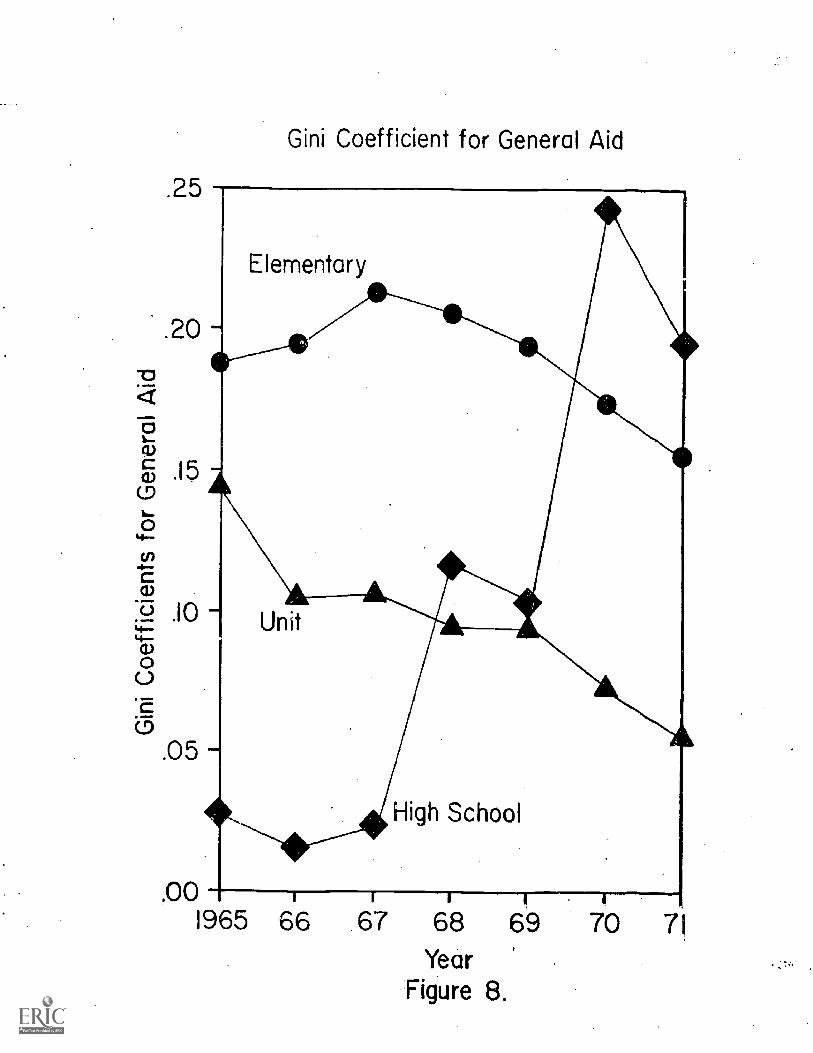
be "equalizing" in their effect. (19) The (lath,. payed
in figure eight casts some light upon this subject.
As indicated in the appendix placing state aid on
the vertical axis rather than revenues from a given source
results in a different interpretation of the Gini coeffi-
cient. In this particular case, the higher the value of
the coefficient, the greater the proportion of funds being
directed to the poorer school districts. As can be
observed from figure eight the trends have not been the
same for all three categories of school districts in Illi-
nois. The students in the poorer high school districts
have been receiving a greater share of state aid with the
passage of time. However, the students in the poorer
elementary districts and the poorer unit districts have
suffered a reduction in their share of state aid. In an
earlier version of this paper we concentrated solely upon
the poorest quartile of students with essentially the same
results.(20)
A very interesting phenomenon can be observed here
that probably applies to other states which have separate
elementary, secondary, and unit districts; i.e., the
14
so-called "dual district" states. During the period under
analysis in Illinois the foundation level was raised
faster than the qualifying rate. Most observers of the
"foundation" grant-in-aid systems would predict t' -t when
this phenomenon occurs the poorer stude. ive a
smaller 'percentage of state aid since more wealthy dis-
tricts are becoming entitled to equalization grants. That
has, indeed, happened in Illinois for students in unit
districts and in elementary districts. However, this very
same phenomenon has had exactly the opposite effect for
students in high school districts. Raising the foundation
level and holding the qualifying rate constant or at least
not raising the rate very much has placed funds into some
of the poorer secondary districts since these poorer
secondary districts are toward the upper half of the over-
all wealth distribution. This largely unintended conse-
quence is unfortunately typical of the complexities found
in the so-called "dual district" states and makes rational
state fiscal planning very hazardous in these states.
Findings: Fiscal Effort
The Advisory Committee invested a good deal of its
time exploring the concept of "equal expenditure for equal
effort. (21.) A large number of formulae which allowed
districts to receive funds in proportion to their local tax
15
effort were constructed and then shut _ated by computer.
It was therefore logical for the Com. _ttee to ask, "will
any of these effort formulae help poor districts?"
Longitudinal data of the type reported here can not really
answer this type of question very well. The adoption of a
completely new formula brings into being forces that were
simply not there before. That is, the assumption under-
lying projections from a time series, i.e., that conditions
in the future will be similar to conditions !II the immedi-
ate past, is very suspect. Nevertheless, we thought it
useful to at least look at some effort data in longitudinal
Perspective.
Our procedure was similar to that reported in the
previous section. We ranked the districts from low to high
in terms of per student property valuations and then
cumulated by enrollments toward the top, breaking at each
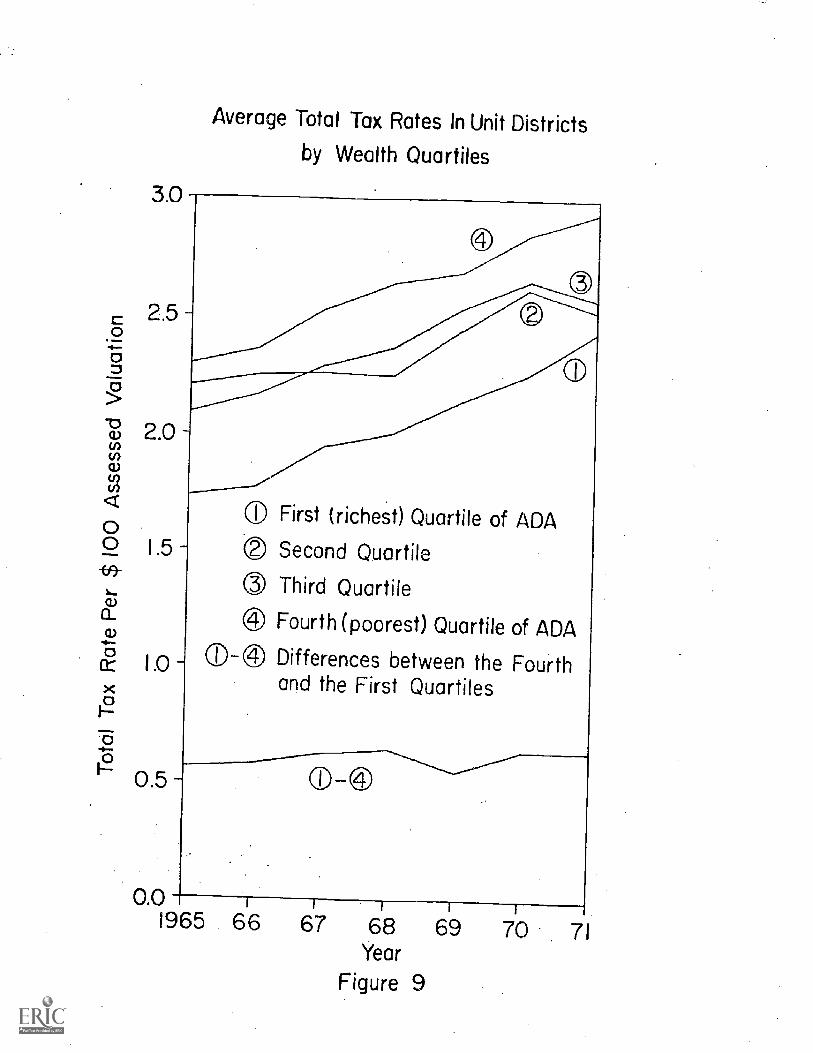
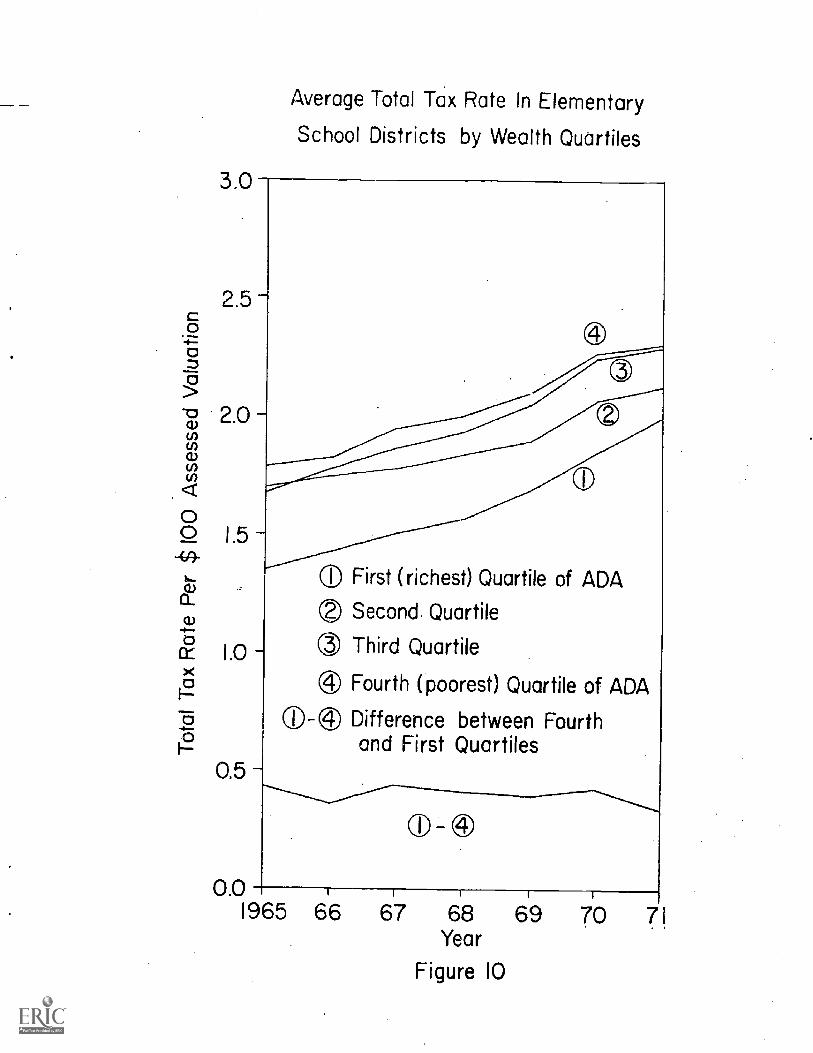
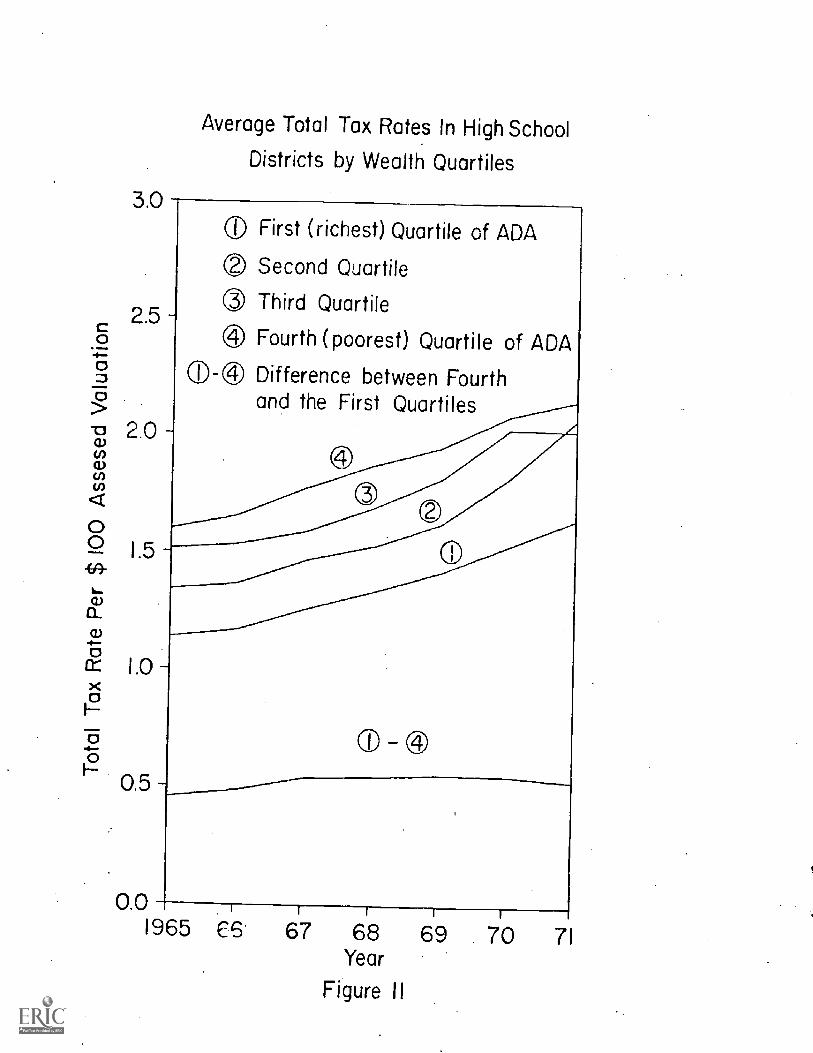
quartile. Figures nine, ten, and eleven assemble tax rate
data by wealth quartiles for the period 1965 through 1971.
Each quartile consists of the districts which contain one-
fourth of the students ranked by wealth. The tax rates
indicated are weighted averages; that is, we took the
expenditures for all educational purposes in each quartile
and then divided by the total property valuation in that
quartile. The line at the bottom indicates the tax rate
difference between the richest quartile and the poorest
16
quartile.
The first relationship we can obsel've from figures
nine, ten, and eleven is that the districts which contain
the wealthiest quartile of students has t;% loWcst tax
effort, and the poorest quartile has the rlthest tax
effort. In fact, with a few exceptions, Ohg., prior to
1967 for unit districts, and in 1971 for High school dis-
tricts, this relationship of wealth to ta$ effort has been
similar every year since 1965. One could therefore con-
clude that the immediate or short-run effec=t of adopting a
formula which was weighted heavily for local district tax
effort would be to put more funds into the poorer districts.
We are, however, also interested in trend0 through time.
Here the results are not quite so reassuring, if the goal
is greater equalization. For unit districts an=t for high
school districts the difference between trle wealthiest
quartile and the poorest quartile has been tairly constant
during the period under examination. However, with regard
to elementary districts the difference between the two
quartiles has narrowed with the passage of time, and one
can see by inspection of figure ten that this was due to
increased effort by the wealthier quartile since 196 .
Figure eleven also reveals a strong upward, thrust of effort
from the second wealthiest quartile of the high school dis-
tricts. Thus there is a modest indication in the data that
17
the wealthier of the so-called "dual districts" in Illinois
have been exertinz ;; ratter effort with the passage of time.
Critics of "effort" formulae, also called "incen-
tive" or "stimulation" or "district power" formulae, allege
that when a bonus is placed into the formula to reward
local effort it will be the wealthier districts that will
respond. to the stimula rather than the poorer districts. (22)
It is di:fficult to subject this notion to a direct test.
About all we are prepared to do at this 1,r,int is to hazard
a guess that the initial or short-range effect of the
adoption of an effort formula would be to help poorer
districts but that this gain in equalization might be
greatly weakened at some later point in time as the richer
districts begin to exert greater effort. Effort formulae
will probably become a popular means by which states seek
to meet court decisions. When challenged, a state will
allege that its formula does not make expenditures a
function of local wealth, but rather a function of willing-
ness to exert tax effort for education. The various effort
formulas can be slowly adjusted to the point where any two
districts exerting the same tax effort can have almost the
same expenditure level. Technically they can be adjusted
so that any two districts have exactly the same expenditure
levels but this procedure is usually too costly to the
state. However, if willingness to tax and wealth are highly

18
correlated then an application of the Gini coefficient as
described in the previous section will still show a lack of
fiscal neutrality even if an effort formula has been
adopted 'y tho 10 Ir--tu-'o. Ei2ert formulae are no
panacea; at best they may provide a convenient resting'sta-
tion on the way from where we are now toward full sta-L
funding.
Conclusions and
The observed reduction in disp;3rity among scliaol
districts relative to -expenditure leveTh and tax rates is
a good omen as this state, along with others, awaits th
Courts' planre in Rod,r17e7, and similar eases. Ho7.-Jevr,.
we can find little evidence to indicate that this reduction
in disparity, in expenditure and tax ratan was the inten:T:ed.
result of dolibor.ate state fiscal policy. To the contrary,
there is some evidence that. the student7s in the poorer dis-
. tricts of Illinois havu fared worst-7? in -2,ecent years rela-
tive to their share of 'state aid. It is also clear that
Illinois was not much closer to fiscal neutrality in 1971
than it was in 1965. It is more apparent to us now than it
was when we started this investigation that the two con-
cepts, "permissible variance," and "fiscal neutrality," are
more dissimilar than they are similar. Variance in
expenditures could be decreasing bit that variance cou44.
19
still remain a function of local wealth and/or local -4111-
inmpqs to spend. If the Courts are really intent upon
el,ablishing fiscal neutrality then it appears to us that
the Gini coefficient would be a more appropriate criterion
than any meaTxrement of simple dispersion.
As Daub', there are unresolved measurement problems
in this area of school finance research as in most other
areas. Forxs,:iple, it is difficult to compare the results
of an analysers with the coefficient of variation with the
results of am Investigation with the Gini coefficient when
one method u the district as the unit of analysis and
the other use-rc, the student as the unit of analysis, As
indicated in the appendix, the horizontal axis is the
cumulative ZIA as ranked by wealth not the cumulative count
of districts. That is, we are analyzing what proportion
of expenditures, or in a few cases what proportion of state
aid has been accorded to the poorest 10 per cent, 15 per
cent, 20 per tent, etc. of Students rather than the poorest
10 per cent, 15 per cent, 20 per cent, etc. of districts.
A much more serious qualification lies in the
specification: of district wealth. The "poorest" students
are defined this paper as poor in terms of the property
valuations per. pupil of their district. One has only to
reflect upon the fact that in Illinois the city of Chicago
is in the upper half of the per pupil property distribution

20
to realize that most of the efforts to aid Chicago, for
example the inclusion in the general aid formula of a bonus
for large districts, would have the effect of decreasing
the measurement of fiscal neutrality as it has been defined
and used here. When income data is available for each
school district in Illinois a different specification of
wealth can be used and new Gini coefficients will then need
to be computed using this different measurement of wealth.
Unfortunately, obtaining a reliable measure of income among
school districts for one point in time has been a very slow
process and it may be a very long, long time indeed before
we have a reliable time series of income data fcr each
school district in the state; if indeed we ever have such
measurements.
In conclusion we wish to specifically disavow any
usage of these data to justify some philosophy of "benign
neglect" on the part of any branch of Illinois state
government. In the first place.we doubt very much that the
students in the poorer districts of this state will be
willing to wait for unassisted market forces to level out
expenditures and tax rates. Such a process might take
decades. Secondly, we believe that the goal of fiscal
neutrality is just as compelling if not more compelling
than the simple reduction of fiscal disparities among
school districts. Regardless of the outcome of current
21
litigation on this subject, it appears to us that the
determination of service levels by the wealth of a local
district is not functional to the larger body politic and
we have said this in many ways, for many years.(23)

Notes and References
1. Occasional Papers of the Superintendent's AdvisoryCommittee on School Finance, .Volumes One, Two, andThree, 1*)72, and also Final ReEort of the Superinten-dent's Advisory Committee on School Finance, 1773.These documents ars available from Robert Clark,Director, Legislative Research, Office of the Superin-tendent of Public Instruction, 302 State OfficeBuilding, Springfield, Illinois, 62706
2. See for example, Judge Alexander Harvey's opinion inParker v. Mandel, U.S. District Court for the Districtof Maryland, June 14, 1972.
3. Hickrod, G. Alan, Chaudhari, Ramesh, and Tcheng,Tse-Hao, "Definition, Measurement, and Application ofthe Concept of Equalization in School ?inance,"Occasional Papers of -the Superintendent's AdvisoryCommittee, Volume One, 1972. An abbreviated versionappears in Proceedings of the 15th National Conferenceon School Finance, 1972, National 2dUcation Associa-tion, Washington, D.C., and the complete text isavailable as document ED 060 544 in the ERIC system.
4. Johns, Roe L. and Salmon, Richard G., "The FinancialEqualization of Public School Support Programs in theUnited States for the School Year,' 1965-69' in Statusand Impact of Educational Finance Programs, NationalEducationafPinance Project, 1971, Gainesville,Florida.
5. Wise, Arthur E., contributions in Daly, Charles U..(ed.), The Quality of ineallaltz: Urban and SuburbanPublic Schools, 19677 University of Chicago Press;see also 1!:ise, Arthur E., Rich Schools, Poor School,,1968, University of Chicag-6-7-17ess.
6. See their measurement entitled, "the average deviationfrom full equalization" in chapter ten, AlternativePrograms for Financini Education, 1971, National Educa-tional Pinance Project, Florida.
22
23
7. Hobson v. Hansen, 269 F. Supp. 401 (D.D.C. 1967);M7sub. nom. Smuck v. Hobson, 408 F. 2nd 175(D.C., Cir. 1969).
8. See for example, Alker, Hayward R., Jr., "MeasuringInequality" in Tufte, Edward R., The QuantitativeAnalysis of Social Problems, 19702 Addison-Wesley.
9. Burkhead, Jesse, "Uniformity in Governmental Expend!tures and Resources in a Metropolitan. Area," Nationa,Tax Journal, Dec., 1961.
10. See for example, Hickrod, G. Alan and Sabulao, CesarM., Increasing Social and Economic Inequalities AmongSuburban Schools, 1969, Interstate Printers and Pub-lishers, Danville, Illinois; Lows, Ray L. and Others,"Fiscal Homogeneity or Heterogeneity Among SuburbanSchool Districts in Metropolitan Areas," EducationalAdministration Quarterly, vol. 6, number 3, 1970;also RossmillerTITchard A., Hale, James A. andFrohreich, Lloyd E., Fiscal Capacity and EducationalFinance, 1970, Univ. of Wisconsin Press.
11.. Harrison, Forrest W. and McLoone, Eugene P., Profilesin School Support: A Decennial Overview, 1965, U.S.TffrES---Or Education.
12. See especially Serrano v. Priest, Van Dusartz v.Hatfield, and RodriEues v. `:an Antonio School District,NOLPE School Law Journal, Spring, 1972.
13. For additional illustrations of the use of the Ginicoefficient in school finance research see Harrisonand McLoone, 22. cit.; Barkin, David, The EqualizinaImpact of State AT1to Education, 1967, WashingtonUniversity Institute for Urban and Regional Studies,St. Louis; Hickrod, G. Alan, "Dispersion of FiscalCharacteristics Among School Districts in a Metropoli-tan Area," Educational Administration Quarterly,Autumn, 1967; Wilensky, Gail R., State Aid and Educa-tional Opportunity, 1970, Sage Publications; Michelson,Stephan, "The Political. Economy of Public SchoolFinance" in Carnoy, Martin, Schoolinf4 in a CorporateSociety, 1972, McKay; Grubb, W. Norton and Michelson,Stephan, Public School Finance in ContractualSocieties, unpublished, Cambridge, Mass.; sop alsoGrubb's review of the NEFP studios in Harvard Educa-tional Review, November, 1972.
14. Coons., John E., Clune, William H. III, and Sugarman,Stephen L., Private Wealth and Public Education, 1970,Harvard University Press.
15. Grubb and Michelson, op. cit.
16. For th-ee qaite different views on the contribution ofschool varables tc achievement one might comparethese items: Guthrie, James W., "A Survey of SchoolEffectiveness Studiqs," Do Teachers Make a Difference?,U.S. Office of Education, 1970; Averch, Harvey A.,Carroll, Stephen J., Donaldson, Theodore S., Kiesling,Herbert J., and Pincus, John, How Effective isSchooling?, Rand Corporation, 1972; Jencks, Christopher,Inequality, 1972, Basic Books.
17. Benson, Charles S., The Economics of Public Education,First Edition, 1961, How;htonMiTflin.
18. Grubb and Michelson, op. cit.
19. Just hdw "equalizing" the present general purpose stategrants-in-aid really are, is, at least in this author'sopinion, still an unanswered question. Probably wewill never answer the question until we get moreagreement on how to define and measure "fiscalequalization." For a range of different approachesto this basic problem see Johns, Roe L. et al., Statusand Impact of Educational Finance Programs, 1971,National Educational Finance Project, Gainesville,Florida; Hickrod, G. Alan, Chaudhari, Ramesh, andTcheng. Tse-Hao, 2E. cit.; Grubb, W. Norton andMichelson, Stephan, op. cit.; McLure, William P. etal., Education for the Future of Illinois, 1966, OSPI,Springfield, IlTois.
20. Hickrod, G. Alan and Chaudhari, Ramesh, "DisparitiesAmong School Districts in Illinois and State FiscalPolicy," Occasional Papers of the Superintendent'sAdvisory Committee on School Finance, Volume Three,1972, Springfield, Illinois.
21. Final Report, §uperintendent's Advisorl Committee onSchool Finance, 1973, Springfield, Illinois.
22. See Alternative Programs for Financing Education, 1971,NEFP; also Grubb and Michelson, E. cit.
23. Hickrod, G. Alan and Hubbard, Ben C., "Social Stratifi2-cation, Educational Opportunity, and the Role of StateDepartments of Education," Educational AdministrationQuarterly, Winter, 1968.
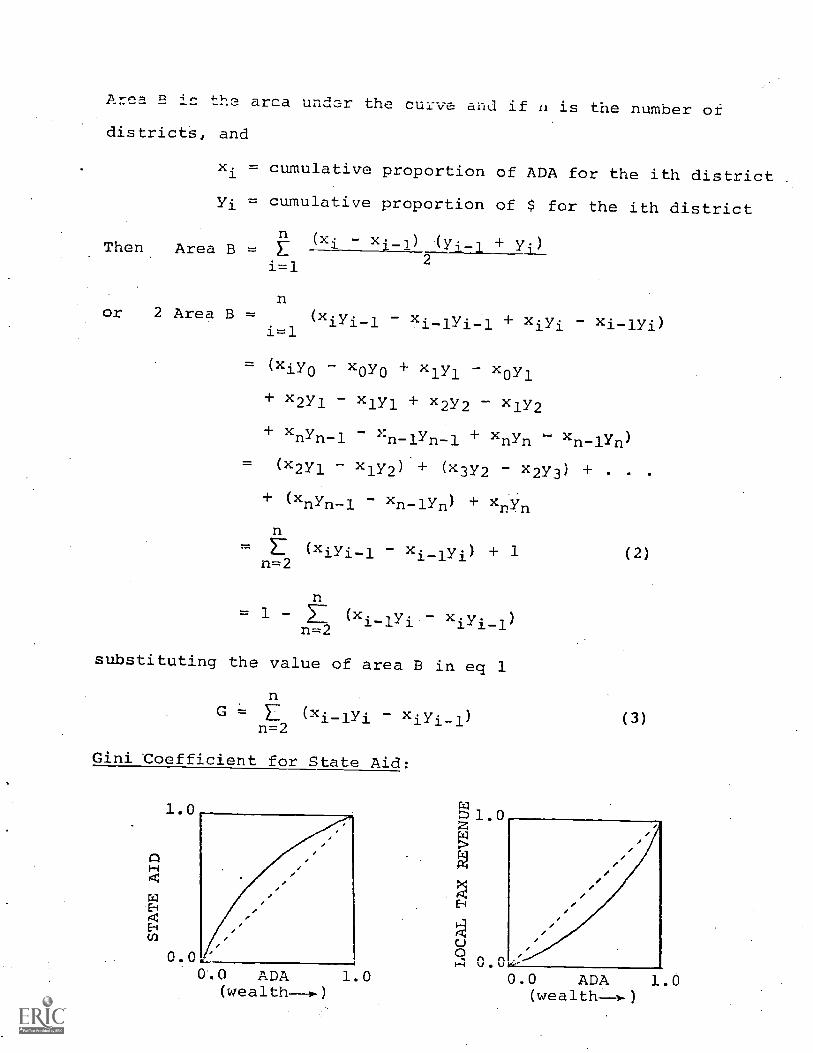
Area u is the arca under the curve and if is the number of
districts, and
xi = cumulative proportion of ADA for the ith district
yi = cumulative proportion of $ for the ith district
(xi - xi -1) + yi)Then Area B =2i=1
nor 2 Area B = - + xiyi - xi-lyi)
i=1
= (xiyo - xoyo + xiyi - x0y1
+ x2yl - xiyi + x2y2 - xly2
xnYn-1 xn-lYn-1 xnYn xn-117n)
= (X2171 - xly2)+ (x3y2 x2y3) . .
(xnYn-1 xn-117n) xnYn
(xiYi-1 xi-117i) 4- 1n=2
= 1(xi-lYin=2
substituting the value of area B in eq 1
(xi-iYin=2
Gini Coefficient for State Aid:
1.0
AH
El
ElU)
.._
0.0 ADA 1.0(wealth--).)
(2)
(3)
0.0 ADA 1.0(wealth
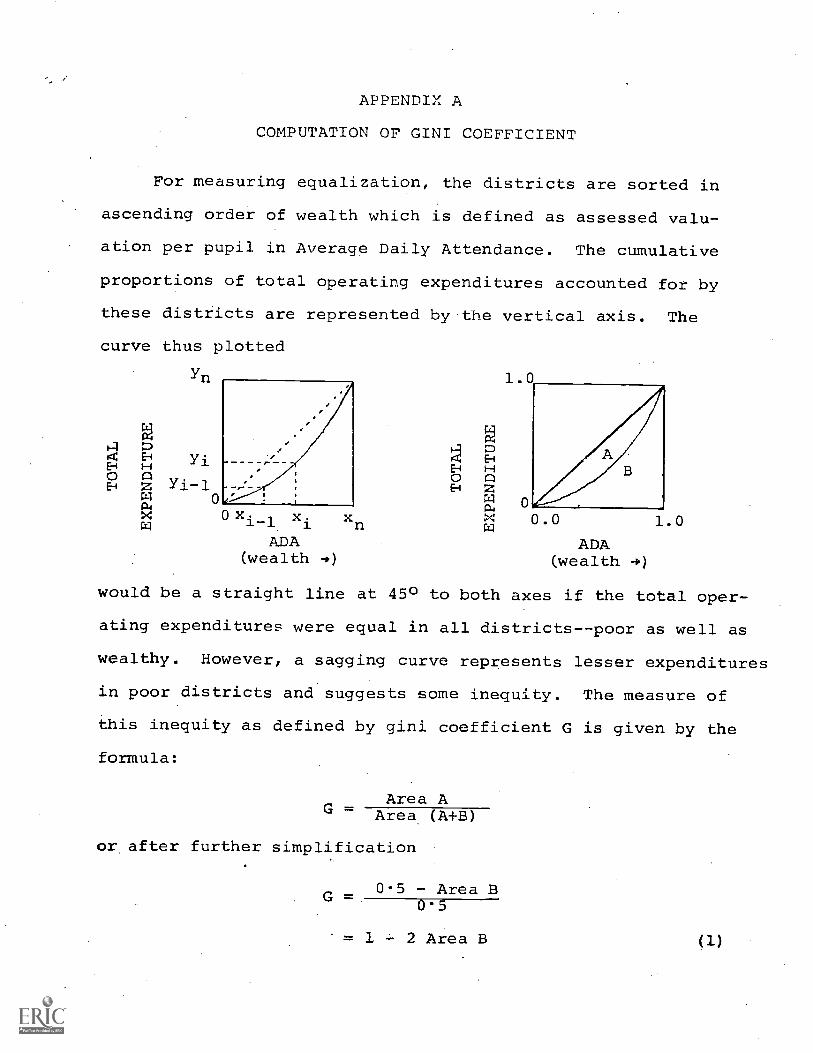
APPENDIX A
COMPUTATION OF GINI COEFFICIENT
For measuring equalization, the districts are sorted in
ascending order of wealth which is defined as assessed valu-
ation per pupil in Average Daily Attendance. The cumulative
proportions of total operating expenditures accounted for by
these districts are represented by the vertical axis. The
curve thus plotted
Yn
0 xi-1 xiADA
(wealth
xn
ADA(wealth -0)
would be a straight line at 450 to both axes if the total oper-
ating expenditures were equal in all districts--poor as well as
wealthy. However, a sagging curve represents lesser expenditures
in poor districts and suggests some inequity. The measure of
this inequity as defined by gini coefficient G is given by the
formula:
G - Area (A+B)Area A
or after further simplification
G 0.5 - Area B0'5
= 1 2 Area B (1)

Since poor districts get more state aid than wealthy dis-
tricts, the curve in this case will be above the diagonal and
formula 3 would result in a negative value of G. To avoid con-
fusion we reverse the sign of G to make it positive. However,
Gini coefficient as applied to state aid must be interpreted
differently. The higher the value. of G in this case, the bet-
ter it is for poor districts and the higher is the equalizatioL,'.
On the other hand higher values of Gini coefficients for total
expenditure and local revenue indicate lesser equalization.
29
27
O0z 250
c--E- 23
o 21i-w562 19
(..) 17
15
VARIATION OF PER PUPILOPERATING COST
HIGH SCHOOLDISTRICTS
ELEMENTARY
ST. DEVV=MEAN x 100
UNIT DISTRICTS
1363 64 65 66 67 68 69 70 7 -IYEAR
FIGURE 1.

28272625
0 2423
czt 22o 2 IzF-- 206 19
18
o 1716
15
14
1363
VARIATION OF EDUCATIONALTAX RATE
64 65 66 67 68YEAR
FIGURE 2.
69 70 71
30292827262524232221
2019
18
-17
16
15
VARIATION OF TOTALTAX RATE
63 64 65 66 67 68 69 70YEAR
FIGURE 3.
71
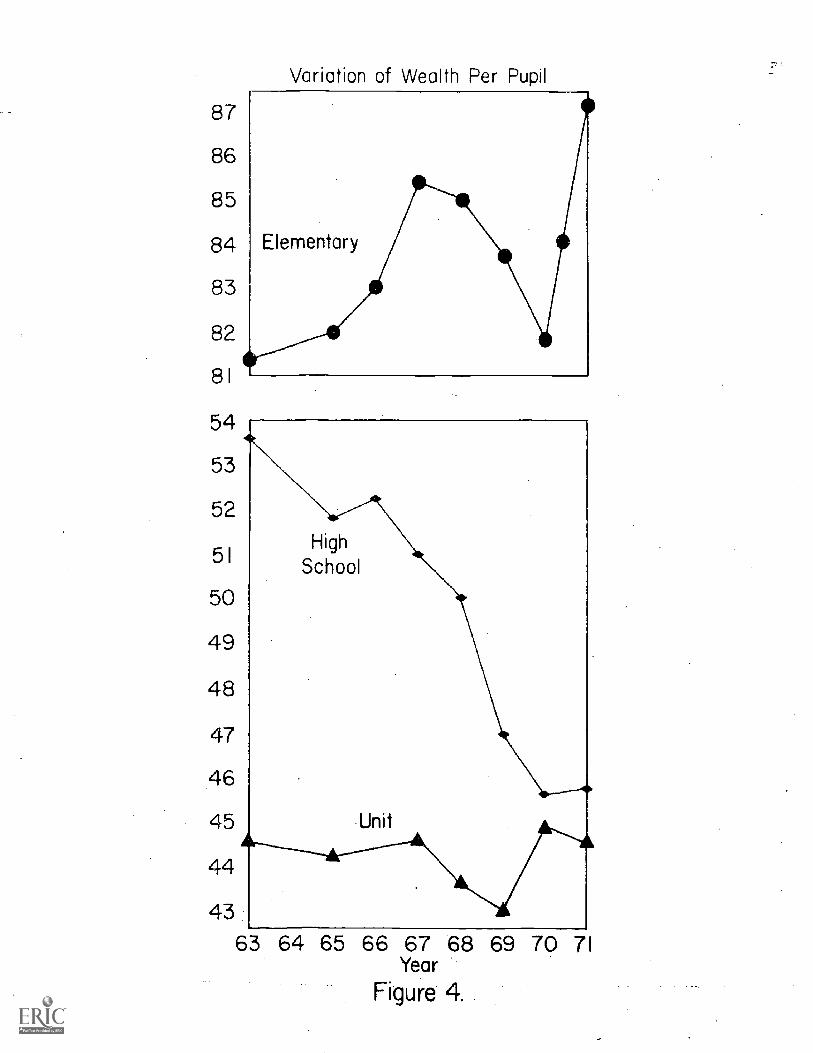
Variation of Wealth Per Pupil
87
86
85
84
83
82
81
54
53
52
51
50
49
48
47
46
45
44
4363
Elementary
High
School
Unit
64 65 66 67 68Year
Figure 4.
69 70 71
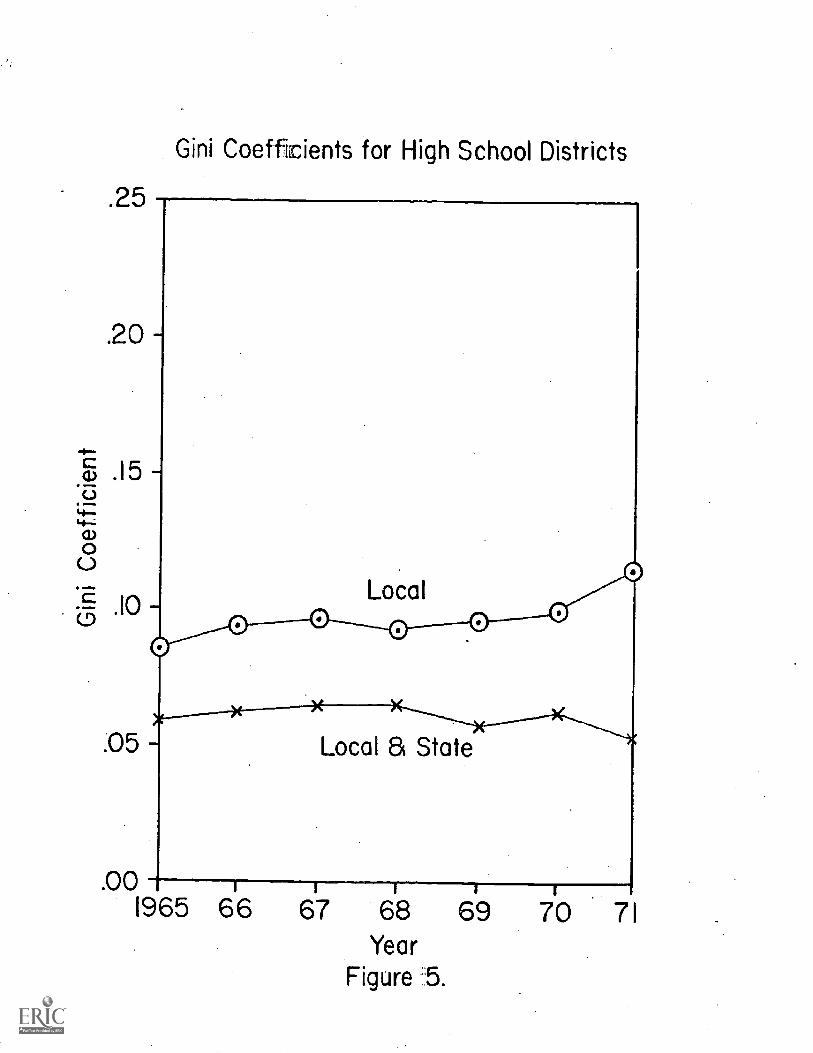
Gini Coefficients for High School Districts
.25
.20
Local
. 05-
.00
Local & State
I
1965 66 67 68 69 70 71
YearFigure 5.
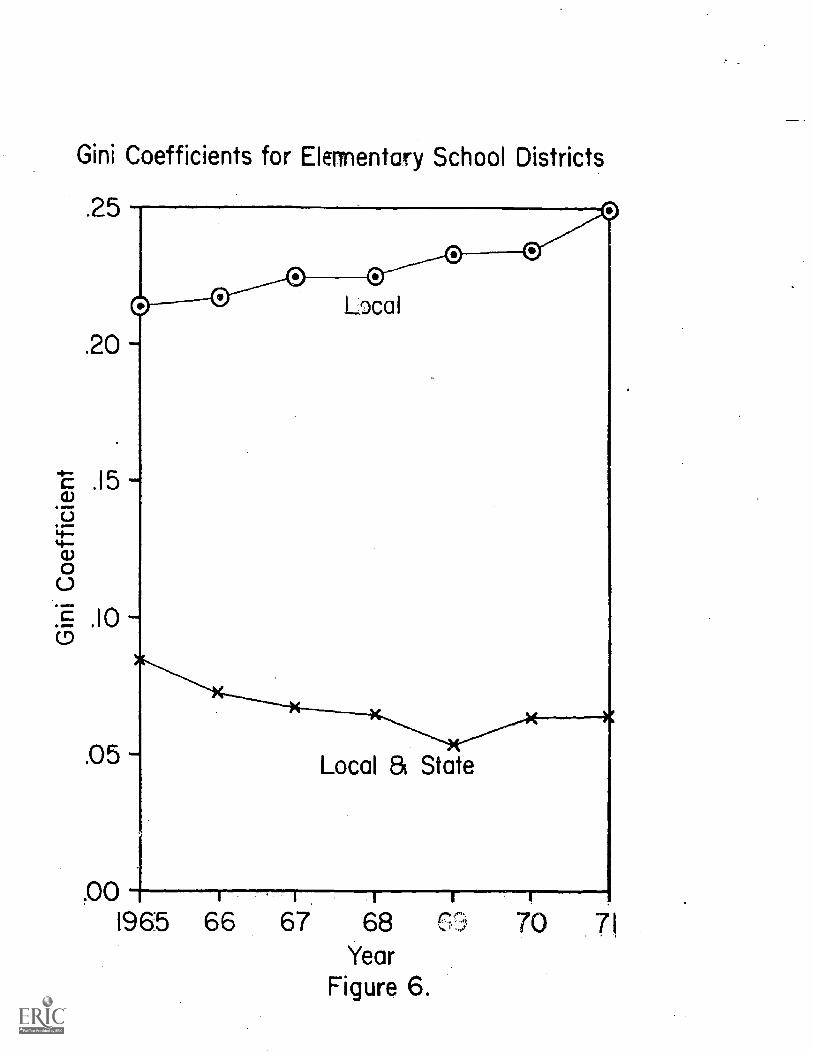
Gini Coefficients for Elementary School Districts
.25
.20
.15
.05
Local
Local & State
.001965 66 67 68 0'3 70 71
YearFigure 6.
a)
4-a)O
E
.25 -
.20
.15
Gini Coefficients for Unit Districts
.10
.05
.00
Local & State
1965 66 67 68 69
YearFigure 7.
70 71
25
.20
Gini Coefficient for General Aid
Elementary
.05
.001965 66 67 68 69 70 71
YearFigure 8.
3.0
2.50
-6
Average Total Tax Rates In Unit Districts
by Wealth Quartiles
"0(i) 2.0tou.)U)
0 First (richest) Quartile of ADA1.5 0 Second Quartile
0 Third Quartile
CD1 Fourth (poorest) Quartile of ADA
IG-0 Differences between the Fourth
and the First Quartiles
0.5
0.01
1965 66 67 68 69Year
Figure 9
70 71
3.0
Average Total Tax Rate In Elementary
School Districts by Wealth Quartiles
2.5c0a
15
2.0a
00 1.5
-69-
6-a.
cc 1.0-x
ai
C) First (richest) Quartile of ADA
® Second. Quartile
a Third Quartile
0 Fourth (poorest) Quartile of ADA
0,-0 Difference between Fourthand First Quartiles
0.0 (fill1965 66 67 68 69 70 71
Year
Figure 10
3.0
2.5
2.0
1.5
Average Total Tax Rates In High School
Districts by Wealth Quartiles
First (richest) Quartile of ADA
© Second Quartile
3 Third Quartile
Fourth (poorest) Quartile of ADA
10-S Difference between Fourthand the First Quartiles
(4)
3
1.0-J
0.5
0.01965 ES 67 68 69 70 71
Year
Figure II