Embed Size (px)
Citation preview
ED 103 008
AUTHORTITLE
INSTITUTION
SPONS AGENCY
REPORT NOPUB DATENOTE
EDRS PRICEDESCRIPTORS
IDENTIFIERS
ABSTRACT.
DOCUMENT RESUME
95 IR 001 694
Bramble, William J., Ed.; Ausness, Claudine, Ed.Formative :;valuation Study for AESP Diagnostic andPrescriptive Reading Course. Technical Report NumberThree.Appalachian Education Satellite Project, Lexington,Ky,National Inst. of Education (DHEW), Washington,D.C.AESP-TR-3Oct 7470p.; For related documents see IR 001 692 through95
HF-$0.76 HC-$3.32 PLUS POSTAGECollege Students; *Communication Satellites; ComputerAssisted Instruction; *Diagnostic Teaching;Educational Techuology; Educational Television;*Formative Evaluation; Inservice Programs; *InserviceTeacher Education; Phonotape Recordings; PrimaryEducation; *Reading; Regional Cooperation;Telecommunication; Video Tape RecordingsAESP; Appalachia; *Appalachian Education SatelliteProject; Regional Educational Service Agencies
The Appalachian Education Satellite Project (AESP)was conceptualized in 1973 (1) to develop courses in reading andcareer-education instruction for teachers in the Appalachian region,and (2) to determine the feasibility of conducting such courses overa large geographical area via communications satellites. This reportdescribes the formative evaluation design used for one course, thediagnostic and prescriptive reading instruction course for K-3teachers. Twelve different instruments were used to evaluate thetelevised lecture tape, audio review tape, laboratory exercises, andscripts for the course module. Forty graduate and undergraduatestudents from reading classes at the University of Kentucky Collegeof Education provided for formative evaluation data for the project.Examples of the instruments together with the sperific procedures fortheir use are included. (P IC)
Formative Evaluation Study
appalachianeducationsatelliteproject
I^hr%011-I 114kilw ines
011)ti
umber 3

FORMATIVE EVALUATION STUDY
FOR AESP DIAGNOSTIC AND PRESCRIPTIVE READING COURSE
Prepared by
Dr. William J. Bramble, Director of Evaluation
Claudine Ausness, Assistant to the Director
Robert Wetter, Evaluator
October, 1974
U S DEPARTMENT OF HEALTH.EDUCATION &WELFARENATIONAL INSTITUTE OF
EDUCATIONTHIS DOCUMENT HAS BEEN REPRODUCED EXACTLY AS RECEIVED FROMTHE PERSON OR ORGANIZATION ORIGINATING IT POINTS OF VIEW OR OPINIONSSTATED DO NOT NECESSARILY REPRESENT OFFICIAL NATIONAL INSTITUTE OFEDUCATION POSITION OR POLICY
The project is supported by N.I.E. Grant #74-4/C0-3009-73-I-0E-0531 tothe Appalachian Regional Commission and the University of Kentucky.
The Technical Report Series of the Appalachian Education
Satellite Project is edited and published by the ROC Evaluation
Component at the University of Kentucky, Lexington, Kentucky.
The purpose of this series is to document and disseminate
information about the design, implementation, and results of the
AESP experiment.
William J, Bramble and Claudine Ausnese
Editors
Technical Reports #1 and #2 in this series are entitled:
AESP Data Base Information: Rationale, Data Collection Procedure,
Interpretation of Results.
An Experiment in Educational Technology: An Overview of the
Appalachian Education Satellite Project.
APPALACHIAN EDUCATION SATELLITE PROJECT STAFF
Appalachian Regional Commisston1666 Connecticut AvenueWashington, D.C. 20235
Harold E. Morse, Director of the AESPRobert Shuman, Deputy to the DirectorDennis Goldstein, Education Satellite Coore_nator
Resource Coordinating Center306 Frazee Hall
University of KentuckyLexington, KY 40506
Management
David L. Larimore, Project DirectorNofflet Williams, Deputy DirectorDiane Maynard, Assistant to the Director
Ev,'uation Component
William J. Brambla, DirectorRodger Marion, Principal EvaluatorClaudine Ausness, Assistant to the DirectorLarry Herding, EvaluatorRobert Wetter, Evaluator
Career-Education Component
Betty Bowling, DirectorCathy Whitton, Materials DeveloperBernie Lovely, Technical Writer
Reading Component
Lowell D. Eberwein, DirectorCarol Harbison, Graduate Assistant
Information-Systems Component
Timothy A. Pasden, DirectorAlice Martinson, Reading-Information SpecialistJoanne Suckiel, Graduate Assistant
Four-Channel Audio Component.
Frank Colton, Director
Television Component
Paul Owen, DirectorRoger Koonce, Production ManagerPaul LeVeque, Producer-DirectorPeter Gillette, Producer-DirectorRichard Falknor, Associate Producer-DirectorClarence Embry, Television Crew SupervisorRay Sprester, Motion Picture SupervisorFloyd Kron, CinematographerDavid Haydon, Film AudioBarry McKee, Film EditorAndy Spears, Film EditorBritt Davis, PhotographerJerry McDonald, Film CrewJohn Quinn, Art DirectorGwyn McGowan, Graphic ArtistMichael Sleadd, Staff ArtistDan Vantreese, ArtistDave Vantreese, Artist/PhotographerCharles Turok, ArtistThomas Hofleron, Chief EngineerJesse Holbrook, Video EngineerMichael Weikel, Recording EngineerJack Martin, Engineer
Engineering Section124 Kastle Hall
University of KentuckyLexington, KY 40505
Jesse McLaurin, Project EngineerJames R. Freeman, Assistant Project Engineer
RESA Project Directors
Chautauqua Board of Cooperative Educational Services (BOCES)Box 250Fredonia, NY 14063Me. Stephanie Bennett
Clinch7Powell Educational CooperativeHarrogate, TN 37752Mr. Doug Cross
DILENOWISCO Educational Cooperative1032 Virginia AvenueNorton, VA 24273Mr. Morley D. Jones
Maryland RESA110 Washington StreetCumberland, MD 21502Dr. William Brish
TARESA2603-C Leeman Ferry RoadHuntsville, AL 35801
Mr. Charles Nickel
7

ACKNOWLEDGKENTS
Spacial recogni is extended to those primarily responsible
for the production of the instructional materials evaluated during
the formative evaluation study.
Dr. Lowell Eberwein, DPRI content expert and instructor.
Paul LeVeque, producer-director of the televised lecture
Alice Martinson, reading specialist
David Haydon, audio technician
Thanks is given to those RCC staff members who monitored
the groups:
Gail Attas
Mary Clarkson
Larry Harding
Marianne Truong
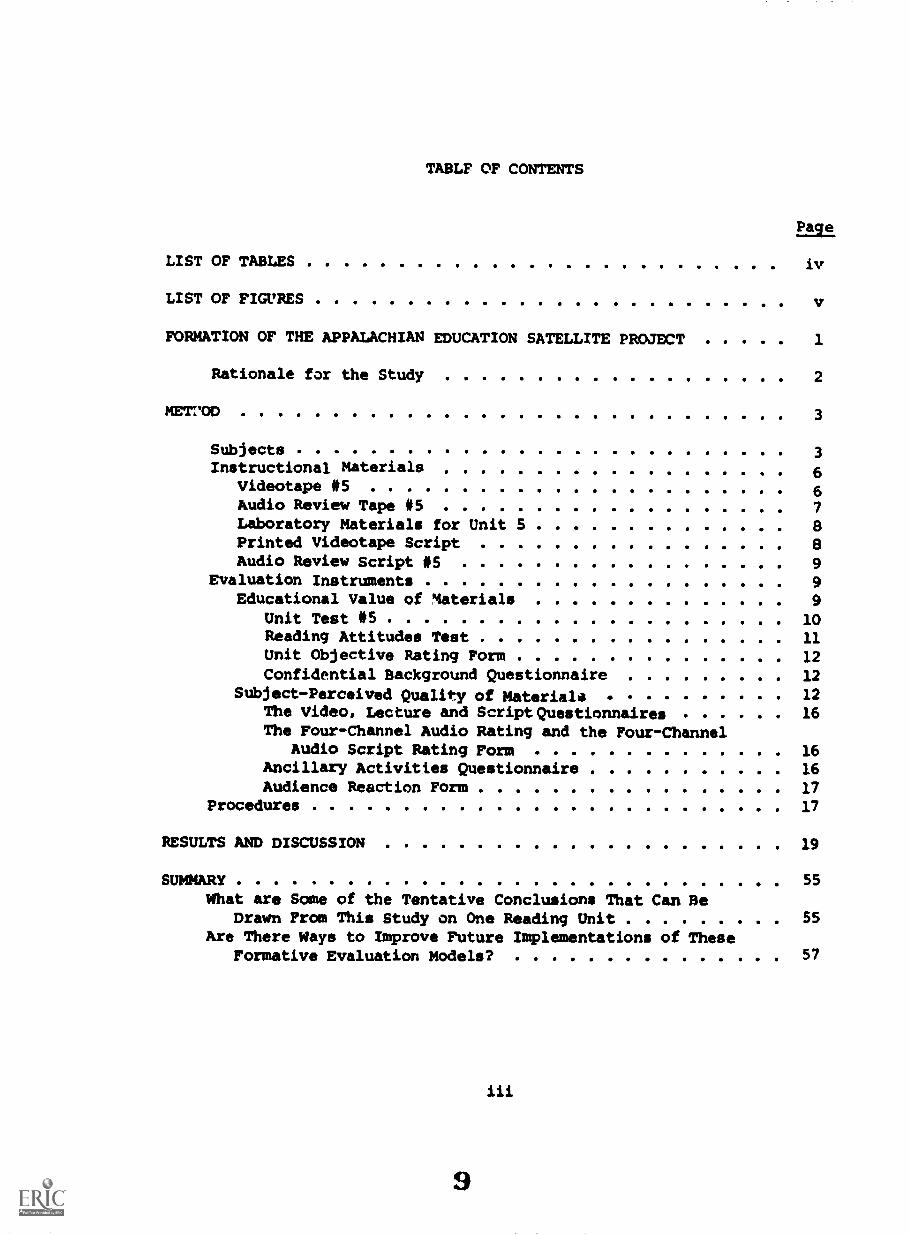
TABLF OF CONTENTS
Page
LIST OF TABLES iv
LIST OF FIGURES
FORMATION OF THE APPALACHIAN EDUCATION SATELLITE PROJECT 1
Rationale for the Study 2
METMD 3
Subjects 3Instructional Materials 6
Videotape #5 6Audio Review Tape #5 7Laboratory Materials for Unit 5 BPrinted Videotape Script BAudio Review Script #5 9
Evaluation Instruments 9Educational Value of Materials 9
Unit Test #5 10Reading Attitudes Test 11Unit Objective Rating Form 12Confidential Background Questionnaire 12
Subject-Perceived Quality of Materials 12The Video, Lecture and Script Questionnaires 16
The Four-Channel Audio Rating and the Four-ChannelAudio Script Rating Form 16
Ancillary Activities Questionnaire 16Audience Reaction Form 17
Procedures 17
RESULTS AND DISCUSSION 19
SUMMARYWhat are Some of the Tentative Conclusions That Can Be
Drawn From This Study on One Reading UnitAre There Ways to Improve Future Implementations of These
Formative Evaluation Models?
iii
9
55
55
57
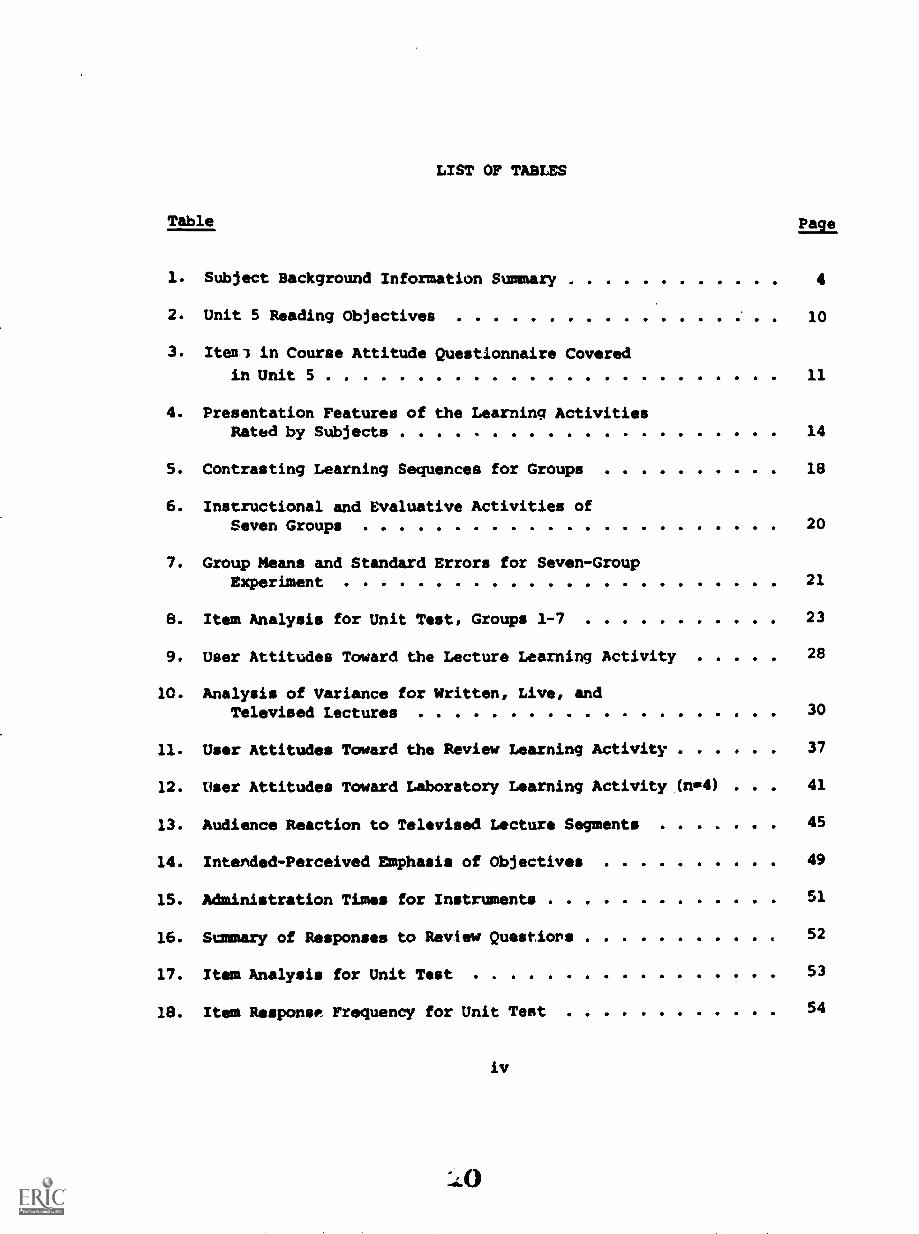
LIST OF TABLES
Table Eas±
1. Subject Background Information Summary 4
2* Unit 5 Reading Objectives 10
3. Itenl in Course Attitude Questionnaire Covered
in Unit 5 11
4. Presentation Features of the Learning ActivitiesRated by Subjects 14
5. Contrasting Learning Sequences for Groups 18
6. Instructional and Evaluative Activities ofSeven Groups 20
7. Group Means and Standard Errors for Seven-GroupExperiment 21
8. Item Analysis for Unit Test, Groups 1-7 23
9. User Attitudes Toward the Lecture Learning Activity 28
10. Analysis of Variance for Written, Live, andTelevised Lectures 30
11. User Attitudes Toward the Review Learning Activity 37
12. User Attitudes Toward Laboratory Learning Activity (n -4) . . . 41
13. Audience Reaction to Televised Lecture Segments 45
14. Intended-Perceived Emphasis of Objectives 49
15. Administration Times for Instruments 51
16. Summary of Responses to Review Questiors 52
17. Item Analysis for Unit Test . 53
18. Item Response Frequency for Unit Test 54
iv
LIST OF FIGURES
Figure Page
1. Means of Seven-Group Experiment for Unit Teat onthe Reading Miscue Analysis 22
2. Graph of Audience Reaction to Televised Lecture #5Miscue Analysis
V
46
BEST COPT AVNIABLE
FORMATION OF THE APPALACHIAN EDUCATION SATELLITE PROJECT
In 1966 the National Aeronautics and Space Administration (NASA)
began the launching of a series of six Applications Technology Satellites
(ATS). With these satellites NASA intended not only to improve satellite
equipment, but also to demonstrate multiple uses of satellites. One of
the 24 applications projects to which NASA allotted satellite time on
ATS-6 was the Appalachian Education Satellite Project (AESP).
The AESP is a demonstration of the application of spaceage tech-
nology to education. It explores the feasibility of using satellites to
deliver to classroom teachers in-service instruction and supporting
information services. The demonstration requires the development of
materials, procedures, and equipment suitable for the use of teachers at
widely scattered learning centers in Appalachia.
During the summer of 1974 at 15 sites scattered throughout
Appalachia nearly 600 teachers took either the AESP-produced elementary
reading or career-education course. There were twelve instructional
units in each course. The learning sequence constructed for each of
these units consisted of: (1) a pre-program preparation assignment; (2)
a one-half hour, pretaped televised lecture; (3) a 15-minute, question-
and-answer, taped audio review on the lecture content; (4) a laboratory
practice period of about 1-1 1/2 hours; (5) a homework reading
assignment or activity requiring the application of the concepts and
procedures, and (6) a unit test the following session that indicated to
the participants how well they mastered the unit content.
To supplement the regular unit learning sequence there were 45-
minute, live seminars televised four times during the courses. During
1
1;4
2
these seminars course parti ants at the local sites could call in
questions they would like answered on the air by the content experts.
To provide additional information, an on-site library and several com-
puterized retrieval systems were made available for the use of course
participants.
Rationale for the Study
Technical Report #3 describes the formative evaluation study the
RCC Evaluation Component developed to assess summer course units
prior to these course units being broadcast into Appalachia. This report
focuses on the arplication o the fon. ye evaluation design to one unit
in one of the AESP productA courses, .r diagnostic and prescriptive
reading instruction course (DPRI) for K-3 teachers.
The quality of course materials depends largely on the expertise
of those developing the materials. However, when time and money allow.
trying out preliminary materials and procedures can supply the developers
with information that can be used to make decisions regarding the im-
provement of course materials and procedures.
To supply formative evaluation information to the developers of
the instructional and evaluative materials, the RCC Evaluation Component
first identified questions the developers would need answered if they
were to improve their initial products:
1) How effective are the materials in teaching the behaviors
specified in the unit objectives?
2) Does receiving a greater portion of the learning sequence
result in the subjects learning more?
3
3) How do the selected formats for the learning activities
compare with alternate formats for the activities in terms
of their effectiveness in teaching specified behaviors?
4) Which formats for the learning activities did the subjects
prefer?
5) Which type cf production techniques in the televised lecture
best held the interests of the subjects?
6) How does what the subjects perceived was covered compare
with what the instructor intended to emphasize?
7) :s there a need to make any alterations in the evaluation
procedures and instruments?
METHOD
Sub ects
Volunteers were obtaiaed from graduate and undergraduate reading
classes in the University of Kentucky College of Education. Forty-one
of these appeared at the designated time and place, and of these, forty
actually completed the experiment. Each of the 40 subjects who par-
ticipated fully in the expeL_mental study received a gratuity of two
dollars.
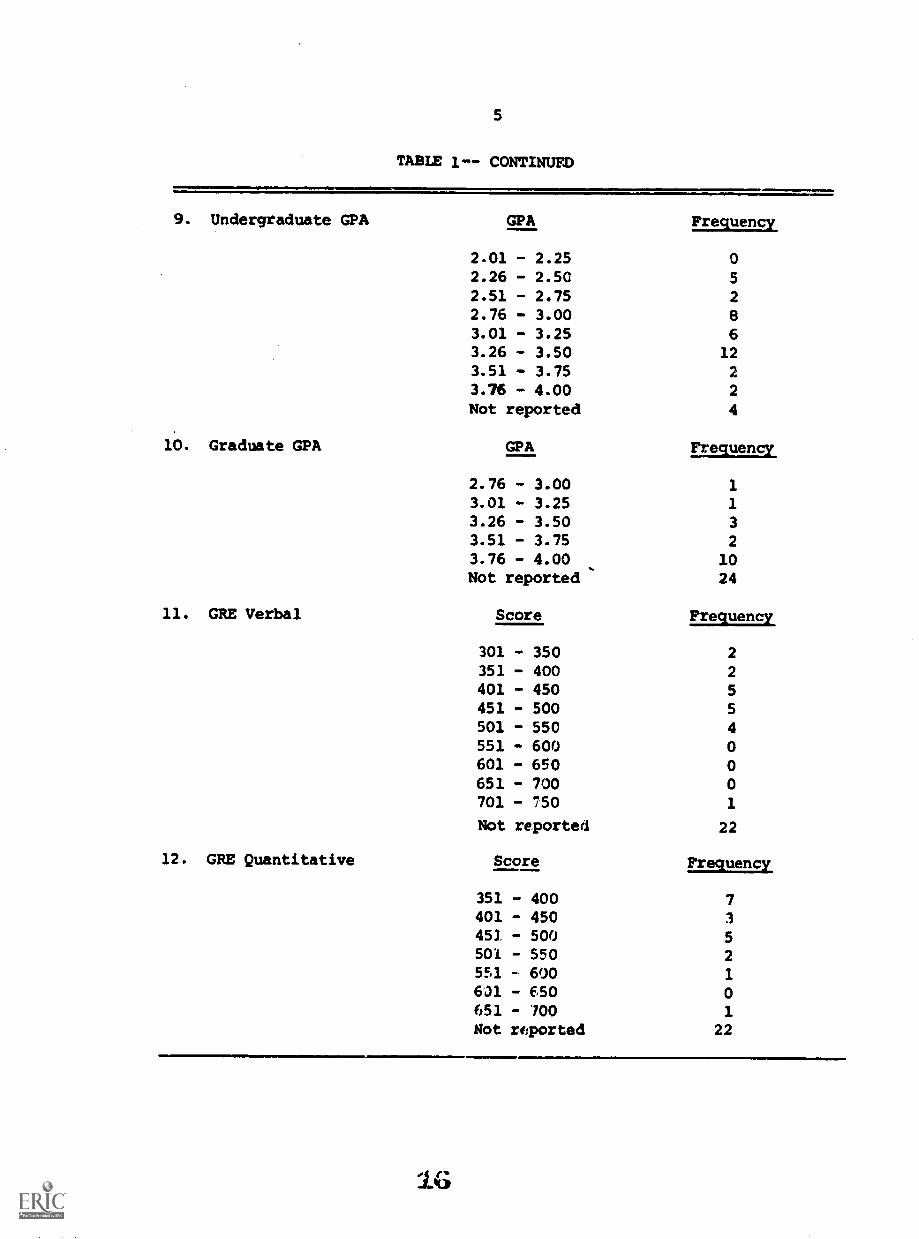
Table 1 summarizes the background characteristics of the 40
subjects in the study. While statistically there is no "typical"
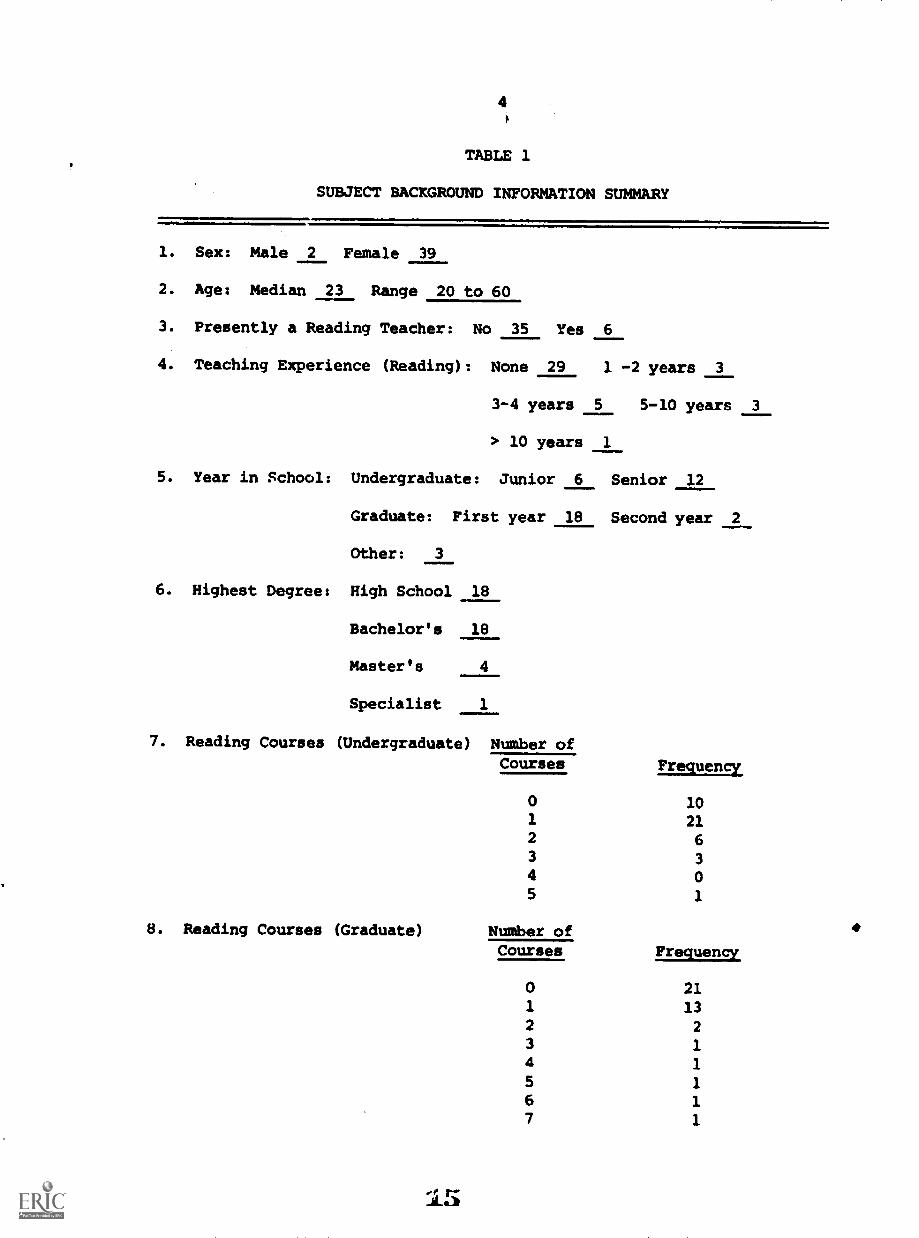
TABLE 1
SUBJECT BACKGROUND INFORMATION SUMMARY
1. Sex: Male 2 Female 39
2. Age: Median 23 Range 20 to 60
3. Presently a Reading Teacher: No 35 Yes 6
4. Teaching Experience (Reading): None 29 1 -2 years 3
3-4 years 5 5-10 years
> 10 years 1
5. Year in School: Undergraduate: Junior 6 Senior 12
Graduate: First year 18 Second year 2
Other: 3
6. Highest Degree: High School 18
Bachelor's 18
Master's 4
Specialist 1
7. Reading Courses (Undergraduate) Number ofCourses Frequency
8. Reading Courses (Graduate)
0 101 212 63 3
4 05 1
Number ofCourses Frequency
0 211 132 2
3 14 1
5 1
6 1
7 1
3
5
TABLE 1-- CONTINUED
9. Undergraduate GPA
10. Graduate GPA
11. GRE Verbal
12. GRE Quantitative
GPA Frequency
2.01 - 2.25 0
2.26 - 2.50 5
2.51 - 2.75 2
2.76 - 3.00 8
3.01 - 3.25 63.26 - 3.50 123.51 - 3.75 2
3.76 - 4.00 2
Not reported 4
GPA Frequency
2.76 - 3.00 1
3.01 - 3.25 1
3.26 - 3.50 3
3.51 - 3.75 2
3.76 - 4.00 10Not reported 24
Score Frequency
301 - 350 2
351 - 400 2
401 - 450 5
451 - 500 5
501 - 550 4
551 - 600 0601 - 650 0
651 - 700 0
701 - 750 1
Not reported 22
Score Frequency
351 - 400 7
401 - 450 3
451. - 500 5
501 - 550 2
5S1 - 600 1
601 - 650 0651 - 700Not reported 22
16
6
subject, the data in Table 1 suggest that the subject tended to be a
woman, 23 years old with a B grade-point-average who scored average or
below on the Graduate Record Examination. She was working on her
bachelor's or master's degree, had had little or no actual experience
in teaching reading, and had completed one course in reading instruction.
Instructional Materials
The instructional materials needed to implement the study were:
(1) a copy of the 30-minute televised lecture tape; (2) a copy of the
15-minute audio review tape; (3) a copy of the laboratory materials;
(4) a printed copy of the videotape script; and (5) a printed copy of the
audio review script.
Videotape #5
Videotape #5 is one of the 12 televised lectures to be broadcast
as part of the diagnostic and prescriptive reading instruction (DPRI)
course for K-3 teachers. The instructional activities in Unit 5 focus on
the analysis of oral reading miscues, as presented by Yetta Goodman and
Carolyn Burke in their Reading Miscue Inventory Manual: Procedures for
Diagnosis and Evaluation (New York: MacMillan, 1974).
In format the videotape is best characterized as an illustratfid
lecture. It consists structually of an opening and closing that shows
a redheaded, freckled-faced Appalachian boy having difficulty reading,
on-and-off camera narration by the instructor on the procedures for
17
7
administering and interpreting the Reading Miscue Inventory (RMI),
graphic illustrations of the RMI procedures, and documentary film
segments that depict the RMI being administered to an elementary student
and scored by a teacher.
Audio Review Tape #5
Audio review tape #5 is one of the 12 four-channel-audio review
tapes to be broadcast as part of the DPRI course. It contains four
case-study type questions that either highlight some of the main concepts
presented during the televised lecture or make explicit classroom
implications of these concepts.
During the actual course, the four questions and responses were
transmitted on four audio channels, one channel for each alternative
response. The participants listened to the four-choice audio review
questions on a set of headphones. The participant then pressed the
button on his response pad corresponding to his chosen response
(A, B, C, or D). Immediately following his selectioi he heard an
explanation that gave him feedback on the correctness or incorrectness of
his response. Since the next question he heard was unrelated to his
response on the previous question, there was branching within a question
but not between questions.
To simulate for the 7-group study, the simultaneous broadcast via
satellite of four explanations, a four-track tape was produced. It
contained the questions, alternatives, and alternate explanations. With
this recording and the headphones and playback equipment in the UK
language laboratory, the subjects in the 7-group experiment were able to
8
go through a selection process similar 11 the one the participants in the
course followed when the actual four-channel audio equipment was used.
Laboratory Materials for Unit 5
Like the participants in the course, the subjects in one of the
7 groups received a copy of the DPRI ancillary activities guide for
Unit 5. The guide included blank and filled-in copies of the RMI work-
sheet, a retelling outline, coding sheet, and reader profile. The DPRI
instructor, playing the role of the site monitor, guided the subjects
through the activities outlined in the ancillary activities guide. The
subjects listened to a tape of a child reading, marked his miscues on
the worksheet and his comprehension remarks on the retelling sheet,
and filled in the coding sheet and the reader profile. The attempt
again was to recreate for the 7 -group subjects the environment the
actual course participants experienced.
Printed Videotape Script
Some minor changes in word choice were made in the 19-page
script to adapt the narration to a written rather than an audio-visual
medium, but the essential content of the script was unaltered. For
instance, the alteration in delivery mode made it necessary to make
references to pictured materials more descriptive. The appendix to
this modified videotape script included some of the materials displayed,
visually during the videotaped administration of the RMI. The appendix
contained a copy of the boy's worksheet with all the miscues written in
and such sections of the RMI manual as the coding sheet, the reader
19
9
profile, and the patterns for interpreting student use of grammatical
and comprehension clues.
Audio Review Script #5
The printed audio review script for reading Unit 5 is a
verbatim transcription of the questions, alternatives and explanations
that appear on the four-channel audio tape #5. Each question with its
alternatives appeared on a separate page, the next two pages listing the
four possible responses, with each response followed by its particular
explanation.
Even though the content is the same, the printed format made
this a different learning activity from that experienced by a student
who heard the questions and answers. Consequently the instructions to
the subjects differed: the subject was asked to read each question, circle
the answer he felt was best, turn the page and read the explanation for
that alternative, and move on to the next question. As in the audio
format, a brief summary of the main concepts discussed in the questions
appeared at the end of the printed review.
Evaluation Instruments
To illuminate the purpose and content of each of the 12 different
evaluation instruments used in this study, the instruments are grouped
by the type of information they supply.
Educational Value of Materials
Since the learning sequence for the summer courses included
10
the televised lecture, the audio review, and the laboratory activities,
the following four instruments were developed to measure the effective-
ness of the instruction.
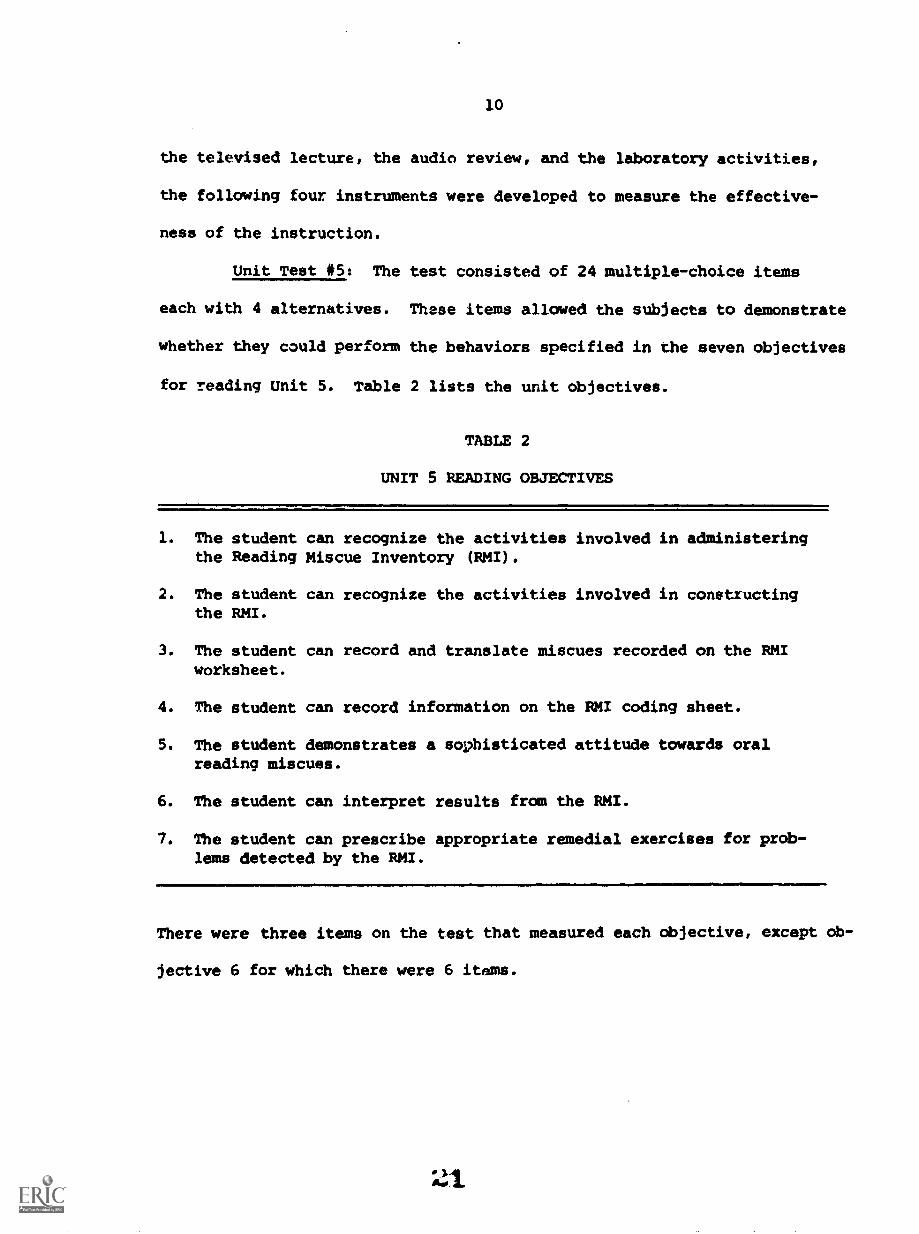
Unit Test #5: The test consisted of 24 multiple-choice items
each with 4 alternatives. These items allowed the subjects to demonstrate
whether they could perform the behaviors specified in the seven objectives
for reading Unit 5. Table 2 lists the unit objectives.
TABLE 2
UNIT 5 READING OBJECTIVES
1. The studentthe Reading
2. The studentthe RMI.
3. The studentworksheet.
can recognize the activities involved in administeringMiscue Inventory (RMI).
can recognize the activities involved in constructing
can record and translate miscues recorded on the RMI
4. The student can record information on the RMI coding sheet.
5. The student demonstrates a sophisticated attitude towards oralreading miscues.
6. The student can interpret results from the RMI.
7. The student can prescribe appropriate remedial exercises for prob-lems detected by the RMI.
There were three items on the test that measured each objective, except ob-
jective 6 for which there were 6 items.
BEST COPY 11
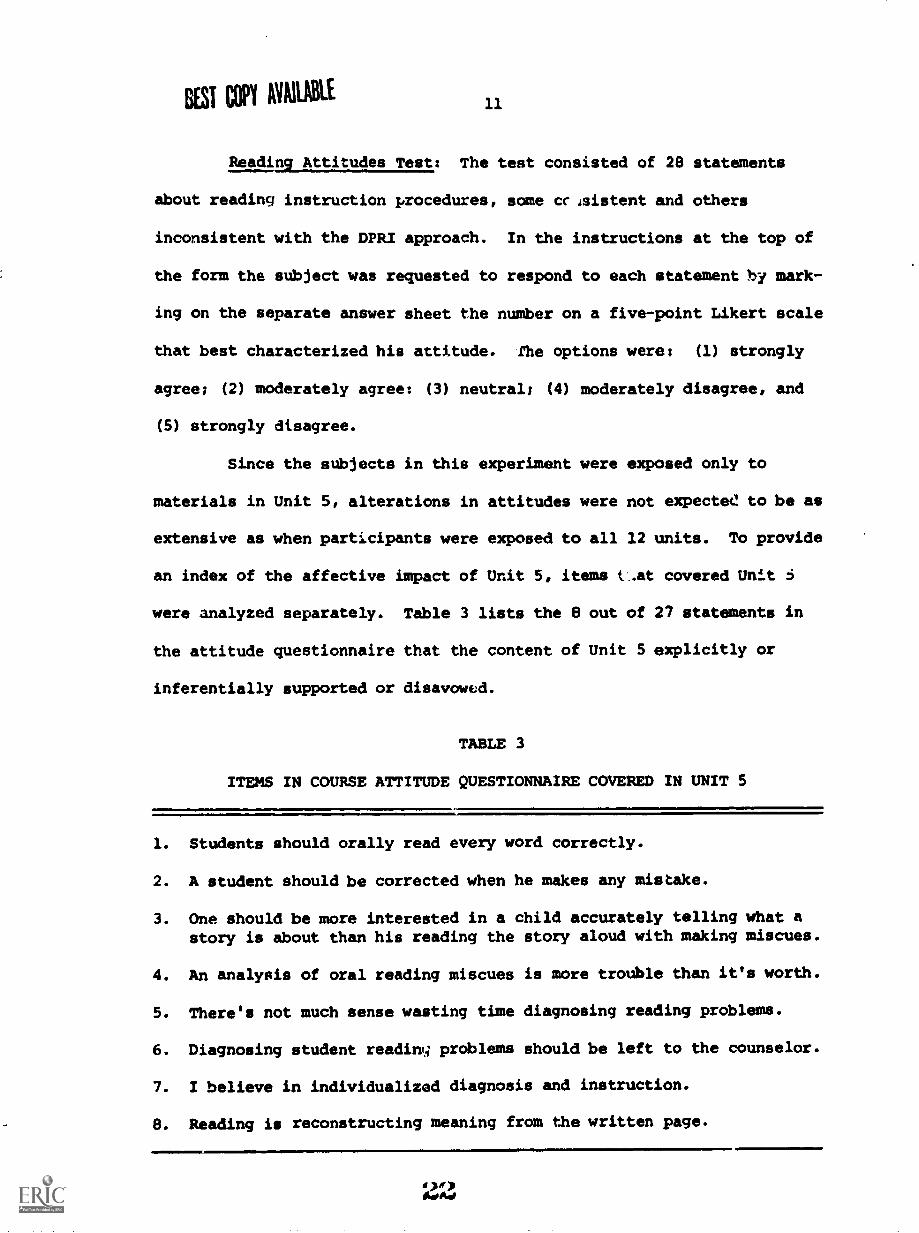
Reading Attitudes Test: The test consisted of 28 statements
about reading instruction procedures, some ccisistent and others
inconsistent with the DPRI approach. In the instructions at the top of
the form the subject was requested to respond to each statement by mark-
ing on the separate answer sheet the number on a five-point Likert scale
that best characterized his attitude. The options were: (1) strongly
agree; (2) moderately agree: (3) neutral; (4) moderately disagree, and
(5) strongly disagree.
Since the subjects in this experiment were exposed only to
materials in Unit 5, alterations in attitudes were not expecte to be as
extensive as when participants were exposed to all 12 units. To provide
an index of the affective impact of Unit 5, items i.at covered Unit 6
were analyzed separately. Table 3 lists the 8 out of 27 statements in
the attitude questionnaire that the content of Unit 5 explicitly or
inferentially supported or disavowed.
TABLE 3
ITEMS IN COURSE ATTITUDE QUESTIONNAIRE COVERED IN UNIT 5
1. Students should orally read every word correctly.
2. A student should be corrected when he makes any mistake.
3. One should be more interested in a child accurately telling what astory is about than his reading the story aloud with making miscues.
4. An analysis of oral reading miscues is more trouble than it's worth.
5. There's not much sense wasting time diagnosing reading problems.
6. Diagnosing student reading problems should be left to the counselor.
7. I believe in individualized diagnosis and instruction.
8. Reading is reconstructing meaning from the written page.
12
Unit Objective Rating Form: Listed on this form were seven
objectives for reading Unit 5 plus three bogus objectives. The subjects
were asked to rank ten objectives from one to ten in terms of the per-
ceived emphasis on the objective received during the instructional activ-
ities, with a rating of one for the objective that received the most
emphasis.
Confidential Background Questionnaire: The questionnaire
consisted of 10 fill-in-the-blank and 5 multiple-choice items. It
provided information on such individual differences of the subjects as
their sex, age, education level, formal learning experiences in reading,
teaching experience in reading instruction, graduate and undergraduate
grade-point-average, and GRE scores. With this information it was
possible to relate background characteristics to performance and to
determine with which types, if any, the materials were most effective.
Subject-Perceived Quality of Materials
Measuring the degree to which cognitive and affective changes
occur in the participants is one way to evaluate the effectiveness of
the materials. Another method is to have the users of the materials
express their opinion of the quality of the materials. To obtain this
information an attitudinal instrument for each of the six learning
activities was developed. Each instrument collected information on the
perceived usefulness of the content to the classroom teacher, the
perceived technical and presentation quality of the materials and
equipment used during the activity, and the preferences of the subjects
for various presentation modes.
13
Table 4 identifies the technical, presentation, content, and
value features common to all three types of learning activities rated by
the subjects. For instance, in the value section of Table 4 are seven
features the subjects were asked to rate. There is an X under the format
if the feature was rated. For instance, the subjects in all formats were
.asked to rate how interesting the different formats for each instructional
activity were (feature 19) and how much they felt they learner's during the
activity (feature 20).
The data gathered on the six attitudinal instruments provided
information that could be used to answer such questions about the
acceptability of the materials, the equipment and the procedures as:
Does the equipment malfunction or same mishandling of the
class interfere with the reception of the instruction?
(see technical features in Table 4).
Are the materials adequately displayed and does the presenter
speak distinctly and seem credible? (see presentation
features in Table 4).
Are the ideas presented in an organized fashion, and is the
information adapted to the needs of the classroom teacher?
(see content features in Table 4).
- What is the value of the presentation as an instructional
activity? (see value features in Table 4).
24
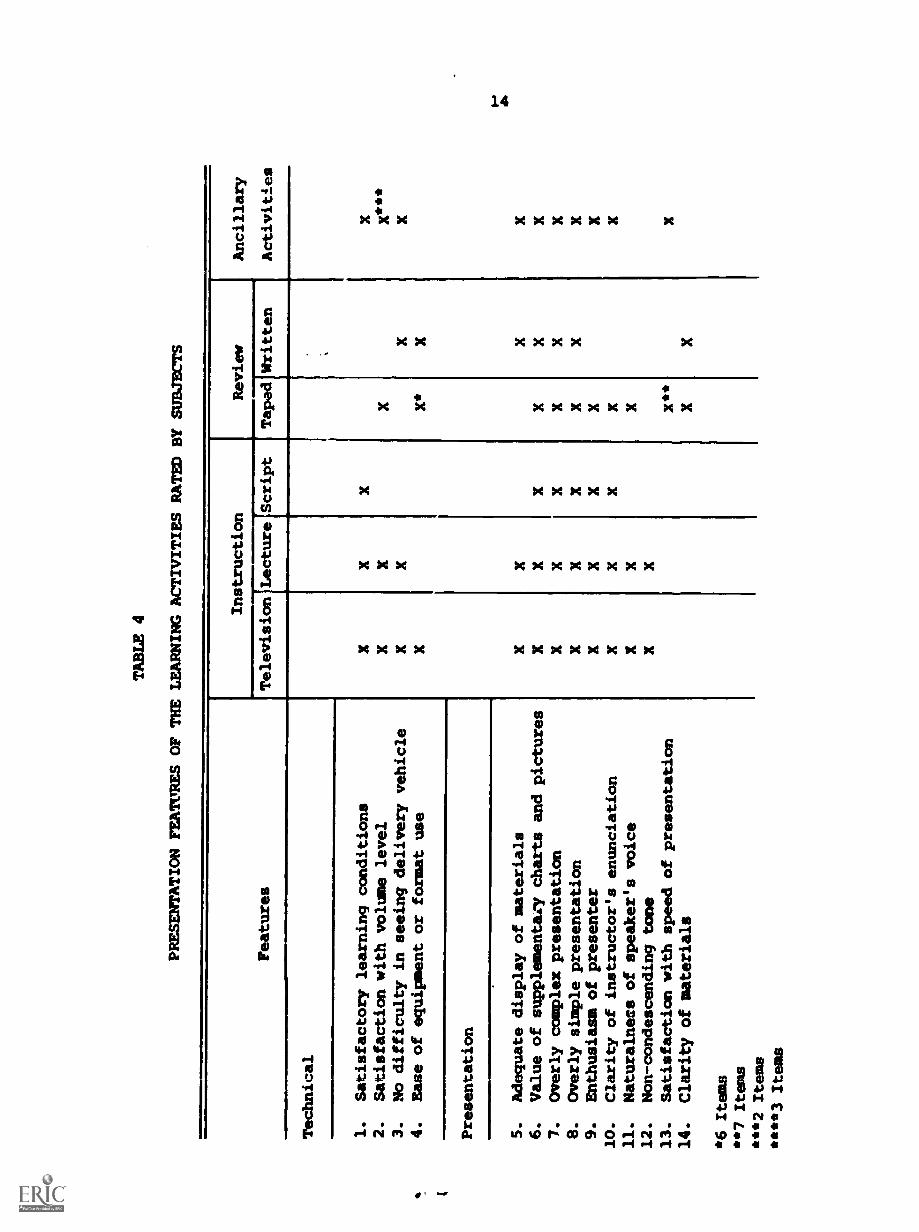
TABLE 4
PRESENTATION FEATURES OF THE LEARNING ACTIVITIES RATED BY SUBJECTS
Features
Technical
Instruction
1.
Satisfactory learning conditions
2.
Satisfaction with volume level
3.
No difficulty in seeing delivery vehicle
4.
Ease of equipment or format use
Presentation
S.
Adequate display of materials
6.
Value of supplementary charts and pictures
7.
Overly complex presentation
8.
Overly simple presentation
9.
Enthusiasm of presenter
10.
Clarity of instructor's enunciation
11.
Naturalness of speaker's voice
12.
Non-condescending tone
13.
Satisfaction with speed of presentation
14.
Clarity of materials
*6 Its
**7 Items
***2 Items
****3 Items
Television Lecture Script
X
Review
Taped Written
X X*
X X X
Ancillary
Activities
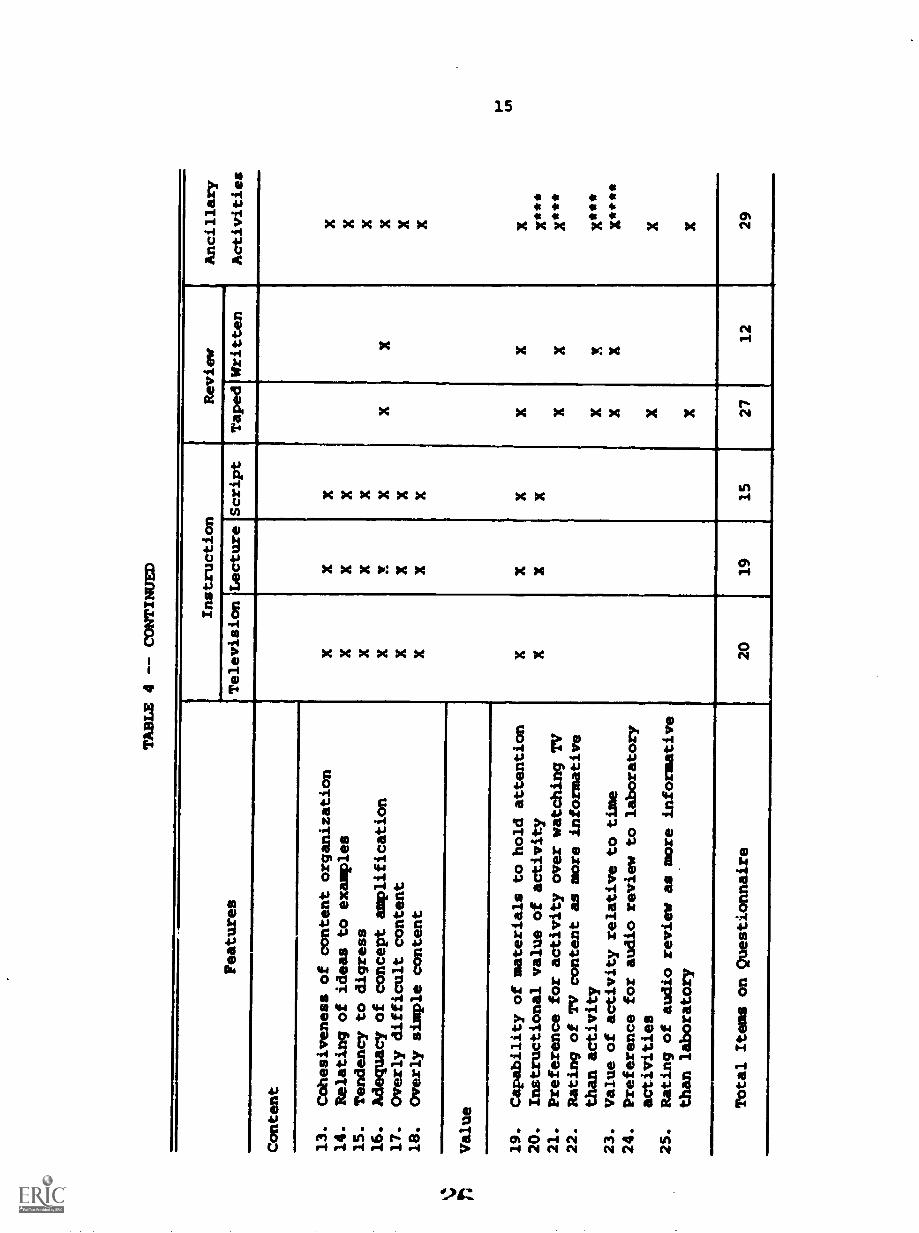
TABLE 4 -- CONTINUED
Instruction
Review
Ancillary
Activities
Features
Television
Lecture
Script
TapedWritten
Content
x X x X X X X X
X X X M X X X X
x X X X X X X X
X X X X X X X
X X X x X
X X X X X X X X***
X***
X***
x****
X X
13.
Cohesiveness of content organization
14.
Relating of ideas to examples
15.
Tendency to digress
16.
Adequacy of concept amplification
17.
Overly difficult content
18.
Overly simple content
Value
19.
Capability of materials to hold attention
20.
Instructional value of activity
21.
Preference for activity over watching TV
22.
Rating of TV content as more informative
than activity
23.
Value of activity relative to time
24.
Preference for audio review to laboratory
activities
25.
Rating of audio review as more informative
than laboratory
Total It
on Questionnaire
20
19
15
27
12
29

BEST COPT AVAILABLE
16
The Video, Lecture and Script Questionnaires: There were three
separate, but essentially parallel, instruments that measured the opinions
of the subjects on the content and presentation quality of three different
modes of instruction. The rewording of items to describe the particular
mode was one of the minor differences between the questionnaires. For
instance, whether a reference was made to the "TV program" or the
"lecture" or the "script" depended on the presentation mode. Since all
items did not apply to all three presentation modes, the questionnaires
also differed in length. The Video Questionnaire had 20 items, the
Lecture Questionnaire had 19 and the Script Questionnaire had 15. The
subject rated each statement on a five-point Likert scale.
The Four-Channel Audio Ratin and the Four-Channel Audio Script
Rating Form: These were separate but parallel forms that measured the
opinions of the subjects on the content and presentation quality of the
taped and written formats for the review and amplifi,Ation of the
instruction. The qualities of the taped and written reviews were stated
in quest!on form and required a dichotomous yes-no response.
Table 4 identifies which features common to both modes of review
were assessed by the items. Summing the scores and comparing the means
for the items common to each format provided a measure of subject
receptivity to the different ways of presenting the same material.
Ancillary Activities Questionnaire: As revealed in Tab]e 4
many of the 29 Likert-type statements on this form allowed the subjects
not only to express their opinions of features peculiar to the
27
17
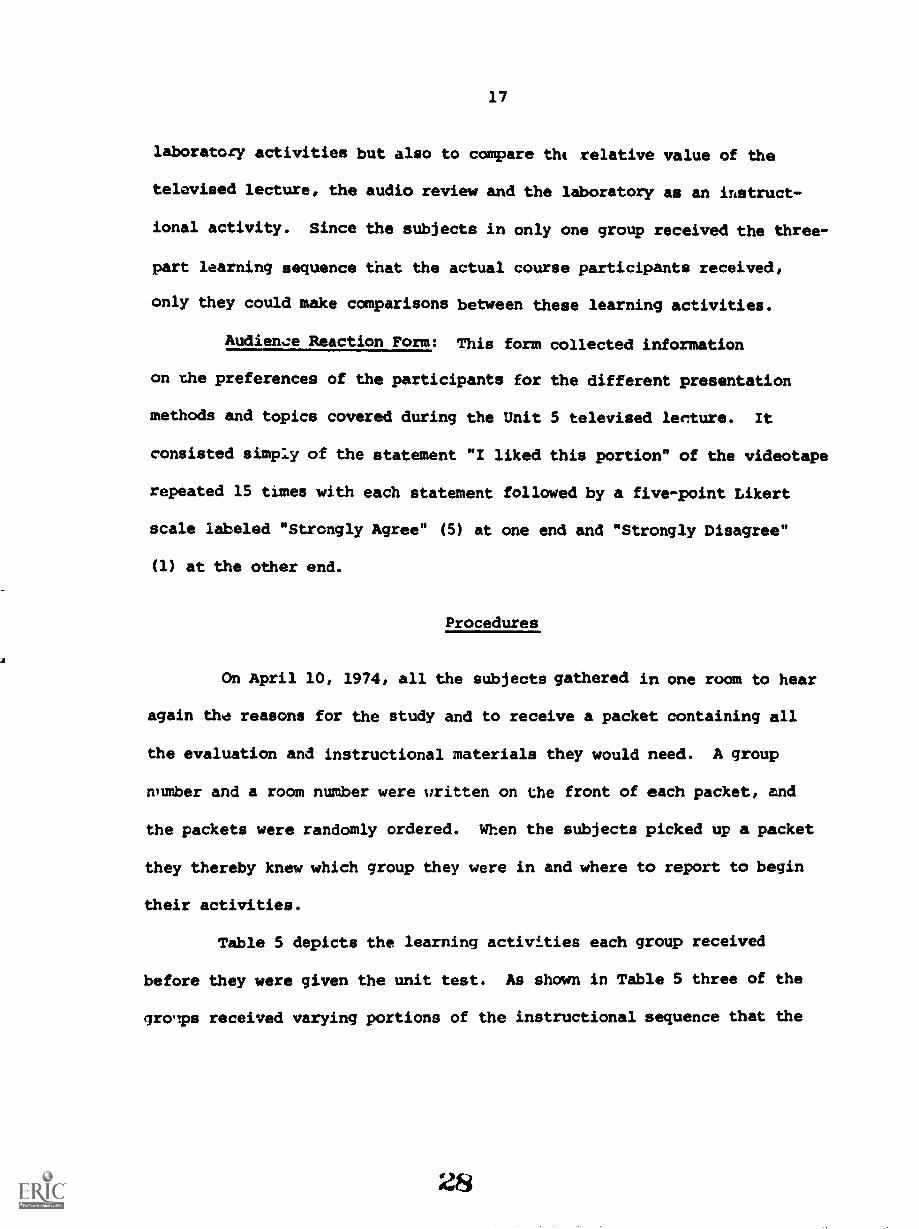
laboratory activities but also to compare the relative value of the
televised lecture, the audio review and the laboratory as an instruct-
ional activity. Since the subjects in only one group received the three-
part learning sequence that the actual course participants received,
only they could make comparisons between these learning activities.
Audienze Reaction Form: This form collected information
on the preferences of the participants for the different presentation
methods and topics covered during the Unit 5 televised lecture. It
consisted simply of the statement "I liked this portion" of the videotape
repeated 15 times with each statement followed by a five-point Likert
scale labeled "Strongly Agree" (5) at one end and "Strongly Disagree"
(1) at the other end.
Procedures
On April 10, 1974, all the subjects gathered in one room to hear
again the reasons for the study and to receive a packet containing all
the evaluation and instructional materials they would need. A group
number and a room number were written on the front of each packet, and
the packets were randomly ordered. When the subjects picked up a packet
they thereby knew which group they were in and where to report to begin
their activities.
Table 5 depicts the learning activities each group received
before they were given the unit test. As shown in Table 5 three of the
grays received varying portions of the instructional sequence that the
28

18
summer course participants actually received. Group 7 received the
entire instructional sequence - the televised lecture, followed by the
audio review with immediate feedback and the laboratory activities.
Group 6 received the televised lecture followed by the audio review,
and Group 4 received only the televised lecture.
In contrast, three of the groups received the lecture or the
review in an alternate delivery mode. Group 2 received a written version
of the lecture, and Group 3 heard an on-site instructor deliver a fifty-
minute lecture. The lecture covered essentially the same material
covered in the televised lecture. Group 5 received the regular
televised lecture, but a paper and pencil, rather than an audio, version
of the review questions. To estimate entrance-level knowledge, Croup 1
received no treatment.
TABLE 5
CONTRASTING LEARNING SEQUENCES FOR GROUPS
LaboratoryActivities
UnitTest
Treatment Instrurtion
Live
Review
Televised Written Audio Written
Group 1
Group 4 X
Group 3
Group 2 X
Group 6 X X
Group 5 X X
Group 7 ! X X X
19
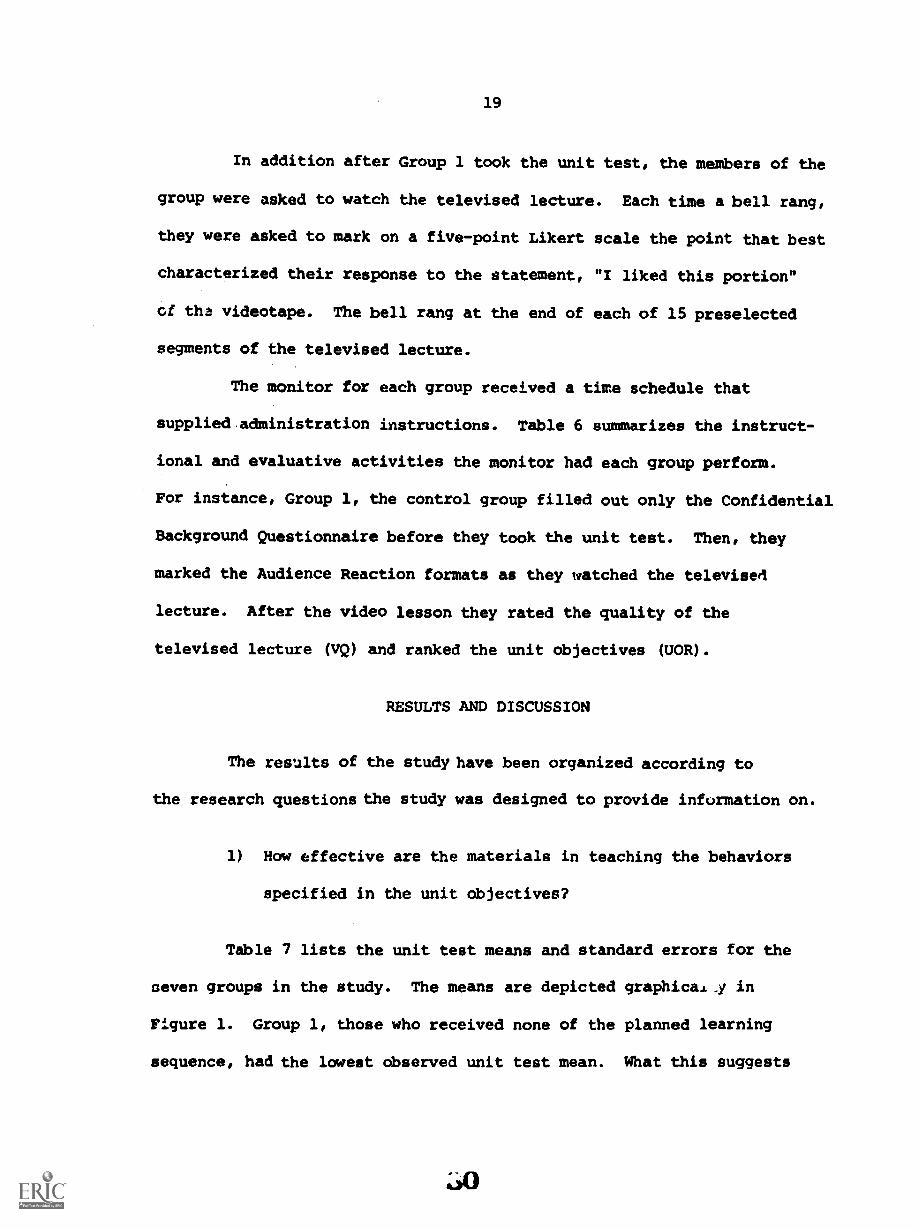
In addition after Group 1 took the unit test, the members of the
group were asked to watch the televised lecture. Each time a bell rang,
they were asked to mark on a five-point Likert scale the point that best
characterized their response to the statement, "I liked this portion"
of tha videotape. The bell rang at the end of each of 15 preselected
segments of the televised lecture.
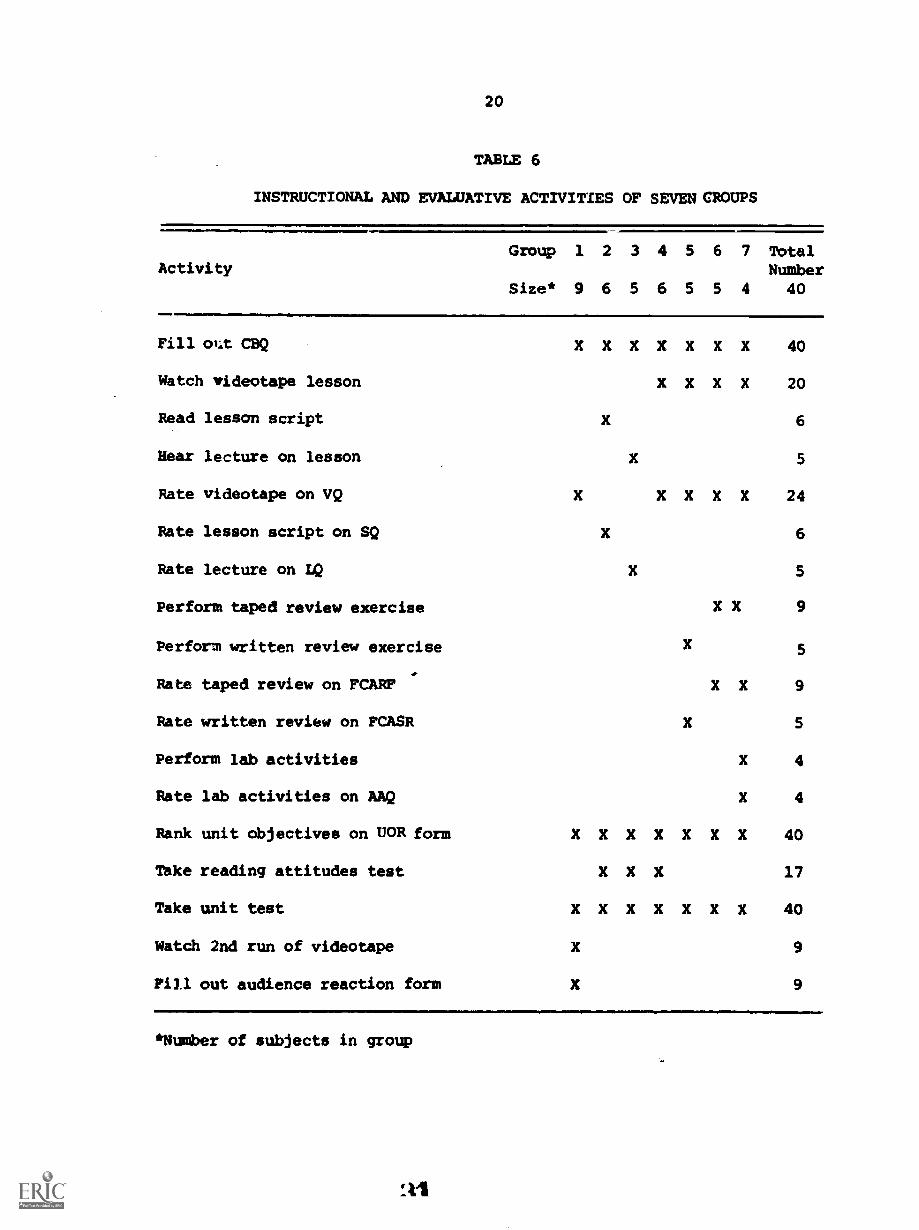
The monitor for each group received a time schedule that
supplied administration instructions. Table 6 summarizes the instruct-
ional and evaluative activities the monitor had each group perform.
For instance, Group 1, the control group filled out only the Confidential
Background Questionnaire before they took the unit test. Then, they
marked the Audience Reaction formats as they watched the televised
lecture. After the video lesson they rated the quality of the
televised lecture (VQ) and ranked the unit objectives (UOR).
RESULTS AND DISCUSSION
The results of the study have been organized according to
the research questions the study was designed to provide information on.
1) How effective are the materials in teaching the behaviors
specified in the unit objectives?
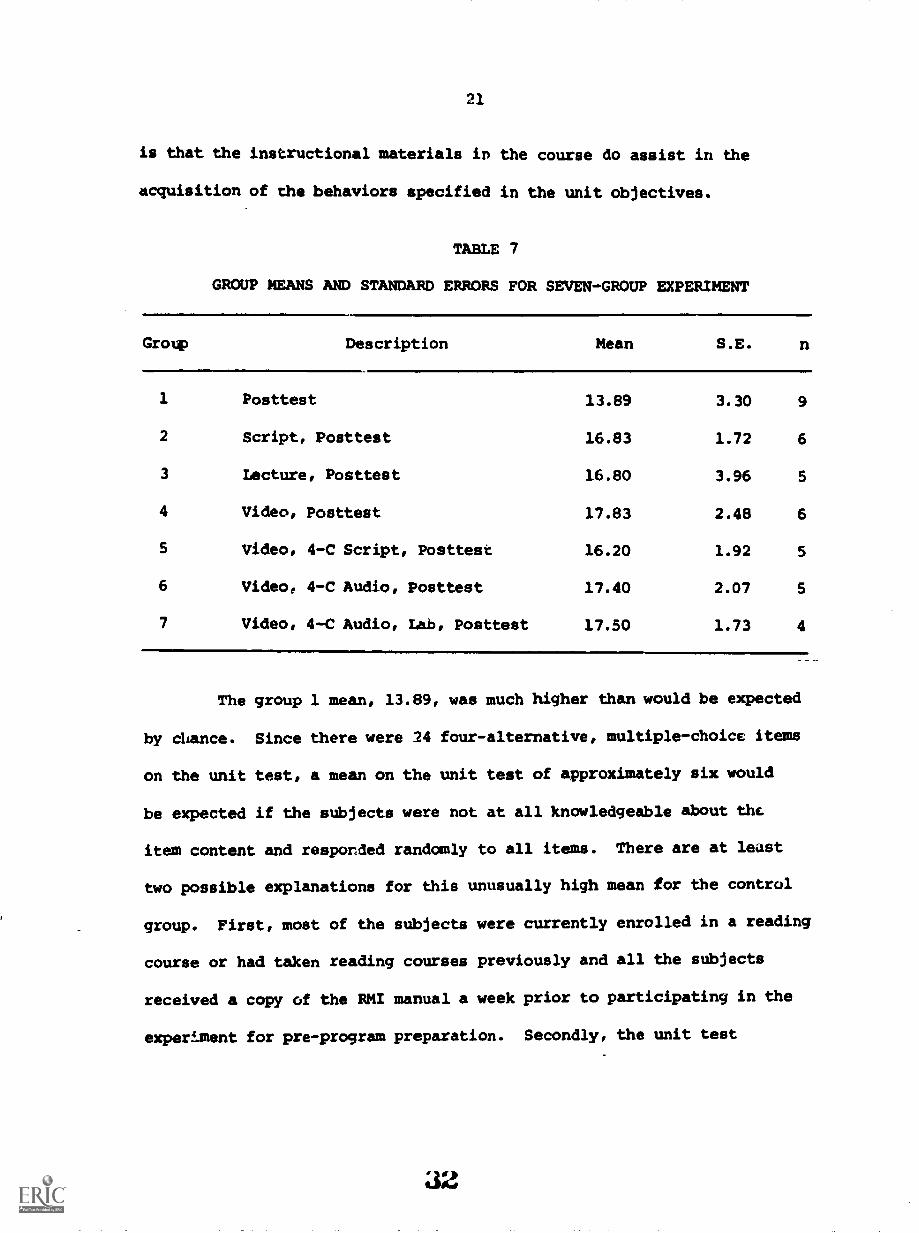
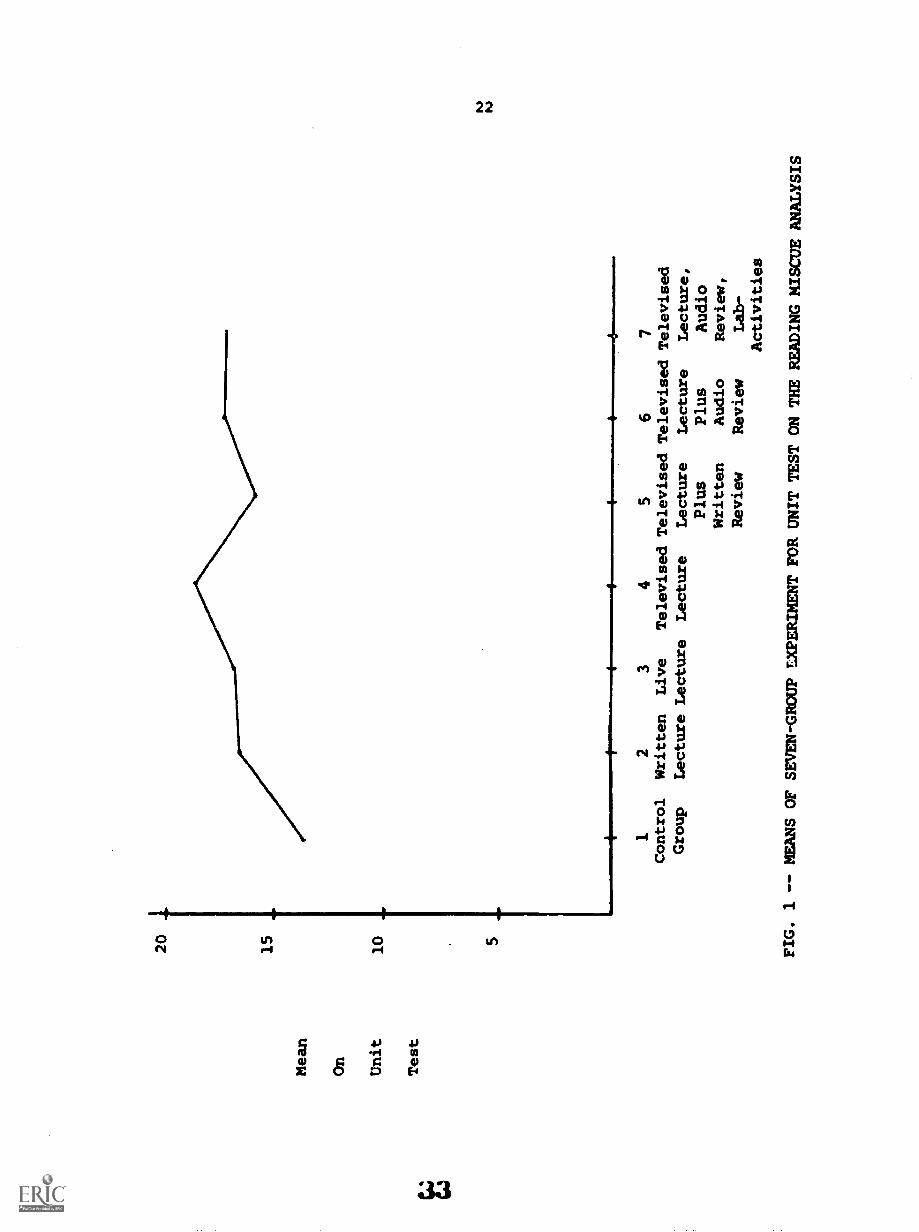
Table 7 lists the unit test means and standard errors for the
seven groups in the study. The means are depicted graphica.1.4 in
Figure 1. Group 1, those who received none of the planned learning
sequence, had the lowest observed unit test mean. What this suggests
.a0
20
TABLE 6
INSTRUCTIONAL AND EVALUATIVE ACTIVITIES OF SEVEN GROUPS
ActivityGroup 1
Size* 9
2
6
3
5
4
6
5
5
6
5
7
4
TotalNumber
40
Fill ollt CBQ X X X X X X X 40
Watch videotape lesson X X X X 20
Read lesson script X 6
Hear lecture on lesson x 5
Rate videotape on VQ X X X X X 24
Rate lesson script on SQ X 6
Rate lecture on LQ X 5
Perform taped review exercise X X 9
Perform written review exercise X 5
Rate taped review on FCARF X X 9
Rate written review on FCASR X 5
Perform lab activities X 4
Rate lab activities on AAQ X 4
Rank unit objectives on UOR form X X X X X X X 40
Take reading attitudes test X X X 17
Take unit test X X X X X X X 40
Watch 2nd run of videotape X 9
Fill out audience reaction form X 9
*Number of subjects in group
23.
is that the instructional materials in the course do assist in the
acquisition of the behaviors specified in the unit objectives.
TABLE 7
GROUP MEANS AND STANDARD ERRORS FOR SEVEN-GROUP EXPERIMENT
Group Description Mean S.E.
1 Posttest 13.89 3.30 9
2 Script, Posttest 16.83 1.72 6
3 Lecture, Posttest 16.80 3.96 5
4 Video, Posttest 17.83 2.48 6
5 Video, 4-C Script, Posttest 16.20 1.92 5
6 Video9 4-C Audio, Posttest 17.40 2.07 5
7 Video, 4-C Audio, Lab, Posttest 17.50 1.73 4
The group 1 mean, 13.89, was much higher than would be expected
by chance. Since there were 24 four-alternative, multiple-choice items
on the unit test, a mean on the unit test of approximately six would
be expected if the subjects were not at all knowledgeable about the
item content and responded randomly to all items. There are at least
two possible explanations for this unusually high mean for the control
group. First, most of the subjects were currently enrolled in a reading
course or had taken reading courses previously and all the subjects
received a copy of the RMI manual a week prior to participating in the
experiment for pre-program preparation. Secondly, the unit test
32
Mean
On
Unit
Test
20
15
10
12
3Control
Written
Live
Group
Lecture Lecture
45
6Televised Televised Televised
Lecture
Lecture
Lecture
Plus
Plus
Written
Audio
Review
Review
7
Televised
Lecture,
Audio
Review,
Lab-
Activities
FIG. 1 -- MEANS OF SEVEN-GROUP EXPERIMENT FORUNIT TEST ON THE READING MISCUE ANALYSIS
23
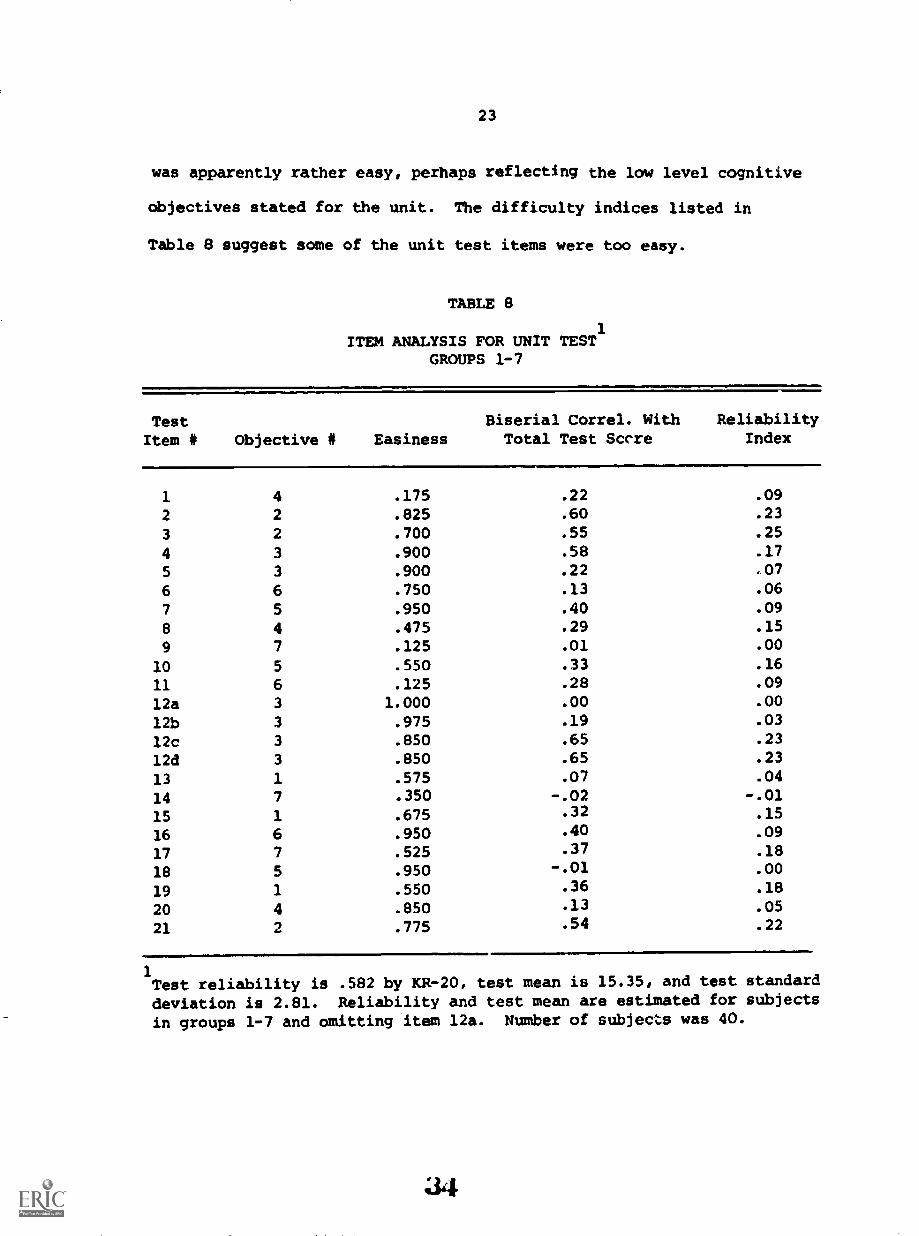
was apparently rather easy, perhaps reflecting the low level cognitive
objectives stated for the unit. The difficulty indices listed in
Table 8 suggest some of the unit test items were too easy.
TABLE 8
1ITEM ANALYSIS FOR UNIT TEST
GROUPS 1-7
TestItem # Objective # Easiness
Biserial Correl. WithTotal Test Scare
ReliabilityIndex
1 4 .175 .22 .09
2 2 .825 .60 .23
3 2 .700 .55 .25
4 3 .900 .58 .17
5 3 .900 .22 .07
6 6 .750 .13 .06
7 5 .950 .40 .09
8 4 .475 .29 .15
9 7 .125 .01 .00
10 5 .550 .33 .16
11 6 .125 .28 .09
12a 3 1.000 .00 .00
12b 3 .975 .19 .03
12c 3 .850 .65 .23
12d 3 .850 .65 .23
13 1 .575 .07 .04
14 7 .350 -.02 -.01
15 1 .675 .32 .15
16 6 .950 .40 .09
17 7 .525 .37 .18
18 5 .950 -.01 .00
19 1 .550 .36 .18
20 4 .850 .13 .05
21 2 .775 .54 .22
1Test reliability is .582 by KR-20, test mean is 15.35, and test standard
deviation is 2.81. Reliability and test mean are estimated for subjects
in groups 1-7 and omitting item 12a. Number of subjects was 40.
24
While the unit test measured cognitive achievement, the reading
attitudes questionnaire measured the attitudes of the subjects toward
principles expressed in Unit 5. As indicated in Table 3 there were eight
items on the attitude test related to concepts covered during Unit 5.
The means have been adjusted so that the closer a mean is to five the
more strongly the subjects agreed with the principle.
The means for the 17 subjects taking this test (groups 2, 3, and
4) were (1) 4.47 (SD .62) for the idea that it is not important that
children make no errors while reading aloud; (2) 4.06 (SD 1.09) for the
idea that it is not necessary to correct a child every time he makes a
mistake; (3) 4.47 (SD .80) for the idea that it is more important that a
child understands what he reads than read without making miscues; (4)
4.29 (SD .85) for the idea that analyzing oral miscues is worth the time
it takes; (5) 4.94 (SD .24) for the idea that diagnosing reading problems
is worth the time it takes; (6) 4.82 (SD .53) for the idea that
diagnosing reading problems is the responsibility of the teacher rather
than the counselor; (7) 4.82 (SD .39) for the idea that individualized
diagnosis and instruction is important; (8) 4.35 (SD .61) for the notion
that the main function of reading is the reconstruction meaning from
written symbols.
The subjects on the average expressed a very positive attitude
toward the principles expressed in the unit. Since the attitude
questionnaire was only given to students receiving the lecture in some
format, it was not possible to measure changes in attitudes as a result
of the lecture nor to compare the results for students participating in
the other learning activities.
25
2) Does receiving a greater portion of the learning sequence
result in the subjects learning more?
The increments in learning attributed to different amounts of
the learning sequence and learning activities were estimated by comparing
the group means. The model, Yi p + 01 + 02 + 03 + ei, depicts the
learning increments due to each learning activity. In this model Yi is
the unit test score for subjects i completing all learning activities,
p is the population grand mean without instruction, 01 is the effect
of the televised or written lecture, 02 is the effect of the taped or
written review activity, 03 is the effect of the laboratory materials,
and ei
is the error term for subject i.
To estimate these effects, the model used is
al
Yi 1n (Y1 Yn) (7F YI)(YL Yr) +ei,
when "in is the estimated mean for students receiving no instruction, Yl
is the mean for those receiving only the initial lecture instruction in
some format, Y is the mean for subjects receiving the lecture and the
review in some format, YL
is the mean for students receiving the lab-
oratory activities and the lecture end review in the format selected for
the summer courses. When the estimates are used in the model, it becomes
Yi 13.89 + 3.26 + (-.35) + .70 + ei.
Of all the planned comparisons only the effect of the lecture in some format
(#1ss 3.26) was significantly different from zero (ci - .05).
This means that the only learning detectable, with this design,
sample size, and measuring instrument, resulted from the presentation
of the lecture in some format. The fact that subjects who received
26
more of the learning sequence did not show significant gain may be due
to memory loss or retroactive inhibition ,(subsequent learning interfered
with prior learning).
3) How do the selected formats for the learning activities
compare with the alternate formats in terms of their
effectiveness in teaching specified behaviors?
Comparisons were made among the alternative formats for the
lecture presentation (live lecture, television script only, and
televised lecture) and between the formats for the audio review
(pretaped audio review and audio review script only) using the Scheffe
method for a posteriori comparisons. The dependent variable was the
unit test score. None of these tests were significant for the sample
sizes employed. Thus, no detectable differences in unit test perform-
ance as a function of alternative presentation formats were observed.
4) Which formats for the learning activities did the subjects
prefer?
By their unit test scores the subjects demonstrated the general
effectiveness of the materials and procedures. In addition, their
opinions about the quality of the materials and the acceptability of the
procedures and equipment provided an index to the effectiveness of the
individual learning activities.
On the questionnaires developed for each activity the users were
asked to express their opinion about different features of the learning
27
activities. Those watching the televised lecture were asked to respond
to the statements on the Video Questionnaire, those listening to the
live lecturer were asked to rate the statements on the Lecture
Questionnaire, and so forth. The statements cluster around four basic
aspects of each learning activity: technical, presentation, content,
and over-all value features of the activity.
The independent variable, then, is the learning activity the
subject experienced, and the dependent variable is the subject's score
on the questionnaire appropriate for the activity. The length of these
questionnaires differed, since different learning activities or alter-
itive formats for the same learning activity occasionally called for
more information on one or more of the four feature categories. :or
instance, the Four-Channel Audio Rating form is much longer than the
Four-Channel Script Rating form partially because it contains more
statements about technical features. However, when different formats
for the same learning activity were compared, only items common to all
questionnaires were included in the total scores. From the data
collected several interpretations can be made about subject preferences.
a) The data suggest that the users preferred the live to the
televised or written versions of the lecture.
Table 9 the individual item means for the different
features the subjects assessed on tL &e questionnaires for the three
lecture formats -- the televised lecture, the live lecture, and the
written lecture. It should be pointed out that, although the features
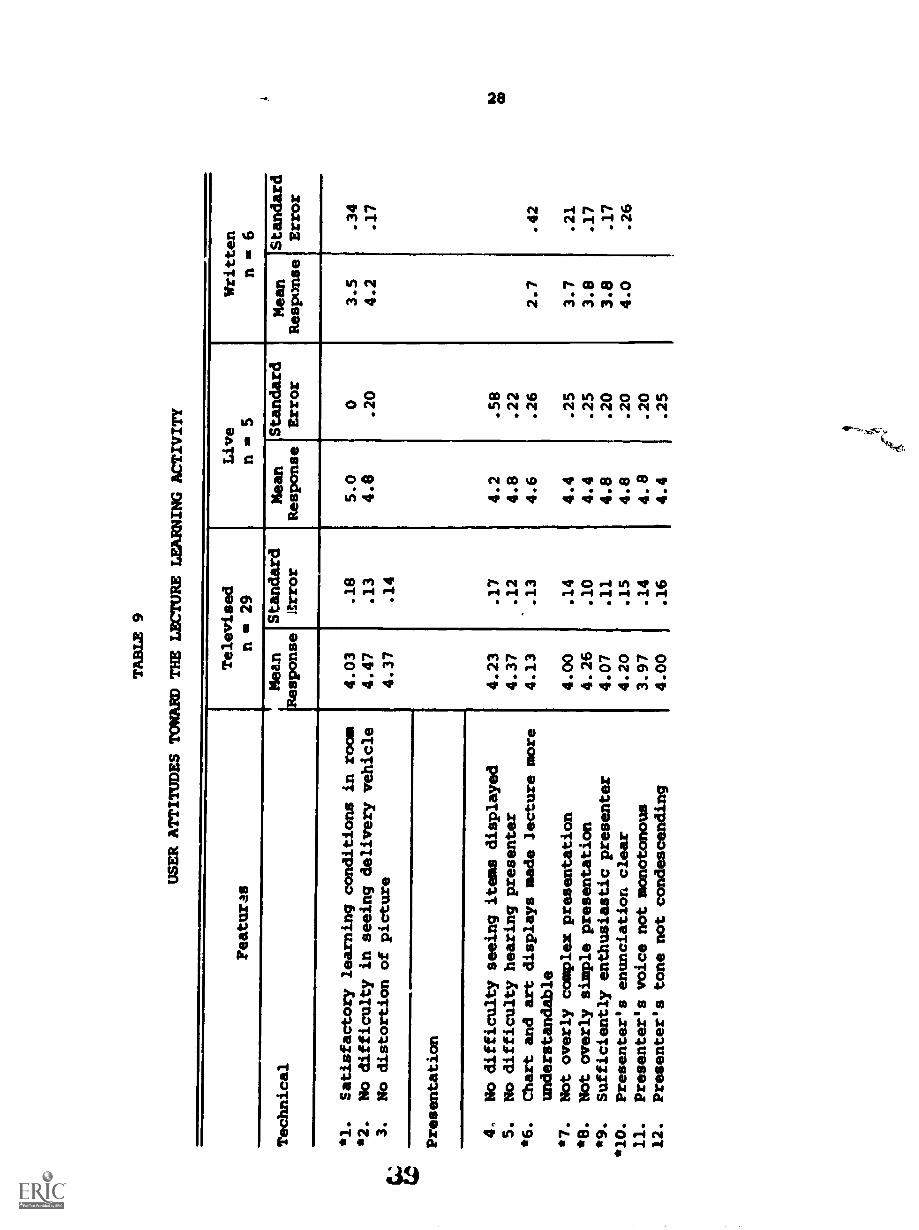
TABLE 9
USER ATTITUDES TOWARD THE LECTURE LEARNING ACTIVITY
Featuras
Televised
n = 29
Live
n = 5
Written
n =6
Technical
Mean
Response
Standard
Ltrror
Mean
Response
Standard
Error
Mean
ResponseStandard
Error
*1.
Satisfactory learning conditions inroom
4.03
.18
5.0
03.5
.34
*2.
No difficulty in seeing delivery vehicle
4.47
.13
4.8
.20
4.2
.17
3.
No distortion of picture
4.37
.14
Presentation
.17
4.2
.58
4,
No difficulty seeing items displayed
4.23
5.
No difficulty hearing presenter
4.37
.12
4.8
.22
*6.
Chart and art displays made lecture more
understandable
4.13
.13
4.6
.26
2.7
.42
*7.
Not overly complex presentation
4.00
.14
4.4
.25
3.7
.21
*8.
Not overly simple presentation
4.26
.10
4.4
.25
3.8
.17
*9.
Sufficiently enthusiastic presenter
4.07
.11
4.8
.20
3.8
.17
*10.
Presenter's enunciation clear
4.20
.15
4.8
.20
4.0
.26
11.
Presenter's voice not monotonous
3.97
.14
4.8
.20
12.
Presenter's tone not condescending
4.00
.16
4.4
.25
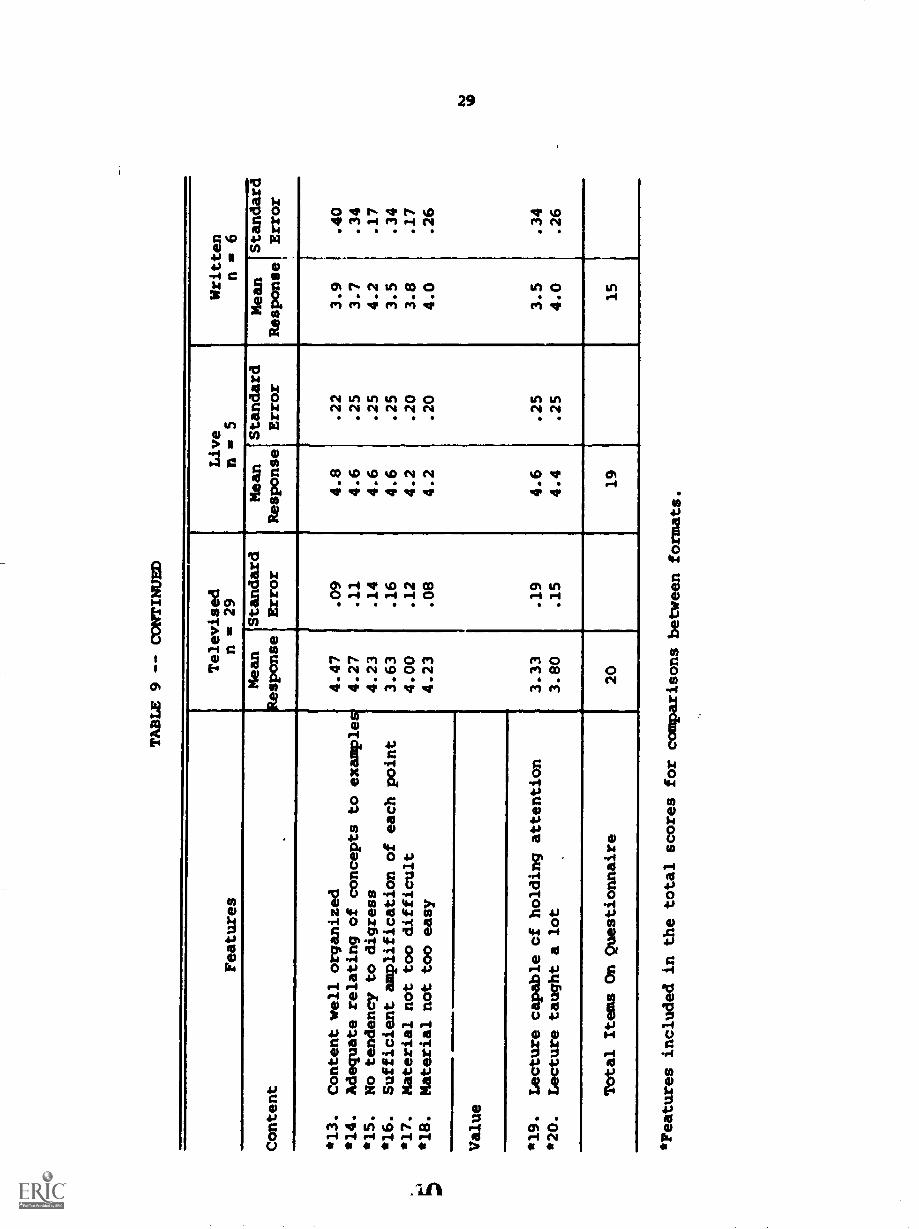
TABLE 9 -- CONTINUED
Features
Televised
n= 29
Live
n = 5
Written
n = 6
Mean
Standard
Response Error
Content
Mean
1tesponse
'Standard
Error
Mean
Response
Standard
Error
4,
*13.
Content well organized
4.47
.09
4.8
.22
3.9
.40
*14.
Adequate relating of concepts to examples
4.27
.11
4.6
.25
3.7
.34
*15.
No tendency to digress
4.23
.14
4.6
.25
4.2
.17
*16.
Sufficient amplification of each point
3.63
.16
4.6
.25
3.5
.34
*17.
Material not too difficult
4.00
.12
4.2
.20
3.8
.17
*18.
Material not too easy
4.23
.08
4.2
.20
4.0
.26
Value
*19.
Lecture capable cf holding attention
3.33
.19
4.6
.25
3.5
.34
*20.
Lecture taught a lot
3.80
.15
4.4
.25
I
4.0
.26
/
Total Its On Questionnaire
20
19
15
*Features included in the total
scores for comparisons between formats.
BEST COPY AVAILABLE 30
are now stated positively for greater readability, on the questionnaires
the statements were phrased in both positive and negative directions.
The closer the mean is to 5 in Table 9 the more positive user reaction
was.
The starred features identify the 15 items on the questionnaires
for the three alternate lecture formats that were included in the total
scores used to compare the reactions of the subjects to each lecture
format. The unstarred features specify what kinds of additional infor-
mation about particular lecture formats were collected.
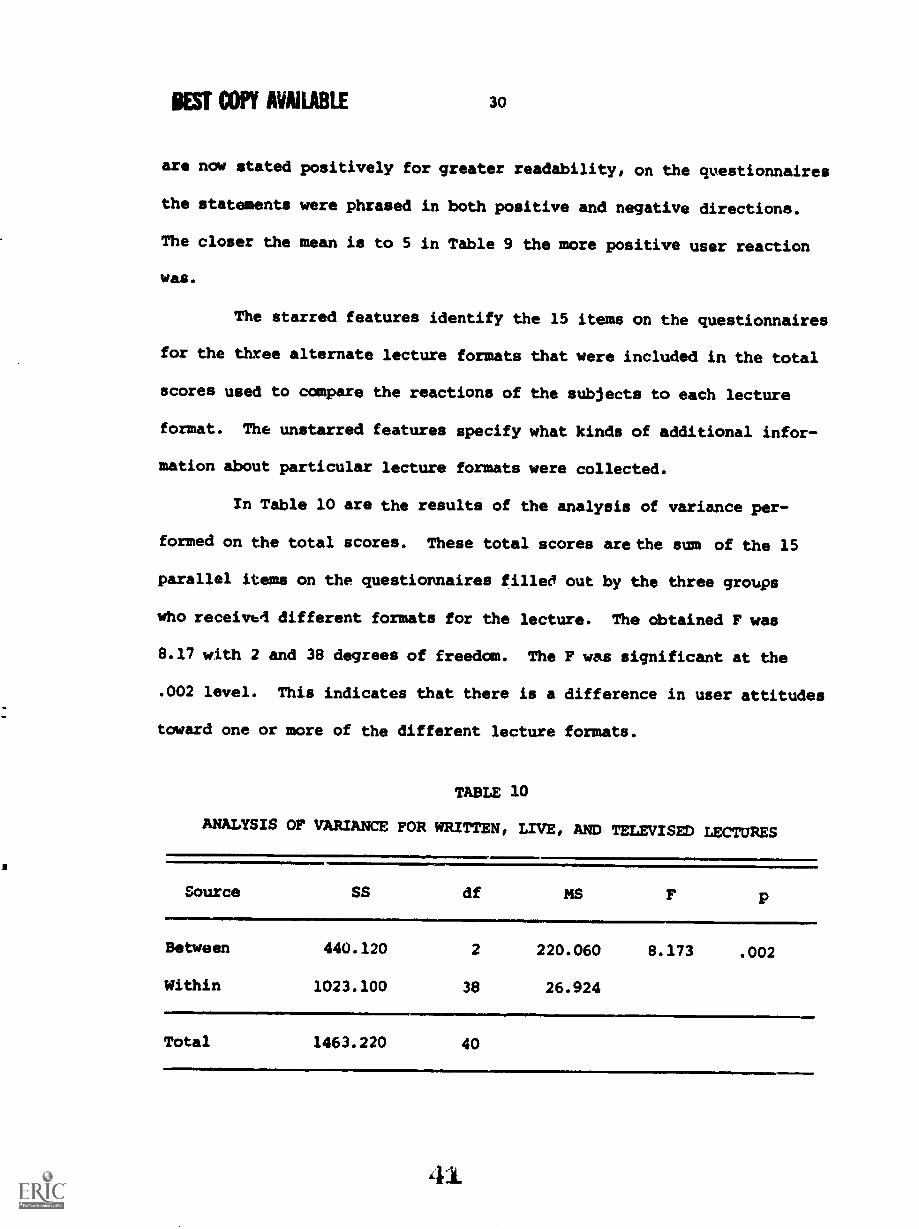
In Table 10 are the results of the analysis of variance per-
formed on the total scores. These total scores are the sum of the 15
parallel items on the questionnaires filled out by the three groups
who received different formats for the lecture. The obtained F was
8.17 with 2 and 38 degrees of freedom. The F was significant at the
.002 level. This indicates that there is a difference in user attitudes
toward one or more of the different lecture formats.
TABLE 10
ANALYSIS OF VARIANCE FOR WRITTEN, LIVE, AND TELEVISED LECTURES
Source SS
,:61.0
df MS F p
Between
Within
440.120
1023.100
2
38
220.060
26.924
11011MPI
8.173 .002
Total 1463.220 40
41

31
The obtained mean for the live lecture format was 68.80 (n=5);
for the televised lecture format, 61.13 (n30); for the written lecture
format, 56.17 (n=6). Pairwise comparisons of these means were made using
the Scheffe tests for a posteriori comparisons. The Scheffe tests
revealed that the written and live lecture means were significantly
different at the .01 level, and the live lecture and the televised
lecture means were significantly different at the .01 level. The tele-
vised lecture and the written lecture means were not significantly
different, although the probability level was just greater than .1.
Since only one of the features evaluated (see Table 9) received
a rating of less than 3 on a five-point scale, the subjects on the
average viewed positively most of the features of the lecture leamiag
activity, regardless of format. Simple t tests were run on the item means
for the individual features to find out which differences among the
groups were significant. Since running this large a number of tests
compounds the type I error, this part of the analysis was clearly
exploratory in nature, useful in the sense of providing directions for
product improvement and further research. These tests revealed that
those participating in alternate formats of the lecture differed
significantly in their attitude toward the following features.
There was a significant difference at the .05 level between the
television vs. live lecture and the live lecture vs. written lecture
groups in their satisfaction with the learning conditions, feature 1 in
Table 9. Those reading the lecture or watching the televised lecture
were less satisfied those hearing the live lecture. It might be
33
logically interpreted, one caution about interpreting the data needs to
be made before preceding: It is highly likely that the subjects rated
the television presenter in relation to other television hosts and the
classroom presenter in relation to other classroom teachers.
Consequently, unless television hosts and classroom teachers are equally
effective in presenting material and selling themselves, the results,
based on different standards of excellence, may not be comparable. For
this reason, it can only be stated with caution that the subjects seemed
to prefer the live to the televised presenter. The live lecture group
differed significantly from the television lecture group on features 9
and 10 at the .05 level and on feature 11 at the .10 level.
The subjects rating the television lecture felt the television
presenter's voice was more monotonous, his enunciation less clear, and
his enthusiasm less genuine than the subjects rating the live presenter.
Since the same person was the live and the televised instructor, these
differences in perception may mean that the instructor, a university
professor, either felt more comfortable in the role of an on-site
instructor or the subjects, university students, felt more comfortable
with the live lecturer. It may be that for a person who is not a pro-
fessional actor "just talking" rather than reading a teleprompter is an
easier thing to do naturally.
The significant difference between the live and the written
lecture groups at the .01 level for presentation feature 8 can best
be described in relation to the significant difference at the .01 level
32
that environmental imperfections, such as stray noises tx uncomfortable
seating, tended to be more distracting when the activity demanded more
concentration on the part of the subject or when the activity failed to
engage the attention of the subject.
There were five different presentation features toward which one
or more of the lecture groups differed significantly in their attitude.
The television vs. written and the live vs. written lecture groups
differed significantly at the .05 level in their attitude toward the
quality o2 the art displays, feature 6 in Table 9. The subjects felt
both the live and the televised lectures displayed material in an easier
to understand manner. Probably the written lecture group found the
xeroxed supplementary tables less helpful than either the professionally
designed art exhibits displayed on television or the material displayed
(Al the overhead projector and explained by the live instructor.
The television vs. live lecture and the live vs. written lecture
groups differed significantly in their attitudes about the quality of
the presenter's delivery, features 9, 10 and 11 in Table 9. It is
questionable whether features 9 and 10 for the written lecture group
really make sense or are comparable with the parallel items for the live
lecture. It is difficult to see how a xeroxed lecture can convey
enthusiasm in the same way a speaker can or how wilting clearly can be
equated with speaking clearly, the latter feature having more to do with
enunciation than clarity.
While the differences between the television and live lecture
gry their attitudes toward the person presenting the materials can be
34
between these two groups for content features 13, 14 and 15. Those
reading the lecture were significantly less satisfied with the
organization, (feature 13), concreteness, (feature 14), and
amplification of each point (feature 16), than these hearing the live
lecture. For these reasons, they may have felt the presentation was
less simple to understand (feature 8).
In addition, the television lecture group also differed
significantly from the live lecture group on feature 16, having to do
with sufficiency of amplification. It is easy to understand how the
live lecturer may have the advantage over any fixed presentation, either
televised or written, ii. amplification, since he can expand any point
that he perceives the class does not understand. What is more diffl-
cult to understand is why the live lecture and not the televised
lecture significantly differed from the written lecture in adequacy of
content organization and exemplification, since the televised lecture
showed actual demonstrations of the materials being used in real class-
rooms.
The television vs. live and the live vs. written lecture groups
differed significantly at the .05 level in their opinions of the
attention-holding value of the lecture activity. For whatever reason,
the live lecturer was better able to hold student attention than the
written text or the television program. Explanations for this can be
hypothesized from previous reactions of the subjects on the
questionnaires: they perceived the live presentation as more natural
35
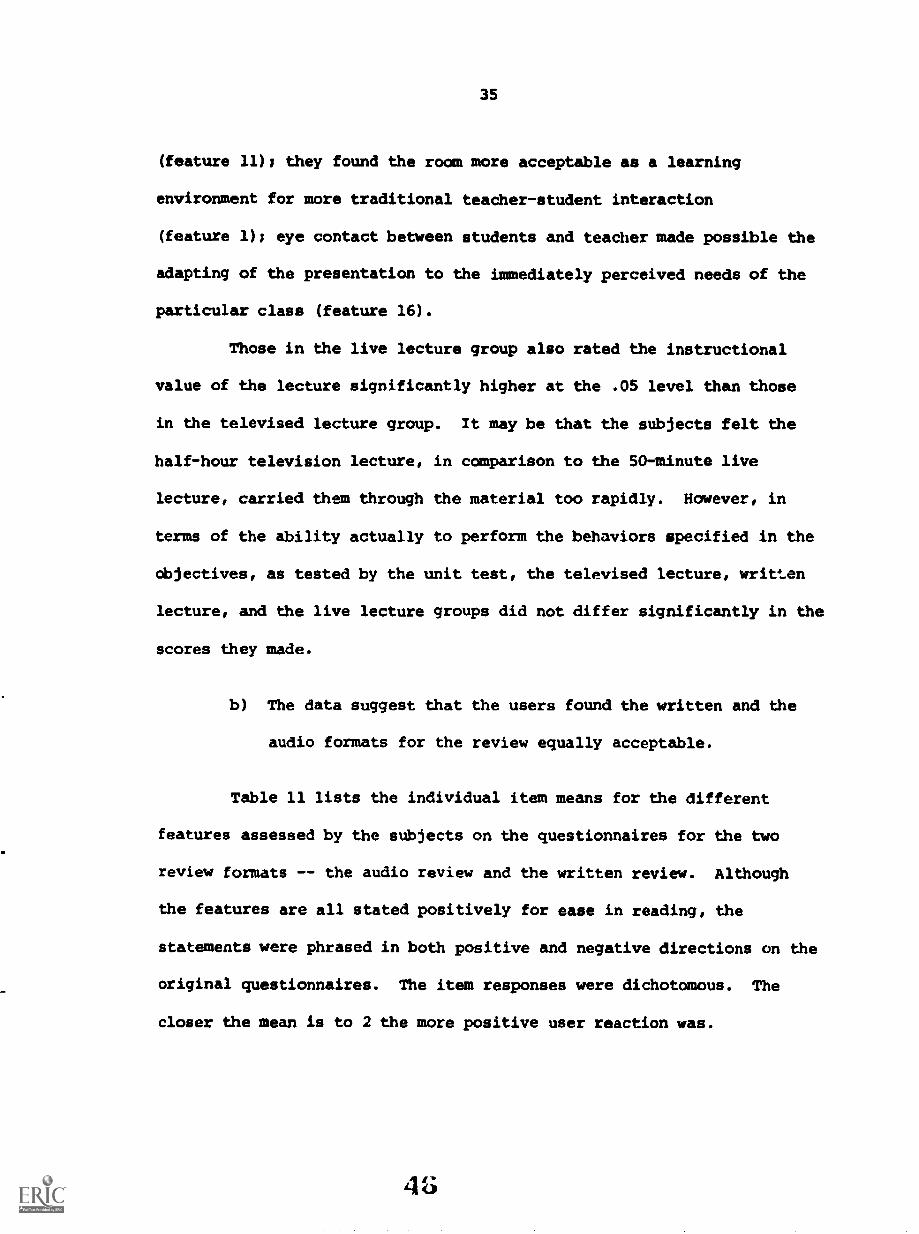
(feature 11): they found the room more acceptable as a learning
environment for more traditional teacher-student interaction
(feature 1); eye contact between students and teacher made possible the
adapting of the presentation to the immediately perceived needs of the
particular class (feature 16).
Those in the live lecture group also rated the instructional
value of the lecture significantly higher at the .05 level than those
in the televised lecture group. It may be that the subjects felt the
half-hour television lecture, in comparison to the 50-minute live
lecture, carried them through the material too rapidly. However, in
terms of the ability actually to perform the behaviors specified in the
objectives, as tested by the unit test, the televised lecture, written
lecture, and the live lecture groups did not differ significantly in the
scores they made.
b) The data suggest that the users found the written and the
audio formats for the review equally acceptable.
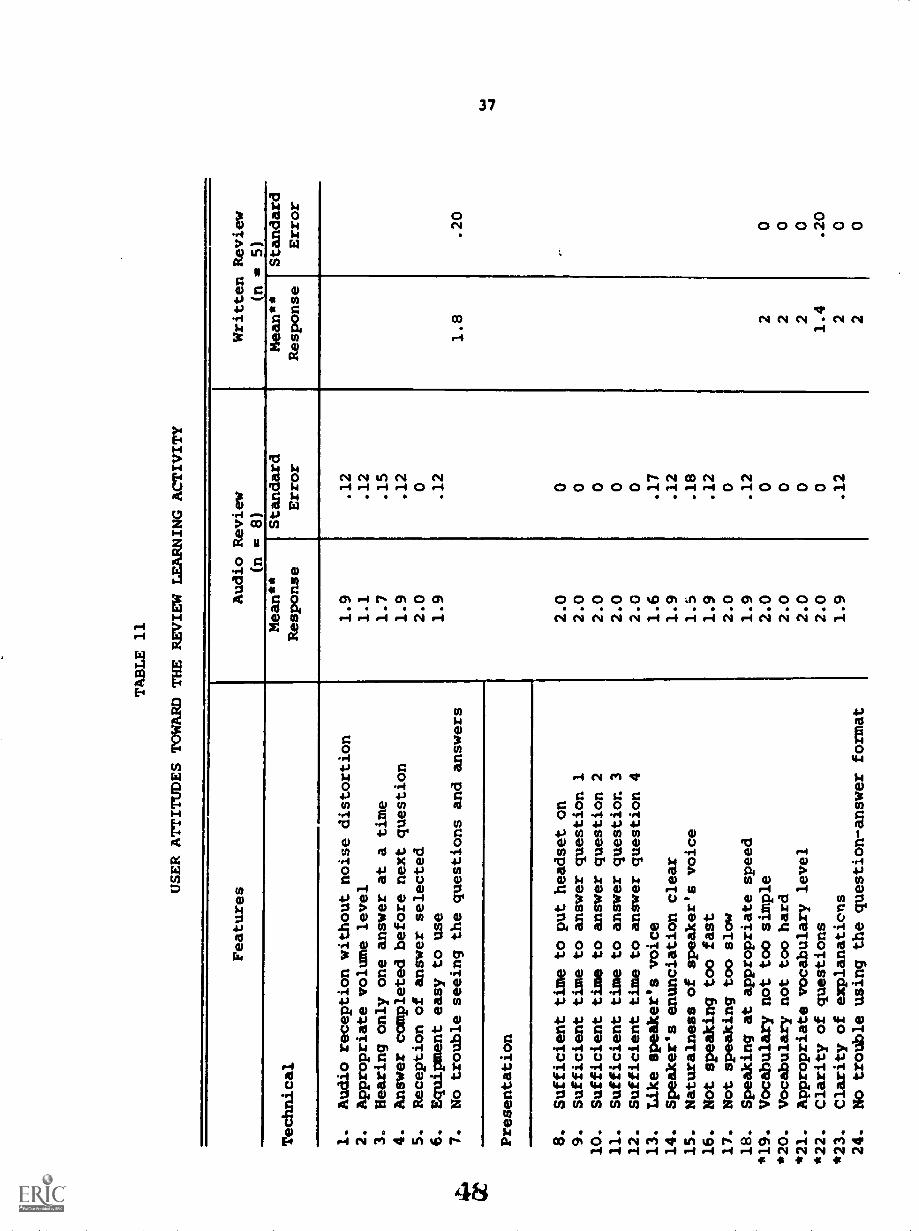
Table 11 lists the individual item means for the different
features assessed by the subjects on the questionnaires for the two
review formats -- the audio review and the written review. Although
the features are all stated positively for ease in reading, the
statements were phrased in both positive and negative directions on the
original questionnaires. The item responses were dichotomous. The
closer the mean is to 2 the more positive user reaction was.
36
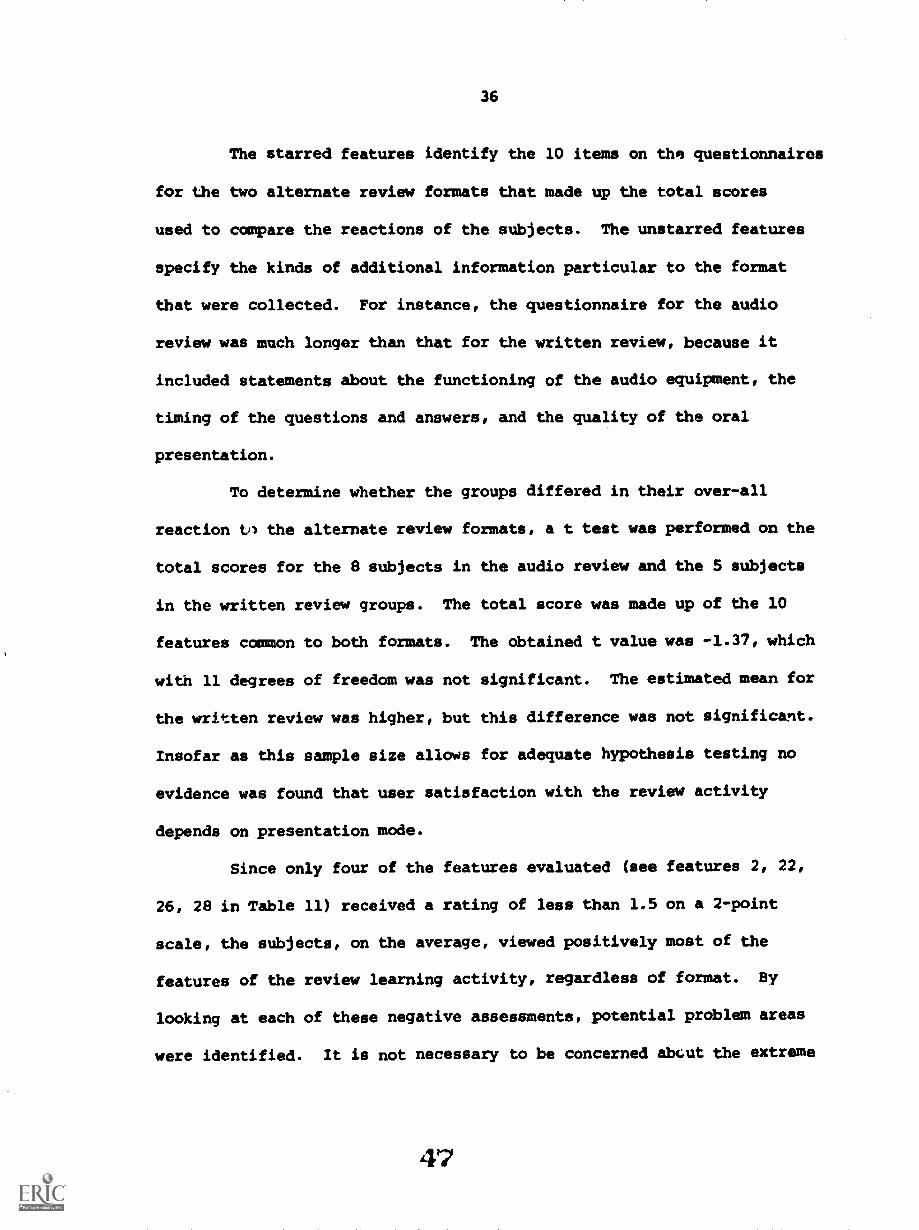
The starred features identify the 10 items on the questionnaires
for the two alternate review formats that made up the total scores
used to compare the reactions of the subjects. The unstarred features
specify the kinds of additional information particular to the format
that were collected. For instance, the questionnaire for the audio
review was much longer than that for the written review, because it
included statements about the functioning of the audio equipment, the
timing of the questions and answers, and the quality of the oral
presentation.
To determine whether the groups differed in their over-all
reaction the alternate review formats, a t test was performed on the
total scores for the 8 subjects in the audio review and the 5 subjects
in the written review groups. The total score was made up of the 10
features common to both formats. The obtained t value was -1.37, which
with 11 degrees of freedom was not significant. The estimated mean for
the written review was higher, but this difference was not significant.
Insofar as this sample size allows for adequate hypothesis testing no
evidence was found that user satisfaction with the review activity
depends on presentation mode.
Since only four of the features evaluated (see features 2, 22,
26, 28 in Table 11) received a rating of less than 1.5 on a 2-point
scale, the subjects, on the average, viewed positively most of the
features of the review learning activity, regardless of format. By
looking at each of these negative assessments, potential problem areas
were identified. It is not necessary to be concerned abut the extreme
44
TABLE 11
USER ATTITUDES TOWARD THE REVIEW LEARNING ACTIVITY
Features
Audio Review
(n = 8)
Written Review
(n = 5)
Technical
Mean**
Response
Standard
Error
Mean**
Response
Standard
Error
1.
Audio reception without noise distortion
2.
Appropriate volume level
3.
Hearing only one answer at a time
4.
Answer completed before next question
5.
Reception of answer selected
6.
Equipment easy to use
7.
No trouble seeing the questions and answers
1.9
1.1
1.7
1.9
2.0
1.9
.12
.12
.15
.12
0
.12
1.8
.20
Presentation
8.
Sufficient time to put headset on
2.0
09.
Sufficient time to answer question 1
2.0
010.
Sufficient time to answer question 2
2.0
011.
Sufficient time to answer question 3
2.0
012.
Sufficient time to answer question 4
2.0
013.
Like speaker's voice
1.6
.17
14.
Speaker's enunciation clear
1.9
.12
15.
Naturalness of speaker's voice
1.5
.18
16.
Not speaking too fast
1.9
.12
17.
Not speaking too slow
2.0
0
18.
Speaking at appropriate speed
1.9
.12
*19.
Vocabulary not too simple
2.0
02
0
*20.
Vocabulary not too hard
2.0
02
0
*21.
Appropriate vocabulary level
2.0
02
0
*22.
Clarity of questions
2.0
01.4
.20
*23.
Clarity of explanations
1.9
.12
20
24.
No trouble using the question-answer format
20
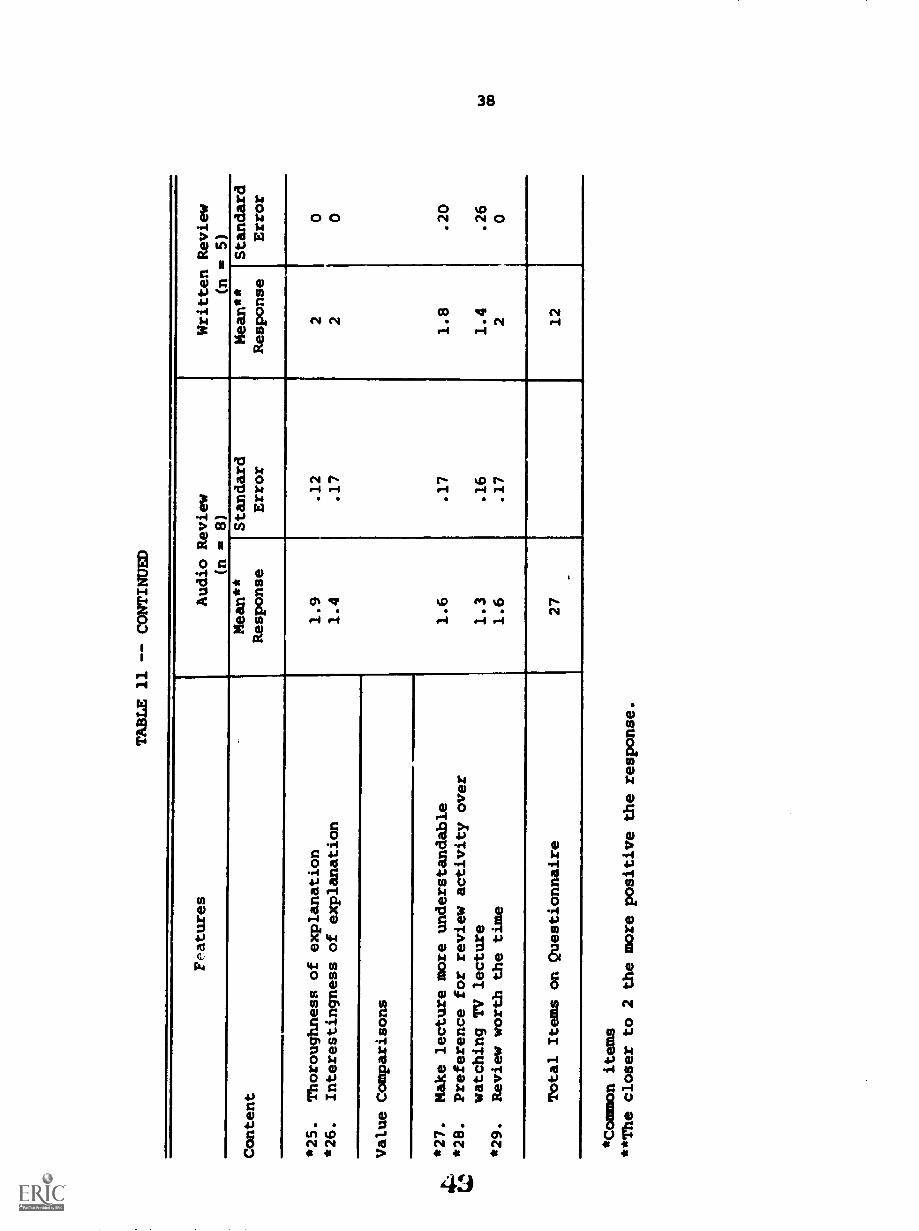
TABLE 11 -- CONTINUED
Features
Audio Review
(n = 8)
Written Review
(n = 5)
Content
Mean**
Response
Standard
Error
Mean**
Response
Standard
Error
*25.
Thoroughness of explanation
1.9
.12
20
*26.
Interestingness of explanation
1.4
.17
20
Value Comparisons
*27.
Make lecture more understandable
1.6
.17
1.8
.20
*28.
Preference for review activity over
watching TV lecture
1.3
.16
1.4
.26
*29.
Review worth the time
1.6
.17
20
Total Items on Questionnaire
27
_
12
*Common items
**The closer to 2 the more positive theresponse.
39
dissatisfaction the subjects hearing the review felt about the volume
level (feature 2 in Table 11). The actual four-channel equipment to be
used during the summer of 1974 has individual volume controls. However,
it is important to keep in mind that, if the subjects were extremely
annoyed by a technical imperfection that interferred with their
reception of the information, they could rate other features of the
activity lower than they otherwise would.
Simple t tests were run on individual feature means for the two
review formats in order to find out which means were far enough apart
to be significantly different. Feature 22 was significantly different
at the .05 level. While the audio review group unanimously felt the
questions were clear, the written review group using the printed
question format was significantly more dissatisfied with the clarity
of the questions (feature 22). The data do not indicate whether this
reaction to the questions stemmed from their phrasing, their length,
the difficulty of the questions, or some other factor. However, it
might be suggested that intonation made the meaning clearer or that
those reading the review were simply able to more closely scrutinize
the questions and detect ambiguities.
The written review and audio review groups also differed
significantly at the .05 level in their reactions to feature 26 in
Table 11. Those experiencing the audio mode of review found the
explanations significantly less interesting than those taking part in
the written mode of review. One explanation for this could be that
those who had access to all the explanations for all the alternatives
50
40
appreciated more the way explanations were shaped to fit the response
selected.
Both review groups felt the review was probably worth the time
it took (feature 29). However, they both said they enjoyed more
watching the televised lecture than responding to the review questions.
This could indicate a preference on the subject's part for one modality
over another or passive rather than active participation. It could
also indicate a preference for instruction over what could be perceived
as testing.
c) The data indicate that the users were, on the average,
satisfied with the laboratory activities.
As Table 12 indicates, all features of the laboratory act-
ivities received positive ratings. The users rated lowest the
adequacy with which each point was amplified (feature 12). The lab
problem involved transcribing and interpreting 25 reading errors. Since
this process was only completed for part of these errors, it may be that
the participants in the summer courses, who go through the process for
all 25 errors, receive sufficient amplification because of increased
replications of the steps in the process. On the other hand, the steps
in the process may need to be more explained and interrelated and the
value of the exercise for classroom use made more explicit.
The users rated equally low the ability of the laboratory
activities to hold their attention (feature 20). It could be that having
the subjects begin the experiment after a regular school day was too tiring.
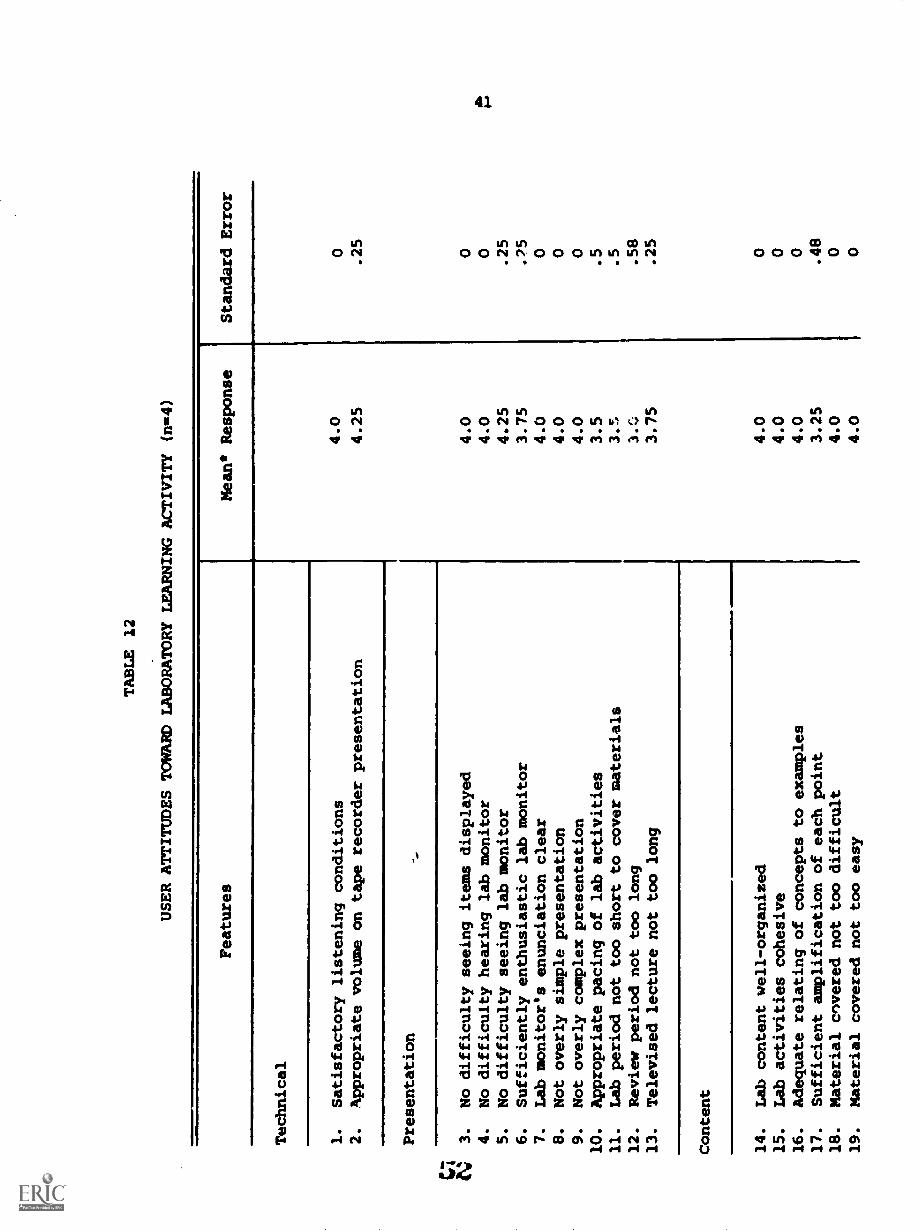
TABLE 12
USER ATTITUDES TOWARD LABORATORY LEARNING ACTIVITY (n=4)
Features
Technical
1.
Satisfactory listening conditions
2.
Appropriate volume on tape recorder presentation
Presentation
CI N 3.
No difficulty seeing items displayed
4.
No difficulty hearing lab monitor
5.
No difficulty seeing lab monitor
6.
Sufficiently enthusiastic lab monitor
7.
Lab monitor's enunciation clear
8.
Not overly simple presentation
9.
Not overly complex presentation
10.
Appropriate pacing of lab activities
11.
Lab period not too short to cover materials
12.
Review period not too long
13.
Televised lecture not too long
Content
14.
Lab content well-organized
15.
Lab activities cohesive
16.
Adequate relating of concepts to examples
17.
Sufficient amplification of each point
18.
Material crwered not too difficult
19.
Material covered not too easy
Meant Response
Standard Error
4.0
04.25
.25
4.0
04.0
04.25
.25
3.75
.75
4.0
04.0
04.0
0
3.5
.5
3.5
.5
3.0
.58
3.75
.25
4.0
04.0
04.0
0
3.25
.48
4.0
0
4.0
0
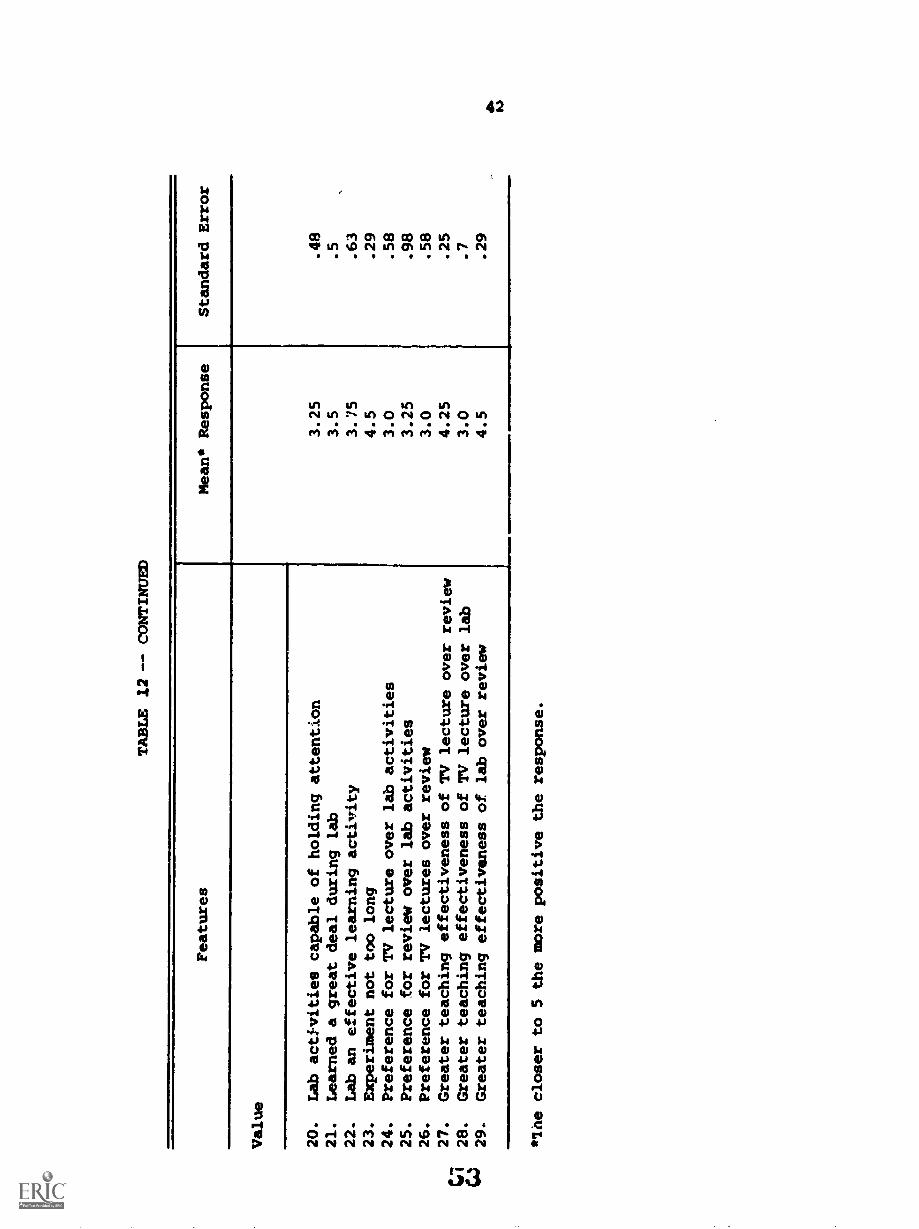
TABLE 12 -- CONTINUED
Features
Mean* Response
Standard Error
Value
20.
Lab activities capable of holding attention
3.25
.48
21.
Learned a great deal during lab
3.5
.5
22.
Lab an effective learning activity
3.75
.63
23.
Experiment not too long
4.5
.29
24.
Preference for TV lecture over lab activities
3.0
.58
25.
Preference for review over lab activities
3.25
.98
26.
Preference for TV lectures over review
3.0
.58
27.
Greater teaching effectiveness of TV lecture
over review
4.25
.25
ohli
28.
Greater teaching effectiveness of TV lecture over lab
3.0
.7
'6"
29.
Greater teaching effectiveness of lab over review
4.5
.29
*The closer to 5 the more positive the
response.
43
Since the summer course schedule begins at 8:30 A.M. and concludes at
3:30 P.M., unlike the experiment that began at 3:30 P.M. and concluded
at 7:00 P.M., the participants should not be as tired when they start.
Howevar, since the laboratory period will be longer, there may still be a
need to vary the activities in the lab more or revise them in some way
to make them more interesting.
d) The data suggest the subjects in group 7 like doing all the
learning activities equally well. However, they thought
they learned more during acme of the activities.
The four subjects who participated in the laboratory activity
were the only subjects who received the learning sequence actually
followed in the AESP summer courses -- that is, televised lecture,
audio review, and laboratory activities. For this reason, they were
asked to compare the instructional value of all the learning activities
as well as assess the laboratory activities (features 11-13 and 24-29
in Table 12). Since there were only four subjects in this group it
would be unwise to place much emphasis in the generalizability of their
reactions. All that their responses really tell is how these four
subjects felt about the comparative worth of the different instructional
activities.
The type of responses made to features 24-26 in Table 12
indicate that these subjects enjoyed almost equally well the learning
activities of watching the televised lecture, responding to the review
questions, and practicing the skills during the laboratory seseion.
However, their responses to features 27-29 indicate that they felt they
BEST COP! MINABLE44
had learned more from both the TV lecture and the laboratory practice
activities than the review questions.
5) Which type of production techniques in the televised lecture
best held the interests of the subjects?
Table 13 describes the average reactions of those who responded
at 15 points in the televised lecture to the statement "1 liked this
portion" of the videotape. Since all the means are 3 or higher on a
five-point scale, the responses are, on the average, positive. However,
interest of varying intensities is sustained throughout the program,
with interest highest during the filmed segment depicting Wayne
retelling the story (observation 8 in Table 13) and lowest during tha
close-up shots of the instructor when discussing the assumptions under-
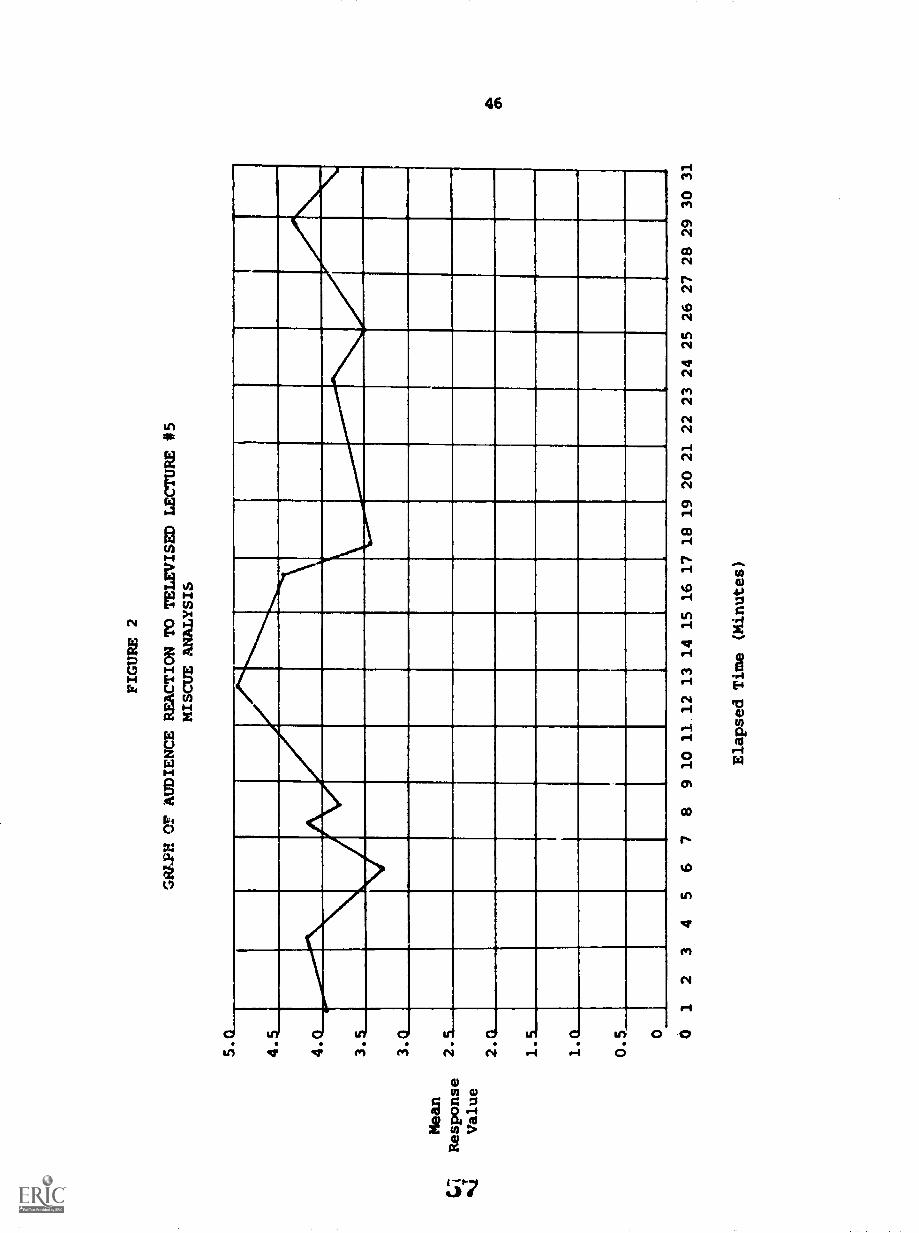
lying the Reading Miscue Inventory (observation 4). Figure 2 graph-
ically depicts the mean response for each of the 15 points rated during
the 31-minute program.
It is necessary when looking at the mean responses in Table 13
to realize that a difference between means of nearly .7 is necessary
at the .10 level and over .8 at the .05 level for the difference to be
significant. There are, then, only 3 comparisons between adjacent
means that are significant at the .05 level: the comparison between
observations 4 and 5, 9 and 10, and 13 and 14. The significant difference
in interest between observations 4 and 5 parallel the movemeit of the
program from a discussion by the lecturer on the abstract assumptions
underlying the RMI to an explanation of the uses of the RMI, punctuated
by film showing the RMI in use in a classroom. This supports the idea
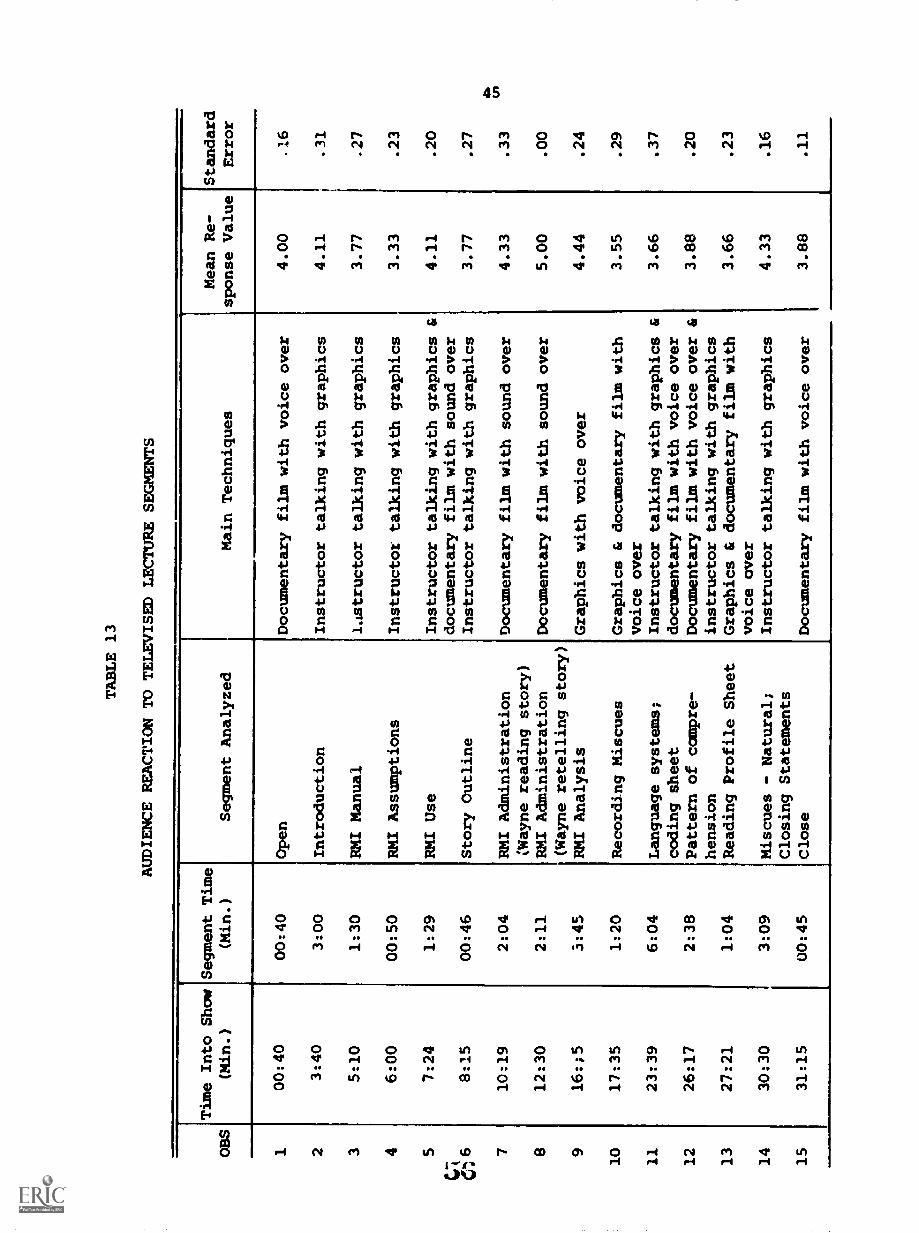
TABLE 13
AUDIENCE REACTION TO TELEVISED LECTURE SEGMENTS
OBS
Time Into Show
(Min.)
Segment Time
(Min.)
Segment Analyzed
Main Techniques
Mean Re-
sponse Value
Standard
Error
100:40
00:40
Open
Documentary film with voice over
4.00
.16
23:40
3:00
Introduction
Instructor talking with graphics
4.11
.31
35:10
1:30
RMI Manual
1.1structor talking with graphics
3.77
.27
46:00
00:50
RMI Assumptions
Instructor talking with graphics
3.33
.23
57:24
1:29
RMI Use
Instructor talking with graphics &
4.11
.20
1 .6
48:15
00:46
Story Outline
documentary film with sound over
Instructor talking with graphics
3.77
.27
710:19
2:04
RMI Administration
Documentary film with sound over
4.33
.33
(Wayne reading story)
812:30
2:11
RMI Administration
Documentary film with sound over
5.00
.00
(Wayne retelling story)
916:;5
3:45
RMI Analysis
Graphics with voice over
4.44
.24
10
17:35
1:20
Recording Miscues
Graphics & documentary film with
voice over
3.55
.29
11
23:39
6:04
Language systems;
coding sheet
Instructor talking with graphics &
documentary film with voice over
3.66
.37
12
26:17
2:38
Pattern of compre-
pension
Documentary film with voice over &
instructor talking with graphics
3.88
.20
13
27:21
1:04
Reading Profile Sheet
Graphics & documentary film with
voice over
3.66
.23
14
30:30
3:09
Miscues - Natural;
Instructor talking with graphics
4.33
.16
Closing Statements
15
31:15
00:45
Close
Documentary film with voice over
3.88
.11
5.0
4.5
FIGURE 2
GRLPH OF AUDIENCE REACTION TO TELEVISED LECTURE #5
MISCUE ANALYSIS
4.0
3.5
3.0
Mean
Clifi
Response
2-c
144
Value
0.5 0 0
12
34
56
78
9 10 11 12 13 14 15 16 17 18 19 20 21 22 23 24 25 26 27 28 29 30 31
Elapsed Time (Minutes)
47
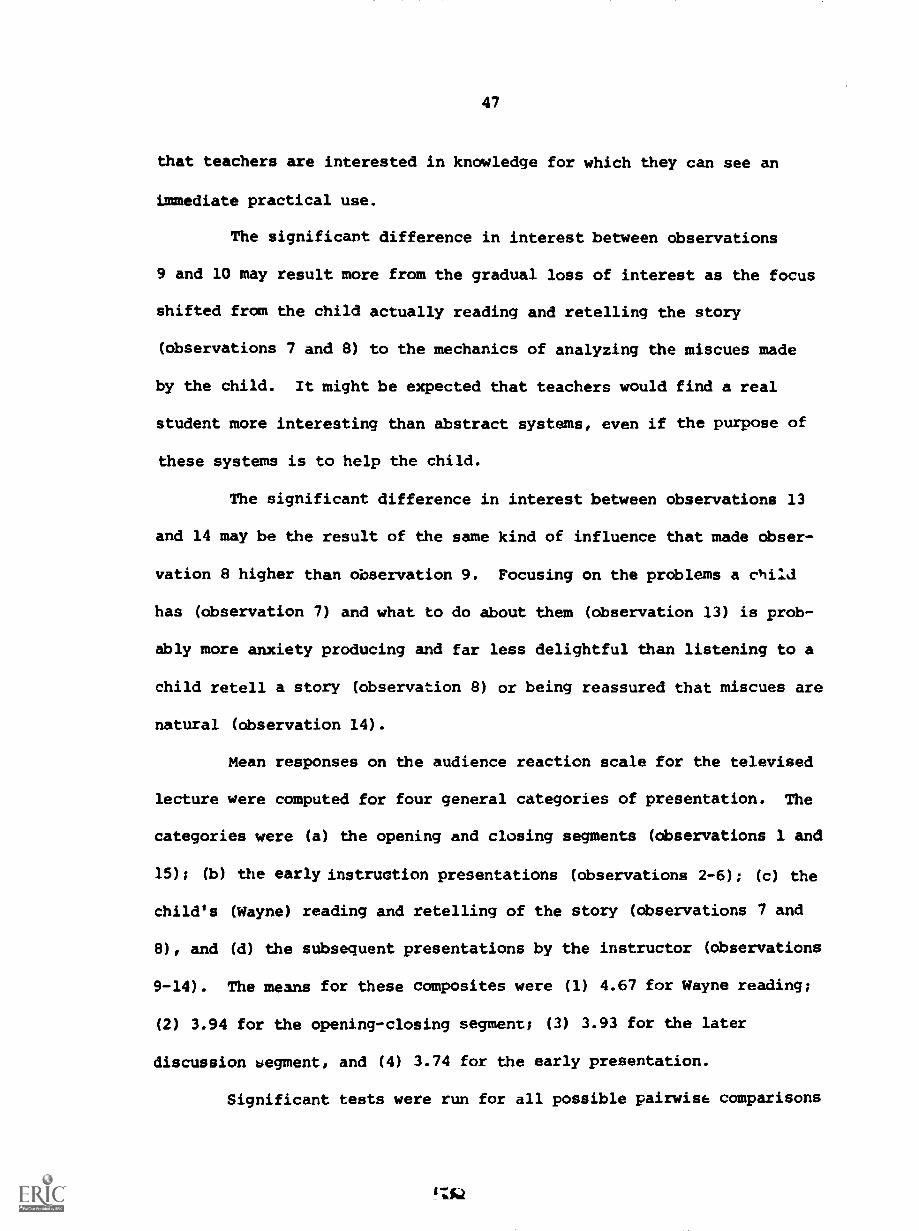
that teachers are interested in knowledge for which they can see an
immediate practical use.
The significant difference in interest between observations
9 and 10 may result more from the gradual loss of interest as the focus
shifted from the child actually reading and retelling the story
(observations 7 and 8) to the mechanics of analyzing the miscues made
by the child. It might be expected that teachers would find a real
student more interesting than abstract systems, even if the purpose of
these systems is to help the child.
The significant difference in interest between observations 13
and 14 may be the result of the same kind of influence that made obser-
vation 8 higher than observation 9. Focusing on the problems a child
has (observation 7) and what to do about them (observation 13) is prob-
ably more anxiety producing and far less delightful than listening to a
child retell a story (observation 8) or being reassured that miscues are
natural (observation 14).
Mean responses on the audience reaction scale for the televised
lecture were computed for four general categories of presentation. The
categories were (a) the opening and closing segments (observations 1 and
15); (b) the early instruction presentations (observations 2-6); (c) the
child's (Wayne) reading and retelling of the story (observations 7 and
8), and (d) the subsequent presentations by the instructor (observations
9-14). The means for these composites were (1) 4.67 for Wayne reading;
(2) 3.94 for the opening-closing segment; (3) 3.93 for the later
discussion tiegment, and (4) 3.74 for the early presentation.
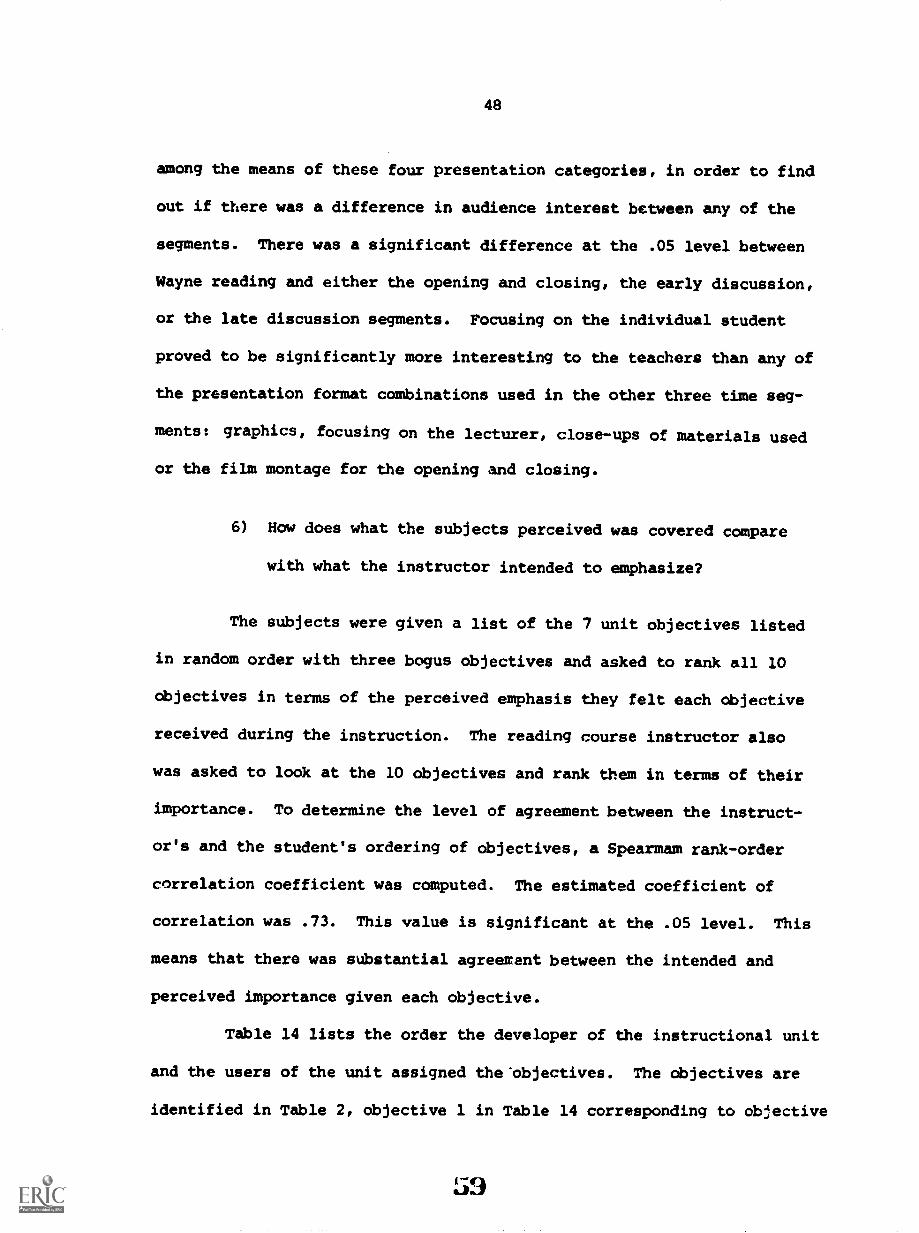
Significant tests were run for all possible pairwise comparisons
48
among the means of these four presentation categories, in order to find
out if there was a difference in audience interest between any of the
segments. There was a significant difference at the .05 level between
Wayne reading and either the opening and closing, the early discussion,
or the late discussion segments. Focusing on the individual student
proved to be significantly more interesting to the teachers than any of
the presentation format combinations used in the other three time seg-
ments: graphics, focusing on the lecturer, close-ups of materials used
or the film montage for the opening and closing.
6) How does what the subjects perceived was covered compare
with what the instructor intended to emphasize?
The subjects were given a list of the 7 unit objectives listed
in random order with three bogus objectives and asked to rank all 10
objectives in terms of the perceived emphasis they felt each objective
received during the instruction. The reading course instructor also
was asked to look at the 10 objectives and rank them in terms of their
importance. To determine the level of agreement between the instruct-
or's and the student's ordering of objectives, a Spearmam rank-order
correlation coefficient was computed. The estimated coefficient of
correlation was .73. This value is significant at the .05 level. This
means that there was substantial agreement between the intended and
perceived importance given each objective.
Table 14 lists the order the developer of the instructional unit
and the users of the unit assigned the-objectives. The objectives are
identified in Table 2, objective 1 in Table 14 corresponding to objective
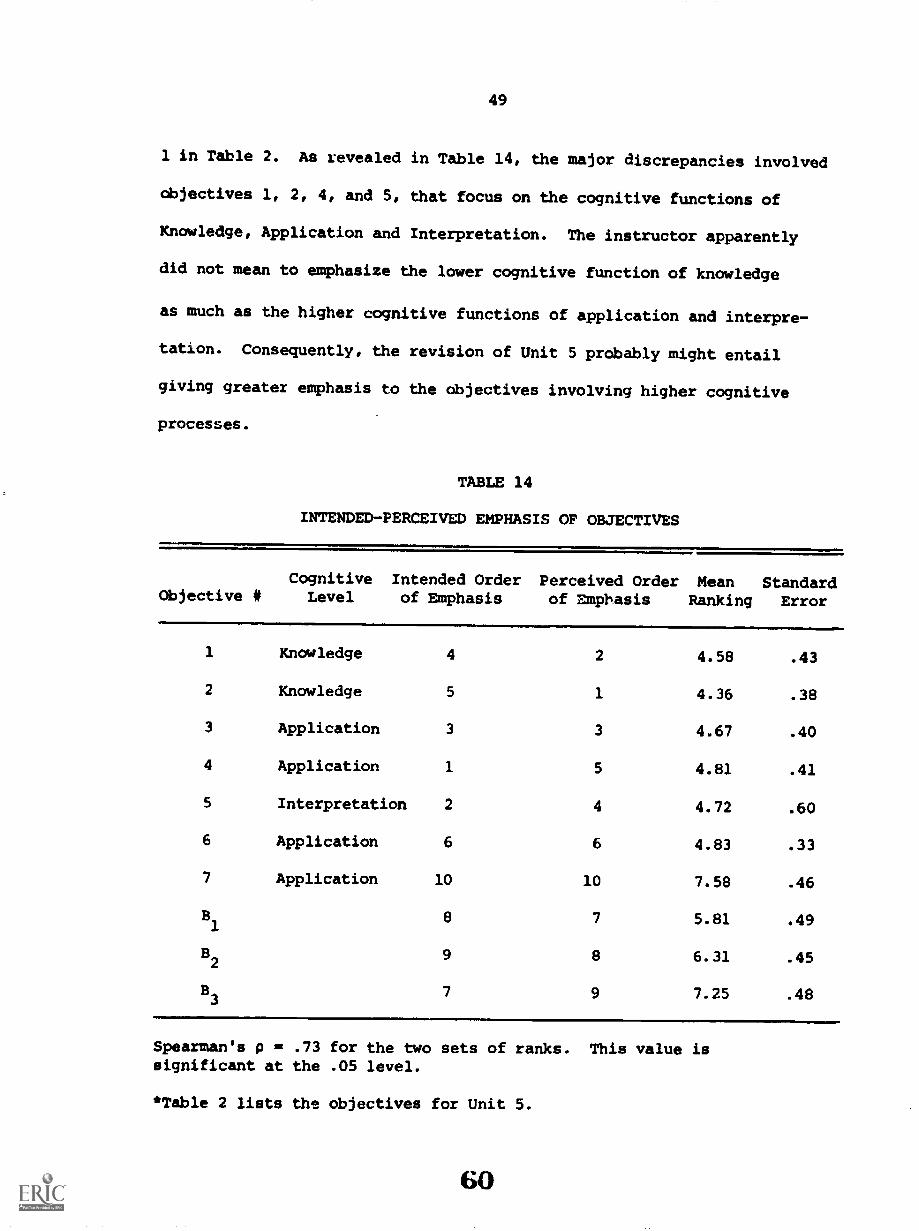
49
1 in Table 2. As revealed in Table 14, the major discrepancies involved
objectives 1, 2, 4, and 5, that focus on the cognitive functions of
Knowledge, Application and Interpretation. The instructor apparently
did not mean to emphasize the lower cognitive function of knowledge
as much as the higher cognitive functions of application and interpre-
tation. Consequently, the revision of Unit 5 probably might entail
giving greater emphasis to the objectives involving higher cognitive
processes.
TABLE 14
INTENDED-PERCEIVED EMPHASIS OF OBJECTIVES
Objective *Cognitive Intended Order
Level of EmphasisPerceived Order Mean Standardof Emphasis Ranking Error
1 Knowledge 4 2 4.58 .43
2 Knowledge 5 1 4.36 .38
3 Application 3 3 4.67 .40
4 Application 1 5 4.81 .41
5 Interpretation 2 4 4.72 .60
6 Application 6 6 4.83 .33
7 Application 10 10 7.58 .46
B1
8 7 5.81 .49
B2 9 8 6.31 .45
B3 7 9 7.25 .48
Spearman's p .1 .73 for the two sets of ranks. This value issignificant at the .05 level.
*Table 2 lists the objectives for Unit 5.
60
50
7) Is there a need to make any alterations in the evaluation
procedures or instruments?
The 7-group formative evaluation design provided an opportunity
to try out the instructional and evaluative materials, procedures and
equipment for the DPRI reading course. The following observations made
as a result of this study had considerable value to those developing the
evaluative products.
a) The time allotted for administration of the evaluation
instruments was too long.
Table 15 lists the average time it took the groups to complete
each instrument and the amount of time scheduled for the administration
of each instrument. With the empirical knowledge gained from going
through the evaluative and instructional activities for one unit, the
RCC Evaluation Component was able to estimate more realistic time
allotments for the administration of evaluation instruments for summer
courses.
b) Item analyses performed on the multiple-choice items on the
unit test and the audio review identified non-functioning
distractors and non-discriminating items.
Table 16 shows the number of subjects in the audio and written
review groups who chose each alternative for the four audio review
questions. The percentage of the subjects choosing the correct response
61
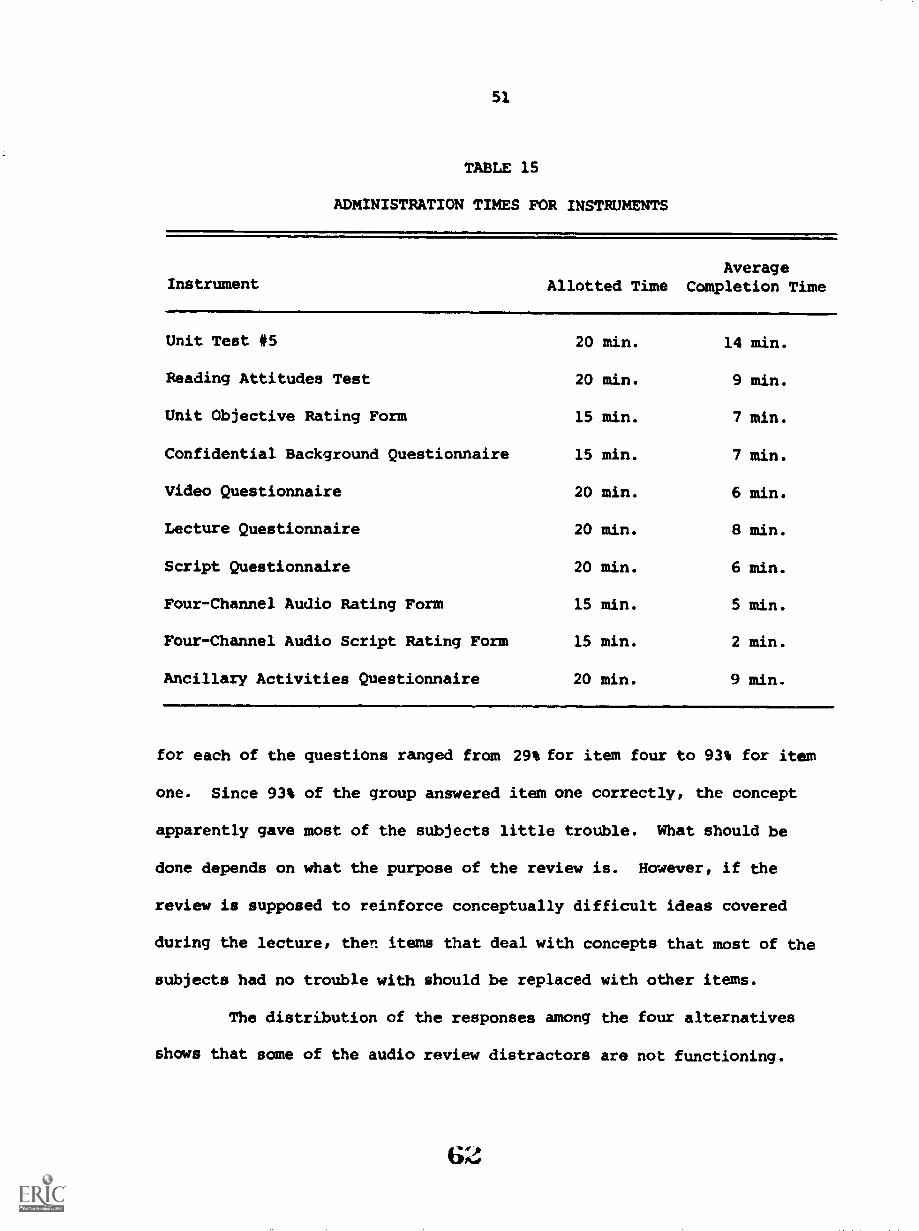
51
TABLE 15
ADMINISTRATION TIMES FOR INSTRUMENTS
AverageInstrument Allotted Time Completion Time
Unit Test #5
Reading Attitudes Test
Unit Objective Rating Form
Confidential Background Questionnaire
Video Questionnaire
Lecture Questionnaire
Script Questionnaire
Four-Channel Audio Rating Form
Four-Channel Audio Script Rating Form
Ancillary Activities Questionnaire
20 min.
20 min.
15 min.
15 min.
20 min.
20 min.
20 min.
15 min.
15 min.
20 min.
14 min.
9 min.
7 min.
7 min.
6 min.
8 min.
6 min.
5 min.
2 min.
9 min.
for each of the questions ranged from 29% for item four to 93% for item
one. Since 93% of the group answered item one correctly, the concept
apparently gave most of the subjects little trouble. What should be
done depends on what the purpose of the review is. However, if the
review is supposed to reinforce conceptually difficult ideas covered
during the lecture, then items that deal with concepts that most of the
subjects had no trouble with should be replaced with other items.
The distribution of the responses among the four alternatives
shows that some of the audio review distractors are not functioning.
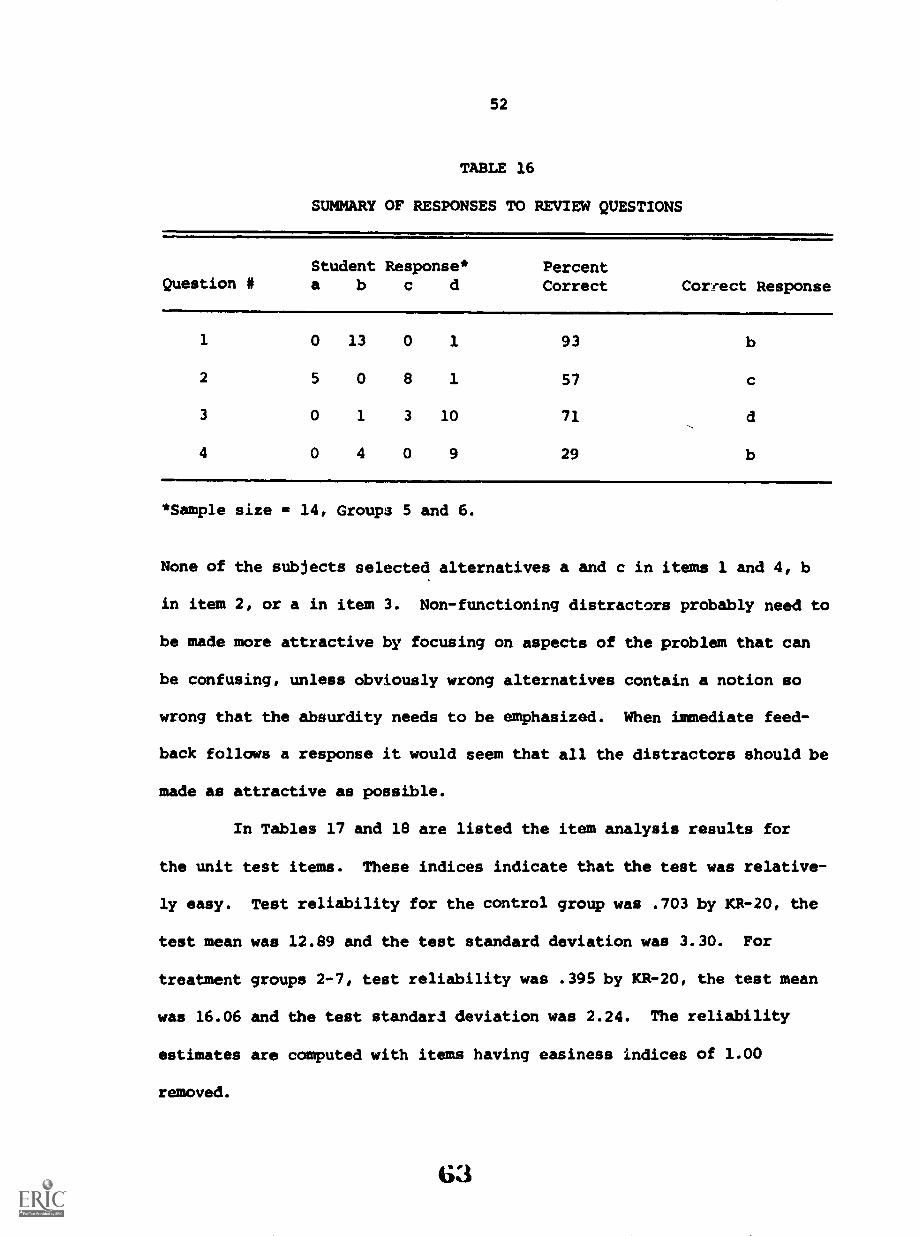
52
TABLE 16
SUMMARY OF RESPONSES TO REVIEW QUESTIONS
Question *Student Response*a b c d
PercentCorrect Correct Response
1 0 13 0 1 93 b
2 5 0 8 1 57 c
3 0 1 3 10 71 d
4 0 4 0 9 29 b
*Sample size s 14, Groups 5 and 6.
None of the subjects selected alternatives a and c in items 1 and 4, b
in item 2, or a in item 3. Non-functioning distractors probably need to
be made more attractive by focusing on aspects of the problem that can
be confusing, unless obviously wrong alternatives contain a notion so
wrong that the absurdity needs to be emphasized. When immediate feed-
back follows a response it would seem that all the distractors should be
made as attractive as possible.
In Tables 17 and 18 are listed the item analysis results for
the unit test items. These indices indicate that the test was relative-
ly easy. Test reliability for the control group was .703 by KR-20, the
test mean was 12.89 and the test standard deviation was 3.30. For
treatment groups 2-7, test reliability was .395 by KR-20, the test mean
was 16.06 and the test standard deviation was 2.24. The reliability
estimates are computed with items having easiness indices of 1.00
removed.
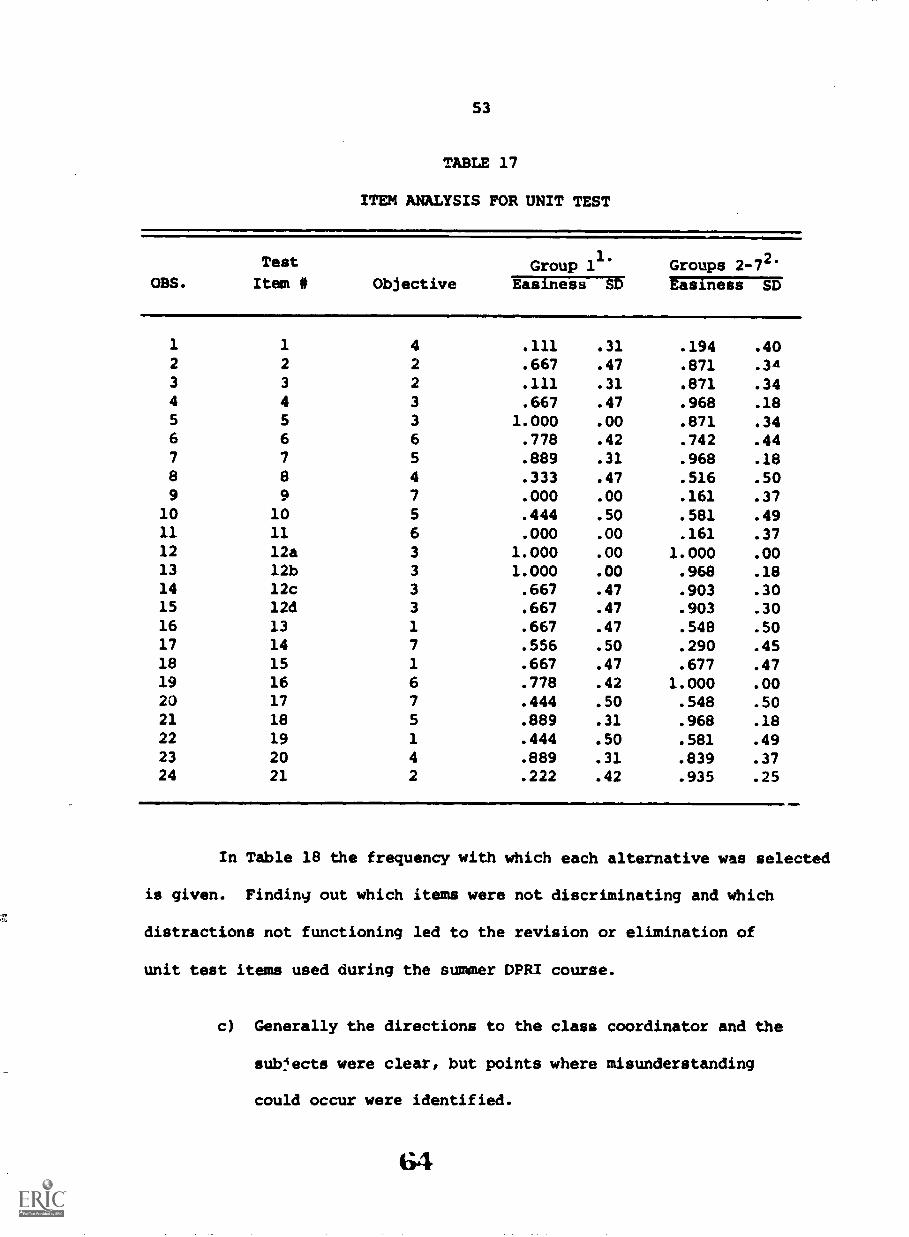
53
TABLE 17
ITEM ANALYSIS FOR UNIT TEST
OBS.
Test
Item it ObjectiveGroup 11 Groups 2-72'
Easiness SD Maness SD
1 1 4 .111 .31 .194 .402 2 2 .667 .47 .871 .343 3 2 .111 .31 .871 .344 4 3 .667 .47 .968 .185 5 3 1.000 .00 .871 .346 6 6 .778 .42 .742 .447 7 5 .889 .31 .968 .188 8 4 .333 .47 .516 .509 9 7 .000 .00 .161 .37
10 10 5 .444 .50 .581 .4911 11 6 .000 .00 .161 .3712 12a 3 1.000 .00 1.000 .0013 12b 3 1.000 .00 .968 .1814 12c 3 .667 .47 .903 .3015 12d 3 .667 .47 .903 .3016 13 1 .667 .47 .548 .5017 14 7 .556 .50 .290 .4518 15 1 .667 .47 .677 .4719 16 6 .778 .42 1.000 .0020 17 7 .444 .50 .548 .5021 18 5 .889 .31 .968 .1822 19 1 .444 .50 .581 .4923 20 4 .889 .31 .839 .3724 21 2 .222 .42 .935 .25
In Table 18 the frequency with which each alternative was selected
is given. Finding out which items were not discriminating and which
distractions not functioning led to the revision or elimination of
unit test items used during the summer DPRI course.
c) Generally the directions to the class coordinator and the
subjects were clear, but points where misunderstanding
could occur were identified.
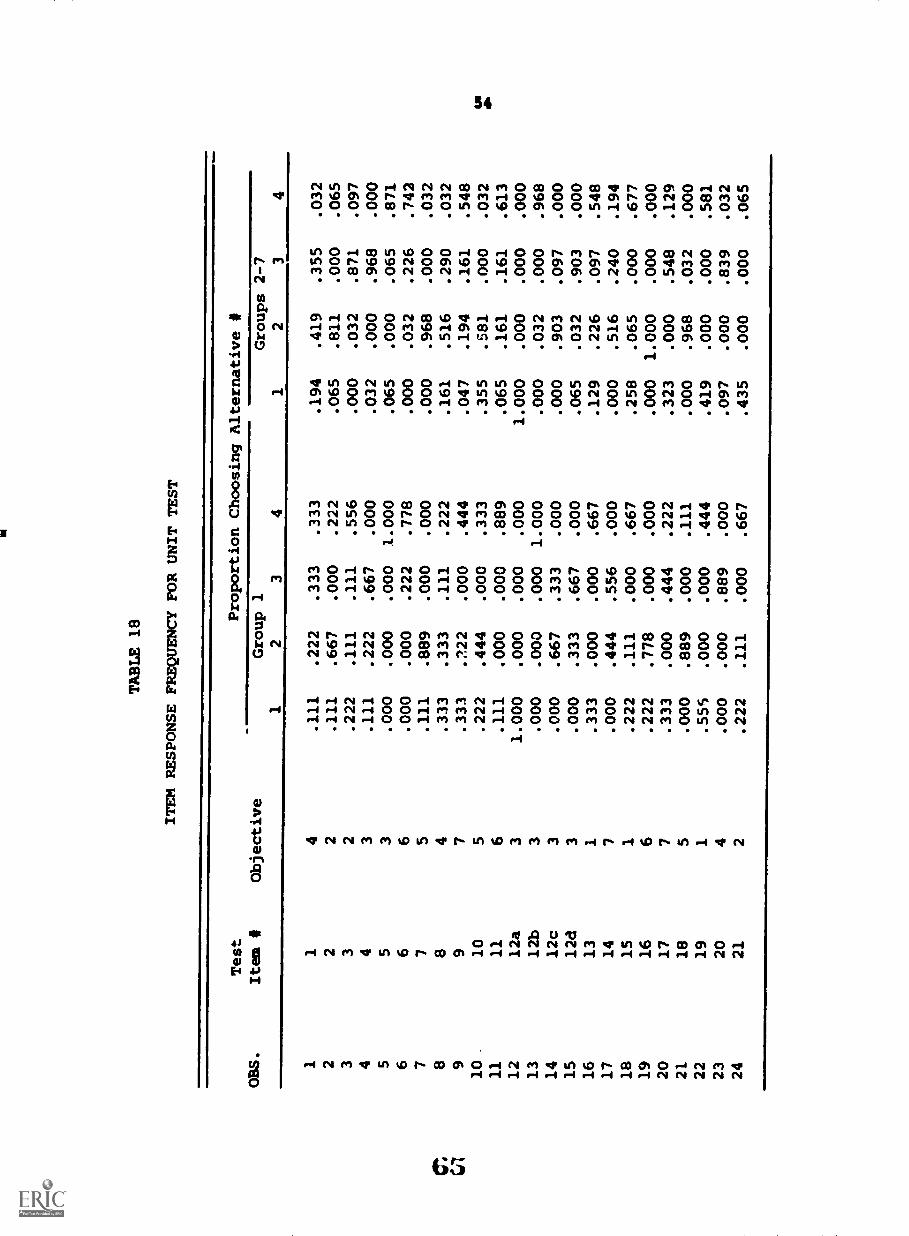
TABLE 18
ITEM RESPONSE FREQUENCY FOR UNIT TEST
Test
Proportion Choosing Alternative I
OBS.
It
1Objective
Group 1
Groups 2-7
12
34
12
34
11
4.111
.222
.333
.333
.194
.419
.355
.032
22
2.111
.667
.000
.222
.065
.811
.000
.065
33
2.222
.111
.111
.556
.000
.032
.871
.097
44
3.111
.222
.667
.000
.032
.000
.968
.000
55
3.000
.000
.000
1.000
.065
.000
.065
.871
66
6.000
.000
.222
.778
.000
.032
.226
.742
77
5.111
.889
.000
.000
.000
.968
.000
.032
C".
88
4.333
.333
.111
.222
.161
.516
.290
.032
CA
99
7.333
.722
.000
.444
.047
.194
.161
.548
10
10
5.222
.444
.000
.333
.355
.581
.000
.032
11
11
6.111
.000
.000
.889
.065
.161
.161
.613
12
12a
31.000
.000
.000
.000
1.000
.000
.000
.000
13
12b
3.000
.000
.000
1.000
.000
.032
.000
.968
14
12c
3.000
.667
.333
.000
.000
.903
.097
.000
15
12d
3.000
.333
.667
.000
.065
.032
.903
.000
16
13
1.333
.000
.000
.667
.129
.226
.097
.548
17
14
7.000
.444
.556
.000
.000
.516
.240
.194
18
15
1.222
.111
.000
.667
.258
.065
.000
.677
19
16
6.222
.778
.000
.000
.000
1.000
.000
.000
20
17
7.333
.000
.444
.222
.323
.000
.548
.129
21
18
5.000
.889
.000
.111
.000
.968
.032
.000
22
19
1.555
.000
.000
.444
.419
.000
.000
.581
23
20
4.000
.000
.889
.000
.097
.000
.839
.032
24
21
2.222
.111
.000
.667
.435
.000
.000
.065
55
Trying out the instruments revealed many of the questions site
coordinators would need to know how to answer during the course. For
instance, on the Confidential Background Questionnaire the subjects
wanted to know whether they should guess their GRE scores or leave the
space blank, whether they should count reading courses they were
currently enrolled in as reading courses completed, why they had to put
any identifying information on the instruments. Knowledge of some of
the problems that were likely to arise showed the RCC Evaluation
Component where to amplify the directions to the students and which
administration details needed to be included in the site monitor's
manual.
SUMMARY
What are some of the tentative conclusions that can be drawn
from this study on one reading unit?
The formative evaluation designs in this study identify some of
the strategies that could be implemented to secure information useful in
product development. The study included audience reaction polling and
grouping by treatments, with the treatments involving varying the amount
of the learning sequence received or altering formats of the different
learning activities.
Regardless of which stragegies are adopted, some kind of
formative evaluation study should be carried out on each instructional
unit. In-process evaluation studies like these enable the producers of
56
instructional materials to obtain information they can use to improve
their products before they are finalized. In addition, feedback on one
unit often helps producers shape other units more effectively. Although
limited time and funding made extensive formative evaluation impossible
for the 1974 AESP summer courses, greater involvement of the RCC
Evaluation Component in product development should result in the pro-
duction of better materials.
To summarize the findings of this study, the data indicated
that instruction involving at least the initial learning activity in the
unit prepared the subjects to perform better the behavioxs specified
for the unit. However, gains in performance were not detected for
additional learning activities in the sequence. This may mean that
activities subsequent to the televised lecture simply repeat former
coverage, rather than prepare the subject to perform higher cognitive
behaviors. Since no tests were given after the lapse of a substantial
amount of time, however, it is impossible to say whether the additional
learning activities in the sequence increased long-term retention of
the material.
The data indicated that the subjects preferred situation-
centered handling of concepts to abstract discussions about them. The
responses during the audience-reaction study suggested that the
subjects preferred discussions of issues immediately relevant to them
as classroom teachers. They seemed to like visuals showing actual
classroom situations more than watching the lecturer. Consequently,
57
whenever possible it might be a good idea to explain concepts and
procedures through the construction of actual or fabricated situations
that demonstrate them.
Are there ways to improve future implementations of
these formative evaluation models?
This piloting of both the 7-group and audience-reaction studies
identified several ways the designs could be improved. First, the
sample size per group should be increased, since the larger the sample
the more sensitive the analysis is to differences in the effectiveness
and acceptability of the different learning materials and activities.
This could involve running the study on a larger sample. Given the
availability of experimental subjects, however, a more practical
solution would be to run studies of smaller scope with samples of
about this size (40). For instance, audience reaction studies could be
run on each of the te.i.eviaed lectures, and the subjects asked at
selected points in the program whether they liked it, understood what
was going on, or any other dichotomous question.
Secondly, to make the results generalizable to the target
population, subjects as near as possible like the prospective users of
the course should be selected to participate in the evaluation studies.
For instance, the subjects in this study tended to be iAexperienced
teachers. If the future participants in the course are experienced
teachers, the results may not be very informative about how they would
respond to the products. However, correlational analyses revealed that
BEST COPT AVAILABLE58
for the subjects whc participated in this study neither the number of
previous reading courses taken or undergraduate or graduate grade-
point-average was significantly correlated with performance on the unit
test.
Thirdly, if at all possible the unit tests should be more
thoroughly piloted before being used to measure differences. While the
reliability of unit test 5 may be high enough to be acceptable for
research purposes, care always should be taken to make sure that unit
tests are sensitive enough to pick up subtle differences in the ability
of the subjects to perform higher level cognitive functions.
Finally, since the on-site course coordinators in the field are
not experts in reading instruction, the person selected to run the
laboratory session during the experiment also should not be
a content expert. In this study the lab monitor was the person who
developed the program. It would be better to have a person as nearly
like field respresentatives as possible, if the appropriate effect of
the lab activities is to be found and if the directions are going to
be checked to determine Vlether the procedures are clearly enough
spelled out for a non-expert to handle questions that arise.
The 7-group formative evaluation design provided an opportunity
to try out some of the instructional and evaluative materials, procedures,
and equipment used in the DPRI reading course. With such a small number
of subjects going through only one unit, it would obviously not be
valid to take their reactions as the final word. However, their
responses identified for course developers potential problem areas.

59
This report was produced under a grant from the
National Institute of Education. The views expressed do not
necessarily reflect those of the National Institute of Education
or the U.S. Department of Health, Education, and Welfare.
70