Embed Size (px)
Citation preview
DOCUMENT RESUME
ED 269 398 SP 027 582
AUTHOR Guskey, Thomas R.TITLE Context Variables That Affect Measures of Teacher
Efficacy.PUB DATE Apr 86NOTE 28p.; Paper presented at the Annual Meeting of the
American Educational Research Association (70th, SanFrancisco, CA, April 16-20, 1986).
PUB TYPE Speeches/Conference Papers (150) -- ReportsResearch /Technical (143)
EDRS PRICEDESCRIPTORS
MF01/PCO2 Plus Postage.Academic Lchievement; *Outcomes of Education; *SelfEvaluation (Individuals); *Teacher Attitudes;*Teacher Effectiveness
ABSTRACTThis paper presents a model describing three context
variables hypothesized to affect measures of teacher efficacy. Thesevariables include the nature of the student performance outcome(positive or negative), the ability of the students involved (high orlow), and the scope of influence (single student or group ofstudents). The results from studies investigating the influence ofperforma=e outcomes and student ability on teachers' perceptions ofefficacy are summarized. The present study explored :he extent of theeffect of influence on the teachers' perceptions. It was discoveredthat teachers do distinguish in their perceptions of efficacy betweenresults with a single student and those with a group of students.When poor performance was involved, teachers expressed less personalresponsibility and efficacy for single students than for results froma group of students. A four-page list of references is included.(Author/CB)
************************************************************************ Reproductions supplied by EDRS are the best that can be made ** from the original document. *
***********************************************************************
CONTEXT VARIABLES THAT AFFECT MEASURES OF TEACHER EFFICACY
"PERMISSION TO REPRODUCE THISMATERIAL HAS BEEN GRANTED BY
TO THE EDUCATIONALRESOURCES
INFORMATION CENTER (ERIC)"
Thomas R. Guskey
College of EducationUniversity of Kentucky
Lexington, Kentucky )10506Phone: 606/257-8666
U.S DEPARTMENT OF EDUCATIONOnce of Educational Research and improvementEDUCATIONAL RESOURCES INFORMATION
CENTER (ERIC)0 This document has been reproduced as
received from the person or nantrationoriginating It.
O Minor changes have been made lo improvereproduction quality
Points of view or opinions stated in this deo u-ment oo not necessarily represent officialOERI position or policy
Paper presented at the annual meeting of theAmerican Educational Research Association,
San Francisco, 1986.
Teacher Efficacy
1
Abstract
This paper presents a model describing three context variables
hypothesized to affect measures of teacher efficacy. These variables
include the nature of the student performance outcome (positive or
negative), the ability of the studep+s involved (high or low), and the
scope of influence (single student or group of students). The results
from studies investigating the influence of performance outcomes and
student ability on teachers' perceptions of efficacy are summarized.
The present study focuses on the scope of influence and offers evidence
of its importance to the model
3
Teacher Efficacy
2
Context Variables That Affect Measures of Teacher Efficacy
Over the past decade a growing number of educational researchers have
identified teachers' perceived responsibility for student achievement or
personal sense of efficacy as a powerful variable in studies of
instructional effectiveness. In reporting on the Rand Corporation's
"Change Agent Study," for example, McLaughlin and Marsh (1978) note that
teachers' sense of efficacy was "the most powerful teacher attribute in
the Rand analysis" (p. 84). Armor, Conroy-Osequera, Cox, King,
McDonnell, Pascal, Pauly, & Zellman (1976) reached a simil r conclusion
in their study of reading programs in Los Angeles. Their findings
showed measures of teacher efficacy were strongly and consistently
related to student gains in reading achievement. Likewise, Brookover
and Lezotte (1979) found through interviews with school personnel that
those in more effective schools had a stronger sense of efficacy and
tended to feel more responsible for the learning of their students than
did those in less effective schools. Other studies investigating this
construct have yielded comparable results (Brophy & Evertson, 1977;
Murray & Staebler, 197k; Porter & Cohen, 1977).
Although modern definitions of teacher efficacy vary, most can be
traced to the early research of Heider (1958) or White (1959). In the
Rand study, efficacy was defined as "the extent to which the teacher
believes he or she has the capacity to affect student performance"
(McLaughlin & Marsh, 1978, p. 84). In general, it is seen as a
teacher's belief or conviction that he or she can influence how well
4K.
Teacher Efficacy
3
students learn, even those who may be difficult or unmotivated. Gibson
and Dembo (1984) argue it may be necessary to further distinguish
general teaching efficacy from personal teaching efficacy, as suggested
by Bandura's (1977, 1978) conceptualization of self-efficacy. That is,
teachers may believe that certain practices or teaching behaviors will
affect student performance (general) but, at the same time, may not
believe they can perform those necessary activities (personal).
Early studies of teacher efficacy measured this construct with scales
consisting of as few as two items (Berman & McLaughlin, 1917; Armor et
al., 1976). But in recent years, several well-designed instruments have
been developed to measure teacher efficacy with greater accuracy and
reliability (Gibson & Dembo, 1984; Guskey, 1981a; Rose & Medway, 1981).
Investigations employing instruments such as these have been concerned
with the relation of teacher efficacy to student learning (Guskey, 1984;
Porter & Cohen, 1977), to other teacher characteristics and classroom
behaviors (Ashton & Webb, 1982; Gibson & Dembo, 1984; Guskey, 1981b), or
to the general attribution assignments teachers make (Guskey, 1982).
But while it has been noted that teacher efficacy is likely to be
dependent upon certain context variables (Ashton, 1984), few
investigations have sought to determine the nature of these variables or
their precise effects on measures of teacher efficacy.
This paper presents a model describing three context variables that
are hypothesized to affect measures of teacher efficacy. It is argued
that instead of representing a single global construct, efficacy is
multidimensional and that these context variables represent dimensions
of that construct. The results of research studies investigating two of
5
Teacher Efficacy
these context variables are outlined in detail. In addition, the
results of a study focusing on a third variable are described which add
credence to its importance to the model.
Theoretical Framework
Previous research has shown two context variables to have strong
influence on measures of teacher efficacy. One is the nature of the
student performance outcome being considered. Numerous studies have
demonstrated that there is little relation between the efficacy or
responsibility teachers assume for positive learning outcomes versus
that which they assume for negative learning outcomes. In the Rand
study, for instance, Berman and McLaughlin (1977) found the correlation
between the two efficacy items, one of which was positive while the
other was negative, to be very modest. In fact, in only one of six
samples did this correlation even reach statistical significance.
Similarly, in developing the Responsibility for Student Achievement
scale (RSA), Guskey (1981a) found the correlation between perceived
responsibility for positive versus negative classroom events to be only
+.20. This was seen as evidence that these two dimensions are
relatively independent, similar to what Crandall, Katkovsky, and
Crandall (1965) found in investigating childrens' perceptions of
personal control in achievement related situations. Rose and Medway
(1981) found the same pattern in developing their Teacher Locus of
Control scale. In this research a correlation of only +.33 was found
between items measuring internal attributions for student success and
those measuring internal attributions for student failure.
6Ilt
Teacher Efficacy
5
Investigations seeking to explain these differences have yielded
inconsistent results. For example, Johnson, Feigenbaum, and Weiby
(1964) found that in a laboratory teaching task, teachers tended to make
"defensive" attribution assignments, accepting responsibility when
students did well but blaming the situation when students did poorly.
In a similar study, Beckman (1970) also found that teachers tended to
credit themselves for student improvement while attributing failure
primarily to external situational factors. Yet in a number of other
studies teachers have been found to make "counter-defensive"
attributions. Ross, Bierbrauer, mid Polly (1974), for instance, found
that professional teachers attributed responsibility for student failure
to themselves and responsibility for success to the student. Similar
nondefensive perceptions on the part of teachers have been identified in
the research of Ames (1975), Beckman (1973), and Tetlock (1980).
An explanation for these inconsistencies was offered in a study by
Brandt, Hayden, & Brophy (1975). They suggested that when subjects are
dependent totally on data from experimenters, as they are in laboratory
experiments like that of Johnson, et al. (1964) and Beckman (1970), more
defensive reactions are likely to result. Tn contrast, when subjects
are given an opportunity to meet students personally and deal with them
at length, their reactions are more likely to be more nondefensive. In
other words, in more naturalistic situations teachers are far less
self-serving and defensive than some of the purely experimental studies
make them out to be. Still, it is clear that the nature of the student
performance outcome, specifically whether that outcome is positive
(success) or negative (failure), influences teacher perceptions of
efficacy and the measure of those perceptions.
7
Teacher Efficacy
A second context variable found to affect measures of teacher
efficacy is the ability of the students involved. Research on the
classroom behaviors of teachers shows there are unintentional,
qualitative differences in the way teachers interact with high ability
students versus low ability students. Generally, teachers have been
found to teach more to students labeled "high ability" than those
labeled "low ability," and are more attentive toward children labeled
"bright" than toward those labeled "dull" (Brophy & Good, 1974;
Rothbart, Dalfen, & Barrett, 1971). Studies have also shown these
behavioral differences to be associated with efficacy or personal
responsibility differences. Cooper and Lowe (1977) reported that
6
teachers perceive smart students as more personally responsible for
classroom successes. Dull students, on the other hand, are perceived as
more personally responsible for classroom failures. In a related study,
Cooper, Burger, and Seymour (1979) found these perceptual differences to
be the result of teachers feeling hey have less control over low
ability students and, therefore, are less able to influence how well
they learn. A study by Medway (1979) also confirmed student ability to
be an important mediating variable in the responsibility and attribution
assignments of teachers.
As a context variable, student ability is also tied to teacher
expectations and consistency in the performance outcome. Typically,
high ability students would be expected to perform well, while low
ability students might be expected to perform poorly. In other words,
consistency in performance is generally what is expected. Departures
from these expected outcomes; that is, high ability students doing
8
4
Teacher Efficacy
7
poorly or low ability students doing well; are likely to have definite
effects on teachers' perceptions of efficacy or personal responsibility.
But rather than presenting separate, distinct factors, these can be
represented as special combinations of performance outcomes with student
abilities. Hence, it seems likely that the performance outcome and
student ability variables may have not only direct, but also interactive
influences on measures of teacher efficacy.
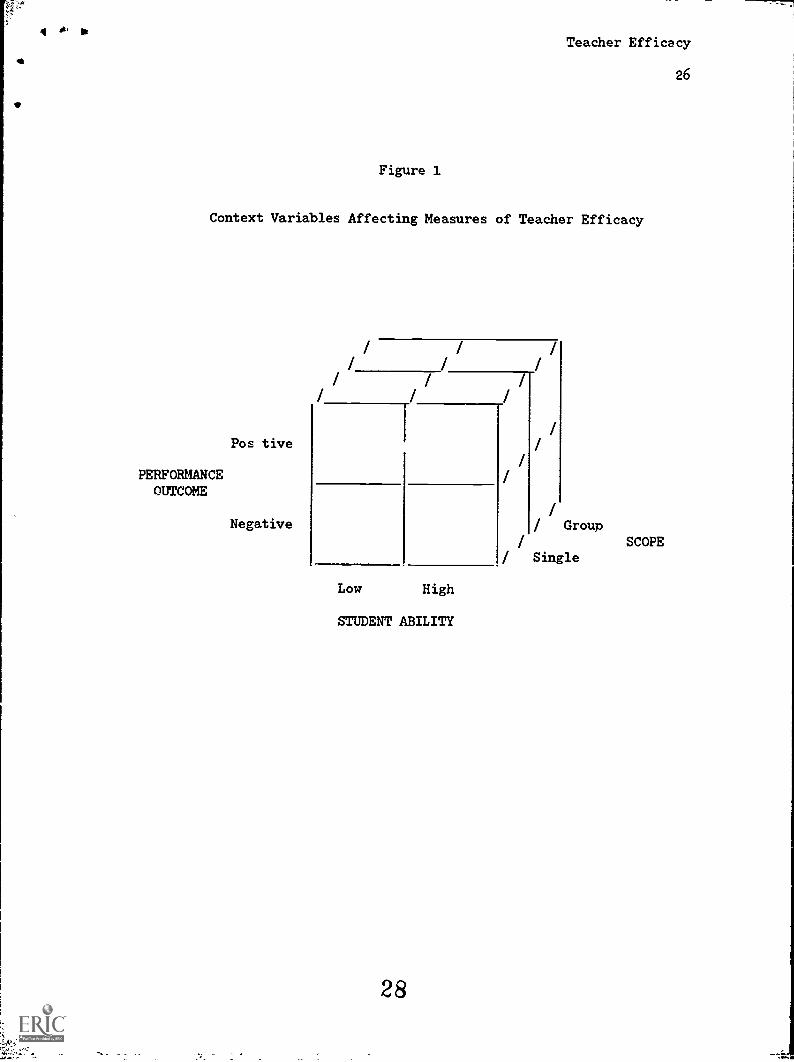
A third context variable hypothesized to affect measures of teacher
efficacy is the scope of influence. Scope refers to the narrowness or
broadness of the teachers' influence. Specifically, it has to do with
differences in teachers' beliefs about their influence over the learning
of a single student versus that of a group or entire class of students.
Studies have shown that teachers do distinguish between results with
individual students and results from a group of students. Lortie
(1975), for example, found in his study of Five Towns that the
predominant source of pride for most teachers was striking success with
one student here and one sludent there, as distinct from raising the
achievement level of an entire group of students. In fact, when asked
about the major source of their satisfaction, 64 percent of the Five
Town teachers mentioned successes with a single student while only 29
percent mentioned group results. It seems probable that teachers would
make similar distinctions in measures of efficacy. In particular, it
was thought teachers would express greater efficacy when asked about the
learning of a single student than when asked about a group or class of
students. The management problems inherent in group-based teaching
situations often limit the direct influence and control teachers have
9
Teacher Efficacy
8
over learning. With a single student, however, management problems are
far less pressing and do not interfere with the influence a teacher can
have.
Figure 1 illustrates the dimensions of these three context variables.
Each variable is shown to have only two levels, although finer
gradations are undoubtedly possible in all three. Again, these include:
(1) the performance outcome, which can be either positive or negative;
(2) student ability, which can be either high or low; and (3) scope,
which can refer to either a single student or a group of students. The
importance of the performance outcome and student ability variables
appears fairly well documented. The purpose of this study was to
investigate the relevance of the scope variable.
Insert Figure 1
Method
To determine the effects of the outcome scope variable on measures of
teacher efficacy, a revised version of the Responsibility for Student
Achievement scale (Guskey, 1981a) was devised. This scale provides
separate subscales for positive (RP) and negative (RN) performance
outcomes (reliability coefficients = .79 and .88, respectively) but does
not distinguish between outcomes obtained with high versus low ability
students. From the original 30 items in the scale, the ten most
discriminating items from both the positive and negative suuscales were
Teacher Efficacy
9
selected. Five items from each of these two groups of ten items were
then reworded to clearly reflect a learning situation involving a single
student; the other five items clearly reflected a learning situation
with a group or entire class or students. Care was also taken to make
sure half of the single student items referred to a female student and
the other half to a male student. Items were then randomly ordered in a
new version of the scale.
The Responsibility for Student Achievement scale employs an
alternative-weighting procedure in which respondents are asked to assign
a certain percent of weight to each of the two responses, totalling 100
percent. For example, one item asks: "If you don't have as much
success as usual with a particular class, is that probably ('a) because
you didn't plan as carefully as usual, or (b) because these students
refused to work as hard as others?" This item reflects a negative
performance outcome with the scope focused on a group of students. The
percentage weight assigned to response (a), the more personally
responsible or efficacious response, is then tallied. For the purposes
of this study, response weights were reduced to a 0-10 rating and then
averaged across items in that subscale.
participating in a special staff development program for which they
were female. On the average they had 11 years teaching experience.
received salary lane credit. Forty-six of these teachers were male; 74
The revised scale was then administered to a group of 120 elementary
and secondary school teachers from three school districts. One of these
districts was an urban, inner city district, the second was a suburban
district, and the third was a rural district. These teachers were all
11
Teacher Efficacy
10
With the revised Responsibility for Student Achievement scale, these
teachers also completed two additional scales. The first was a scale
designed by the author to assess affect toward teaching; that is, how
much teachers like teaching and how positively or negatively they feel
about various aspects of teaching. This scale contains 30 Likert-type
items, most of which were adapted from items in the Self-Observational
Scales (Katzenmeyer & Stenner, 1974). Each item in this scale asks
teachers to indicate their feelings regarding a particular statement.
Five options are available for the rating, ranging from Strongly
Disagree to Strongly Agree. Statements are both positive and negative.
For example, a positive item would be, enjoy learning about new
classroom techniques," while a negative item would be, "I often get
bored in discussions about education." The weights that are assigned
response options for positive items are reversed in tallying responses
to negative items. An average response across items is then calculated
so that scores can range from 1 to 5. Pilot testing of this scale
showed it was fairly reliable, with a Cronbach alpha coefficient equal
to .85.
The second scale, also developed by the author, assessed teaching
self-concept. Like the affect toward teaching scale, this scale
consists of 30 Likert-type items. These items are all behavioral-based,
self-concept items, similar to those developed in the research of
Brookover (1973). Each item asks teachers to indicate their feelings in
relation to particular behaviors or characteristics relevant to
teaching. Items are both positive and negative, and are rated on a
five-point scale from Strongly Disagree to Strongly Agree. An example
12
Teacher Efficacy
11
of a positive item would be, "I am very proud of my performance as a
teacher," while a negative item would be, "I sorgetimes have doubts about
the effectiveness of my teexhing." Again, an average response across
items is then calculated so that scores range from 1 to 5 Pilot
testing of this scale showed it also to be fairly reliable, with a
Cronbach alpha equal to .84.
Finally, a general measure of efficacy was gathered using the two
efficacy items from Berman and McLaughlin (1977). Responses to each of
these items were recorded separately along with a total combined
efficacy score.
Results
Of the 120 teachers participating in the study, six either did not
complete the instruments or recorded their responses in such a manner
that they could not be used. Therefore, analyses were based on complete
data gathered from a total of 114 teachers.
The means and standard deviations of, measures from the various scales
are illustrated in Table 1. Since other studies have indicated that
grade level differences among teachers can influence their beliefs in
responsibility and efficacy (Guskey, 1982), a breakdown of means and
standard deviations by grade level groupings was also constructed. This
is displayed in Table 2.
Insert Tables 1 & 2
13
Teacher Efficacy
12
These data show that the perceptions of personal efficacy among this
group of highly experienced teachers tended to be defensive in nature.
That is, these teachers expressed significantly greater personal
efficacy when the performance outcome was positive (RP measures) than
when it was negative (RN measures). In addition, these data show that
outcome scope is also influential, but only when the performance outcome
is negative. There was no difference in the personal efficacy expressed
by these teachers for positive results with single students or groups.
But the personal efficacy they expressed for negative outcomes with
single students was significantly different from that expressed with
groups of students. Counter to what was hypothesized, however, these
teachers expressed greater personal efficacy for g7 results than for
those involving only a single student.
Dividing the teachers by grade levels showed that response patterns
remained fairly constant across grade assignments with little difference
between the various levels. The only exception was the personal
efficacy expressed by high school teachers for negative outcomes with a
single student (RN Single), which was less than that expressed by any
other group.
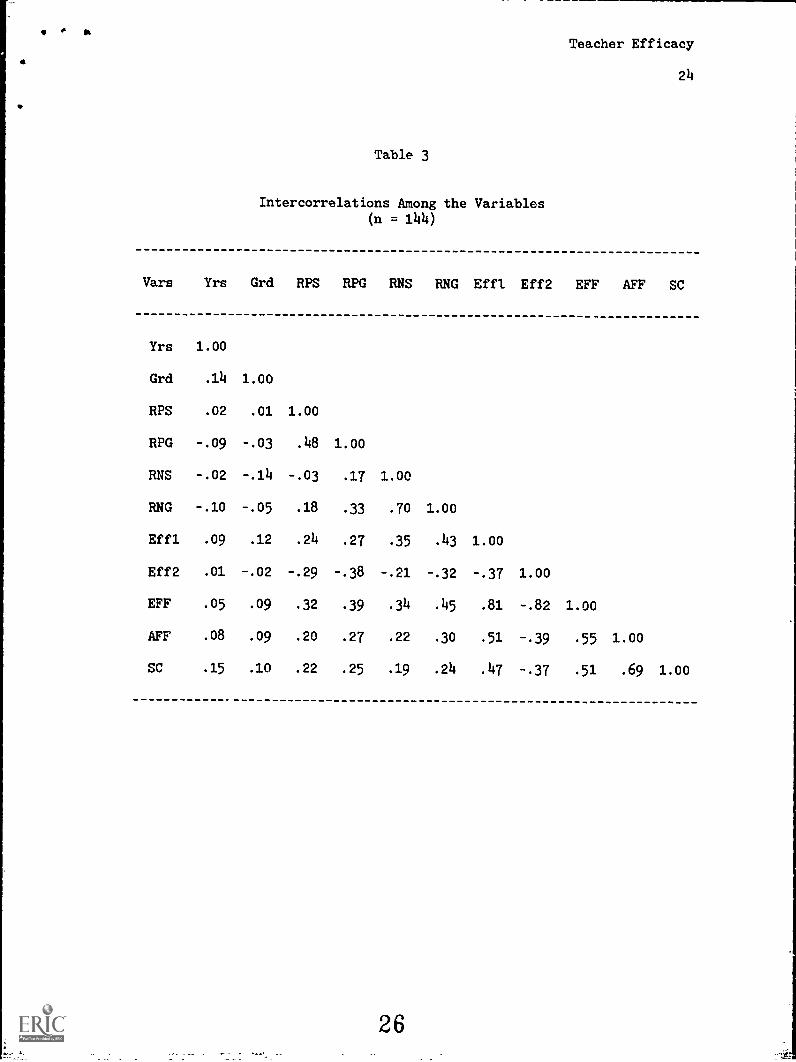
The intercorrelations among these variables are shown in Table 3.
Here it can be seen that neither years experience nor grade level
assignment are significantly related to any of the othe_ variables in
the study. Inspection of the intercorrelations among the various
dimensions of the efficacy context variables shows an interesting
pattern, however. The correlation between the positive/group and
negative/group dimensions is +.33, similar in both direction and
14
a
Teacher Efficacy
13
magnitude to what other researchers have found between efficacy measures
for positive versus negative performance outcomes. But the correlation
between the positive/single and negative/single dimensions is only -.03,
indicating that there is no relation between these dimensions. In other
words, the responsibility or personal efficacy a teacher assumes for the
learning success of a single student is unrelated to the responsibility
or efficacy that teacher assumes for a single students' lack of success
or failure. Correlations between single and group dimensions for
outcomes similar in nature are moderate: +.48 for positive outcomes and
+.70 for negative outcomes.
Insert Table 3
The relationships between the various dimensions of the efficacy
context variables and the two efficacy items taken from the research of
Berman and McLaughlin (1977) are what one would anticipate. The first
item, which states "When it comes down to it, a teacher really can't do
much because most students' motivation and performance depends on their
environment," would be classified as a negative/group item. As
illustrated in Table 3, responses to this item are more strongly related
to the negative /group dimension (r=+.48) than any other dimension. The
second item, on the other hand, states "If I really try hard, I can get
through to even the most difficult or unmotivated students." This
statement would be classified as positive/single and, again, is more
Teacher Efficacy
strongly related to that dimension than any other (r=-.38)*
The intercorrelations among the affect toward teaching and teaching
self-concept scales, and the various dimensions of the efficacy context
variables, also reveal an interesting pattern. Both affect and
self-concept are more strongly related to the group dimensions of
efficacy than to the single student dimensions. This holds true for
both positive and negative performance outcomes. Apparently how much
teachers like teaching and how confident they feel about their teaching
abilities are more closely tied to the personal efficacy they assume for
the performance of groups of students than to that of a single student.
Hence, while success with a single student may bring pride and
satisfaction (Lortie, 1975), it appears that teaching affect and
teaching self-concept are more closely tied to perceptions of efficacy
regarding group results.
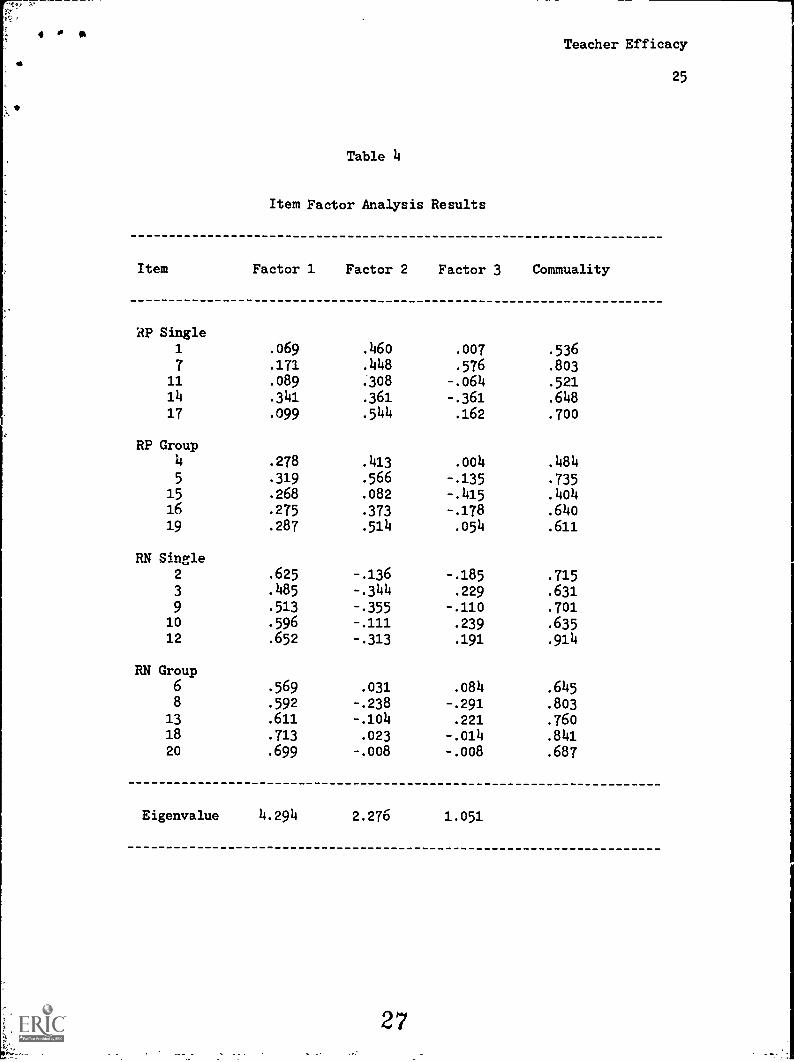
Finally, a factor analysis was conducted on the revised
Responsibility for Student Achievement scale. The results from this
analysis are illustrated in Table 4. To simplify interpretation, items
have been grouped in the table by the dimensions of the context
variables they were designed to assess. Three factors were derived in
the analysis with eigenvalues greater than one. From the table it can
be seen that the first factor appears to capture the negative
performance outcome dimension. All of the negative outcome items loaded
most heavily on this factor. The second factor appears to capture the
positive performance outcome dimension. With only one exception (item
#15), the positive outcome items loaded most heavily on this factor.
* The negative sign is due to the reverse scaling of this item.
Teacher Efficacy
15
These results provide still further evidence that positive and negative
performance outcomes represent separate dimensions, operating
independently in their influence on perceptions of efficacy.
Insert Table 4
While it was anticipated that the third factor might identify some
dimension of scope, this was not verified. As the table shows, the
loadings on the third factor are mixed and inconsistent across items.
Inspection of the items in relation to these loadings could not identify
any specific characteristic that might typify this factor or help to
label it.
Discussion
This paper sought to explore the affects of specific context
variables on measures of teacher efficacy. Results from previous
efficacy research was reviewed to illustrate the influence of two
variables: performance outcome and student ability. This evidence
showed that teachers' perceptions of efficacy do vary depending upon
whether the performance outcome is positive (student success) or
negative (student failure), and whether the students involved are of
high or low ability. In the present study a third variable, the scope
of influence, was explored to determine the extent of its affect on
teachers' perceptions of efficacy and the measure of those perceptions.
Teacher Efficacy
16
It was discovered that teachers do distinguish in their perceptions of
efficacy between results with a single student and those with a group of
students, but that these perceptions differ significantly only when the
performance outcome is negative. When poor performance was involved,
teachers expressed less personal responsibility and efficacy for single
students than for results from a group or entire class of students.
Poor performance on the part of a single student was generally
attributed to situational factors outside of the teachers' control. It
was also discovered that teachers' feelings of affect toward teaching
and teaching self-concept were more strongly related to personal
efficacy for group results.
Although these findings are counter to what was originally
hypothesized, they are quite reasonable. The management problems
associated with classroom settings may restrict teachers' influence and
control to some degree. Still, it is clear that the teacher is (or can
be) the major causal agent of group-based results. While the
experienced teachers included in this study did not see themselves as
the major source of influence when students did poorly, they did accept
significantly greater personal responsibility when the results from an
entire group or class of students were poor, compared to when only a
single student did poorly. It seems these teachers perceived the
individual learning problems experienced by some students as
particularly difficult to influence through their personal effort or
pedagogical skill.
The generalization of these results is limited to some degree by the
nonrandom nature of the sample of teachers included. Still, it is
18
Teacher Efficacy
believed that strong evidence has been presented to support the notion
that teacher efficacy is a complex and multidimensional construct.
Among the context variables that affect teachers' perceptions of
efficacy, performance outcome and student ability appear to have both
direct and interactive effects. The results from the present study
indicate that the affect of scope of influence may be primarily
interactive, depending upon the nature of the performance outcome.
Teacher efficacy is likely to continue to be a potent construct in
studies of instructional effectiveness. By considering the context
variables that affect measures of teacher efficacy it is hoped we will
gain a better understanding of this construct and its influence on the
teaching and learning process.
19
17
Teacher Efficacy
18
References
Ames, R. (1975). Teachers' attributions of responsibility: Some
unexpected nondefensive effects. Journal of Educational Psychology,
67, 668-676.
Armor, D., Conroy-Osequera, P., Cox, M., King, N., McDonnell, L.,
Pascal, A., Pauly, E., & Zellman, G. (1976). Analysis of the school
preferred reading programs in selected Los Angles minority schools
(Report No. R-2007-LAUSD). Santa Monica, CA: Rand Corporation.
Ashton, P. (1984). Teacher efficacy: A motivationa] paradigm for
effective teacher education. Journal of Teacher Education, 35 (5),
28-32.
Ashton, P., & Webb, R. (1982). Teachers' sense of efficacy: Toward an
ecological model. Paper presented at the annual meeting of the
American Educational Research Association, New York.
Bandura, A. (1977). Self-efficacy: Toward a unifying theory of
behavioral change. Psychological Review, 84, 191-215.
Bandura, A. (1978). Reflections on self-efficacy. Advances in
Behavioral Research and Therapy, 1, 237-269.
Beckman, L. (1970). Effects of students' performance on teachers' and
observers' attributions of causality. Journal of Educational
Psychology, 61, 76-82.
Beckman, L. (1973). Teachers' and observers' perceptions of causality
for a child's performance. Journal of Educational Psychology, 65,
198-204.
Berman, P., & McLaughlin, M. W. (1977). Federal programs supporting
educational change, Vol. III: Factors affecting implementation and
20
Teacher Efficacy
19
continuation (Report No. R-1589/7-HEW). Santa Monica, CA: Rand
Corporation.
Brandt, L. J., Hayden, M. E., & Brophy, J. E. (1975). Teachers'
attitudes and ascriptions of causation. Journal of Educational
Psychology, 67, 677-682.
Brookover, W. (1973). Identification and analysis of elementary school
environment characteristics associated with different school
performance, socio-economic status and racial composition of the
schools controlled (USOE Co-op Research Project). East Lansing, MI:
Michigan State University.
Brookover, W. P., & Lezotte, L. W. (1979). Changes in school
characteristics coincided with changes in s+14dent achievement. East
Lansing, MI: Michigan State University, Inst:tute for Research on
Teaching.
Brophy, J. E., & Evertson, C. (1977). Teacher behaviors and student
learning in second and third grades. In G. D. Borich (Ed.), The
appraisal of teaching: Concepts and process (pp. 79-95). Reading,
MA: Addison-Wesley.
Brophy, J. E., & Good, T. L. (1974). Teacher-student relationships:
Causes and consequences. New York: Holt, Rinehart & Winston.
Cooper, H. M., & Baron, R. M. (1977). Academic expectations and
attributed responsibility as predictors of professional teachers'
reinforcement behavior. Journal of Educational Psychology, 69,
409-418.
Cooper, H. M., Burger, J. M., & Seymour, G. E. (1979). Classroom
context and student ability as influences on teacher perceptions of
21
Teacher Efficacy
20
classroom control. American Educational Reasearch Journal, 16,
189-196.
Cooper, H. M., & Lowe, C. A. (1977). Task information and attributions
for academic performance by professional teachers and roleplayers.
Journal of Personality, 45, 469-483.
Gibson, S., & Dembo, M. H. (1984). Teacher efficacy: A construct
validation. Journal of Educational Psychology, 76, 569-582.
Guskey, T. R. (1981a). Measurement of the responsibility teachers
assume for academic successes and railures in the classroom.
Journal of Teacher Education, 32 (3), 44-51.
Guskey, T. R. (1981b). The relationship of affect toward teaching and
teaching self-concept to responsibility for student achievement.
Journal of Social Studies Research, 5, 60-74.
Guskey, T. R. (1982). Differences in teachers' perceptions of personal
control of positive versus negative student learning out...)me.
Contemporary Educational Psychology, 7, 70-80.
Guskey, T. R. (1984). The influence of change in instructional
effectiveness upon the affective characteristics of teachers.
American Educational Research Journal, 21, 245-259.
Heider, F. (1958). The psychology of interpersonal relations. New
York: Wiley.
Johnson, T. J., Feigenbaum, R., & Weiby, M. (1964). Some determinants
and consequences of the teacher's perception of causation. Journal
of Educational Psychology, 55, 237-246.
Katzenmeyer, W., & Stenner, A. (1974). Self-observational scales.
Durham, NC: National Testing Services.
22
a eTeacher Efficacy
21
Lortie, D. C. (1975). Schoolteacher: A sociological Study. Chicago:
University of Chicago Press.
McLaughlin, M. W., & Marsh, D. D. (1978). Staff development and school
change. Teachers College Record, 80, 70-94.
Medway, F. J. (1979). Causal attributions for school 'elated problems:
Teacher perceptions and teacher feedback. Journal of Educational
Psychology, 71, 809-818.
Murray, H., & Staebler, B. K. (1974). Teachers' locus of control and
student achievement gains. Journal of School Psychology, 12,
305-309.
Porter, M. & Cohen, L. (1977). Personal causation and locus of control:
An analysis of selected teacher characteristics and their relation
to student achievement. Paper presented at the annual meeting of
the American Educational Research Association, New York.
Rose, J. S., & Medway, F. J. (1981). Measurement of teachers' beliefs
in their own control over student outcomes. Journal of Educational
Research, 74, 185-190.
Ross, L., Bierbrauer, B., & Polly, S. (1974). Attribution of
educational outcomes by professional and nonprofessional
instructors. Journal of Personality and Social Psychology, 22,
609-619.
Rothbart, M., Dalfen, S., & Barrett, R. (1971). Effects of teachers'
expectancy on student-teacher interactions. Journal of Educational
Psychology, 62, 49-54.
White, R. W. (1959). Motivation reconsidered: The concept of
competence. Psychological Review, 66, 297-333.
23
Teacher Efficacy
Table 1
Means and Standard Deviations of Various Teacher Measures(n=114)
Variable Mean Standard Deviation
Years experience 11.80 7.69
Grade level 4.93 3.28
RP Single 6.09 1.05
RP Group 6.29 1.20
RN Single 4.29 1.63
RN Group 5.71 1.59
Efficacy 1 4.01 .91
Efficacy 2 2.06 .85
Efficacy 3.97 .73
Affect Toward Teaching 4.04 .45
Teaching Self-Concept 3.82 .49
22
4Teacher Efficacy
23
Table 2
Means and Standard Deviations of Teach T Measures by Grade Level
Variable
Grades K-3
(11=37)
X. (sd)
Grades 4-6(n=27)
X. (sd)
Grades 7-8(n=31)
X. (sd)
Grades 9-12(n=19)
X. (sd)
Yrs. Exp. 10.93 (8.97) 12.80 (8.20) 13.09 (4.88) 15.36 (8.13)
Grade 2.54 (.74) 5.05 (.76) 7.78 (.42) 9.79 (.80)
RP Single 6.24 (1.07) 6.23 (1.13) 5.91 (.99) 6.39 (1.05)
RP Group 6.64 (1.08) 6.45 (1.22) 5.90 (1.35) 6.41 (1.14)
RN Single 4.81 (1.64) 4.05 (1.67) 4.40 (1.79) 3.60 (1.44)
RN Group 6.29 (1.57) 5.48 (1.64) 5.74 (1.72) 5.47 (1.53)
Efficacy 1 4.11 (.83) 3.95 (1.13) 4.00 (.80) 4.36 (.63)
Efficacy 2 1.82 (.82) 2.16 (.76) 2.00 (.80) 2.00 (1.04)
Efficacy 4.14 (.73) 3.89 (.76) 4.00 (.67) 4.18 (.70)
Affect 4.10 (.36) 4.04 (.49; 4.11 (.40) 4.09 (.70)
Self-Cncpt 3.89 (.37) 3.83 (.61) 3.86 (.55) 3.92 (.56)
25
Teacher Efficacy
214
Table 3
Intercorrelations Among the Variables(n = 144)
Vars Yrs Grd RPS RPG RNS RNG Effl Eff2 EFF AFF SC
Yrs
Grd
RPS
RPG
RNS
RNG
Effl
Eff2
EFF
AFF
SC
1.00
.14
.02
-.09
-.02
-.10
.09
.01
.05
.08
.15
1.00
.01
-.03
-.14
-.05
.12
-.02
.09
.09
.10
1.00
.48
-.03
.18
.24
-.29
.32
.20
.22
1.00
.17
.33
.27
-.38
.39
.27
.25
1.00
.70
.35
-.21
.34
.22
.19
1.00
.43
-.32
.45
.30
.24
1.00
-.37
.81
.51
.47
1.00
-.82
-.39
-.37
1.00
.55
.51
1.00
.69 1.00
26
4 II
Table 4
Item Factor Analysis Results
Teacher Efficacy
25
Item
RP Single
Factor 1 Factor 2 Factor 3 Commuality
1 .069 .46o .007 .536
7 .171 .448 .576 .80311 .089 .308 -.064 .52114 .341 .361 -.361 .64817 .099 .544 .162 .700
RP Group4 .278 .413 .00k .484
5 .319 .566 -.135 .73515 .268 .082 -.415 .40416 .275 .373 -.178 .64o19 .287 .514 .054 .611
RN Single2 .625 -.136 -.185 .715
3 .485 -.344 .229 .631
9 .513 -.355 -.110 .70110 .596 -.111 .239 .63512 .652 -.313 .191 .914
RN Group6 .569 .031 .084 .6458 .592 -.238 -.291 .803
13 .611 -.104 .221 .76018 .713 .023 -.014 .84120 .699 -.008 -.008 .687
Eigenvalue 4.294 2.276 1.051
27
4Teacher Efficacy
Figure 1
Context Variables Affecting Measures of Teacher Efficacy
PERFORMANCEOUTCOME
Pos tive
Negative
Low High
STUDENT ABILITY
/ Group
// Single
SCOPE
26