Embed Size (px)
Citation preview

DOCUMENT RESUME
ED 362 076 HE 026 512
TITLE Utah System of Higher Education Data Book (Supplementto Operating Budget Request) 1991-92.
INSTITUTION Utah State Board of Higher Education, Salt LakeCity.
PUB DATE Dec 90NOTE 343p.PUB TYPE Statistical Data (110)
EDRS PRICE MF01/PC14 Plus Postage.DESCRIPTORS Budgeting; Comparative Analysis; Degrees (Academic);
Educational Finance; Enrollment; *Higher Education;Instructional Student Costs; Libraries; ProgramDescriptions; School Demography; *Statistical Data;Student rinancial Aid; Tuition; VocationalEducation
IDENTIFIERS *State College and University Systems; *Utah
ABSTRACTThis publication offers a comprehensive statistical
look at the Utah state higher education system covering enrollment,degrees, tuition and fees, financial information, and comparativeanalysis. Introductory information includes a general description ofthe system, a map showing campus locations, a listing oforganizational names, institutional councils, presidents of memberinstitutions, and an organizational chart. Individual sectionspresent information on: (1) degrees and awards at all institutionswith comparative information from traditional non-publicinstitutions; (2) enrollment figures by institution, market share.growth, by course, and by residency; (3) vocational education; (4)
tuition and fees; (5) student financial aid participation and defaultrates; (6) financial information; (7) budget history for the systemas a whole and for each individual institution; (8) results of a coststudy by major program showing direct and calculated indirectinstructional costs for each institution and for the whole system;(9) statistics on system-wide staffing; (10) salary and compensationincluding comparison with groups of schools similar to Utahinstitutions; (11) libraries; and (12) faculty compensation andtuition and fees for Utah system institutions compared to select setsof "peer" institutions. (JB)
**************************A***AA:,AA*******A.**:.A:.A*:.********************
Reproductions supplied by EDRS are the best that can be made* from the original document. *
**************-4******************************************************

1
1
LI
UTAH SYSTEM OF HIGHER EDUCATION
Box Elder I Cache Rich
1,513<3 Ogden
Weber
7
Logan
5,929 82Brigham City e
Tooelo
TooeleP.
Salt Lake30,359
833
Davis 242Layton (.4
7,702
Juab
152
Utah
Provo 270
Morgan
Summit
Wasatch
Heber
1991-92DATA BOOK
672
7,810
Nephi
453
Delta
Fillmore
Beaver
149
Daggettq' 28
Ducnesne
Roosevelt
593
Sanpete
739
Ephraim
Sevier
Richfield
397
Carbon
Emery
1,530Price
Vernal
744
Grand
599 267
Pane Wayne
55 108
Iron
1,582
Cedar City
Washingtoir
2,429St. George
Garfield
Panguitch
Kane
Kanab154
125
Moab
San Juan
691 "PERMISSION TO REPRODUCE THISMATERIAL HAS BEEN GRANTED BY
Blanding - Utah System of
Higher Education
Fall 1990 Enrollment by County
2
TO THE EDUCATIONAL RESOURCESINFORMATION CENTER (ERIC1."
U.S. DEPARTMENT Of EDUCATIONOthce of Educatonei Roses/0 and improvamenf
EDUCATIONAL RESOURCES INFORMATIONCENTER fERICI
CIMMTi document hes been reproduced Ssreceived from the person or organizationoriginating rt.
C Mmor chimp's have been made to irripnOveroOrOduCtion Quality
Points of vow or ocenions stated m this COCO.mint do not nicesSerify rePresent othciatOEM MIRKA Or POlicY

RESIDENTSCounty UofU
UTAH SYSTEM OF HIGHER EDUCATIONFall 1990 Third Week Enrollment Report
Headcount by Residency
USU WSU SUU Snow Dixie # CEU UVCC SLCC Total
Box Elder 84 902 431 24 17 23 1 21 10 1,513
Cache 133 5,589 126 12 20 13 3 16 17 5.929
Daggett 2 17 5 2 0 0 0 1 1 28
Davis 1,720 764 4,426 50 62 85 16 78 501 7,702
Duchesne 34 410 29 14 12 17 14 56 7 593
Morgan 9 40 176 1 2 7 0 6 1 242
Rich 2 66 5 4 3 0 0 1 1 82
Salt Lake 13,987 1,981 1,036 333 372 228 97 286 12,039 30,359
Summit 249 76 65 11 156 9 5 29 72 672
Tooele 125 403 68 36 41 18 15 30 97 833
Uintah 16 559 51 22 18 3 18 48 9 744
Utah 1,023 648 364 157 182 106 59 5,142 129 7,810
Wasatch 57 36 28 6 6 17 10 90 20 270
Weber 568 678 5,913 17 26 49 4 28 53 7,336
TOTAL NORTHERN 18,009 12,169 12,723 689 917 575 242 5,832 12,957 64,113
Beaver 8 13 16 79 3 5 0 18 7 149
Carbon 101 173 25 32 1 3 1,164 22 9 1,530
Emery 20 128 15 24 28 3 361 15 5 599
Garfield 8 15 12 57 3 18 0 12 0 125
Grand 31 119 10 18 7 7 64 8 3 267
Iron 52 75 40 1,372 1 28 2 9 3 1,582
Juab 14 28 8 23 21 2 1 51 4 152
Kane 6 13 1 84 2 15 0 28 5 154
Millard 34 82 29 121 81 26 4 73 3 453
Piute 1 7 0 20 14 4 0 8 1 55
San Juan 26 37 32 49 25 15 458 35 14 691
Sanpete 49 136 32 48 396 9 22 44 3 739
Sevier 34 86 18 162 8 23 12 49 5 397
Washington 112 150 139 410 9 1,565 6 33 5 2,429
Wayne 6 22 8 28 22 3 1 17 1 108
TOTAL SOUTHERN 502 1,084 385 2,527 621 1,726 2,095 422 68 9,430
NATIVE AMERICANS * 0 0 8 37 2 6 226 0 0 279
OTHER @ 3,858 0 351 510 0 47 288 878 3 5,935
TOTAL RESIDENTS 22,369 13,253 13,467 3,763 1,540 2,354 2,851 7,132 13,028 79,757
NONRESIDENTSOther U.S. 1,972 1,292 391 222 117 133 81 624 125 4,957
Foreign 1,084 1,027 255 18 215 41 28 130 191 2.989
TOTAL NONRESIDENTS 3,056 2,319 646 240 332 174 109 754 316 7,946
TOTAL ENROLLMENT 25,425 15,572 14,113 4,003 1,872 2,528 2,960 7,886 13,344 87,703
* Native American students who are classified as residents for tuition assessment according to state law,
but do not have Utah as their state residence. .
@ Includes Undetermined, Military, Job Corps. For UofU includes Off-Campus.
# 143 Elder Hostel removed from Utah Other. 186 removed from Other U.S.
c:\databk\resident3-Dec-90
NOTE: This table correspunds to the data incluoed on tt,e cover of the 1991-92 Data Book.

UTAH SYSTEM OF HIGHER EDUCATION
DATA BOOK
(Supplement to Operating Budget Request)
1991-92
Submitted to
THE HON. NORMAN H. BANGERTER, GOVERNOR
and the
49TH LEGISLATURE OF THE STATE OF UTAH
GENERAL SESSION 1991
UTAH STATE BOARD OF REGENTSPUBLISHED BY THEOFFICE OF THE COMMISSIONER OF HIGHER EDUCATIONDECEMBER 1990
Document Publithed Partially on Recycied Paper
4

TABLE OF CONTENTS
Description of the Utah System of Higher Education
Utah System of Higher Education Map ii
Organizational Listing of Names iii
Institutional Counas iv
Presidents of Member Institutions
USHE Organization Chart vi
Degrees & Awards TAB A
Enrollments TAB B
Vocational Education TAB C
Tuition & Fees TAB D
Student Financial Aid TAB E
Financial ;nformation TAB F
Budget History TAB G
Cost Study TAB H
Staffing TAB I
Salary & Compensation TAB J
Libraries TAB K
Comparisons TAB L

DESCRIPTION OF THEUTAH SYSTEM OF
HIGHER EDUCATION /
The Utah System of Higher Education consists of nine public colleges and universitiesgoverned by the State Board of Regents, assisted by local Institutional Councils. The systemincludes two major research/teaching universities, two metropolitan/regional universities, andfive community colleges. The basic missions of these nine institutions are described below.
UNIVERSITY OF UTAH
The mission of the University of Utah is that of a major urban state university withsignificant programs of sponsored research and of graduate, professional, and undergraduateeducation in some 15 colleges and professionai schools and their authorized degree programs.
UTAH STATE UNIVERSITY
Utah State University serves as the state's land-grant institution under state and federallegislation and is a primary center of university research and of graduate, professional, andurdergraduate education in numerous authorized fields of study.
WEBER STATE UNIVERSITY
Weber State University has the mission of a large comprehensive undergraduateinstitution seeking to develop and refine programs and achieve distinction within that mission.Any new graduate programs authorized for the institution will not be oriented toward traditionalbasic research.
SOUTHERN UTAH UNIVERSITY
Southern Utah University has the mission of a four-year undergraduate teachinginstitution meeting the baccalaureate and assigned vocational training needs of Southern Utah.
COMMUNITY COLLEGES
Snow College, Dixie College, the College of Eastern Utah, Utah Valley CommunityCollege, and Salt Lake Community College have similar missions as open-accesscomprehensive community colleges addressing area needs with programs of vocational-technical training, transfer and general education, continuing education for personalenrichment or career counseling, development&: remedial studies, and placement. Programofferings and areas of emphasis among these institutions will differ according to v.irious needsand demands of the students and comm.nities served.

0>
IDAHOSOX ELDER UTAH STATE f RICK
UNIVERSITY -1L O w,
.1tordolPh
,WEBER STATEUNIVERSITY .T
GREAT .._ogc6r. motGAN
SALT
TOOELE 4,1ECA "44°'\ N VERSITY4
Salt Lake :OF UTAHCommunity ColleAgeAKE'`",-,.
Tooth/6 ;
1SALT LAKV Opybe,
Utah ValleytommunIty College
`'LT,Vcid
UTAH SYSTEM OFHIGHER EDUCATION
INSTITUTIONSAND CENTERS
I
SUMMIT
.---DUCMESNE
"."*. ex.4 DAGGETT
.1 I
USU-UintahBasin Center
( art..
JLIAB
X\e" UTA H
'-1/47------i-COLLEGE OF-cAksoNEASTERN UTAH, f
MILLARD I .1'\r-PDAM
NATNAI
j
ON
LSNOW COLLEGE
1
Cook Duit
L. SANPETE
ci.vreSEVIER
1
Lcheeid
"'RAI(
1""' 1 I Loc
Jvwci I WAYNE
SOUTHERN UTAHUNIVERSITY
;77,1,-4-Z-GicTtr-1
DIXIE COLLEGEI
$ I Growls.
USU-SECenter
..410moob
---.L6( SAN r. JUA N
.;.^1
42
GARFIELD
Cootob
ARIZO/N
TLANTI
LAK E POWELL
7
cs.
CEU-San JuanCenter
JI IAN

1
ORGANIZATIONALLISTING OF NAMES
Charles W. BullenMean H. ClydeIan M. CummingDouglas S. Fox ley, ChairmanJohn B. GoddardRobert D. HalesKaren H. HuntsmanJon E Jordan
Douglas S. Fox ley
Executive Carmine.Douglas S. Fox ley, ChairmanSteven E. Snow, Vice ChairmanJohn B. GoddardClifford S. LeFevreFred H. StringhamDale 0. Zabriskie
Budget and FranceFred H. Stringham, ChairmanJohn B. Goddard, Vice ChairmanCharles W. BullenKthael 0. LesavittSteven E Snow
UTAH STATE BOARD OF RB3E1TS
SBR/SBE LIAISON COANIITTEE
Evelyn B. Lee
STANDING COMIMITTBES
OFFICE OF THE CONDASSIONERUtah System of Higher Education
355 West No Temple, 3 Triad Suite 550Salt Lake City, Utah 84180-1205 (801) 538-5247
Ntichael 0. LaavittEvelyn B. LeeClifford S. LeFevrePaul S. RogersSteven E. Snow, \Ace ChairmanFred H. StingharnJay B. TaggartDale 0. Zabriskie
Clifford S. LeFevre
Academic aid Vacationed EducationClifford S. LeFevre, ChairmanDale 0. Zabriskie, Vice ChairmanMean H. ClydeJon E. JordanEvelyn B. Lee
ring and Fatieslan M. Cumming, ChairmanPaul S. Rogers, %Ace ChairmanIbbert D. HalesKaren M. HuntsmanJay B. Taggart
Wiliam Rolfe Kerr, CommissionerDon A. Carpenter, Associate Commissioner for Planning and FacilitiesCecelia H. Foxley, Associate Commissioner for Academic MfairsChalmers Gail Norris, Associate Commissioner for Budget and FnanceHarden R Eyring, Executive Assistant to the CommissionerVicki Varela, Assistant to the Commissioner for Government & Media RelationsRchard 0. Davis, Assistant COMMiSSIOner for Guaranteed Student LoansDavid A. Feitz, Assistant Commissioner for Student Financial AidMax S. Lowe, Assistant Commissioner for Vocational EducationSterling R. Provost, Assistant Commissioner for Veterans Education and Proprietary SchoolsMask H. Spencer, Assistant Commissioner for Academic AffairsJerry H. Fullmer, Director of Information SystemsBarbara S. Gittins, Director of Budget Operations

INSTITUTIONALCOUNCILS
Lkivernily of MeiLOUIS H. Canister, Vice Chairmanaeon° P. EcclesEmanuel A. FloorJames S. Jardine, ChairmanLeonard J. Lewis
Utah State UniversityKenneth G. Mderton, ChairmanJ. Clark BallardJames W. BingharnFred R. HunsakerJames D. Laub
Weber State UniverskyFred S. BallWiliam H. ChildBryce C. FlammMonis HansenJohn A. Lindquist, Vice Chairman
Hans ChamberlainJames HoyleLois Iverson, Vice ChairmanDavid JordanJacque Merchant
Southern Ulah University
Snow College
Erode College
College of Eastern Utah
Gary L Cariston, ChairmanJanet GreenhalghFermi D. HuntsmanLaMar R. MonroeRchard H. Olson, Mee Chairman
Bette MalSidney J. AtidnReed M. GardnerDale J. Lambert, Vice ChairmanShirlee Last
Ralph T. CoatesPAke DalpiazMargaret Dayton, %Ice ChairmanJames J. Harris, ChairmanJames T. Jensen
Nancy K. PaceReed SearleNicholas S. VidalakisG. Donald Gale (Alumni Pres.)John P. Wunder li (Student Body Pres.)
Frank Maughan, Jr.Bonnie F. Nelsen, Vice ChairmanC. Booth Wa DentineGary Blacker (Alumni Pres.)Tad L Sorenson (Student Body Pres.)
Utah Valley Comm/11y Coley,Alan C. AshtonJoseph A. CannonFtay M. Harding, .k., Vice ChairmanNancy M. HoustonDe Lance W. Squire, Chairman
.10e BarrettJohn A. Bch lingNice M. Bo byJoan Burnside, ChairpersonM. Dale Ensign
Salt Lake Community College
iv
Rchard E Myers, ChairmanCarolyn Rch NebekerJohn E UlibarriC. Bervard Smith (Alumni Pres.)Doug Peterson (Student Body Pres.)
Steve MarshallK.L Man ChairmanA. Lear ThorpeJoyce Sherratt (Alumni Pres.)Julie Stuart (Student Body Pres.)
Alva C. SnowRah TempestThorpe WaddinghamMark Stoddard (Alumni Pres.)Melissa Lowry (Student Body Pres.)
G. La Mont RchardsRobert WeyherRandy W. Wilkinson, ChairmanPatrick R. PAmdt (Alumni Pres.)Berkeley C. Booth (Student Body Pres.)
Doug SonntagFbbert SwinbumeManuel TorresScott McArthur (Alumni Pres.)Bryce Rowley (Student Body Pres.)
Jay WeaverMary Mne 0. WoodBrent De Mille (Alumni Pres.)Kelly Bitters (Student Body Pres.)
Mayne T. JohnsonMichael N. MartinezF. Warren Nuesrneyer, Vice ChairmanMke Has lam (Alumni Pres.)Shawn Mohr (Student Body Pres.)

A
I
Presidentsof Member Institutions
1
Chase N. PetersonUniversity of UtahSalt Lake City, Utah 84112
Gerald R. SherrattSouthern Utah UniversityCedar City, Utah 84720
Michael A. PetersenCollege of Eastern UtahPrice, Utah 84501
Stanford CazierUtah State UniversityLogan, Utah 84321
Paul H. ThompsonWeber State University
Ogden, Utah 84408
Gerald J. DaySnow CollegeEphraim, Utah 84627
Douglas D. AlderDixie College
St. George, Utah 84770
Kerry D. RomesburgUtah Valley Community CollegeOrem, Utah 84058
Frank W. BuddSatt Lake Community College
Salt Lake City, Utah 84130
v
.4 0

Liaison Coolittee
I
NM
On
INS
MI
1111
111
I
1111
111
1111
1111
11,
NI"
,011
1N
CO
INN
MN
NO
MN
___
.i
..
1II
I...
IM
I
State loard of Education
1 1
UTAH SYSTEM OF HIGHER EDUCATION
Governor
and
legislature State Board of Regents
UHEAA Board
of Directors
Coamiss oner of
Higher Education
Office of the
Cosaissioner
Utah Higher Education
Assistance Authority
loan Purchase
Program
1
Institutional Councils
1
Council of Presidents
-Presidents
[
Institutions
1
12

TAB ADEGREES & AWARDS
The Degrees & Awards included in Tab A represents the information from institutionstraditionally listed in previous years. This includes all degrees and awards of the nine publicinstitutions in the Utah System of Higher Education and for comparative information, degreesand awards of traditional non-public institutions: Brigham Young University, WestminstarCollege, and Latter Day Saint's Business College. Not included are awards by otherprivate/proprietary institutions or postsecondary awards by the applied technology centers.
Tables 1 through 8 include Public and Private Institutions1982-83 through 1989-90
TABLE 1 Total Degrees and Awards 1
FIGURE 1 Total Degrees and Awards 1
TABLE 2 Postsecondary Certificates and Diplomas of Less Than One Year . . . 2
TABLE 3 Postsecondary Certificates and Diplomas of Greater Than One Yearbut Less Than Four Years 2
TABLE 4 Associate Degrees 3
TABLE 5 Bachelor Degrees 3
TABLE 6 Master Degrees 4
TABLE 7 Doctorate Degrees 4
TABLE 8 First Professional Degrees 5
FIGURE 2 Total Degrees and Awards by Public and by Private Institutions 5
TABLE 9 USHE Degrees and Awards by Gender for 1989-90 6
FIGURE 3 1989-90 USHE Percent of Total Degrees and Awards by Institution 6
FIGURE 4 1989-90 Degrees and Awards by Gender 6
1 :3
I/
i
I
I
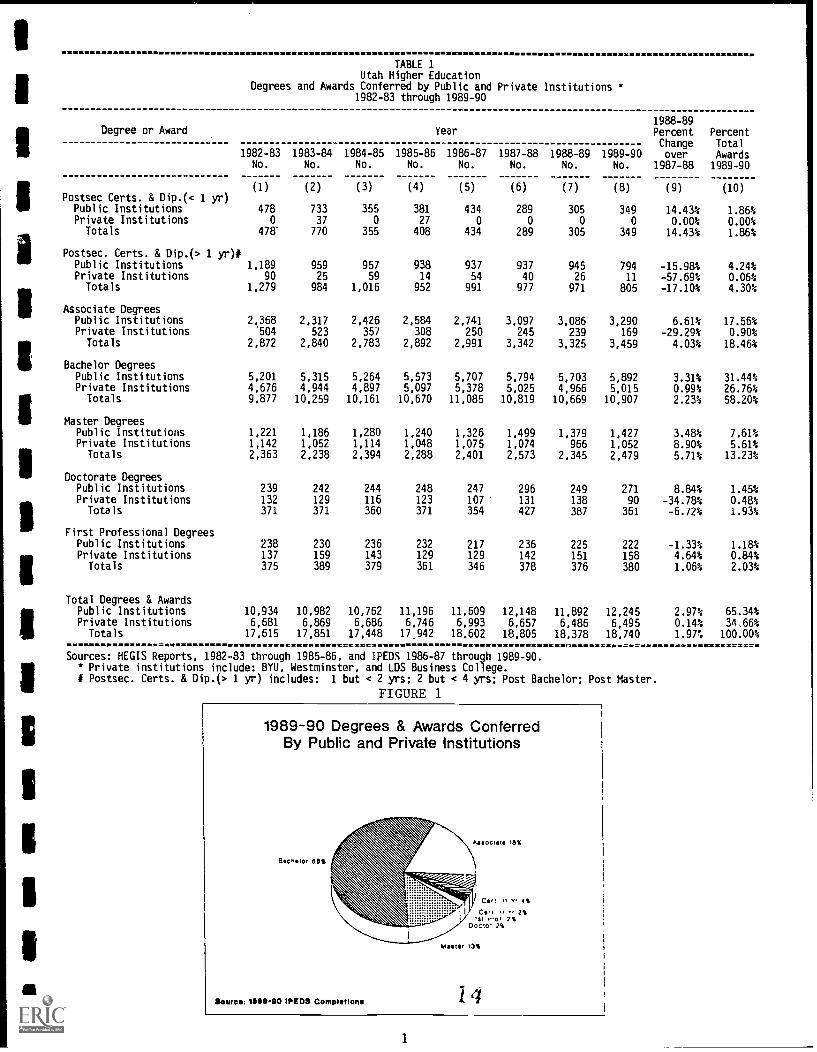
TABLE 1Utah Higher Education
Degrees and Awards Conferred by Public and Private Institutions *1982-83 through 1989-90
Degree or Award
Postsec Certs. & Dip.(< 1 yr)Public Institutions
(1)
478
(2)
733
(3)
355
(4)
381
(5)
434
(6)
289
(7)
305
(8) (9) (10)
349 14.43% 1.86%Private Institutions 0 37 0 27 0 0 0 0 0.00% 0.00%
Totals 478" 770 355 408 434 289 305 349 14.43% 1.86%
Postsec. Certs. & Dip.(> 1 yr)#Public Institutions 1,189 959 957 938 937 937 945 794 -15.984 4.24%Private Institutions 90 25 59 14 54 40 26 11 -57.69% 0.06%
Totals 1,279 984 1,016 952 991 977 971 805 -17.10% 4.30%
IIAssociate DegreesPublic Institutions 2,368 2,317 2,426 2,584 2,741 3,097 3,086 3,290 6.61% 17.56%Private Institutions '504 523 357 308 250 245 239 169 -29.29% 0.90%Totals 2,872 2,840 2,783 2,892 2,991 3,342 3,325 3,459 4.03% 18.46%
Bachelor DegreesPublic Institutions 5,201 5,315 5,264 5,573 5,707 5,794 5,703 5,892 3.31% 31.44%Private Institutions 4,676 4,944 4,897 5,097 5,378 5,025 4,966 5,015 0.99% 26.76%
rees
Totals 9,877 10,259 10,161 10,670 11,085 10,819 10,669 10,907 2.23% 58.20%
Master DegPublic Institutions 1,221 1,186 1,280 1,240 1,326 1,499 1,379 1,427 3.48% 7.61%Private Institutions 1,142 1,052 1,114 1,048 1,075 1,074 966 1,052 8.90% 5.61%
Degrees
Totals 2,363 2,238 2,394 2,288 2,401 2,573 2,345 2,479 5.71% 13.23%
DoctoratePublic Institutions 239 242 244 248 247 296 249 271 8.84% 1.45%Private Institutions 132 129 116 123 107 131 138 90 -34.78% 0.48%Totals 371 371 360 371 354 427 387 361 -6.72% 1.93%
1988-89Percent PercentChange Total
1982-83 1983-84 1984-85 1985-86 1986-87 1987-88 1988-89 1989-90 over AwardsNo. No. No. No. No. No. No. No. 1987-88 1989-90
Year
First Professional DegreesPublic Institutions 238 230 236 232 217 236 225 222 -1.33% 1.18%Private Institutions 137 159 143 129 129 142 151 158 4.64% 0.84%
Totals 375 389 379 361 346 378 376 380 1.06% 2.03%
Total Degrees & AwardsPublic InstitutionsPrivate InstitutionsTotals
10,934 10,982 10,762 11,196 11,609 12,148 11,892 12,245 2.97% 65.34%6,681 6,869 6,686 6,746 6,993 6,657 6,486 6,495 0.14% 34.66%17,615 17,851 17,448 17.942 18,602 18,805 18,378 18,740 1.97% 100.00%
Sources: HEGIS Reports, 1982-83 through 1985-86, and IPEDS 1986-87 through 1989-90.* Private institutions include: BYU, Westminster, and LDS Business College.# Postsec. Certs. & Dip.(> 1 yr) includes: 1 but < 2 yrs; 2 but < 4 yrs; Post Bachelor; Post Master.
FIGURE 1
1989-90 Degrees & Awards ConferredBy Public and Private Institutions
Bicneior 601,
SO WM IPEDS Completions 14
1

TABLE 2Postsecondary Certificates and Diplomas of Less Than One Year
for Public and Private Institutions1982-83 through 1989-90
Institutions
PUBLIC
University of UtahUtah State UniversityWeber State UniversitySouthern Utah UniversitySnow CollegeDixie CollegeCollege of Eastern UtahUtah Valley Community CollegeSalt Lake Community College
TOTAL PUBLIC
PRIVATE
Brigham Young UniversityWestminster CollegeLDS Business College
TOTAL PRIVATE
TOTAL PUBLIC & PRIVATE
1989-90 Percent% Change Total
1982-83 1983-84 1984-8 1985-86 1986-87 1987-88 1988-89 1989-90 over AwardsNo. No. No. No. No. No. No. No. 1988-89 1989-90
(1)
0
0
00
1000
27441
478
37
(2) (3)
0 0
0 0
0 0
0 0
0 0
302 0
0 015 10
416 345
733 355
0 0 0 0
0 0 0 0
0 37 0 27
478 770 355 408 434 289 305 349
0 27
(4) (5) (6) (7) (8)
0 0 0 0 0
0 0 0 0 0
0 0 0 0 0
0 0 0 0 0
2 4 9 o oo 44 o o oo 34 o o o
27 14 21 38 41
352 338 259 267 308
381 434 289 305 349
0 0
o
0
(9) (10)
9.00%0.00%0.00%0.00%0.00%0.00%0.00%7.89%15.36%
0.00%0.00%0.00%0.00%0.00%0.00%0.00%11.75%88.25%
14.43% 100.00%
0.00%0.00%0.00%
0.00%0.00%0.00%
0.00% 0.00%
14.43% 100.00%
====
1
111
1
TABLE 3Postsecondary Certificates and Diplomas of Greater Than One Year but Less Than Four Years *
for Public and Private Institutions1982-83 through 1989-90
Institutions
PUBLIC
University of UtahUtah State UniversityWeber State UniversitySouthern Utah UniversitySnow CollegeDixie CollegeCollege of Eastern UtahUtah Valley Community CollegeSalt Lake Community College
TOTAL PUBLIC
PRIVATE
Brigham Young UniversityWestminster CollegeLDS Business College
TOTAL PRIVATE
51
1449977
4017022
49195
1982-83 1983-84 1984-85 1985-86 1986-87 1987-88 1988-89 1989-90No. No. No. No. No. No. No. No.
(1) (2) (3) (4) (5) (6) (7)
0119825024
90
71
416107
66929731
3512757
37379
0 0 0
0 0 0
90 25 59
6273
9334
19
111
53
361
132
1,189 959 957 938 937 937 945
90 25 59 14
8810531
16
11843358178
9361
41154
26658282117
1053432
15
2027964
292104
5 o o oo o o o9 54 40 26
54 40 26
TOTAL PUBLIC & PRIVATE 1.279 984 1,016 952 991 977 971
(8) (9)
11
1989-90% Change
over1988-89
0.00%0.00%
-57.69%
i11 -57.69%
805 -17.10%
5
110 4.76%2 52.94%
34 6.25%7 -53.33%
11 -45.00%189 -32.26%51 -20.31%265 -9.25%75 -27.88%
794 -15.98%
-- -Sources: HEGIS Reports, 1982-83 through 1985-86, and IPEDS 1986-87 through 1989-90.
* Postsec. Certs. & Dip.(> 1 yr) includes: 1 but < 2 yrs; 2 but < 4 yrs; Post Bachelor's
152
PercentTotalAwards1989-90
(10)
13.66%6.46%4.22%0.87%1.37%23.48%6.34%32.92%9.32%
98.63%
111
0.00% I0.00%1.37%
1.37%
100.00%
Degrees; Post Master's Degree

TABLE 4Associate Degrees for Public and Private Institutions
1982-83 through 1989-90
Institutions
PUBLIC
1982-83No.
(1)
1983-84No.
(2)
1984-85No.
(3)
1985-86No.
(4)
1986-87No.
(5)
1987-88No.
(6)
1988-89No.
(7)
1989-90No.
(8)
1989-90% Change
over .
1988-89
(9)
PercentTotalAwards1989-90
(10)
University of Utah 3 5 1 1 0 0 1 0 -100.00% 0.00%Utah State University 0 0 I 3 1 2 43 45 4.65% 1.30%Weber State University 686 678 691 695 681 739 887 855 -3.61% 24.72%Southern Utah University 34 42 62 57 77 78 61 77 26.23% 2.23%Snow College 263 177 236 261 252 270 268 339 26.49% 9.80%Dixie College 327 310 264 305 374 390 431 428 -0.70% 12.37%College of Eastern Utah 117 128 140 138 145 170 187 227 21.39% 6.56%Utah Valley Community College 529 508 410 545 627 584 569 649 14.06% 18.76%Salt Lake Community College 409 469 621 579 584 864 639 .670 4.85% 19.37%
TOTAL PUBLIC 2,368 2,317 2,426 2,584 2,741 3,097 3,086 3,290 6.61% 95.11%
PRIVATE
Brigham Young University 383 419 265 194 86 97 95 51 -46.32% 1.47%Westminster College 0 0 0 0 0 0 0 0 0.00% 0.00%LDS Business College 121 104 92 114 164 148 144 118 -18.06% 3.41%
TOTAL PRIVATE 504 523 357 308 250 245 239 169 -29.29% 4.89%
TOTAL PUBLIC & PRIVATE 2,872 2,84D 2,783 2,892 2,991 3,342 3,325 3,459 4.03% 100.00%
W = W =
TABLE 5Bachelor Degrees for Public and Private Institutions
1982-83 through 1989-90
1989-90% Change
PercentTotal
1982-83 1983-84 1984-85 1985-86 1986-87 1987-88 1988-89 1989-90 over AwardsInstitutions No. No. No. No. No. No. No. No. 1988-89 1989-90
PUBLIC (1) (2) (3) (4) (5) (6) (7) (8) (9) (10)
University of Utah 2,472 2,547 2,43 2,653 2,639 2,806 2,806 2,830 0.86% 25.95%Utah State University 1,426 1,473 1,49 1,465 1,576 1,476 1,348 1,437 6.60% 13.18%Weber State University 1,003 987 99 1,104 1,044 1,071 1,117 1,15'.-. 3.40% 10.59%Southern Utah University 300 30 33 351 448 441 432 47 8.80% 4.31%Snow College 0 0 0 0 0 n.00% 0.00%Dixie College 0 0 0 0 0 0.00% 0.00%College of Eastern Utah 0 0 0 0 0 0.00% 0.00%Utah Valley Community College u 0 0 0 0 0.00% 0.00%Salt Lake Community College 0 0 0 0 0 0.00% 0.00%
TOTAL PUBLIC 5,201 5,315 5,264 5,573 5,707 5,794 5,703 5,892 3.31% 54.02%
PRIVATE
Brigham Young University 4,502 4,769 4,732 4,918 5,150 4,769 4,726 4,757 0.66% 43.61%Westminster College 174 175 165 179 228 256 240 258 7.50% 2.37%LDS Business College 0 0 0 0 0 0 0 0 0.00% 0.00%
TOTAL PRIVATE 4,676 4,944 4,897 5,097 5,378 5,025 4,966 5,015 0.99% 45.98%
TCTAL PUBLIC & PRIVATE 9,877 10,259 10,161 10,670 11,085 10,819 10,669 10,907 2.23% 100.00%
Sources: HEGIS Reports, 1982-83 through 1985-86, and IPEDS 1986-87 through 1989-90.
3

TABLE 6Master Degrees for Public and Private Institutions
1982-83 through 1988-89
Institutions
PUBLIC
1982-83 1983-84No. No.
(1) (2)
1984-85No.
(3)
1985-86No.
(4)
1986-87 1987-88No. No.
(5) (6)
1988-89No.
(7)
1989-90No.
(8)
1989-90% Changeover
1988-89
(9)
PercentTotalAwards1989-90
(10)
University of Utah 758 720 798 768 80 842 746 792 6.17% 31.95%
Utah State University 429 430 460 438 47 597 589 572 -2.89% 23.07%
Weber State University 24 36 22 32 3 51 40 47 17.50% 1.90%
Southern Utah University 0 2 9 4 16 300.00% 0.65%
Snow College 0 0 0 0 0 0 0.00% 0.00%
Dixie College 0 0 0 0 0 0.00% 0.00%
College of Eastern Utah 0 0 0 0 0 0 0.00% 0.00%
Utah Valley Community College 0 0 0 0 0 0.00% 0.00%
Salt Lake Community College 0 0 0 0 0 0 0.00% 0.00%
TOTAL PUBLIC 1,221 1,186 1,280 1,240 1,326 1,499 1,379 1,427 3.48% 57.56%
PRIVATE
Brigham Young University 1,103 1,012 1,092 1,013 1,040 1,033 902 979 8.54% 39.49%
Westminster College 39 40 22 35 35 41 64 73 14.06% 2.94%
LDS Business College 0 0 0 0 0 0 0 0 0.00% 0.00%
TOTAL PRIVATE 1,142 1,052 1,114 1,048 1,075 1,074 966 1,052 8.90% 42.44%
TOTAL PUBLIC & PRIVATE 2,363 2,238 2,394 2,288 2,401 2,573 2,345 2,479 5.71% 100.00%
TABLE 7Doctorates for Public and Private Institutions
1
1
1982-83 through 1989-90
1989-90 Percent% Change Total
1982-83 1983-84 1984-85 1985-86 1986-87 1987-88 1988-89 1989-90 over Awards
Institutions No. No. No. No. No. No. No. No. 1988-89 1989-90
PUBLIC (1) (2) (3) (4) (5) (6) (7) (8) (9) (10)
University of Utah 16 16 17 188 176 21 17 19 14.37% 55.12%
Utah State University 7 8 6 6 71 7 7 7 -4.00% 19.94%
Weber State University 0.00% 0.00%
Southern Utah University 0.00% 0.00%
Snow College 0.00% 0.00%
Dixie College 0.00% 0.00%
College of Eastern Utah 0.00% 0.00%
Utah Valley Community College 0.00% 0.00%
Salt Lake Community College 0.00% 0.00%
TOTAL PUBLIC 239 242 244 248 247 296 249 271 8.84% 75.07%
PRIVATE
Brigham Young University 132 129 116 123 107 131 138 90 -34.78% 24.93%
Westminster College 0 0 0 0 0 0 0 0 0.00% 0.00%
LDS Business College 0 0 0 0 0 0 0 0 0.00% 0.00%
TOTAL PRIVATE 132 129 116 123 107 131 138 90 -34.78% 24.93%
TOTAL PUBLIC & PRIVATE 371 371 360 371 354 427 387 361 -6.72% 100.00%
Sources: HEGIS Reports, 1982-83 through 1985-86, and IPEDS 1986-87 through 1989-90.
17
4

TABLE 8First Professional Degrees for Public and Private Ir.titutions
Institutions
PUBLIC
1982-83No.
(1)
1983-84No.
(2)
1982-83 through 1989-90
1984-85 1985-86 1986-87 1987-88No. No. No. No.
(3) (4) (8) (6)
1988-89No.
(7)
1989-90No.
(8)
1989-904 Change
over1988-89
(9)
PercentTotalAwards1989-90
(10)
University of UtahLaw (J.D.) 128 125 128 122 111 120 120 123 2.50% 32.37%Medicine (M.D.) 105 101 99 101 98 100 99 96 -3.03% 25.26%Pharmacy (D. Pharm.) 5 4 9 9 8 16 6 3 -50.00% 0.79%
TOTAL eUBLIC 238 230 236 232 217 236 225 222 -1.33% 58.42%
PRIVATE
Brigham Yourg UniversityLaw (J.D.) 137 159 143 129 129 142 151 158 4.64% 41.58%
TOTAL PRIVATE 137 159 143 129 129 142 151 158 4.64% 41.58%
IOTAL PUBLIC & PRIVATE 375 389 379 361 346 378 376 380 1.06% 100.00%
Sources: HEGIS Reprts, 1982-83 through 1985-86, and 1PEDS 1986-87 through 1989-90.
FIGURE 2
1989-90 Degrees & Awards ConferredBy Public and By Private Institutions
Type of Degree
Cert. <1 Yr -1.11
Cert. >1 Yr
Associate
Bachelor
Master
Doctor
1st Prof.IM Public MI Privati
0 1 2 3 4 5 6 7
Number (Thousands)9oUrce: 1989-90 !beds Completions
135

TABLE 9Utah System of Higher Education
Degrees and Awards by Gender for 1989-90
Type of Degree or Award
Postsec. Certs. & Dip.(< 1 yr)
UofU USU WSU
Institutions
SUU SNOW DIXIE CEU UVCC SLCC
TOTAL
No. Percent
Male 0 0 0 0 0 0 0 38 87 ,25 35.82%Female 0 0 0 0 0 0 0 3 221 224 64.18%Total 0 0 0 0 0 0 0 41 308 349 100.00%
Postsec. Certs. & Dip.(> 1 yr)*Male 56 36 3 2 4 104 5 98 54 362 45.59%Female 54 16 31 5 7 85 46 167 21 432 54.41%Total 110 52 34 7 11 189 51 265 75 794 100.00%
Associate DegreesMale 0 13 276 26 127 208 84 366 420 1.520 46.20%Female 0 32 579 51 212 220 143 283 250 1,770 53.80%Total 0 45 855 77 339 428 227 649 670 3,290 100.00%
Bachelor DegreesMale 1,599 796 643 234 0 0 0 0 0 3.272 55.53%Female 1.231 641 512 236 0 0 0 0 0 2,620 44.47%Total 2.830 1.437 1.155 470 0 0 0 0 0 5,892 100.00%
Master DegreesMale 422 367 22 13 0 0 0 0 0 824 57.74%Female 370 205 25 3 0 0 0 0 0 603 42.26%Total 792 572 47 16 0 0 0 0 0 1,427 100.00%
Doctorate DegreesMale 135 53 0 0 0 0 0 0 0 188 69.37%Female 64 19 0 0 0 0 0 0 0 83 30.63%Total 199 72 0 0 0 0 0 0 0 271 100.00%
First Professional DegreesMale 153 0 0 0 0 0 0 0 0 153 68.92%Female 69 0 0 0 0 0 0 0 0 69 31.08%Total 222 0 0 0 0 0 0 0 0 222 100.00%
Total Degrees & AwardsMale 2.365 1,265 944 275 131 312 89 502 561 6,444 52.63%Female 1,788 913 1.147 295 219 305 189 453 492 5,801 47.37%Total 4,153 2,178 2.091 570 350 617 278 955 1,053 12.245 100.00%
Institutional PercentDegrees and Awards Total 33.92% 17.79% 17.08% 4.65% 2.86% 5.04% 2.27% 7.80% 8.60% 100.00%
Sources: HEGIS Reports, 1982-83 through 1985-86, and IPEDS 1986-87 through 1989-90.* Postsec. Certs. & Dip.(> 1 yr) includes: 1 but < 2 yrs, 2 but < 4 yrs; Post Bachelor; Post Master.
FIGURE 31989-90 Degrees & Awards Conferred
By USHE Schools
USU
SeU: S30%.,
Sourer: tellf-110 IPE011 Completions
SLCC91
tivCCSS
CEUDizte 21&
FIGURE 41989-90 Degrees & Awards Conferred
By Gender USHE Schools
Mal e6,444 53%
SIOWOO: 111.91PIEDS Goo ltions
Female5,801 47%
6

L TAB B
TABLE 1
FIGURE 1
System Totals
System Totals
2
3
TABLE 2 University of Utah Total Institution 4
FIGURE 2 University of Utah Total Institution 5
TABLE 3 University of Utah Education & General 6
TABLE 4 University of Utah Medical School 7
TABLE 4a "University of Utah Medical School (Non MD) 8
TABLE 5 Utah State University Total Institution 10
FIGURE 3 Utah State University Total Institution 11
TABLE 6 Utah State University Education & General 12
TABLE 7 Utah State University SE Utah Center 13
TABLE 8 Utah State University Uintah Center 14
TABLE 9 Weber State University 16
FIGURE 4 Weber State University 17
TABLE 10 Southern Utah University 18
FIGURE 5 Southern Utah University 19
TABLE 10a Southern Utah University (Non SCH Generating) 20
TABLE 11 Snow College 22
FIGURE 6 Snow College 23
TABLE 12 Dixie College 24
FIGURE 7 Dixie College 25
4.4. 0

TABLE 13
FIGURE 8
TABLE 14
TABLE 15
TABLE 16
FIGURE 9
TABLE 17
FIGURE 10
TABLE 17a
TABLE 18
FIGURE 11
FIGURE 12
FIGURE 13
FIGURE 14
TABLE 19
TABLE 20
FIGURE 15
FIGURE 16
FIGURE 17
FIGURE 18
TAB BENROLLMENTS
--Continued--
College of Eastern Utah .... Total Institution 26
College of Eastern Utah .... Total Institution 27
College of Eastern Utah ... . Education & General 28
College of Eastern Utah ... . San Juan Center 29
Utah Valley Community College 30
Utah Valley Community College 31
Salt Lake Community College Total Institution 32
Salt Lake Community College Total Institution 33
Salt Lake Community College (Non SCH Generating) 34
Institutional Share of Market Fall Headcount and Annualized FTE 35
USHE 1989-90 Enrollment Market Shares 36
USHE FTE Makeup 36
USHE Growth from 1979-80 to 1989-90 37
USHE Growth from 1989-90 to 1999-00 37
Skills Center 38
Academic-General & Vocational-Technical Headcount Fall 1990 . . 39
Academic-General & Vocational-Technical FTE's Fall 1990 40
Headcount Enrollment by Course Level Fall 1990 41
FTE Enrollment by Course Level Fall 1990 41
Headcount Enrollment by Residency Fall 1990 42
FTE Enrollment by Residency Fall 1990 42
21
TAB BENROLLMENTS
--Continued--
TABLE 21 3 Year History of Academic-General & Vocational-TechnicalFall Headcount 43
FIGURE 19 Vocational-Technical Headcount & FTE by Institution 43
TABLE 22 13-Year History of Academic-General & Vocational-TechnicalFTE's 44
FIGURE 20 13-Year History of Academic-General & Vocational-TechnicalFTE's 44

ENROLLMENT HISTORY,MANAGEMENT TARGETS,
AND PROJECTIONSFROM
1977-78 TO 1999-00
1,4 3

1
Table 1UTAH SYSTEM OF HIGHER EDUCATION
Enrollment History, Management Targets, and Projections from 1977-78 to 1999-00
-- System Total --
Year Res
ACTUALS:
Fall Headcount
Nonres Total Res
Fall FTE
Nonres Total Res
Academic Year
Nonres Total
Annualized Year
II/Res Nonres Total
1977-78 48,665 8,487 57,152 38,404 8,604 47,008 35,680 8,060 43,740 39,164 8,408 47,572
1978-79 48,476 8,430 56,906 37,113 8,411 45,524 34,552 7,839 42,391 37,901 8,188 46,089
1979-80 49,629 8,352 57,981 38,733 8,373 47,106 36,685 7,774 44,459 40,059 8,179 48,238
1980-81 53,559 7,913 61,472 42,134 7,904 50,038 40,157 7,338 47,495 43,900 7,746 51,646
1981-82 55,805 7,645 63,450 43,743 7,349 51,092 41,742 6,756 48,498 45,611 7,091 52,703
1982-83 60,186 7,228 67,414 46,599 6,819 53,418 44,755 6,279 51,034 48,716 6,635 55,351
1983-84 64,009 6,899 70,908 48,921 6,416 55,337 45,944 5,846 51,790 50,255 6,222 56,477
1984-85 63,770 6,445 70,215 48,643 5,831 54,474 45,813 5,361 51,174 50,000 5,666 55,666
1985-86 65,162 6,391 71,553 48,617 5,515 54,132 45,796 4,963 50,759 50,160 5,340 55,500
1986-87 67,811 6,139 73,950 50,065 5,290 55,355 47,206 4,829 52,036 51,779 5,193 56,972
1987-88 69,827 6,299 76,126 50,964 5,334 56,298 47,789 4,763 52,552 52,470 5,164 57,634
1988-89 69,836 6,163 75,999 51,395 5,244 56,640 48,780 4,753 53,534 53,445 5,162 58,606
1989-90 74,501 6,661 81,162 54,355 5,672 60,027 51,668 5,147 56,813 56,722 5,647 62,368
1990-91
Funded Target: 62,506
Projected (a)
76,835 6,415 83,250 56,365 5,465 61,830 53,805 4,965 58,770 59,015 5,415 64,430
Actual 79,757 7,946 87,703 56,925 6,646 63,571
Revised Estimates (b): 54,981 6,033 61,014 60,335 6,617 66,952
PROJECTED
1991-92 83,800 6,540 90,340 60,980 5,580 66,560 57,890 5,070 62,960 63,560 5,530 69,090
1992-93 85,190 6,540 91,730 62,000 5,580 67,580 58,840 5,070 63,910 64,580 5,530 70,110
1993-94 86,290 6,540 92,830 62,810 5,580 68,390 59,590 5,070 64,660 65,420 5,530 70,950
1994-95 88,460 6,540 95,000 64,410 5,580 69,990 61,110 5,070 66,180 67,070 5,530 72.600
1995-96 92,240 6,540 98,780 67,140 5,580 72,720 63,710 5,070 68,780 69,920 5,530 75,450
1996-97 93,450 6,540 99,990 68,010 5,580 73,590 64,530 5,070 69,600 70,840 5,530 76,370
1997-98 96,380 6,540 102,920 70,150 5,580 75,730 66,570 5,070 71,640 73,060 5,530 78,590
1998-99 98,410 6,540 104,950 71,600 5,580 77,180 67,950 5,070 73,020 74,580 5,530 80,110
1999-00 98,460 6,540 105,000 71,620 5,580 77,200 67,970 5,070 73,040 74,620 5,530 80,150
(a) Enrollment Market Projections based on an Enrollment Demand Model and the Enrollment Management Model.
(b) Revised estimates based on actual 1990-901 Summer and Fall Quarter enrollment data.
2

FIGURE 1
CUMULATIVE ENROLLMENT LEVELS
110
100
90
SO
70
60
50
40
1977-78
0 FALL HOCT
UTAH SYSTEM OF HIGHER EDUCATIONENROLLMENT HISTORY AND PROJECTIONS
Li
1
1990-91 1993-94 1996-97 1999-90 1992-93 1995-96 1999-99
+ FALL FTEYEAR
AC FTE A AY FTE
ANNUAL GROWTH RATES (FTE)
2295
20%
1895
16%
14%
12%
10%
8%
6%
4%
2%
096
2%
9%
6%
UTAH SYSTEM OF HIGHER EDUCATIONENROLLMENT HISTORY AND PROJECTIONS
miillE'Mr.drA,111111116EIN
PPMINIM r.-
8%
1.11K
197G-79 1981-92 1984-95 1987-98
YEAR
1990-91. s
1993-94 1996-97 1999-00
3

TABLE 2
UTAH SYSTEM OF HIGHER EDUCATION
Enrollment History, Management Targets, and Projections from 1977-78 to 1999-00
-- University of Utah --
Total Institution
Year Res
ACTUALS:
Fall Headcount
Nonres Total Res
Fall FTE
Nonres Total Res
Academic Year
Nonres Total Res
Anwlized Year
Nonres Total
1977-78 18,762 3,118 21,880 15,648 3,083 18,731 14,575 2,869 17,444 15,987 3,106 19,093
1978-79 18,431 3,013 21,444 15,095 2,979 18,074 14,102 2,774 16,876 15,394 2,980 18,374
1979-80 19,059 2,933 21,992 15,405 2,858 18,263 14,690 2,634 17,324 15,966 2,853 18,818
1980-81 20,449 2,521 22,970 16,336 2,383 18,719 15,418 2,196 17,614 16,778 2,378 19,156
1981-82 20,898 2,475 23,373 16,693 2,272 18,965 15,758 2,037 17,795 17,049 2,181 19,230
1982-83 22,068 2,296 24,364 17,200 2,096 19,296 16,450 1,933 18,383 17,771 2,084 19,855
1983-84 22,652 2,259 24,911 17,530 2,060 19,590 16,483 1,934 18,417 17,803 2,094 19,897
1984-85 22,759 2,12? 24,886 17,610 1,894 19,504 16,567 1,786 18,353 17,919 1,922 19,841
1985-86 22,899 2,261 25,160 17,477 1,933 19,410 16,258 1,815 18,073 17,695 2,011 19,706
1986-87 22,886 2,276 25,162 17,211 1,918 19,129 16,056 1,818 17,874 17,446 1,993 19,439
1987-88 22,169 2,442 24,611 17,076 2,110 19,186 15,918 1,910 17,828 17,348 2,119 19,467
1988-89 21,601 2,445 24,046 16,684 2,122 18,806 15,623 1,944 17,567 17,058 2,159 19,217
1989-90 21,865 2,567 24,432 16,867 2,134 19,001 15,915 1,950 17,865 17,420 2,210 19,629
1990-91
Funded Target: 19,757
Projected (a)
22,055 2,505 24,560 17,035 2,125 19,160 15,985 1,955 17,940 17,475 2,185 19,660
Actual 22,369 3,056 25,425 17,350 2,562 19,912
Revised Estimates (b): 16,291 2,336 18,627 17,772 2,583 20,355
PROJECTED
1991-92 23,130 2,510 25,640 17,880 2,130 20,010 16,780 1,960 18,740 18,340 2,190 20,530
1992-93 23,160 2,510 25,670 17,910 2,130 20.040 16,800 1,960 18,760 18,360 2,190 20,550
1993-94 23,150 2,510 25,660 17,900 2,130 20,030 16,790 1,960 18,750 18,350 2,190 20,540
1994-95 23,310 2,510 25,820 18,020 2,130 20,150 16,900 1,960 18,860 18,480 2,190 20,670
1995-96 23,710 2,510 26,220 18,320 2,130 20,450 17,190 1,960 19,150 18,790 2,190 20,980
1996-97 24,270 2,510 26,780 18,750 2,130 20,880 17,590 1,960 19,550 19,230 2,190 21,420
1997-98 24,600 2,510 27,110 19,000 2,130 21,130 17,830 1,960 19,790 19,490 2,190 21,680
1998-99 24,540 2,510 27,050 18,950 2,130 21,080 17,780 1,960 19,740 19,440 2,190 21,630
1999-00 24,730 2,510 27,240 19,100 2,130 21,230 17,920 1,960 19,680 19,590 2,190 21,780
(a) Enrollment Market Projections based on an Enrollment Demand Model and the Enrollment Management Model.
(b) Revised estimates based on actual 1990-901 Summer and Fall Quarter enrollment data.
4
I.
I

FIGURE 2
CUMULATIVE ENROLLMENT LEVELS
28
27
28
25
24
23
22
21
20
19
'18
17
16
UNIVERSITY OF UTAHENROLLMENT HISTORY AND PROJECTIONS
I
1977-78
0 Fall HOCT
1990- 01 1993-84 1996-67 1999-90
+ Fetil PTEYEAR
1992-93
AC FTE
1995-96 1996-99
AY PTE
ANNUAL GROWTH RATES (FTE)
22%
20%
19%
16%
14%
12%
10%
8%
6%
4%
2%
0%
2%
-4%
-6%
13%
UNIVERSITY OF UTAHENROLLMENT HISTORY AND PROJECTIONS
-18%1978-79 19E1-92 1994-95 1997-99 1990-91
YEAR
,
1993-94'
1996-97 1999-00
5
(47

TABLE 3UTAH SYSTEM OF HIGHER EDUCATION
Enrollment History, Management Targets, and Projections from 1977-78 to 1999-00
-- University of Utah --
Education and General
Fall Headcount Fall FTE Academic Year Annualized Year
Year Res Nonres Total Res Nonres Total Res Nonres Total Res Nonres Total
ACTUALS: I1977-78 18,427 3,060 21,487 15,313 3,025 18,338 14,240 2,811 17,051 15,652 3,048
1978-79 18,101 2,944 21,045 14,765 2,910 17,675 13,772 2,705 16,477 15,064 2,911
1979-80 18,742 2,861 21,603 15,088 2,786 17,874 14,373 2,562 16,935 15,649 2,781
1980-81 20,122 2,460 22.582 16,009 2,322 18,331 15,091 2,135 17,226 16,451 2,317
1981-82 20,572 2,404 22,976 16,367 2,201 18,568 15,432 1,966 17,398 16,723 2,110
1982-83 21,735 2,228 23,963 16,867 2,028 18,895 16,117 1,865 17,982 17,438 2,016
1983-84 22,310 2,196 24,506 17,188 1,997 19,185 16,141 1,871 18,012 17,461 2,031
1984-85 22,426 2,064 24,490 17,277 1,831 19,108 16,234 1,723 17,957 17,586 1,859
1985-86 22,567 2,198 24,765 16,999 1,813 18,812 15,825 1,702 17,527 17,257 1,896
1986-87 22,561 2,212 24,773 16,755 1,811 18,566 15,623 1,712 17,335 17,008 1,884
1987-88 21,837 2,374 24,211 16,593 1,989 18,582 15,471 1,792 17,263 16,896 2,000
1988-89 21,269 2,379 23,648 16,184 1,992 18,176 15,154 1,829 16,983 16,584 2,038
1989-90 21,527 2,507 24,034 16,334 1,993 18,327 15,421 1,822 17,243 16,917 2,079
1990-91
Funded Target:
Projected (a)
21,720 2,440 24,160 16,500 1,990 18,490 15,500 1,820 17,320 16,980 2,050
Actual 22,017 3,003 25,020 16,782 2,416 19,198
Revised Estimates (b): 15,768 2,206 17,974 17,242 2,448
PROJECTED
1991-92 92,790 2,450 25,240 17,310 2,000 19,310 16,270 1,830 18,100 17,820 2,060
1992-93 22,820 2,450 25,270 17,340 2,000 19,340 16,290 1,830 18,120 17,840 2,060
1993-94 22,810 2,450 25,260 17,330 2,000 19,330 16,280 1,830 18,110 17,830 2,060
1994-95 22,970 2,450 25,420 17,450 2,000 19,450 16,390 1,830 18,220 17,960 2,060
1995-96 23,370 2,450 25.820 17,750 2,000 19,750 16,680 1,830 18,510 18,270 2,060
1996-97 23,930 2,450 26,380 18,180 2,000 20,180 17,080 1,830 18,910 18,710 2,060
1997-98 24,260 2,450 26,710 18,430 2,000 20,430 17,320 1,830 19,150 18,970 2,060
1998-99 24,200 2,450 26,650 18,380 2,000 20,380 17,270 1,830 19,100 18,920 2,060
1999-00 24,390 2,450 26,840 18,530 2,000 20,530 17,410 1,830 19,240 19,070 2,060
18,700
17,975
18,429
18,768 I18,833
19,454
19,492 i19,445
19,153
18,892 II18,896
18,622
18,996
I19,182
I19,030
I19,690
I19,880
19,900
19,890
20,020
I20,330
20,770
21,030
20,980 I21,130
(a) Enrollment Market Projections based on an Enrollment Demand Model and the Enrollment Management Model.
(b) Revised estimates based on actual 1990-901 Summer and Fall Quarter enrollment data.
28

1
1
TABLE 4UTAH SYSTEM OF HIGHER EDUCATION
Enrollment History, Management Targets, and Projections from 1977-78 to 1999-00
-- University of Utah --
Medical School (MD)
Year Res
ACTUALS:
Fall Headcount
Nonres Total Res
Fall FTE
Nonres Total Res
Academic Year
Nonres Total Res
Annualized Year
Nonres Total
1977-78 335 58 393 335 58 393 335 58 393 335 58 393
1978-79 330 69 399 330 69 399 330 69 399 330 69 399
1979-80 317 72 389 317 72 389 317 72 389 317 72 389
1980-81 327 61 388 327 61 388 327 61 388 327 61 388
1981-82 326 71 397 326 71 397 326 71 397 326 71 397
1982-83 333 68 401 333 68 401 333 68 401 333 68 401
1983-84 342 63 405 342 63 405 342 63 405 342 63 405
1984-85 333 63 396 333 63 396 333 63 396 333 63 396
1985-86 332 63 395 332 63 395 332 63 395 332 63 395
1986-87 325 64 389 325 64 389 325 64 389 325 64 389
1987-88 332 68 400 332 68 400 334 67 401 334 67 401
1988-89 332 66 398 332 66 398 333 60 393 333 63 396
1989-90 338 60 398 338 60 398 339 57 396 340 57 397
1990-91
Funded Target: 400
Projected (a)
335 65 400 335 65 400 335 65 400 335 65 400
Actual 352 53 405 352 53 405
Revised Estimates (6): 352 48 400 352 48 400
PROJECTED
1991-92 340 60 400 340 60 400 340 60 400 340 60 400
1992-93 340 60 400 340 60 400 340 60 400 340 60 400
1993-94 340 60 400 340 60 400 340 60 400 340 60 400
1994-95 340 60 400 340 60 400 340 60 400 340 60 400
1995-96 340 60 400 340 60 400 340 60 400 340 60 400
1996-97 340 60 400 340 60 400 340 60 400 340 60 400
1997-98 340 60 400 340 60 400 340 60 400 340 60 400
1998-99 340 60 400 340 60 400 340 60 400 340 60 400
1999-00 340 60 400 340 60 400 34C 60 400 340 60 400
(a) Enrollment Market Projections based on an Enrollment Demand Model and the Enrollment Management Model.
(b) Revised estimates based on actual 1990-901 Summer and Fall Quarter enrollment data.
7

TABLE 4aUTAH SYSTEM OF HIGHER EDUCATION
Enrollment History, Management Targets, and Projections from 1977-78 to 1999-00
-- University of Utah --
Medical School (Non MD)
Fall Headcount
Year Res Nonres Total
ACTUALS:
1977-78
1978-79
1979-80
1980-81
1981-82
1982-83
1983-84
1984-85
Res
Fall FTE
Nonres Total
Academic Year
Res Nonres Total Res
Annualized Year
Nonres Total
1985-86 146 57 203 101 50 151 106 52 158
1986-87 131 43 174 108 43 151 113 45 158
1987-88 151 53 204 113 51 164 118 52 170
1988-89 168 64 232 136 55 191 141 58 199
1989-90 195 81 276 155 71 226 163 74 236
1990-91
Funded Target: 175
Projected (a)
200 70 270 150 70 220 160 70 230
Actual 216 93 309
Revised Estimates (b): 171 82 253 178 87 265
PROJECTED
1991-92 230 70 300 170 70 240 180 70 250
1992-93 230 70 300 170 70 240 180 70 250
1993-94 230 70 300 170 70 240 180 70 250
1994-95 230 70 300 170 70 240 180 70 250
1995-96 230 70 300 170 70 240 180 10 250
1996-97 230 70 300 170 70 240 180 70 250
1997-98 230 70 300 170 70 240 180 70 250
1998-99 230 70 300 170 70 240 180 70 250
1999-00 230 70 300 170 70 240 180 70 250
(a) Enrollment Market Projections based on an Enrollment Demand Model and the Enrollment Management Model.
(b) Revised estimates based on actual 1990-901 Sumer and Fall Quarter enrollment data.
NOTE: Fall quarter headcount included in E & G
8 ao

TABLE 5UTAH SYSTEM OF HIGHER EDUCATION
Enrollment History, Management Targets, and Projections from 1977-78 to 1999-00
-- Utah State University --
Total Institution
Year Res
ACTUALS:
Fall Headcount
Nonres Total Res
Fall FTE
Nonres Total Res
Academic Year
Nonres Total Res
Annualized Year
Nonres Total
1977-78 6,596 3,456 10,052 5,965 3,575 9,540 5,586 3,379 8,965 6,350 3,379 9,729
1978-79 6,619 3,224 9,843 5,812 3,243 9,055 5,398 3,022 8,420 6,134 3,022 9,156
1979-80 6,801 3,074 9,875 6,136 3,110 9,246 5,861 2,947 8,808 6,615 2,947 9,562
1980-81 7,495 3,085 10,580 6,720 3,143 9,863 6,524 2,982 9,506 7,377 2,982 10,359
1981-82 7,945 3,001 10,946 7,014 2,894 9,908 6,721 2,752 9,473 7,613 2,752 10,365
1982-83 8,938 2,866 11,804 7,408 2,649 10,057 7,200 2,489 9,689 8,064 2,489 10,553
1983-84 11,227 2,673 13,900 8,272 2,400 10,672 7,751 2,198 9,949 8,791 2,198 10,989
1984-85 10,828 2,400 13,228 8,034 2,120 10,154 7,697 1,961 9,658 8,702 1,961 10,663
1985-86 10,992 2,145 13,137 7,953 1,792 9,745 7,709 1,616 9,325 8,690 1,616 10,306
1986-87 11,342 2,000 13,342 8,113 1,687 9,800 7,715 1,573 9,288 8,780 1,573 10,353
1987-88 11,968 1,953 13,921 8,209 1,604 9,813 7,831 1,501 9,332 8,896 1,501 10.397
1988-89 12,248 1,988 14,236 8,441 1,645 10,086 8,057 1,530 9,587 9,101 1,530 10,631
1989-90 12,312 2,049 14,361 8,832 1,729 10,561 8,544 1,595 10,139 9,610 1,595 11,205
1990-91
Funded Target: 11,144
Projected (a)
12,930 2,010 14,940 9,080 1,680 10,760 8,730 1,560 10,290 9,840 1,560 11,400
Actual 13,253 2,319 15,572 9,560 1,953 11,513
Revised Estimates (b): 9,186 1,811 10,997 10,359 1,811 12,170
PROJECTED
1991-92 14,350 2,010 16,360 10,080 1,680 11,760 9,700 1,560 11,260 10,940 1,560 12,500
1992-93 14,530 2,010 16,540 10,210 1,680 11,890 9,830 1,560 11,390 11,080 1,560 12,640
1993-94 14,590 2,010 16,600 10,260 1,680 11,940 9,870 1,560 11,430 11,130 1,560 12,690
1994-95 14,920 2,010 16,930 10,500 1,680 12,180 10,100 1,560 11,660 11,390 1,560 12,950
1995-96 15,410 2,010 17.420 10,850 1,680 12,530 10,440 1,560 12,000 11,770 1,560 13,330
1996-97 15,560 2,010 17,570 10,960 1,680 12,640 10,540 1,560 12,100 11,890 1,560 13,450
1997-98 16,130 2,010 18,140 11,370 1,680 13,050 10,940 1,560 12,500 12,340 1,560 13,900
1998-99 16,580 2.010 18,590 11,700 1,680 13,380 11,250 1,560 12,810 12,690 1,560 14,250
1999-00 16,550 2,010 18,560 11,670 1,680 13,350 11,230 1,560 12,790 12,670 1,560 14,230
(a) Enrollment Market Projections based on an Enrollment Demand Model and the Enrollment Management Model.
(b) Revised estimates based on actual 1990-901 Summer and Fall Quarter enrollment data.
NOTE: 1990-91 Funded Target increased by 60 for previously unreported independent study program.
1
1

FIGURE 3
CUMULATIVE ENROLLMENT LEVELS
19
18
17
16
15
14
13
12
11
10
UTAH STATE UNIVERSITYENROLLMENT HISTORY AND PROJECTIONS
.1977-78
0 Fell MOCT
1980-81 1983-84 1906-87 1989-90
+ Fail FTEYEAR
1992-93
O AC FTE
1995-96 19SG-99
A AY FTE
ANNUAL GROWTH RATES (FTE)
22%
20%
18%
15%
14%
12%
10%
ex
6%
4%
2%
0%
2%
-4%
- 6%
- 8%
-10%
UTAH STATE UNIVERSITYENROLLMENT HISTORY AND PROJECTIONS
1978-79 1981-82 1984-85 1987-88
YEAR
1990-91 1993-94 1995-97 1999-00
11
32

TABLE 6UTAH SYSTEM OF HIGHER EDUCATION
Enrollment History, Management Targets, and Projections from 1977-78 to 1999-00
-- Utah State University --
Education and General
Fall Headcount
Year Res Nonres Total
ACTUALS:
Res
Fall FTE
Nonres Total Res
Academic Year
Nonres Total Res
Annualized Year
Nonres Total
1977-78 5,980 3,456 9,436 5,710 3,575 9,285 5,339 3,379 8,718 6,068 3,379 9,447
1978-79 6,004 3,224 9,228 5,570 3,243 8,813 5,161 3,022 8,183 5,861 3,022 8,883
1979-80 6,192 3,074 9,266 5,872 3,110 8,982 5,612 2,947 8,559 6,323 2,947 9,270
1980-81 6,854 3,085 9,939 6,417 3,143 9,560 6,261 2,982 9,243 7,058 2,982 10,040
1981-82 7,289 3,001 10,290 6,714 2,894 9,608 6,442 2,752 9,194 7,284 2,752 10,036
1982-83 8,246 2,866 11,112 7,094 2,649 9,743 6,914 2,489 9,403 7,739 2,489 10,228
1983-84 10,505 2,673 13,178 7,952 2,400 10,352 7,456 2,198 9,654 8,462 2,198 10,660
1984-85 10,147 2,400 12,547 7,692 2,120 9,812 7,399 1,961 9,360 8,369 1,961 10,330
1985-86 10,225 2,145 12,370 7,607 1,792 9,399 7,406 1,616 9,022 8,355 1,616 9,971
1986-87 10,555 2,000 12,555 7,744 1,687 9,431 7,379 1,573 8,952 8,401 1,573 9,974
1987-88 11,049 1,947 12,996 7,813 1,600 9,413 7,460 1,497 8,957 8,479 1,497 9,976
1988-89 11,274 1,980 13,254 8,004 1,641 9,645 7,643 1,525 9,168 8,641 1,525 10,166
1989-90 11,343 2,047 13,390 8,342 1,727 10,069 8,097 1,594 9,691 9,104 1,594 10,698
1990-91
Funded Target: 10,660
Projected (a)
11,880 2,010 13,890 8,580 1,680 10,260 8,260 1,560 9,820 9,320 1,560 10,880
Actual 12,206 2,300 14,506 9,029 1,943 10,972
Revised Estimates (b): 8,692 1,802 10,494 9,815 1,802 11,617
PROJECTED
1991-92 13,230 2,010 15,240 9,550 1,680 11,230 9,200 1,560 10,760 10,380 1,560 11,940
1992-93 13,410 2,010 15,420 9,680 1,680 11,360 9,330 1,560 10,890 10,520 1,560 12,080
1993-94 13,470 2,010 15,480 9,730 1,680 11,410 9,370 1,560 10,930 10,570 1,560 12,130
1994-95 13,800 2,010 15,810 9,970 1,680 11,650 9,600 1,560 11,160 10,830 1,560 12,390
1995-96 14,290 2,010 16,300 10,320 1,680 12,000 9,940 1,560 11,500 11,210 1,560 12,770
1996-97 14,440 2,010 16,450 10,430 1,680 12,110 10,040 1,560 11,600 11,330 1,560 12,890
1997-98 15,010 2,010 17,020 10,840 1,680 12,520 10,440 1,560 12,000 11,780 1,560 13,340
1998-99 15,460 2,010 17,470 11,170 1,680 12,850 10,750 1,560 12,310 12,130 1,560 13,690
1999-00 15,430 2,010 17,440 11,140 1,68P 12,820 10,730 1,560 12,290 12,110 1,560 13,670
(a) Enrollment Market Projections based on an Enrolllient Demand Model and the Enrollment Management Model.
(b) Revised estimates based on actual 1990-901 Summer and Fall Quarter enrollment data.
NOTE: 1990-91 Funded Target increased by 60 for previously unreported independent study program.
3312

1
TABLE 7UTAH SYSTEM OF HIGHER EDUCATION
Enrollment History, Management Targets, and Projections from 1977-78 to 1999-00
-- Utah State University --
Southeastern Utah Center only
Fall Headcount
Year Res Nonres Total
ACTUALS:
Fall FTE
Res Nonres Total
Academic Year
Res Nonres Total
Annualized Year
Res Nonres Total
1977-78 141 0 141 51 0 51 58 0 58 65 0 65
1978-79 202 0 202 60 0 60 49 0 49 57 0 57
1979-80 193 0 193 59 0 59 58 0 58 67 0 67
1980-81 205 0 205 59 0 59 60 0 60 67 0 67
1981-82 195 0 195 49 0 49 51 0 51 61 0 61
1982-83 209 0 209 59 0 59 62 0 62 67 0 67
1983-84 196 0 196 70 0 70 73 0 73 74 0 74
1984-85 184 0 184 85 0 85 80 0 80 84 0 84
1985-86 247 0 247 90 0 90 78 0 78 82 0 82
1986-87 272 0 272 97 0 97 79 0 79 85 0 85
1987-88 291 0 291 81 0 81 84 0 84 91 0 91
1988-89 319 3 322 109 2 111 102 2 104 112 2 114
1989-90 257 0 257 120 0 120 97 0 97 109 0 109
1990-91
Funded Target: 127
Projected (a)
310 0 310 120 0 120 110 0 110 120 0 120
Actual 289 6 295 121 3 124
Revised Estimates (b): 108 3 111 121 3 124
PROJECTED
1991-92 310 0 310 120 0 120 110 0 110 120 0 120
1992-93 310 0 310 120 0 120 110 0 110 120 0 120
1993-94 310 0 310 120 0 120 110 0 110 120 0 120
1994-95 310 0 310 120 0 120 110 0 110 120 0 120
1995-96 310 0 310 120 0 120 110 0 110 120 0 120
1996-97 310 0 310 120 0 120 110 0 110 120 0 120
1997-98 310 0 310 120 0 120 110 0 110 120 0 120
1998-99 310 0 310 120 0 120 110 0 110 120 0 120
1999-00 310 0 310 120 0 120 110 0 110 120 0 120
(a) Enrollment Market Projections based on an Enrollment Demand Model and the Enrollment Management Model.
(b) Revised estimates based on actual 1990-901 Summer and Fall Quarter enrollment data.
1 1 3
3 4
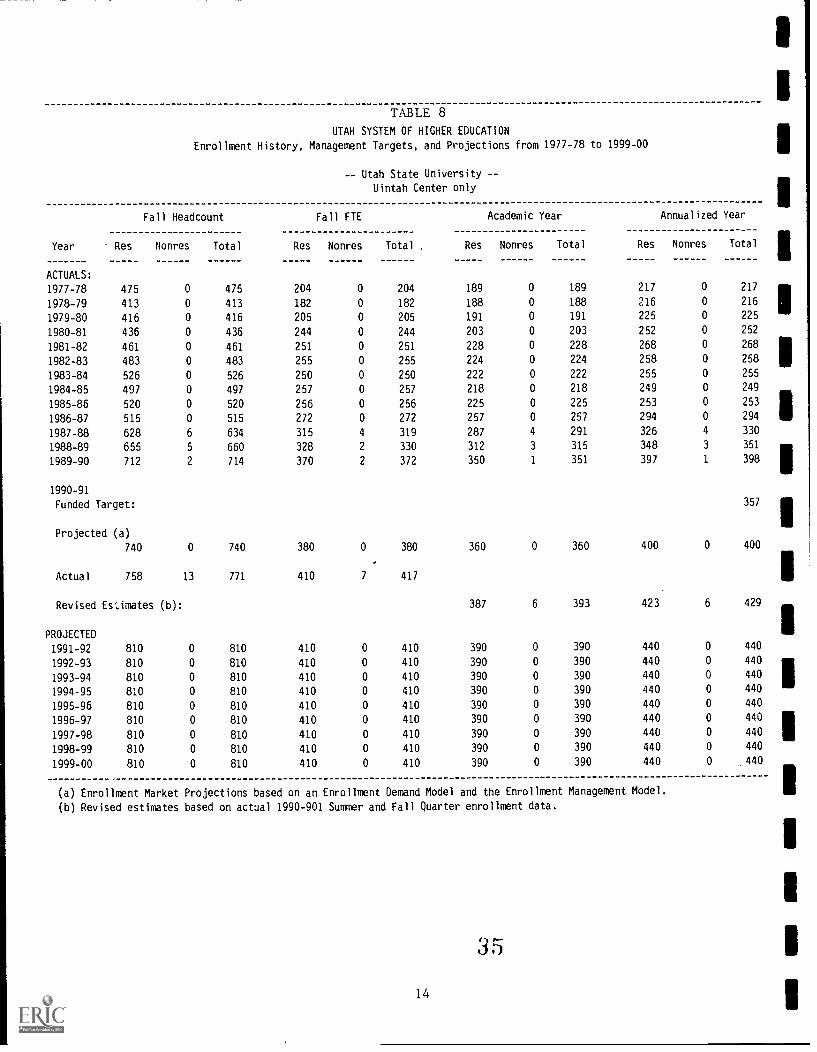
TABLE 8
UTAH SYSTEM OF HIGHER EDUCATION
Enrollment History, Management Targets, and Projections from 1977-78 to 1999-00
-- Utah State University --
Uintah Center only
Fall Headcount
Year Res Nonres Total
ACTUALS:
Fall FTE
Res Nonres Total . Res
Academic Year
Nonres Total Res
Annualized Year
Nonres Total
1977-78 475 0 475 204 0 204 189 0 189 217 0 217
1978-79 413 0 413 182 0 182 188 0 188 216 0 216
1979-80 416 0 416 205 0 205 191 0 191 225 0 225
1980-81 436 0 436 244 0 244 203 0 203 252 0 252
1981-82 461 0 461 251 0 251 228 0 228 268 0 268
1982-83 483 0 483 255 0 255 224 0 224 258 0 258
1983-84 526 0 526 250 0 250 222 0 222 255 0 255
1984-85 497 0 497 257 0 257 218 0 218 249 0 249
1985-86 520 0 520 256 0 256 225 0 225 253 0 253
1986-87 515 0 515 272 0 272 257 0 257 294 0 294
1987-88 628 6 634 315 4 319 287 4 291 326 4 330
1988-89 655 5 660 328 2 330 312 3 315 348 3 351
1989-90 712 2 714 370 2 372 350 1 351 397 1 398
1990-91
Funded Target: 357
Projected (a)
740 0 740 380 0 380 360 0 360 400 0 400
Actual 758 13 771 410 7 417
Revised Es',imates (b): 387 6 393 423 6 429
PROJECTED
1991-92 810 0 810 410 0 410 390 0 390 440 0 440
1992-93 810 0 810 410 0 410 390 0 390 440 0 440
1993-94 810 0 810 410 0 410 390 0 390 440 0 440
1994-95 810 0 810 410 0 410 390 0 390 440 0 440
1995-96 810 0 810 410 0 410 390 0 390 440 0 440
1996-97 810 0 810 410 0 410 390 0 390 440 0 440
1997-98 810 0 810 410 0 410 390 0 390 440 0 440
1998-99 810 0 810 410 0 410 390 0 390 440 0 440
1999-00 810 0 810 410 0 410 390 0 390 440 0 440
(a) Enrollment Market Projections based on an Enrollment Demand Model and the Enrollment Management Model.
(b) Revised estimates based on actual 1990-901 Summer and Fall Quarter enrollment data.
3 5
14
1
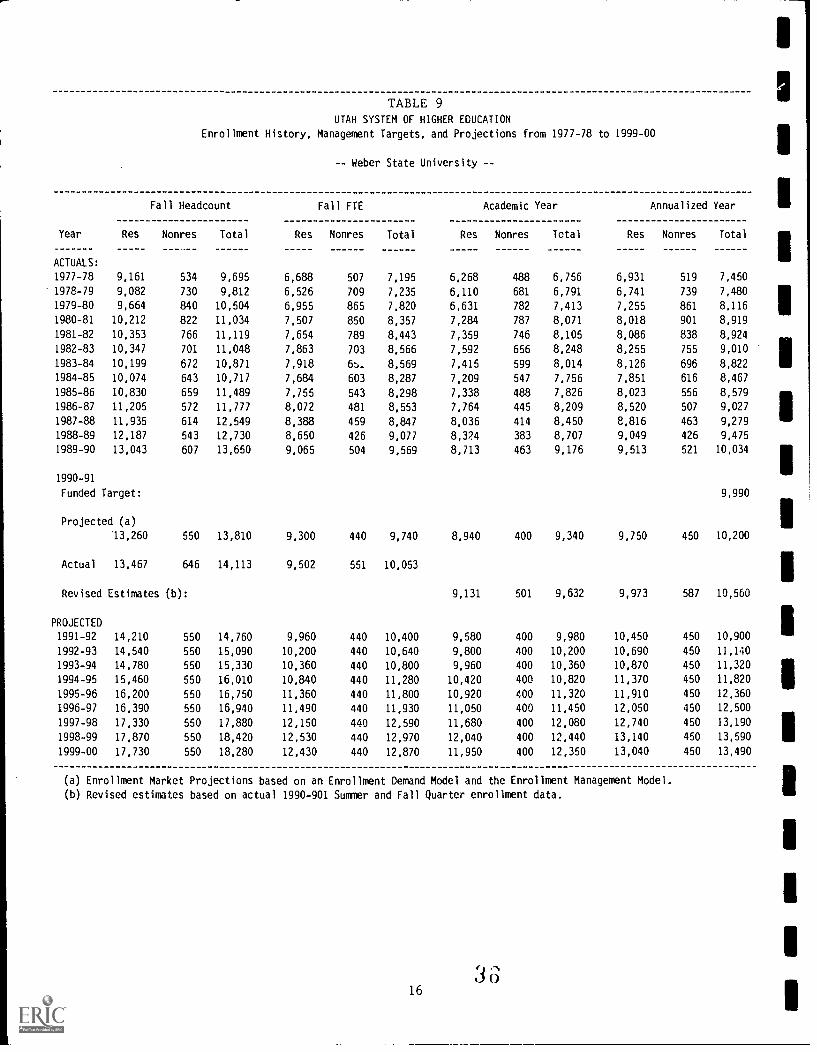
TABLE 9UTAH SYSTEM OF HIGHER EDUCATION
Enrollment History, Management Targets, and Projections from 1977-78 to 1999-00
-- Weber State University --
Year Res
ACTUALS:
Fall Headcount
Nonres Total Res
Fall FTE
Nonres Total Res
Academic Year
Nonres Total Res
Annualized Year
Nonres Total
1977-78 9,161 534 9,695 6,688 507 7,195 6,268 488 6,756 6,931 519 7,450
1978-79 9,082 730 9,812 6,526 709 7,235 6,110 681 6,791 6,741 739 7.480
1979-80 9,664 840 10,504 6.955 865 7.820 6,631 782 7,413 7.255 861 8,116
1980-81 10,212 822 11,034 7,507 850 8,357 7,284 787 8,071 8,018 901 8,919
1981-82 10,353 766 11,119 7,654 789 8,443 7,359 746 8,105 8,086 838 8,924
1982-83 10,347 701 11,048 7,863 703 8,566 7,592 656 8,248 8,255 755 9,010
1983-84 10,199 672 10,871 7,918 6:). 8,569 7,415 599 8,014 8,126 696 8,822
1984-85 10,074 643 10,717 7,684 603 8,287 7,209 547 7,756 7,851 616 8,467
1985-86 10,830 659 11,489 7,755 543 8,298 7,338 488 7,826 8,023 556 8,579
1986-87 11,205 572 11,777 8,072 481 8,553 7,764 445 8,209 8,520 507 9,027
1987-88 11,935 614 12,549 8,388 459 8,847 8,036 414 8,450 8,816 463 9,279
1988-89 12,187 543 12,730 8.650 426 9,077 8,324 383 8,707 9,049 426 9,475
1989-90 13,043 607 13,650 9,065 504 9,569 8,713 463 9,176 9,513 521 10,034
1990-91
Funded Target: 9,990
Projected (a)
13,260 550 13,810 9,300 440 9,740 8,940 400 9,340 9,750 450 10,200
Actual 13,467 646 14,113 9,502 551 10,053
Revised Estimates (b): 9,131 501 9,632 9,973 587 10,560
PROJECTED
1991-92 14,210 550 14,760 9,960 440 10,400 9,580 400 9,980 10,450 450 10,900
1992-93 14,540 550 15,090 10,200 440 10,640 9,800 400 10,200 10,690 450 11,140
1993-94 14,780 550 15,330 10,360 440 10,800 9,960 400 10,360 10,870 450 11,320
1994-95 15,460 550 16,010 10,840 440 11,280 10,420 400 10,820 11,370 450 11,820
1995-96 16,200 550 16,750 11,360 440 11.800 10,920 400 11,320 11,910 450 12,360
1996-97 16,390 550 16,940 11.490 440 11,930 11,050 400 11,450 12,050 450 12,500
1997-98 17,330 550 17,880 12,150 440 12,590 11,680 400 12,080 12,740 450 13,190
1998-99 17,870 550 18,420 12,530 440 12,970 12,040 400 12,440 13,140 450 13,590
1999-00 17,730 550 18,280 12,430 440 12,870 11,950 400 12,350 13,040 450 13,490
(a) Enrollment Market Projections based on an Enrollment Demand Model and the Enrollment Management Model.
(b) Revised estimates based on actual 1990-901 Summer and Fall Quarter enrollment data.
1
16

FIGURE 4
CUMULATIVE ENROLLMENT LEVELS
2
2
19
18
17
16
15
14
13
12
11
10
9
7
1977-78
WEBF.R STATE UN I VERS I TYENROLLMENT HISTORY ANO PROJECTIONS
0 Fel! HOCT
1980-91 1923-BA 1986-87 1929-90
Fell PTEYEAR
1992-93
0 AC FTE
1995-96 1998-99
AY FTE
ANNUAL GROWTH RATES (FTE)
22%
20%
12%
16%
14%
12%
10%
ex
6%
4%
2%
096
2%
-4%
- 8%
- 8%
WEBER STATE UN I VERS I TYENROLLMENT HISTORY AND PROJECTIONS
MEW tag
nimmummwAremvAiminvxmaramium
-10%1978-79 1981-22 1984-85 1987-80
YEAR
1990-91 1993-94 1996-97' I
1999-00
17 37

TABLE 10UTAH SYSTEM OF HIGHER EDUCATION
Enrollment History, Management Targets, and Projections from 1977-78 to 1999-00
-- Southern Utah University --
Total Institution
Year Res
ACTUALS:
Fall Headcount
Nonres Total Res
Fall FTE
Nonres Total Res
Academic Year
Nonres Total Res
Annualized Year
Nonres Total
1977-78 1,518 366 1,884 1,393 375 1,768 1,309 346 1,655 1,388 361 1,749
1978-79 1,464 334 1,798 1,378 344 1,722 1,308 314 1,622 1.385 334 1,719
1979-80 1,651 315 1,966 1,520 314 1,834 1,471 287 1,758 1,548 305 1,853
1980-81 1,788 270 2,058 1,670 274 1,944 1,576 256 1,832 1,672 276 1,948
1981-82 1,866 240 2,106 1,656 240 1,896 1,614 202 1,816 1,697 224 1,921
1982-83 2,140 238 2,378 1,934 233 2,167 1,842 212 2,054 1,937 236 2,173
1983-84 2,344 199 2,543 2,095 201 2,296 1,993 187 2,180 2,105 210 2,315
1984-85 2,422 220 2,642 2.218 220 2,438 2,085 193 2,278 2,197 213 2,410
1985-86 2,394 191 2,585 2,150 198 2,348 2.025 168 2,193 2,175 186 2,361
1986-87 2,676 189 2,865 2,382 189 2,571 2,270 172 2,442 2,484 201 2,685
1987-88 2,731 183 2,914 2,504 181 2,685 2,372 161 2,533 2,598 181 2,779
1988-89 2,789 163 2,952 2,609 161 2,770 2,496 150 2,646 2,715 179 2,894
1989-90 3,276 226 3,502 2,679 214 2,893 2,552 171 2,723 2,819 215 3,044
1990-91
Funded Target: 3,195
Projected (a)
3,270 210 3,480 2,860 200 3,060 2,720 170 2,890 2,990 210 3,200
Actual 3,763 240 4,003 2,961 233 3,194
Revised Estimates (b): 2,815 195 3,010 3,110 255 3,365
PROJECTED
1991-92 3,500 220 3,720 3,060 210 3,270 2,910 180 3,090 3,200 220 3,420
1992-93 3,540 220 3,760 3,090 210 3,300 2,950 180 3,130 3,230 220 3,450
1993-94 3,580 220 3.800 3,130 210 3,340 2,980 180 3,160 3,270 220 3,490
1994-05 3,690 220 3,910 3,220 210 3,430 3,070 180 3,250 3,370 220 3,590
1995-96 3,970 220 4,190 3,470 210 3,680 3,310 180 3,490 3,630 220 3,850
1996-97 4,020 220 4,240 3,510 210 3,720 3,350 180 3,530 3,670 220 3,890
1997-98 4,250 220 4,470 3,710 210 3,920 3,540 180 3,720 3,880 220 4,100
1998-99 4,330 220 4,550 3,780 210 3,990 3,610 180 3,790 3,950 220 4,170
1999-00 4,340 220 4,560 3,790 210 4,000 3,610 180 3,790 3,960 220 4,180
(a) Enrollment Market Projections based on an Enrollment Demand Model and the Enrollment Management Model.
(b) Revised estimates based on actual 1990-901 Summer and Fall Quarter enrollment data.
NOTE: Funded Target was increased by 14 for STIT funding and decreased
by 39 for Recording Fees that were removed from the report.
18
1
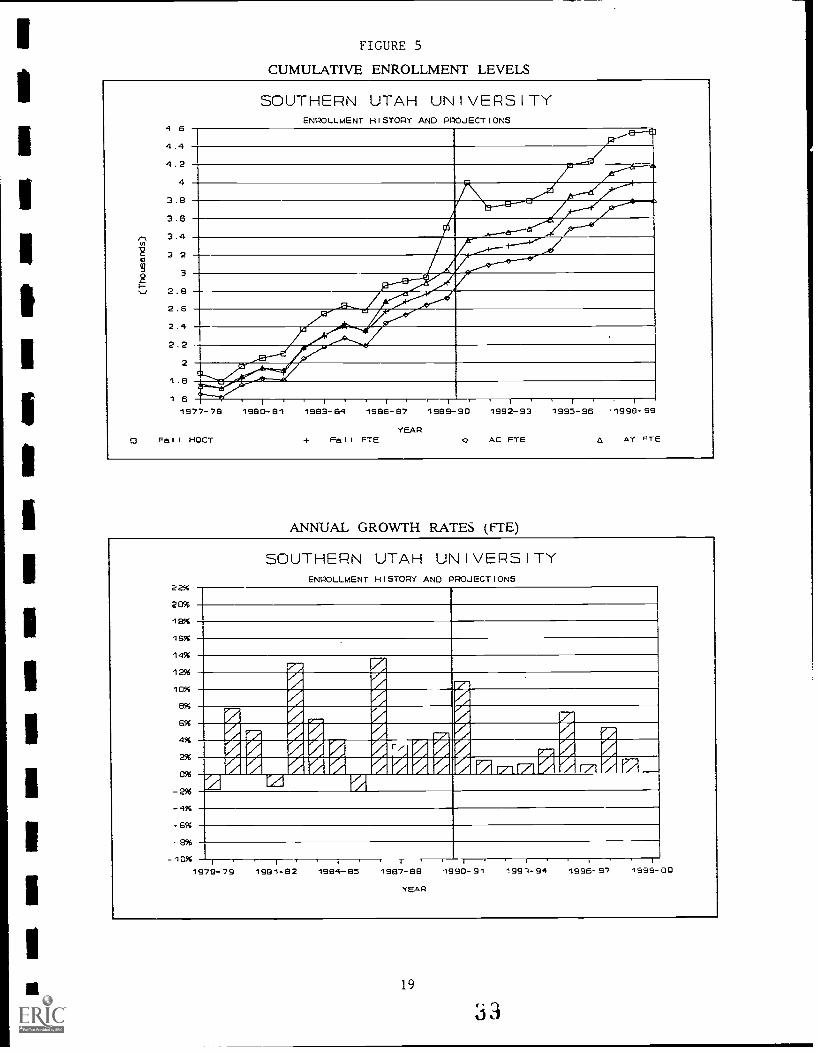
FIGURE 5
CUMULATIVE ENROLLMENT LEVELS
4 6
4.4
4.2
4
3.8
3.5
3.4
3 2
3
2.8
2.6
2.4
2.2
2
1 8
1 51977-78 1990-131
SOUTHERN UTAH UNIVERSITYENROLLMENT HISTORY AND PROJECTIONS
0 Fall HOCT
1983-84 1986-87 1989-90
+ Fall FTEYEAR
1992-93
0 AC FTE
1995-96 .1998-99
a AY PTE
ANNUAL GROWTH RATES (FTE)
22%
20%
18%
16%
14%
12%
10%
ex
E%
4%
2%
0%
2%
-4%
-6%
ex
SOUTHERN UTAH UNIVERSITYENROLLMENT HISTORY AND PROJECTIONS
mri rEiMMINIMINE r/. Arl.INFAITAINIEWINTRINIMINIUM
-10% 1 ,
1978-79 1981-92 1994-85 1997-88 1990-91 199,1-94 1996-97 1999-00
YEAR
19

1
ITABLE 10a
UTAH SYSTEM OF HIGHER EDUCATION
Enrollment History, Management Targets, and Projections from 1977-78 to 1999-00 1-- Southern Utah University --
Non SCH Generating
IFall Headcount Fall FTF Academic Year Annualized Year
Year Res Nonres Total Res Nonres Total Res Nonres Total Res Nonres Total
IACTUALS:
1977-78
1978-79 11979-80
1980-81
1981-82
1982-83 I1983-84
1984-85
1985-86
11986-87
1987-88
1988-89
1989-90
11990-91
Funded Target:
1Projected (a)
Actual 31 0 31 23 0 23 IRevised Estimates (b):
PROJECTED I1991-92
1992-93
1993-9411994-95
1995-96
1996-97
11997-98
1998-99
1999-00
(a) Enrollment Market Projections based on an Enrollment Demand Model and the Enrol lmt. t Management Model. I(b) Revised estimates based on actual 1990-901 Summer and Fall Quarter enrollment data.
NOTE: Included in Total Institution for projection purposes. III
I40
1
20 I

TABLE 11UTAH SYSTEM OF HIGHER EDUCATION
Enrollment History, Management Targets, and Projections from 1977-78 to 1999-00
-- Snow College --
Year Res
ACTUALS:
Fall Headcount
Nonres Total Res
Fall FTE
Nonres Total Res
Academic Year
Nonres Total Res
Annualized Year
Nonres Total
1977-78 857 151 1,008 860 158 1,018 784 131 915 784 131 9151978-79 842 141 983 835 138 973 778 119 897 778 119 8971979-80 946 181 1,127 943 160 1,103 835 163 998 836 166 1,0021980-81 1,071 212 1,283 979 216 1,195 886 204 1,090 893 215 1,1081981-82 1,179 209 1,388 989 220 1,209 887 203 1,090 906 226 1,1321982-83 1,230 181 1,411 961 182 1,143 878 147 1,025 878 147 1,0251983-84 1,128 178 1,306 1,038 178 1,216 969 147 1,116 985 161 1,1461984-85 1,174 145 1,319 1,079 150 1,229 968 127 1,095 989 141 1,1301985-86 1,096 163 1,259 1,028 166 1,194 962 142 1,104 988 154 1,1421986-87 1,239 157 1,396 1,176 164 1,340 1,078 146 1,224 1,112 153 1,2651987-88 1,188 181 1,369 1,126 188 1,314 1,043 158 1,201 1,067 177 1,2441988-89 1,356 188 1,544 1,224 197 1,421 1,128 186 1,314 1,156 219 1,3751989-90 1,480 254 1,734 1,362 259 1,621 1,277 262 1,539 1,312 304 1,616
1990-91
Funded Target:1,540
Projected (a)
1,630 240 1,870 1,500 250 1,750 1,390 240 1,630 1,430 280 1,710
Actual 1,540 332 1,872 1,447 351 1,798
Revised Estimates (b):1,346 337 1,683 1,374 389 1,763
PROJECTED
1991-92 1,740 290 2,030 1,600 300 1,900 1,490 290 1,780 1,530 330 1,8601992-93 1,790 290 2,080 1,640 300 1,940 1,530 290 1,820 1,570 330 1,9001993-94 1,810 290 2,100 1,660 300 1,960 1,550 290 1,840 1,590 330 1,9201994-95 1,870 290 2,160 1,720 300 2,020 1.600 290 1,890 1,640 330 1,9701995-96 1,930 290 2,220 1,770 300 2,070 1,650 290 1,940 1,690 330 2,0201996-97 1,900 290 2,190 1,750 300 2,050 1,620 290 1,910 1,670 330 2,0001997-98 1,940 290 2,230 1,780 300 2,080 1,660 290 1,950 1,700 330 2,0301998-99 2,020 290 2,310 1,860 300 2,160 1,730 290 2,020 1,770 330 2,1001999-00 2,000 290 2,290 1,840 300 2,140 1,710 290 2,000 1,750 330 2,080
(a) Enrollment Market Projections based on an Enrollment Demand Model and the Enrollment Management Model.(b) Revised estimates based on actual 1990-901 Summe,- and Fall Quarter enrollment data.
22
4
1

FIGURE 6
CUMULATIVE ENROLLMENT LEVELS
2
2 4
2.3
2 2
2.1
2
1 9
1 8
1.7
1.6
1 5
1 4
1 3
1.2
1 1
1
0.9
0
1977-72 1980-81 1923-84 1926-27 1999-90
SNOW COLLEGEENROLLMENT HISTORY AND PROJECTIONS
Mgr ftwums71011=11
0 Fall MOCT * Fall FTEYEAR
' I '
1992-93
AC FTE
1993-96
a Af FIE
ANNUAL GROWTH RATES (FTE)
22%
20%
lex
16%
14%
12%
10%
ex
6%
4%
2%
0%
-2%
4%
6%
ex
_ 10%
SNOW COLLEGEENROLLMENT HISTORY AND PROJECTIONS
or
P pp rØØiØidiØrortimmel
"AlF0111111E5EIRIIIMINEIN0 4
r-
rANIMINEVAI
1978-79 1921-82 1994-85 1297-26 1990-91 1993-94 1996-97 1999-00
YEAR
23 4 2
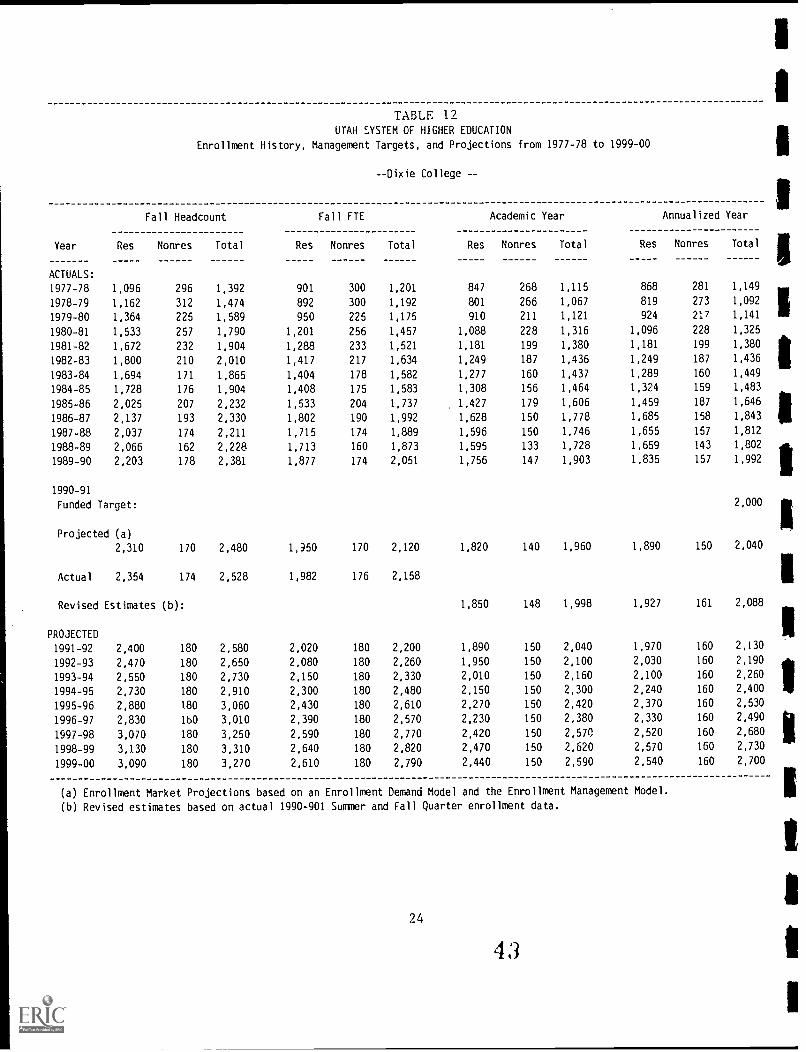
TABLE 12UTAH SYSTEM OF HIGHER EDUCATION
Enrollment History, Management Targets, and Projections from 1977-78 to 1999-00
--Dixie College --
Fall Headcount
Year Res Nonres Total
ACTUALS:
Res
Fall FTE
Nonres Total Res
Academic Year
Nonres Total Res
Annualized Year
Nonres Total
1977-78 1,096 296 1,392 901 300 1,201 847 268 1,115 868 281 1,149
1978-79 1,162 312 1,474 892 300 1,192 801 266 1,067 819 273 1,092
1979-80 1,364 225 1,589 950 225 1,175 910 211 1,121 924 217 1,141
1980-81 1,533 257 1,790 1,201 256 1,457 1,088 228 1,316 1,096 228 1,325
1981-82 1,672 232 1,904 1,288 233 1,521 1,181 199 1,380 1,181 199 1,380
1982-83 1,800 210 2,010 1,417 217 1,634 1,249 187 1,436 1,249 187 1,436
1983-84 1,694 171 1.865 1,404 178 1,582 1,277 160 1,437 1,289 160 1,449
1984-85 1,728 176 1,904 1,408 175 1,583 1,308 156 1,464 1,324 159 1,483
1985-86 2,025 207 2,232 1,533 204 1,737 1,427 179 1,606 1,459 187 1,646
1986-87 2,137 193 2,330 1,802 190 1,992 1,628 150 1,778 1,685 158 1,843
1987-88 2,037 174 2,211 1,715 174 1,889 1,596 150 1,746 1,655 157 1,812
1988-89 2,066 162 2,228 1,713 160 1,873 1,595 133 1,728 1,659 143 1,802
1989-90 2,203 178 2,381 1,877 174 2,051 1,756 147 1,903 1,835 157 1,992
1990-91
Funded Target: 2,000
Projected (a)
2,310 170 2,480 1,350 170 2,120 1,820 140 1,960 1,890 150 2,040
Actual 2,354 174 2,528 1,982 176 2,158
Revised Estimates (b): 1,850 148 1,998 1,927 161 2,088
PROJECTED
1991-92 2,400 180 2,580 2,020 180 2,200 1,890 150 2,040 1,970 160 2,130
1992-93 2,470 180 2,650 2,080 180 2,260 1,950 150 2,100 2,030 160 2,190
1993-94 2,550 180 2,730 2,150 180 2,330 2,010 150 2,160 2,100 160 2,260
1994-95 2,730 180 2,910 2,300 180 2,480 2,150 150 2,300 2,240 160 2,400
1995-96 2,880 180 3,060 2,430 180 2,610 2,270 150 2,420 2,370 160 2,530
1996-97 2,830 160 3,010 2,390 180 2,570 2,230 150 2,380 2,330 160 2,490
1997-98 3,070 180 3,250 2,590 180 2,770 2,420 150 2,570 2,520 160 2,680
1998-99 3,130 180 3,310 2,640 180 2,820 2,470 150 2,620 2,570 160 2,730
1999-00 3,090 180 3,270 2,610 180 2,790 2,440 150 2,590 2,540 160 2,700
(a) Enrollment Market Projections based on an Enrollment Demand Model and the Enrollment Management Model.
(b) Revised estimates based on actual 1990-901 Summer and Fall Quarter enrollment data.
24
4 3

FIGURE 7
CUMULATIVE ENROLLMENT LEVELS
DIXIE COLLEGEENROLLMENT HISTORY AND PROJECTIONS
0 Fall HOCT + Fail FTEYEAR
0 AC FTE AY FTE
ANNUAL GROWTH RATES (FTE)
22%
20%
18%
16%
14%
12%
10%
8%
6%
4%
2%
0%
- 2%
- 6%
- 8%
-10%
DIXIE COLLEGEENROLLMENT HISTORY ANC) PROJECTIONS
P/0'0' 0irA dd d
Mr.rarmeramm avremadramonWAIN
1979-79 1991-92 1994-95 1987-99
YEAR
1990-91i 1 '
1993-94 1996-97 1999-00
254 4

TABLE 13
UTAH SYSTEM OF HIGHER EDUCATION
Enrollment History, Management Targets, and Projections from 1977-78 to 1999-00
--College of Eastern Utah--
Total Institution
Year Res
ACTUALS:
Fall Headcount
Nonres Total Res
Fall FTE
Nonres Total Res
Academic Year
Nonres Total Res
Annualized Year
Nonres Total
1977-78 946 39 985 644 36 680 589 42 631 606 44 650
1978-79 1,044 31 1,075 658 29 687 606 33 639 626 34 660
1979-80 902 48 950 629 47 676 548 44 592 580 45 625
1980-81 1,174 44 1,218 700 50 750 654 43 697 709 44 753
1981-82 1,255 35 1,290 824 39 863 728 33 761 795 34 829
1982-83 1,252 46 1,298 829 45 874 846 35 881 886 36 922
1983-84 1,294 65 1,359 926 70 996 943 44 988 1,020 45 1,065
1984-85 1,359 53 1,412 1,067 54 1,121 1,018 40 1,058 1,121 41 1,162
1985-86 1,318 53 1,371 1,005 54 1,059 1,021 44 1,065 1,097 44 1,141
1986-87 1,688 83 1,771 1,186 82 1,268 1,158 48 1,206 1,260 49 1,309
1987-88 2,079 68 2,147 1,231 65 1,296 1,138 43 1,181 1,237 44 1,281
1988-89 1,986 77 2,063 1,357 38 1,395 1,249 27 1,276 1,325 29 1,354
1989-90 2,304 37 2,341 1,494 31 1,525 1,295 31 1,325 1,386 34 1,420
1990-91
Funded Target: 1,570
Projected (a)
2,380 40 2,420 1,550 30 1,580 1,390 30 1,420 1,480 30 1,510
Actual 2,851 109 2,960 1,734 66 1,800
Revised Estimates (b): 1,562 56 1,618 1,656 64 1,720
PROJECTED
1991-92 2,760 60 2,820 1,800 40 1,840 1,610 40 1,650 1,730 40 1,770
1992-93 2,810 60 2,870 1,840 40 1,880 1,640 40 1,680 1,760 40 1,800
1993-94 2,890 60 2,950 1,890 40 1,930 1,690 40 1,730 1,810 40 1,850
1994-95 2,930 60 2,990 1,910 40 1,950 1,710 40 1,750 1,830 40 1,870
1995-96 3,010 60 3,07G 1,960 40 2,000 1,750 40 1,790 1,880 40 1,920
1996-97 2,940 60 3,000 1,920 40 1,960 1,720 40 1,760 1,840 40 1,880
1997-98 3,080 60 3,140 2,010 40 2,050 1,790 40 1,830 1,920 40 1,960
1998-99 3,160 60 3,220 2,060 40 2,100 1,840 40 1,880 1,970 40 2,010
1999-00 3,130 60 3,190 2,040 40 2,080 1,820 40 1,860 1,950 40 1,990
(a) Enrollment Market Projections based on an Enrollment Demand Model and the Enrollment Management Model.
(b) Revised estimates based on actual 1990-901 Summer and Fall Quarter enrollment data.
26
1
II
1
1

FIGURE 8
CUMULATIVE ENROLLMENT LEVELS
COLLEGE OF EASTERN UTAHENRG LMENT HISTORY AND PROJECTIONS
3 4
3.2
3
2 8
2.6
2.4
2.2
2
1.8
1.6
1.4
1 2
0 41977-72 1990-91 1993-24 1926-97 1929-90 1992-93
Fall HOCT Fall FTE
1995-96 199G-99
AC FTE AY FTE
ANNUAL GROWTH RATES (FTE)
22%
4%
2%
0%
-2%
4%
6%
COLLEGE OF EASTERN UTAHENROLLMENT HISTORY AND PROJECTIONS
1r r A,r0 i d
a.011011 /
Pd-/.,
dille0/' A rAIL , rd .
MIIIIMININIMP411mprirdreremarail.rd ,Pe
z
e%
-10%1s7e-7s
' I '
1991-92 1994-85 1997-99
YEAR
I ' ` I
1990-91 1993-94 1996-97 1999-00
27 4

TABLE 14UTAH SYSTEM OF HIGHER EDUCATION
Enrollment History, Management Targets, and Projections from 1977-78 to 1999-00
--College of Eastern Utah--
Education and General
Year Res
ACTUALS:
Fall Headcount
Nonres Total Res
Fall FTE
Nonres Total Res
Academic Year
Nonres Total Res
Annualized Year
Nonres Total
1977-78 880 39 919 605 36 641 540 42 582 557 44 601
1978-79 938 31 969 583 29 612 525 33 558 546 34 580
1979-80 803 48 851 575 47 622 512 44 556 530 45 575
1980-81 1,059 44 1,103 631 50 681 586 43 629 610 44 654
1981-82 1,099 35 1,134 727 39 766 633 33 666 682 34 716
1982-83 1,061 46 1,107 715 45 760 696 35 731 719 36 755
1983-84 1,011 63 1,074 734 69 803 733 44 777 784 45 829
1984-85 1,060 53 1,113 848 54 902 790 40 830 866 41 907
1985-86 1,079 53 1,132 817 54 871 804 44 848 861 44 905
1986-87 1,320 83 1,403 897 82 979 890 48 939 952 49 1,001
1987-88 1,807 68 1,875 1,040 65 1,105 917 43 960 982 44 1,026
1988-89 1,624 77 1,701 1,111 38 1,149 1,008 27 1,035 1,052 29 1,081
1989-90 1,932 37 1,969 1,233 31 1,264 1,052 31 1,082 1,110 34 1,144
1990-91
Funded Target: 1,270
Projected (a)
1,990 40 2,030 1,280 30 1,310 1,120 30 1,150 1,180 30 1,210
Actual 2,201 108 2,309 1,344 65 1,409
Revised Estimates (b): 1,177 55 1,232 1,248 63 1,311
PROJECTED
1991-92 2,260 60 2,320 1,450 40 1,490 1,270 40 1,310 1.340 40 1,380
1992-93 2,310 60 2,370 1,490 40 1,530 1,300 40 1,340 1,370 40 1,410
1993-94 2,390 60 2,450 1,540 40 1,580 1,350 40 1,390 1,420 40 1,460
1994-95 2,430 60 2,490 1,560 40 1,600 1,370 40 1,410 1,440 40 1,480
1995-96 2,510 60 2,570 1,610 40 1,650 1,410 40 1,450 1,490 40 1,530
1996-97 2,440 60 2,500 1,570 40 1,610 1,380 40 1,420 1,450 40 1,490
1997-98 2,580 60 2,640 1,660 40 1,700 1,450 40 1,490 1,530 40 1,570
1998-99 2,660 60 2,720 1,710 40 1,750 1,500 40 1,540 1,580 40 1,620
1999-00 2,630 60 2,690 1,690 40 1,730 1,480 40 1,520 1,560 40 1,600
(a) Enrollment Market Projections based on an Enrollment Demand Model and the Enrollment Management Model.
(b) Revised estimates based on actual 1990-901 Summer and Fall Quarter enrollment data.
4 7
28
1
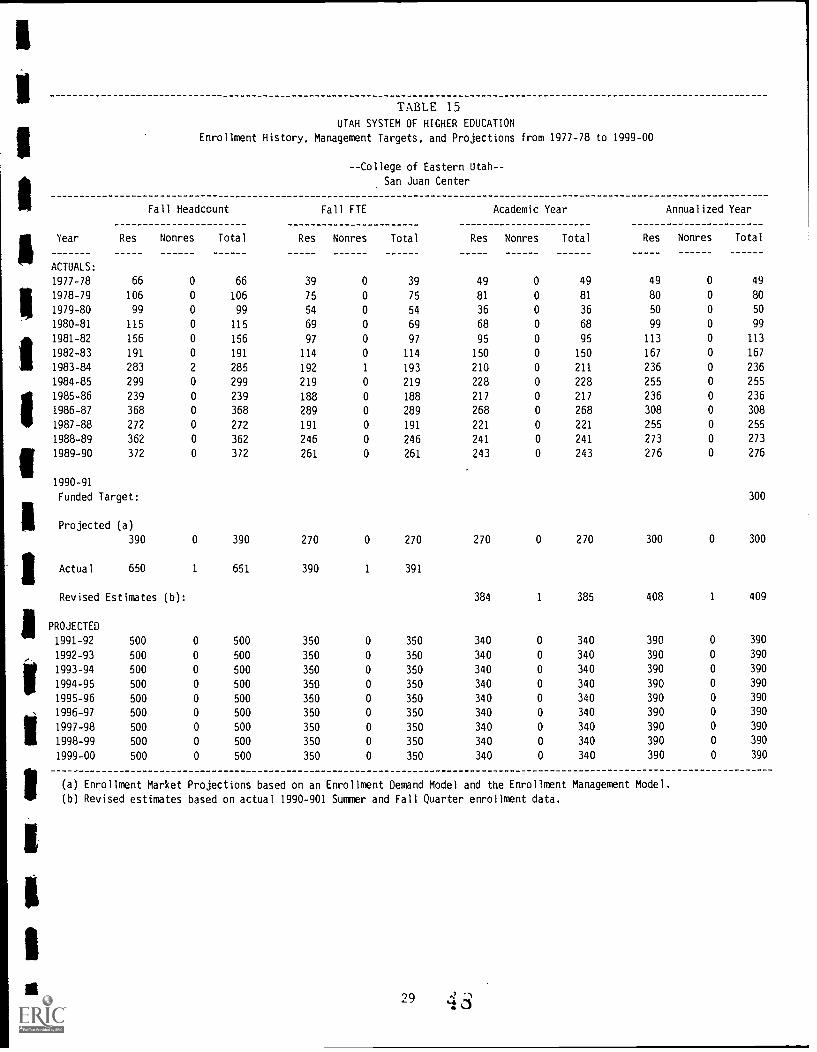
TABLE 15
UTAH SYSTEM OF HIGHER EDUCATION
Enrollment History, Management Targets, and Projections from 1977-78 to 1999-00
--College of Eastern Utah--
San Juan Center
Fall Headcount
Year Res Nonres Total
ACTUALS:
Res
Fall FTE
Nonres Total Res
Academic Year
Nonres Total Res
Annualized Year
Nonres Total
1977-78 66 0 66 39 0 39 49 0 49 49 0 49
1978-79 106 0 106 75 0 75 81 0 81 80 0 80
1979-80 99 0 99 54 0 54 36 0 36 50 0 50
1980-81 115 0 115 69 0 69 68 0 68 99 0 99
1981-82 156 0 156 97 0 97 95 0 95 113 0 113
1982-83 191 0 191 114 0 114 150 0 150 167 0 167
1983-84 283 2 285 192 1 193 210 0 211 236 0 236
1984-85 299 0 299 219 0 219 228 0 228 255 0 255
1985-86 239 0 239 188 0 188 217 0 217 236 0 236
1986-87 368 0 368 289 0 289 268 0 268 308 0 308
1987-88 272 0 272 191 0 191 221 0 221 255 0 255
1988-89 362 0 362 246 0 246 241 0 241 273 0 273
1989-90 372 0 372 261 0 261 243 0 243 276 0 276
1990-91
Funded Target: 300
Projected (a)
390 0 390 270 0 270 270 0 270 300 0 300
Actual 650 1 651 390 1 391
Revised Estimates (b): 384 1 385 408 1 409
PROJECTED
1991-92 500 0 500 350 0 350 340 0 340 390 0 390
1992-93 500 0 500 350 0 350 340 0 340 390 0 390
1993-94 500 0 500 350 0 350 340 0 340 390 0 390
1994-95 500 0 500 350 0 350 340 0 340 390 0 390
1995-96 500 0 500 350 0 350 340 0 340 390 0 390
1996-97 500 0 500 350 0 350 340 0 340 390 0 390
1997-98 500 0 500 350 0 350 340 0 340 390 0 390
1998-99 500 0 500 350 0 350 340 0 340 390 0 390
1999-00 500 0 500 350 0 350 340 0 340 390 0 390
(a) Enrollment Market Projections based on an Enrollment Demand Model and the Enrollment Management Model.
(b) Revised estimates based on actual 1990-901 Summer and Fall Quarter enrollment data.
29

TABLE 16UTAH SYSTEM OF HIGHER EDUCATION
Enrollment History, Management Targets, and Projections from 1977-78 to 1999-00
--Utah Valley Community College--
Fall Headcount Fall FTE Academic Year Annualized Year
Year Res Nonres Total Res Nonres Total Res Nonres Total Res Nonres Total
ACTUALS:
1977-78 3,398 395 3,793 2,462 434 2,896 2,244 416 2,660 2,413 450
1978-79 3,473 517 3,990 2,333 536 2,869 2,150 493 2,643 2,354 543
1979-80 3,520 610 4,130 2,557 655 3,212 2,403 570 2,973 2,614 636
1980-81 3,984 618 4,602 3,037 641 3,678 3,000 549 3,549 3,238 602
1981-82 4,324 617 4,941 3,537 589 4,126 3,461 518 3,979 3,778 571
1982-83 4,966 627 5,593 4,134 634 4,768 3,994 566 4,560 4,402 633
1983-84 5,473 620 6,093 4,611 629 5,240 4,228 539 4,767 4,662 610
1984-85 5,184 634 5,818 4,263 578 4,841 4,018 518 4,536 4,377 570
1985-86 5,365 648 6,013 4,314 572 4,886 3,998 465 4,463 4,367 532
1986-87 5,882 610 6,492 4,612 536 5,148 4,369 433 4,802 4,704 502
1987-88 6,331 637 6,968 4,907 513 5,420 4,445 390 4,835 4,826 476
1988-89 6,309 524 6,833 4,877 442 5,312 4,545 351 4,896 4,911 418
1989-90 7,118 640 7,758 5,446 541 5,987 4,968 438 5,406 5,347 507
1990-91
Funded Target:
Projected (a)
7,500 600 8,100 5,940 500 6,440 5,450 400 5,850 5,880 470
Actual 7,132 754 7,886 4,644 581 5,225
Revised Estimates (: ':: 4,714 480 5,194 5,085 565
PROJECTED
1991-92 7,400 630 8,030 5,690 530 6,220 5,230 420 5,650 5,640 500
1992-93 7,750 630 8,380 5,960 530 6,490 5,470 420 5,890 5,900 500
1993-94 8,150
1 994-95 8,550
630
630
8,780
9,180
6,270
6,580
530
530
6,800
7,110
5,750
6,040
420
420
6,170
6,460
6,210
6,520
500
500
1995-96 9,240 630 9,870 7,110 530 7,640 6,520 420 6,940 7,040 500
1996-97 9,240 630 9,870 7,110 530 7,640 6,520 420 6,940 7,040 500
1997-98 9,440 630 10,070 7,260 530 7,790 6,660 420 7,080 7,190 500
1998-99 9,730 630 10,360 7,490 530 8,020 6,870 420 7,290 7,420 500
1999-00 9,640 630 10,270 7,420 530 7,950 6,810 420 7,230 7,350 500
2,863
2,897
3,250
3,840
4,349
5,035
5,272
4,947
4,899
5,206
5,302
5,329
5,854
5,890
6,350
II
5,650
I6,140
6,400
111
6,710
7,020
7,540
7,540
7,690
I7,920
7,850
(a) Enrollment Market Projections based on an Enrollment Demand Model and the Enrollment Management Model. i(b) Revised estimates based on actual 1990-901 Summer and Fall Quarter enrollment data.
30

FIGURE 9
CUMULATIVE ENROLLMENT LEVELS
Zn
2
11
10
7
5
2
UTAH VALLEY COMMUN I TY COLLEGEENROLLMENT HISTORY AND PROJECTIONS
' I
1977-79 1980-91 leea-eq 1eee-e7 leee-eo 1992-93
0 Fall HOCT + FaIi FTEYEAR
19E5-96 1999-99
0 AC FTE A AY FTE
ANNUAL GROWTH RATES (FTE)
22%
20%
19%
16%
14%
12%
10%
ex
6%
4%
2%
0%
-2%
- 4%
-6%
- 8%
-10%
UTAH VALLEY COMMUN I TY COLLEGEENROLLMENT HISTORY AND PROJECTIONS
41dAiims WIGS] El d.A EIVIELVINIONMEMPIE1111/49MINIMINIIIDAIN
p rA
1979-79 1981-82 1994-85 1997-99 1990-91 1999-94 1996-97 1999-00
YEAR
3 1

TABLE 17UTAH SYSTEM OF HIGHER EDUCATION
Enrollment History, Management Targets, and Projections from 1977-78 to 1999-00
Salt Lake Community College
Total Institution
Year Res
ACTUALS:
Fall Headcount
Nonres Total Res
Fall FTE
Nonres Total Res
Academic Year
Nonres Total Res
Annualized Year
Nonres Total
1977-78 6,331 132 6,463 3,843 136 3,979 3,478 121 3,599 3,837 137 3,974
1978-79 6,359 128 6,487 3,584 133 3,717 3,299 137 3,436 3,670 144 3,814
1979-80 5,722 126 5,848 3,638 139 3,777 3,336 136 3,472 3,721 149 3,870
1980-81 5,853 84 5,937 3,984 91 4,075 3,727 93 3,820 4,118 119 4,237
1981-82 6,313 70 6,383 4,088 73 4,161 4,033 66 4,099 4,507 66 4,573
1982-83 7,445 63 7,508 4,853 60 4,913 4,704 54 4,758 5,273 68 5,341
1983-84 7,998 62 8,060 5,127 49 5,176 4,884 38 4,922 5,474 48 5,522
1984-85 8,242 47 8,289 5,280 37 5,317 4,943 33 4,976 5,520 43 5,563
1985-86 8,243 64 8,307 5,402 53 5,455 5,058 46 5,104 5,666 54 5,720
1986-87 8,756 59 8,315 5,511 43 5,554 5,168 43 5,211 5,788 57 5,845
1987-88 9,389 47 9,436 5,808 40 5,848 5,410 35 5,445 6,027 46 6,073
1988-89 9,294 73 9,367 5,840 53 5,893 5,764 49 5,813 6,471 59 6,530
1989-90 10,900 103 11,003 6,733 86 6,819 6,648 90 6,737 7,480 104 7,584
1990-91
Funded Target: 7,420
Projected (a)
11,500 90 11,590 7,150 70 7,220 7,380 70 7,450 8,280 80 8,360.
Actual 13,028 316 13,344 7,745 173 7,918
Revised Estimates (b): 8,085 168 8,253 9,079 202 9,281
PROJECTED
1991-92 14,310 90 14,400 8,890 70 8,960 8,700 70 8,770 9,760 80 9,840
1992-93 14,600 90 14,690 9,070 70 9,140 8,870 70 8,940 9,960 80 10,040
1993-94 14,790 90 14,880 9,190 70 9,260 8,990 70 9,060 10,090 80 10,170
1994-95 15,000 90 15,090 9,320 70 9,390 9,120 70 9,190 10,230 80 10,310
1995-96 15,890 90 15,980 9,870 70 9,940 9,660 70 9.730 10,840 80 10,920
1996-97 16,300 90 16,390 10,130 70 10,200 9,910 70 9,980 11,120 80 11,200
1997-98 16,540 90 16,630 10,280 70 10,350 10,050 70 10,120 11,280 80 11,360
1998-99 17,050 90 17,140 10,590 70 10,660 10,360 70 10,430 11,630 80 11,710
1999-00 17,250 90 17,340 10,720 70 10,790 10,480 70 10,550 11,770 80 11,850
(a) Enrollment Market Projections based on an Enrollment Demand Model and the Enrollment Management Model.
(b) Revised estimates based on actual 1990-901 Summer and Fall Quarter enrollment data.
32

FIGURE 10
CUMULATIVE ENROLLMENT LEVELS
18
17
16
15
14
13
12
11
10
7
6
4
3
SALT LAKE COMMUNITY COLLEGEENROLLMENT HISTORY AND PROJECTIONS
__AMEN=-411,SWONWIF'-
_-_-.44111PP-
Ari
1677-791 19610-91 1993-94 1996-87 1999-90 1992-93 1995-96 1998-95
YEAR0 FeiI HOCT Feit FTE 0 AC FTE p AY FTE
ANNUAL GROWIE RATES (FTE)
24%
22%
20%
18%
16%
14%
12%
10%
ex
6%
4%
0%
- 2%
- 4%
- 6%
- 89C
-10%1978-7S
SALT LAKE COMMUNITY COLLEGEENROLLMENT HISTORY AND PROJECTIONS
1, r00,d
IddirPd'O.W. 40. 4 MN .. sron4
,sa
Kg FALEIMININIESTAIMINIMINWANIEM .
1934-85 1987-88 1990-91
YEAR
1993-94 1996- 97 1999-00
33r- 2

TABLE 1 7aUTAH SYSTEM OF HIGHER EDUCATION
Enrollment History, Management Targets, and Projections from 1977-78 to 1999-00
Salt Lake Community College
Non SCH Generating
Year Res
ACTUALS:
Fall Headcount
Nonres Total Res
Fall FTE
Nonres Total Res
Academic Year
Nonres Total Res
Annualized Year
Nonres Total
1977-78
1978-79
1979-80
1980-81
1981-82
1982-83
1983-84
1984-85
1985-86
1986-87
1987-88
1988-89 304 15 319 82 5 87 110 7 117 134 7 141
1989-90 368 4 372 98 5 103 112 4 116 135 5 140
1990-91
Funded Target:
Projected (a)
Actual 844 120 964 141 20 161
Revised Estimates (b):
PROJECTED
1991-92
1992-93
1993-94
1994-95
1995-96
1996-97
1997-98
1998-99
1999-00
(a) Enrollment Market Projections basA on an EnrJilment Demand Model and the Enrollment Management Model.
(b) Revised estimates based on actual 1990-901 Summer and Fall Quarter enrollment data.
NOTE: Included in Total Institution for projection purposes.
34
5 3

TABLE 18
UTAH SYSTEM OF HIGHER EDUCATIONINSTITUTIONS' SHARE OF THE MARKETFALL HEADCOUNT AND ANNUALIZED FTE
FALL HEADCOUNT ENROLLMENT
79-80 89-90 99-00
Actual Actual Projected
ANNUALIZED FTE ENROLLMENT
79-80 89-90 99-00
Actual Actual Projected
UNIVERSITY OF UTAH
Enrollment 21,992 24,432 27,240 18,818 19,629 21,780
Percent of Total USHE 37.93% 30.10% 25.94% 39.01% 31.47% 27.17%
UTAH STATE UNIVERSITY
Enrollment 9,875 14,361 18,560 9,562 11,205 14,230
Percent of Total USHE 17.03% 17.69% 17.68% 19.82% 17.97% 17.75%
SUBTOTAL RESEARCH UNIVERSITIES
Enrollment 31,867 38,793 45,800 28,380 30,834 36,010
Percent of Total USHE 54.96% 47.80% 43.62% 58.834 49.44% 44.93%
WEBER STATE UNIVERSITY
Enrollment 10,504 13,650 18,280 8,116 10,034 13,490
Percent of Total USHE 18.12% 16.82% 17.41% 16.83% 16.09% 16.83%
SOUTHER UTAH UNIVERSITY
Enrollment 1,966 3,502 4,560 1,853 3,034 4,180
Percent of Total USHE 3.39% 4.31% 4.34% 3.84% 4.86% 5.22%
SUBTOTAL COMPREHENSIVE UNIVERSE.JS
Enrollment 12,470 17,152 22,840 9,969 13,068 17,670
Percent of Total USHE 21.51: 21.13% 21.75% 20.67% 20.95% 22.054
SNOW COLLEGE
Enrollment 1,127 1,734 2,290 1,002 1,616 2,080
Percent of Total USHE 1.94% 2.14% 2.18% 2.08% 2.59% 2.60%
DIXIE COLLEGE
Enrollment 1,589 2,381 3,270 1,141 1,992 2,700
Percent of Total USHE 2.74% 2.93% 3.11% 2.37% 3.19% 3.37%
COLLEGE OF EASTERN UTAH
Enrollment 950 2,341 3,190 625 1,420 1,990
Percent of Total USHE 1.64% 2.88% 3.04% 1.30% 2.28% 2.48%
UTAH VALLEY COMMUNITY COLLEGE
Enrollment 4,130 7,758 10,270 3,250 5,854 7,850
Percent of Total USHE 7.12% 9.56% 9.78% 6.74% 9.39% 9.79%
SALT LAKE COMMUNITY COLLEGE
Enrollment 5,848 11,003 17,340 3,870 7,584 11,850
Percent of Total USHE 10.09% 13.56% 16.51% 8.02% 12.16% 14.78%
SUBTOTAL COMMUNITY COLLEGES
Enrollment 13,644 25,217 36,360 9,888 18,466 26,470
Percent of Total USHE 23.53% 31.07% 34.63% 20.50% 29.61% 33.03%
GRAND TOTAL USHE 57,981 81.162 105,000 48,237 62,368 80,150
*WITH ENROLLMENT MANAGEMENT
354
BEST COPY AVAILABLE
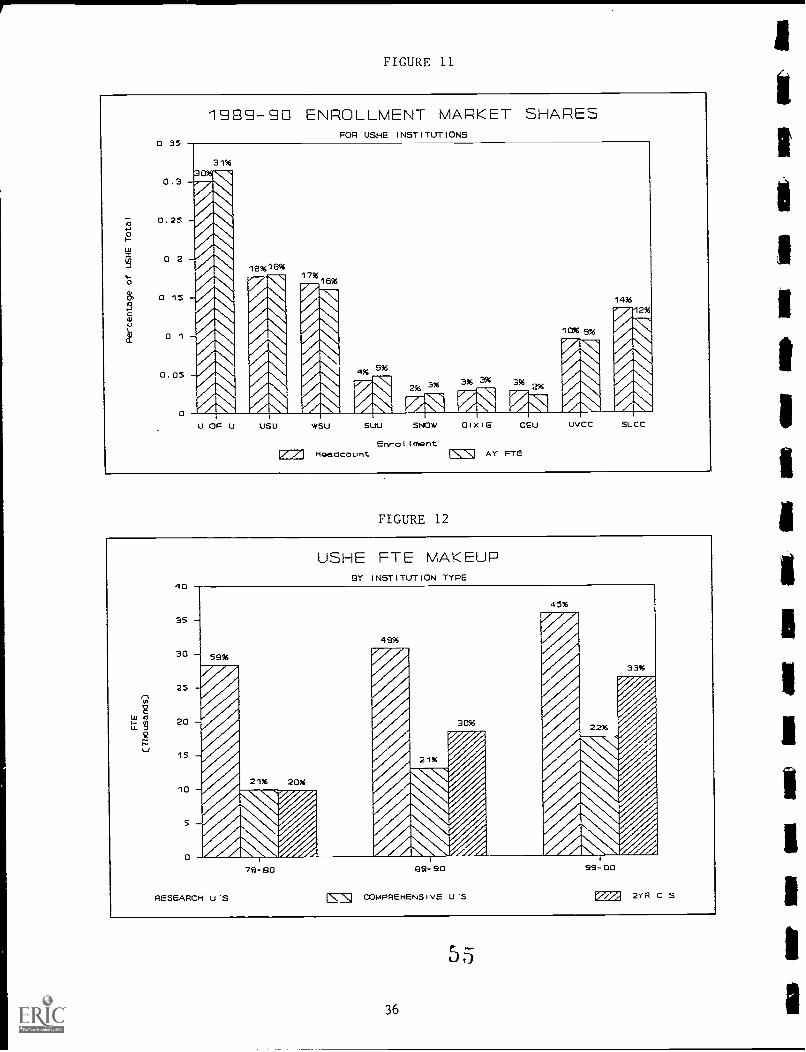
FIGURE 11
1999-90 ENROLLMENT MARKET SHARESFOR USHE INSTITUTIONS
USU NYSU SUU SNOW
HeadcountEnrollment
DIXIE CEU
NNcl AY FTE
UVCC SUCC
FIGURE 12
L. 9
USHE FTE MAKEUPBY INSTITUTION TYPE
RESEARCH U.S
79-90 El9 -90
L--E1 COMPREHENSIVE U'S
99-00
F772 2YR C S
55
36

FIGURE 13
USHE GROWTH FROM 79-80 TO 99-90TOTAL FTE GROWTH 14,131
S -
3
2 S -2
wa2 -L9 1,918
1,643
1.5 -1,181
811
0.5
U OF U USU WSu SUU
814 r851 795
Pr AAA/
2,604
3,714
SNOW DIXIE CSU uVCC SLCC
FIGURE 14
USHE GROWTH FROM 99-90 TO 99-00TOTAL FTE GROWTH 17,762
4 5
3.5
2.52'3
1.5
0.5
2.151
3,025
3,456
1, 146
446
708570
1,995
4,266
AdA Ad AdU OF U USU WSU SUU SNOW (DIXIE CSU uVCC SLCC
37

SKILLS CENTER
In 1990-91 the Skills Center, previously funded through Public Education,was transferred to Salt Lake Community College. To date, activity at the SkillsCenter has not been incorporated into the USHE enrollment reporting andprojection process. Total Skills Center activity for October 1989 and October1990 are reported below.
October 1989 October 1990
Total Students Served 835 3771
New Enrollments 109 148
Total Membership Hours 34,339 31,780
Total Students Served decreased in October 1990 because offederal funding cuts.
5 738
3

C:\OATABK\ACAVOC LAP:28-Dec-90
TABLf 10UTAH SYSTEM OF HIGHER EDUCATION
Fall 1990 Academic-General and Vocational-Technical Headcount
By Course Level and Residency Status
Institution Course TypeCourseLevel
Resident
Number Percent
(1) (2)
Nonresident
Number Percent
(3) (4)
Total
Number Percent
(4) (5)
UNIVERSITY OF UTAH Academic & General Lower 9,236 36.33% 1,343 5.28% 10,579 41.61%
Upper 9,899 38.93% 531 2.09% 10,430 41.02%
Beg Grad 2,210 8.69% 639 2.51% 2,849 11.21%
Adv Grad 1,024 4.03% 543 2.14% 1,567 6.16%
Subtotal 22,369 87.98% 3,056 12.02% 25,425 100.00%
Vocational/Technical 0 0.00% 0 0.00% 0 0.00%
TOTAL 22,369 87.98% 3,056 12.02% 25,425 100.00%
UTAH STATE UNIVERSITY Academic & General Lower 6,251 40.14% 1,054 6.77% 7,305 46.91%
Upper 4,556 29.26% 446 2.86% 5,002 32.12%
Beg Grad 2,142 13.76% 533 3.42% 2,675 17.18%
Adv Grad 150 0.96% 264 1.70% 414 2.66%
Subtotal 13,099 84.12% 2,297 14.7516 15,396 98.87%
Vocational/Technical 154 0.99% 22 0.14% 176 1.13%
TOTAL 13,253 85.11% 2,319 14.89% 15,572 100.00%
WEBER STATE UNIVERSITY Academic & General Lower 5,895 41.77% 290 2.05% 6,186 43.83%
Upper 4,237 30.02% 160 1.13% 4,397 31.16%
Beg Grad 138 0.98% o 0.00% 137 0.97%subtotal 10.270 72.77% 450 3.19% loam 75.96%
Vocational/Technical 3,197 22.65% 196 1.39% 3,393 24.04%
TOTAL 13,467 95.42% 646 4.58% 14,113 100.00%
SO. UTAH UNIVERSITY Academic & General Lower 2,218 55.41% 197 4.92% 2,415 60.33%
Upper 1,273 31.80% 38 0.95% 1,311 32.75%
Beg Grad 23 0.57% 1 0.02% 24 0.60%
Subtotal 3,514 87.78% 236 5.90% 3,750 93.68%
Vocational/Technical 249 6.22% 4 0.10% 253 6.32%
TOTAL 3,763 94.00% 240 6.00% 4,003 100.00%
SNOW COLLEGE Academic & General Lower 1,240 66.24% 283 15.12% 1,523 81.36%
Vocational/Technical 300 16.03% 49 2.62% 349 18.64%
TOTAL 1,540 82.26% 332 17.74% 1,872 100.00%
DIXIE COLLEGE Academic & General Lower 1,651 65.31% 124 4.91% 1,775 70.21%
Vocational/Technical @ 703 27.81% 50 1.98% 753 29.79%
TOTAL 2,354 93.12% 174 6.88% 2,528 100.00%
COLLEGE OF EASTERN UTAH Academic & General Lower 1,707 57.67% 69 2.33% 1,776 60.00%
Vocational/Technical 1,144 38.65% 40 1.35% 1,184 40.00%
TOTAL 2,851 96.32% 109 3.68% 2,960 100.00%
UT VALLEY COMM COLLEGE Academic & General Lower 3,946 50.04% 567 7.19% 4,513 57.23%
Vocational/Technical 3,186 40.40% 187 2.37% 3,373 42.77%
TOTAL 7,132 90.44% 754 9.56% 7,886 100.00%
SALT LAKE COMM COLLEGE Academic & General Lower 4,603 34.49% 76 0.57% 4,679 35.06%
Vocational/Technical @@ 8,425 63.14% 240 1.80% 8,665 64.94%
TOTAL 13,028 97.63% 316 2.37% 13,344 100.00%
SYSTEMWIDE Academic & General Lower 36,747 41.90% 4,003 4.56% 40,751 46.46%
Upper 19,965 22.76% 1,175 1.34% 21,140 24.10%
Beg Grad 4,513 5.15% 1,173 1.34% 5,685 6.48%
Adv Grad 1,174 1.34% 807 0.92% 1,981 2.26%
Subtotal 62,399 71.15% 7,158 8.16% 69,557 79.31%
Vocational/Technical 17,358 19.79% 788 0.90% 18,146 20.69%
TOTAL 79,757 90.94% 7,946 9.06% 87,703 100.00%
@ 329 Elder Hostel removed from voc/tech.
@@ Non-SCH included in voc/tech.
-
BEST COPY AVAILABLE
39

CADATABK\ACAVOC LAP:28-Dec-90
TABLE 2c5UTAH SYSTEM OF HIGHER EDUCATION
Fall 1990 Academic-General and Vocational-Technical FTE'sBy Course Level and Residency Status
Institution Course Type
Course
Level
Resident
Number Percent
(1) (2)
Nonresident
Number Percent
(3) (4)
Total
Number Percent
(4) (5)
UNIVERSITY OF 017A Academic & General Lower 6,919 34.75% 1,136 5.71% 8,056 40.46%
Upper 7,644 38.39% 471 2.37% 8,115 40.75%
Beg Grad 1,725 8.66% 523 2.63% 2,247 11.28%
Adv Grad 1,062 5.33% 432 2.17% 1,494 7.50%
Subtotal 17.350 87.13% 2,562 12.87% 19,912 100.00%
Vocational/Technical o 0.00% 0 0700% 0 0.00%
TOTAL 17,350 87.13% 2,562 12.87% 19,912 100.00%
UTAH STATE UNIVERSITY Academic & General Lower 4,577 39.76% 954 8.29% 5,531 48.04%
Upper 3,760 32.66% 396 3.44% 4,156 36.10%
Beg Grad 1,017 8.83% 388 3.37% 1,405 12.20%
Adv Grad 103 0.89% 198 1.72% 301 2.61%
Subtotal 9,457 82.14% 1,936 16.82% 11,393 98.96%
Vocational/Technical 103 0.89% 17 0.15% 120 1.04%
TOTAL 9,560 83.04% 1,953 16.96% 11,513 100.00%
wEBER STATE UNIVERSITY Academic & General Lower 4,206 41.84% 248 2.47% 4,454 44.31%
Upper 3,008 29.92% 124 1.23% 3,132 31.15%
Beg Grad 86 0.86% 0 0.00% 86 0.86%
Subtotal 7,300 72.62% 372 3.70% 7,672 76.32%
vocational/Technical 2,202 21.90% 179 1.78% 2,381 23.68%
TOTAL 9,502 94.52% 551 5.48% 10,053 100.00%
SO. UTAH UNIVERSITY Academic & General Lower 1,543 48.31% 192 6.01% 1.735 54.32%
Upper 1,172 35.69% 36 1.13% 1,208 37.82%
Beg Grad 19 0.59% 1 0.03% 20 0.63%
Subtotal 2,734 85.60% 229 7.17% 2,963 92.77%
Vocational/Technical " 227 7.11% ,4 0.13% 231 7.23%
TOTAL 2,961 92.71% 233 7.29% 3,194 100.00%
SNOW COLLEGE Academic & General Lower 1,133 63.01% 300 16.69% 1,433 79.70%
Vocational/Technical 314 17.46t 51 2.84% 365 20.30%
TOTAL 1,447 80.48. 351 19.52% 1.798 100.00%
DIXIE COLLEGE Academic & General Lower 1,387 64.27% 124 5.75% 1,511 70.02%
Vocational/Technical @ 595 27.57% 52 2.41% 647 29.98%
TOTAL 1,982 91.84% 176 8.16% 2,158 100.00%
COLLEGE OF EASTERN UTAH Academic & General Lower 994 55.22% 45 2.50% 1,039 57.72%
Vocational/Technical 740 41.11% 21 1.17% 761 42.28%
TOTAL 1,734 96.33% 66 3.67% 1,800 100.00%
UT VALLEY COMM COLLEGE @@ Academic & General Lower 2.577 49.32% 433 8.29% 3,010 57.61%
Vocational/Technical 2,067 39.56% 148 2.83% 2,215 42.39%
TOTAL 4,644 88.88% 581 11.12% 5,225 100.00%
SALT LAKE COMM COLLEGE Academic & General Lower 2,945 37.19% 64 0.81% 3,008 37.99%
Vocational/Technical 4,800 60.62% 109 1.38% 4,910 62.01%
TOTAL 7,745 97.82% 173 2.18% 7,918 100.00%
SYSTEMWIDE Academic & General Lower 26.281 41.34% 3,496 5.50% 29,777 46.84%
Upper 15,584 24.51% 1,027 1.62% 16,611 26.13%
Beg Grad 2,847 4.48% 912 1.43% 3,758 5.91%
Adv Grad 1,165 1.83% 630 0.99% 1,795 2.82%
Subtotal 45,877 72.17% 6,065 9.54% 51,941 81.71%
Vocational/Technical 11,048 17.38% 581 0.91% 11,630 18.29%
TOTAL 56,925 89.55% 6,646 10.45% 63,571 100.00%
@ 81 Elder Hostel removed from Voc/Tech.
@@ 59 FTE for x.5 credit hours estimated.
" 23 STIT added to Resident Voc/Tech.
40

FIGURE 15 & 16
USHE FALL 1990 HEADCOUNT ENROLLMENTBy Course Level
Lower 46%
Up Per 24%
Sources Third Mak Enrollment Reports
Voc -Tech 21%
Ady Grad 2%
Bag Grad 6%
USHE FALL 1990 FTE ENROLLMENTBy Course Level
Lower 47% ,..*:-..***::**0$M.IMAW
ommwmg4g4$eAkknkkkkkkk*****:-*****$$$$$$$$$$WMOMMW"mgMakkw"oommeo'tl*e".
Udder 26%
Source: Third week Enrollment Reports
Voo -Tech IS%
Adv Grad 3%
Seg Grad 6%
4 1 C

FIGURE 17 & 18
USHE FALL 1990 HEADCOUNT ENROLLMENTBy Residency
Resident91%
Source: Thlrcl Weak Enrollment Reports
Nonresident9%
USHE FALL 1990 FTE ENROLLMENTBy Residency
Resident90%
Source: Third Week Enrellrnent Reports
Nonresident10%
6 1
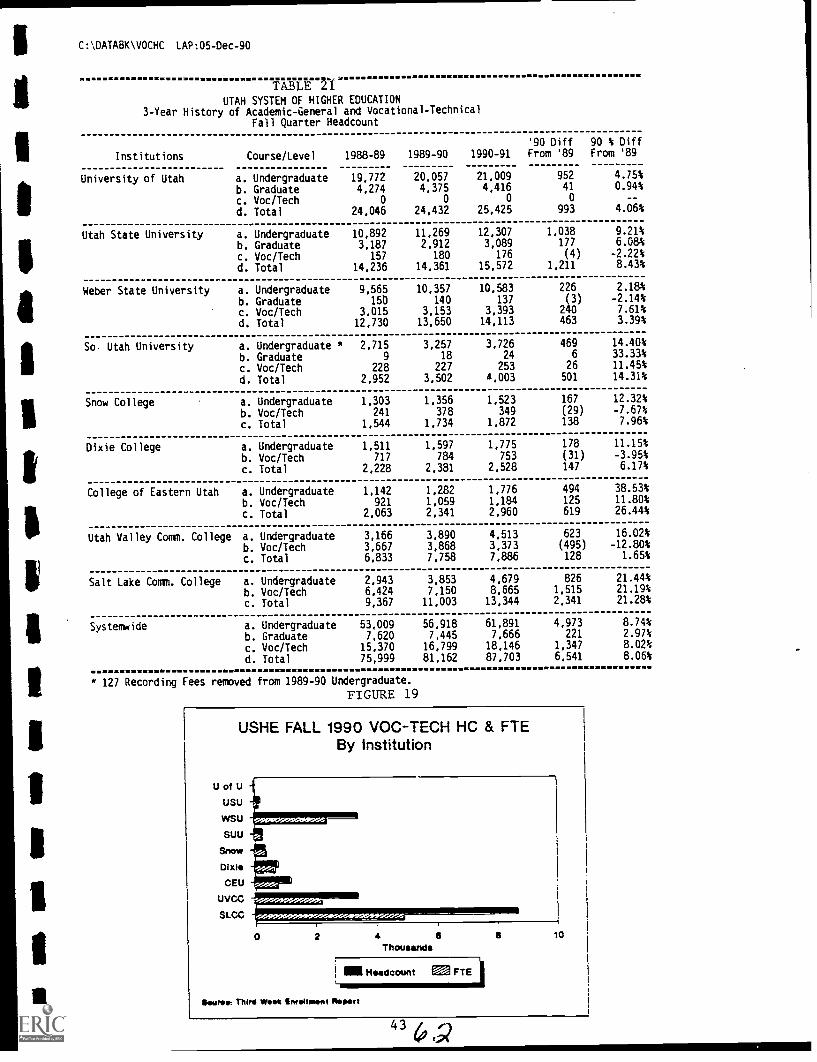
C:\DATA8K\VOCHC LAP:05-Dec-90
TIOIJE 2fUTAH SYSTEM OF HIGHER EDUCATION
3-Year History of Academic-General and Vocational-TechnicalFall Quarter Headcount
Institutions Course/Level
University of Utah a. Undergraduateb. Graduatec. Voc/Techd. Total
Utah State University a. Undergraduateb. GraduateC. Voc/Techd. Total
Weber State University a. Undergraduateb. Graduatec. Voc/Techd. Total
So- Utah University a. Undergraduate *b. Graduatec. Voc/Techd. Total
Snow College a. Undergraduateb. Voc/Techc. Total
Dixie College a. Undergraduateb. Voc/Techc. Total
College of Eastern Utah a. Undergraduateb. Voc/Techc. Total
Utah Valley Comm. College a. Undergraduateb. Voc/Techc. Total
Salt Lake Comm. College a. Undergraduateb. Voc/Techc. Total
Systemwide a. Undergraduateb. Graduatec. Voc/Techd. Total
90 Diff 90 % Diff
1988-89 1989-90 1990-91 From '89 From '89
19,772 20,057 21,009 952 4.75%
4,274 4,375 4,416 41 0.94%
0 0 0 0
24,046 24,432 25,425 993 4.06%
10,892 11,269 12,307 1,038 9.21%
3,187 2,912 3,089 177 6.084
157 180 176 (4) -2.22%
14,236 14,361 15,572 1,211 8.43%
9,565 10,357 10,583 226 2.184
150 140 137 (3) -2.14%
3,015 3,153 3,393 240 7.61%
12,730 13,650 14,113 463 3.39%
2,715 3.257 3,726 469 14.40%
9 18 24 6 33.33%
228 227 253 26 11.45%
2.952 3,502 A,003 501 14.31%
1,303 1,356 1,523 167 12.32%
241 378 349 (29) -7.67%
1,544 1.734 1,872 138 7.96%
1,511 1,597 1,775 178 11.15%
717 784 753 (31) -3.95%
2,228 2,381 2,528 147 6.17%
1,142 1,282 1,776 494 38.53%
921 1,059 1,184 125 11.80%
2,063 2.341 2,960 619 26.44%
3,166 3,890 4,513 623 16.02%
3,667 3,868 3,373 (495) -12.80%
6,833 7,758 7.886 128 1.65%
2,943 3,853 4,679 826 21.44%
6,424 7,150 8,665 1,515 21.19%
9,367 11.003 13,344 2,341 21.28%
53,009 56,918 61,891 4,973 8.74%
7,620 7,445 7,666 221 2.97%
15,370 16,799 18,146 1,347 8.02%
75,999 81,162 87,703 6,541 8.06%
* 127 Recording Fees removed from 1989-90 Undergraduate.
FIGURE 19
USHE FALL 1990 VOC-TECH HC & FTEBy Institution
U of U
USU
WSU
SUU
Snow
Dixie
CEU
UVCC
SLCC
0 2 4 a 8 10Thousand.
11111 Headcount E0 FTE
&WM Thlr4 Wit* Entatiment %pert
4340,

C:\CATABK\LVLHIST LAP:05-Dec-90
TABLE 22UTAH SYSTEM OF HIGHER EDUCATION
I3-year History of Academic-General and Voc-Tech Fall Quarter FTE's
90 Diff % of inst '90 % Diff1978-79 1979-80 1980-81 1981-82 1982-83 1983-84 1984-85 1985-86 1986-87 1987-88 1988-89 1989-90 1990-91 Prom '89 increase From '89
,niversity of Utah
a. undergraduate 13,851 14,218 14,734 15,220 15,494 15,693 15.782 15,607 15,422 15,389 15,004 15,212 16,021 809 88.80% 5.32%n. Graduate 4,223 4,045 3,985 3,745 3,802 3,897 3,723 3,804 3,707 3,797 3,803 3,789 3,891 102 11.20% 2.69%C. voc.-Tecnnical -- -- -- -- -- -- -- -- -- -- -- -- -- -- -- --a. Subtotal
titan State University
4. Undergraduate
18,074
7,757
18,263
7,966
18,719
8.413
18,965
8,505
19,296
8,514
19,590
8,784
19,505
8,540
19,411
8,325
19,129
8,342
19,186
8,218
18,807
8,329
19,001
8,822
19.912 911
9,687 865
100.00%
90.86%
4.79%
9.81%0. Graduate 1,031 1.041 1,178 1,124 1,273 1,625 1,433 1,268 1,298 1,451 1,640 1,623 1,706 83 8.72% 5.11%c. Pac.-Technical 267 239 272 279 270 263 181 152 160 144 116 116 120 4 0.42% 3.45%a. Subtotal
weber State University
a. Undergraduate
9,055
6,026
9,246
6,267
9,863
6,893
9,908
6,486
10,057
5,872
10,672
5,929
10,154
5,785
9,745
5,926
9,800
6,018
9,813
6,508
10,085
6,871
10,561
7,297
11,513 952
7,586 289
100.00%
59.71%
9.01%
3.96%8. Graduate 35 48 42 47 59 43 47 40 90 69 101 81 86 5 1.03% 6.17%c. Voc.-Technical 1,174 1,505 1,422 1,910 2,635 2,597 2,455 2,332 2,445 2,270 2,105 2,191 2,381 190 39.26% 8.67%4. Subtotal 7,235 7,820 8,357 8,443 8,566 8,569 8,287 8,298 8,553 8,847 9,077 9,569 10,053 484 100.00% 5.06%
So Utah University
a. Undergraduate 1,567 1.647 1,796 1,696 1,939 2,000 2,111 2,118 2,136 2,216 2,553 2.665 2,943 278 92.36% 10.43%b. Graduate -- -- -- -- -- -- -- 1 2 11 8 15 20 5 1.66% 33.33%C. Voc.-Technical 155 187 148 200 228 296 327 229 433 458 210 213 231 18 5.98% 8.45%d. Subtotal 1,722 1,834 1,944 1,896 2,167 2,296 2,438 2,348 2,571 2,685 2,771 2,893 3,194 301 100.00% 10.40%
Snow Collegea. Undergraduate 867 1,003 1,032 862 806 874 834 794 987 967 1,172 1,247 1,433 186 105.08% 14.92%8. Voc.-Tachnical 106 100 163 347 337 342 394 400 353 347 249 374 365 (9) -5.08% -2.41%c. Subtotal 973 1,103 1,195 1,209 1,143 1,216 1,228 1,194 1,340 1,313 1,421 1,621 1,798 177 100.00% 10.92%
Dixie College
a. Undergraduate 859 875 1,047 964 770 751 874 876 1,043 1,155 1,265 1,365 1,511 146 136.45% 10.70%8. Voc.-Technical Ic. Subtotal
333
1,192
300
1,175
4101,457
556
1,521
864
1,634
831
1,582
710
1,584
861
1,737
950
1,993
733
1,889
608
1,873
686
2,051
647 (39)
2,158 107
-36.45%
100.00%
-5:2692ii:
College of Eastern Uta. Undergraduate 422 495 405 413 408 562 602 567 728 762 837 856 1,039 183 66.55% 21.38%b. Voc.-Techntcal 265 181 345 450 466 434 519 492 540 534 554 669 761 92 33.45% 13.75%c. Subtotal 687 676 750 863 874 996 1,121 1,059 1,268 1,296 1,391 1,525 1,800 275 100.00% 18.03%
Ut Valley Comm Col
a. Undergraduate 256 529 589 759 1,045 1,304 1,393 1,545 1,828 2,263 2,408 2,985 3,010 25 3.28% 0.84%b. Voc.-Technical 2,613 2,683 3.089 3,367 3,723 3,937 3,448 3,341 3,321 3,157 2,910 3,002 2,215 (787) -103.28% -26.22%c. Subtotal 2,869 3,212 3,678 4,126 4,768 5,241 4,841 4,886 5,148 5,420 5,318 5,987 5,225 (762) -100.00% -12.73%
Salt Lake Comm Cola. undergraduate 140 66 436 390 520 450 561 707 876 1,472 1,914 2,457 3.008 551 50.14% 22.43%8. Voc.-Technica1 3,577 3,711 3,639 3,771 4,392 4,726 4,756 4,748 4,678 4,376 3,979 4,362 4,910 548 49.86% 12.56%c. Subtotal 3,717 3,777 4,075 4,161 4,912 5,176 5,317 5,455 5.554 5,848 5,893 6,819 7,918 1,099 100.00% 16.12%
Systemwidea. Jndergraduate 31,745 33.066 35,345 35,296 35,368 36,347 36,482 36,465 37,379 38,950 40,353 42,906 46,238 3,332 94.02% 7.77%b. Graduate 5,289 5,134 5,205 4,916 5,134 5,565 5,203 5,113 5,097 5.328 5,552 5,508 5,703 195 5.50% 3.54%c. Voc.-Technical 8,490 8,906 9,488 10,880 12,916 13,426 12,790 12,555 12,880 12,019 10,731 11,613 11.630 17 0.48% 0.15%d. Total 45,524 47,106 50,038 51,092 53,418 55,338 54,475 54,133 55,356 56,297 56,636 60,027 63,571 3,544 100.00% 5.90%
* U of U includes School of Medicine Non-MD from 1985-86 on. FIGURE 2081 Uder Hostel removed from voc/tech.
USHE FTE FALL QUARTER HISTORYAcademic-General & Vocational-Technical
Thousands70
60 1
50 -I
40 1
30 1
20-4,
10
0 '
1978-79 1980-81 1982-83 1984-85 1986-87 1988-89 1990-91
Undargraduats Graduato Voc-Tach -3- Total '
Source. Third Walk Enrollment Reports
44
1
TAB CVOCATIONAL EDUCATION
Enrollments 1
TABLE I Vocational Fall Quarter Headcount 1
TABLE ll Vocational Fall Quarter FTE 1
TABLE III 1989-90 Noncredit Headcount 2
Short-Term Intensive Training 2
Master Planning 2
Additional Highlights 3
Financial Maintenance of Effort 3
Summary 4
(SEE ALSO TAB B ENROLLMENTS - TABLES 19 THROUGH 22)

VOCATIONAL EDUCATION
The following are some of the highlights of Vocational Education programsand efforts at Utah System of Higher Education institutions:
I. Enrollments
A. Credit
While there have been individual institutional fluctuations, totalsystem vocational education enrollments for credit continued to growthis year, as evidenced by Fall Quarter headcount.
TABLEFall Quarter Vocational Education Headcount
1985-86 1988-89 1989-90 1990-91
USU 218 157 180 176
WSU 3,075 3,015 3,153 3,393SUU 258 228 227 253SNOW 383 241 378 349DIXIE 1,068 717 784 753
CEj 578 921 1,059 1,184
UVCC 3,141 3,667 3,868 3,373SLCC 7 213 6 424 7 150 8 665
15,934 15,370 16,799 18,146
The growth in headcount enrollment from Fall 1989 to Fall 1990 wasover 8 percent. Full-time Equivalent (FTE) enrollments, on the otherhand, remained approximately the same.
TABLE 11
Fall Quarter Vocational Education FTE
1985-86 1988-89 1989-90 1990-91
USU 152 116 116 120
WSU 2,332 2,105 2,191 2,381
SUU 229 210 213 231
SNOW 400 249 374 366
DIXIE 861 608 686 647
CEU 492 554 669 761
UVCC 3,341 2,910 3,002 2,215SLCC 4 748 3 979 4 362 4 910
12,555 10,731 11,613 11,630
The FTE increase from Fall of 1989-90 was less than one percent. A
major factor for the lack of growth in this area can be attributed tothe drop in vocational FTEs at Utah Valley Community College. UVCCconverted to the semester calendar beginning this fall, and it is
projected that once students become familiar with registrationschedules and appropriate course loads, the overall enrollmentincrease will resume at UVCC.
1
6 5

B. Noncredit
In the noncredit area, substantial enrollment growth continues.TABLE III
1989-90 Noncredit Headcount
WSU SUU SNOW DIXIE CEU UVCC SLCC TOTAL
2,421 389 257 515 2,387 11,204 5,006 22,179
This represents a 20.04 percent growth over last year's 18,428
headcount, and represents the major efforts expended by higher
education institutions to meet business and industry's training needsthrough Custom Fit Training, custom short-term training, licensingcourses, business workshops, skills center training and other areas of
vocational training activities. If we were to add the 22,179 studentsenrolled in noncredit training and the 16,799 students enrolled forcredit for Fall Quarter 1989, the total headcount enrollment for 1989
was 38,978. This represents a very significant effort.
II. Short-Term Intensive Training
In 1989 the Utah System of Higher Education institutions received specific
appropriations to meet business and industry's short-term noncredit
training needs throughout the state. The policies and procedures were
approved in September, 1990; consequently, it was October or Novemberbefore the programs were actually able to begin. Even with that late
start 1,158 Utah citizens were served. The average wage at job placement
following the training was $7.94 per hour, and for specific upgrade
training programs, it was $8.29 per hour. Some of the companies
participating in these training programs include the following:
1. Fabrication Training - McDonnell Douglas
2. Electronics Mechanic - Delta Airlines3. "Senior" Mature Trainee Program - Holiday Inn Reservation Center
4. Machinist Training - Aerospace Industry5. WordPerfect Training - Various Businesses
6. Composite Materials Training - Various Aircraft and Other Industries
7. Gas-tungsten Arc Welding - West Fab8. Welder/Fabrication Training - Steel Structures Inc.
9. Pilot and Instrument Rating Training - Skywest
10. Statistical Process Control Training - Ram
Master Planning
Cooperation between vocational education entities in higher education andpublic education during 1989 continues to be exemplary. A significant
portion of funding for noncredit training at state colleges and
universities came from the State Office of Education's Custom Fit monies.Both sectors have worked together to assist in the development of regional
plans that involved secondary school, Applied Technology Center andcollege planning in the nine regions of the state. The plans were further
reviewed this year and suggestions for improvement were made. These
regional plans will serve as the basis for the new state vocational plan
2

which must be developed to meet tne Reauthorized Carl Perkins' FederalRequirements in July of 1991.
In addition, cooperation and coordination with State Department of
Community and Economic Development has continued to expand as efforts aremade in higher education to make vocational programs more market-drivenand market-responsive. This past year "High Tech" resources weredistributed to four higher education institutions, Weber State University,Southern Utah University, Salt Lake Community College, and Utah ValleyCommunity College, to improve and enhance the computer numerical control(CNC) machining programs at these sites in order to produce more qualifiedmachinists to meet the needs of the expanding aerospace industry and otherindustries in the state.
IV. Additional Highlights
Weber State University's Radiological Sciences Program cluster wasselected to receive the U.S. Secretary of Education's award foroutstanding vocational-technical programs. The final selection wasannounced by the U.S. Secretary of Education Lauro F. Cavazos inSeptember of 1990.
Salt Lake Community College and Utah Valley Community College designatedadministrative units as Applied Technology Centers in order to focus morespecifically on the applied technology center activities in theirregions.
Snow College completed the west campus facility which now houseselectronics, computer information systems, drafting labs, and otherclassroom spaces.
Articulation of the Automotive Program with Sevier Valley ATC wasinitiated.
Utah Valley Community College initiated a composite technology noncreditprogram.
The College used considerable resources for marketing to directlyp-omo te vocational education.
Southern Utah University upgraded computer labs and acquired additionalspecial equipment for the Crime Lab, agriculture, wordprocessing, earlychildhood development and the Computer-Assisted Design (CAD) programs.
V. Financial Maintenance of Effort
Regents' policy directs the Commissioner's Office to provide a financialmaintenance of effort comparison of "target" and "actual" expenditures.A formula was developed to arrive at a target base figure and computationsfrom the cost study are used each year to compare financial maintenance ofeffort.
3 6 7

1989-90 Maintenance of Effort Target and Actual Expenditures
Target Actual
USU $ 616,111 $ 710,447
SE Utah 17,975 17,756
Uintah Basin 30,369 48,619
WSU 6,709,295 7,057,848
SUU 1,090,219 1,042,244
SNOW 845,735 895,780
DIXIE 1,121,370 1,216,891
CEU 1,114,598 1,428,505
UVCC 6,134,516 6,285,715
SLCC 8,405,602 9,619,066
$26,085,840 $28,314,811
VI. Summary
The Utah System of Higher Education continues to place heavy emphasis on
vocational education. The student headcount both in the credit andnoncredit programs increased during this past year. In addition, theshort-term intensive training program was initiated and served over 1,100citizens, and will continue to expand this coming year.
The target level for vocational expenditures, worked out by an agreed uponformula, was $26,Gi5,840 and the actual expenditures exceeded that amount
by $2.23 million.
While all of these things are very positive, there are still some concernsand challenges that need to be noted. Some of these can be addressed in
one year; others will require several years. Those challenges include:(1) funding for the four regions of the state that do not have appliedtechnology centers; (2) development of an automated accounting system thatcaptures noncredit enrollments; (3) enhancement of the image of vocational
education in order to provide a viable alternative for many studentsinterested in well-paying high tech jobs; and (4) the continual need fornew equipment and the upgrading of current equipment.
4 63

ITAB D
TUITION & FEES
Tables 1 through 4 represent Undergraduate Full-Time Studentsper Academic Year for the institution or institutions iisted and their
Peer Comparison Groups including Resident and NonResident Students
TABLE 1 University of Utah
TABLE 2 Utah State University 2
TABLE 3 Weber State University and Southern Utah University 3
TABLE 4 Two-Year Colleges 4
FIGURE 1 1990-91 Undergraduate Resident Tuition & Fees Levelsas a Percent of Peer Group Averages 5
TABLE 5 USHE 1990-91 Tuition by Credit Hour Load for ResidentUndergraduate Students 6
TABLE 6 USHE 1990-91 Tuition & Fees by Credit Hour Loadfor Resident Uodergraduate Students 6
Figures 2 and 3 represent USHE Four Year InstitutionsFigures 4 and 5 represent USHE Two Year Institutions
FIGURE 2 USHE 1990-91 Tuition by Credit Load for ResidentUndergraduate Students 7
FIGURE 3 USHE 1990-91 Tuition & Fees by Credit Load for ResidentUndergraduate Students 7
FIGURE 4 USHE 1990-91 Tuition by Credit Load for ResidentUndergraduate Students 8
FIGURE 5 USHE 1990-91 Tuition & Fees by Credit Load for ResidentUndergraduate Students 8
TABLF. 7 USHE Summary of Undergraduate Tuition & Fees 10

TAB DTUITION & FEES
--Continued--
Figures 6 and 7 represent USHE Four Year InstitutionsFigures 8 and 9 represent USHE Two Year Institutions
FIGURE 6 Tuition & Fees in the 1980's for ResidentUndergraduate Students 12
FIGURE 7 Tuition & Fees in the 1980's in constant dollars forResident Undergraduate Students 12
FIGURE 8 Tuition & Fses in the 1980's for ResidentUndergraduate Students 13
FIGURE 9 Tuition & Fee Increases in the 1980's in constant dollars forResident Undergraduate Students 13
TABLE 8 USHE Undergraduate Tuition In Actual and Real Dollars 14
Figures 10 through 18 represent Tuition Trends Based onResident Undergraduate Tuition for the Institution Listed
FIGURE 10 University of Utah 15
FIGURE 11 Utah State University 15
FIGURE 12 Weber State University 16
FIGURE 13 Southern Utah University 16
FIGURE 14 Snow College 17
FIGURE 15 Dixie College 17
FIGURE 16 College of Eastern Utah 18
FIGURE 17 Utah Valley Community College 18
FIGURE 18 Salt Lake Community College 19
TABLE 9 USHE Undergraduate Student Tuition & Fees for 1990-91 20
7t)
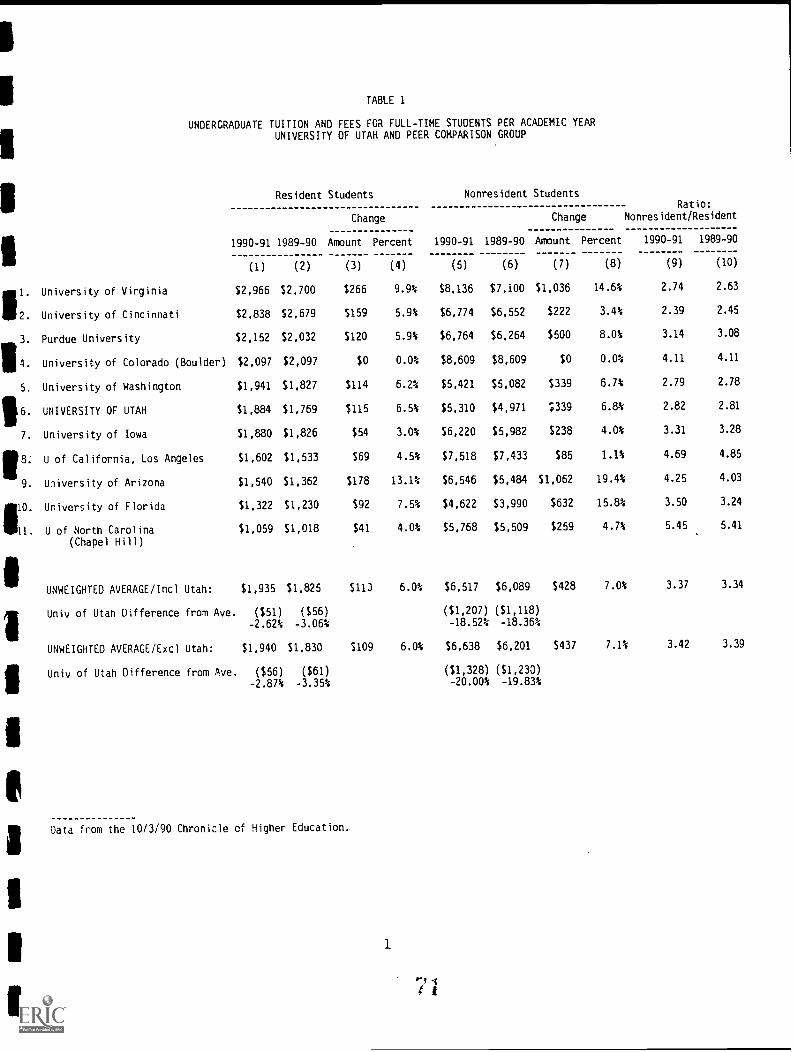
1
.
2.
3.
14.
5.
11 6.
7.
/8.
9.
1111.
TABLE 1
UNDERGRADUATE TUITION AND FEES FOR FULL-TIME STUDENTS PER ACADEMIC YEARUNIVERSITY OF UTAH AND PEER COMPARISON GROUP
Resident Students
1990-91 1989-90
(1)
University of Virginia $2,966
University of Cincinnati $2,838
Purdue University $2,152
University of Colorado (Boulder) $2,097
University of Washington
UNIVERSITY OF UTAH
University of Iowa
U of California, Los Angeles
Diversity of Arizona
University of Florida
U of North Carolina(Chapel Hill)
UNWEIGHTED AVERAGE/Incl Utah:
Univ of Utah Difference from Ave.
UNWEIGHTED AVERAGE/Excl Utah:
Univ of Utah Difference from Ave.
Data from the 10/3/90
$1,941
$1,884
$1,880
$1,602
$1,540
$1,322
$1,059
(2)
$2,700
$2,679
$2,032
$2,097
$1,827
$1,769
$1,826
$1,533
$1,362
$1,230
$1,018
$1,935 $1,825
($51) ($56)
-2.62% -3.06%
$1,940 $1,830
Nonresident Students
Change Change
Ratio:
Nonresident/Resident
Amount Percent 1990-91 1989-90 Amount Percent 1990-91 1989-90
(3) (4) (5) (6) (7) (8) (9) (10)
$266 9.9% $8,136 $7,100 $1,036 14.6% 2.74 2.63
$159 5.9% $6,774 $6,552 $222 3.4% 2.39 2.45
$120 5.9% $6,764 $6,264 $500 8.0% 3.14 3.08
$0 0.0% $8,609 $8,609 $0 0.0% 4.11 4.11
$114 6.2% $5,421 $5,082 $339 6.7% 2.79 2.78
$115 6.5% $5,310 $4,971 ;339 6.8% 2.82 2.81
$54 3.0% $6,220 $5,982 $238 4.0% 3.31 3.28
$69 4.5% $7,518 $7,433 $85 1.1% 4.69 4.85
$178 13.1% $6,546 $5,484 $1,062 19.4% 4.25 4.03
$92 7.5% $4,622 $3,990 $632 15.8% 3.50 3.24
$41 4.0% $5,768 $5,509 $259 4.7% 5.45 5.41
$113 6.0% $6,517 $6,089 $428 7.0% 3.37 3.34
($1,207) ($1,118)
-18.52% -18.36%
$109 6.0% $6,638 $6,201 $437 7.1% 3.42 3.39
($56) ($61) ($1,328) ($1,230)
-2.87% -3.35% -20.00% -19.83%
Chronicle cf Higher Education.
1
4 t

TABLE 2
UNDERGRADUATE TUITION AND FEES FOR FULL-TIME STUDENTS PER ACADEMIC YEARUTAH STATE UNIVERSITY AND PEER COMPARISON GROUP
Resident Students
Change
1990-91 1989-90 Amount Percent
Nonresident StudentsRatio:
Change Nonresident/Resident
1990-91 1989-90 Amount Percent 1990-91 1989-90
(1) (2) (3) (4) (5) (6) (7) (8) (9) (10)
1. VirgInla Tech University $2,846 $2,730 $116 4.24 $6,230 $5,706 $524 9.2% 2.19 2.09
2. University of Maryland $2,267 $2.097 $170 8.1% $6,323 $5,754 $569 9.9% 2.79 2.74
(College Park)3. Color9do State University $2,222 $2,096 $126 6.0% $6,100 $5,648 $452 8.0% 2.75 2.69
4. Washington State University $1,953 $1,827 $126 6.9% $5,433 $5,082 $351 6.9% 2.78 2.78
5. Oregon State University $1.878 $1,707 $171 10.0% $5,637 $4,576 $1,061 23.2% 3.00 2.68
6. Iowa State University $1,826 $1,826 $0 0.0% $5,982 $5,982 $0 0.0% 3.28 3.28
7. University of California, Davis $1,676 $1,607 $69 4.3% $7,592 $7,406 $186 2.5% 4.53 4.61
8. UTAH STATE UNIVERSITY $1,599 $1,500 $99 6.6% $4,413 $4,131 $282 6.8% 2.76 2.75
9. New Mexico State University $1,488 $1,386 $102 7.4% $5,184 $5,082 $102 2.0% 3.48 3.67
(Main Campus)10. Texas A & M university $1,256 $1,200 $56 4.7% $4,376 $4,320 $56 1.3% 3.48 3.60
11. North Carolina State Univ $1.109 $1,050 $59 5.6% $5,818 $5,282 $536 10.1% 5.25 5.03
(Raleigh)
UNWEIGHTED AVERAGE/Incl Utah: $1,829 $1,730 $99 5.84 $5,735 $5,361 $374 7.0% 3.14 3.10
Utah State Difference from Ave. ($230) ($230) ($1,322) ($1,230)
-12.58% -13.284 -23.06% -22.94%
UNWEIGHTED AVERAGE/Excl Utah: $1,852 $1,753 $5,868 $5,484 $384 7.0% 3.17 3.13
Utah State Difference from Ave. ($253) ($253) ($1,455) ($1,353)
-13.67% -14.41% -24.79% -24.67%
Data from the 10/3/90 Chronicle of Higher Education, and telephone contact for Colorado State University.
2
1
I.
a
1
1

TABLE 3
UNDERGRADUATE TUITION AND FEES FOR FULL-TIME STUDENTS PER ACADEMIC YEARWEBER STATE UNIVERSITY, SOUTHERN UTAH uNIVERSITY, AND PEER COMPARISON GROUP
1. Indiana University Northwest
2. Univ of Wisconsin, Oshkosh
3. Southern Oregon St. College
4. Univ of Southern Colorado
5. Eastern Washington University
6. SUNY College at Brockport (NY)
7. Austin Peay State U (TN)
B. WEBER STATE UNIVERSITY
9. SOUTHERN UTAH UNIVERSITY
II10. Boise State University
11. University of Nevada, Las Vegas
11/
12. California State University(Dominguez Hills)
UNWEIGHTED AVERAGE/Incl Utah:
Differences from Average__weber State University
Southern Utah University
,NWEIGHTED AVERAGE/Excl Utah:
cifferences from Aierage__
4eber state university
Southern Utah university
21t1 'rr:m tne 10,'3190 Chronicle
Resident Students
Change
Nonresident Students
Change
Ratio:
Nonresident/Resident
1990-91 1989-90 Amount Percent 1990-91 1989-90 Amount Percent 1990-91 1989-90
(1) (2) (3) (4) (5) (6) (7) (8) (9) (10)
$1,826 $1,724 $102 5.9% $4,549 $4,214 $335 7.9% 2.49 2.44
$1,764 $1,688 $76 4.5% $5,411 $5,049 $362 7.2% 3.07 2.99
$1,824 $1,692 $132 7.8% $4,998 $4,231 $767 18.1% 2.74 2.50
$1,601 $1,537 $64 4.2% $5,525 $5,275 $250 4.7% 3.45 3.43
$1,611 $1,518 $93 6.1% $5,649 $5,325 $324 6.1% 3.51 3.51
$1,586 $1,490 $96 6.4% $4,936 $4,840 $96 2.0% 3.11 3.25
$1,442 $1,372 $70 5.1% $4,646 $4,326 $320 7.4% 3.22 3.15
$1,398 $1,308 $90 6.9% $3,753 $3,513 $240 6.8% 2.68 2.69
$1,350 $1,242 $108 8.7% $3,582 $3,327 $255 7.7% 2.65 2.68
$1,303 $1,224 $79 6.5% $3,303 $3,124 5179 5.7% 2.53 2.55
$1.380 $1,200 $180 15.0% $4,680 $4,200 $480 11.4% 3.39 3.50
$876 $790 $86 10.9% $7,026 $6,502 $524 8.1% 8.02 8.23
$1,497 $1,399 $98 7.0% $4,838 $4,494 $344 7.7% 3.23 3.21
($99) ($91) ($1.535) ($1,370)
-6.60% -6.49% -31.73% -30.48%
($147) ($157) $2,188 $2,008
-9.80% -11.21% 45.22% 44.69%
$1,521 $1,424 $98 6.9% $5,072 $4,709 $364 7.7% 3.33 3.31
($123) ($116) ($1,319) ($1,196)
-8.10% -8.11% -26.01% -25.39%
($171) ($182) ($1,490) ($1,382)
-11.26% -12.75% -29.38% -29.34%
of Higher Education.
3

TABLE 4
UNDERGRADUATE TUITION AND FEES FOR FULL-TIME STUDENTS PER ACADEMIC YEAR
TWO-YEAR COLLEGES AND PEER COMPARISON GROUP
Resident Students Nonresident Students
Change
Ratio:
Change Nonresident/Resident
1990-91 1989-90 Amount Percent 1990-91 1989-90 Amount Percent 1990-91 1989-90
(1) (2) (3) (4) (5) (6) (7) (8) (9) (10)
1. Onondaga Comm College (NY) $1,434 $1,426 $8 0.6% $4,134 $4.126 $8 0.2% 2.88 2.89
2. .lpie Arundel Comm College (MD) $1,320 $1,180 $140 11.9% $5,280 $4,720 $560 11.9% 4.00 4.00
3. SALT LAKE COMMUNITY COLLEGE $1,239 $1,197 $42 3.5% $3,438 $3,315 $123 3.7% 2.77 2.77
4. Grano Rapids Junior College (MI) $1,220 $1,130 $90 8.0% $2,270 $1,710 $560 32.7% 1.86 1.51
5. UTAH VALLEY COMMUNITY COLLEGE $1,194 $1,167 $27 2.3% $3,300 $3,213 $87 2.7% 2.76 2.75
5. ClxIE COLLEGE $1,156 $1,124 $32 2.8% $3,145 $3,055 $90 2.9% 2.72 2.72
SNOW COLLEGE $1,005 $972 $33 3.4% $2,679 $2,598 $81 3.1% 2.67 2.67
3. COLLEGE OF EASTERN UTAH $1,005 $963 $49. 4.4% $2,709 $2,616 $93 3.6% 2.70 2.72
9. Spokane Community College (WA) $867 $832 $35 4.2% $3,402 $3,234 $168 5.2% 3.92 3.89
10. Canville Comm College (VA) $862 $802 $60 7.5% $4,264 $3,962 $302 7.6% 4.95 4.94
II. Chemeketa Comm College (OR) $828 $828 $0 0.0% $2,988 $2,988 SO 0.0% 3.61 3.61
2. North Idaho College $804 $760 $44 5.8% $1,954 $1,910 $44 2.3% 2.43 2.51
13. Joliet Junior College (IL) $780 $690 $90 13.0% $4,305 $3,578 $727 20.3% 5.52 5.19
14. Western Wyoming Comm Clg $622 $578 $44 7.6% $1,154 $1,340 ($186) -13.9% 1.86 2.32
15. Yavapai College (AZ) $590 $562 $28 5.0% $4,550 $4,378 $172 3.9% 7.71 7.79
UNWEIGHTED AVERAGE/Incl Utah: $995 $947 $48 5.0% $3,305 $3,116 $189 6.1% 3.32 3.29
Differences from Average--
Snow College
Dixie College
$10 $25 ($626) ($518)
1.00% 2.60% -18.94% -16.63%
$161 $177 ($160) ($61)
16.17% 18.64% -4.84% -1.96%
College of Eastern Utah $10 $16
1.00% 1.65%
jtah valley Community College $199 $220
19.99% 23.18%
Salt Like Community College $244 $250
24.51% 26.35%
($598) ($500)-18.03% -16.05%
($5) $97
-0.15% 3.114
$133 $199
4.03% 6.38%
UNWEIGHTED AVERAGE/Excl Utah: $933 $879 $54 6.1% $3,430 $3,195 $235 7.4% 3.68 3.64
'Jifferences from Average--
Snow College $72 $93 ($751) ($597)
7.75% 10.61% -21.90% -18.68%
5'xie College $223 $245 ($285) ($140)
23.94% 27.90% -8.31% -4.37%
r.ollege of Eastern Utah $72 ¶84 ($721) ($579)
7.75% 9.58% -21.02% -18.11%
Utah Valley Community College $261 $288 ($130) $18
28.02% 32.79% -3.79% 0.57%
iait L3ke Community College $306 $318 $8 $120
32.84% 36.21% 0.23% 3.77%
-)ata from the 10/3/90 Chronicle of Higher Education, andtelephone contact for Anne Arundel CC, Joliet CC,
',00kane (C, and western Wyoming CC.
4 4
1
1
1
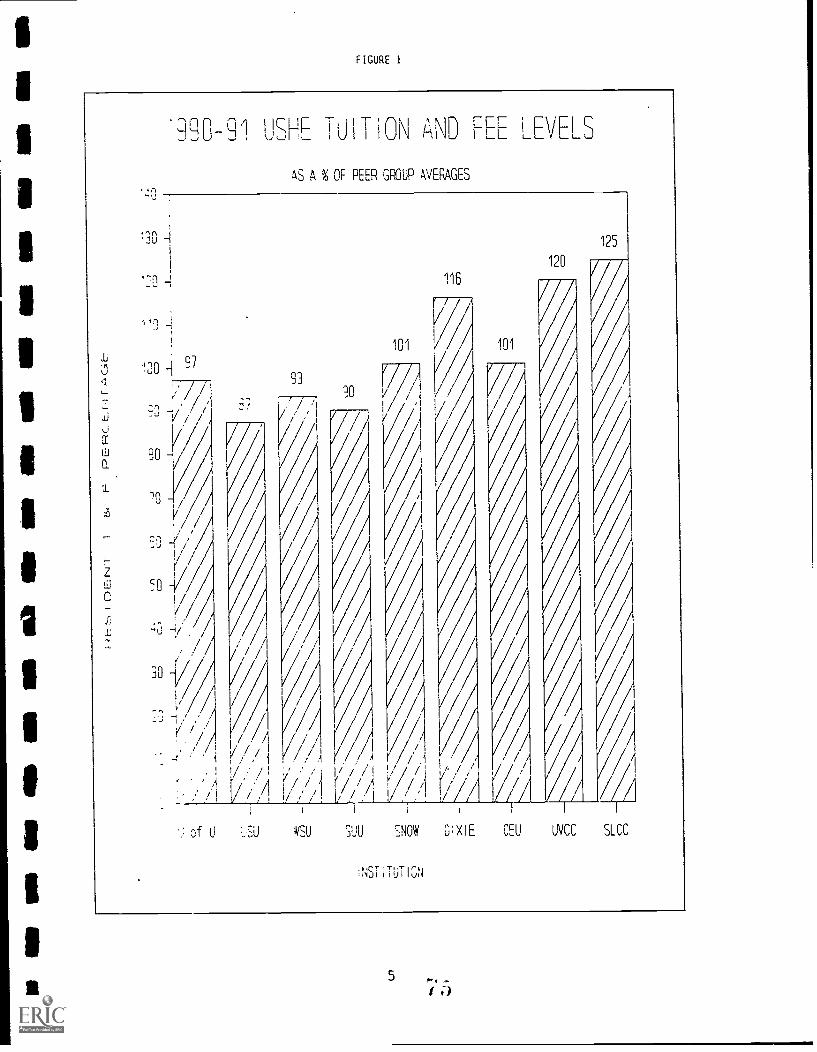
F I GURE 1
aw
*:191-91 USHE TUIT12\ AN: FEE LEVELS
AS A % OF PEER GROUP AVERAGES
93
-77-7
'
101
116
101
120
2r1 t
/
50
('
/,
V
AI /
Df
////,/ /// /,/ /,
WSU SUU
/ b / ,
// ,
,
/1 /1/ //0
SNOW 'XIE CEU
:NSTiTUTICN
UVCC SLCC
5

TABLE 51990-91 TUITION BY QUARTER CREDIT HOUR LOAD
FOR RESIDENT uNDERGRADUATE STUDENTS
U of U USU WSU SUU Snow Dixie CEU UVCC SLCC
1 118.00 76.00 59.00 59.00 46.00 25.70 45.70 42.00 54.00
2 146.50 101.00 90.00 90.00 70.00 51.40 65.00 65.00 78.00
3 175.00 126.00 121.00 121.00 93.00 77.11 84.30 88.00 102.00
4 203.50 151.00 153.00 152.00 117.00 102.80 103.60 111.00 126.00
232.00 176.00 184.00 183.00 139.00 127.22 122.90 134.00 150.00
5 260.50 201.00 216.00 214.00 162.00 152.91 '12.20 157.00 174.00
7 289.00 226.00 247.00 245.00 185.00 178.61 161.50 180.00 198.00
8 317.50 251.00 279.00 276.00 208.00 204.32 180.80 203.00 222.00
9 346.00 276.00 310.00 307.00 231.00 230.02 200.10 226.00 246.00
10 374.50 301.00 337.00 338.00 253.00 253.80 219.40 249.00 270.00
11 403.00 326.00 350.00 338.00 253.00 277.57 238.70 272.00 285.00
12 431.50 351.00 357.00 338.00 253.00 301.35 258.00 295.00 300.00
13 460.00 376.00 357.00 338.00 253.00 301.35 258.00 307.00 311.00
14 488.50 401.00 357.00 338.00 253.00 301.35 258.00 319.00 322.00
15 517.00 427.00 357.00 338.00 253.00 301.35 258.00 319.00 333.00
16 545.50 452.00 357.00 338.00 253.00 301.35 258.00 319.00 344.00
17 574.00 477.00 357.00 338.00 253.00 301.35 258.00 331.00 355.00
18 602.50 502.00 357.00 338.00 253.00 301.35 258.00 343.00 366.00
19 631.00 527.00 380.00 338.00 253.00 301.35 258.00 361.00 377.00
20 659.50 552.00 403.00 338.00 253.00 301.35 277.30 379.00 388.00
21 688.00 577.00 427.00 369.00 276.00 327.05 296.60 397.00 410.00
22 716.50 602.00 450.00 400.00 299.00 352.75 315.90 415.00 432.00
23 745.00 627.00 474.00 431.00 322.00 378.46 335.20 433.00 454.00
24 773.50 652.00 496.00 462.00 345.00 404.15 354.50 451.00 476.00
25 802.00 677.00 520.00 493.00 368.00 428.57 373.80 469.00 498.00
TABLE e1990-91 TUITION AND FEES BY QUARTER CREDIT HOUR LOAD
FOR RESIDENT UNDERGRADUATE STUDENTS
U of U USU WSU SUU Snow Dixie CEU UVCC SLCC
1 173.00 104.00 89.00 81.00 53.00 46.70 53.40 62.00 75.00
205.50 131.00 128.00 122.00 80.00 77.40 80.40 94.00 105.00
3 238.00 161.00 167.00 163.00 107.00 111.11 107.40 126.00 137.00
4 270.50 191.00 208.00 204.00 135.00 142.13 134.40 158.00 168.00
5 303.00 221.00 247.00 245.00 161.00 174.88 161.40 186.00 199.00
6 335.50 250.00 289.00 286.00 188.00 206.91 188.40 214.00 230.00
368.00 318.00 329.00 327.00 215.00 239.94 215.40 242.00 258.00
400.50 347.00 368.00 368.00 242.00 271.98 242.40 271.00 291.00
9 433.00 377.00 412.00 409.00 269.00 306.02 269.40 298.00 320.00
10 465.50 407.00 443.00 450.00 335.00 337.80 296.40 325.00 349.00
11 498.00 432.00 458.00 450.00 335.00 361.57 315.70 351.00 365.00
12 530.50 457.00 466.00 450.00 335.00 385.35 335.00 374.00 380.00
13 563.00 482.00 466.00 450.00 335.00 385.35 335.00 386.00 391.00
14 595.50 507.00 466.00 450.00 335.00 385.35 335.00 398.00 402.00
15 628.00 533.00 466.00 450.00 335.00 385.35 335.00 398.00 413.00
16 660.50 558.00 466.00 450.00 335.00 385.35 335.00 398.00 424.00
17 693.00 583.00 466.00 450.00 335.00 385.35 335.00 410.00 435.00
18 724.50 608.00 466.00 450.00 335.00 385.35 335.00 422.00 446.00
19 755.00 633.00 489.00 450.00 335.00 385.35 335.00 440.00 457.00
20 785.50 658.00 512.00 450.00 335.00 385.35 354.30 458.00 468.00
21 816.00 683.00 536.00 481.00 358.00 411.05 373.60 476.00 490.00
22 846.50 708.00 559.00 512.00 381.00 436.75 392.90 494.00 512.00
23 '.77.00 733.00 583.00 543.00 404.00 462.46 412.20 512.00 534.00
24 907.50 758.00 605.00 574.00 427.00 488.15 431.50 530.00 556.00
25 938.00 783.00 629.00 505.00 450.00 512.57 450.80 548.00 578.00
6

FIGURES 2 AND 3
FOUR YEAR INSTITUTIONS
1990-91 TUITION BY CREDIT LOAD
900
EDO
700
600
500
400
300
200
,00
RDA RESIDENT UNDERGRADUATE STUDENTS
....M.411111=1111111111111:
1111IIIII111IIIIIIIIIII1 2 3 4 5 6 7 8 9 10 11 12 13 14 15 16 17 18 19 20 21 22 23 24 25
Credit Hourst u5U 0 11/5U FJU
1990-91 TUITION & FEES BY CREDIT LOADF-OR RESIDENT UNDERGRADUATE STUDENTS
O 9
O 8
3 7
O 6
0.5
1 2 3 4 5 6 7 8 9 10 11 12 13 14 15 16 17 18 19 20 21 22 23 24 25
Credit moure+ USU 0 WSU
7

te
F IGURES 4 AND 5
TWO YEAR INSTITUTIONS
5:3
350
0
'Q90-2,1 TUlTION BY CREDIT LOADFOR RESIDENT UNDERGRADUATE STUDENTS
350
300
250
AZOO 1
en
100
Snow
2 3 4 5 6 7 S 9 10 11 "2 13 14 15 16 17 18 19 20 21 22 23 24 25
Crecitt HOU-,
0:X10 0 cEu a uvCC x SLOG
19c0-c---1 Til TON & FEES BY CREDIT LOAD
SOO
500
400ft4
4
300
zco
POP PGSIDENT UNDERGRADUATE STUDENTS
1 2 3 4 5 5 8 9 1C ^1 12 13 .4 '5 '6 17 le 19 20 21 22 23 24 25
0 Snow
Creci.t moure01x141 0 CEU uvCC x SLCc
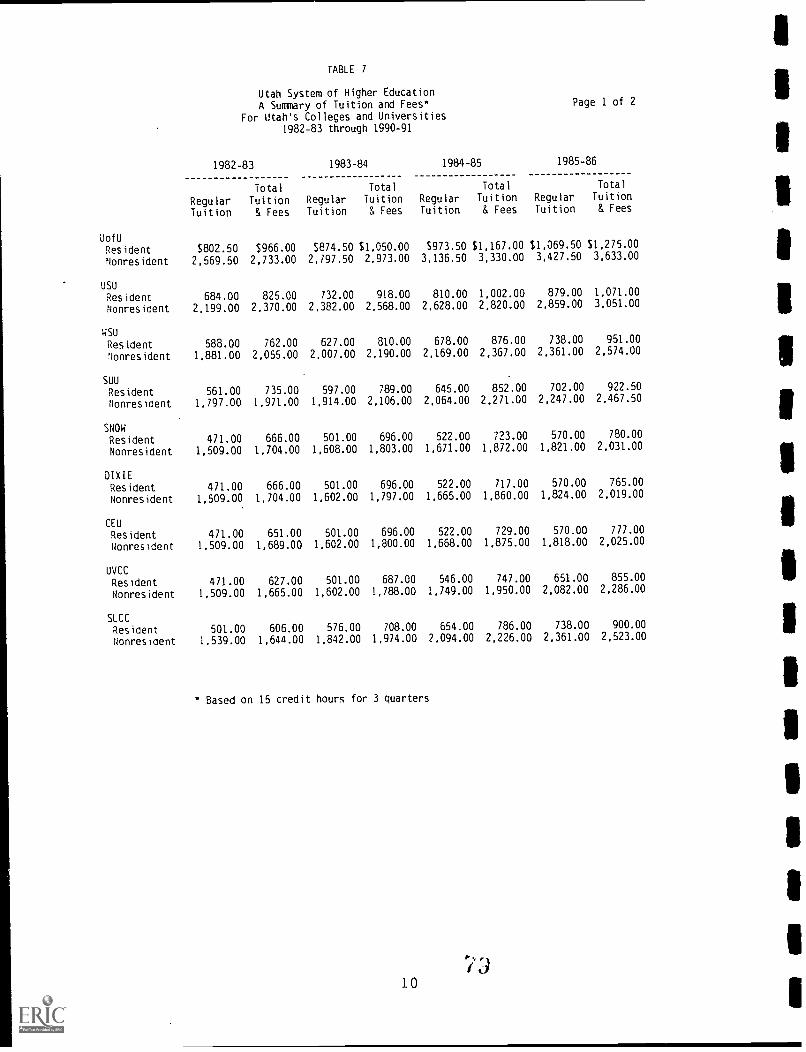
TABLE 7
Utah System of Higher EducationA Summary of Tuition and Fees*
For Utah's Colleges and Universities1982-83 through 1990-91
Page 1 of 2
UofU
1982-83
Total
Regular Tuition
Tuition & Fees
1983-84
Total
Regular Tuition
Tuition & Fees
1984-85
Total
Regular Tuition
Tuition & Fees
1985-86
Total
Regular Tuition
Tuition & Fees
Resident $802.50 $966.00 $874.50 $1,050.00 $973.50 $1,167.00 $1,069.50 $1,275.00
Nonresident 2,569.50 2,733.00 2,797.50 2.973.00 3,136.50 3,330.00 3,427.50 3,633.00
USU
Resident 684.00 825.00 732.00 918.00 810.00 1,002.00 879.00 1,071.00
Nonresident 2,199.00 2.370.00 2,382.00 2.568.00 2,628.00 2,820.00 2,859.00 3,051.00
WSU
Resident 588.00 762.00 627.00 810.00 678.00 876.00 738.00 951.00
Nonresident 1,881.00 2,055.00 2,007.00 2,190.00 2,169.00 2,367.00 2,361.00 2,574.00
SUU
Resident 561.00 735.00 597.00 789.00 645.00 852.00 702.00 922.50
Nonresident 1,797.00 1,971.00 1,914.00 2,106.00 2,064.00 2,271.00 2,247.00 2,467.50
SNOW
Resident 471.00 666.00 501.00 696.00 522.00 723.00 570.00 780.00
Nonresident 1,509.00 1,704.00 1,608.00 1,803.00 1,671.00 1,872.00 1,821.00 2,031.00
DIXIE
Resident 471.00 666.00 501.00 696.00 522.00 717.00 570.00 765.00
Nonresident 1,509.00 1,704.00 1,602.00 1,797.00 1,665.00 1,860.00 1,824.00 2,019.00
CEU
Resident 471.00 651.00 501.00 696.00 522.00 729.00 570.00 777.00
Nonresident 1,509.00 1,689.00 1,602.00 1,800.00 1,668.00 1,875.00 1,818.00 2,025.00
UVCC
Resident 471.00 627.00 501.00 687.00 546.00 747.00 651.00 855.00
Nonresident 1,509.00 1,665.00 1,602.00 1,788.00 1,749.00 1,950.00 2,082.00 2,286.00
SLCCResident 501.00 606.00 576.00 708.00 654.00 786.00 738.00 900.00
Nonresident 1,539.00 1,644.00 1,842.00 1,974.00 2,094.00 2,226.00 2,361.00 2,523.00
* Based on 15 credit hours for 3 quarters
10
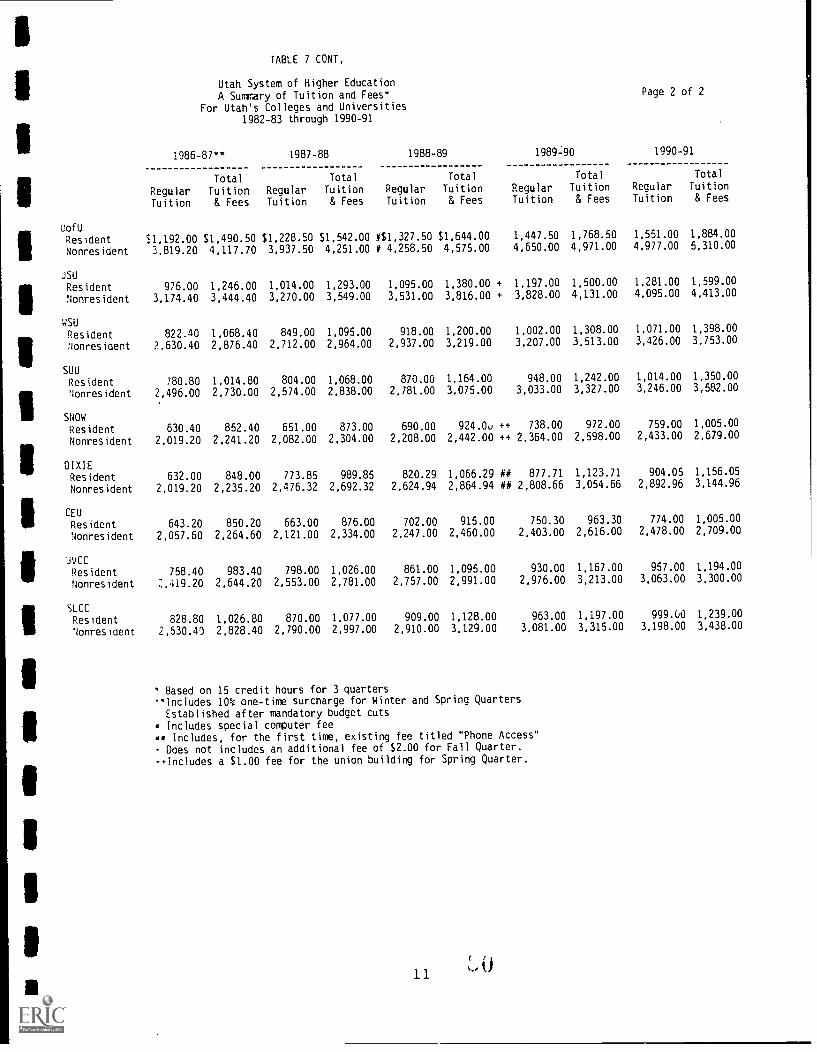
TABLE 7 CONT.
Utah System of Higher EducationA Summary of Tuition and Fees*
For Utah's Colleges and Universities1982-83 through 1990-91
Page 2 of 2
uofU
1986-87**
Total
Regular TuitionTuition & Fees
1987-88
Total
Regular Tuition
Tuition & Fees
1988-89
Total
Regular TuitionTuition & Fees
1989-90
Total
Regular TuitionTuition & Fees
1990-91
Total
Regular TuitionTuition & Fees
Resident $1,192.00 $1,490.50 $1,228.50 S1,542.00 #$1,327.50 $1.644.00 1,447.50 1,768.50 1,551.00 1,884.00
Nonresident 3,819.20 4,117.70 3,937.50 4,251.00 # 4,258.50 4,575.00 4,650.00 4,971.00 4,977.00 5,310.00
JSU
Resident 976.00 1,246.00 1,014.00 1,293.00 1,095.00 1.380.00 + 1,197.00 1,500.00 1,281.00 1.599.00
Nonresident 3,174.40 3,444.40 3,270.00 3,549.00 3,531.00 3,816.00 + 3,828.00 4,131.00 4,095.00 4,413.00
WSU
Resident 822.40 1,068.40 849.00 1,095.00 918.00 1,200.00 1,002.00 1,308.00 1,071.00 1,398.00
Nonresident 2,630.40 2.876.40 2,712.00 2,964.00 2,937.00 3,219.00 3,207.00 3,513.00 3,426.00 3,753.00
SUU
Resident 780.80 1,014.80 804.00 1,068.00 870.00 1,164.00 948.00 1,242.00 1,014.00 1,350.00
Nonresident 2,496.00 2,730.00 2,574.00 2,838.00 2,781.00 3,075.00 3,033.00 3,327.00 3,246.00 3,582.00
SNOW
Resident 630.40 852.40 651.00 873.00 690.00 924.0v ++ 738.00 972.00 759.00 1.005.00
Nonresident 2,019.20 2,241.20 2,082.00 2,304.00 2,208.00 2,442.00 ++ 2.364.00 2,598.00 2,433.00 2,679.00
DIXIEResident 632.00 848.00 773.85 989.85 820.29 1,066.29 ## 877.71 1,123.71 904.05 1,156.05
Nonresident 2,019.20 2,235.20 2,476.32 2,692.32 2,624.94 2,864.94 ## 2,808.66 3,054.66 2,892.96 3,144.96
CEUResident 643.20 850.20 663.00 876.00 702.00 915.00 750.30 963.30 774.00 1,005.00
Nonresident 2.057.60 2,264.60 2,121.00 2,334.00 2,247.00 2,460.00 2,403.00 2,616.00 2,478.00 2,709.00
uVCC
Resident 758.40 983.40 798.00 1,026.00 861.00 1,095.00 930.00 1,167.00 957.00 1,194.00
Nonresident 2,419.20 2,644.20 2,553.00 2,781.00 2,757.00 2,991.00 2,976.00 3,213.00 3,063.00 3,300.00
SLCC
Resident 828.80 1,026.80 870.00 1,077.00 909.00 1,128.00 963.00 1,197.00 999.60 1,239.00
Nonresident 2,530.43 2,828.40 2,790.00 2,997.00 2,910.00 3,129.00 3,081.00 3,315.00 3,198.00 3,438.00
* Based on 15 credit hours for 3 quarters"Includes 10% one-time surcharge for Winter and Spring Quarters
Established after mandatory budget cuts= Includes special computer feesit Includes, for the first time, existing fee titled "Phone Access"
- Does not includes an additional fee of $2.00 for Fall Quarter.
-*Includes a $1.00 fee for the union building for Spring Quarter.
11 L

FIGURES 6 AND 7
FOUR YEAR INSTITUTIONS
1 9
1 9
1 7
1 6
5
3 9
o e
O 7
O 5
TIJ I T ION & FEES IN THE 1980 SPOP RESIDENT UNDERGRADUATE STUDENTS
a
pwr
0.5
79-80 80-81 81-82 82-83 83-84 84-85 85-86 86-87 87-88 88-89 89-90 SO-91
3 U of U USUYear
0 WSU A SUU
7
22.02
1
0.9
2
O. 7
0
TU I T I ON & FEES I N CONSTANT $POP RESIDENT UNDERGRADUATE STUDENTS
:1
n
104111111111111111V
2 5
79-80 60-81 81-82 57-93 83-84 84-85 85-5 P 86-87 87-88 88-89 89-90 90-91
u of uyoar
USU 0 Nr9J ga SW
1 2 8 1
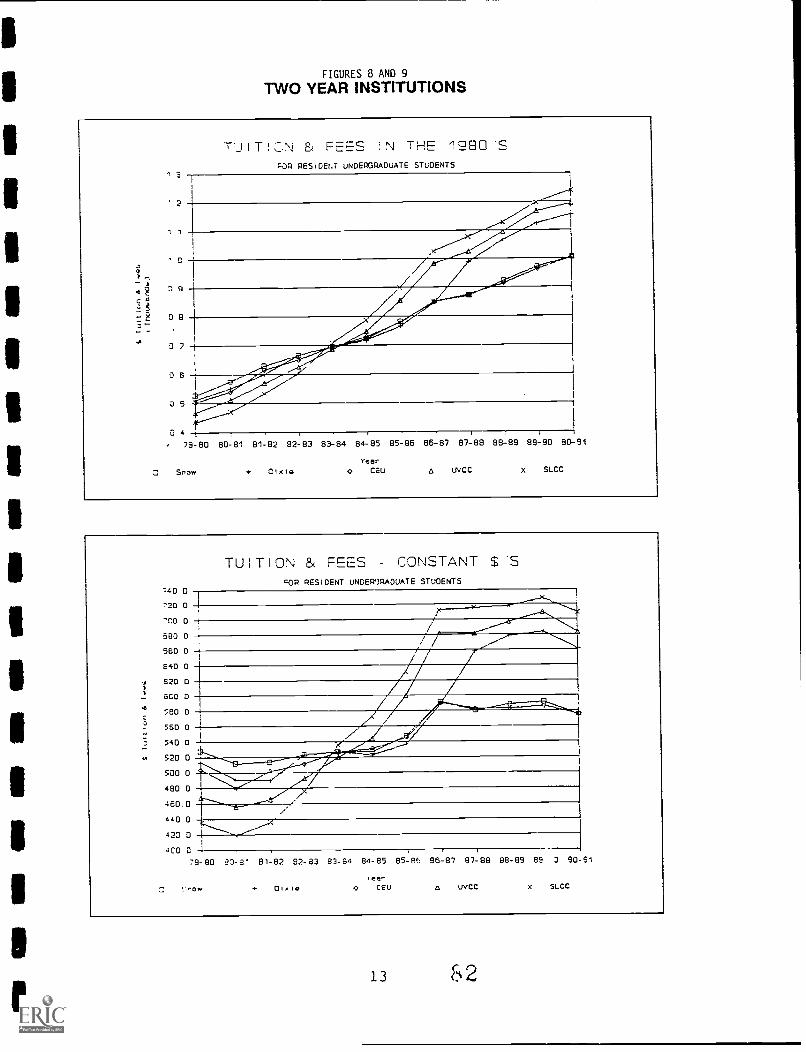
FIGURES 8 AND 9
IWO YEAR INSTITUTIONS
" 3
1 1
' 0
3 9
O 8
O 7
O 6
O 5
O 4
TUIT!C.N FEES N THE 1c180.POP PESIOENT UNO6PGPADUATE STUDENTS
, 79-e0 80-81 01-82 92-83 83-84 84-85 85-86 86-87 87-88 88-89 89-90 90-91
0 Snow + OIxtoYear
0 CEU UVCC X SLCC
3
740 0
720 0
-00 0
580 0
560 0
640 0
620 0
6CO 0
580 0
560 0
540 0
520 0
500 0
480 D
460 0
440 0
420 0
TUITION & FEES CONSTANT S'ScOP RESIDENT UNDEP3RADUATE STUDENTS
4C0 C
79-e0 a3-8l 81-02 92-83 83-94 04-85 85-25 96-87 97-88 88-89 89 3 90 91
,eee-
+ 01,10 0 CEu a uvCC x SLCC

TABLE 8
Utah System of Higher EducationResident and Nonresident Tuition*In Actual and Real Dollar Values
For 1969-70, 1979-80, 1989-90 and 1990-91
1969-70 1979-80 1989-90
Tuition Oollars$ Tuition Dollars* Tuition
University of Utah
Dollars*
1990-91
Tuition
ConstantDollar
% Change1969-70
Resident $392 1,393 $555 970 $1,448 $1,538 $1,551 11.32%
Nonresident 977 3,473 1,665 2,909 4,650 $4,941 4,977 43.32%
Utah State UniversityResident 345 1,226 501 875 1,197 $1,272 1,281 4.46%
Nonresident 855 3,039 1,551 2.710 3,828 $4,068 4,095 34.75%
Weber State UniversityResident 270 960 435 760 1,002 $1,065 1,071 11.60%
Nonresident 675 2,399 1,245 2,175 3,207 $3,408 3,426 42.80%
Southern Utah universityResident 276 981 420 734 948 $1,007 1,014 3.36%
Nonresident 681 2,421 1,200 2,096 3,033 $3,223 3,246 34.10%
Snow CollegeResident 240 853 351 613 738 $784 759 -11.03%
Nonresident 600 2.133 999 1,745 2,364 $2,512 2,433 14.08%
Dixie CollegeResident 240 853 351 613 878 $933 904 5.98%
Nonresident 600 2,133 999 1,745 2,809 $2,985 2,893 35.65%
College of Eastern UtahResident 240 853 351 613 750 $797 774 -9.27%
Nonresident 600 2,133 999 1,745 2,403 $2,554 2,478 16.19%
Utah Valley Community CollegeResident 252 896 351 613 930 $988 957 6.84%
Nonresident 879 3,124 1,053 1,840 2,976 $3,162 3,063 -1.96%
Salt Lake Community CollegeResident 252 896 351 613 963 $1,023 999 11.53%
Nonresident 852 3,028 1,053 1,840 3,081 $3,274 3,198 5.60%
* Based on 15 credit hours for 3 quarters
1 December CPI (1982-84=100) used to compute real dollars:1969 = 37.7; 1979 - 76.7; 1989 = 126.1: 1990 = 134.0; Using 1990-91 as the Base Year
83
14

FIGURES 10 AND 11
1 6
, tr.
gC a
.0 -o
1 4
1 3
1 2
1 1
D 9
0 8
0.7
O 6
O 5
.2 4
O 3
U OP U TU T I ON TRENDSBASED ON PES/UNDERGRAD TUITION
69-70
O Line A
,. 79-80
Year+ Line o Line C
89-90
A. Tuition in 1990 DollarsB. Actual Tuition PaidC. 1969 Tuition Increased by Inflation
15 8 4

FIGURES 12 AND 13
A. Tuition in 1990 DollarsB. Actual Tuition PaidC. 1969 Tuition Increased by Inflation
3 9
O 2
7
O 6
O 5
3 4
3 3
O 2
SUU TUITION TRENDS8A5E0 ON RES/ UNDERGRAO TUITION
59-70
0 Line A
79-80
'ear+ Line 6 o one C
89-90
6 5
16

1
1
FIGURES 14 AND 15
5
;30
SNOW TUITION TRENDSBASED ON PES/UNDERGRAD TUITION
7:00
200
59-70
0 Line A
79- 90
Year+ Ltne 8 o LIne C
89-90
A. Tuition in 1990 DollarsB. Actual Tuition PaidC. 1969 Tuition Increased by Inflation
3 9
2 9
3 7
3 0
4
7.: 3
2
DIXIE TUITION TRENDSBASED ON RES/UNDERGRAO TUITION
/Z
7"-,..........---
./ ---
. .
..../
...-.Y",
//,------
,-------------
69-70
0 Line A
79-90
veerL10e 8
^o Line C
89-90
17
E5 6

FIGURES 16 AND 17
0
7
0
900
SOO
-00
600
SOO
400
3 0 0
CEU TUITCN TRENDSBASED ON RES/ UNCERGAA0 TJITION
200 ,
59-70
Llne A
79-60
ear4. Line B 0 Line C
69-90
A. Tuition in 1990 DollarsB. Actual Tuition PaidC. 1969 Tuition Increased by Inflation
UVCC TUITION TRENDSBASED ON RES/LINOEFGRAO TUITION
7 5
4
3
2.
E..3- 70
L:ne A
79-80 89- 90
'earLine L!ne C
8718

FIGURE 18
SLCC TU IT MN TRENDSBASE() ON RES/uNDERORAD TUITION
0 9
0 2
E9-70 79-80
0 Line A
Year+ Line B
//
o Line C
89-90
A. Tuition in 1990 DollarsB. Actual Tuition PaidC. 1969 Tuition Increased by Inflation
Lit.)
19

TABLE 9
UTAH SYSTEM OF HIGHER EDUCATIONUNDERGRADUATE STUDENT TUITION AND FEES FOR ACADEMIC YEAR
1990-91*
Tuition
U of U**
UniversitiesUSU# WSU SUU
$
Snow
2 Year Community Colleges
Dixie CEU UVCC
$
SLCC
S
Resident Students 1,551.00 1,281.00 1,071.00 1,014.00 759.00 904.05 774.00 957.00 999.00
Nonresident Students 4,977.00 4,095.00 3,246.00 3,246.00 2,433.00 2,892.96 2,478.00 3,063.00 3,198.00
Fees
Student Activity 27.00 42.00 60.87 67.50 40.50 36.00 42.00 33.00 24.00
Building Fee 130.50 90.00 76.11 156.00 60.00 84.00 42.00 105.00 84.00
Athletic Fee 39.00 60.00 58.14 57.00 42.00 36.00 54.00 27.00 18.00
Union Building Fee 54.66 15.00 32.25 33.00 54.00 51.00 51.00
Theaters9.00
Med. or Health 15.00 33.00 13.83 7.50 6.75 3.00
Recreation Fee 16 50 15.00 12.39
Regis. By Telephone 18.00 6.00
Yearbook18.00 12.00
Activity Center 30.00 24.00 30.00 18.00 3.00
Alumni Fee3.00 3.00
Departmental Activity18.00
insurance9.00 9.00
Library 6.00 3.00 3.00 3.00
1.0. cards 3.00
Intramural4.50 3.00 12.00
Transcript 3.0027.00
ServicingBand Uniforms 3.00
Comp. Advising 9.00
Computer 105.00 60.00 30.00 9.00 6.00 6.00 9.00
Total Fees 333.00 318.00 327.00 336.00 246.00 252.00 231.00 237.00 240.00
Total Tuition & Fees
Resident Students 1,884.00 1,599.00 1,398.00 1,350.00 1,005.00 1,156.05 1,005.00 1,194.00 1,239.00
Nonresident Students 5,310.00 4,413.00 3,573.00 3,582.00 2,679.00 3,144.96 2,709.00 3,300.00 3,438.00
- =
U of U
Undergrad. Graduate Student Tuition and Fees for Academic Year 1990-91*
PhysicianAssistant
U of U School of College USU WSU SUU
Graduate Medicine of Law Graduate Graduate Graduate
TuitionResident Students 5,250.00 1,696.50 4,896.00 2,353.00 1,410.00 1,179.00 1,116.00
Nonresident Students 6,054.00 5,472.00 10,593.00 5,781.00 4,506.00 3,768.00 3,576.00
Tuition and Fees
Resident Students 5,586.00 2,044.50 5,232.00 2,701.00 1,728.00 1,506.00 1,452.00
Nonresident Students 6,390.00 5,820.00 10,929.0 6,129.00 4,824.00 4,095.00 3,912.00
Based on 15 credit hours for 3 quarzrs except for law (2 semesters)
- quition and fees for all undergraduate students with the exception of the
Physician Assistant students. Physician Assistant tuition and fees listed below.
g Does not include an additional fee of $2.00 for Fall Quarter fixed cost increases of the
Associated Student Association.
S3
2 0

TAB ESTUDENT FINANCIAL AID f/ I
CAMPUS-BASED & PROGRAM-BASED STUDENT FINANCIAL AID .. . 1
TABLE 1 Federal and State Matching Student Financial Aid, 1983-84 - 1989-90 . 2
TABLE 2 Western Interstate Commission for Higher Education (WICHE)and Regional Dental Exchange Program (RDEP) 3
TABLE 3 Paul Douglas Teacher Scholarship Program 3
TABLE 4 Utah Career Teaching Scholarship Program 4
STAFFORD STUDENT LOAN, PLUS, AND SUPPLEMENTAL LOANSFOR STUDENTS PROGRAMS 5
FIGURE 1 UHEAA Annual Gross Guarantee Volume, Stafford, PLUS andSLS Programs 7
FIGURE 2 UHEAA Cumulative Gross Guarantee Volume, Stafford, PLUS andSLS Programs 7
TABLE 5 UHEAA Annual Gross Guarantee Volume, Stafford, PLUS, SLS,Consolidation, and All Loan Programs 8
TABLE 6 UHEAA Annual Gross Guarantee Volume, Stafford Program,by Top Ten Lenders 9
TABLE 7 UHEAA Annual Gross Guarantee Volume, SLS Program,by Lender 9
TABLE 8 UHEAA Annual Gross Guarantee Volume, PLUS Program,by Lender 10
TABLE 9 UHEAA Annual Gross Guarantee Volume, All Loan Programs,by Top Ten Lenders 10
TABLE 10 UHEAA Annual Gross Guarantee Volume, Stafford Program,Utah Schools 11
TABLE 11 UHEAA Annual Gross Guarantee Volume, SLS Program,Utah Schools 12

TAB ESTUDENT FINANCIAL AID
--Continued--
TABLE 12 UHEAA Annuai Gross Guarantee Volume, PLUS Program,Utah Schools 13
TABLE 13 UHEAA Annual Gross Guarantee Volume, All Loan Programs,Utah Schools 14
FIGURE 3 UHEAA Stafford Loan Default Rates (Gross) 15
FIGURE 4 UHEAA Stafford Loan Default Rates (Net) 15
FIGURE 5 UHEAA Stafford Loan Recovery Rates 16
UTAH STATE BOARD OF REGENTS - LOAN PURCHASE PROGRAM 17

CAMPUS-BASED & PROGRAM-BASEDSTUDENT FINANCIAL AID
INTRODUCTION
The following table provides statistical information concerning a number of student financial aidprograms. The U.S. Department of Education offers five major student financial aid programs as follows:
Program Description
Perkins Loans
College Work-Study (CWS)
Pell Grants
Supplemental EducationalOpportunity Grants (SEOG)
State Student ImentiveGrants (SSIG)
The National Direct Student Loan (NDSL) program has been renamed thePerkins Loan program as a memorial to Carl D. Perkins, the chairmanof the U.S. House rf Representatives Education and Labor Committee.Perkins loans are low interest (5 percent) loans with a maximum 10year repayment period. The Perkins Loan program is called a "campus-based" program since each institution is responsible for
administering the program on its own campus. Institutions areresponsible for providing a one ninth match of the Perkins funding.
The CWS prOgram provides jobs for undergraduate and graduate studentswho need financial aid. Employers pay a portion of the student'swages while the CWS funds pay the remainder. CWS is also one of thecampus-based programs with funding received directly from the U.S.Department of Education. Beginning in fiscal 1989, the employershare of student wages was increased. The institutions are requiredto provide a 30% match for the College Work-Study Federal funds.
The Pell Grant program is the largest Federal student financial aidgrant program. Pell Grants are need-based awards to undergraduatestud2nts ranging in size from $200 to $2,300 for the 1990-91 awardyear. Funding for the Pell Grant program comes directly from theU.S. Department of Education to the iKividual -ampuses. The PellGrant program is considered an entitlement since funding is providedto every eligible applicant.
The SEOG program is a grant program for undergraduate students withexceptional need. Awards of up to $4,000 per year are availabledepending on the student's need. The SEOG program is also considereda campus-based program. Funding for the program is provided by theU.S. Department of Education. Beginning in fiscal 1989, institutionsbecame responsible for providing a five percent matching portion ofthe SEOG funding. The matching portion percentage increased to 10percent in 1990 and will be 15 percent in 1991.
The SSIG program is a grant program for undergraduate students withsubstantial financial need. Awards of up to $2,500 per year areavailable depending on the student's need. Funding for the programis provided partially by the U.S. Department of Education with aminimum of fifty percent matching and maintenance of effortrequirement ot the designated State agency. The SSIG program in Utah
operates on a decentralized system with the individual institutionsresporsicie for the aaministration of the program.
1

TABLE 1
UTAH SYSTEM Cf HIGHER EDUCATIONFEDERAL AND STATE MATCHING STUDENT FINANCIAL AID
1983-84 1984-85 1985-86 1986-87 1987-88
No. of Dollar No. of Dollar No. of Dollar No. of Dollar No. of DollarStudents Amount Students Amount Students Amount Students Amount Students Amount
U Of U
1988-89 1989-90
No. of Dollar No. of Dollar
Students Amount Students Amount
Perkins 1,226 2,054,334 1,244 2,236,359 1,589 2,680,634 1,133 Z,121,842 479 2,306,035 1,039 3,157,097 2,233 3,098,772
CWS 536 1,191,979 562 1,014,454 567 1,101,176 477 1,095,040 1,761 1,130,091 2,404 1,596,564 1,374 1,530,322
SEOG 536 314,213 577 381,549 607 403,481 463 350,394 237 318,149 648 384,117 814 462,966
SSIG 958 488,675 785 417,223 855 414,873 464 726,570 489 360,254 550 376,195 506 359,635
Pell 3,165,438 3,610,257 4,063,874 4,588.771 5,387,372 6,737,350 7,711,793
TOTAL 7,214,639 7,659,842 8,664,038 8,88.,611 9,501,901 12,251,323 13,163,488
USUPerkins 920 1,046,005 793 824,098 1,160 1,206,880 882 1,074,610 870 1,080,247 1,181 1,541,260 835 1,197,935
CWS 530 651,023 638 592,467 837 706,851 607 575,397 537 619,956 536 602,803 560 651,725
SEOG 735 587,313 878 630,506 738 514,850 884 631,692 850 608,801 1,590 596,844 1,392 663,519
SSIG 176 159,090 276 193,718 276 174,360 262 184,623 303 199,092 239 190,686 463 193,974
Pell 2,631,593 3,433,540 4,050,710 3,982,239 4,430,574 5,776,902 7,192,919
TOTAL 5,075,024 5,674,329 6,653,651 6,448,561 6,938,670 8;708,495 9,900,072
WSU
Perkins 907 787,368 806 719,036 852 879,372 628 658,473 636 627,900 987 884,642 991 952,148
CWS 652 820,316 545 640,365 645 729,520 624 812,698 677 798,616 1,421 1,112,237 516 749,975
SEOG 710 401,990 660 401,166 624 417,765 507 456,552 653 465,438 688 482,916 640 445,707
SSIG 314 280,633 535 318,912 440 321,256 276 309,973 353 248,294 264 209,294 254 192,216
Pell 2,167,419 2,287,653 2,925,846 2,904,181 3,498,230 5,044,541 6,022,812
TOTAL 4,457,726 4,367,132 5,273,759 5,141,877 5,638,478 7,733,630 8,362,858
SUUPerkins 236 275,765 227 281,590 203 251,705 242 332,701 209 346,500 217 371,117 182 287,566
CWS 269 260,934 239 234,893 218 215,885 250 229,376 259 229,401 272 261,880 275 253,904
SEOG 290 123,429 292 147,732 263 133,978 262 152,226 232 141,232 277 137,349 382 145,050
SSIG 49 61,128 78 68,379 70 70,579 56 68,286 60 41,758 136 45,282 106 49,292
Pell 940,441 1,192,050 1,370,162 1,487,829 1,646,156 2,090,626 2,486,252
TOTAL 1,661,697 1,924,644 2,042,309 2,270,418 2,405,047 2,906,254 3,222,064
SNOWPerkins 106 72,238 71 41,701 117 78,688 180 151,079 159 143,871 137 130,668 113 113,207
CWS 96 70,928 107 63,066 133 68,608 125 71,481 140 84,410 108 65,626 98 67,097
SEOG 87 39,434 95 34,172 127 58,862 218 50,338 248 71,763 377 56,137 557 64,011
SSIG 38 32,256 54 35,086 53 35,886 51 34,662 54 22,572 94 23,264 78 23,783
Pell 295.015 322,566 375,101 321,396 463,251 634,288 824.511
TOTAL 509,871 496,591 617,145 628,956 785,867 909.983 1,092,609
DIXIEPerkins 109 90,050 113 99,002 167 172.562 125 121,408 98 125,037 135 219,946 129 214,184
CWS 163 141,735 165 172,924 169 161,907 169 154,088 167 167,753 166 161,395 183 169,380
SEOG 183 96,408 140 84,956 169 89,395 131 90,914 164 88,014 339 105,804 307 110,473
SSIG 26 26,028 27 29,272 31 29,772 27 29,140 38 29,344 63 30,694 54 31,965
Pell 333,825 412,779 577,535 671,578 838,984 1,062,752 1,220,374
TOTAL 688.046 798,933 1,031,171 1,067,128 1,249,132 1,580,591 1,746,376
CEU
Perkins 60 47,788 34 37,226 29 33,931 32 31,882 37 45,701 34 29,090 61 45,934
CWS 60 47,788 70 51,297 60 35,968 77 41,538 81 59,631 78 56,311 77 35,837
SEOG 42 20,449 52 27,554 62 39,469 112 59,718 81 46,760 64 33,541 83 62,029
SSIG 33 72,396 44 78,610 27 74,542 50 72,130 61 28,676 51 24,438 58 24,378
Pell 417,774 567,299 667,411 780,894 745,202 923,593 1,021,086TOTAL 606,195 761,986 851,321 986,162 925,970 1,066,973 1,189,264
UVCCPerkins 100 90,720 141 113,321 116 96,954 192 191,174 106 122,468 132 182,166 199 293,069
CWS 137 154,275 115 125,613 115 124,694 195 142,768 106 109,741 149 142,778 187 215,803
SEOG 138 82,344 120 78,318 283 114,798 159 77,616 95 56,549 266 131,561 330 130.403
SSIG 109 79,522 143 90,187 173 100,299 185 89,831 126 85,774 136 84,578 160 98,340Pell 1,045,335 1,268,404 1,766,477 1,842,171 1,979,225 2,597,081 3,454.670
TOTAL 1,452,196 1,675,843 2,203,222 2,343,560 2,353,757 3,138,164 4,192,285
SLCCPerkins 253 204,933 325 259,917 343 298,840 235 202,485 414 507,021 562 922,552 605 639,511
CWS 117 106,940 121 148,228 161 166,026 133 140,975 157,444 211 210,706 281 323,593
SEOG 137 73,679 219 148,492 559 456,279 237 116,590 379 216,336 605 276,955 696 296,844
SSIG 166 100,186 156 112,323 178 114,723 210 110,588 207 )00,446 216 104,224 244 110,972
Pell 1,226,119 1,347,722 1,669,868 1,813,992 2,475,359 3,772,436 4,429,249TOTAL 1,711,857 2,016,682 2,705,736 2,384,630 3,456,656 5,286,873 5,800,169
TOTAL USHEPerkins 3,91? 4,669,201 3,754 4,612,250 4,576 5,699,566 3,649 4,885,654 3,038 5,304,780 4,424 7,438,538 5,348 6,842,326CHS 2,560 3,445,918 2.562 3,043,307 2,905 3,310,635 2,657 3,263,361 3,868 3,357,043 5,345 4,210,300 3,551 3,997,636
SEOG 2,858 1,739,259 3,033 1,934,445 3,432 2,228,877 2,973 1,986,040 2,939 2,013,092 4,854 2.205,224 5 201 2,381,002
SSIG 1,869 1,299.914 2,098 1,343,710 2,103 1,336,290 1,581 1,625,803 1,691 1,115,210 1,749 1,088,655 1,923 1,084,555
Pell 12,222,959 14,442,270 17,466,984 lb,393,051 21,464,353 28,639,569 34,363,666
TOTAL 23,377,251 25.375,982 30,042,352 30,153,909 33,255,478 43,582,286 48,669,185
Source: FISAP & Other Federal Reports
2 5 3
1
1

TABLE 2
,:eterinary Medicine
WESTERN INTERSTATE COMMISSION FOR HIGHER EDUCATION (NICHE)SCHOLARSHIPS AWARDED
1984-85 1985-86 1986-87 1987-88 1988-89 1989-90
* of Awards 47 47 47 47 46 44
Dollar Amount $639,200 $653,300 $672,100 $749,800 $799,167 $809,600Optometry
g of Awards 16 16 14 17 17 14
Dollar Amount $91,200 $94,400 $85,400 $105,400 $107,100 89,600
Podiatry* of Awards 6 7 5 8 9 7
Dollar Amount $39,000 $46,900 $34,500 $52,500 $60,350 $50,400x of Awards 6 4
Dollar Amount $70,000 $43,200Administration Fee
Dollar Amount $53,000 $53,000 $56,000 $59,000 $62,000 $65,100TOTAL
* of Awards 75 74 66 72 72 65Dollar Amount $892,400 $890,800 $848,000 $966,700 $1,028,617 $1,014,700
REGIONAL DEOTAL EXCHANGE PROGRAM (RDEP)SCHOLARSHIPS AWARDED
Leg. Appropriation4 of Awards 20 30 40 40 40 40
Dollar Amount $178,000 $288,000 $382,600 $381,300 $379,300 $379,400Total Expenditure
Dollar Amount $210,506 $323,363 $429,594 $413,083 $421,200 $425,150
The Student Exchange Program administered through the Western Interstate Commission for Higher Education (NICHE)and the Regional Education Dental Program (RDEP) assist Utah students in obtaining professional training indentistry, veterinary medicine, optometry, and podiatry outside the State of Utah. Under these reciprocalarrangements, Utah receives out-of-state students in medicine, physical therapy, pharmacy, law, architecture,and forestry under the interstate compact. Participating students pay resident fees of the receiving state orpay one-third of the regular tuition rate if attending a private institution. The above is a summary of Utah's
participation in these programs.
TABLE 3
PAUL DOUGLAS TEACHER SCHOLARSHIP PROGRAM
1987-88 1988-89Number of Scholarship Number of Scholarship
1989-90Number of Scholarship
Institution Students Award Amount Students Award Amount Students Award Amount
Brigham Young University 9 45,000 13 65,000 9 42,500
Rick's College (ID) 1 5,000Snow College 1 4,469 1 4,665 1 5,000
Southern Utah State College 3 15,000 2 8,335Trenton State (NJ) 1 5,000 1 5,000
Utah State University 3 15,000 9 45,000 9 45,000
,ieber State College 1 5,000 2 10,000.......16 79,469 28 138,000 22 107,500
The Paul Douglas Teacher Scholarship Program is a federally-funded program to provide college scholarships tooutstanding high school graduates. The program's purpose is to encourage and enable students to pursue teachingcareers. Students may apply for scholarships of up to $5,000 for each academic year of Aucation in preparation
to become teachers. Schol&rship assistance is ava.lable for no more than four academic years. Students
receiving this scholarship will be required to complete a teacher certification program and teach on a full-time
basis for a period of not less than two years for each year of scholarship funding received.
3
r- At-..4
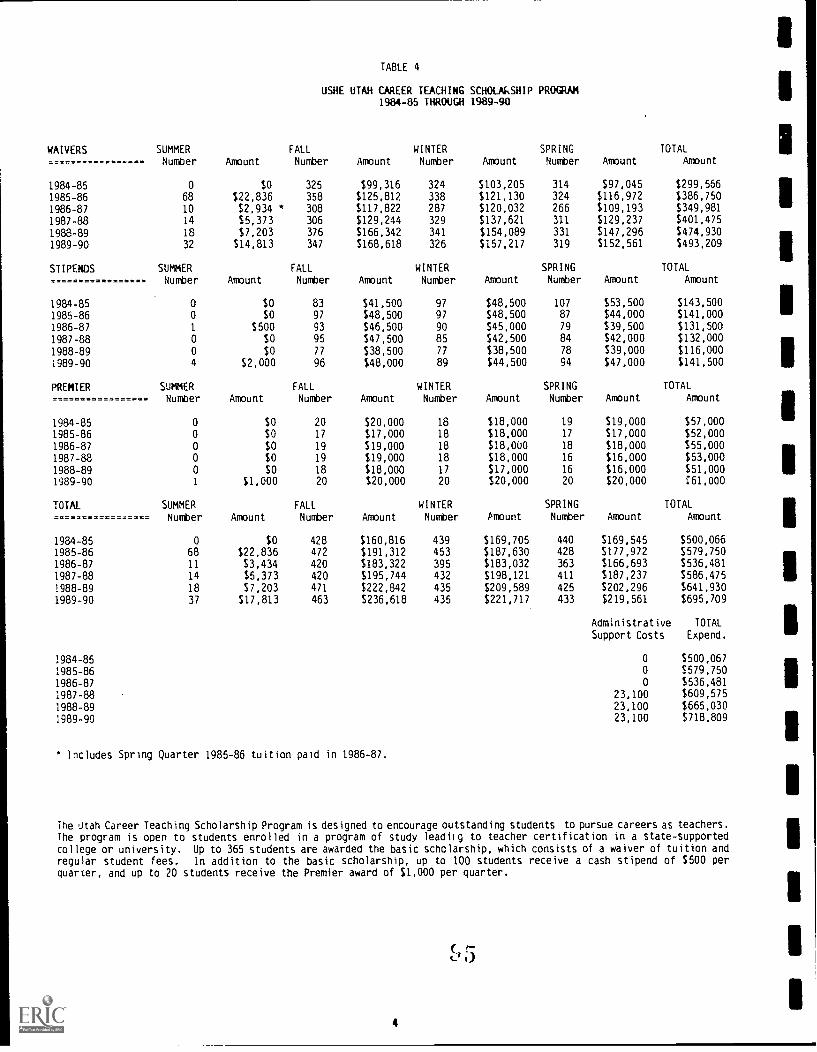
TABLE 4
USHE UTAH CAREER TEACHING SCHOLAkSHIP PROGRAM1984-85 THROUGH 1989-90
WAIVERS SUMMERNumber Amount
FALL
Number AmountWINTERNumber Amount
SPRING
Number AmountTOTAL
Amount
1984-85 0 $0 325 $99,316 324 $103,205 314 $97,045 $299,566
1985-86 68 $22,836 358 $125,812 338 $121,130 324 $116,972 $386,750
1986-87 10 $2,934 * 308 $117,822 287 $120,032 266 $109,193 $349,981
1987-88 14 ¶5,373 306 $129,244 329 $137,621 311 $129,237 $401,475
1988-89 18 $7,203 376 $166.342 341 $154,089 331 $147,296 $474,930
1989-90 32 $14,813 347 $168,618 326 $157,217 319 $152,561 $493,209
STIPENDS SUMMERNumber Amount
FALL
Number Amount
WINTERNumber Amount
SPRING
Number AmountTOTAL
Amount
1984-85 0 $0 83 $41,500 97 $48,500 107 $53,500 $143,500
1985-86 0 $0 97 $48,500 97 $48,500 87 $44,000 $141,000
1986-87 1 $500 93 $46,500 90 $45,000 79 $39,500 $131,500
1987-88 0 $0 95 $47,500 85 $42,500 84 $42,000 $132,000
1988-89 0 $0 77 $38,500 77 $38,500 78 $39,000 $116,000
1989-90 4 $2,000 96 $48,000 89 $44,500 94 $47,000 $141,500
PREMIER SUMMERNumber Amount
FALL
Number Amount
WINTERNumber Amount
SPRINGNumber Amount
TOTAL
Amount
1984-85 0 $0 20 $20,000 18 $18,000 19 $19,000 $57,000
1985-86 0 $0 17 $17,000 18 $18,000 17 $17,000 $52,000
1986-87 0 $0 19 $19,000 18 ¶18,000 18 $18,000 $55,000
1987-88 0 $0 19 $19,000 18 $18,000 16 $16,000 $53,000
1988-89 0 $0 18 $18,000 17 $17,000 16 $16,000 $51,0001989-90 1 $1,000 20 $20,000 20 $20,000 20 $20,000 :61,000
TOTAL SUMMER- Number Amount
FALL
Number Amount
WINTERNumber Amount
SPRINGNumber
TOTAL
Amount Amount
1984-85 0 $0 428 $160,816 439 $169,705 440 $169,545 $500,066
1985-86 68 $22,836 472 $191,312 453 $187,630 428 $177,972 $579,750
1986-87 11 ¶3,434 420 $183,322 395 $183,032 363 $166,693 $536,481
1987-88 14 ¶5,373 420 $195,744 432 5198.121 411 $187,237 $586,475
1988-89 18 $7,203 471 $222,842 435 $209,589 425 $202,296 $641,930
1989-90 37 $17,813 463 $236,618 435 $221,717 433 $219,561 $695,709
Administrative TOTAL
Support Costs Expend.
1984-85 0 $500,067
1985-86 0 $579,750
1986-87 0 3536,481
1987-88 23,100 $609,575
1988-89 23,100 $665,030
1989-90 23,100 $718,809
* Includes Spring Quarter 1985-86 tuition paid in 1986-87.
The Utah Career Teaching Scholarship Program is designed to encourage outstanding students to pursue careers as teachers.
The program is open to students enrolled in a program of study leadiig to teacher certification in a state-supportedcollege or university. Up to 365 students are awarded the basic scholarship, which consists of a waiver of tuition andregular student fees. In addition to the basic scholarship, up to 100 students receive a cash stipend of $500 perquarter, and up to 20 students receive the Premier award of $1,000 per quarter.
4

STAFFORD STUDENT LOAN, PLUSAND SUPPLEMENTAL LOANSFOR STUDENTS PROGRAMS
INTRODUCTION
The Guaranteed Student Loan Program, which consists of the Stafford Student Loan, PLUS Loans and SupplementalLoans for Students (SLS) programs, makes long-term, low interest loans available for students and the parents of studentsenrolled in postsecondary institutions. Guaranteed student loans are made primarily by commercial lenders and are insuredagainst loss by state guarantee agencies and reinsured by the Federal government.
The Guaranteed Student Loan Program is the largest single source of student financial assistance in the nation.For the federal fiscal year 1989, national loan volume totaled $12.5 billion consisting of approximately 4.7 millionloans. Since the inception of the program. more than $101 billion of loans have been made.
UTAH HIGHER EDUCATION ASSISTANCE AUTHORITY
Utah Higher Education Assistance Authority (UHEAA) is the designated guarantee agency in Utah. The tables andgraphs on the following pages describe the loan volume and related statistics for loans guaranteed by UHEAA.
BASIC PROGRAM PROVISIONS
A summary of the basic provisions for each of the Guaranteed Student Loan Programs is provided below:
Program Description
Stafford Loans
PLUS Loans
SLS Loans
The Stafford Loan program, formerly Guaranteed Student Loan program or "GSL", hasrecently been renamed in honor of Senator Robert Stafford. Eligible students mayborrow the following loan amounts:
First- and Second-Year $2,625 AnnuallyUndergraduates
Third- and Fourth-YearUndergraduates
Graduate Students
$4,000 Annually
$7,500 Annually
Cumulative Loan Limit forUndergraduate Study $17,250
Cumulative Loan Limit forUndergraduate and GraduateStudy $54,750
The current interest rate on Stafford Loans is 8 percent for the first fouryears of repayment and 10 percent thereafter. The maximum repayment period,which begins six months after the student is no longer attending school on atleast a half-time basis, is 10 years.
PLUS Loans are available to the parents of dependent undergraduate or graduatestudents. A parent can borrow a maximum of $4,000 per year for each dependentstudent with an aggregate limit of $20,000 per dependent. Interest on PLUSLoans is a variable rate based on the 52-week Treasury bill. The current PLUSinterest rate is 11.49 percent. Repayment on PLUS Loans begins when the loanis made and extends over a maximum 10-year period.
SLS Loans are available to independent undergraduate students, graduatestudents and, in some cases, to dependent students. The maximum amcunt astudent may borrow under the SLS program in any academic year or perioo of 7consecutive months, whichever is longer, is $4,000. However, the maximum loanamount for a first-year borrower who is not enrolled in a program that is atleast one academic year in length is:
$2,500 2/3 of an academic year
$1,500 Less than 2/3, but greater than 1/3 of an academic year
Students enrolled in a program that is less than 1/3 of an academic year arenot eligible to borrow under the SLS program. The aggregate limit on SLSloans is $20,000. The interest and repayment terms are identical to the PLUSLoan program.
U5

DEFAULT DEFINITIONS
Soffe of the tables and graphs on the following pagis provide data concerning the default rate on GuaranteedStudent Loans. To promote understanding of the data, the following definitions are provided:
Matured Paper. Matured paper is equal to the net loans guaranteed minus in-school and in-grace loans.
Gross Default Rate. The gross default rate is equal to cumulative defaults paid to lenders divided by cumulativematured paper.
Net Default Rate. The net default rate is equal to cumulative defaults paid to lenders minus cumulative defaultcollections divided by cumulative matured paper.
Recovery Rate. The recovery rate is equal to cumulative default collections divided by cumulative defaults paidto lenders.
As shown in the graphs, both the gross and net default rates for UHEAA are below the national average while therecovery rate on defaulted UHEAA loans is above the national average. For fiscal year 1989. UHEAA had the 18th lowestnet default rate and the ninth best recovery rate in the nation.
fi 7
6

UHEAA Annual Gross Guarantee VolumeStafford, PLUS and SLS Programs
Fiscal Year Ending June 30
Year Dollar Amount
1979 15,923,5541980 25,573,6591981 36,954,0751982 39,650,1021983 39,718,0461984 39,572,0641985 44,550,0101986 49,434,2051987 51,962,9011988 64;146,2061989 77,618,228
1990 85,783,309
FIGURE 1
00
°°
UHEAA ANNUAL GROSS' GUARANTEE VOLUvIEStafford, PLUS and V.S Procrarm
70 -
SO -
50 -
40
30 -
20 -
79 90 81 83 84 VS 87 II 99 90
UHEAA Cumulative Gross Guarantee VolumeStafford, PLUS and SLS Programs
Fiscal Year Ending June 30
Year Dollar Amount
1979 17,867,7981980 43,441,4571981 80,395,532
1982 120,045,6341983 159,763,6801384 199,335,7441985 243,885,7541986 293,319,9591987 345,282,860
1988 409,429,066
1989 483,110,265
1990 568,893,574
FIGURE 2
UHEAA CUMULAT I VE GROSS GUARANTEE VOLLUE
600
SOO
Stafford, PLUS and 'LS Prodrand
00-
: 300 -
200-
100
API80 81
A.4-44.44.4 A81 84 OS 87 08 89
r, 3

Stafford Student Loan Program
PLUS Program
SLS Program
Consolidation Loan Program
All Loan Programs
TABLE 5
UHEAA GROSS GUARANTEESANNUAL VOLUME
For Each Fiscal Year Ending June 30
Kumber of Loans Dollar Amount
I1973 805 $ 1,944,2441979 6,992 15,923,5541980 12,969 25,573,6591981 33,593 36,954,0751982 22,593 39,650,102 I1983 18,813 39,620,454
1984 19.6,9 39,458,8331985 20,731 43,866,4911986 21,270 48,493,521 I1987 20,549 50,784,1471988 22,141 61,652,5661989 25,225 70,108,2691990 27,341 80,915,633
ITOTAL 252 681 $ 554,945,548,
Number of Loans Dollar Amount 11983 22 $ 47,296
1984 34 83,6701985 77 203,4651986 128 339,350 I1987 122 332,651
1988 201 563,9591989 300 884,405
1990 409 1,246,942 ITOTAL 1 293 $ 3 701 738
Number of Loans Dollar Amount 11983 1 $ 3,000
1984 28 76,857
1985 185 480,054 I1986 228 601,3341987 335 846,1031988 650 1,929,6811989 948 2,688,525
111990 1,267 3,620,734
TOTAL 3 642 $ 10 246 288
1Number of Loans Dollar Amount
1988 178 $ 2,697,8801989 285 3,923,8801990 337 4 758 842
TOTAL 800 $ 11 380 602
!hater of Loans Dollar Amount
19781979
8056,992
$ 1,944,24415,923,554
1980 12,969 25,573,6591981 33,593 36,954,075
1982 22,593 39,650,1021983 18,836 39,670,750
1984 19,721 39,619,360
1985 20,993 44,550,010
1986 21,626 49,434,205
1987 21,006 51,962,901
1988 23,170 66,844,086
1989 26,758 77,605,079
1990 29,354 90,542,151
TOTAL 258 416C 00 0 $ 580,274,176
8
I
I
I
I
I
I

TABLE 6
UHEAA GROSS GUARANTEESANNUAL VOLUMETop Ten Lenders
For the Fiscal Year Ending June 30, 1990Stafford Student Loan Program
Number
Percent ofMarket Share(Based on
Institution of Loans Dollar Amount Dollar Volume)
America First Credit Union 1,355 $ 3,378,400 4.18First Interstate Bank 2,468 7,705 ,851 9.52.
First Security Bank 6,003 17,715,366 21.89
Key Bank 886 2,283,020 2.82Mountain America Credit Union 1,232 3,391,400 4.19United Savings Bank 1,545 3,513.395 4.34
Universal Campus Credit Union 2,671 9,095,129 11.24University of Utah Credit Union 623 2,201,704 2.72Valley Bank 980 2,756,360 3.41
Zion 's First National Bank 7 683 23,387,177 28.90
Subtotal 25,446 $ 75,427,802 93.22
All Other Lenders 1 895 5,487,831 6.78
TOTAL 27 341 $ 80 915 633 100.00
TABLE 7
UHEAA GROSS GUARANTEESANNUAL VOLUME
By LenderFor the Fiscal Year Ending June 30, 1990Supplemental Loans for Students Program
Number
Percent ofMarket Share(Based on
Institution of Loans Dollar Amount Dollar Volume)
Crossland Savings 1 $ 2,744 .08
Family First Credit Union 1 1,135 .03
First Interstate Bank 27 62,288 1.72
First Security Bank 272 814,428 22.49Granite District Credit Union 15 39,113 1.08
Guardian State Bank 1 1,200 .03
Key Bank 1 2,000 .06
Mountain America Credit Union 97 264,436 7.44
United Savings Bank 219 590,333 16.30Universal Campus Credit Union 149 419,238 11.58.a1.ey Bank 22 54,825 1.51
4est One Bank 4 8,747 .24
Zion's First National Bank 458 1,355,247 37.43
TOTAL 1 267 $ 3,620,734 100.00
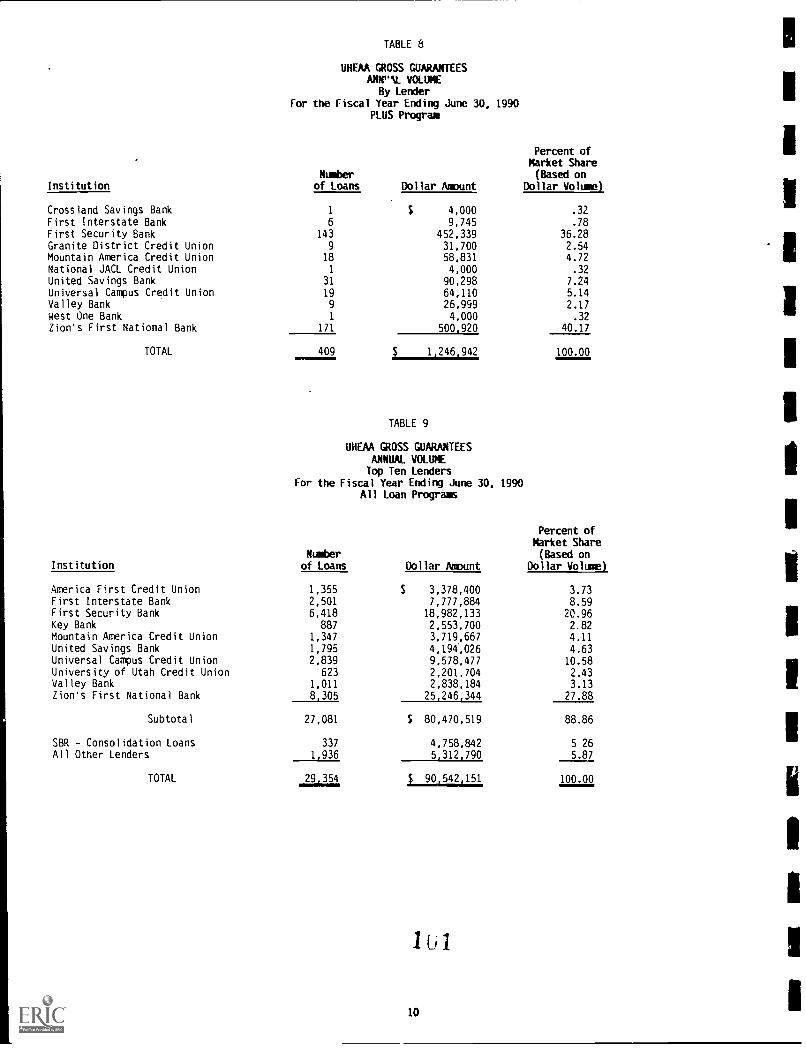
TABLE 8
UHEAA GROSS GUARANTEESANNP1L VOLUME
By LenderFor the Fiscal Year Ending June 30, 1990
PLUS Program
Number
Percent ofMarket Share(Based on
Institution of Loans Dollar Amount Dollar Volume)
Crossland Savings Bank 1 $ 4,000 .32
First Interstate Bank 6 9,745 .78
First Security Bank 143 452,339 36.28Granite District Credit Union 9 31,700 2.54Mountain America Credit Union 18 58,831 4.72
National JACL Credit Union 1 4,000 .32
United Savings Bank 31 90,298 7.24
Universal Campus Credit Union 19 64,110 5.14Valley Bank 9 26,999 2.17west One Bank 1 4,000 .32
Zion's First National Bank 171 500 920 40.17
TOTAL 409 $ 1,246,942 100.00
TABLE 9
UHEAA GROSS GUARAKTEESANNUAL VOLUMETop Ten Lenders
For the Fiscal Year Ending June 30, 1990All Loan Programs
Number
Percent ofMarket Share(Based on
Institution of Loans Dbllar Amount Dollar Volume)
America First Credit Union 1,355 $ 3,378,400 3.73First Interstate Bank 2,501 7,777,884 8.59First Security Bank 6,418 18,982,133 20.96Key Bank 887 2,553,700 2.82Mountain America Credit Union 1,347 3,719,667 4.11United Savings Bank 1,795 4,194.,026 4.63Universal Campus Credit Union 2,839 9,578,477 10.58University of Utah Credit Union 623 2,201,704 2.43Valley Bank 1,011 2,838,184 3.13Zion's First National Bank 8 305 25,246,344 27.88
Subtotal 27,081 $ 80,470,519 88.86
SBR - Consolidation Loans 337 4,758,842 5 26All Other Lenders 1 936 5,312,790 5.87
TOTAL 29 354 $ 90,542,151 100.00

TABLE 10
UHEAA GROSS GUARANTEESANNUAL VOLUMEUtah Schools
For the Fiscal Year Ending Jone 30, 1990Stafford Loan PrograA
Number
Percent ofMarket Share(Based on
Institution of Loans Dollar Amount Dollar Volume)
Advanced Career Institute 36 $ 70,520 .09
American Institute of Medical & Dental Technology 105 218,870 .27
American Technical Center 123 316,779 .39
Beau La Reine Beauty College 26 61,398 .08
Brigham Young University 7,284 24,562.565 30.36Bryman School 426 1,048,3c.2 1.30Certified Careers Institute 343 863,127 1.07College of Eastern Utah 128 247,830 .31
Continental College of Beauty 42 92,624 .11
Dixie College 446 1,003,942 1.24Evans Hairstyling College - Cedar City 7 17,150 .02
Evans Hairstyling College - Provo 16 38,610 .05
Evans Hairstyling College - St. George 3 7,507 .01
Fran Brown College of Beauty 23 50,500 .06Fran Brown College of Beauty 11 26,400 .03
Hairitage College of Beauty - Murray 28 63,887 .08
Hairitage College of Beauty - West Valley City 31 68,349 .08
Hollywood Beauty College 110 274,280 .34
Intermountain College of Court Reporting 35 88,268 .11
International Institute of Hair Design 135 277,759 .34
ITT Technical Institute 641 1,661,634 2.05LOS Business College 173 3g8,498 .48Logan Business College 7 14,750 .02
Mary Kawakami College of Beauty 7 17,980 .02
Painter's College of Beauty Ogden Branch 22 55,433 .07
Painter's College of Beauty Roy Branch 160 390,281 .48
Phillips Jr. College 264 560,841 .69
Salt Lake Community College 932 1,953,356 2.41Sevier Valley Area Vocational Center 31 74,243 .09
Snow College 239 387,091 .48
Southern Utah Ugiversity 1,006 2,198,080 2.72St. Mark's Hospital School of Radiologic Technology 1 6,800 .01
Stacey's Hands of Champions Beauty College 20 41,381 .05
Stevens-Henager College of Business - Ogden 578 1,533,755 1.90Stevens-Henager :ollege of Business - Provo 65 146,415 .18Universal Academy of Heir Design 14 26,071 .03
University of Phoenix 524 2,251,509 2.78University of Utah 4,735 16,499,938 20.39university of Utah - School of Radiologic Technology 22 55,225 .07
Utah State University 2,442 6,616,285 8.18Utah Valley Community College 968 2,262,422 2.80Von Curtis Academy of Hair Design - Provo 58 133,401 .16
Von Curtis Academy of Hair Design - Salt Lake 53 121,457 .15
Wasatch Career Institute 144 357,147Weber State University 2,J21 ',330,408 6.59Westminster College 847 2 853 689 3.53
Total Utah Schools 25,832 75,336,847 93.11All Other Schools 1,509 5,578,786 6.89
TOTAL 27 341 $ 80,915,633 100.00
11
1! 2

TABLE 11
UHEAA GROSS GUARANTEESANNUAL VOLUMEUtah Schools
For the Fiscal Year Ending June 30, 1990Supplemental Loans for Students Program
Number
Percent ofMarket Share(Based on
Institution of Loans Dollar Amount Dollar Volume)
Advanced Career Institute 1 $ 2,400 .07
American Institute of Medical & Dental Technology 3 2,150 .06
American Technical Center 1 4,000 .11
Beau La Reine Beauty College 3 11,175 .31
Brigham Young University 274 768,766 21.23Bryman School 31 57,143 1.58Certified Careers Institute 82 218,029 6.02College of Eastern Utah 6 12,797 .35
Continental College of Beauty 0 -0- .00
Dixie College 12 37,784 1.04
Evans Hairstyling College - Cedar City 0 -0- .00
Evans Hairstyling College - Provo 0 -0- .00
Evans Hairstyling College - St. George 0 -0- .00
Fran Brown College of Beauty 0 -0- .00
Fran Brown College of Beauty 0 -0- .00
Hairitage College of Beauty - Murray 0 -0- .00
Hairitage College of Beauty - West Valley City 0 -0- .00
Hollywood Beauty College 0 -0- .00
Intermountain College of Court Reporting 1 4,000 .11
International Institute of Hair Design 0 -0- .00
ITT Technical Institute 8 19,975 .55
LDS Business College 5 13,012 .36
Logan Business College 0 -0- .00
Mary Kawakami College of Beauty 0 -0- .00
Painter's College of Beauty Ogden Branch 0 -0- .00
Painter's College of Beauty Roy Branch 0 -0- .00
Phillips Jr. College 165 506,037 13.98Salt Lake Community College 37 75,349 2.08Sevier Valley Area Vocational Center 0 -0- .00
Snow College 2 2,247 .06
Southern Utah University 24 56,504 1.56St. Mark's Hospital School of Radiologic Technology 0 -0- .00
Stacey's Hands of Champions Beauty College 0 -0- .00
Stevens-Henager College of Business - Ogden 53 137,228 3.79Stevens-Henager College of Business - Provo 16 29,857 .82
Universal Aceery of Hair Design 0 -0- .00
University of Phoenix 0 -0- .00
University of Utah 186 589,413 16.28university of Utah - School of Radiologic Technology 0 -0- .00
Utah State University 53 115,532 3.19
Utah Valley Community College 19 56,003 1.55Von Curtis Academy of Hair Design - Provo 1 2,500 .07
Von Curtis Acaaemy of Hair Design - Salt Lake 15 58,448 1.61
Wasatch Career Institute 18 31,391 .87
Weber State University 33 68,433 1.89Westminster College 70 232 162 6.41
Total Utah Schools 1,119 3,112,335 85.96
All Other Schools 148 508,399 14.04
TOTAL _1,267- $ 3 620 734 100.00
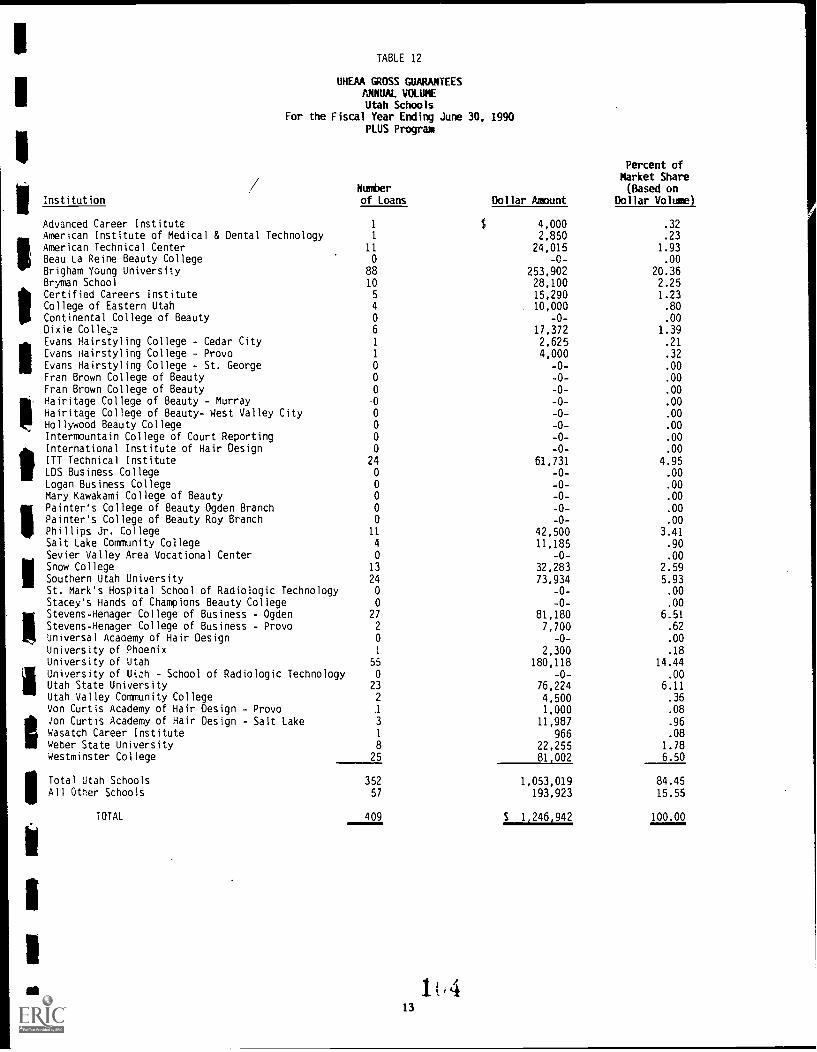
TABLE 12
UHEAA GROSS GUARMITEESANNUAL VOLUMEUtah Schools
For the Fiscal Year Ending June 30. 1990PLUS Program
Number
Percent ofMarket Share(Based on
Institution of Loans Dollar Amount Dollar Volume)
Advanced Career Institute 1 4,000 .32
American Institute of Medical & Dental Technology 1 2,850 .23
American Technical Center 11 24,015 1.93Beau La Reine Beauty College -0- .00
Brigham Young University 8 253,902 20.36Bryman School 1 28,100 2.25Certified Careers Institute 15,290 1.23College of Eastern Utah 10,000 .80
Continental College of Beauty -0- .00
Dixie Colle;a 17,372 1.39Evans Hairstyling College - Cedar City 2,625 .21
Evans Hairstyling College - Provo 4,000 .32
Evans Hairstyling College - St. George -0- .00Fran Brown College of Beauty -0- .00
Fran Brown College of Beauty -0- .00Hairitage College of Beauty - Murray -0- .00
Hairitage College of Beauty- West Valley City -0- .00Hollywood Beauty College -0- .00
Intermountain College of Court Reporting -0- .00International Institute of Hair Design -0- .00
ITT Technical Institute 2 61,731 4.95LDS Business College -0- .00
Logan Business College -0- .00
Mary Kawakami College of Beauty -0- .00
Painter's College of Beauty Ogden Branch -0- .00Painter's College of Beauty Roy Branch -0- .00
Phillips Jr. College 1 42,500 3.41Salt Lake Community College 11,185 .90
Sevier Valley Area Vocational Center -0- .00Snow College 1 32,283 2.59Southern Utah University 2 73,934 5.93St. Mark's Hospital School of Radiologic Technology -0- .00
Stacey's Hands of Champions Beauty College -0- .00Stevens-Henager College of Business - Ogden 2 81,180 6.51Stevens-Henager College of Business - Provo 7,700 .62
universal Acaoemy of Hair Design -0- .00
University of Phoenix 2,300 .18
University of Utah 55 180,118 14.44University of Llizlh - School of Radiologic Technology -0- .00Utah State University 23 76,224 6.11Utah Valley Community College 4,500 .36Von Curtis Academy of Hair Design - Provo 1,000 .08
/on Curtis Academy of Hair Design Salt Lake 11,987 .96
Wasatch Career Institute 966 .08weber State University 22,255 1.78Westminster College 25 81 002 6.50
Total Utah Schools 352 1,053,019 84.45All Other Schools 57 193,923 15.55
TOTAL 409 $ 1,246,942 100.00

TABLE 13
UHEAA GROSS GUARANTEESANNUAL VOLUMEUtah Schools
For the Fiscal Year Ending June 30. 1990All Loan Program Except Consolidation
Number
Percent ofMarket Share(Based on
Institution of Loans Dollar Amount Dollar Volume)
Advanced Career Institute 38 $ 76,920 .09American Institute of Medical & Dental Technology 109 223,870 .26American Technical Center 135 344,794 .40Beau La Reine Beauty College 29 72,573 .08Brigham Young University 7,646 25,585,233 29.83Bryman School 467 1,133,635 1.32Certified Careers Institute 430 1,096,446 1.28College of Eastern Utah 138 270,627 .32
Continental College of Beauty 42 92,624 .11
Dixie College 464 1,059,098 1.23Evans Hairstyling College - Cedar City 8 19,775 .02
Evans Hairstyling College - Provo 17 42,610 .05
Evans Hairstyling College - St. George 3 7,507 .01
Fran Brown College of Beauty - Layton 23 50,500 .06Fran Brown College of Beauty - Ogden 11 26,400 .03Hairitage College of Beauty - Murray 28 63,887 .07
Hairitage College of Beauty - West Valley City 31 68,349 .08Hollywood Beauty College 110 274,280 .32
Intermountain College of Court Reporting 36 92,268 .11International Institute of Hair Design 135 277,759 .32
ITT Technical Institute 673 1,743,340 2.03LDS Business College 178 401,510 .47
Logan Business College 7 14,750 .02
Mary Kawakami College of Beauty 7 17,980 .02
Painter's College of Beauty Ogden Branch 22 55,433 .06
Painter's College of Beauty Roy Branch 160 390,281 .45
Phillips Jr. College 440 1,109,378 1.29Salt Lake Community College 973 2,039,890 2.38Sevier Valley Area Vocational Center 31 74,243 .09Snow College 254 421,621 .49
Southern Utah University 1,054 2,328,518 2.71St. Mark's Hospital School of Radiologic Technology 1 6,800 .01
Stacey's Hands of Champions Beauty College 20 41,381 .05
Stevens-Henager College of Business - Ogden 658 1,752,163 2.04Universal Academy of Hair Design 14 26,071 .03University of Phoenix 525 2,253,809 2.63University of Utah 4,976 17,269,469 20.13University of Utah - School of Radiologic Technology 22 55,225 .06
Utah State University 2,518 6,808,041 7.94
Utah Valley Community College 989 2,322,925 2.71Von Curtis Academy of Hair Desigw- Provo 60 136,901 .16
Von Curtis Academy of Hair Design - Salt Lake 71 191,892 .22
Wasatch Career Institute 163 389,504 .45
Weber State University 2,562 5,421,096 6.32Westminster Cc,llege 942 3 166 853 3.69
Total Utah Schools 27,303 79,502,201 92.68All Other Schools 1,714 6,281,108 7.32
TOTAL 29 017 $ 85 783 309 100.00

v
FIGURE 3
STAFFORD LOAM DEFAULT RATES (GROSS)For the Year Ending September 30
FIGURE 4
STAFFORD LOAN DEFAULT RATES (NET)For the Year Ending September 30
15 .1.L.G

FIGURE 5
STAFFORD LOAM RECOVERY RATESFor the Year Ending September 30
it)
16

UTAM STATE BOARD OF REGENTSLOAM PURCHASE PROGRAM
The Student Loan Purchase Program was formed in 1977 for the purpose of making loans to, and purchasing
the loans of, qualified students attending eligible institutions of higher education. The Program, which beganoperations in January 1979, provides a secondary market for student loans which are guaranteed by the UtahHigher Education Assistance Authority (UHEAA) and originated by Utah lenders.
At the present time, 28 Utah lenders are originating student loans guaranteed by UHEAA. Of these 28
lenders, 26 of them also participate in the Board's secnndary market activities and generally speaking sell
their loans to the Loan Purchase Program at or prior to the time the borrower leaves school and beginsrepayment.
In October 1987, the Loan Purchase Program also began originating Consolidation Loans which providesa borrower with the opportunity to combine eligible types of outstanding student loan debts into one, newconsolidation loan. Through a Consolidation Loan, a borrower is able to make a single monthly payment and can
generally lower the amount of the monthly payment over the extended repayment period.
Following is a table of student loans purchased and originated by the Loan Purchase Program since
inception:
Year Consolidation
Ended Loans Loans
June 30 Purchased Originated
1979 $ 21,320,6741980 25,048,084
1981 3,984,461
1982 21,366,1851983 48,340,963
1984 40,475,2391985 18,773,146
1986 32,062,783
1987 29,581,2001988 30,241,627 2,671,635
1989 35,549,411 3,956,955
1990 38,570,030 4 776 965
TOTA' 345,313,801 $11,405,555
At June 30, 1990, the Loan Purchase Program's portfolio of student loans consisted of 55,128 borrowers
with an aggregate outstanding balance totaling $189,589,131. The student loan portfolio is financed throughtax exempt student loan revenue bonds issued by the Board of Regents. At June 30, 1990, there were $227,695,000
of bonds outstanding. These bonds are secured by the ,,ssets of the Program and are not liabilities of the State
of Utah.
17

1
TAB FFINANCIAL INFORMATION
TABLE 1 USHE Revenue Trend Analysis 1976-77 through 1991-92Education and General 1
TABLE 2 USHE Mineral Lease Allocations 1983-84 through 1989-90 6
TABLE 3 University of Utah Tuition and Fee Revenue AnalysisSchool of Medicine 8
TABLE 4 U.S. Bureau of Labor Statistics Consumer Price Indexfor all Urban Consumers, U.S. City Average, All Items 9
TABLE 5 Summary of Current Funds, Revenues, Expendituresand Transfers 10

Utah System of Higher Education
Revenue Trend Analysis
For 1976-77 through 1991-92
Education and General
TABLE 1
Institution
University of Utah
General
Fund
Appropr-
ation
(1)
%
of
Total
Revenues
(2)
Tuition
And
Fees
(3)
%
of
Total
Revenues
(4)
Other
Operating
Revenue
(5)
%
of
Total
Revenues
(6)
Total
Revenues
(7)
1976-77 $39,884,950 72.24% $11,274,118 20.42% $4,051,376 7.34% $55,210,444
1977-78 45,288,148 74.78% 11,906,463 19.66% 3,370,221 5.56% 60,564,832
1978-79 50,371,600 75.65% 11,947,069 17.94% 4,269,991 6.41% 66,588,660
1979-80 52,297,877 73.29% 13,068,770 18.31% 5,991,563 11.40% 71,358,210
1980-81 58,115,774 75.12% 15,390,741 19.89% 3,861,255 4.99% 77,367,770
1981-82 65,163,400 74.97% 17,140,050 19.72% 4,616,445 5.31% 86,919,895
1982-83 71,564,200 72.66% 18,935,356 19.22% 7,996,993 8.12% 98,496,549
1983-84 74,234,000 72.41% 20,458,281 19.96% 7,826,000 7.63% 102,518,281
1984-85 86,332,600 76.59% 21,770,570 19.31% 4,611,556 4.09% 112,714,726
1985-86 89,450,287 74.56% 23,243,560 19.37% 7,278,563 6.07% 119,972,410
1986-87 88,766,600 75.73% 25,457,174 21.72% 2,996,945 2.56% 117,220,719
1987-88 94,106,700 74.02% 25,941,874 20.41% 7,083,106 5.57% 127,131,680
1988-89 96,589,200 74.91% 27,501,268 21.33% 4,853,174 3.76% 128,943,642
1989-90 Actual 101,828,300 75.46% 30,453,192 22.57% 2,656,911 1.97% 134,938,403
1990-91 Budget 102,788,500 74.83% 33,852,200 24.64% 721,800 0.53% 137,362,500
1991-92 Requested 117,957,300 76.09% 37,058,500 23.91% 0 0.00% 155,015,800
Utah State University
1976-77 $17,833,550 71.20% $5,666,546 22.62% $1,546,369 6.17% $25,046,465
1977-78 20,040,288 71.99% 6,488,419 23.31% 1,307,053 4.70% 27,835,760
1978-79 22,424,200 73.31% 6,806,164 22.25% 1,356,390 4.43% 30,586,754
1979-80 23,860,608 71.64% 7,260.331 21.80% 2,185,765 6.56% 33,3u6,704
1980-81 26,621,069 72.68% 8,459,882 23.10% 1,544,942 4.22% 36,625,893
1981-82 29,591,900 72.00% 9,278,589 22.58% 2,227,500 5.42% 41,097,989
1982-83 32,777,121 72.48% 9,883,573 21.85% 2,562,732 5.67% 45,223,426
1983-84 34,053,600 72.01% 10,127,369 21.41% 3,111,872 6.58% 47,292,841
1984-85 40,492,200 76.20% 10,233,769 19.26% 2,415,172 4.54% 53,141,141
1985-86 42,849,180 75.42% 10,475,331 18.44% 3,492,854 6.15% 56,817,365
1986-87 43,511,800 77.35% 11,331,864 20.14% 1,412,997 2.51% 56,256,661
1987-88 46,088,900 77.74% 11,347,377 19.14% 1,849,964 3.12% 59,286,241
1988-89* 46,622,100 76.16% 12,516,682 20.45% 2,075,652 3.39% 61,214,434
1989-90 Actual* 50,410,500 76.55% 14,343,875 21.78% 1,097,821 1.67% 65,852,196
1990-91 Budgeted* 50,995,100 76.47% 15,112,800 22.66% 580,100 0.87% 66,688,000
1991-92 Requested* 61,392,400 76.97% 17,927,200 22.48% 439,500 0.55% 79,759,100
*Includes Coop. Masters w/SUSC
1
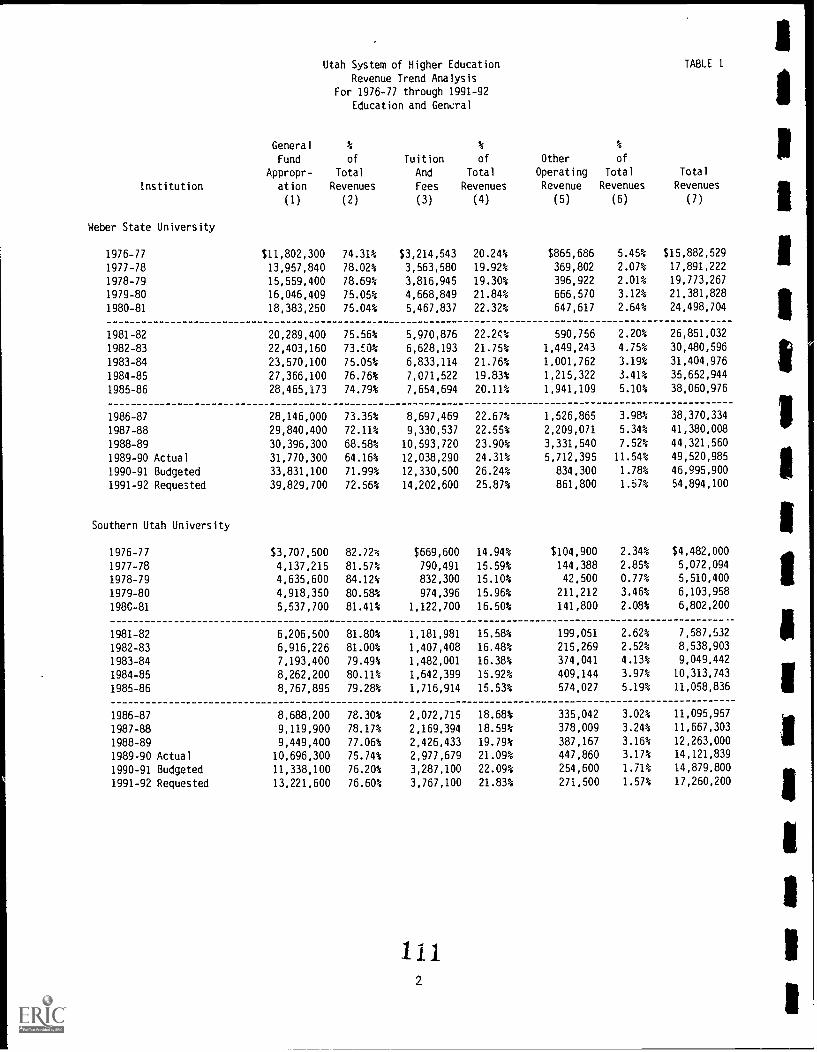
Utah System of Higher Education
Revenue Trend Analysis
For 1976-77 through 1991-92
Education and Ge%ral
TABLE 1
Institution
Weber State University
General
Fund
Appropr-
ation
(1)
%
of
Total
Revenues
(2)
Tuition
And
Fees
(3)
%
of
Total
Revenues
(4)
Other
Operating
Revenue
(5)
%
of
Total
Revenues
(6)
Total
Revenues
(7)
1976-77 $11,802,300 74.31% $3,214,543 20.24% $865,686 5.45% $15,882,529
1977-78 13,957,840 78.02% 3,563,580 19.92% 369,802 2.07% 17,891,222
1978-79 15,559,400 78.69% 3,816,945 19.30% 396,922 2.01% 19,773,267
1979-80 16,046,409 75.05% 4,668,849 21.84% 666,570 3.12% 21,381,828
1980-81 18,383,250 75.04% 5,467,837 22.32% 647,617 2.64% 24,498,704
1981-82 20,289,400 75.56% 5,970,876 22.24% 590,756 2.20% 26,851,032
1982-83 22,403,160 73.E0% 6,628,193 21.75% 1,449,243 4.75% 30,480,596
1983-84 23,570,100 75.05% 6,833,114 21.76% 1,001,762 3.19% 31,404,976
1984-85 27,366,100 76.76% 7,071,522 19.83% 1,215,322 3.41% 35,652,944
1985-86 28,465,173 74.79% 7,654,694 20.11% 1,941,109 5.10% 38,060,976
1986-87 28,146,000 73.35% 8,697,469 22.67% 1,526,865 3.98% 38,370,334
1987-88 29,840,400 72.11% 9,330,537 22.55% 2,209,071 5.34% 41,380,008
1988-89 30,396,300 68.58% 10,593,720 23.90% 3,331,540 7.52% 44,321,560
1989-90 Actual 31,770,300 64.16% 12,038,290 24.31% 5,712,395 11.54% 49,520,985
1990-91 Budgeted 33,831,100 71.99% 12,330,500 26.24% 834,300 1.78% 46,995,900
1991-92 Requested 39,829,700 72.56% 14,202,600 25.87% 861,800 1.57% 54,894,100
Southern Utah University
1976-77 $3,707,500 82.72% $669,600 14.94% $104,900 2.34% $4,482,000
1977-78 4,137,215 81.57% 790,491 15.59% 144,388 2.85% 5,072,094
1978-79 4,635,600 84.12% 832,300 15.10% 42,500 0.77% 5,510,400
1979-80 4,918,350 80.58% 974,396 15.96% 211,212 3.46% 6,103,958
198G-81 5,537,700 81.41% 1,122,700 16.50% 141,800 2.08% 6,802,200
1981-82 6,206,500 81.80% 1,181,981 15.58% 199,051 2.62% 7,587,532
1982-83 6,916,226 81.00% 1,407,408 16,48% 215,269 2.52% 8,538,903
1983-84 7,193,400 79.49% 1,482,001 16.38% 374,041 4.13% 9,049,442
1984-85 8,262,200 80.11% 1,642,399 15.92% 409,144 3.97% 10,313,743
1985-86 8,767,895 79.28% 1,716,914 15.53% 574,027 5.19% 11,058,836
1986-87 8,688,200 78.30% 2,072,715 18.68% 335,042 3.02% 11,095,957
1987-88 9,119,900 78.17% 2,169,394 18.59% 378,009 3.24% 11,667,303
1988-89 9,449,400 77.06% 2,426,433 19.79% 387,167 3.16% 12,263,000
1989-90 Actual 10,696,300 75.74% 2,977,679 21.09% 447,860 3.17% 14,121,839
1990-91 Budgeted 11,338,100 76.20% 3,287,100 22.09% 254,600 1.71% 14,879,800
1991-92 Requested 13,221,600 76.60% 3,767,100 21.83% 271,500 1.57% 17,260,200
1
1

1
1
Utah System of Higher Education
Revenue Trend Analysis
For 1976-77 through 1991-92
Education and General
TABLE 1
Institution
Snow College
General
Fund
Appropr-
ation
(1)
%
of
Total
Revenues
(2)
Tuition
And
Fees
(3)
%
of
Total
Revenues
(4)
Other
Operating
Revenue
(5)
%
of
Total
Revenues
(6)
Total
Revenues
(7)
1976-77 $1,776,750 85.25% $247,917 11.89% $59,616 2.86% $2,084,283
1977-78 2,105,945 86.85% 301,100 1.2.42% 17,800 0.73% 2,424,845
1978-79 2,524,300 88.92% 336,200 :1.84% (21,800) -0.77% 2,838,700
1979-80 2,694,500 82.94% 427,000 13.14% 127,300 3.92% 3,248,800
1980-81 3,035,900 82.97% 559,000 15.28% 64,000 1.75% 3,658,900
1981-82 3,421,5M 82.34% 683,274 16.44% 50,746 1.22% 4,155,520
1982-83 3,859,465 85.95% 624,184 13.90% 6,877 0.15% 4,490,526
1983-84 4,156,100 80.57% 745,872 14.46% 256,172 4.97% 5,158,144
1984-85 4,837,000 82.70% 755,361 12.91% 256,456 4.38% 5,848,817
1985-86 4,965,102 84.17% 816,118 13.84% 117,480 1.99% 5,898,700
1986-87 4,965,100 82.03% 972,520 16.07% 115,067 1.90% 6,052,687
1987-88 5,203,900 76.62% 1,058,206 15.58% 529,905 7.80% 6,792,011
1988-89 5,322,700 76.21% 1,156,542 16.56% 505,180 7.23% 6,984,422
1989-90 Actual 5,888,200 71.82% 1,593,757 19.44% 716,227 8.74% 8,198,184
1990-91 Budgeted 6,229,600 79.39% 1,490,800 19.00% 126,700 1.61% 7,847,100
1991-92 Requested 7,383,800 78.31% 1,908,800 20.24% 136,000 1.44% 9,428,600
Dixie College
1976-77 $1,879,000 78.03% $396,000 16.45% $133,000 5.52% $2,408,000
1977-78 2,119,995 78.61% 462,478 17.15% 114,427 4.24% 2,696,900
1978-79 2,496,700 82.98% 497,719 16.54% 14,503 0.48% 3,008,922
1979-80 2,682,705 81.06% 560,900 16.95% 65,893 1.99% 3,309,498
1980-81 3,095,489 80.93% 682,581 17.85% 46,930 1.23% 3,825,000
1981-82 3,448,400 80.20% 719,120 16.72% 132,280 3.08% 4,299,800
1982-83 3,793,986 79.56% 789,349 16 55% 185,492 3.C95: 4,768,827
1983-84 3,966,800 79.37% 837,855 16 77% 192,978 3.86% 4,997,633
1984-85 4,493,400 78.94% 932,943 16.39% 266,133 4.68% 5,692,476
1985-86 4,796,157 77.88% 1,140,654 18.52% 221,302 3.59% 6,158,113
1986-87 5,211,900 75.79% 1,316,538 19.14% 348,431 5.07% 6,876,869
1987-88 5,453,60' 73.51% 1,569,123 21.15% 396,470 5.34% 7,419,193
1988-89 5,656,500 68.84% 1,621,730 19.74% 938,592 11.42% 8,216,822
1989-90 Actual 6,257,000 69.22% 1,877,015 20.77% 905,203 10.01% 9,039,218
1990-91 Budgeted 6,564,900 76.07% 1,899,100 22.00% 166,400 1.93% 8,630,400
1991-92 Requested 7,715,900 77.51% 2,066,600 20.76% 172,200 1.73% 9,954,700
1123

Utah System of Higher Education
Revenue Trend Analysis
For 1976-77 through 1991-92
Fducation and General
TABLE 1
Institution
College of Eastern Utah
General %
Fund of
Appropr- Total
ation Revenues
(1) (2)
%
Tuition of
And Total
Fees Revenues
(3) (4)
Other of
Operating Total
Revenue Revenues
(5) (6)
Total
Revenues
(7)
1976-77 $1,444,000 88.71% $168,480 10.35% $15,374 0.94% $1,627,854
1977-78 1,629,525 84.69% 232,027 12.06% 62,637 3.26% 1,924,189
1978-79 1,897,900 84.19% 222,293 9.86% 134,163 5.95% 2,254,356
1979-80 2,072,725 83.26% 272,481 10.95% 144,110 5.79% 2,489,316
1980-81 2,389,672 85.44% 332,110 11.87% 75,205 2.69% 2,796,987
1981-82 2,656,100 84.26% 376,654 11.95% 119,451 3.79% 3,152,205
1982-83 2,914,177 83.66% 413,720 11.88% 155,344 4.46% 3,483,241
1983-84 3,058,530 83.72% 442,776 12.12% 151,976 4.16% 3,653,282
1984-85 3,692,700 84.39% 479,862 10.97% 203,418 4.65% 4,375,980
1985-86 3,786,651 76.74% 550,395 11.15% 597,090 12.10% 4,934,136
1986-87 4,013,700 83.64% 623,071 12.98% 161,798 3.37% 4,798,569
1987-88 4,145,774 83.96% 627,711 12.71% 164,235 4,937,720
1988-89 4,307,400 80.09% 681,249 12.67% 389,365 7.24% 5,378,014
1989-90 Actual 4,862,900 79.65% 816,600 13.38% 425,578 6.97% 6,105,078
1990-91 Budgeted 5,134,400 82.63% 961,000 15.47% 118,500 1.91% 6,213,900
1991-92 Requested 5,979,600 83.19% 1,081,200 15.04% 127,400 1.77% 7,188,200
Utah Valley Community College
1976-77 $3,463,500 70.65% 987,299 20.14% $451,508 9.21% 4,902,307
1977-78 4,441,140 76.63% 1,123,528 19.39% 230,864 3.98% 5,795,532
1978-79 5,286,000 74.79% 1,291,200 18.27% 491,000 6.95% 7,068,200
1979-80 5,436,500 72.85% 1,473,800 19.75% 552,500 7.40% 7,462,800
1980-81 6,206,500 71.70% 1,904,800 22.00% 545,100 6.30% 8,656,400
1981-82 7,054,100 68.61% 2,285,000 22.23% 942,100 9.16% 10,281,200
1982-83 7,671,400 67.43% 2,952,500 25.95% 753,600 6.62% 11,377,500
1983-84 7,997,700 66.53% 3,298,200 27.44% 725,800 6.04% 12,021,700
1984-85 9,963,500 71.92% 3,393,900 24.50% 496,700 3.59% 13,854,100
1985-86 10,723,475 69.63% 3,833,824 24.89% 842,982 5.47% 15,400,281
1986-87 10,716,500 67.11% 4,594,125 28.77% 657,127 4.12% 15,957,752
1987-88 11,162,400 66.46% 4,853,938 28.90% 780,088 4.64% 16,796,426
1988-89 11,658,900 64.36% 5,283,565 29.17% 1,172,715 6.47% 18,115,180
1989-90 Actual 12,771,900 61.64% G,451,749 31.14% 1,496,373 7.22% 20,720,022
1990-91 Budgeted 13,939,400 65.38% 6,787,800 31.84% 592,300 2.78% 21,319,500
1991-92 Requested 16,455,900 67.33% 7,346,400 30.06% 638,500 2.61% 24,440,800
113
4
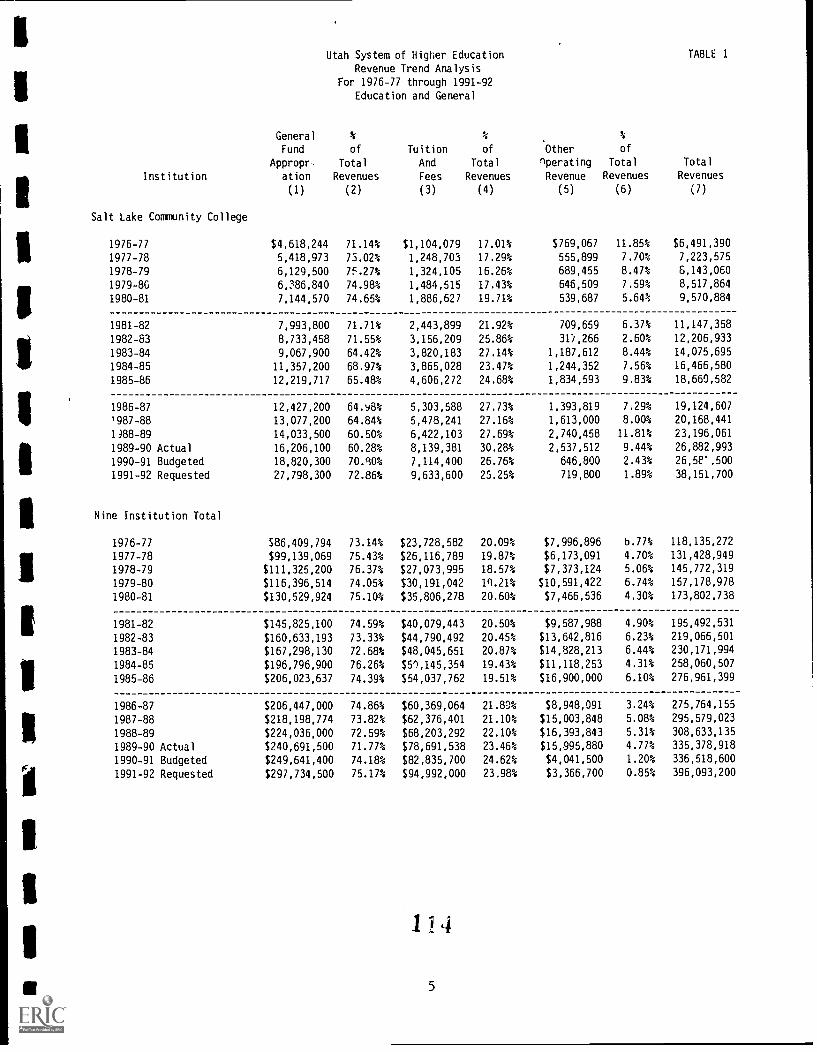
Utah System of Higher Education
Revenue Trend Analysis
For 1976-77 through 1991-92
Education and General
TABLE 1
Institution
Salt Lake Community College
General %
Fund of
Appropr. Total
ation Revenues
(1) (2)
Tuition
And
Fees
(3)
%
of
Total
Revenues
(4)
Other
nperating
Revenue
(5)
%
of
Total
Revenues
(6)
Total
Revenues
(7)
1976-77 $4,618,244 71.14% $1,104,079 17.01% $769,067 11.85% $6,491,390
1977-78 5,418,973 75.02% 1,248,703 17.29% 555,899 7.70% 7,223,575
1978-79 6,129,500 75.27% 1,324,105 16.26% 689,455 8.47% 6,143,060
1979-80 6,86,840 74.98% 1,484,515 17.43% 646,509 7.59% 8,517,864
1980-81 7,144,570 74.65% 1,886,627 19.71% 539,687 5.64% 9,570,884
1981-82 7,993,800 71.71% 2,443,899 21.92% 709,659 6.37% 11,147,358
1982-83 8,733,458 71.55% 3,156,209 25.86% 31,266 2.60% 12,206,933
1983-84 9,067,900 64.42% 3,820,183 27.14% 1,187,612 8.44% 14,075,695
1984-85 11,357,200 68.97% 3,865,028 23.47% 1,244,352 7.56% 16,466,580
1985-86 12,219,717 65.48% 4,606,272 24.68% 1,834,593 9.83% 18,660,582
1986-87 12,427,200 64.8% 5,303,588 27.73% 1,393,819 7.29% 19,124,607
1987-88 13,077,200 64.84% 5,478,241 27.16% 1,613,000 8.00% 20,168,441
1)88-89 14,033,500 60.50% 6,422,103 27.69% 2,740,458 11.81% 23,196,061
1989-90 Actual 16,206,100 60.28% 8,139,381 30.28% 2,537,512 9.44% 26,882,993
1990-91 Budgeted 18,820,300 70.10% 7,114,400 26.76% 646,800 2.43% 26,58',500
1991-92 Requested 27,798,300 72.86% 9,633,600 25.25% 719,800 1.89% 38,151,700
Nine Institution Total
1976-77 $86,409,794 73.14% $23,728,582 20.09% $7,996,896 b.77% 118,135,272
1977-78 $99,139,069 75.43% $26,116,789 19.87% $6,173,091 4.70% 131,428,949
1978-79 $111,325,200 76.37% $27,073,995 18.57% $7,373,124 5.06% 145,772,319
1979-80 $116,396,514 74.05% $30,191,042 11.21% $10,591,422 6.74% 157,178,978
1980-81 $130,529,924 75.10% $35,806,278 20.60% $7,466,536 4.30% 173,802,738
1981-82 $145,825,100 74.59% $40,079,443 20.50% $9,587,988 4.90% 195,492,531
1982-83 $160,633,193 73.33% $44,790,492 20.45% $13,642,816 6.23% 219,066,501
1983-84 $167,298,130 72.68% $48,045,651 20.87% $14,828,213 6.44% 230,171,994
1984-85 $196,796,900 76.26% $51,145,354 19.43% $11,118,253 4.31% 258,060,507
1985-86 $206,023,637 74.39% $54,037,762 19.51% $16,900,000 6.10% 276,961,399
1986-87 $206,447,000 74.86% $60,369,064 21.89% $8,948,091 3.24% 275,764,155
1987-88 $218,198,774 73.82% $62,376,401 21.10% $15,003,848 5.08% 295,579,023
1988-89 $224,036,000 72.59% $68,203,292 22.10% $16,393,843 5.31% 308,633,135
1989-90 Actual $240,691,500 71.77% $78,691,538 23.46% $15,995,880 4.77% 335,378,918
1990-91 Budgeted $249,641,400 74.18% $82,835,700 24.62% $4,041,500 1.20% 336,518,600
1991-92 Requested $297,734,500 75.17% $94,992,000 23,98% $3,366,700 0.85% 396,093,200
1 1 4
5
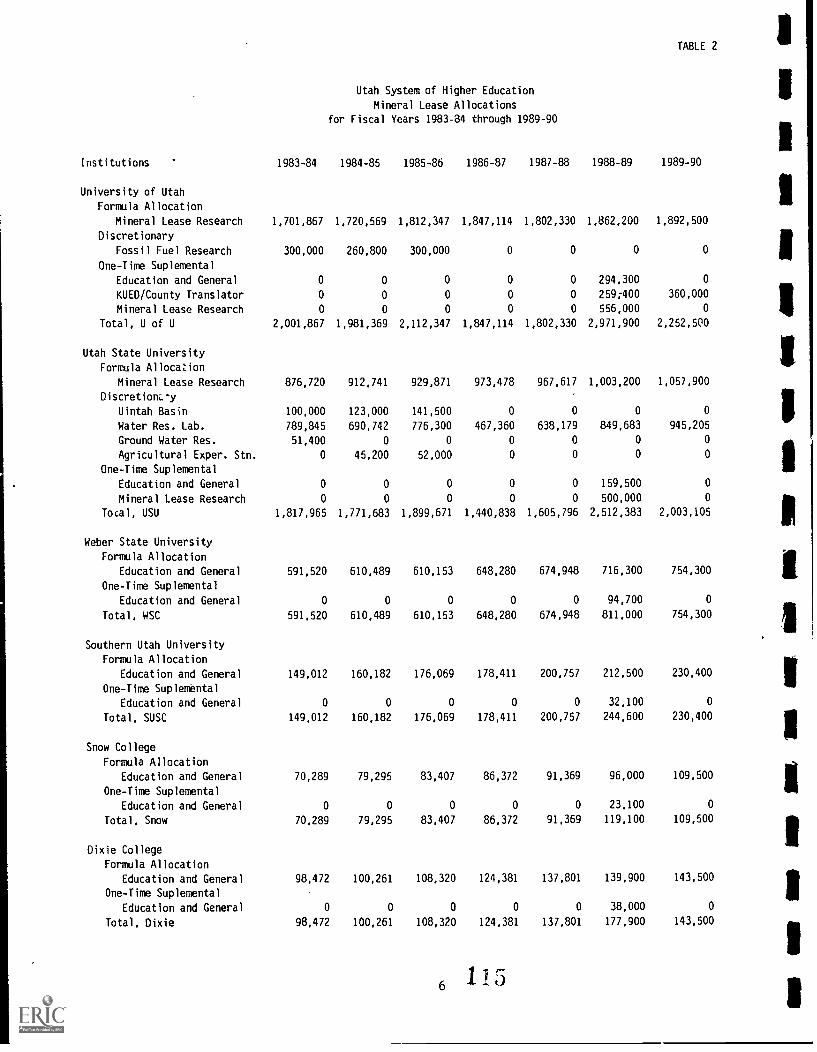
TABLE 2
Institutions
University of Utah
Formula Allocation
for
1983-84
Utah System of Higher Education
Mineral Lease Allocations
Fiscal Years 1983-34 through 1989-90
1984-85 1985-86 1986-87 1987-88 1988-89 1989-90
Mineral Lease Research 1,701,867 1,720,569 1,812,347 1,847,114 1,802,330 1,862,200 1,892,500
Discretionary
Fossil Fuel Research 300,000 260,800 300,000 0 0 0 0
One-Time Suplemental
Education and General 0 0 0 0 0 294,300 0
KUED/County Translator 0 0 0 0 0 259;400 360,000
Mineral Lease Research 0 0 0 0 0 556,000 0
Total, U of U 2,001,867 1,981,369 2,112,347 1,847,114 1,802,330 2,971,900 2,252,500
Utah State University
Formula Allocation
Mineral Lease Research 876,720 912,741 929,871 973,478 967,617 1,003,200 1,057.900
Discretionz.sy
Uintah Basin 100,000 123,000 141,500 0 0 0 0
Water Res. Lab. 789,845 690,742 776,300 467,360 638,179 849,683 945,205
Ground Water Res. 51,400 0 0 0 0 0 0
Agricultural Exper. Stn. 0 45,200 52,000 0 0 0 0
One-Time Suplemental
Education and General 0 0 0 0 0 159,500 0
Mineral Lease Research 0 0 0 0 0 500,000 0
local, USU 1,817,965 1,771,683 1,899,671 1,440,838 1,605,796 2,512,383 2,003,105
Weber State University
Formula Allocation
Education and General 591,520 610,489 610,153 648,280 674,948 716,300 754,300
One-Time Suplemental
Education and General 0 0 0 0 0 94,700 0
Total, WSC 591,520 610,489 610,153 648,280 674,948 811,000 754,300
Southern Utah University
Formula Allocation
Education and General 149,012 160,182 176,069 178,411 200,757 212,500 230,400
One-Time Suplemental
Education and General 0 0 0 0 0 32,100 0
Total, SUSC 149,012 160,182 176,069 178,411 200,757 244,600 230,400
Snow College
Formula Allocation
Education and General 70,289 79,295 83,407 86,372 91,369 96,000 109,500
One-Time Suplemental
Education and General 0 0 0 0 0 23,100 0
Total, Snow 70,289 79,295 83,407 86,372 91,369 119,100 109,500
Dixie College
Formula Allocation
Education and General 98,472 100,261 108,320 124,381 137,801 139,900 143,500
One-Time Suplemental
Education and General 0 0 0 0 0 38,000 0
Total, Dixie 98,472 100,261 108,320 124,381 137,801 177,900 143,500

TABLE 2
Institutions
College of Eastern Utah
Formula Allocation
1983-84
Utah System of Higher Education
Mineral Lease Allocations
for Fiscal Years 1983-84 through 1989-90
1984-85 1985-86 1986-87 1987-88 1988-89 1989-90
Education and General 51,865 73,690 84,820 86,145 98,800 98,900 109,500
Discretionary
Education and General 151,000 155,800 189,000 0 0 0 0
One-Time Suplemental
Education and General 0 0 0 0 0 275,000 0
San Juan Center 0 0 0 0 0 9,300 0
Prehistoric Museum 0 0 0 0 0 0 100,000
Total, CEU 202,865 229,490 273,820 86,145 98,800 383,200 209,500
Utah Valley Community College
Formula Allocation
Education and General 345,300 364,716 361,465 370,197 389,178 409,300 424,200
One-Time Suplemental
Education and General 0 0 0 0 0 35,800 0
Total, UVCC 345,300 364,716 361,465 370,197 389,178 445,100 424,200
Salt Lake Community College
Formula Allocation
Education and General 350,985 375,026 406,395 432,237 436,956 471,700 508,600
One-Time Suplemental
Education and General 0 0 0 0 0 91,300 0
Total, SLCC 350,985 375,026 406,395 432,237 436,956 563,000 508,600
State Board of Regents
One-Time Suplemental
Administration 0 0 0 0 0 22,400 * 0
Total
Formula Allocation 4,236,030 4,396,969 4,572,847 4,746,615 4,799,756 5,010,000 5,230,400
Discretionary 1,392,245 1,275,542 1,458,800 467,360 638,179 849,683 945,205
One-Time Suplemental 0 0 0 0 0 2,390,900 460,000
Total 5,628,275 5,672,511 6,031,647 5,213,975 5,437,935 8,250,583 6,635,605
*Not Included in 1990-91 Appropriated Operating Budget Book

TABLE 3 I
University of Utah
Tuition and Fee Revenue Analysis
School of Medicine
1989-90, 1990-91 and 1991-92
Actual 1989-90 Budget 1990-91 SBR Request 1991-92----
Total
RevenueTuition and Fees Students Tuition
Total
Revenue Students Tuition
Total
Revenue
Est. Est.
Students Tuition
Resident Students 337.40 $4,575 $1,543,583 324.00 $4,893 $1,585,300 329.00 $5,187
Nonresident Students 10.62 9,900 105,132 14.00 10,593 148,300 14.00 11,230
W1CHE Students:
Resident Fees 18.00 4,575 82,350 30.00 4,893 146,800 25.00 5,187
W1CHE Fee 22,800 410,400 22,800 684,000 22,800
Wyoming Student-Non Resident Fees 27.00 9,900 267,300 32.00 10,593 339,000 32.00 11,230
Physician Assistant Program
Resident Students 22.67 4,905 111,180 25.00 5,250 131,300 25.00 5,565
Nonresident Students 10.00 5,658 58,466 10.00 6,054 60,500 10.00 ,, 15
Masters & Doctoral Student Fees 196,900 210,700
Other Miscellaneous Fees 16,990 13,300
Total Tuition and Fees 425.69 $2,792,301 435.00 $3,319,200 435.00
$1,706,500
157,200
129,700
R570,000
359,300
139,100111
64,100
223,300
13,300
I$3,362,500
-............... ======= .......- -- ._ . _ __ .. . .
lir
Tuition and Fee Revenue Analysis
Regional Dental Education Program
1989-90, 1990-91 and 1991-92
Actual 1989-90 Budget 1990-91 SBR Request 1991-92----
Total Total Total
Tuition and Fees Students Tuition Revenue Students Tuition Revenue Students Tuition Revenue
Tuition naid to the U of U 10.00 4,776 47,760 10.00 4,890 48,900 10.00 5,180 51,800
1 1 7
8

U.S. Bureau of Labor Statistics
Consumer Price Index for all Urban Consumers
U. S. City Average. All Items
Year Jan. Feb. March April
(1982-84
May June
- 100)
July
1967 32.9 32.9 33.0 33.1 33.2 33.3 33.4
1968 34.1 34.2 34.3 34.4 34.5 34.7 34.9
1969 35.6 35.8 36.1 36.3 36.4 36.6 36.8
1970 37.8 38.0 38.2 38.5 38.6 38.8 39.0
1971 39.8 39.9 40.0 40.1 40.3 40.6 40.7
1972 41.1 41.3 41.4 41.5 41.6 41.7 41.9
1973 42.6 42.9 43.3 43.6 43.9 44.2 44.3
1974 46.6 47.2 47.8 48.0 48.6 49.0 49.4
1975 52.1 52.5 52.7 52.9 53.2 53.6 54.2
1976 55.6 55.8 55.9 56.1 56.5 56.8 57.1
1977 58.5 59.1 59.5 60.0 60.3 60.7 61.0
1978 62.5 62.9 63.4 63.9 64.5 65.2 65.7
1979 68.3 69.1 69.8 70.6 71.5 72.3 73.1
1980 77.8 78.9 80.1 81.0 81.8 82.7 82.7
1981 87.0 87.9 88.5 89.1 89.8 90.6 91.6
1982 94.3 94.6 94.5 94.9 95.8 97.0 97.5
1983 97.8 97.9 97.9 98.6 99.2 99.5 99.9
1984 101.9 102.4 102.6 103.1 103.4 103.7 104.1
1985 105.5 106.0 106.4 106.9 107.3 107.6 107.8
1986 109.6 109.3 108.8 108.6 108.9 109.5 109.5
1987 111.2 111.6 112.1 112.7 113.1 113.5 113.8
1988 115.7 116.0 116.5 117.1 117.5 118.0 118.5
1989 121.1 121.6 122.3 123.1 123.8 124.1 124.4
1990 127.4 128.0 128.7 128.9 129.2 129.9 130.4
Aug.
33.5
35.0
37.0
39.0
40.8
42.0
45.1
50.0
54.3
57.4
61.2
66.0
73.8
83.3
92.3
97.7
100.2
104.5
108.0
109.7
9
114.4
119.0
124.6
131.6
TABLE 4
Sept. Oct. Nov. Dec.
Yearly --% Increase--
Ave. Dec Ann Ave
33.6 33.7 33.8 33.9 33.4 3.1% 3.1%
35.1 35.3 35.4 35.5 34.8 4.7% 4.3%
37.1 37.3 37.6 37.7 36.7 6.2% 5.5%
39.2 39.4 39.6 39.8 38.8 5.6% 5.8%
40.8 40.9 40.9 41.1 40.5 3.3% 4.3%
42.1 42.3 42.4 42.5 41.8 3.4% 3.3%
45.2 45.6 45.9 46.2 44.4 8.7% 6.2%
50.6 51.1 51.5 51.9 49.3 12.3% 11.1%
54.6 54.9 55.3 55.5 53.8 6.9% 9.1%
57.6 57.9 58.0 58.2 56.9 4.9% 5.7%
61.4 61.6 61.9 62.1 60.6 6.1% 6.5%
66.5 67.1 67.4 67.7 65.2 9.0% 7.6%
74.6 75.2 75.9 76.7 72.6 13.3% 11.3%
84.0 84.8 85.5 86.3 82.4 12.5% 13.5%
93.2 93.4 93.7 94.0 90.9 8.9% 10.3%
97.9 98.2 98.0 97.6 96.5 3.8% 6.1%
100.7 101.0 101.2 101.3 99.6 3.84 3.2%
105.0 105.3 105.3 105.3 103.9 3.9% 4.3%
108.3 108.7 109.0 109.3 107.6 3.8% 3.5%
110.2 110.3 110.4 110.5 109.6 1.1% 1.9%
115.0 115.3 115.4 115.4 113.6 4.4% 3.7%
119.8 120.2 120.3 120.5 118.3 4.4% 4.1%
125.0 125.6 125.9 126.1 124.0 4.6% 4.8%
132.7 133.5 133.8 134.0 130.7 6.3% 5.4%
Est. Est. Est. Est.

UNIVERSITY OF UTAN
SUMMARY Of CURRENT FUNDS, REVENUES, EXPENDITURES ANO TRANSFERS TABLE 5
1989-90 ACTUAL 1990-91 ESTIMATED
Other Total Other Total
Appropriated Current Funds Current Funds Appropriated Current Funds Current Funds
CURRENT FUNDS REVENUES
Education and General
Tuition and Fees 132,882,853 17,745,115 $40,627,968 $36,536,300 $8,031,700 $44,568,000
Endowment Income $0 19,694,501 $8,694,501 .$0 $9,129,200 $9,129,200
Sales and Services $0 $58,334,218 $58,334,218 $O $61,250,900 $61,250,900
Other Sources $746,885 $13,229,516 $13,976,401 $1,186,100 113,891,000 $15,077,100
Gift, Grant and Contract Funds $2,154,628 $109,743,304 $111,897,932 $971,800 $117,048,200 $118,020,000
Federal Appropriations $0 SO $0 $0 SO SO
State Appropriations $123,478,800 SO $123,478,800 + $123,368,700 $0 $123,368,700
Local Appropriations $0 $0 $0 $0 SO $0
TOTAL EDUCATION ANO GENERAL $159,263,166 $197,746,654 $357,009,820 $162,062,900 $209,351,000 $371,413,900
Hospital (Including Appropriations) $2,878,800 $188,139,319 $191,018,119 $3,042,200 1197,546,300 1200,588,500
Auxiliary Enterprises ,0 $36,876,554 $36,876,554 $O 538,720,400 $38,720,400
Independent Operations $O $0 $01
$0 $0 $0
TOTAL REVENUES $162,141,966 $422,762,527 $584,904 493 $165,105,100 $445,617,700 SO10,722,800
Expenditures and Transfers
Education and General
Instruction $84,496,145 $20,786,268 $105,282,413 $92,057,000 $22,681,300 1114,738,300
Research $3,441,988 $65,332,754 $68,774,742 $1,914,600 $71,289,000 $73,203,600
Public Service $4,607,142 $59,854,180 $64,461,322 $3,345,400 565,311,000 $68,656,400
Academic Support $18,441,396 $11,121,488 $29,562,884 $16,982,200 $12,135,400 $29,117,600
Student Services $7,000,902 12,640,792 $9,641,694 ' $7,056,500 $2,881,500 19,938,000
Institutional Support $15,855,255 $5,376,098 $21,231,353 117,115,000 15,866,200 122,981,200
Operation and Maintenance of Plant $20,554,918 $40,993 $20,595,911 $22,704,100 $44,700 122,748,800
Scholarships and Fellowships $423,400 $14,061,850 $14,485,250 $386,000 $15,343,800 $15,729,800
Transfers (Net) $283,706 $12,645,131 $12,928,837 " $502,100 $13,798,100 $14,300,200
TOTAL EDUCATION AND GENERAL $155,104,852 $191,859,554 $346,964,406 $162,062,900 $209,351,000 $371,413,900
Hospitals
Expenditures $2,878,800 $177,335,217 $180,214,017 $3,042,200 $188,922,200 $191,964,400
Transfers (Net) $0 $8,226,583 $8,226,583 $0 $8,624,100 $8,624,100
TOTAL HOSPITALS 12.878,800 $185,561,800 $188,440,600 $3.042,200 $197,546,300 1200,588,500
Auxiliary Enterprises
Expenditures $0 $35,293,262 $35,293,262 SO $36,318,900 $36,318,900
Transfers (Net) $0 $2,333,632 $2,333,632 $0 $2,401,500 $2,401,500
TOTAL AUXILIARY ENTERPRISES $0 $37,626,894 $37,626,894 SO $38,720,400 $38,720,400
Total Independent Operations $0 $0 $0 SO $0 $O
TOTAL EXPENDITURES AND TRANSFERS $157,983,652 $415,048,248 $573,031,900 $165,105,100 $445,617,700 $610,722,800
REVENUE/EXPENDITURES DIFFERENCE $4,158,314 $7,714,279 $11,872,593 $0 $0 SO
*Difference from IPTaS report and Financial Statement due to revenue received but not expended.
'Difference from IPEDS report and Financial Statement due to different definitions used by the budget office as compared to the accounting office.
1 910

SUMMARY OF CURRENT FUNDS, REVENUES, EXPENDITURES AND TRANSFERS TABLE 5
UNIVERSITY OF UTAH 1991-92 ESTIMATED
CURRENT FUNDS REVENUES
Education and General
Appropriated
Other
Current Funds
Total
Current Funds
Tuition and Fees $39,966,200 $8,513,600 $48,479,800
Endowment Income SO $9,585,700 $9,585,700
Sales and Services $0 $64,313,400 $64,313,400
Other Sources $1,072,100 $14,585,600 $15,657,700
Gift, Grant and Contract Funds SO $125,322,400 $125,322,400
Federal Appropriations $0 $O $0
State Appropriations $141,114,500 SO $141,114,500
Local Appropriations $O SO SO
TOTAL EDUCATION AND GENERAL $182,152,800 $222,320,700 $404,473,500
Hospital (Including Appropriations) $3,298,600 $207,423,600 $210,722,200
Auxiliary Enterprises $O $40,656,400 $40,656,400
Independent Operations SO $0 $0
TOTAL REVENUES $185,451,400 $470,400,700 $655,852,100
Expenditures and Transfers
Education and General
Instruction 599,412,800 524,086,500 $123,499,300
Research $4,049,600 575,705,500 579,755,100
Public Service $5,420,500 569,357,100 574,777,600
Academic Support $21,697,000 512,887,200 $34,584,200
Student Services $8,236,800 $3,060,100 $11,296,900
Institutional Support $18,654,300 $6,229,700 $24,884,000
Operation and Maintenance of Plant $24,183,600 $47,500 $24,231,100
Scholarships and Fellowships $498,200 $16,294,400 $16,792,600
Transfers (Net) SO $14,652,700 $14,652,700
TOTAL EDUCATION AND GENERAL $182,152,800 $222,320,700 $404,473,500
Hospitals
Expenditures $3,298,600 $198,368,300 $201,666,900
Transfers (Net) $0 $9,055,200 $9,055,200
TOTAL HOSPITALS $3,298,600 $207,423,600 $210,722,200
Auxiliary Enterprises
Expenditures $0 $38,134,900 $38,134,900
Transfers (Net) SO $2,521,500 $2,521,500
TOTAL AUXILIARY ENTERPRISES $0 $40,656,400 $40,656,400
Total Independent Operations $0 $0 $0
TOTAL EXPENDITURES AND TRANSFERS $185,451,400 $470,400,700 $655,852,100
REVENUE/EXPENDITURES DIFFERENCE $O $0 $0

SUMMARY Of CURRENT FUNDS, REVENUES, EXPENDITURES AND TRANSFERS TABLE 5
IIUTAH STATE UNIVERSITY 1989-90 ACTUAL 1990-91 ESTIMATED
Other Total Other Total
Appropriated Current Funds Current Funds Appropriated Current Funds Current Funds
CURRENT FUNDS REVENUES
Education and General
Tuition and Fees $14,874,016 $5,646,927 $20,520,943 $15,785,700 $5,870,500 $21,656,200
Endowment Income $O $580,072 $580,072 $0 $609,100 $609,100
Sales and Services $1,419,976 $1,645,631 $3,065,607 $800,400 $1,727,900 $2,528,300
Other Sources $603,041 $4,796,835 $5,399,876 $490,100 $5,036,700 $5,526,800
Gift, Grant and Contract Funds $1,486,604 $83,233,610 $84,720,214 $290,600 $87,749,800 $88,040,400
Federal Appropriations $3,617,894 $284,730 $3,902,624 $3,426,200 $0 $3,426,200
State Appropriations $68,192,105 $O $68,192,105 4. $69,868,300 $0 $69,868,300
Local Appropriations $0 $O $O $0 SO $0
TOTAL EDUCATION AND GENERAL $90,193,636 $96,187,805 $186,381,441 $90,661,300 $100,994,000 $191,655,300
Hospital (Including Appropriations) $0 $0 SO $O $O $0
Auxiliary Enterprises $0 $17,350,080 $17,350,080 $0 $18,217,600 $18,217,600
Independent Operations SO $O $0 $0 SO $O
TOTAL REVENUES $90,193,636 $113,537,885 $203,731,521 $90,661,300 $119,211,600 1209,872,900
Expenditures and Transfers
Education and General
Instruction $36,228,372 $9,534,189 $45,762,561 * $38,929,269 $10,710,700 $49,639,969
Research $13,686,220 $54,634,521 $68,320,741 $13,121,554 $61,376,500 $74,498,054
Public Service $9,503,000 $5,559,597 $15,062,597 $9,286,492 $6,245,700 $15,532,192
Academic Support $10,203,224 $495,131 $10,698,355 $8,854,889 $556,200 19,4'1,089
Student Services $3,793,986 $1,499,889 $5,293,875 * $3,940,626 $1,685,000 $5,625,626
Institutional Support $5,930,810 $4,281,911 $10,212,721 $5,856,479 $4,810,300 $10,666,779
Operation and Maintenance of Plant $9,857,378 $85,257 $9,942,635 * $10,431,091 $95,800 $10,526,891
Scholarships and Fellowships $137,253 $12,252,520 $12,389,773 $140,300 $13,764,500 $13,904,800
Transfers (Net) $84,413 $1,557,120 $1,641,533 * 1100,600 $1,749,300 $1,849,900
TOTAL EDUCATION AND GENERAL $89,424,656 $89,900,135 $179,324,791 $90,661,300 $100,994,000 $191,655,300
Hospitals
Expenditures $0 SO $0 $0 $0 $0
Transfers (Net) $0 $O $0 $0 SO $0
TOTAL HOSPITALS $0 SO $0 $0 tn SO
Auxiliary Enterprises
Expenditures $0 $17,654,256 $17,654,256 $0 $18,298,900 $18,298,900
Transfers (Net) $0 ($78,483) ($78,483) $0 ($81,300) ($81,300)
TOTAL AUXILIARY ENTERPRISES $0 $17,575,773 $17,575,773 $0 $18,217,600 $18,217,600
Total Independent Operations $0 $O $0 $0 $0 $0
TOTAL EXPENDITURES AND TRANSFERS $89,424,656 $107,475,908 $196,900,564 $90,661,300 $119,211,600 $209,872,900
REVENUE/EXPENDITURES DIFFERENCE $768,980 $6,061,977 $6,830,957 SO $0 $0
+Difference from IPEDS report and Financial Statement due to revenue received but not expended.
*Difference from IPEDS report and Financial Statement due to different definitions used by the budget office as compared to the accounting office.
12
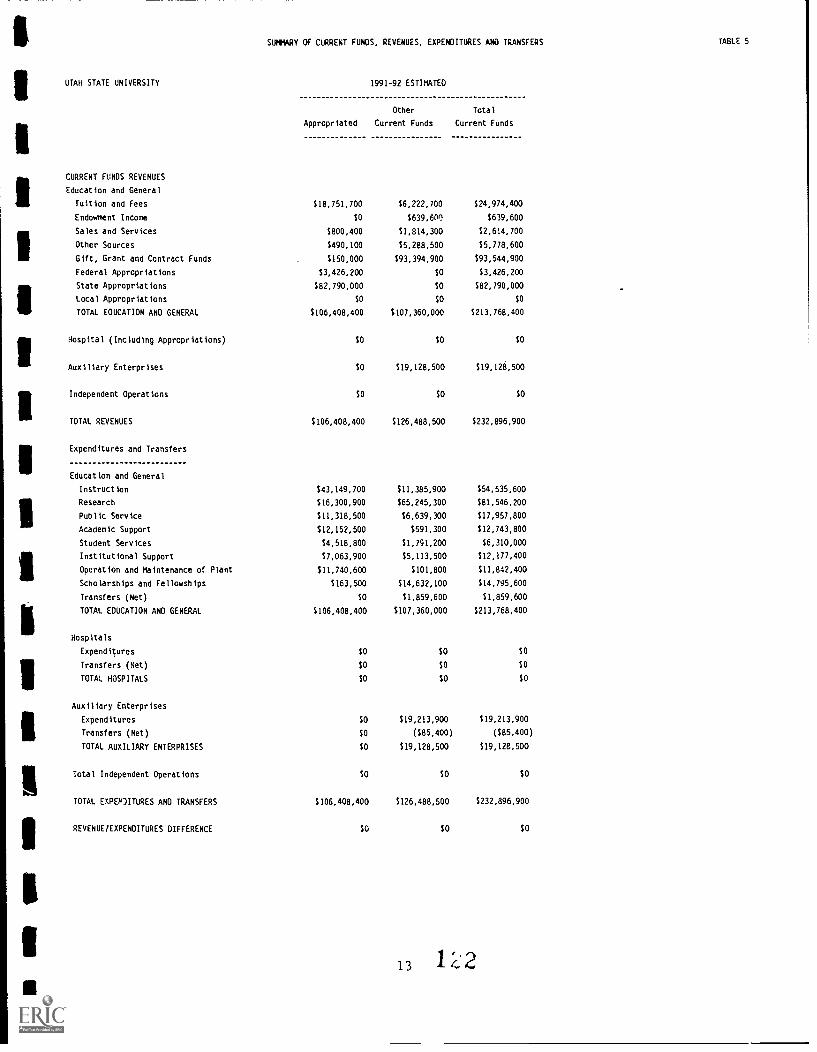
SUMMARY OF CURRENT FUNOS, REVENUES, EXPENDITURES AND TRANSFERS TABLE 5
UTAH STATE UNIVERSITY 1991-92 ESTIMATED
CURRENT FUNDS REVENUES
Education and General
Appropriated
Other
Current Funds
Total
Current Funds
Tuition and Fees $18,751,700 $6,222,700 $24,974,400
Endowment Income $O $639,600 $639,600
Sales and Services $800,400 $1,814,300 $2,614,700
Other Sources $490,100 $5,288,500 $5,778,600
Gift, Grant and Contract Funds $150,000 $93,394,900 $93,544,900
Federal Appropriations $3,426,200 $0 $3,426,200
State Appropriations $82,790,000 $0 $82,790,000
Local Appropriations $O $0 $0
TOTAL EDUCATION AND GENERAL $106,408,400 $107,360,000 $213,768,400
Hospital (Including Appropriations) $0 SO $O
Auxiliary Enterprises SO $19,128,500 $19,128,500
Independent Operations $O SO $O
TOTAL REVENUES $106,408,400 $126,488,500 $232,896,900
Expenditures and Transfers
Education and General
Instruction $43,149,700 $11,385,900 $54,535,600
Research $16,300,900 $65,245,300 $81,546,200
Public Service $11,318,500 $6,639,300 $17,957,800
Academic Support $12,152,500 $591,300 $12,743,800
Student Services $4,518,800 $1,791,200 $6,310,000
Institutional Support $7,063,900 $5,113,500 $12,177,400
Operation and Maintenance of Plant $11,740,600 $101,800 $11,842,400
Scholarships and Fellowships $163,500 $14,632,100 S14,795,600
Transfers (Net) SO $1,859,600 $1,859,600
TOTAL EDUCATION AND GENERAL $106,408,400 $107,360,000 $213,768,400
Hospitals
Expenditures SO SO $0
Transfers (Net) $0 $O $0
TOTAL HOSPITALS $0 $O $0
Auxiliary Enterprises
Expenditures SO $19,213,900 $19,213,900
Transfers (Net) $0 ($85,400) ($85,400)
TOTAL AUXILIARY ENTERPRISES $0 $19,128,500 $19,128,500
Total Independent Operations $0 $0 $0
TOTAL EXPEN)ITURES AND TRANSFERS $106,408,400 $126,488,500 $232,896,900
REVENUE/EXPENDITURES DIFFERENCE $O $0 $O

WEBER STATE UNIVERSITY
SUMMARY Of CURRENT FUNDS, REVENUES, EXPENDITURES AND TRANSFERS TABLE 5
II/1989-90 ACTUAL 1990-91 ESTIMATED
Other Total Other Total
Appropriated Current Funds Current Funds Appropriated Current Funds Current Funds
CURRENT FUNDS REVENUES
Education and General
Tuition and Fees $12,066,190 $2,471,288 $14,517,478 $12,360,400 $2,640,800 $15,001,200
Endowment Income $0 $324,953 $324,953 $O $341,200 $341,200
Sales and Services $0 $463,773 $463,773 $0 $487,000 $487,000
Other Sources $45,070 $1,915,383 $1,960,453 $50,600 $2,011,200 $2,061,800
Gift, Grant and Contract Funds $270,239 $11,684,486 $11,954,725 $321,800 $12,270,700 $12,592,500
Federal Appropriations $0 SO SO $O SO SO
State Appropriations $33,126,586 $O $33,126,586 + $35,235,700 $O $35,235,700
Local Appropriations $0 $O SO SO $0 $0
TOTAL EDUCATION AND GENERAL $45,508,085 $16,859,883 $62,367,968 $47,968,500 $17,750,900 $65,719,400
Hospital (Including Appropriations) $O $O $O SO $0 $O
Auxiliary Enterprises $0 $9,054,409 $9,054,409 SO $8,149,000 $8,149,000
Independent Operations $0 $O $O $0 $0 SO
TOTAL REVEKHES $45,508,085 $25,914,292 $71,422,377 $47,968,500 $25,899,900 $73,868,400
Expenditures and Transfers
Education and General
Instruction $25.)09,415 $3.396,586 $28,406,001 $27,395,113 $3,909,900 $31,305,013
Research $84 $355,293 5355,377 SO $409,000 $409,000
Public Service $173,929 $1,278,220 $1,452,149 $265,560 $1,471,400 51,736.960
Academic Support $3,824,178 $785,209 $4,609,387 $4,112,752 $903,900 $5,016,652
Student Services $3,772,862 $264,970 $4,037,832 $3,250,376 $305,000 $3,555,376
Institutional Support $5,180,515 $629,209 $5,809,724 $6,633,424 $724,300 57,357,724
Operation and Maintenance of Plant $5,332,653 $152,536 $5,485,189 $6,179,325 $175,600 $6,354,925
Scholarships and Fellowships $161,761 $7,719,798 $7,881,559 $131,950 $8,886,500 $9,018,450
Transfers (Net) $O $838,625 $838,625 $0 $965,300 $965,300
TOTAL EDUCATION AND GENERAL $43,455.397 $15,420,446 $58,875,843 $47,968,500 $17,750,900 $65,719,400
Hospitals
Expenditures $0 $0 $0 $0 $O SO
Transfers (Net) $0 $O $O $0 $0 SO
TOTAL HOSPITALS $O SO $O $O $O $0
Auxiliary Enterprises
Expenditures SO $9,554,337 $9,554,337 $0 $9,320,000 $9,320,000
Transfers (Net) $0 ($1,200,460) ($1,200,460) $0 ($1,171,000) ($1,171,000)
TOTAL AUXILIARY ENTERPRISES $0 $8,353,877 $8,353,877 SO $8,149,000 $8,149,000
Total Independent Operations $0 10 $O $O SO $0
TOTAL EXPENDITURES AND TRANSFERS $43,455,397 $23,774,323 $67,9,720 $47,968,500 $25,899,900 $73,868,400
REVENUE/EXPENDITURES DIFFERENCE $2,052,688 $2,139,969 $4,192,657 $0 $0 SO
+Difference from IPEDS report and Financial Statement due to revenue received but not expended.
*Decline in Revenues and Expend. Contracting Food Services
1 3
14
1

SUMMARY Of CURRENT FUNDS, REVENUES, EXPENDITURES AND TRANSFERS TABLE 5
WEBER STATE.UNIVERSITY 1991-92 ESTIMATED
CURRENT FUNDS REVENUES
Education awl General
Appropriated
Other
Current Funds
Total
Current Funds
Tuition and Fees $14,289,500 $2,799,200 $17,088,700
Endowment Income $0 $358,300 $358,300
Sales and Services $0 $511,400 $511,400
Other Sou:ces $50,600 $2,111,800 $2,162,400
Gift, Grant and Contract Funds $321,000 $12,886,200 $13,207,200
Federal Appropriations $0 $0 $O
State Appropriations $41,356,400 SO $41,356,400
Local Appropriations $O $0 $0
TOTAL EDUCATION AND GENERAL $56,017,500 $18,666,900 $74,684,400
Hospital (Including Appropriations) SO $O SO
Auxiliary Enterprises $0 $8,556,500 $8,556,500
Independent Operations SO $0 $0
TOTAL REVENUES $56,017,500 $27,223,400 $83,240,900
Expenditures and Transfers
Education and General
Instruction $32,239,100 $4,111,700 $36,350,800
Research $100 $430,100 5430,200
Public Service $224,200 $1,547,300 $1,771,500
Academic Support $4,929,700 $950,500 $5,880,200
Student Services $4,863,500 $320,800 $5,184,300
Institutional Support $6,678,100 $761,700 $7,439,800
Operation and Maintenance of Plant $6,874,200 $184,600 $7,058,800
Scholarships and Fellowships $208,600 $9,345,000 $9,553,600
Transfers (Net) $O $1,015,200 51,015,200
TOTAL EDUCATION AND GENERAL $56,017,500 $18,666,900 $74,684,400
Hospitals
Expenditures $0 SO $O
Transfers (Net) $0 SO $0
TOTAL HOSPITALS $0 SO $O
Auxiliary Enterprises
Expenditures $0 $9,786,100 $9,786,100
Transfers (Net) $0 ($1,229,600) ($1,229,600)
TOTAL AUXILIARY ENTERPRISES SO $8,556,500 $8,556,500
Total Independent Operations SO SO $O
TOTAL EXPENDITURES AND TRANSFERS $56,017,500 $27,223,400 $83,240,900
REVENUE/EXPENDITURES DIFFERENCE $0 SO $O
1 4
15

SOUTHERN UTAH UNIVERSITY
SUMMARY OF CURRENT FUNDS, REVENUES, EXPENDITURES AND TRANSFERS TABLE 5
II/1989-90 ACTUAL 1990-91 ESTIMATED
Other Total Other Total
Appropriated Current Funds Current Funds Appropriated Current Funds Current Funds
CURRENT FUNDS REVENUES
Education and General
Tuition and Fees $2,977,679 $1,088,657 $4,066,336 $3,287,100 $1,230,200 $4,517,300Endowment Income $O $100,286 $100,286 $0 $105,300 $105,300Sales and Services $0 $2,623,661 $2,623,661 $O $2,754,800 $2,754,800Other Sources $14,215 $280,634 $294,849 $13,800 $294,700 $308,500
Gift, Grant and Contract Funds $74,111 $4,867,583 $4,941,694 $50,600 $5,113,700 $5,164.300Federal Appropriations $O $O $O $0 $O $O
State Appropriations $10,988,439 $O $10,988,439 4. $11,641,300 $O $11,641,300Local Appropriations $O SO SO $O $O $O
TOTAL EDUCATION AND GENERAL $14,054,444 $8,960,821 $23,015,265 $14,992,800 $9,498,700 $24,491,500
Hospital (Including Appropriations) $0 $0 $0 $O $0 $0
Auxiliary Enterprises SO $3,236,266 $3,236,266 $0 $3,398,100 $3,398,100
Independent Operations $0 $O $O $0 $0 $0
TOTAL REVENUES $14,054,444 $12,197,087 $26,251,531 $14,992,800 $12,896,800 527.889,600
Expenditures and Transfers
Education and General
Instruction $6,578,260 $784,358 $7,362,618 $7,443,886 $864,500 $8,308,386
Research $0 $0 $O $O $O $0
Public Service $61,577 $2,891,525 $2,953,102 $107,934 $3,186,900 $3,294,834Academic Support $1,611,217 $500,104 $2,111,321 $1,406,063 $551,200 $1,957,263Student Services $1,429,147 $405,373 $1,834,520 $1,606,526 $446,800 $2,053,326
Institutional Support $1,851,183 $475,278 $2,326,441 $1,988,783 $523,800 12,512,583
Operation and Maintenance of Plant $2,246,711 $43,793 $2,290,504 $2,408,992 $48,300 $2,457,292
Scholarships and Fellowships $30,093 $3,431,419 $3,461,512 $30,616 $3,782,000 $3,812,616
Transfers (Net) SO $86,369 $86,369 $0 $95,200 $95,200
TOTAL EDUCATION AND GENERAL $13,808,118 $8,618,239 $22,426,407 $14,992,800 $9,498,700 $24,491,500
Hospitals
Expenditures $O $0 $0 $O SO $0
Transfers (Net) $0 $O $0 $O SO SO
TOTAL HOSPITALS $0 $0 $0 $0 $0 $0
Auxiliary Enterprises
Expenditures $0 $2,959,587 $2,959,587 $O $2,838,400 $2,838,400Transfers (Net) $0 $583,544 $583,544 $O $559,700 $559,700
TOTAL AUXILIARY ENTERPRISES $O $3,543,131 $3,543,131 $0 $3,398,400 $3,398.100
Total Independent Operations $O $0 ;0 SO $0 $O
TOTAL EXPENDITURES AND TRANSFERS $13,808,188 $12,161,350 $25,969,538 $14,992,800 $12,896,800 $27,889,600
REVENUE/EXPENDITURES DIFFERENCE $246,256 $35,737 $281,993 $O $O $O
+Difference from IPEDS report and Financial Statement due to revenue received but not expended.
16
1
1

SUMMARY CW CURRENT FUNOS, REVENUES, EXPENDITURES ANO TRANSFERS TABLE 5
SOUTHERN UTAH UNIVERSITY 1991-92 ESTIMATED
CURRENT FUNDS REVENUES
Education and General
Appropriated
Other
Current Funds
Total
Current Funds
Tuition and Fees $3,767,100 $1,304,000 $5,071,100
Endowment Income $0 $110,600 $110,600
Sales and Services $0 $2,892,500 $2,892,500
Other Sources $13,800 $309,400 $323,200
Gift, Grant and Contract Funds $49,500 $5,370,500 $5,420,000
Federal Appropriations $0 $0 $0
State Appropriations $13,546,600 $0 $13,546,600
Local Appropriations $0 $0 $0
TOTAL EDUCATION AND GENERAL $17,377,000 $9,987,000 $27,364,000
Hospital (Including Appropriations) $0 $O $0
Auxiliary Enterprises $0 $3,568,000 $3,568,000
Independent Operations $0 $0 $0
TOTAL REVENUES $17,377,000 $13,555,000 $30,932,000
Expenditures and Transfers
Education and General
Instruction $8,278,500 $908,900 $9,187,400
Research $0 $0 $0
Public Service $77,500 $3,350,800 $3,428,300
Academic Support $2,027,600 $579,500 $2,607,100
Student Services $1,798,500 $469,800 $2,268,300
Institutional Support $2,329,600 $550,800 $2,880,400
Operation and Maintenance of Plant $2,827,400 $50,700 $2,878,100
Scholarships and Fellowships $37,900 $3,976,400 $4,014,300
Transfers (Net) SO $100,100 $100,100
TOTAL EDUCATION AND GENERAL $17,377,000 $9,987,000 $27,364,000
Hospitals
Expenditures $0 $O $0
Transfers (Net) $0 $0 $O
TOTAL HOSPITALS $O $0 $0
Auxiliary Enterprises
Expenditures $0 $2,980,400 $2,980,400
Transfers (Net) $0 $587,600 $587,600
TOTAL AUXILIARY ENTERPRISES $0 $3,568,000 $3,568,000
Total Independent Operations $O SO $O
TOTAL EXPENDITURES AND TRANSFERS $17,377,000 $13,555,000 $30,932,000
REVENUE/EXPENDITURES DIFFERENCE $0 $0 $O
+Difference from 1PED' report and Financ
-17
BEST COPY MADE

SNOW COLLEGE
SUMMARY OF CURRENT FUNDS, REVENUES, EXPENOITURES ANO TRANSFERS TABLE 5
II/1989-90 ACTUAL 1990-91 ESTIMATED
Other Total Other Total
Appropriated Current Funds Current Funds Appropriated Current Funds Current Funds
CURRENT FUNDS REVENUES
Education and General
Tuition and Fees $1,593,757 $200,079 $1,793,836 $1,490,800 $200,100 $1,690,900
Endowment Income $0 $20,164 $20,164 $0 $21,200 $21,200
Sales and Services $0 $219,032 $219,032 $0 $230,000 $230,000
Other Sources $600 $736,391 $736,991 $O $773,200 $773,200
Gift, Grant and Contract Funds $141,047 $2,080,947 $2,221,994 $162,600 $2,186,400 $2,349,000
Federal Appropriations $0 $0 $0 $0 SO $0
State Appropriations $6,022,300 $0 $6,022,300 $6,380,300 10 $6,380,300
Local Appropriations SO $0 $0 $O $0 $0
TOTAL EDUCATION AND GENERAL $7,757,704 $3,256,613 $11,014,317 18,033,700 $3,410,900 $11,444,600.
Hospital (Including Appropriations) SO $0 $0 $0 $O SO
Auxiliary Enterprises $0 $1,074,939 $1,074,939 $0 $1,128,700 $1,128,700
Independent Operations $0 $0 $0 $0 $0 SO
TOTAL REVENUES $7,757,704 $4,331,552 $12,089,256 18,033,700 $4,539,600 $12,573,300
Expenditures and Transfers
Education and General
Instruction $3,124,551 $387,768 $3,512,319 13,494,500 $418,500 $3,913,000
Research $0 $7,513 $7,513 $0 $8,100 18,100
Public Service $0 $618,525 $618,525 SO $667,500 $667,500
Academic Support $604,207 $224,950 $829,157 $660,000 $242,800 $902,800
Student Services $960,011 $294,220 $1,254,231 $1,054,900 $317,500 $1,372,400
Institutional Support $1,275,893 $316,733 $1,592,626 $1,402,300 ;341,800 $1,744,100
Operation and Maintenance of Plant $1,332,413 $85,502 $1,417,95 $1,397,400 $92,300 $1,489,700
Scholarships and Fellowships $24,600 $1,100,428 $1,125,028 $24,600 $1,187,600 $1;212,200
Transfers (Net) $0 $125,018 $125,018 $0 $134,800 $134,800
TOTAL EDUCATION AND GENERAL $7,321,675 $3,160,657 $10,482,332 $8,033,700 $3,410,900 $11,444,600
.Hospitals
Expenditures $0 $0 $0 $0 $0 $0
Transfers (Net) $0 $O $0 $0 $0 SO
TOTAL HOSPITALS $O $O $0 $0 $0 $0
Auxiliary Enterprises
Expenditures $0 $962,919 $962,919 $0 $1,128,700 $1,128,700
Transfers (Net) $0 $0 $0 $0 $0 SO
TOTAL AUXILIARY ENTERPRISES $0 $962,919 $962,919 $0 $1,128,700 $1,128,700
Total Independent Operations $0 $0 $0 $0 $0 $0
TOTAL EXPENDITURES AND TRANSFERS $7,321,675 $4,123,576 $11,445,251 $8,033,700 $4,539,600 $12,573,300
REVENUE/EXPENDITURES DIFFERENCE $436,029 $207,976 $644,005 $0 $O SO
18
1
a

SUMMARY OF CURRENT FUNDS, REVENUES, EXPENDITURES AND TRANSFERS TABLE 5
SNOW COLLEGE 1991-92 ESTIMATED
CURRENT FUNDS REVENUES
Education and General
Appropriated
Other
Current Funds
Total
Current Funds
Tuition and Fees 11,908,800 1208,100 $2,116,900
Endowment Income SO $22,300 $22,300
Sales and Services SO $241,500 $241,500
Other Sources $O 1811,900 $811,900
Gift, Grant and Contract Funds 1162,000 $2,296,300 12,458,300
Federal Appropriations SO $0 $0
State Appropriations $7,545,600 $O $7,545,600
Local Appropriations SO SO $0
TOTAL EDUCATION AND GENERAL $9,616,400 53,580,100 113,196,500
Hospital (Inzluding Appropriations) $0 $O $0
Auxiliary Enterprises SO 11,185,100 $1,185,100
Independent Operations $0 $0 SO
TOTAL REVENUES $9,616,400 $4,765,200 $14,381,600
Expenditures and Transfers
Education and General
Instruction $4,103,800 $439,200 54,543,000
Research SO 18,500 18,500
Public Service SO $700,600 $700,600
Academic Support $793,600 $254,800 $1,048,400
Student Services $1,260,900 1333,300 $1,594,200
Institutional Support $1,675,800 $358,800 $2,034,600
Operation and Maintenance of Plant $1,750,000 $96,800 $1,846,800
Scholarships and Fellowships 132,300 $1,246,500 51,278,800
Transfers (Net) $O $141,600 $141,600
TOTAL EDUCATION AND GENERAL $9,616,400 13,580,100 $13,196,500
Hospitals
Expenditures $0 $O $0
Transfers (Net) $0 SO $O
TOTAL HOSPITALS $0 $0 $0
Auxiliary Enterprises
Expenditures SO $1,185,100 $1,185,100
Transfers (Net) $0 SO $0
TOTAL AUXILIARY ENTERPRISES $0 $1,185,100 $1,185,100
Total Independent Operations SO $O $0
TOTAL EXPENDITURES AND TRANSFERS 19,616,400 14,765,200 114,381,600
REVENUE/EXPENDITURES DIFFERENCE $O Sn $O
19

DIXIE COLLEGE
SUMMARY OF CURRENT FUNOS, REVENUES, EXPENDITURES AND TRANSFERS TABLE 5
II/1989-90 ACTUAL 1990-91 ESTIMATED
Other Total Other Total
Appropriated Current Funds Current Funds Appropriated Current Funds Current Funds
CURRENT FUNDS REVENUES
Education and General
Tuition and Fees $1,877,015 $754,398 $2,631,413 $1,899,100 $772,800 $2,671,900
Endowment Income $0 $50,352 $50,352 $O $52,900 $52,900
Sales and Services $O $0 $0 SO $0 $0
Other Sources $32,938 $214,949 $247,887 $41,400 $225,700 $267,100
Gift, Grant and Contract Funds $165,464 $2,589,595 $2,755,059 $131,000 $2,721,800 $2,852,800
Federal Appropriations 10 $0 $0 $0 $0 10
State Appropriations $6,452,500 $O $6,452,500 + $6,774 100 $0 $6,774,100
Local Appropriations $0 $O $0 SO SO $0
TOTAL EDUCATION AND GENERAL $8.527,917 $3,609,294, $12,137,211 $8,845,600 $3,773,200 $12,618,800
Hospital (Including Appropriations) $0 $0 $0 $0 $0 $O
Auxiliary Enterprises SO $2,124,410 $2,124,410 $0 $2,230,600 $2,230,600
Independent Operations $0 SO $0 10 $0 SO
TOTAL REVENUES $8,527,917 $5,733,704 $14,261,621 $8,845,600 $6,003,800 $14,849,400
Expenditures and Transfers
Education and General
Instruction $3,710,422 $781,900 $4,492,322 $4,132,904 $881,300 $5,014.204
Research $0 $O $0 $0 $0 $0
Public Service $131,687 $417,559 $549,246 * $134,620 $470,600 $605,220
Academic Support $674,429 $154,040 1828,469 $528,941 $173,600 $702,541
Student Services $1,354,985 $59,247 $1,414,232 * $1,336,203 $66,800 $1,403,003
Institutional Support $1,312,731 $45,570 $1,358,301 * $1,386,022 $51,400 $1,437,422
Operation and Maintenance of Plant $1,426,133 $17,732 $1,443,865 $1,311,810 $20,000 $1,331,810
Scholarships and Fellowships $15,100 $1,997,164 $2,012,264 $15,100 $2,251,000 $2,266,100
Transfers (Net) $58,462 ($125,441) ($66,979)* $0 ($141.500) ($141,500)
TOTAL EDUCATION AND GENERAL $8,683,949 $3,347,771 $12,031,720 $8,845,600 $3,773,200 512,618,800
Hospitals
Expenditures $O $O $0 $0 $0 $0
Transfers (Net) SO $O $O SO $O $O
TOTAL HOSPITALS $0 10 $0 $0 $O SO
Auxiliary Enterprises
Expenditures SO 12,201,830 $2,201,830 SO $2.265,800 12,265,800
Transfers (Net) $0 ($34,187) ($34,187) $0 ($35,200) ($35,200)
TOTAL AUXILIARY ENTERPRISES $0 $2,167,643 $2,167,643 $0 $2,230,600 $2,230,600
Total Independent Operations $0 $0 $0 $0 $O $0
TOTA, EXPENDITURES AND TRANSFERS $8,683,949 $5,515,414 $14,199,363 $8,845,600 $6,003,800 $14,849,400
REVENUE/EXPENUITURES DIFFERENCE ($156,032) $218,290 $62,258 $0 $0 $0
+Difference from IPEDS report and Financial Statement due to revenue received but not expended.
'Difference from IPEDS report and Financial Statement due to different definitions used by the budget office as compared to the accounting office.
1
1
20
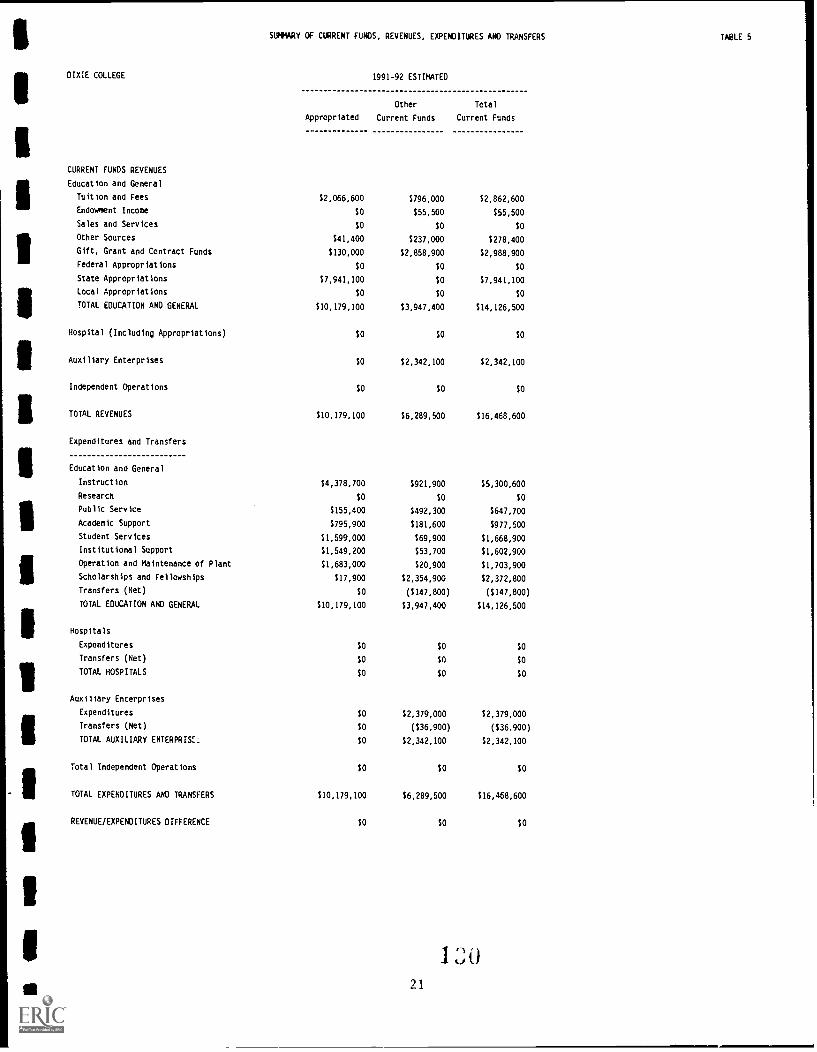
DIXIE COLLEGE
SUMMARY OF CURRENT FUNDS, REVENUES, EXPENDITURES AND TRANSFERS TABLE 5
1991-92 ESTIMATED
CURRENT FUNDS REVENUES
Education and General
Appropriated
Other
Current Funds
Total
Current Funds
Tuition and Fees $2,066,600 $796,000 $2,862,600
Endowment Income $O $55,500 $55,500
Sales and Services $0 $O $O
Other Sources $41,400 $237,000 $278,400
Gift, Grant and Contract Funds $130,000 $2,858,900 $2,988,900
Federal Appropriations $O $0 SO
State Appropriations $7,941,100 $O $7,941,100
Local Appropriations $0 $0 SO
TOTAL EDUCATION AND GENERAL $10,179,100 $3,947,400 $14,126,500
Hospital (Including Appropriations) SO $0 $0
Auxiliary Enterprises SO $2,342,100 $2,342,100
Independent Operations $0 SO $O
TOTAL REVENUES $10,179,100 $6,289,500 $16,468,600
Expenditures and Transfers
Education and General
Instruction $4,378,700 $921,900 $5,300,600
Research $0 $O SO
Public Service $155,400 $492,300 $647,700
Academic Support $795,900 $181,600 $977,500
Student Services $1,599,000 $69,900 $1,668,900
Institutional Support $1,549,200 $53,700 $1,602,900
Operation and Maintenance of Plant $1,683,000 $20,900 $1,703,900
Scholarships and Fellowships $17,900 $2,354,900 $2,372,800
Transfers (Net) SO ($147,800) ($147,800)
TOTAL EDUCATION AND GENERAL $10,179,100 $3,947,400 $14,126,500
Hospitals
Expenditures SO $O $0
Transfers (Net) $0 $0 $0
TOTAL HOSPITALS $O $O $O
Auxiliary Enterprises
Expenditures SO $2,379,000 $2,379,000
Transfers (Net) $0 ($36,900) ($36,900)
TOTAL AUXILIARY ENTERPRIK. SO $2,342,100 $2,342,100
Total Independent Operations $0 SO $0
TOTAL EXPENDITURES AND TRANSFERS $10,179,100 $6,289,500 $16,468,600
REVENUE/EXPENDITURES DIFFERENCE $O $O SO
1 `J
21

COLLEGE OF EASTERN UTAH
SUMMARY Of CURRENT FUNDS, REVENUES, EXPENDITURES AND TRANSFERS TABLE 5
1989-90 ACTUAL 1990-91 ESTIMATED
Other Total Other Total
Appropriated Current Funds Current Funds Appropriated Current Funds Current Funds
CURRENT FUNDS REVENUES
Education and General
Tuition and Fees $1.030,003 $195,657 $1,225,660 $1,173,500 $212,200 $1,385,700
Endowment Income $O $6,033 $6,033 $0 16.300 16,300
Sales and Services $0 $86,576 $86,576 SO $90,900 $90,900
Other Sources $22,212 $550,366 $572,578 $8,300 $577.900 $586,200
Gift, Grant and Contract Funds $248,501 $2,513,662 $2,762.163 $377,000 $2,644,300 $3,021,300
Federal Appropriations $0 $0 $0 $O $O SO
State Appropriations $5,802,300 $0 $5,802,300 $6,113,700 $0 $6,113,700
local Appropriations $0 $0 $O $O SO $O
TOTAL EDUCATION AND GENERAL $7,103,016 $3,352,294 $10,455,310 $7,672,500 $3,531,600 $11,204,100
Hospital (Including Appropriations) $0 $O $0 $O $O $O
Auxiliary Enterprises $0 $1,241,533 $1,241,533 $O $1,303,600 $1,303,600
Independent Operations $O $O $0 $0 $O $0
TOTAL REVENUES $7,103,016 $4,593,827 $11,696,843 $7,672,500 $4,835,200 $12,507,700
Expenditures and Transfers
Education and General
Instruction $2,924,957 $933,238 $3,858,195 $3.450,570 $1,015,000 $4,465,570
Research $0 $0 $0 $O $O $O
Public Service $0 $40.705 $40,705 $0 $44,300 144,300
Academic Support $586,723 $36,291 1623,014 1576,542 $39,500 $616,042
Student Services $884,196 $584,574 $1.468,770 $1,006,452 $635800 $1,642,252
Institutional Support $1,277,157 $214,939 $1,492,096 $1,451,322 $233,800 $1,685,122
Operation and Maintenance of Plant $981,576 $26,170 $1,007,746 $1,034,177 $28,500 $1.062,677
Scholarships and Fellowships $147,919 $1,387,235 $1,535,155 $153,437 $1,508,800 $1,662,237
Transfers (Net) $101,686 $23,892 $125,578 $O $25,900 $25,900
TOTAL EDUCATION AND GENERAL $6,904,214 $3,247,045 $10,151,259 $7,672,500 $3,531,600 $11,204,100
Hospitals
Expenditures $O $0 $O $0 SO $O
Transfers (Net) $O $0 $O $O $O $O
TOTAL HOSPITALS $0 $O $O $0 $O $0
Auxiliary Enterprises
Expenditures $0 $1,344,845 $1,344,845 $0 $1,156,600 11,156,600
Transfers (Net) $0 $170,890 $170,890 $O $147,000 $147,000
TOTAL AUXILIARY ENTERPRISES $0 $1,515,735 $1.515,735 SO $1,303,600 $1,303,600
Total Independent Operations $0 $0 $0 $O $0 $0
TOTAL EXPENDITURES AND TRANSFERS $6,904,214 $4,762,780 $11,666,994 17,672,500 $4,835,200 $12,507,700
REVENUE/EXPENDITURES DIFFERENCE $198,80. (1168,953) $29,849 10 $0 $0
1 3
22
a
1

SUMMARY OF CURRENT FUNDS, REVENUES, EXPENDITURES AND TRANSFERS
COtLEGE OF EASTERN UTAH 1991-92 ESTIMATED
CURRENT FUNDS REVENUES
Education and General
Appropriated
Other
Current Funds
Total
Current Funds
Tuition and Fees $1,370,600 $220,700 $1,591,300
Endowment Income $O $6,600 $6,600
Sales and Services $O $95,400 $95,400
Other Sources $8,300 $606,800 $615,100
Gift, Grant and Contract Funds $375,000 $2,778,500 $3,153,500
Federal Appropriations $O $0 $O
State Appropriations $7,393,300 $0 $7,393,300
Local Appropriations $O $O $O
TOTAL EDUCATION AND GENERAL $9,147,200 $3,708,000 $12,855,200
Hospital (Including Appropriations) $O $O $0
Auxiliary Enterprises $0 $1,368,800 $1,368,800
Independent Operations $0 SO $0
TOTAL REVENUES $9,147,200 $5,076,800 $14,224,000
Expenditures and Transfers
Education and General
Instruction $3,933,100 $1,065,700 $4,998,800
Research $0 $0 $0
Public Service $O $46,500 $46,500
Academic Support $789,000 $41,400 $830,400
Student Services $1,189,000 $667,600 $1,856,600
Institutional Support $1,717,400 $245,500 $1,962,900
Operation and Maintenance of Plant $1,319,900 $29,900 $1,349,800
Scholarships and Fellowships $198,800 $1,584,200 $1,783,000
Transfers (Net) $O $27,200 $27,200
TOTAL EDUCATION AND GENERAL $9,147,200 $3,708,000 $12,855,200
Hospitals
Expenditures $O $0 $0
Transfers (Net) $0 $O $0
TOTAL HOSPITALS $O $0 $O
Auxiliary Enterprises
Expenditures $0 $1,214,500 $1,214,500
Transfers (Net) $0 $154,300 $154,300
TOTAL AUXILIARY ENTERPRISES SO $1,368,800 $1,368,800
Total Independent Operations $0 $O $0
TOTAL EXPENDITURES AND TRANSFERS $9,147,200 $5,076,800 $14,224,000
REVENUE/EXPENDITURES DIFFERENCE SO $O $O
13223

UTAH VALLEY COMMUNITY CCCLEGE
SUMMARY OF CURRENT FUNDS, REVENUES, EXPENOITURES AND TRANSFERS TABLE 5 1/1989-90 ACTUAL 1990-91 ESTIMATED
Other Total Other Total
App,Jpriated Current Funds Current Funds Appropriated Current Funds Current Funds
CURRENT FUNDS REVENUES
Education and General
Tuition and Fees $6,451,749 $1,229,606 $7,681,355 $6,787,800 $1,229,600 58,017,400
Endowment Income $0 $0 $0 $O $O $0
Sales and Services $19,339 $1,195,223 $1,214,562 $17,500 $1,255,000 $1,272,500
Other Sources $107,191 1557,490 $664,681 $116,000 $585,400 $701,400
Gift, Grant and Contract Funds $414,074 $5,079,493 $5,493,567 $425,600 $5,338,500 $5,764,100
Federal Appropriations $0 $0 $0 $O $O SO
State Appropriations $13,248,000 $O $13,248,000 $14,449,100 $O $14,449,100
Local Appropriations $0 $O $O $0 $0 $0
TOTAL EDUCATION AND GENERAL $20,240,353 $8,061,812 $28,302,165 $21,796,000 $8,408,500 $30,204,500
Hospital (Including Appropriations) SO $0 $0 $0 SO $O
Auxiliary Enterprises $O $3,298,731 $3,298,731 $0 $3,463,700 $3,463,700
Indefendent Operations $O $0 $0 $O $0 $O
TOTAL REVENUES $20,240,353 $11,360,543 $31,600,896 $21,796,000 $11,872,200 $33,668,200
Expenditures and Transfers
Education and General
Instruction $10,555,376 $602,134 $11,157,510 $11,262,225 $610,000 $11,872,225
Research $0 $0 $0 $0 $U $0
Public Service SO $O $0 $0 $O SO
Academic Support $1,859,071 $1,383,285 $3,242,356 $1,839,297 $1,401,300 $3,240,597
Student Services $1,750,216 $685,599 $2,435,815 $1,777,103 $694,500 $2,471,603
Institutional Support $3,368,878 $1,178,514 $4,547,392 $3,850,092 $1,193,800 $5,043,892
Operation and Maintenance of Plant $3,055,938 $0 $3,055,938 $3,014,383 $O $3,014,383
Scholarships and Fellowships $0 $4,262,500 $4,262,500 $52,900 $4,317,900 $4,370,80m
Transfers (Net) $0 $188,549 $188,549 $0 $191,000 $191,000
TOTAL EDUCATION AND GENERAL $20,589,479 $8,300,581 $28,890,060 $21,796,000 $8,408,500 $30,204,500
Hospitals
Expenditures $0 $0 $0 $0 $0 $O
Transfers (Net) $O $0 SO $0 SO $O
TOTAL HOSPITALS SO $0 $O $O $0 $O
Auxiliary Enterprises
Expenditures $0 $2,955,059 $2,955,059 $0 $3,230,100 $3,230,100
Transfers (Net) SO $213,678 $213,678 $0 $233,600 $233,600
TOTAL AUXILIARY ENTERPRISES $0 $3,168,737 $3,168,737 $0 $3,463,700 $3,463,700
Total Independent Operations $0 $0 $O $O SO SO
TOTAL EXPENDITURES AND TRANSFERS $20,589,479 $11,469,318 $32,058,797 $21,796,000 $11,872,200 $33,668,200
REVENUE/EXPENDITURES DIFFERENCE ($349,126) ($I08,775) ($457,901) $O $0 $O
.1 3 324
1
1
1

SUMMARY Cf CURRENT FUNDS, REVENUES, EXPENDITURES ANO TRANSFERS TABLE 5
UTAH VALLEY COMMUNITY COLLEGE 1991-92 ESTIMATED
CURRENT FUNDS REVENUES
Education and General
Appropriated
Other
Current Funds
Total
Current Funds
Tuition and Fees $7,346,400 $1,278,800 18,625,200
Endowment Income $0 SO $0
Sales and Services $17,500 $1,317,800 $1,335,300
Other Sources $116,000 $614,700 $730,700
Gift, Grant and Contract Funds $423,600 $5,607,400 $6,031,000
Federal Appropriations $0 $0 $0
State Appropriations $17,016,400 $0 $17,016,400
Local Appropriations $0 $0 $0
TOTAL EDUCATION AND GENERAL $24,919,900 $8,818,700 $33,738,600
Hospital (Including Appropriations) $0 SO $0
Auxiliary Eni.trprises $0 53,636,900 $3,636,900
Independent Operations $O $O $0
TOTAL REVENUES $24,919,900 $12,455,600 $37,375,500
Expenditures and Transfers
Education and General
Instruction $12,775,400 $639,700 $13,415,100
Research SO $0 $0
Puhlic Service $0 $0 SO
Academic Support $2,250,100 $1,469,600 $3,719,700
Student Services $2,118,300 $728,400 $2,840,700
Institutional Support $4,077,400 $1,252,100 $5,329,500
Operation and Maintenance of Plant $3,698,700 $0 $3,698,700
Scholarships and Fellowships $0 $4,528,600 $4,528,600
Transfers (Net) $0 $200,300 $200,300
TOTAL EDUCATION AND GENERAL $24,919,900 $8,818,700 $33,738,600
Hospitals
Expenditures $0 $0 $0
Transfers (Net) $0 $0 $0
TOTAL HOSPITALS SO $0 $0
Auxiliary Enterprises
Expenditures $0 $3,391,700 $3,391,700
Transfers (Net) $0 $245,200 $'445,200
TOTAL AUXILIARY ENTERPRISES $0 $3,636,900 $3,636,900
Total Independent Operations $0 $0 $0
TOTAL EXPENDITURES AND TRANSFERS 124,919,900 112,455,600 $37,375,500
REVENUE/EXPENDITURES DIFFERENCE $0 $O $0
1 (Lt
25

SUMMARY Of CuRRENT FUNDS, REVENUES, EXPENDITURES AND TRANSFERS TABLE 5
i
II/
SALT LAKE COMMUNITY COLLEGE \--' 1989-90 ACTUAL 1990-91 ESTIMATED
Other Total Other Total
Appropriated Current Funds Current Funds Appropriated Current Funds Current Funds
CURRENT FUNDS REVENUES
Education and General
Tuition and Fees $8,700,432 $1,230,525 0,930,957 $7,475,900 $1,262,000 $8,737,900
Endowment Income $0 $40,991 $40,991 $0 $42,600 $42,600
Sales and Services $29,714 $156,175 $185,889 $30,000 $162,400 $192,400
Other Sources $61,754 $1,152,691 $1,214,445 $25,000 $1,198,800 $1,223,800
Gift, Grant and Contract Funds $865,135 $7,279,373 98,144,508 $810,700 $7,570,500 $8,381,200
Federal Appropriations $O $0 SO $0 SO $0
State Appropriations $18,625,256 $0 $18,625,256 + $21,405,600 SO $21,405,600
Local Appropriations $0 $O $0 $0 10 $0
TOTAL EDUCATION AND GENERAL $28,282,291 $9,859,755 $38,142,046 $29,747,200 $10,236,300 $39,983,500
Hospital (Including Appeopriations) SO SO $0 SO SO $O
Auxiliary Enterprises $0 $4,939,760 $4,939,760 $0 $5,186,700 95,186,700
Independent Operations 10 $0 $0 SO SO $0
TOTAL FUNDS AVAILABLE 928,282,291 914,799,515 943,081,806 929,747,200 915,423,000 945,170,200
Expenditures and Transfers
Education and General
Instruction $15,521,428 $173,014 $15,694,442 $16,908,700 $184,700 $17,093,400
Research $0 $0 SO SO $0 SO
Public Service SO $0 $0 $O $O $O
Academic Support $1,363,380 $17,440 ;1,380,820 91,260,300 918,600 91,278,900
Student Services $2,283,186 $3,398,476 $5,681,662 * $2,393,900 93,627,600 $6,021,500
Institutional Support $3,827,979 $451,785 $4,279,764 * $5,021,500 $482,200 95,503,700
Operation and Maintenance of Plant $4,014,270 10 $4,014,270 $4,098,300 $0 14,098,300
Scholarships and Fellowships $64,500 $5,269,238 $5,333,738 964,500 $5,624,500 95,689,000
Transfers (Net) $126,682 $279,761 $406,443 * $0 $298,700 9298,700
TOTAL EDUCATION AND GENERAL $27,201,425 $9,589,714 $36,791,139 $29,747,200 $10,236,300 $39,983,500
Hospitals
Expenditures SO SO $0 SO $O $O
Transfers (Net) $0 SO $0 $O $0 $0
TOTAL HOSPITALS $O $0 SO $0 $0 $0
Auxiliary Enterprises
Expenditures $O $4,476,234 $4,476,234 SO $5,024,000 $5,024,000
Transfers (Net) $0 $145,000 $145,000 $O $162,700 $162,700
TOTAL AUXILIARY ENTERPRISES $0 ' 621,234 94,621,234 SO $5,186,700 95,186,700
Total Independent Operations $O $0 $O $0 SO SO
TOTAL EXPENDITURES AND TRANSFERS $27,201,425 $14,210,948 $41,412,373 $29,747,200 $15,423,000 $45,170,200
REVENUE/EXPENDITURES DIFFERENCE $1,080,866 $588,567 $1,669,433 $0 10 $O
+Difference from IPEDS report anJ Financial Statement due to revenue received but not expended.
'Difference from IPEDS report and Financial Statement due to different definitions used by the budget office as compared to the accounting office.
/635
1
1

SUMMARY OF CURRENT FUNDS, REVENUES, EXPENDITURES AND TRANSFERS TABLE 5
SALT LAKE COMMUNITY COLLEGE 1991-92 ESTIMATED
CURRENT FUNDS REVENUES
Education and General
Appropriated
Other
Current Funds
Total
Current Funds
Tuition and Fees $9,995,100 $1,299,900 $11,295,000
Endowment Income SO $44,700 $44,700
Sales and Services $30,000 $170,500 $200,500
Other Sources $25,000 $1,258,700 51,283,700
Gift, Grant and Contract Funds $640,200 S8,119,500 $8,759,700
Federal Appropriations SO SO SO
State Appropriations $30,921,600 $O $30,921,600
Local Appropriations $0 SO SO
TOTAL EDUCATION AND GENERAL $41,611,900 $10,893,300 $52,505,200
Hospital (Including Appropriations) $0 SO $0
Auxiliary Enterprises $0 $5,446,000 $5,446,000
Independent Operations $0 $0 $0
TOTAL FUNDS AVAILABLE . $41,611,900 $16,339,300 $57,951,200
Expenditures and Transfers
Education and General
Instruction $23,855,300 $196,500 $24,051,800
Research $0 SO $0
Public Service SO SO $O
Academic Support $2,095,400 $19,800 $2,115,200
Student Services $3,509,100 $3,860,500 $7,369,600
Institutional Support $5,883,300 $513,200 $6,396,500
Operation and Maintenance of Plant $6,169,600 $0 $6,169,600
Scholarships and Fellowships $99,200 $5,985,500 $6,084,700
Transfers (Net) $0 $317,700 $317,700
TOTAL EDUCATION AND GENERAL S41,611,900 $10,893,200 $52,505,100
Hospitals
Expenditures $0 $0 $0
Transfers (Net) SO $0 SO
TOTAL HOSPITALS $O $O SO
Auxiliary Enterprises
Expenditures SO $5,275,200 $5,275,200
Transfers (Net) $0 $170,900 $170,900
TOTAL AUXILIARY ENTERPRISES $0 $5,446,100 $5,446,100
Total Independent Operations $0 $0 St.
TOTAL EXPENDITURES AND TRANSFERS $41,611,900 $16,339,300 $57,951,200
REVENUE/EXPENDITURES DIFFERENCE $0 $O $0
2 7 0

NINE INSTITUTION TOTAL
SUMMARY Of CURRENT FUNDS, REVENUES, EXPENDITURES AND TRANSFERS TABLE 5
1989-90 ACTUAL 1990-91 ESTIMATED
ier Total Other Total
Appropriated Current Funds Current Funds Appropriated Current Funds Current Funds
CURRENT FUNDS REVENUES
Education and General
Tuition and Fees $82,453,694 $20,562,252 5103,015,946 $86,796,600 $21,449,900 $108,246,500
Endowment Income $O S9,817,352 $9,817,352 $0 510,307,800 510,307,800
Sales and Services $1,469,029 $64,724,289 $66,193,318 $847,900 $67,958,900 $68,806,800
Other Sources 51,633,906 $23,434,255 525,068,161 $1,931,300 $24,594,600 $26,525,900
Gift, Grant and Contract Funds $5,819,803 $229,072,053 $234,891,856 $3,541,700 $242,643,900 $246,185,600
Federal Appropriations $3,617,894 $284,730 $3,902,624 $3,426,200 SO $3,426,200
State Appropriations $285,936,286 $0 $285,936,286 $295,236,800 $0 $295,236,800
Local Appropriations $O $0 $0 SO SO $0
TOTAL EDUCATION AND GENERAL $380,930,612 $347,894,931 $728,825,543 $391,780,500 $366,955,100 $758,735,600
Rospital (Including Appropriations) $2,878,800 $188,139,319 $191,018,119 $3,042,200 $197,546,300 $200,588,500
Auxiliary Enterprises $0 $79,196,682 $79,196,682_ $O $81,798,400 581,798,400
Independent Operations $0 SO $0 SO SO $0
TOTAL REVENUES $383,809,412 $615,230,932 $999,040,344 $394,822,700 $646,299,800 $1,041,122,500
Expenditures and Transfers
Education and General
Instruction $188,148,926 $37,379,455 $225,528,381 $205,074 167 $41,275,900 $246,350,067
Research $17,128,292 $120,330,081 $137,458,373 $15,036,154 $133,082,600 $148,118,754
Public Service $14,477,335 $70,660,311 $85,137,646 $13,140,006 $77,397,400 $90,537,406
Academic Support $39,167,825 $14,717,938 $53,885,763 $36,220,984 $16,022,500 552,243,484
Student Services $23,229,491 $9,833,140 $33,062,631 $23,422,586 $10,660,500 $34,083,086
Institutional Support $39,880,401 $12,970,037 $52,850,438 $44,704,922 $14,227,600 $58,932,522
Operation and Maintenance of Plant $48,801,990 $451,983 $49,253,973 $52,579,578 $505,200 S53,084,778
Scholarships and Fellowships $1,004,626 $51,482,153 $52,486,779 $999,403 $56,666,600 $57,666,003
Transfers (Net) $654,949 $15,619,024 $16,273,973 $602,700 $17,116,800 $17,719,500
TOTAL EDUCATION AND GENERAL $372,493,835 $333,444,122 $705,937,957 $391,780,500 $366,955,100 $758,735,600
Hospitals
Expenditures $2,878,800 $177,335,217 $180,214,017 $3,042,200 $188,922,200 $191,964,400
Transfers (Net) $0 $8,226,583 $8,226,583 SO $8,624,100 $8,624,100
TOTAL HOSPITALS $2,878,800 $185,561,800 $188,440,600 $3,042,200 $197,546,300 $200,588,500
Auxiliary Enterprises
Expenditures $0 $77,402,329 $77,402,329 $O $79,581,400 $79,581,400
Transfers (Net) $O $2,133,614 $2,133,614 $0 $2,217,000 $2,217,000
TOTAL AUXILIARY ENTERPRISES $0 $79,535,943 $79,535,943 $O $81,798,400 $81,798,400
Total Independent Operations $O $0 $0 $O $0 $0
TOTAL EXPENDITURES AND TRANSFERS $375,372,63b $598,541,865 $973,914,500 $394,822,700 $646,299,800 $1,041,122,500
REVENUE/EXPENDITURES DIFFERENCE $8,436,777 $16,689,067 $25,125,844 SO $0 10
1 7
28

SUMMARY OF CURRENT F"NOS, REVENUES, EXPENDITURES AND TRANSFERS TABLE 5
NINE INSTITUTION TOTAL 1991-92 ESTIMATED
CURRENT FUNDS REVENUES
Education and General
Appropriated
Other
Current Funds
Total
Current Funds
Tuition and Fees $99,462,000 $22,643,000 $122,105,000
Endowment Income $0 $10,823,300 $10,823,300
Sales and Services $847,900 $71,356,800 $72,204,700
Other Sources $1,817,300 $25,824,400 $27,641,700
Gift, Grant and Contract Funds $2,251,300 $258,634,600 $260,885,900
Federal Appropriations $3,426,200 $0 $3,426,200
State Appropriations $349,625,500 SO $349,625,500
Local Appropriations SO $0 $0
TOTAL EDUCATION AND GENERAL $457,430,200 $389,282,100 S846,712,300
Hospital (Including Appropriations) $3,298,600 $207,423,600 $210,722,200
Auxiliary Enterprises $0 $85,888,300 $85,888,300
Independent Operations $0 $0 $0
TOTAL REVENUES $460,728,800 $682,594,000 $1,143,322,800
Expenditures and Transfers
Education and General
Instruction $232,126,400 $43,756,000 $275,882,400
Research 520,350,600 $141,389,400 5161,740,000
Public Service $17,196,100 $82,133,900 $99,330,000
Academic Support $47,530,800 $16,975,700 $64,506,500
Student Services $29,093,900 $11,301,600 $40,395,500
Institutional Support $49,629,000 $15,079,000 $64,708,000
Operation and Maintenance of Plant $60,247,000 $532,200 $60,779,200
Scholarships and Fellowships $1,256,400 $59,947,600 $61,204,000
Transfers (Net) $0 $18,166,700 $18,166,700
TOTAL EDUCATION AND GENERAL $457,430,200 $389,282,100 $846,712,300
Hospitals
Expenditures $3,298,600 $198,368,300 $201,666,900
Transfers (Net) $0 $9,055,200 $9,055,200
TOTAL HOSPITALS $3,298,600 $207,423,500 $210,722,100
Auxiliary Enterprises
Expenditures $0 $83,560,800 $83,560,800
Transfers (Net) $0 $2,327,600 $2,327,600
TOTAL AUXILIARY ENTERPRISES $0 $85,888,400 $85,888,400
Total Independent Operations $0 $0 $0
TOTAL EXPENDITURES AND TRANSFERS $460,728,800 $682,594,000 $1,143,322,800
REVENUE/EXPENDITURES DIFFERENCE $O $0 $0

SBR & STATEWIDE PROGRAMS
SUMMARY OF CURRENT FUNDS, REVENUES, EXPENDITURES AND TRANSFERS TABLE 5
1989-90 ACTUAL 1990-91 ESTIMATED
Other Total Other Total
Appropriated Current Funds Current Funds Appropriated Current Funds Current Funds
CURRENT FUNDS REVENUES
Education and General
Tuition and Fees $0 $O SO $O SO $0
Endowment Income $0 $O $O $O $0 $0
Sales and Services $O $0 $0 SO $0 $0
Other Sources $80,507 $2,643,950 $2,724,457 $55,000 $2,749,700 $2,804,700
Gift, Grant and Contract Funds $60,498 $907,405 $967,903 $59,600 $943,700 $1,003,300
Federal Appropriations SO $0 $O $0 SO $0
State Appropriations 110,541,000 SO 110,541,000 $3,660,800 $O $3,660,800
Local Appropriations $0 SO SO $0 SO $0
TOTAL EDUCATION AND GENERAL $10,682,005 $3,551,355 $14,233,360 $3,775,400 $3,693,400 $7,468,800
Hospital (Including Appropriations) $O SO $O $O $O SO
Auxiliary Enterprises $O $0 $O 30 $O SO
Independent Operations $0 $O $0 $0 SO $0
TOTAL REVENUES $10,682,005 $3,551,355 $14,233,360 $3,775,400 $3,693,400 $7,468,800
Expenditures and Transfers
Education and General
Instruction $O $230,503 $230,503 $0 $275800 5275,800
Research $0 $0 $O SO $0 $O
Public Service $0 $O $O SO $0 SO
Academic Support 165,100 $0 $65,100 $68,400 10 $68,400
Student Services $0 $1,565,638 $1,565,638 $O $1,873,200 $1,873,200
Institutional Support $2,389,183 $622,599 $3,011,782 $1,555,200 $744,900 $2,300,100
Operation and Maintenance of Plant $0 SO $0 $0 $O SO
Scholarships and Fellowships $1,645,309 $668,210 $2,313,519 $1,603,300 1799,500 $2,402,800
Transfers (Net) $298,264 $O $298,264 $548,500 SO $548,500
TOTAL EDUCATION AND GENERAL $4,397,856 $3,086,950 $7,484,806 $3,775,400 $3,693,400 $7,468,800
Hospitals
Expenditures SO SO SO SO SO $0
Transfers (Net) $0 $O SO $0 $0 $0
TOTAL HOSPITALS SO $O SO $0 $0 $0
Auxiliary Enterprises
Expenditures $0 SO $O $0 10 10
Transfers (Net) $0 $O SO $0 SO SO
TOTAL AUXILIARY ENTERPRISES $0 $0 SO SO $O $O
Total Independent Operations $0 $O 10 $0 $O $0
TOTAL EXPENDITURES AND TRANSFERS $4,397,856 $3,086,950 $7,484,806 $3,775,400 $3,693,400 $7,468,800
REVENUE/EXPENDITURES DIFFERENCE $6,284,149 $464,406 $6,748,554 $O $O $0
139
30
1
1
1

SUMMARY OF CURRENT FUNDS, REVENUES, EXPENDITURES AND TRANSFERS TABLE 5
SBR E. STATEWIDE PROGRAMS 1991-92 ESTIMATED
CURRENT FUNDS REVENUES
Education and General
Appropriated
Other
Current Funds
Total
Current Funds
Tuition and Fees $O $0 $0
Endowment Income $O $O $0
Sales and Services $0 $0 $0
Other Sources $55,000 $2,887,200 $2,942,200
Gift, Grant and Contract Funds $59,600 $990,900 $1,050,500
Federal Appropriations $0 $O $0
State Appropriations $6,417,400 SO $6,417,400
Local Appropriations $0 $0 $O
TOTAL EDUCATION AND GENERAL $6,532,000 $3,878,100 $10,410,100
Hospital (Including Appropriations) SO $0 SO
Auxiliary Enterprises . $O $O SO
Independent Operations $O $0 $0
TOTAL REVENUES $6,532,000 $3,878,100 $10,410,100
Expenditures and Transfers
Education and General
Instruction $O $289,600 $289,600
Research $O SO $0
Public Service $0 $O SO
Academic Support $103,700 $O $103,700
Student Services $O $1,956,900 $1,966,900
Institutional Support $3,806,800 4782,200 $4,589,000
Operation and Maintenance of Plant $0 $0 $O
Scholarships and Fellowships $2,621,500 $839,400 $3,460,900
Transfers (Net) $O $O $O
TOTAL EDUCATION AND GENERAL $6,532,000 $3,878,100 $10,410,100
Hospitals
Expenditures $O $0 $O
Transfers (Net) $0 $O $O
TOTAL HOSPITALS SO $O $0
Auxiliary Enterprises
Expenditures $0 $0 $O
Transfers (Net) $0 $O $O
TOTAL AUXILIARY ENTERPRISE'. $0 $O $0
Total Independent Operations $0 $O SO
TOTAL EXPENDITURES AND TRANSFERS $6,532,000 $3,878,100 $10,410,100
REVENUE/EXPENDITURES DIFFERENCE $0 $O $0

TOTAL USHE
SUMMARY OF CURRENT FUNOS, REVENUES, EXPENDITURES AND TRANSFERS TABLE 5
i1989-90 ACTUAL 1990-91 ESTIMATED
Other Total Other Total
Appropriated Current Funds Current Funds Appropriated Current Funds Current Funds
CURRENT FUNDS REVENUES
Education and General
Tuition and Fees $82,453,694 $20,562,252 $103,015,946 $86,796,600 $21,449,900 $108,246,500
Endowment Income $0 $9,817,352 $9,817,352 $0 $10,307,800 $10,307,800
Sales and Services $1,469,029 $64,724,289 $66,193,318 $847,900 $67,958,900 $68,806,800
Other Sources $1,714,413 $26,078,205 $27,792,618 $1,986,300 $27,344,300 $29,330,600
Gift, Grant and Contract Funds $5,880,301 $229,979,458 $235,859,759 $3,601,300 $243,587,600 $247,188,900
Federal Appropriations $3,617,894 $284,730 $3,902,624 $3,426,200 $0 $3,426,200
State Appropriations $296,477,286 $0 $296,477,286 $298,897,600 $0 $298,897,600
Local Appropriations $O $0 $0 $0 $0 $0
TOTAL EDUCATION AND GENERAL $391,612,617 $351,446,286 $743,058,903 $395,555,900 $370,648,500 $766,204,400
Hospital (Including Appropriations) $2,878,800 $188,139,319 $191,018,119 $3,042,200 $197,546,300 $200,588,500
Auxiliary Enterprises $0 $79,196,682 $79,196,682 $0 $81,798,400 $81,798,400
Independent Operations $0 $0 $0 $0 $O $O
TOTAL REVENUES $394,491,417 $618,782,287 $1,013,273,704 $398,598,100 $649,993,200 $1,048,591,300
Expenditures and Transfers
Education and General
Instruction $188,148,926 $37,609,958 $225,758,884 $205,074,167 $41,551,700 $246,625,867
Research $17,128,292 $120,330,081 $137,458,373 $15,036,154 $133,082,600 $148,118,754
Public Service $14,477,335 $70,660,311 $85,137,646 $13,140,006 $77,397,400 $90,537,406
Academic Support $39,232,925 $14,717,938 $53,950,863 $36,289,384 $16,022,500 $52,311,884
Student Services $23,229,491 $11,398,779 $34,628,270 $23,422,586 $12,533,700 $35,956,286
Institutional Support 542,269,584 $13,592,636 $55,862,220 $46,260,122 $14,972,500 $61,232,622
Operation and Maintenance of Plant $48,801,990 $451,983 $49,253,973 $52,579,578 $505,200 $53,084,778
Scholarships and Fellowships $2,649,935 $52,150,363 $54,800,298 $2,602,703 $57,466,100 $60,068,803
Transfers (Net) $953,213 $15,619,024 $16,572,237 $1,151,200 $17,116,800 $18,268,000
TOTAL EDUCATION AND GENERAL $376,891,691 $336,531,072 $713,422,763 $395,555,900 $370,648,500 $766,204,400
Hospitals
Expenditures $2,878,800 $177,335,217 $180,214,017 $3,042,200 S188,922,200 $191,964,400
Transfers (Net) $0 $8,226,583 $8,226,583 $0 $8,624,100 $8,624,100
TOTAL HOSPITALS $2,878,800 $185,561,800 $188,440,600 $3,042,200 $197,546,300 5200,588,500
Auxiliary Enterprises
Expenditures $0 $77,402,329 $77,402,329 $0 $79,581,400 $79,581,400
Transfers (Net) $0 $2,133,614 $2,133,614 $0 $2,217,000 $2,217,000
TOTAL AUXILIARY ENTERPRISES $0 $79,535,943 $79,535,943 $0 181,798,400 $81,798,400
Total Independent Operations $0 $0 $0 $0 $0 $0
TOTAL EXPENDITURES AND TRANSFERS $379,770,491 $601,628,815 $981,399,306 $398,598,100 $649,993,200 $1,048,591,300
REVENUE/EXPENDITURES DIFFERENCE $14,720,926 $17,153,472 $31,874,398 $0 $0 SO
14132
1
1

SUMMARY OF CURRENT FUNDS, REVENUES, EXPENDITURES ANO TRANSFERS TABLE 5
TOTAL USHE 1991-92 ESTIMATED
CURRENT FUNDS REVENUES
Education and General
App. Triated
Other
Current Funds
Total
Current Funds
Tuition and Fees $99,462,000 $22,643,000 $122,105,000
Endowment Income $O $10,823,300 $10,823,300
Sales and Services $847,900 $71,356,800 $72,204,700
Other Sources $1,872,300 $28,711,600 $30,583,900
Gift, Grant and Contract Funds $2,310,900 $259,625,500 $261,936,400
Federal Appropriations $3,426,200 $0 $3,426,200
State Appropriations $356,042,900 $O $356,042,900
Local Appropriations SO $O $O
TOTAL EDUCATION AND GENERAL $463,962,200 $393,150,200 $857,122,400
Hospital (Including Appropriations) $3,298,600 $207,423,600 $210,722,200
Auxiliary Enterprises $O $85,888,300 $85,888,300
Independent Operations $0 $O SO
TOTAL REVENUES $467,260,800 $686,472,100 $1,153,732,900
Expenditures and Transfers
Education and General
Instruction $232,126,400 $44,045,600 1276,172,000
Research $20,350,600 $141,389,400 $161,740,000
Public Service $17,196,100 $82,133,900 $99,330,000
Academic Support $47,634,500 $16,975,700 $64,610,200
Student Services $29,093,900 $13,268,500 $42,362,400
Institutional Support $53,435,800 $15,851,200 $69,297,000
Operation and Maintenance of Plant $60,247,000 $532,200 160,779,200
Scholarships and Fellowships $3,877,900 $60,787,000 $64,664,900
Transfers (Net) $O $18,166,700 $18,166,700
TOTAL EDUCATION AND GENERAL $463,962,200 $393,160,200 $857,122,400
Hospitals
Expenditures $3,298,600 $198,368,300 $201,666,900
Transfers (Net) $O $9,055,200 $9,055,200
TOTAL HOSPITALS $3,298,600 $207,423,500 $210,722,100
Auxiliary Enterprises
Expenditures SO $83,560,800 $83,560,800
Transfers (Net) $0 $2,327,600 $2,327,600
TOTAL AUXILIARY ENTERPRISES $O $85,888,400 $85,888,400
Total Independent Operations $O $O $O
TOTAL EXPENDITURES AND TRANSFERS $467,260,800 $686,472,100 $1,153,732,900
REVENUE/EXPENDITURES DIFFERENCE $O $0 $O
14233

TAB GBUDGET HISTORY
Historical Information on USHE Appropriated Budgets
FIGURE 1
FIGURE 2
FIGURE 3
FIGURE 4
FIGURE 5
FIGURE 6
FIGURE 7
FIGURE 8
FIGURE 9
FIGURE 10
FIGURE 11
FIGURE 12
FIGURE 13
FIGURE 14
FIGURE 15
FIGURE 16
FIGURE 17
FIGURE 18
FIGURE 19
FIGURE 20
1
Expenditures per FTE Cumulative 14 Year Changes 2
Expenditures per FTE One Year Changes (90-91 over 89-90) 2
State Tax Funds per FTE Cumulative 14 Year Changes 3
State Tax Funds per FTE One Year Changes (90-91 over 89-90) 3
Tuition per FTE Cumulative 14 Year Changes 4
Tuition per FTE One Year Changes (90-91 over 89-90) 4
USHE Expenditures and Revenues per FTE 5
USHE Cumulative Percent Changes of per FTE Measures 5
University of Utah Expenditures and Revenues per FTE 6
University of Utah Cumulative Percent Changes 6
Utah State University Expenditures and Revenues per FTE 7
Utah State University Cumulative Percent Changes 7
Weber State University Expenditures and Revenues per FTE 8
Weber State University Cumulative Percent Changes 8
Southern Utah University Expenditures and Revenues per FTE 9
Southern Utah University Cumulative Percent Changes 9
Snow c' 3glege Expenditures and Revenues per FTE 10
Snow College Cumulative Percent Changes 10
Dixie College Expenditures and Revenues per FTE 11
Dixie College Cumulative Percent Changes 11
143

TAB GBUDGET HISTORY
--Continued--
FIGURE 21 College of Eastern Utah Expenditures and Revenues per FTE 12
FIGURE 22 College of Eastern Utah Cumulative Percent Changes 12
FIGURE 23 Utah Valley Comm College Expenditures and Revenues per FTE 13
FIGURE 24 Utah Valley Comm College Cumulative Percent Changes 13
FIGURE 25 Salt Lake Comm College Expenditures and Revenues per FTE 14
FIGURE 26 Salt Lake Comm College Cumulative Percent Changes 14
TABLE 1 USHE 14 Year Changes in Enrollments and AppropriatedExpenditures, Appropriations; and Tax Funds 15
APPENDIX History of Enrollment and Budget Changes, USHE 17
TABLE 1 Current Dollar Expenditures 18
TABLE 2 Constant Dollar Expenditures 22
TABLE 3 Current Dollar State Tax Funds 26
TABLE 4 Constant Dollar State Tax Funds 30
TABLE 5 Current Dollar Tuition & Fee Revenues 34
TABLE 6 Constant Dollar Tuition & Fee Revenues 38
TABLE 7 Current Dollar Expenditures, Tax Funds,and Tuition & Fees per FTE 42
TABLE 8 Constant Dollar Expenditures, Tax Funds,and Tuition & Fees per FTE 46
TABLE 9 Calculation of Constant Dollar InflatorsBased on CPI at December 31st 50
144

HISTORICAL INFORMATION ON USHE APPROPRIATED BUDGETS
Background
The analysis presented in the following graphs and tables has been preparedto provide a neutral analysis of recent budget history for the USHE and for eachindividual institution. This is one of three basic data sets developed toprovide a balanced basis for analysis of the relative funding needs of USHEinstitutions. The other two data sets are the USHE Cost Study, and ComparisonInstitutions Financial Information.
Explanation of Attachments
Figures 1 through 6 show both cumulative 14-year relationships and mostrecent 1-year relationships between enrollment change and changes in constantdollar expenditures, State tax funds, and tuition revenues per FTE student foreach institution and total USHE. The graphs support the observation that bothexpenditures per FTE and tax funds per FTE tended to be negatively associatedwith enrollment growth over the 14-year period. In other words, funding
generally did not follow enrollment growth to an adequate degree. Looking at
Figure 5, however, there is no discernable long-term relationship betweenenrollment growth and tuition revenues per FTE student.
Looking at Figures 7 and 8, the following patterns are apparent. The high
point in purchasing power per student for total USHE was in 1978-79. This highpoint followed several years of state revenue growth during which time executiveand legislative policy supported improving the resources available to provide ahigh quality system of higher education. Between 1979-80 and 1982-83, USHEabsorbed significant enrollment increases without needed increases in funding tosupport the added students. This was compounded by high inflation during thatperiod, including double digit CPI increases in 1979-80 and 1980-81.
After 1982-83, the Board instituted annual funded enrollment targets toprevent further erosion in the resource support to maintain acceptable qualityfor students enrolled. In 1984-85 and 1985-86 some gains were achieved.However, limited state revenues, and aggressive institutional enrollment policieshave caused deterioration since 1985-86. Constant dollar expenditures and taxfunds per FTE budgeted for 1990-91 are lower than at any time in recent history.At the same time, tuition revenues per FTE are expected to reach record highs(although generally not high when compared to national averages and peerinstitutions, except in some of the two-year colleges). Figures 9 through 26
provide similar trend information for each individual institution.
Table 1 provides basic data on the net changes for the 14-year period, foreach institution and total USHE. Finally, source data are arrayed in the
Appendix for those who may wish to understand the calculations behind the trendssummarized in the graphs and Table 1.
145

FIGURES I AND 2EXPENDITURES PER FTE (CONSTANT DOLLAR)
CHANGES IN ENRLMT & EXP/PER FTECUMULATIVE 14-YEAR CHANGES
40%
;EU
30%
20%
10%
0%
0 UU
0 USC1 IVSU0 UVCC
-10%
-20%
00C
OSC 0SUU
-30%
0-40%
0% 40% 80% 120% 180% 200%
CUM. CHANGES IN ENROLLMENT
CHANGES IN ENRLMT & EXP/PER FTEONE-YEAR CHANGES (30-81 OVER 88-80)
20%
15%
10%
5%
0%
0 UvOC
Ve:r 1.)
0 IJUOS
-5%
0%
0 DC
0-USIC
OUSUa s LAJI
CI r
15%
o c !EU
-20%
-4% 0% 4% 8% 12%
ONE-YEAR CHANGES IN ENROLLMENT
16% 20% 24%

1
FIGURES 3 AND 4STATE TAX FUNDS PER FTE (CONSTANT DOLLAR)
40%
30%
20%
10%
0%
- 10%
- 20%
- 30%
- 4096
- 50%
CHANGES IN ENRLMT & TX FNDS/PER FTECUMULATIVE 14-YEAR CHANGES
0 ULI
0 USU
4142/SeIE
0 DC
IJVL
S
0 SUU0 SC
_CC
0 EU
0% 40% 80% 120% 180% 200%
CUM. CHANGES IN ENROLLMENT
CHANGES IN ENRLMT & TX FNDS/PER FTEONE-YEAR CHANGES (80-91 OVER 88-80)
20%
15%
10%
596
0 LN OC
LI 1.-ZU
10%0
0 DC
USHOS-
15%
OUSU0 &LIU 0 SLCC
-
0 CEU
- 20%
-4% 0% 496 8% 12% 15% 20% 24%
ONG-YEAR CHANGES IN ENROLLMENT
147

FIGURES 5 AND 6TUITION PER FTE (CONSTANT DOLLAR)
CHANGES IN ENRLMT & T&F/PER FTECUMULATIVE 14-YEAR CHANGES
60%
30%0 UVCC
40%
0 SCCC
30%
20%
0 UUWSU
Still
10%
aUSHE
0% n usu
-10%
-20%
-30%
-40%0% 40% 80% 120%
CUM. CHANGES IN ENROLUAENT
160%
0
200%
EU
CHANGES IN ENRLMT & T&F/PER FTEONE-YEAR CHANGES (80-81 OVER 88-90)
20%
10%
0%
0 l.N OC 0 UU
GlUst.
- 10%
o wa DC
0 Usu
SHE
0 SC
0 5 UUC EU
- 20%
- 30%
- 40%
-4% 0% 496 8% 12%
ONE-YEAR CHANGES IN ENROLLMENT
16% 20%
SLC
24%
4 14s

FIGURES 7 AND 8
$7.0
$6.0
$S 0
$4 . 0
$3 0
$2.0
UTAH SYSTEM OF HIGHER EDUCATIONE & G RELATED (CONSTANT $)
$1.01976-77
r1978-79 1980-81 1982-83 1984-85 1986-87 1988-89 1990-91
EXP/ FTE + TAX/ FTE o T&F/ FTE
18%
19%
14%
12%
10%
8%
6%
4%
2%
0%
2%
- 4%
- 6%
- 8%
10%
- 12%1976-77 1978-79 1980-81 1982-83 1984-85 1986-87 1988-89
UTAH SYSTEM OF HIGHER EDUCATIONCUAJLAT % CHANCES (CONSTANT S)
0 EXPI FTE TAX/ FTE o T&F/ FTE
1990-91
5 143

FIGURES 9 AND 10
$7.0
$6.0
$S 0
$4 0
$3.0
$2.0
UNIVERSITY OF UTAHE & G + RELATED (CONSTANT 5)
$1.01976-77 1978-79
0 EXP/ PTE
1990-81 1982-83 1984-85 1985-87 1989-89 1990-91
+ TAX/ FTE 0 T&F/ FTE
30%
25%
20%
15%
10%
5%
0%
- 5%
- 10%1976-77
UNIVERSITY OF UTAHCUMULAT I VE % CHANGES (CONSTANT 5)
1978-79
0 EXP/ FTE
1980-81 1982-83
1- TAX/ FTE
1984-85 1985-87 198e- se
o T&F/ FTE
1990-91
6 150

FIGURES 11 AND 12
$7.0
$8 0
$S 0
$4.0
$3 0
$2.0
$1.0
1976-77
c
UTAH STATE UN I VERS I TYE & G RELATED (CONSTANT $)
r,
1 1
1978-79 1980-81 1982-83 1984-85 1986-87 1988-89 1990-91
0 EXP/ FTE TAX/FTE T&F/ FTE
20%
18%
16%
14%
12%
10%
ex
ex
4%
2%
0%
- 2%
-4%
- 6%
ex
- 1 lox
- 12%
1976-77
UTAH STATE UN I VERS I TYCUMULATIVE % CHANGES (CONSTANT $)
1
1978-79 1980-01 1982-83 1984-85 1986-87
0 EXP/ FTE t TAX/FTE
1988-89
o T&F/FTE
1990-91
7 1 5 I

FIGURES 13 AND 14
$5.5
$5.0
44.5
44.0
$3 .5
$3.0
52 5
$2.0
$1.5
51.0
$0.51976-77
WEBER STATE UN I VERS I TYE & G RELATED (CONSTANT 5)
.---1,----------4
...-=6=10.--4)...._.........."
1978-79
0 EXP/ FTE
1980-81 1982-83
+ TAX/ FTE
1984-85 1986_87 1988-89
o T&F/ FTE
1990-91
35%
30%
25%
20%
15%
1 0%
5%
0%
- 5%
- 10%
WEBER STATE UN I VERS I TYCIACLAT I VE % CHANGES (CONSTANT 5)
- 15%1976-77 1978-79 1980-81 1982-83 1984-85
0 EXP/ FTE + TAX/ FTE
r
1985-87i
1988-89
O T&F/ FTE
1990-91
8 152

FIGURES 15 AND 16
$7.0
$6.0
$5.0
44 0
43 0
$2.0
SOUTHERN UTAH UNIVERSITYE & G RELATED (CONSTANT 4)
$1.0
$O. 01976-7-' 1978-79 1980-81
0 EXP/ FTE
1982-83 1984-85 1985-87 1988-89 1990-91
+ TAX/ FTE 0 T&F/ FTE
30%
20%
10%
- 20%
SOUTHERN UTAH UNIVERSITYCUMULAT I VE 96 CHANGES (CONSTANT 4)
30%1976-77 1978-79 1980-81 1982-83 1984-85 1986-87 19138-89
0 EXP/ FTE + TAX/ FTE T&F/ FTE
1990-91

FIGURES 17 AND 18
57 0
SNOW COLLEGEE & G . RELATED (CONSTANa S)
.-
. '56.0
. . , '$5.0 . J
54 0
53 0
$2.0
$1.0 ,....--
$0.01976-77
0
1978-79
EXP/FTE
1980-81 1982-83
+ TAX/FTE
1
1984-851
1966-87 1988-89
0 T&F/FTE
1990-91
60%
50%
40%
30%
20%
10%
0%
- 1 0%
- 20%
-30%1976-77
SNOW COLLEGECUMULATIVE % CHANGES (CONSTANT S)
1978-79
0 EXP/FTE
1980-81 1982-83
+ TAX/FTE
1984-85 1986-87 1988-89
0 T&F/FTE
1990-91
10 154

1
FIGURES 19 AND 20
T5.5
$5.0
T4.5
T4.0
$3.5
$3 0
42 5
$2.0
$1.5
41.0
$0.5
DIXIE COLLEGEE & G RELATED (CONSTANT T)
-a-
0
1
1976-77 1978-79 1980-81 1982-83 1984-85 1986-87 1988-99 1990-91
0 EXP/ FTE + TAX/ FTE 0 T&F/ FTE
30%
25%
2095
15%
10%
5%
0%
- 5%
- 10%
- 15%
- 20%1975-77
DIXIE COLLEGECUIAJLAT I % CHANGES (CONSTANT $)
1978-79
0 EXP/ FTE
1980-81 1982-83
+ TAX/ FTE
1984-85 1986-87 1988-89
T&F/ FTE
1990-91
11 ,.;),-)
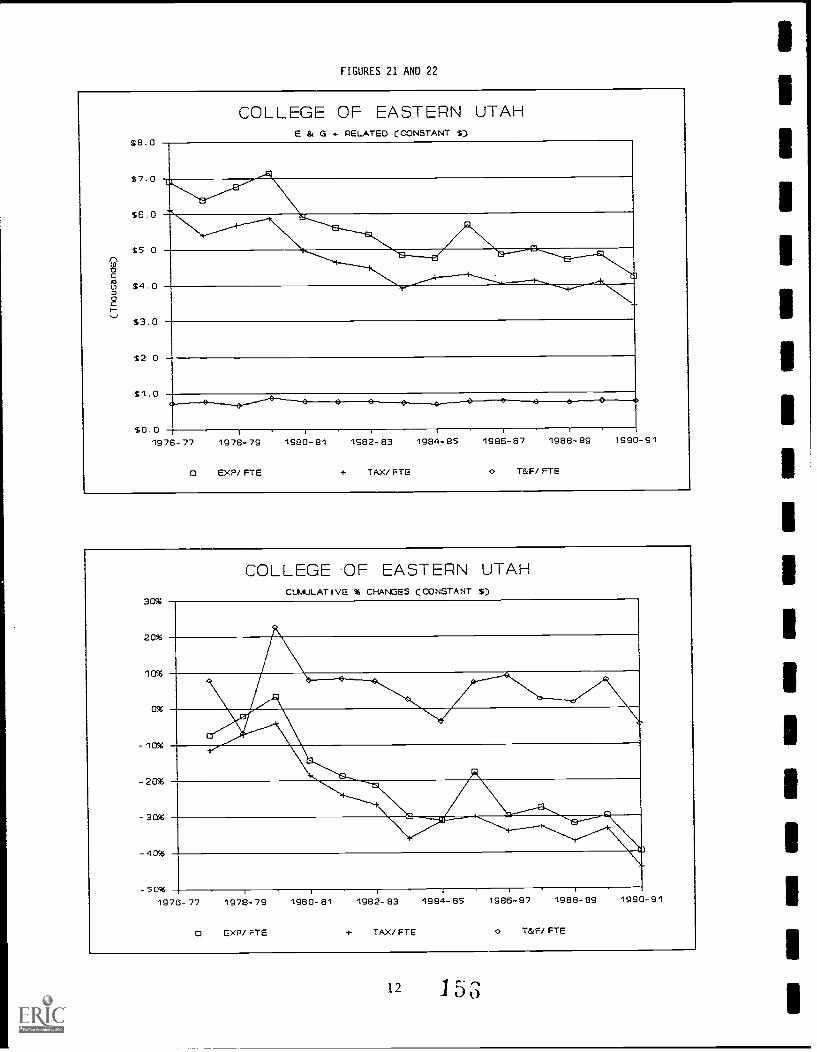
FIGURES 21 AND 22
$8 . 0
$7.0
$6.0
$5 0
$4 . 0
$3. 0
$2 0
$1.0
COLLEGE OF EASTERN UTAHE & G RELATED (CONSTANT $)
;-*
=
$O . 01976-77 1978-79 1980-81 1982-83 1984-85 1986-87 1988-89
0 EXP/ FTE + TAX/ FTE 0 T&F/ FTE
30%
20%
10%
Cr%
- 10%
- 20%
- 30%
- 40%
COLLEGE OF EASTERN UTAHCUMJLAT I VE % CHANGES (CONSTANT S)
- 50%1976-77 1978-79 1980-81
EXP/ FTE
1982-83 1984-85 1986-87 1988-89 1990-91
+ TAX/ FTE o T&F/ FTE
12 1 5

FIGURES 23 AND 24
$5.0
$4 5
$4.0
$3 5
$3.0
$2.5
$2 0
$1.5
$1 0
$0.5
UTAH VALLEY COMMUN I TY COLLEGEE & G RELATED (CONSTANT $)
-4)
1975-77 1978-79
0 EXP/FTE
1980-81 1982-83 1984-85 1986-87 1988-89 1990-9.1
+ TAX/FTE o T&F/FTE
GO%
50%
40%
30%
20%
10%
0%
-10%
-20%
-30%
UTAH VALLEY COMMUN I TY COLLEGECUMULATIVE % CHANGES (CONSTANT $)
1975-77 1978-79
0 EYP/FTE
1680-81 1982-83
TAX/ FIE
1984-85 1986-87 1988-89
T&F/FTE
1990-91

FIGURES 25 AND 26
$4.5
. 0
$3.5
$3.0
$2.5
$2.0
$1 5
$1.0
SALT LAKE COMMUNITY COLLEGEE & G RELATED (CONSTANT 5)
$0.51976-77 1978-79 1980-81 1982-83 1984-85 1985-87 1988-89
0 EXP/ FTE + TAX/ FTE T&F/ FTE
1990-91
80%
70%
GO%
50%
40%
30%
20%
10%
0%
- 10%
- 20%
SALT LAKE COMMUNITY COLLEGECUMULAT VE % CHANGES (CONSTANT $)
- 30%
1976-77 1978-79
EXP/ FTE
1980-81 1982-83
TAX/ FTE
1984-85 1986-87 1988-89
0 T&F/ FTE
1990-91
14
15Q

TABLE 1
24-Dec-90 USHE-14 YEAR CHANGES IN ENROLLMENTS AND APPROPRIATED EXPENDITURES, APPROPRIATIONS, AND TAX FUNDS Page 1
ICurrent
Annualized Expend Tax Fund Tuit/Fees
FTE per FTE per FTE per FTE
I _
University of Utah
1976-77 Actual 18,982 $2,917 $2,109
1990-91 Budget 19,690 $7,020 $5,220 $1T643
I% Change 3.7% 140.7% 147.5% 196.9%
Utah State University
I1976-77 Actual 9,518 $2,679 $1,908 $608
1990-91 Budget
% Change
12,170 $5,753 $4,290 $1,415
27.9% 114.8% 124.8% 132.6%
IWeber State University
1976-77 Actual 7,634 $2,121 $1,587 $421
1990-91 Budget 10,560 $4,552 $3,244 $1,229
% Change 38.3% 114.7% 104.4% 191.9%
ISouthern Utah University
1976-77 Actual 1,807 $2,480 $2,052 $371
1990-91 Budget 3,365 $4,475 $3,369 $1,030
I% Change 86.2% 80.4% 64.2% 177.9%
Snow College
I 1976-77 Actual
1990-91 Budget
849
1,763
$2,455 $2,093
$4,588 $3,534 $$299822
% Change 107.7% 86.9% 68.8% 236.4%
Dollars Constant Dollars
Dixie College
1976-77 Actual 1,150 $2,094 $1,634 $344
1990-91 Budget 2,088 $4,169 $3,144 $945
% Change 81.6% 99.1% 92.4% 174.5%
ICollege of Eastern Utah
I % Change 216.8% 41.0% 28.2% 140.7%
1990-91 Budget 1,720 $4,226 $3,410
1976-77 Actual 543 $2,998 $2,659
IT
Utah Valley Community College
I1976-77 Actual 2,881 $1,702 $1,202
1990-91 Budget 5,650 $3,773 $2,467 $1$,324031
% Change 96.1% 121.8% 105.2% 250.6%
ISalt Lake Community College
ITotal USHE
1976-77 Actual 47,330 $2,515 $1,843 $504
I % Change 107.0% 106.3% 166.5%
1990-91 Budget 66,287
40.1%
$5,206 $3,802 $1,343
% Change 134.1% 86.3% 74.1% 242.2%
1976-77 Actual 3,964 $1,638 $1,165
1990-91 Budget 9,281 $3,051 $2,028 1297593
Expend
per FTE
Tax Fund
per FTE
$6.716 $4,857
$7,020 $5,220
4.5% 7.5%
$6,168 $4,394
$5,753 $4,290
-6.7% -2.4%
$4,883 $3,654
$4,552 $3,244
-6.8% -11.2%
$5,711 $4,724
$4,475 $3,369
-21.6% -28.7%
$5,652 $4,818
$4,588 $3,534
-18.8% -26.7%
$4,821 $3,762
$4,169 $3,144
-13.5% -16.4%
$6,902
$4,226
-38.8%
$6,123
$3,410
-44.3%
$3,918 $2,768
$3,773 $2,467
-3.7% -10.9%
$3,770 $2,682
$3,051 $2,028
-19.1% -24.4%
$5,791 $4,242
$5,206 $3,802
-10.1% -10.4%
Tuit/Fees
per FTE
$1,367
$1,763
29.0%
$1,400
$1,415
1.0%
$1!992729
26.8%
$853
$1,030
20.7%
$$69782
46.1%
$793
19924.%
147741.475%
$789
$1,201
52.3%
4:76%
$953
*Analysis includes all Education & General line items plus all other instructional line items except
I School of Med, RDEP and Skills Center.
**1990-91 enrollments, tuition, and expenditures are revised estimates based on actual 1990-91 Summer and Fall experience.
1153

24-Dec-90 USHE-14 YEAR CHANGES IN ENROLLMENTS AND APPROPRIATED EXPENDITURES, APPROPRIATIONS, AND TAX FUNDS Page 2
University of Utah
Current Dollar Tax Funds (000)
Total Medical Ag
Instit Programs Programs
Constant Dollar Tax Funds (000)
Total Medical Ag
Instit Programs Programs
1976-77 Actual $48,341 $5,792 $111,302 $13,334
1990-91 Budget $124,496 $15,900 $124,496 $15,900
% Change 157.5% 174.5% 11.9% 19.2%
Utah State University
1976-77 Actual $23,745 $4,264 $54,670 $9,817
1990-91 Budget $68,112 $13,104 $68,112 $13,104
% Change 186.9% 207.3% 24.6% 33.5%
Weber State University
1976-77 Actual $12,265 $28,239
1990-91 Budget $34,453 $34,453
% Change 180.9% 22.0%
Southern Utah University
1976-77 Actual $3,740 $8,610
1990-91 Budget $11,402 $11,402
% Change 204.9% 32.4%
Snow College
1976-77 Actual $1,829 $4,211
1990-91 Budget $6,254 $6,254
% Change 242.0% 48.5%
Dixie College
1976-77 Actual $1,945 $4,479
1990-91 Budget $6,619 $6,619
% Change 240.2% 47.8%
Ulege of Eastern Utah
1976-77 Actual $1,535 $3,535
1990-91 Budget $6,003 $6,003
% Change 291.0% 69.8%
Utah Valley Community College
1976-77 Actual $3,485 $8,023
1990-91 Budget $13,992 $13,992
% Change 301.6% 74.4%
Salt Lake Community College
1976-77 Actual $4,635 $10,672
1990-91 Budget $18,885 $18,885
% Change 307.4% 77.0%
Total USHE
1976-77 Actual $102,838 $236,774
1990-91 Budget $293,454 $293,454
% Change 185.4% 23.9%
*Analysis includes all Education & General line items plus all other instructional line items except
School of Med, RDEP and Skills Center.
**1990-91 enrollments, tuition, and expenditures are revised estimates based on actual 1990-91 Summer and Fall experience.
16
160

APPENDIX
1.6i17

History 24-Dec-90 HISTCRY OF ENROLLMENT AND BUDGET CKANGES, USHE Page 1 111
TABLE 1--Current Dollar Expenditures
in thousands of dollars
UNIVERSITY OF UTAH
1976-77
Actual
1977-78
Actual 1-Yr Inc
1978-79
Actual 1-Yr Inc 2-Yr Inc
1979-80
Actual 1-Yr Inc 3-Yr Inc
1980-81
Actual 1-Yr Inc 4-Yr Inc
Annualized FTE* 18 982, 18,699 -1.49% 17,975 -3.87% -5.31% 18,430 2.53% -2.91% 18,768 1.83% -1.13%
Ed & Gen * Coop Nursing $55,366 $60,756 9.73% $66,783 9.92% 20.62% $71,509 7.08% 29.16% $77,532 8.49: 40.12%
Medical Programs (Ind 5th Path) $6,64; $7,304 9.94% $7,855 7.54% 18.23% $8,925 13.63% 34.34: $9,837 10.22% 48.07%
All Other (Including KUED) $2,424 $3,650 50.61% $3,686 1.00% 52.11% $3,448 -6.46% 42.29% $3,425 -0.68% 41.32%
Total $64,433 $71,710 11.29% $78,324 9.22% 21.56% $83,882 7.10% 30.18% 590,844 8.30% 40.99%
UTAH STATE UNIVERSITY
Annualized FTE** 9,518 9,729 2.22% 9,156 -5.89% -3.80% 9,562 4.43% 0.46% 10,359 8.34% 8.84%
Ed & Gen + CE Centers + Coop H Ed $25,496 $28,348 11.19% $31,221 10.13% 22.45% $33,971 8.81% 33.24% 37,413 10.13% 46.744
Agricultural Programs $7,313 $8,297 13.46% $9,034 8.88% 23.53% $9,972 10.39% 36.36% 10,701 7.31% 46.33%
All Other (Including Prod Ctr) $1,518 $1,639 7.97% $1,874 14.34% 23.45% $2,189 16.82% 44.21% $2,168 -0.94% 42.86%
Total 534,327 538,284 11.53% $42,128 10.04% 22.73% 546,132 9.50% 34.39% 50,282 9.00% 46.48%
WEBER STATE uNIVERSITY
Annualized FTE*** 7,634 7,449 -2.42% 7,480 0.42% -2.02% 8,116 8.50% 6.31% 8,919 9.89% 16.83%
Ed & Gen + Coop Nursing $16,189 $18,221 12.55% $20,173 10.71% 24.61% $21,753 7.83% 34.37% $24,944 14.67% 54.08%
All Otner $151 $151 0.42% $149 -1.49% -1.08% $148 -0.93% -1.99% $164 11.30% 9.08%
Total $16,340 $18,372 12.44% 520,322 10.61% 24.37% $21,901 7.77% 34.03% $25,108 14.65% 53.66%
SOUTHERN UTAH UNIVERSITY
Annualized FTE 1,807 1,750 -3.15% 1,719 -1.77% -4.87% 1,853 7.80% 2.55% 1,948 5.13% 7.80%
Ed & Gen + Coop H Ed $4,482 $5,072 13.17% $5,542 9.27% 23.65% $6,104 10.14% 36.19% $6,824 11.79% 52.24%
All Other $32 $190 490.77% $37 -80.81% 13.35% $58 58.24% 79.37% $40 -31.61% 2" ,7%
Total 54,514 55,262 16.57; $5,579 6.01% 23.58% 56,162 10.45% 36.50: 56,863 11.38: -.03%
SNOW COLLEGE
Annualized FTE 849 915 7.77% 897 -1.97% 5.65% 1,002 11.71% 18.02% 1,108 10.58% 30.51%
Education and General $2,084 $2,425 16.34% $2,839 17.07% 36.20% $3,249 14.45% 55.87% $3,659 12.62% 75.55%
All Other $52 $20 -60.79% $19 -5.45% -62.93% $22 15.18% -57.30% $30 34.55% -42.55%
Total 52,136 52,445 14.48% 52,858 16.88% 33.80% 53,271 14.45% 53.14% 53,689 12.77% 72770%
DIXIE COLLEGE
Annualized FTE 1,150 1,148 -0.17% 1,092 -4.88% -5.04% 1,141 4.49% -0.78% 1,325 16.13% 15.22%
Education and General $2,408 $2,697 12.00% $3,009 11.57% 24.96% $3,309 9.99% 37.44% $3,825 15.58% 58.85%
All Other (Ind ZP Amp) $66 $11 -83.43% $12 7.27% -82.23% $32 172.26% -51.62% $40 23.40% -40.29%
Total $2,474 $2,708 9.44% 53,021 11.55% 22.08% $3,342 10.62% 35.05% 53,865 15.65% 56.19%
COLLEGE OF EASTERN UTAH
Annualized FTE**** 543 649 19.52% 660 1.69% 21.55% 625 -5.30% 15.10% 753 20.48% 38.67%
Ed & Gen + San Juan Ctr $1,628 $1,924 18.20% $2,254 17.16% 38.49% $2,557 13.41% 57.05% $2,869 12.22% 76.24%
All Other $114 $69 -39.34% 568 -2.02% -40.56% $81 18.76% -29.41% $91 13.11% -20.15%
Total $1,742 51.994 14.43% 52,322 16.49% 33.30% $2,637 13.56% 51.38% 52,960 12.24% 69.91%
UTAH VALLEY CONCHITY COLLEGE
Annualized FIE 2,881 2,863 -0.62% 2,897 1.19% 0.56% 3,250 12.19% 12.81% 3,840 18.15% 33.29%
Education and General $4 ,902 55,796 18.22% $7,068 21.96% 44.18% $7,463 5.58% 52.23% $8,656 15.99% 76.58%
All Other $20 $135 570.84% $35 -74.32% 72.30% $43 23.34% 112.52% $44 1.64% 116.00%
Total 54,922 55,931 20.48% 57,103 19.77% 44.30% 57,506 5.67% 52.48% $8,700 15.91% 76.74%
SALT LAKE COMMUNITY COLLEGE
Annualized FTE 3,964 3,974 0.25% 3,814 -4.03% -3.78% 3,870 1.47% -2.37% 4.155 7.36% 4.82%
Education and General $6,491 $7,224 11.28% $8,143 12.73% 25.44% $8,518 4.60% 31.22% $9,571 12.36% 47.44%
All Other (Excl Sk Ctr) $17 $33 94.12% $43 31.37% 155.01% $51 18.31% 201.69% $52 1.98% 207.66%
Total (Excl Sk Ctr) $6,508 $7.257 11.50% $8,186 12.81% 25.78% $8,569 4.68% 31.66% $9,623 12.30% 47.86%
SIN AND STATEWIDE
SBR Administration $601 $711 18.25% $786 10.57% 30.75% $843 7.19% 40.15% $980 16.37% 63.09%
Other Statewide $769 $1,518 97.35% $1,170 -22.90% 52.14% $1,351 15.45% 75.64% $1.440 6.58% 87.21%
Total $1,370 $2,229 62.65% 51,956 -12.23% 42.76% 52,194 12.13% 60.08% 52,421 10.34% 76.63%
TOTAL USHE .
Annualized FTE* 47,330 47,178 -0.32% 45,690 -3.15% -3.47% 47,849 4.73% 1.10% 51,174 6.95% 8.12%
Educ & Gen + Other Inst $119,048 $132,462 11.27% $147,033 11.00% 23.51% 5158,433 7.75% 33.08% $175,342 10.67% 47.29%
All Other Line Items $19,721 $23.729 20.33% $24,767 4.38% 25.59% $27,162 9.67% 37.74% $29,012 6.81% 47.11:
Total $138.768 $156,191 12.56% $171,800 9.99% 23.80% 5185.595 8.03% 33.74% $204,354 10.11% 47.26%
*Excluding Medical **Including Cont Ed Centers ***Including Coop Nursing ****Including San Juan Center
18 1 62
1

History 24-Dec-90
TABLE 1--Current Dollar ExpendituresIII
in thousands of dollars
UNIVERSITY OF UTAH
IIIAnnualized FTE*
Ed & Gen + Coop Nursing
medical Programs (Incl 5th Path)
All Other (Including KUED)
!IITotal
UTAH STATE UNIVERSITY
Annualized FTE**
Ed & Gen + CE Centers + Coop M Ed
IIIAgricultural Programs 512,165
All Other (Including Prod Ctr)
Total
WEBER STATE UNIVERSITY
1Annualized FTP".
Ed & Gen + Coop Nursing
All Other
Total
IIISOUTHERN UTAH UNIVERSITY
ed FTEAnnualiz
Ed & Gen 4- Coop M Ed
All Other
111
Total
SNOW COLLEGE
Annualized FTE
III
Education and General
All Other
Total
DIXIE COLLEGE
Annualized FIE
III
Education and General
All Other (Incl ZP Amp)
Total
IIICOLLEGE OF EASTERN UTAH
Annualized FTE****
Ed & Gen + San Juan Ctr
All Other
illTotal
UTAH VALLEY COMMUNITY COLLEGE
Annualized FTE
Education and General
ill
All Other
Total
IIIISALT LAKE COMMUNITY COLLEGE
Annualized FTE
ill
Education and General
All Other (Excl Sk Ctr)
Total (Excl Sk Ctr)
SBR AND STATEWIDE
II/
SBR Administration
Other Statewide
Total
TOTAL USHE
111
Annualized FTE
Educ & Gen 4. Other Inst
All Other Line Items
Total
1
HISTORY OF E ROLLMENT AND BUDGET CHANGES, USHE Page 2
1981-82
Actual 1-Yr Inc 5-Yr Inc
1912-83
tztual 1-Yr Inc 6-Yr Inc
1983-84
Actual 1-Yr Inc 7-Yr Inc
1984-85
Actual 1-Yr Inc 8-Yr Inc
18,833 0.35% -0.78% 19,454 3.30% 2.49% 19,492 0.20% 2.69% 19,445 -0.24% 2.44%
$87,190 12.38% 57.48% $98,715 13.22% 78.29% $101,390 2.71% 83.13% $110,840 9.32% 100.19%
$12,178 23.80% 83.30% $13,850 13.73% 108.46% $14,074 1.62% 111.84% $15,519 10.27% 133.59%
$4,401 28.51% 81.62% $6,268 42.41% 158.64% $6,472 3.25% 167.05% $6,945 7.30% 186.55%
$103,769 14.23% 61.05% $118,832 14.52% 84.43% 9121,936 2.61% 89.24% 9133,303 9.32% 106.89%
10,365 0.06% 8.90% 10,553 1.81% 10.87% 10,989 4.13% 15.45% 10,663 -2.97% 12.03%
$41.902 12.00% 64.35% $46,093 10.00% 80.79% $47,321 2.66% 85.60% $52,594 11.14% 106.28%
13.68% 66.35% 912,810 5.30% 75.17% 912,973 1.27% 77.40% $14,412 11.09% 97.07%
92.752 26.94% 81.34% $4.200 52.60% 176.74% $3,878 -7.66% 155.54% 54,527 16.72% 198.26%
$56,819 13.00% 65.52% 963,103 11.06% 83.83% $64,172 1.69% 86.94% 971,532 11.47% 108.39%
8,924 0.06% 16.90% 9,010 0.96% 18.02% 8,822 -2.09% 15.56% 8,467 -4.02% 10.91%
$27,377 9.75% 69.11% $31,082 13.54% 91.99% $31,444 1.16% 94.23% $34,582 9.98% 113.61%
$149 -9.10% -0.84A $211 41.22% 40.03% $208 -1.17% 38.40% $200 -4.08% 32.75%
$27,526 9.63% 68.46% 931,293 13.69% 91.51% $31,652 1.15% 93.71% 934,782 9.89% 112.86%
1,922 -1.33% 6.36% 2,173 13.06% 20.25% 2,315 6.53% 28.11% 2,410 4.10% 33.37%
$7,611 11.54% 69.81% $8,562 12.50% 91.03% $8,870 3.59% 97.90% $9,988 12.60% 122.84%
$55 38.78% 70.24% $57 3.87% 76.83% $56 -1.99% 73.30% $60 6.69% 84.90%
97.666 11.69% 69.81% 58,619 12.44% 90.93% $8,926 3.56% 97.72% 910,047 12.57% 122.57%
1,132 2.17% 33.33% 1,025 -9.45% 20.73% 1,146 11.80% 34.98% 1,130 -1.40% 33.10%
$4,156 13.57% 99.37% $4,491 8.06% 115.45% $5,011 11.59% 140.43% $5,455 8.85% 161.71%
$25 -15.82% -51.64% $22 -11.74% -57.32% $22 1.96% -56.48% $22 -2.26% -57.46%
$4,180 13.34% 95.73% $4,513 7.94% 111.28% 95,034 11.55% 135.68% 95,477 8.80% 156.43%
1,380 4.15% 20.00% 1,436 4.06% 24.87% 1,449 0.91% 26.00% 1.483 2.35% 28.96%
$4,300
$51
12.41%
29.51%
78.56%
-22.67%
$4,769
$56
10.91%
9.05%
98.04%
-15.68%
$4,887
$57
2.48%
1.03%
102.96%
-14.81%
$5,436
$71
11.24%
25.16%
125.77%
6.62%
54,351 12.59% 75.85% $4,825 10.89% 94.99% $4,944 2.47% 99.80% 55,507 11.40% 122.57%
829 10.09% 52.67% 922 11.22% 69.80% 1,065 15.51% 96.13% 1,162 9.11% 114.00%
$3,266 13.84% 100.63% $3,650 11.76% 124.23% $3,901 6.88% 139.67% $4,344 11.35% 166.86%
$85 -6.43% -25.29% $95 11.17% -16.94% $92 -3.31% -19.69% $96 4.77% -15.85%
93,351 13.21% 92.37% 93,745 11.75% 114.97% $3,993 6.63% 129.21% 54,440 11.19% 154.87%
4,349 13.26% 50.95% 5,035 15.77% 74.77% 5,272 4.71% 82.99% 4,947 -6.16% 71.71%
$10,281 18.77% 109.72% $11,378 10.66% 132.08% $11,985 5.34% 144.48% $13,700 14.31% 179.47%
$46 5.29% 127.42% $45 -1.09% 124.94% $45 -0.22% 124.44% $47 4.65% 134.87%
$10,327 18.70% 109.79% 911,423 10.61% 132.06% 912,030 5.32% 144.40% 913,748 14.27% 179.29%
4,573 10.06% 15.36% 5,339 16.75% 34.69% 5,518 3.35% 39.20% 5,563 0.82% 40.34%
S11,147 16.47% 71.73% $12,207 9.51% 88.05% 913,560 11.08% 108.89% 915,303 12.85% 135.74%
$55 5.35% 224.12% 559 6.54% 245.31% $59 0.85% 248.24% $62 4.90% 265.29%
$11,202 16.41% 72.12% $12,266 9.49% 88.46% $13,619 11.03% 109.25% $15,365 12.82% 136.08%
$913 -6.90% 51.84% $1,106 21.18% 83.99% 51,078 -2.54% 79.33% $1,142 5.95% 89.99%
$1,448 0.57% 88.28% $1,948 34.46% 153.16% $1,806 -7.29% 134.72% $2,707 49.92% 251.89%
$2,361 -2.46% 72.29% 93,054 29.33% 122.82% 92,884 -5.57% 110.42% 93,849 33.48% 180.87%
52,306 2.21% 10.51% 54,946 5.05% 16.09% 56,068 2.04% 18.46% 55,270 -1.42% 16.78%
$197,229 12.48% 65.67% $220,947 12.03% 85.60% $228,369 3.36% 91.83% $252,243 10.45% 111.88%
$34,325 18.31% 74.06% 940,726 18.65% 106.52% $40,821 0.23% 106.99% $45,808 12.22% 132.29%
$231,554 13.31% 66.86% 9261,673 13.01% 88.57% $269,190 2.87% 93.99% 5298,051 10.72% 114.78%
'Excluding Medical **Including Cont Ed Centers ***Including COOp Nursing ****Including San Juan Center

History 24-Dec-90
TABLE I--Current Dollar Expenditures
in thousands of dollars
UNIVERSITY OF UTAH
HISTORY OF ENROLLMENT AND BUDGET CHANGES, USHE
1985-86 1986-87 1987-88
Actual I-Yr Inc 9-Yr Inc Actual 1-Yr Inc 10-Yr Inc Actual 1-Yr Inc 11-Yr Inc
Page 3
1988-89
Actual 1-Yr Inc I2-Yr Inc
Annualized FTE' 19,153 -1.50% 0.90% 18,892 -1.36% -0.470i 18,896 0.02% -0.45% 18.622 -1.45% -1.90%
Ed & Gen + Coop Nursing $120,289 8.52% 117.26% $118,810 -1.23% 114.59% 9122,907 3.45% 121.99% 9126,765 3.14: 128.96:
Medical Programs (Incl 5th Path) $17.351 11.80% 161.16% 116,650 -4.04% 150.61% $17,357 4.25% 161.26% $17,715 2.06% 166.65%
All Other (Including KUE0) $7,623 9.77% 214.54% $7,798 2.29% 221.75% $8,161 4.66% 236.75% $9,009 10.39% 271.75%
Total $145,262 8.97% 125.45% 9143,258 -1.38% 122.33% $148,426 3.61% 130.35% 9153,489 3.41% 138.21%
uTAH STATE UNIVERSITY
Annualized FTE'" 10,306 -3.35% 8.28% 10,353 0.46% 8.77% 10,397 0.42% 9.24% 10,631 2.25% 11.69%
Ed & Gen + CE Centers + Coop M Ed $57,471 9.27% 125.41% $56,432 -1.81% 121.33% $59,511 5.46% 133.41% $62,206 4.53% 143.98%
Agricultural Programs 915,266 5.93% 108.744 $15,177 -0.58% 107.53% $15.506 2.17% 112.03% $16,347 5.42% 123.53%
All Other (Including Prod Ctr) $5,088 12.41% 235.26% $4,986 -2.00% 228.56% $4,986 0.00% 228.56% 95,729 14.90% 277.50%
Total $77,825 8.80% 126.72% $76,595 -1.58% 123.13% $80,003 4.45% 133.06: 984,282 5.35% 145.53%
WEBER STATE UNIVERSITY
Annualized FTE*** 8,579 1.32% 12.38% 9,027 5.22% 18.25% 9,279 2.79% 21.55% 9,475 2.11% 24.12%
Ed & Gen + Ccop Nursing $37,977 9.82% 134.58% $37,618 -0.94% 132.36% 139,714 5.57% 145.31% 140,123 1.03% 147.84%
All Other $266 33.26% 76.90% $630 136.29% 318.00% $619 -1.73% 310.76% 9431 -30.29% 186.35%
Total $38,243 9.95% 134.05% 938,248 0.01% 134.08% 940,333 5.45% 146.84% 140,554 0.55% 148.19%
SOUTHERN UTAH UNIVERSITY
Annualized FTE 2,361 -2.03% 30.66% 2,685 13.72% 48.59% 2,779 3.50% 53.79% 2,894 4.14% 60.15%
Ed & Gen 4. Coop M Ed $10,945 9.59% 144.21% $10,973 0.25% 144.82% $11,567 5.42% 158.09% $12,061 4.27% 169.10%
All Other 965 9.50% 102.47% 9224 243.62% 595.72% 1158 -29.60% 389.75% 9188 19.02% 482.92%
Total $11,011 9.59% 143.91% 911,197 1.69% 148.04% 911,725 4.72% 159.744 912,249 4.47% 171.34%
SNOw COLLEGE
Annualized FTE 1,142 1.06% 34.51% 1,265 10.77% 49.00% 1,244 -1.66% 46.53% 1,375 10.53: 61.96%
Education and General 16,105 11.92% 192.91% $5,814 -4.76% 178.96,1 $6,444 10.82% 209.15% 16,378 -1.01% 206.02%
All Other $26 20.70% -48.65% $254 860.50% 393.18% $199 -21.80% 285.65% 9210 5.89% 308.36:
Total 1, 131 11.95% 187.08% 96,068 -1.03% 184.13% 96,642 9.46% 211.00% $6,589 -0.81% 208.49%
DIXIE COLLEGE
Annualized FTE 1,646 10.99% 43.13% 1,843 11.97% 60.26% 1,812 -1.68% 57.57% 1,802 -0.55% 56.70%
Education and General $6,232 14.63% 158.81% 96,596 5.84% 173.92% $6,745 2.26% 180.12% 17,468 10.71% 210 11%
All Other (Incl ZP Amp) $66 -6.63% -0.45% 9127 91.54% 90.69% $251 98.08% 277.71% 9221 -12.00% 232.38%
Total 96,298 14.36% 154.53% 96,723 6.74% 171.69% 56,996 4.07% 182.74% 97.688 9.89% 210.71%
COLLEGE OF EASTERN UTAH
Annualized FTE"" 1,141 -1.81% 110.13% 1,309 14.72% 141.07% 1,281 -2.14% 135.91% 1,354 5.70% 149.36%
Ed & Gen + San Juan Ctr $5,294 21.87% 225.22% $5,234 -1.14% 221.52% $5,521 5.48% 239.15% $5,727 3.73% 251.80%
All Other $96 -0.60% -16.36% $371 288.00% 224.54% 1486 30.88% 324.75% $466 -4.08% 307.43%
Total $5,390 21.38% 209.36% 15,605 3.99% 221.72% $6,007 7.16% 244.77% 16,193 3.10% 255.45%
UTAH VALLEY COMMUNITY COLLEGE
Annualized FTE 4,899 -0.97% 70.05% 5,206 6.27% 80.70% 5,302 1.84% 84.03% 5,329 0.51% 84.97%
Education and General 115,400 12.41% 214.14% $15,946 3.55% 225.29% 916,393 2.80% 234.39% 117,463 6.53% 256.22:
All Other $50 6.13% 149.27% $560 1016.44% 2682.91% 9602 7.36% 2887.74% 6425 -29.32% 2011.82%
Total 915,450 12.39% 213.88% 916,507 6.84% 235.34% $16,995 2.95% 245.25% $17,889 5.26% 263.41%
SALT LAKE COMMUNITY COLLEGE
Annualized FTE 5,720 2.82% 44.30% 5,845 2.19% 47.45% 6,073 3.90% 53.20% 6,530 7.53% 64.73%
Education and General $17,817 16.43% 174.48% $18,051 1.31% 178.07% $18,053 0.01% 178.11% $21,259 17.76% 227.49%
All Other (Excl Sk Ctr) $65 3.86% 279.41% $77 19.22% 352.35% $80 3.64% 368.82% $1,005 1161.5% 5814.1%
Total (Excl Sk Ctr) $17,882 16.38% 174.75% $18,128 1.37% 178.53% $18,133 0.03% 178.61% $22,264 22.78% 242.08%
SEIR A40 STATEWIDE
SBR Administration $1,399 22.50% 132.74% 91,329 -5.02% 121.05% $1,384 4.15% 130.22: $1,347 -2.67: 124.06%
Other Statewide $4,864 79.69% 532.31% $1,787 -63.26% 132.29% $1,881 5.26% 144.50% $1,900 1.00% 146.95%
Total 56,263 62.72% 357.03% $3,116 -50.25% 127.36% $3,265 4.79% 138.24% 93,247 -0.56% 136.91%
TOTAL USHE
Annualized FTE 54,947 -0.58% 16.09% 56,425 2.69% 19.22% 57,063 1.13% 20.56% 58,012 1.66% 22.57%
Educ & Gen Other Inst $277.530 10.03% 133.13% 1275,474 -0.74% 131.40% $286,855 4.13% 140.96% $299.449 4.39% 151.54%
All Other Lire Items $52,225 14.01% 164.83% $49,969 -4.32% 153.38% $51,669 3.40% 162.00% 954,994 6.43% 178.86%
Total 9329,756 10.64% 137.63% $325,443 -1.31% 134.52% $338,524 4.02% 143.95% $354,443 4.70% 155.42%
*Excluding MediCel **Including Cont Ed Centers **Including Coop Nursing ***"Including San Juan Center
24 6 4
1
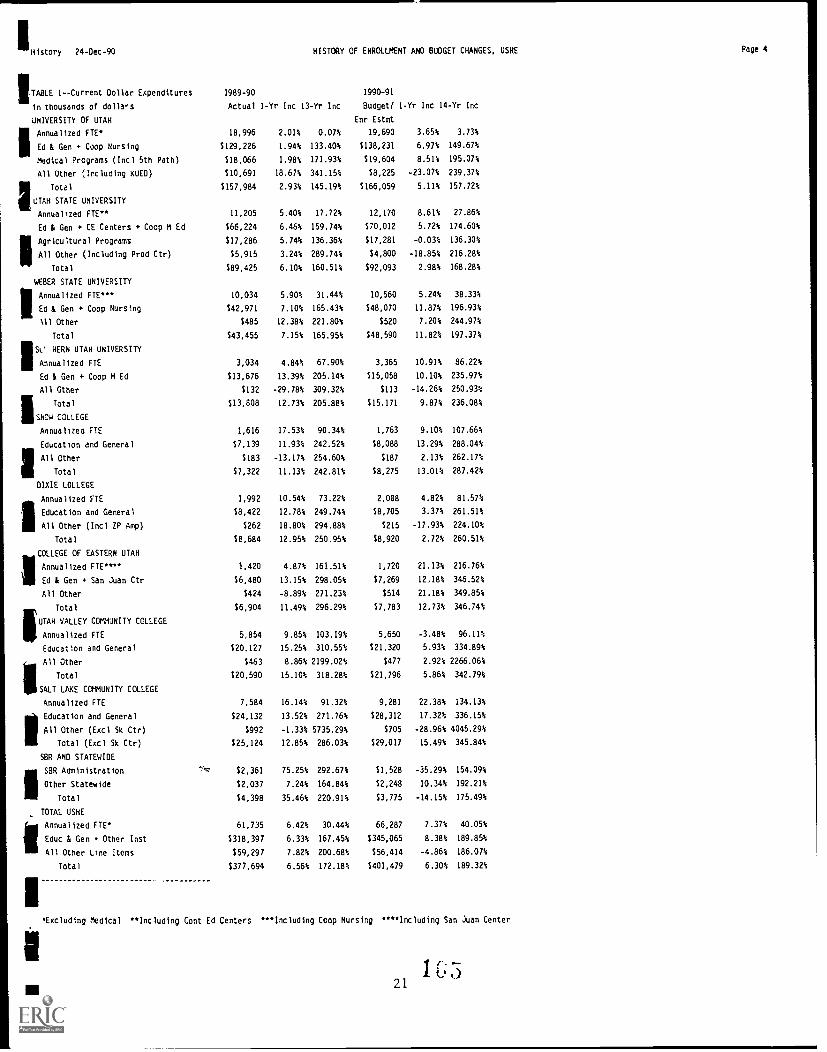
illHistory 24-Dec-90 HISTORY OF ENROLLMENT ANO BUDGET CHANGES, USHE Page 4
1989-90
Actual 1-Yr Inc 13-Yr Inc
1990-91
Budget/ 1-Yr Inc 14-Yr Inc
Enr Estmt
18,996 2.01% 0.07% 19,690 3.65% 3.73%
$129,226 1.94% 133.40% $138,231 6.97% 149.67%
918,066 1.98% 171.93% $19,604 8.51% 195.07%
$10,691 18.67% 341.15% $8,225 -23.07% 239.37%
5157,984 2.93% 145.19% $166,059 5.11% 157.72%
11,205 5.40% 17.72% 12,170 8.61% 27.86%
$66,224 6.46% 159.74% $70,012 5.72% 174.60%
5.74% 136.36% 917,281 -0.03% 136.30%
$5,915 3.24% 289.74% $4,800 -18.85% 216.28%
989.425 6.10% 160.51% 992,093 2.98% 168.28%
10,034 5.90% 31.44% 10,560 5.24% 38.33%
$42,971 7.10% 165.43% $48,070 11.87% 196.93%
$485 12.38% 221.80% 9520 7.20% 244.97%
$43,455 7.15% 165.95% 948,590 11.82% 197.37%
3,034 4.84% 67.90% 3,365 10.91% 86.22%
$13,676 13.39% 205.14% $15,058 10.10% 235.97%
9132 -29.78% 309.32% $113 -14.26% 250.93%
$13,808 12.73% 205.88% 915,171 9.87% 236.08%
1,616 17.53% 90.34% 1,763 9.10% 107.66%
$7,139 11.93% 242.52% $8,088 13.29% 288.04%
$183 -13.17% 254.60% $187 2.13% 262.17%
97,322 11.13% 242.81% 98,275 13.01% 287.42%
1,992 10.54% 73.22% 2,088 4.82% 81.57%
$8,422 12.78% 249.74% $8,705 3.37% 261.51%
$262 18.80% 294.88% $215 -17.93% 224.10%
58,684 12.95% 250.95% $8,920 2.72% 260.51%
1,420 4.87% 161.51% 1,720 21.13% 216.764
$6,480 13.15% 298.05% $7,269 12.18% 346.52%
$424 -8.89% 271.23% $514 21.18% 349.85%
11.4911 296.29% 97,783 12.73% 346.74%
5,854 9.85% 103.19% 5,650 -3.48% 96.11%
$20,127 15.25% 310.55% $21,320 5.93% 334.89%
9463 8.86% 2199.02% $477 2.92% 2266.06%
$20,590 15.10% 318.28% 921.796 5.86% 342.79%
7,584 16.14% 91.32% 9,281 22.38% 134.13%
924,132 13.52% 271.76% $28,312 17.32% 336.15%
$992 -1.33% 5735.29% $705 -28.96% 4045.29%
$25,124 12.85% 286.03% $29,017 15.49% 345.84%
$2,361 75.25% 292.67% 91,528 -35.29% 154.09%
$2,037 7.24% 164.84% 92,248 10.34% 192.21%
$4,398 35.46% 220.91% $3,775 -14.15% 175.49%
61,735 6.42% 30.44% 66,287 7.37% 40.05%
$318,397 6.33% 167.45% $345,065 8.38% 189.85%
959,297 7.82% 200.68% $56,414 -4.86% 186.07%
5377,694 6.56% 172.18% $401,479 6.30% 189.32%
I,TMLE 1--Current Dollar Expenditures
in thousands of dollars
UNIVERSITY OF UTAH
IAnnualized FTE
Ed & Gen Coop Nursing
medical Programs (Incl 5th Path)
All Otner (Including KUED)
111
Total
UTAH STATE UNIVERSITY
Annualized FTE*.
Ed & Gen + CE Centers + Coop M Ed
II/Agricultural Programs 917,286
All Other (Including Prod Ctr)
Total
WEBER STATE UNIVERSITY
IAnnualized FTE***
Ed & Gen + Coop Nursing
111 Other
Total
IIISC HERN UTAH UNIVERSITY
Annualized FTE
Ed & Gen + Coop M Ed
All Other
III
Total
SNOw COLLEGE
Annualized FIE
Education and General
111
All Other
Total
DIXIE COLLEGE
111
Annualized FTE
Education and General
All Other (Incl ZP Amp)
Total
COLLEGE OF EASTERN UTAH
111
Annualized FTE++..
Ed & Gen + San Juan Ctr
All Other
Total III$6,904
UTAH VALLEY COMMUNITY COLLEGE
Annualized FTE
Education and General
1/1
All Other
Total
SALT LAKE COMMUNITY COLLEGE
Annualized FTE
III
Education and General
All Other (Excl Sk Ctr)
Total (Excl Sk Ctr)
SBR AND STATEWIDE
IIISBR Administration
Other Statewide
Total
TOTAL USHE
gAnnualized FTE.
Educ & Gen Other Inst
All Other Line Items
Total
'Excluding Medical **Including Cont Ed Centers ***Including Coop Nursing ***Including San Juan Center

History 24-Dec-90
TABLE 2--CONSTANT Dollar Expenditures
in thousands of dollars
UNIVERSITY OF UTAH
1976-77
Actual
HISTORY OF ENROLLMENT AND BUDGET CHANGES, USHE
1977-78 1978-79 1979-80
Actual 1-Yr Inc Actual 1-Yr Inc 2-Yr Inc Actual 1-Yr Inc 3-Yr Inc
Page 5
1980-81
Actual 1-Yr Inc 4-Yr Inc
Annualized FIE* 18,982 18,699 -1.49% 17,975 -3.87% -5.31% 18,430 2.53% -2.91% 18,768 1.83% -1.13%
Ed & Gen + Coop Nursing $127,476 $131,099 2.84% $132,186 0.83% 3.69% $124,931 -5.49% -2.00 $120,463 -3.58% -5.50%
Medical Programs (Ind 5th Path) $15,296 $15,761 3.044 $15,547 -1.36% 1.64% $15,592 0.29% 1.93% $15,274 -2.04% -0.15%
All Other (Including KUED) $5,580 $7,876 41.16% $7,297 -7.36% 30.77% $6,024 -17.44% 7.97% $5,318 -11.73% -4.69%
Total $148,352 $154,736 4.30% 5155,029 0.19% 4.50% 5146,548 -5.47% -1.22% 5141,055 -3.75% -4.92%
UTAH STATE UNIVERSITY
Annualized FTE** 9,518 9,729 2.22% 9,156 -5.89% -3.80% 9,562 4.43% 0.46% 10,359 8.34% 8.84%
Ed & Gen + CE Centers + Coop M Ed $58,702 $61,170 4.20% $61,796 1.02% 5.27% $59,349 -3.96% 1.10% $58,092 -2.12: -1.04%
Agricultural Programs $16,838 $17,904 6.33% $17,881 -0.13% 6.19% $17,422 -2.56% 3.47% 516,616 -4.63% -1.32%
All Other (Including Prod Ctr) $3,494 $3,536 1.19% $3,708 4.88% 6.13% $3,824 3.11% 9.43% $3,367 -11.96% -3.66%
Total $79,034 $82,609 4.52% 583,386 0.94% 5.51% $80,596 -3.35% 1.98% $78,074 -3.13% -1.21%
WEBER STATE UNIVERSITY
Annualized FTE*** 7,634 7,449 -2.42% 7,480 0.42% -2.02% 8,116 8.501; 6.31% 8,919 9.89% 16.83%
Ed & Gen + Coop Nursing $37,174 $39,317 5.48% $39,928 1.55% 7.12% $38,004 -4.82% 1.96% $38,731 1.91% 3.91%
All Other $347 $326 -5.89% $295 -9.64% -14.96% $258 -12.55% -25.63% $255 -1.08% -26.43%
Total $37,621 $39,644 5.38% 540,223 1.46% 6.92% $38,262 -4.88% 1.70% $38,986 1.89% 3.63%
SOUTHERN UTAH UNIVERSITY
Annualized FTE 1,807 1,750 -3.15% 1,719 -1.77% -4.87% 1,853 7.80% 2.55% 1,948 5.13% 7.80%
Ed & Gen + Coop )1 Ed $10,319 $10,945 6.06% $10,970 0.23% 6.30% $10,664 -2.79% 3.34% $10,595 -0.65% 2.67%
All Other $74 $410 453.67% $72 -82.40% -2.55% $101 39.67% 36.11% $61 -39.22% -17.27%
Total 510,394 $11,355 9.25% 511,042 -2.76% 6.24% 510,765 -2.51% 3.57% $10,656 -1.01% 2.53%
SNOW COLLEGE
Annualized FTE 849 915 7.77% 897 -1.97% 5.659; 1,002 11.71% 18.02% 1,108 10.58% 30.51%
Education and General $4,799 $5,232 9.03% $5,619 7.39% 17.08% $5,676 1.02% 18.28% $5,681 0.09% 18.39%
All Other $119 $44 -63.26% $38 -13.27% -68.13% $38 1.67% -67.60% $46 19.58% -61.26%
Total $4,917 $5,276 7.29% $5,657 7.22% 15.03% $5,714 1.02% 16.20% $5,727 0.23% 16.47%
DIXIE COLLEGE
Annualized FTE 1,150 1,148 -0.17% 1,092 -4.88% -5.04% 1,141 4.49% -0.78% 1,325 16.13% 15.22%
Education and General )5,544 $5,819 4.96% $5,956 2.34% 7.42% $5,782 -2.92% 4.29% $5,939 2.72% 7.12%
All Other (Incl ZP Amp) $153 $24 -84.47% $23 -1.60% -84.72% $56 140.32% -63.29% $62 9.67% -59.73%
Total $5,697 $5,843 2.56% $5,979 2.32% 4.95% $5,838 -2.36% 2.47% $6,001 2.79% 5.33%
COLLEGE OF EASTERN UTAH
Annualized FTE**** 543 649 19.52% 660 1.69% 21.55% 625 -5.30% 15.10% 753 20.48% 38.67%
Ed & Gen + San Juan Ctr $3,748 $4,152 10.78% $4,462 7.47% 19.05% $4,467 0.10% 19.17% 54,455 -0.27% 18.86%
All Other $263 $150 -43.15% $135 -10.12% -48.90% $141 4.83% -46.44% $142 0.53% -46.15%
Total $4,011 $4,302 7.24% $4.597 6.86% 14.59% $4,608 0.24% 14.87% 54,596 -0.24% 14.59%
UTAH VALLEY COMMUNITY COLLEGE
Annualized FTE 2,881 2,863 -0.62% 2,897 1.19% 0.56% 3,250 12.19% 12.81% 3,840 18.15% 33.29%
Education and General $11,287 $12,506 10.80% $13,990 11.87% 23.95% $13,038 -6.81% 15.51% $13,441 3.09% 19.08%
All Other $46 $292 528.71% $69 -76.44% 48.12% $75 8.87% 61.26% $68 -9.67% 45.67%
Total $11,333 $12,797 12.91% $14,059 9.86% 24.05% 513,113 -6.73% 15.70% 513,509 3.02% 19.19%
SALT LAKE COMMUNITY COLLEGE
Annualized FIE 3,964 3,974 0.25% 3,814 -4.03% -3.78% 3,870 1.47% -2.37% 4,155 7.36% 4.82%
Education and General $14,946 $15,587 4.29% $16,118 3.40% 7.84% $14,881 -7.67% -0.43% $14,861 -0.14% -0.57%
All Other (Excl Sk Ctr) $39 $71 81.93% $86 20.50% 119.23% $90 4.42% 128.93% $81 -9.37% 107.49%
Total (Excl Sic Ctr) $14,985 $15,658 4.49% $16,204 3.48% 8.13% $14,971 -7.61% -0 :9% $14,942 -0.19% -0.29%
SBR AND STATEWIDE
SBR Administration $1,384 $1,534 10.82% $1,556 1.43% 12.41% $1,472 -5.39% 6.35% 5I,522 3.42% 9.99%
Other Statewide $1,771 $3,276 84.95% $2,317 -29.28% 30.79% $2,361 1.90% 33.28% $2,236 -5.27% 26.25%
Total $3,155 $4,810 52.43% 53,872 -19.49% 22.73% $3,833 -1.03% 21.47% 52,758 -1.93% 19.12%
TOTAL USHE
Annuallad 'YE* 47,330 47,178 -0.32% 45,690 -3.15% -3.47% 47,849 4.73% 1.10% 51,174 6.95% 8.12%
Educ & Gen Other Inst $274,096 $285,827 4.28% $291,025 1.82% 6.18% $276,792 -4.89% 0.98% $272,258 -1.64% -0.67%
All Other One Items $45,405 $51.203 12.77% 549,022 -4.26% 7.97% $47,454 -3.20% 4.51% $45,047 -5.07% -0.79%
Total $319,501 $337,030 5.49% 5340,047 0.90% 6.43% $324,247 -4.65% 1.49% 5317,305 -2.14% -0.69%
*Excluding Medical **Including Cont Ed Centers ***Including Coop Nursing ****Including San Juan Center
22
1
1

History 24-Dec-90 HISTORY Of ENROLLMENT AND BUDGET CHANGES, USHE
111 TABLE 2--CONSTANT Dollar Expenditures
in thousands of dollars
UNIVERSITY OF UTAH
III Annualized FTE*
Ed & Gen + Coop Nursing
Medical Programs (Incl 5th Path)
. All Other (Including KUED)
III Total
UTAH STATE UNIVERSITY
Annualized FTE
Ed & Gen + CE Centers + Coop M Ed
111
Agricultural Programs
All Other (Including Prod Ctr)
Total
III
WEBER STATE UNIVERSITY
Annualized FTE***
Ed & Gen . Coop Nursing
All Other
IIITotal
SOUTHERN UTAH UNIVERSITY
Annualized FTE
Ed & Gen + Coop M Ed
All Other
Total
litSNOW COLLEGE
Annualized FTE
III
Elucation and General
All Other
Total
DIXIE COLLEGE
Education and General
Annualized FTE
111 All Other (Ind ZP Amp)
Total
III
COLLEGE OF EASTERN UTAH
Annualized FTE"**
Ed & Gen San Juan Ctr
All Other
Total
UTAH VALLEY COMM' tTY COLLEGE
Annualized FTE
Education and General
All Otner
Total
SALT LAKE COMMUNITY, COLLEGE
Annualized FTE
III
Education and General
All Other (Excl Sk Ctr)
Total (Excl Sk Ctr)
589 AND STATEWIDE
III
SBR Administration
Other Statewide,
Total
TOTAL USHE
I Annualized FTE*
Educ & Gen t Other Inst
All Other Line Items
Total
Page 6
1981-82
Actual 1-Yr Inc 5-Yr Inc
1982-83
Actual 1-Yr Inc 6-Yr Inc
1983-84
Actual 1-Yr Inc 7-Yr Inc
1904-85
Actual 1-Yr Inc 8-Yr Inc
18,833 0.359; -0.78% 19,454 3.30% 2.49% 19,492 0.20% 2.69% 19,445 -0.24% 2.44%
$124,292 3.18% -2.50% $135,530 9.04% 6.32% $134,119 -1.04% 5.21% $141,050 5.17% 10.65%
$17,360 13.66% 13.49% $19,015 9.53% 24.31% $18,617 -2.09% 21.71% $19,748 6.08% 29.10%
$6,274 17.99% 12.45% $8,606 37.16% 54.23% $8,561 -0.52% 53.43% $8,837 3.22% 58.38%
$147,926 4.87% -0.29% $163,151 10.29% 9.98% $161,297 -1.14% 8.73% $169,636 5.17% 14.35%
10,365 n (169, /Log% 10,553 1.81% 10.87% 10,989 4.13% 15.45% 10,663 -2.97k 12.03%
$59.732 2.82% 1.75% $63,284 5.95% 7.80% $62,596 -1.09% 6.63% S66,929 6.92% 14.01%
$17,342 4.37% 3.00% 517,588 1.41% 4.45% $17,161 -2.42% 1.92% $18,340 6.87% 8.92%
63,923 16.54% 12.28% 55,766 46.98% 65.02% 65,130 -11.03% 46.82% $5,760 12.28% 64.85%
$80,998 3.74% 2.48% 686,638 6.96% 9.62% $84,887 -2.02% 7.41% 691,029 7.24% 15.18%
8,924 0.06% 16.90% 9,010 0.96% 18.02% 8,822 -2.09% 15.56% 8,467 -4.02% 10.91%
$39,027 0.76% 4.70% 642,675 9.35% 14.49% $41,594 -2.53% 11.59% $44,007 5.80% 18.06%
$213 -16.55% -38.61% $290 36.01% -16.50% $276 -4.78% -20.48% 6254 -7.73% -26.63%
$39,240 0.65% 4.30% 542,964 9.49% 14.20% 641,870 -2.55% 11.29% 644,262 5.71% 17.65%
1.922 -1.33% 6.36% 2,173 13.06% 20.25% 2,315 6.53% 28.11% 2,410 4.10% 33.37%
$10,849 2.40% 5.14% $11,755 8.35% 13.92% $11,733 -0.19% 13.70% $12,710 8.32% 23.16%
$78 27.41% 5.40% 678 0.04% 5.44% $74 -5.57% -0.43% $76 2.64% 2.20%
$10,928 2.54% 5.14% 511,834 8.29% 13.86% $11,807 -0.23% 13.60% $12,786 8.29% 23.01%
1,132 2.17% 33.33% 1,025 -9.45% 20.73% 1,146 11.80% 34.98% 1,130 -1.40% 33.103;
$5,924 4.27% 23.44% $6,165 4.08% 28.47% $6,629 7.52% 38.13% $6,942 4.72% 44.65%
$36 -22.72% -70.06% $30 -14.99% -74.55% $30 -1.76% -75.00% $28 -5.97% -76.49%
$5.959 4.05% 21.19% $6,195 3.96% 25.99% 56,658 7.47% 35.40% 56,969 4.67% 41.73%
1,380 4.15% 20.00% 1,436 4.06% 24.87% 1,449 0.91% 26.00% 1.483 2.35% 26.96%
$6,130 3.20% 10.56% 56,547 6.82% 18.09% $6,465 -1.26% 16.61% 56,918 7.01% 24.78%
$73 18.90% -52.12% $77 5.02% -49.72% $75 -2.66% -51.06% $90 20.41% -41.07%
56,203 3.37% 8.88% $6,624 6.80% 16.27% $6,540 -1.28% 14.79% $7,008 7.17% 23.02%
829 10.09% 52.67% 922 11.22% 69.80% 1,065 15.51% 96.13% 1,162 9.11% 114.00%
$4,656 4.51% 24.22% 55,011 7.64% 33.71% $5,161 2.98% 37.70% 65,528 7.12% 47.50%
5122 -14.09% -53.74% $130 7.07% -50.47% $121 -6.84% -53.86% $122 0.79% -53.49%
$4,778 3.94% 19.10% $5,142 7.63% 28.19% $5,282 2.73% 31.69% $5,651 6.97% 40.87%
4,349 13.26% 50.95% 5,035 15.77% 74.77% 5,272 4.71% 82.99% 4.947 -6.16% 71.71%
$14,656 9.04% 29.85% $15,621 6.58% 38.39% $15,854 1.49% 40.46% $17,435 9.97% 54.46%
$55 -3.34% 40.81% $62 -4.74% 34.13% $60 -3.87% 28.95% 160 0.67% 29.81%
514,721 8,98% 29.89% 515,683 6.53% 38.38% $15,914 1.47% 40.41% $17,495 9.93% 54.36%
.
4,573 10.06% 15.36% 5,339 16.75% 34.69% 5,518 3.35% 39.20% 5,563 0.82% 40.34%
$15,891 6.93% 6.32% $16,760 5.47% 12.14% $17,937 7.03% 20.01% $19,474 8.57% 30.30%
$79 -3.28% 100.68% $81 2.61% 105.91% S78 -2.84% 100.07% $79 0.91% 101.90%
$15,969 6.88% 6.57% $16,840 5.45% 12.38% $18,015 6.98% 20.22% $19,553 8.53% 30.48%
$1,301 -14.53% -5.99% 51,519 16.71% 9.72% $1,426 -6.10% 3.03% $1,453 1.92% 5.01%
$2,065 -7.67% 16.57% $2,674 29.50% 50.96% $2,388 -10.67% 34.85% S3,445 44.22% 94.49%
53,366 -10.45% 6.67% $4,192 24.56% 32.87% $3,815 -9.01% 20.89% 64,898 28.41% 55.24%
52,306 2.21% 10.51% 54,946 5.05% 16.09% 56,068 2.04% 18.46% 55,270 -1.42% 16.78%
$281,156 3.27% 2.58% $303,349 7.89% 10.67% $'02,088 -0.42% 10.21% $320,992 6.26% 17.11%
$48.931 8.62% 7.77% $55,915 14.27% 23.15% $53,998 -3.43% 18.92% $58,294 7.96% 28.39%
5330,087 4.03% 3.31% $359,264 8.84% 12.45% $356,085 -0.88% 11.45% $379,286 6.52% 18.71%
*Excluding Medical **Including Cont Ed Centers ***Including Coop Nursing *.""'Including San Juan Center
2 3 ILG7

History 24-Dec-90
TABLE 2--CONSTANT Dollar Expendit_res
in thousands of dollars
UNIVERSITY OF UTAH
HISTORY Of ENRULMENT AND BUDGET CHANGES, USHE
1985-86 1986-87 1987-88
Actual 1-Yr Inc 9-Yr Inc Actual 1-Yr Inc 10-Yr Inc Actual 1-Yr Inc 11-Yr Inc
Page 7
1988-89
Actual 1-Yr Inc 12-Yr Inc
Annualized FTE* 19.153 -1.50% 0.90% 18,892 -1.36% -0.47% 18,896 0.02% -0.45% 18,622 -1.45% -1.90%
Ed & Gen + Coop Nursing 1147,472 4.55% 15.69% $144,078 -2.30% 13.02% $142,717 -0.94% 11.96% $140,966 -1.23% 10.58%
Medical Programs (Incl 5th Path) $21,272 7.71% 39.06% 120,190 -5.08% 31.99% $20,155 -0.18% 31.76% $19,700 -2.26% 28.79%
All Other (Including KUED) $9,346 5.75% 67.49% $9,456 1.18% 69.46% $9,476 0.22% 69.83% $10,019 5.72% 79.55%
Total $178,089 4.98% 20.04% $173,724 -2.45% 17.10% $172,349 -0.79% 16.18% 1170,685 -0.97% 15.05%
UTAH STATE UNIVERSITY
Annualized FTE" 10.306 -3.35% 8.28%. 10,353 0.46% 8.77% 10,397 0.42% 9.24% 10,631 2.25% 11.69%
Ed & Gen + CE Centers + Coop M Ed 570.458 5.27% 20.03% $68,433 -2.87% 16.58% 169,103 0.98% 17.72% $69,175 0.10% 17.84%
Agricultural Programs $18,715 2.05% 11.15% 118,404 -1.66% 9.30% $18,005 -2.17% 6.93% $18,178 0.96% 7.96%
All Other (Including Prod Ctr) $6,238 8.29% 78.52% 16,047 -3.07% 73.05% $5,790 -4.25% 65.70% $6,371 10.03% 82.33%
Total $95,412 4.82% 20.72% $92,884 -2.65% 17.52% $92,898 0.02% 17.54% $93,724 0.89% 18.59%
WEBER STATE UNIVERSITY
Annualized FTE*" 8,579 1.32% 12.38% 9,027 5.22% 18.25% 9,279 2.79% 21.55% 9,475 2.11% 24.12%
Ed & Gen + Coop Nursing 146,559 5.80% 24.91% 145,618 -2.02% 22.39% 146,115 1.09% 23.72% 144,618 -3.25% 19.70%
All Other 5327 28.38% -5.80% $763 133.72% 120.16% $718 -5.90% 107.16% $480 -33.24% 38.30%
Total 146,886 5.93% 24.63% $46,382 -1.07% 23.29% $46,834 0.97% 24.49% $45,098 -3.71% 19.87%
SOUTHERN UTAH UNIVERSITY
Annualized FIT 2,361 -2.03% 30.66% 2,685 13.72% 48.59% 2,779 3.50% 53.79% 2,894 4.14: 60.15%
Ed & Gen + Coop M Ed 113,419 5.58% 30.03% $13,306 -0.84% 28.95% $13,432 0.94% 30.16% $13,412 -0.15% 29.97%
All Other $80 5.49% 7.81% $272 239.89% 266.43% 1183 -32.59% 147.00% $209 13.99% 181.54%
Total 113,499 5.58% 29.88% $13,578 0.59% 30.64% $13,615 0.27% 30.99% $13,621 0.04% 31.05%
SNOW COLLEGE
Annualized FTE 1,142 1.06% 34.51% 1,265 10.77% 49.00% 1,244 -1.66% 46.53% 1,375 10.53% 61.96%
Education and General $7,485 7.82% 55.97% $7,051 -5.80% 46.93% $7,482 6.12% 55.92% 17,093 -5.20% 47.80%
Al' Other $32 16.28% -72.66% $308 850.07% 159.76% $231 -25.12% 94.50% $234 1.41% 97.23%
Total $7,517 7.86% 52.86% 17,359 -2.10% 49.65% $7,713 4.81% 56.85% $7,327 -5.01% 49.00%
DIXIE COLLEGE
Annualized FTE 1,646 10.99% 43.13% 1,843 11.97% 60.26% 1,812 -1.68% 57.57% 1,802 -0.55% 56.70%
Education and General $7,640 10.44% 37.81% $7,999 4.69% 44.27% $7,832 -2.08% 41.27% $8,304 6.02% 49.78%
All Other (Incl ZP Amp) 181 -10.05% -46.99% $154 89.46% 0.43% $291 89.67% 90.49; 5245 -15.73% 60.54%
Total $7,721 10.18% 35.53% $8,152 5.58% 43.10% $8,124 -0.35% 42.59% $8,550 5.24% 50.07%
COLLEGE OF EASTERN UTAH
Annuallzed FTE**** 1,141 -1.81% 110.13% 1,309 14.72% 141.07% 1,281 -2.14% 135.91% 1,354 5.70% 149.36%
Ed & Gen + San Juan Ctr 16,491 17.41% 73.17% $6,347 -2.21% 69.34% $6,411 1.00% 71.05% $6,368 -0.66% 69.92%
All Other 5117 -4.23% -55.46% $450 283.79% 70.93: $564 25.32% 114.21% 5518 -8.14% 96.79%
Total $6,608 16.94% 64.73% $6,797 2.86% 69.45% $6,975 2.61% 73.88% 56,886 -1.27% 71.68%
UTAH VALLEY COMMUNITY COLLEGE
Annualized FTE 4,899 -0.97% 70.05% 5,206 6.27% 80.70% 5,302 1.84% 84.03% 5,329 0.51% 84.97%
Education and General 118,880 8.29% 67.27% $19,338 2.42% 71.33% $19,035 -1.56% 68.65% $19,420 2.02% 72.05%
All Other $62 2.25% 32.73% 1880 1004.31% 1365.75% 5699 2.80% 1406.81% $473 -32.31% 919.98%
Total 518.942 8.27% 67.13% 120,017 5.68% 76.62% 519,734 -1.42% 74.12% $19,893 0.80% 75.52%
SALT LAKE COMMUNITY COLLEGE
Annualized FTE 5,720 2.82% 44.30% 5,845 2.19; 47.45% 6,073 3.90% 53.20% 6,530 7.53% 64.73%
Education and General 121.844 12.17% 46.15% 521,889 0.21% 46.46% 120,963 -4.23% 40.26% 123,640 12.77% 58.17%
All Other (Excl Sk Ctr) $79 0.06% 102.03% $93 1/.93% 138.25% $93 -0.76% 136.44% 11,118 1108.09% 2756.45%
Total (Excl Sk Ctr) $21,923 12.12% 46.30% $21,983 0.27% 46.70% 121,055 -4.22% 40.51% $24,758 17.59% 65.22%
SBR AND STATEWIDE
SBR Administration $1,715 18.02% 23.93% $1,612 -6.05% 16.43% $1,607 -0.28% 16.11% $1,498 -6.79% 8.22%
Other Statewide $5,963 73.12% 236.69% $2,167 -63.66% 22.34% $2,184 0.79% 23.31% $2,113 -3.28k 19.27%
Total 57,679 56.77% 143.36% 53,778 -50.79% 19.75% $3,791 0.34% 20.15% $3,610 -4.77% 14.42%
TOTAL USHE
Annualized FTE* 54,947 -0.58% 16.09% 56,425 2.69% 19.22% 57,063 1.13% 20.56% 58,012 1.66% 22.57%
Educ & Gen + Other Inst $340,248 6.00% 24.13% $334,059 -1.82% 21.88% $333,090 -0.29% 21.52% $332,997 -0.03% 21.49%
All Other Line Items $64,027 9.84% 41.01% 560,596 -5.36% 33.46% 159,997 -0.99% 32.14% $61,155 1.93% 34.69%
Total 5404.275 6.59% 26.53% 1394,655 -2.38% 23.52% $393,087 -0.40% 23.03% 5394,152 0.27% 23.37%
Excluding Medical **Including Cont Ed Centers ***Including Coop Nursing ""Including San Juan Center
24 _1 3

History 24-Dec-90 HISTCRY OF ENROLLMENT AND BUDGET CHANGES, USHE
111TABLE 2--CONSTANT Dollar Expenditures
in thousands of dollars
UNIVERSITY OF UTAH
111
Annualized FTE*
Ed & Gen + Coop Nursing
Medical Programs (Incl 5th Path)
. All Other (Including KUED)
111
Total
UTAH STATE UNIVERSITY
Annualized FTE**
Ed & Gen CE Centers Coop M Ed
IIIAgricultural Programs
All Other (Including Prod Ctr)
Total
- WEBER STATE UNIVERSITY
IIIAnnualized FTE***
Ed & Gen + Coop Nursing
All Other
ITotal
SOUTHERN UTAH UNIVERSITY
Annualized FTE
Ed & Gen + Coop M Ed
All Other
IIITotal
SNOW COLLEGE
Annualized FTE
Education and General
All Other
Total
DIXIE COLLEGE
Annualized FTE
111 All Other (Incl ZP Amp)
Education and General
Total
III
'' COLLEGE OF EASTERN UTAH
Annualized FTE****
eEd & Gn San Juan Ctr
All Other
II/
Total
UTAH VALLEY COMMUNITY COLLEGE
Annualized FTE
Education and General
All Other
Total
SALT LAKE COMMUNITY COLLEGE
Annualized FTE
III
Education and General
All Other (Excl Sk Ctr)
Total (Excl Sk Ctr)
SBR AND STATEWIDE
II/
SBR Administration
Other Statewide
Total
TOTAL USHE
IIIAnnualized FTE*
' Educ & Gen Other Inst
All Other Line Items
Total
1989-90
Actual 1-Yr Inc 13-Yr Inc
1990-91
Budget/ 1-Yr
Enr Estmt
Inc 14-Yr Inc
18,996 2.01% 0.07% 19,690 3.65% 3.73%
$137,322 -2.59% 7.72% $138,231 0.66% 8.44%
$19,198 -2.55% 25.51% $19,604 2.11% 28.16%
$11,361 13.40% 103.61% $8,225 -27.61% 47.40%
$167,881 -1.64% 13.16% $166,059 -1.09% 11.94%
11,205 5.40% 17.72% 12,170 8.61% 27.86%
$70,373 1.73% 19.88% $10,012 -0.51% 19.27%
$18,368 1.05% 9.09% $17,281 -5.92% 2.63%
$6,286 -1.34% 79.88% $4,800 -23.63% 37.37%
$95,027 1.39% 20.24% $92,093 -3.09% 16.52%
10,034 5.90% 31.44% . 10,560 5.24% 38.33%
$45,663 2.344 22.50% $48,070 5.27% 28.96%
$515 7.39% 48.52% $520 0.88% 49.83%
$46,178 2.39% 22.74% $48,590 5.22% 29.16%
3,034 4.84% 67.90% 3,365 10.91% 86.22%
$14,533 8.36% 40.83% $15,058 3.61% 45.92%
$140 -32.90% 88.92% $113 -19.32% 52.42%
$14,673 7.73% 41.18% $15,171 3.39% 45.97%
1,616 17.53% 90.34% 1,763 9.10% 107.66%
$7,586 6.96% 58.08% $8,088 6.61% 68.54%
$194 -17.02% 63.66% $187 -3.89% 57.30%
$7,780 6.19% 58.22% $8,275 6.35% 68.27%
1,992 10.54% 73.22% 2,088 4.82% 81.57%
$8,949 7.77% 61.42% $8,705 -2.73% 57.01%
$279 13.539$ 82.25% $215 -22.76% 40.76%
$9,228 7.93% 61.98% $8,920 -3.33% 56.58%
1,420 4.87% 161.51% 1,720 21.13% 216.76%
16,886 8.12% 83.72% $7,269 5.56% 93.94%
$451 -12.93% 71.34% $514 14.03% 95.38%
$7,337 6.54% 82.90% $7,783 6.08% 94.03%
5,854 9.85% 103.19% 5,650 -3.48% 96.11%
$21,387 10.13% 89.49% $21,320 -0.32% 88.88%
$492 4.03% 961.09% $477 -3.15% 927.65%
$21,879 9.99% 93.05% $21,796 -0.38% 92.32%
7,584 16.14% 91.32% 9,281 22.38% 134.13%
$25,644 8.48% 71.58% 528,312 10.40% 89.43%
51,054 -5.71% 2593.21% 5705 -33.15% 1700.42%
S26,698 7.84% 78.17% $29,017 8.68% 93.64%
$2,508 67.47% 81.23% $1,528 -39.11% 10.36%
$2,165 2.48% 22.23% $2,248 3.83% 26.92%
$4,673 29.44% 48.11% $3,775 -19.22% 19.65%
61,/35 6.42% 30.44% 66,287 7.37% 40.05%
$338,344 1.61% 23.44% $345,065 1.99% 25.89%
$63,012 3.04% 38.78% $56,414 -10.47% 24.25%
$401,355 1.83% 25.62% $401,479 0.03% 25.66%
*Excluding Medical **Including Cont Ed Centers ***Including Coop Nursing ***Including San Juan Center
25 163

History 24-Dec-90 HISTORY OF ENROLLMENT AND BUOGET CHANGES, USNE Page 9
TABLE 3--Current Dollar State Tax 1976-77 1977-78 1978-79 1979-80 1980-81111
Funds in thousands of dollars Actual Actual 1-Yr Inc Actual 1-Yr Inc 2-Yr Inc Actual 1-Yr Inc 3-Yr Inc Actual 1-Yr Inc 4-Yr Inc
UNIVERSITY OF UTAH
Annualized FTE*
Ed & Gen Coop Nursing
Medical Programs (Ind 5th Path)
All Other (Including KUED)
Total
UTAH STATE UNIVERSITY
Annualized FTE**
Ed & Gen CE Centers + Coop M Ed
Agricultural Programs
All Other (Including Prod Ctr)
Total
wEBER STATE UNIVERSITY
Annualized FTE***
Ed & Gen + Coop Nursing
All Other
Total
SOUTHERN UTAH UNIVERSITY
Annualized FTE
Ed & Gen + Coop M Ed
All Other
Total
SNOW COLLEGE
Annualized FTE
Education and General
All Other
Total
DIXIE COLLEGE
Annualized FTE
Education and General
All Other (Intl ZP Amp)
Total
COLLEGE OF EASTERN UTAH
Annualized FTE***
Ed & Gen + San Juan Ctr
All Other
Total
UTAH VALLEY COMMUNITY COLLEGE
Annualized FIE
Education and General
All Other
Total
SALT LAKE COMMUNITY COLLEGE
Annualized FIE
Education and General
All Other (Excl Sk Ctr)
Total (Excl Sk Ctr)
SBR AND STATEWIDE
SBR Administ.ation
Other Statewide
Total
TOTAL USHE
Annualized FTE'
Educ & Gen + Other Inst
All Cther Line Items
Total
18,982 18,699 -1.49% 17,975 -3.87% -5.31% 18,430 2.53% -2.91% 18,768 1.83%
$40,042 $45,458 13.53% $50.555 11.21% 26.26% $52,485 3.82% 31.08% $58,319 11.12%
$5,792 $6,304 8.86% $6,874 9.03% 18.69% $7,601 10.57% 31.24% $8,341 9.75%
$2,508 $2,951 17.65% $3,189 8.06% 27.13% $3,208 0.60% 27.89% $3,497 9.01%
$48,341 $54,714 13.18% $60,618 10.79% 25.40% $63,294 4.41% 30.93% $70,157 10.844
9,518 9,729 2.22% 9,156 -5.89% -3.80% 9,562 4.43% 0.46% 10,359 8.34%
118,164 $20,417 12.40% $22,890 12.12% 26.02% $24,320 6.25% 33.89% 27,136 11.58%
$4,264 $5,069 18.89% $5,745 13.33% 34.74% $6,134 6.76% 43.85% 7,037 14.73%
$1,317 $1,449 10.05% $1,773 22.35% 34.64% $1,621 -8.57% 23.11% $1,849 14.03%
123,745 $26,935 13.44% $30,409 12.90% 28.07% $32,075 5.48% 35.08% $36,022 12.30%
7,634 7,449 -2.42% 7,480 0.42% -2.02% 8.116 8.50% 6.31% 8.919 9.89%
$12,114 $14,297 18.01% $15,921 11.36% 31.42% $16,420 3.13% 35.54% $18,842 14.75%
$151 $151 0.00% $148 -1.66% -1.66% $154 3.79% 2.07% $161 4.25%
$12,265 $14,447 17.79% $16,069 11.23% 31.02% $16,574 3.14% 35.13% $19,002 14.65%
1,807 1,750 -3.15% 1,719 -1.77% -4.87% 1,853 7.80% 2.55% 1,948 5.13%
$3,708 $4,137 11.59% $4,667 12.81% 25.89% $4.939 5.83% 33.23% $5.560 12.56%
$32 $33 3.13% . $35 7.27% 10.62% $37 4.66% 15.78% $40 6.61%
S3,740 $4,170 11.52% $4,703 12.77% 25.76% $4,977 5.82% 33.08% $5,599 12.51%
849 915 7.714 897 -1.97t 5.65% 1,002 11.71% 18.021 1,108 10.58%
$1,777 $2,106 18.53% $2,524 19.87% 42.07% $2,695 6.74% 51.65% $3,036 12.67%
$52 $22 -58.65% $23 6.51% -55.96% $24 3.49% -54.42% $25 5.06%
$1,829 $2,127 16.33% $2,547 19.73% 39.29% $2,718 6.71% 48.64% $3,061 12.60%
1,150 1,148 -0.17% 1,092 -4.88% -5.04% 1,141 4.49% -0.78% 1,325 16.13%
$1,879 $2,120 12.83% $2,497 17.77% 32.87% $2,683 7.45% 42.77% $3,095 15.39%
$66 $11 -83.43% $12 7.27% -82.23% ($35) -399.81% -153.28% $39 -209.92%
$1,945 $2,131 9.54% $2,509 17.71% 28.95% $2,647 5.53% 36.08% $3,134 18.40%
543 649 19.52% 660 1.69% 21.55% 625 -5.30% 15.10% 753 20.48%
$1,444 $1,630 12.85% $1,898 16.47% 31.43% $2,102 10.76% 45.57% $2,420 15.11%
$91 $69 -24.29% $68 -1.16% -25.16% 171 3.54% -22.52% $76 7.64%
$1,535 51,699 10.64% $1,966 15.75% 28.06% $2,173 10.51% 41.52% 12,496 14.87%
2.881 2,863 -0.62% 2,897 1.19% 0.56% 3,250 12.19% 12.81% 3,840 18.15%
$3,464 $4,441 28.23% $5,286 19.02% 52.62% $5,437 2.85% 56.97% 56.207 14.16%
$21 $135 543.33% $36 -73.43% 70.95% $43 20.06% 105.24% $44 ').93%
$3,485 $4,576 31.33% $5,322 16.29% 52.73% $5,480 2.96% 57.26% 16,250 14.06%
3,964 3,974 0.25% 3,814 -4.03% -3.78% 3,870 1.47% -2.37% 4,155 7.36%
$4,618 $5,419 17.34% $6,130 13.11% 32.72% $6,387 4.20% 38.30% $7,145 11.86%
$17 $33 96.47% $45 34.73% 164.71% $52 15.56% 205.88% $52 0.58%
54,635 15,452 17.63% $6,175 13.24% 33.21% $6,439 4.U% 38.r"i $7,197 11.77%
$580 $623 7.41% $688 10.49% 18.68% $719 4.42% 23.92% 5751 4.48%
$738 $1,520 105.98% $1,226 -19.34% 66.15% $1,368 11.56% 85.36% 11,443 5.46%
$1,318 $2,143 62.61% $1,914 -10.67% 45.26% $2,086 8.99% 58.33% 12,193 5.12%
47,330 47,178 -0.32% 45,690 -3.15% -3.47% 47,849 4.73% 1.10% 51,174 6.95%
$87,208 $100,024 14.70% 1112,369 12.34% 28.85% $117,467 4.54% 34.70% $131,758 12.17%
$15,629 $18,371 17.54% $19,863 8.12% 27.09% $20,995 5.70% 34.33% $23,353 11.23%
$102,838 $118,395 15.13% $132,232 11.69% 28.58% 1138,462 4.71% 34.64% 1155,112 12.02%
*Excluding Medical **Including Cont Ed Centers **Including Coop Nursing ****Including San Juan Center
126
-1.13%
45.65%III
44.03%
39.41%
45.13%
ill8.844
49.40%
65.048
11140.38%
51.70%
16.83%
55.53%III
6.41%
54.93%
7.80% i49.96%
23.44%
III
49.73%
30.51%
70.87%
-52.12%
11167.37%
15.22%
64.74%
III-41.43%
61.12%
38.67%
11167.57%
-16.59%
62.56%
33.29% 111
79.20%
107.14%
79.37%
III
4.82%
54.70%
III
207.66%
55.26%
29.47%
III
95.48%
66.44%
8.12%
51.08% ,
49.42%
50.83%

History 24-Dec-90 HISTORY OF ENROLLMENT AND BUDGET CHANGES, USHE
TABLE 3--Current Dollar State TaxIII
Funds in thousands of dollars
III
UNIVERSITY OF UTAH
Annualized FTE*
Ed & Gen + Coop Nursing
Medical Programs (Ind 5th Path)
All Other (Including KUED)
IIITotal
JTAH STATE UNIVERSITY
Annualized FTE**
Ed & Gen + CE Centers + Coop M Ed
III
tAgricultural Programs
All Other (Including Prod Ctr)
Total
WEBER STATE UNIVERSITY
IIIAnnualized FTE***
Ed & Gen Coop Nursing
All Other
II/Total
SOUTHERN UTAH UNIVERSITY
Annualized FTE
Ed & Gen + Coop M Ed
IAll Other
Total
SNOW COLLEGE
Annualized FTE
tEducation and General
All Other
Total
DIXIE COLLEGE
IAnnualued FTE
Education ard General
All Other (Incl ZP Amp)
Total
111
COLLEGE OF EASTERN UTAH
Annualized FTE****
Ed & Gen + San Juan Ctr
All Other
111
Total
UTAH VALLEY COMMUNITY COLLEGE
Annualized FTE
Education and General
III
All Other
Total
SALT LAKE COMMUNITY COLLEGE
Annualized FTE
111
Education and General
All Other (Eucl Sk Ctr)
Total (Excl Sk Ctr)
SBR AND STATEWIDE
SBR Administration
IIIOther Statewide
Total
TOTAL USHE
II/Annualized FTE*
Educ & Gen + Other Inst
All Other Line Items
Total
Page 10
1981-82
Actual 1-Yr Inc 5-Yr Inc
1982-83
Actual 1-Yr Inc 6-Yr Inc
1983-84
Actual I-Yr Inc 7-Yr Inc
1984-85
Actual 1-Yr Inc 8-Yr Inc
18,833 0.35% -0.78% 19,454 3.30% 2.49% 19,492 0.20% 2.69% 19,445 -0.24% 2.44%
$65,387 12.12% 63.30% $71,804 9.81% 79.33% $74,480 3.73% 86.01 $86,601 16.27% 116.28%
$10,323 23.75% 78.244 $11,464 11.06% 97.95% $11,937 4.12% 106.11% $13,391 12.18% 131.21%
$3,828 9.46% 52.60% $4,167 8.85% 66.11% $4,260 2.24% 69.83% $4,682 9.90% 86.64%
$79,538 13.37% 64.53% $87,436 9.93% 80.87% $90,678 3.71% 87.58% $104,674 15.43% 116.53%
10,365 0.06% 8.90% 10,553 1.81% 10.87% 10,989 4.13% 15.45% 10,663 -2.97% 12.03%
$30,161 11.15% 66.05% $33,423 10.82% 84.01% $34,702 3.83% 91.05% $41,176 18.66% 126.69%
$7,874 11.89% 84.67% $8,785 11.57% 106.03% $8,948 1.86% 109.87% $9,951 11.20% 133.37%
$1,966 6.35% 49.30% $2,039 3.70% 54.82% $1,627 -20.20% 23.54% $2,207 35.67% 67.61%
$40,001 11.05% 68.46% $44,246 10.61% 86.34% $45,277 2.33% 90.68% $53,334 17.80% 124.62%
8,924 0.06% 16.90% 9,010 0.96% 18.02% 8,822 -2.09% 15.56% 8,467 -4.02% 10.91%
$20,804 10.41% 71.73% $23,005 10.58% 89.90% $24,143 4.95% 99.30% $27,990 15.93% 131.05%
$167 3.81% 10.47% $176 5.34% 16.37% $180 2.56% 19.35% $188 4.50% 24.72%
120,971 10.36% 70.98% $23,181 10.54% 89.00% $24,323 4.93% 98.31% $28,178 15.85% 129.74%
1,922 -1.33% 6.36% 2,173 13.06% 20.25% 2,315 6.53% 28.11% 2,410 4.10% 33.37%
$6,231 12.08% 68.07% $6,942 11.41% 87.26% $7,220 4.00% 94.75% $8,291 14.83% 123.62%
$54 35.70% 67.50% $57 6.23% 77.93% $58 1.88% 81.27% ' $61 5.16% 90.63%
$6,285 12.25% 68.07% $6,999 11.37% 87.18% $7,278 3.98% 94.63% $8,352 14.75% 123.33%
1,132 2.17% 33.33% 1,025 -9.45% 20.73% 1,146 11.80% 34.98% 1,130 -1.40% 33.10%
$3,422 12.70% 92.57% $3,859 12.80% 117.22% $4,156 7.69% 133.92% $4,837 16.38% 172.24%
$21 -15.66% -59.62% $22 6.87% -56.84% $23 2.04% -55.96% $24 3.93% -54.23%
$3,443 12.47% 88.24% $3,882 12.76% 112.27% $4,179 7.65% 128.52% $4,861 16.31% 165.80%
1,380 4.15% 20.00% 1.436 4.06% 24.87% 1,449 0.91% 26.00% 1,483 2.35% 28.96%
$3,448 11.40% 83.52% 53,794 10.02% 101.92% $3,967 4.55% 111.11% $4,493 13.28% 139.14%
$42 7.74% -36.90% $44 5.95% -33.14% $44 -1.11% -33.89% $47 6.83% -29 37%
$3,490 11.36% 79.41% $3,838 9.97% 97.31% $4,011 4.49% 106.16% $4,540 13.20% 133.39%
829 10.09% 52.67% 922 11.22% 69.80% 1,065 15.51% 96.13% 1,162 9.11% 114.00%
$2,706 11.82% 87.38% $3,016 11.47% 108.87% $3,156 4.64% 118.56% $3,848 21.91% 166.45%
$78 2.58% -14.44% $83 6.23% -9.11% $85 1.75% -7.53% $91 7.55% -0.55%
$2,784 11.54% 81.32% $3,009 11.32% 101.85% $3,241 4.56% 111.05% $3,939 21.54% 156.51%
4,349 13.26% 50.95% 5,035 15.77% 74.77% 5,272 4.71% 82.99% 4,047 -6.16% 71.71%
$7,054 13.66% 103.67% $7,671 8.75% 121.49% 17,998 4.25% 130.9116 $9,964 24.58% 187.67%
$46 5.29% 118.10% $45 -2.18% 113.33% $45 0.6% 115.24% $47 4.65% 125.24%
17,100 13.60% 103.76% $7,716 8.68% 121.44% $8,043 4.23% 130.82% $10,011 24.47% 187.30%
4,573 10.06% 15.36% 5.339 16.75% 34.69% 5,518 3.35% 39.20% 5,563 0.82% 40.348
$7,994 11.89% 73.09% $8,733 9.25% 89.11% $9,068 3.83% 96.35% $11,357 25.25% 145.92%
:55 5.35% 224.12% $59 6.54% 245.31% $5.., 0.85% 248.24% 162 4.90% 265.29%
$8,049 11.80 73.65% $8,792 9.23% 89.68% $9.127 3.81% 96.91% $11,419 25.11% 146.36%
1888 18.33% 53.21% $976 9.84% 68.28% $995 1.96% 71.58% $1,087 9.28% 87.50%
$1,484 2.88% 101.12% $2,022 36.27% 174.05% $1,843 -8.89% 149.69% 55,405 193.35% 632.46%
$2,372 8.17% 80.04% $2,998 26.37% 127.51% $2,837 -5.36% 115.32% $6,492 128 91% 392.68%
52,306 2.21% 10.51% 54,946 5.05% 16.09% 56,068 2.04% 18.46% 55,270 -1.42% 16.78%
$147,207 11.72% 68.80% $162,249 10.22% 86.05% 1168,890 4.09% 93.66% $198,556 17.57% 127.68%
$26,825 14.87% 71.64% $29,939 11.61% 91.56% $30,104 0.55% 92.61% $37,243 23.72% 138.29%
5174,032 12.20% 69.23% $192,188 10.43% 86.88% 5198.994 3.54% 93.50% $235,799 18.50% 129.29%
*Excluding Medical **Including Cont Ed Centers ***Including Coop Nurfing ****Including San Juan Center
27

History 24-0ec-90 HISTORY OF ENROLLMENT AND BUDGET CHANGES, USHE Page 11
TABLE 3--Current Dollar State Tax
Funds in thousands of dollars
UNIVERSITY OF UTAH
1985-86
Actual I-Yr Inc 9-Yr Inc
1986-87
Actual 1-Yr Inc 10-Yr Inc
1987-88
Actual 1-Yr Inc 11-Yr Inc
1988-89
Actual 1-Yr Inc 12-Yr Inc
Annualized FTE* 19,153 -1.50% 0.90% 18,892 -1.36% -0.47% 18,896 0.024 -0.45% 18,622 -1.45% -1.90%
Ed & Gen + Coop Nursing $89,732 3.62% 124.10% $89,042 -0.77% 122.37% $94,107 5.69% 135.02% $96,589 2.64% 141.22%
Medical Programs (Incl 5th Path) $14,398 7.52% 148.60% $14,187 -1.47% 144.95% $14,422 1.66% 149.02% $14,773 2.43% 155.08%
All Other (In:luding KUED) $5,088 8.68% 102.84% $4,879 -4.12% 94.49% $5,147 5.50% 105.18% $5,259 2.19% 109.66%
Total $109,218 4.34% 125.93% $108,107 -1.02* 123.63% $113,676 5.15% 135.15% $116,622 2.59% 141.25%
UTAH STATE UNIVERSITY
Annualized FTE** 10,306 -3.35% 8.28% 10,353 0.46% 8.77% 10,397 0.42% 9.24% 10,631 2.25% 11.69%
Ed & Gen + CE Centers + Coop M Ed $43,717 6.17% 140.68% $44,397 1.56% 144.43% $46,989 5.84% 158.70% $47,533 1.16% 161.69%
Agricultural Programs $10,798 8.51% 153.24% $10,796 -0 01% 153.20% $11,076 2.59% 159.77% $11,603 4.76% 172.13%
All Other (Including Prod Ctr) $2,146 .2.76% 62.98% $2,414 12.47% 83.31% $2,474 2.48% 87.86% $2,565 3.67% 94.76%
Total $56,661 6.24% 138.63% 157,607 1.67% 142.61% $60,539 5.09% 154.96% $61,701 1.92% 159.85%
WEBER STATE UNIVERSITY
Annualized PH**. 8,579 1.32% 12.38% 9,027 5.22% 18.25% 9,279 2.79% 21.55% 9,475 2.11% 24.12%
Ed & Gen + Coop Nursing $29,154 4.16% 140.66% $28,799 -1.22% 137.73% $30,518 5.97% 151.91% $31,082 1.85% 156.57%
All Otner $192 1.81% 26.9711 5166 -13.26% 10.14% 5196 17.93% 29.89% $196 -0.00% 29.89%
Total $29,345 4.14% 139.26% $28,965 -1.30% 136.16% $30,714 6.04% 150.41% $31,278 1.84% 155.02%
SOU. IERN UTAH UNIVERSITY
Annualized FTE 2,361 -2.03% 30.66% 2,685 13.72% 48.59% 2,779 3.501; 53.79% 2,894 4.14% 60.15%
Ed & Gen + Coop M Ed $8,798 6.12% 137.29% $8,716 -0.93% 135.09% $9,149 4.97% 146.70 $9,449 3.28% 154.87%
All Other $64 4.10% 98.44% $61 -4.57% 89.38% $60 -1.16% 87.19% $89 49.08% 179.06%
Total $8,861 6.10% 136.96% $8,777 -0.95% 134.70% $9,209 4.93% 146.27% $9,539 3.58% 155.08%
SNOW COLLEGE
Annualized FTE 1,142 1.06% 34.51% 1,265 10.77% 49.00% 1,244 -1.66% 46.53% 1,375 10.53% 61.96%
Education and General $4,965 2.65% 179.45% $4,965 0.00% 179.45% $5,204 4.81% 192.89% $5,323 2.28% 199.58%
All Other $25 3.36% -52.69% $24 -4.00% -54.58% $25 4.17% -52.69% $25 0.00% -52.69%
Total $4,990 2.65% 172.85% $4,989 -0.02% 172.79% $5,229 4.81% 185.91% $5,347 2.27% 192.40%
DIXIE COLLEGE
Annualized FTE 1,646 10.99% 43.13% 1,843 11.97% 60.26% 1,812 -1.68% 57.57% 1,802 -0.55% 56.70%
Education and General $4,796 6.74% 155.25% $5,212 8.67% 177.38% $5,454 4.64% 190.24% $5,657 3 72% 201.04%
All Other (Incl ZP Amp) $49 4.90% -25.90% $47 -3.66% -28.61% $50 5.91% -24.40% $51 0.80% -23.80%
Total 54.845 6.72% 149.07% $5,259 8.54% 170.35% $5,504 4.65% 182.91% $5,707 3.69% 193.36%
COLLEGE OF EASTERN UTAH
Annualized FTE**** 1,141 -1.81: 110.13% 1,309 14.72% 141.0,t 1,281 -2.14% 135.91% 1,354 5.70% 149.36%
Ed & Gen + San Juan Ctr $3,993 3.7' 176.51% $4,363 9.26% 202.11% $4,535 3.95% 214.04% $4,701 3.66% 225.55%
All Other $94 3.63% 3.06% $91 -3.82% -0.88% $133 47.24% 45.95% $134 0.52% 46.72%
Total $4,087 3.77% 166.18% $4,453 8.96% 190.03% $4,668 4.83% 204.04% $4,835 3.57% 214.90%
UTAH VALLEY COMMUNITY COLLEGE
Annualized FTE 4,899 -0.97% 70.05% 5,206 6.27% 80.70% 5,302 1.84% 84.03% 5,329 0.51% 84.97%
Education and General $10,724 7.63% 209.61% $10,717 -0.07% 209.41% $11,162 4.16% 222.29% $11,659 4.45% 236.62%
All Other $50 6.13% 139.05% $48 -3.78% 130.00% $51 5.38% 142.38% $51 0.39% 143.33%
Total $10,774 7.62% 209.19% $10,765 -0.08% 208.93% $11,213 4.17% 221.81% $11,710 4.43% 236.06%
SALT LAKE COMMUNITY COLLEGE
Annualized FTE 5,720 2.82% 44.30% 5,845 2.19% 47.45% 6,073 3.90% 53.20% 6,530 7.53% 64.73%
Education and General $12,220 7.59% 164.609; $12,427 1.70% 169.09% $13,077 5.23% 183.16% $14,034 7.31% 203.87%
All Other (Excl Sk Ctr) $65 3.86% 279.41% $62 -4.03% 264.12% $65 4.20% 279.41% $65 0.00% 279.41%
Total (Excl Sk Ctr) $12,284 7.57% 165.02% $12,489 1.67% 169.44% $13,142 5.23% 183.52% $14,098 7.28% 204.15%
SBR ANO STATEWIDE
SIR Administratizn $1,265 16.35% 118.14% $1,261 -0.30% 117.49% 51,322 4.85% 128.04% $1,355 2.44% 133.62%
Other Statewide $2,112 -60.93% 186.15% $1,905 -9.77% 158.18% $2,003 5.12% 171.41% S1,795 -10.39% 143.22%
Total $3,376 -47.99N 156.23% $3,166 -6.23% 140.28% $3,325 5.02% 152.33% S3,149 -5.28% 138.99%
TOTAL USHE
Annualized FTE* 54,947 -0.58% 16.09% 56,425 2.69% 19.22% 57,063 1.13% 20.56% 58,012 1.66% 22.57%
Educ & Gen + Other Inst $208,098 4.81% 138.62% $208,637 0.26% 139.24% $220,195 5.54% 152.49% $226,026 2.65% 159.18%
All Ott.cr Line Items $36,344 -2.41% 132.54% $35,940 -1.11% 129.96% $37,024 3.01% 136.89% $37,960 2.53% 142.88%
Total $244,442 3.67% 137.70% 5244,577 0.06% 137.83% $257,218 5.17% 150.12% $263,986 2.63% 156.70%
*Excluding Medical **Including Cont Ed Centers ***Including Coop Nursing ****Including San Juan Center
28 172
1
I.

History 24-0ec-90 HISTORY OF ENROLLMENT AND BUDGET CHANGES, USHE
IIITABLE 3-Current Dollar State Tax
Funds in thousands of dollars
UNIVERSITY OF UTAH
Annualized FTE*
Ed & Gen + Coop Nursing
Medical Programs (Incl 5th Path)
All Other (Including KUED)
III
Total
UTAH STATE UNIVERSITY
Annualized FTE**
Ed & Gen + CE Centers 4- Coop M Ed
III
i Agricultural Programs
All Other (Including Prod Ctr)
Total
WEBER STATE UNIVERSITY
IAnnualized FTE***
Ed & Gen + Coop Nursing
All Other
Total
ISOUTHERN UTAH UNIVERSITY
Annualized FTE
Ed & Gen + Coop M Ed
All Other
111 Total
SNOW COLLEGE
Annualized FTE
Education and General
II/ All lther
Total
DIXIE COLLEGE
- Annualized FTE
111
Education and General
All Other (Incl ZP Amp)
Total
COLLEGE OF EASTERN UTAH
IIIAnnualized FTE****
Ed & Gen 4- San Juan Ctr
All Other
Total
UTAH VALLEY COMMUNITY COLLEGE
Ann ualized FTE
Education and General
All Other
111
Total
.SALT LAKE COMMUNITY COLLEGE
Annualized FTE
,
Education and General
IIAll Other (Exci Sk Ctr)
Total (Excl Sk Ctr)
SBR AND STATEWIDE
Total
SBR Administration
VOther Statewide
TOTAL USHE
Annualized FTE*
11/
Educ & Gen + Other Insi.
All Other Line Items
Total
1989-90
Actual 1-Yr Inc 13-Yr Inc
1990-91
Budget/ 1-Yr Inc 14-Yr Inc
Enr Estmt
18,996 2.01% 0.07% 19,690 3.65% 3.73%
$101,828 5.42% 154.31% $102,789 0.94% 156.70%
515,490 4.85% 167.45% $15,900 2.65% 174.54%
$6,787 29.05% 170.57% $5,808 -14.43% 131.53%
$124,105 6.42% 156.73% $124,496 0.32% 157.54%
11,205 5.40% 17.72% 12,170 8.61% 27.86%
$51,392 8.12% 182.94% $52,215 1.60% 187.46%
$12,160 4.80% 185.18% $13,104 7.77% 207.34%
$2,637 2.821; 100.24% 12,793 5.91% 112.07%
$66,189 7.27% 178.75% $68,112 2.90% 186.85%
10,034 5.90% 31.44% 10,560 5.24% 38.33%
$32,176 3.52% 165.61% $34,254 6.46% 182.76%
$196 0.00% 29.89% $199 1.33% 31.61%
$32,372 3.50% 163.94% 534,453 6.43% 180.90%
3,034 4.84% 67.90% 3,365 10.91% 86.22%
$10,696 13.20% 188.50% $11,338 6.00% 205.82%
$62 -31.13% 92.19% $64 3.25% 98.44%
$10,758 12.78% 187.68% $11,402 5.98% 204.90%
1,616 17.5311 90.34% 1,763 9.10% 107.66%
$5,888 10.62% 231.40% $6,230 5.80% 250.62%
$25 0.00% -52.69% $25 -0.00% -52.69%
$5,913 10.58% 223.32% $6,254 5.77% 241.99%
1,992 10.54% 73.22% 2,088 4.82% 81.57%
$6,257 10.62% 233.00% $6,565 4.92% 249.38%
$52 2.77% -21.69% $54 3.46% -18.98%
56,309 10.55% 224.30% 56,619 4.91% 240.22%
1,420 4:87% 161.51% 1,720 21.13% 216.76%
$5,457 16.08% 277.89% $5,865 7.47% 306.13%
5136 1.42% 48.80% $138 1.76% 51.42%
55,593 15.67% 264.26% $6,003 7.33% 290.97%
5,854 9.85% 103.19% 5,650 -3.48% 96.11%
$12,772 9.55% 268.76% $13,939 9.14% 302.47%
$52 1.57% 147.14% $53 1.93% 151.90%
$12,824 9.51% 268.02% $13,992 9.11% 301.56%
7,584 16.14% 91.32% 9,281 22.38% 134.13%
$16,206 15.48% 250.91% $18,820 16.13% 307.52%
$65 0.00: 279.41% $65 0.00% 279.41%
$16,271 15.41% 251.02% $18,885 16.07% 307.42%
$8,343 515.95% 1338.96% 11,463 -82.47% 152.31%
$2,198 22.46% 197.85% $1,776 -19.20% 140.66%
$10,541 234.71% 699.93% $3,239 -69.27% 145.79%
61,735 6.42% 30.44% 66,287 7.37% 40.05%
$242,673 7.36% 178.27% $252,014 3.85% 188.98%
$48,201 26.98% 208.41% 541,440 -14.03% 165.15%
$290,874 10.19% 182.85% 5293,454 0.89% 185.36%
*Excluding Medical **Including Cont Ed Centers "'Including Coop Nursing ****Including San Juan Center
29 3
Page 12

History 24-Dec-90
TABLE 4-.CONSTANT Dollar State Tax
Funds ir thousand* rf dollars
UNDERFITY OF 0.
1976-77
Actual
HISTORY OF ENROLLMENT AND BUDGET CRAKES, USHE
1977-78 1978-79 1979-80
Actual 1-Yr Inc Actual 1-Yr Inc 2-Yr Inc Actual 1-Yr Inc 3-Yr Inc
Page 13
1980-81
Actual 1-Yr Inc 4-Yr Inc
Annuilized FTE* 18,982 18,699 -1.49% 17,975 -3.87% -5.31% 18,430 2.53% -2.91% 18.768 1.83% -1.13%
Ed & Gen Coop Nursing $92,192 $98,090 6.40% $100,065 2.01% 8.54% $91,694 -8.37% -0.54% $90,553 -1.24% -1.78%
Medical Programs (Incl 5th Path) $13,334 $13,604 2.02% $13,605 0.01% 2.03% $13,279 -2.40% -0.42% $12,952 -2.46% -2.87%
All Other (Including KUED) $5,776 $6,368 10.26% $6,312 -0.88% 9.29% $5,605 -11.21% -2.96% $5,430 -3.12% -5.98%
Total $111,302 $118,062 6.07% $119,983 1.63% 7.80% $110,578 -7.84% -0.65% $108,935 -1.49% -2.13%
UTAH STATE UNIVERSITY
Annualized FTE** 9,518 9,729 2.22% 9,156 -5.89% -3.80% 9,562 4.43% 0.46% 10,359 8.34% 8.84%
Ed & Gen + CE Centers + Coop M Ed $41,821 $44,056 5.34% $45,307 2.84% 8.34% $42,489 -6.22% 1.60% $42,135 -0.83% 0.75%
Agricultural Programs $9.817 $10,939 11.43% $11,372 3.96% 15.84% $10,716 -5.77% 9.16% $10,927 1.97% 11.30%
All Other (Including Prod Ctr) $3,032 $3,127 3.14% $3,510 12.23% 15.75% $2,832 -19.30% -6.59% $2,870 1.35% -5.33%
Total $54,670 $58,121 6.31% $60,189 3.56% 10.10% $56,037 -6.90% 2.50% $55,932 -0.19% 2.31%
WEBER STATE UNIVERSITY
Annualized FTE*** 7,634 7,449 -2.42% 7,480 0.42% -2.02% 8,116 8.50% 6.31% 8,919 9.89% 16.83%
Ed & Gen + Coop Nursing $27,892 $30,849 10.60% $31,513 2.15% 12.98% $28,687 -8.97% 2.85% $29,256 1.98% 4.89%
All Other $347 $326 -6.28% $294 -9.79% -15.46% $269 -8.39% -22.55% $249 -7.34% -28.24%
Total $28,239 $31,175 10.39% $31,806 2.03% 12.63% $28,956 -8.96% 2.54% $29,506 1.90% 4.48%
SOUTHERN UTAH UNIVERSITY
Annualized FTE 1.807 1,750 -3.15% 1,719 -1.77% -4.87% 1,853 7.80% 2.55% 1,948 5.13% 7.80%
Ed & Gen + Coop M Ed $8,536 $8,927 4.58% $9,238 3.48% 8.22% $8.630 -6.59% 1.09% $8,633 0.03% 1.13%
All Other $74 $71 -3.35% $70 -1.60% -4.90% $65 -7.62% -12.15% $61 -5.25% -16.75%
Total $8,610 $8,999 4.51% $9,308 3.44% 8.11% $8,694 -6.60% 0.98% $8,694 -0.00% 0.98%
SNOW COLLEGE
Annualized FTE 849 915 7.77% 897 -1.97% 5.65% 1,002 11.71% 18.02% 1,108 10.58% 30.51%
Education and General $4,091 $4,544 11.08% $4,996 9.95% 22.14% $4,707 -5.78% 15.07% $4,714 0.14% 15.23%
All Other $120 $46 -61.25% $45 -2.30% -62.14% $41 -8.65% -65.42% $39 -6.62% -67.71k
Total $4,211 $4,591 9.03% $5,042 9.83% 19.74% $4,749 -5.81% 12.79% $4,753 0.08% 12.87%
DIXIE COLLEGE
Annualized FTE 1,150 1,148 -0.17% 1,092 -4.88% -5.04% 1,141 4.49% -0.78% 1,325 16.13% 15.22%
Education and General $4,326 $4,575 5.74% $4,942 8.03% 14.23% $4,687 -5.16% 8.34% $4.806 2.55% 11.10%
All Other (Incl ZP Amp) $153 $24 -84.47% $23 -1.60% -84.72% ($62) -364.63% -140.43% $60 -197.70% -60.50%
Total $4,479 $4,598 2.66% $4,965 7.98% 10.85% $4,625 -6.85% 3.26% $4,867 5.23% 8.66%
COLLEGE OF EASTERN UTAH
Annualized FTE**** 543 649 19.52% 660 1.69% 21.55% 625 -5.30% 15.10% 753 20.48% 38.67%
Ed & Gen + San Juan Ctr $3,325 $3,516 5.76% $3,757 6.84% 12.99% $3,672 -2.24% 10.46% $3,757 2.30% 13.01%
All Other $210 $149 -29.04% $135 -9.33% -35.67% $124 -8.61% -41.21% $118 -4.33% -43.75%
Total $3,535 $3,666 3.69% $3,892 6.18% 10.09% $3,796 -2.46% 7.39% $3,875 2.09% 9.63%
UTAH VALLEY COMMUNITY COLLEGE
Annualized FTE 2,881 2,863 -0.62% 2,897 1.19% 0.56% 3,250 12.19% 12.81% 3,840 18.15% 33.29%
Education and General $7,974 $9,583 20.17% $10,463 9.18% 31.20% $9,498 -9.22% 19.11% $9,637 1.46% 20.85%
All Other $48 $292 502.93% $71 -75.63% 46.96% $75 5.97% 55.73% $68 -10.30% 39.70%
Total $8,023 $9,875 23.08% $10,534 6.67% 31.30% $9,573 -9.12% 19.33% $9,705 1.37% 20.96%
SALT LAKE COMMUNITY COLLEGE
Annualized FTE 3,964 3.974 0.25% 3,814 -4.03% -3.78% 3,870 1.47% -2.37% 4,155 7.36% 4.82%
Education and General $10,633 $11,693 9.97% $12,132 3.76% 14.10% $11,158 -8.03% 4.94% $11,094 -0.58% 4.33%
All Other (Excl Sk Ctr) $39 $72 84.13% $89 23.59% 127.56% $91 2.00% 132.10% $81 -10.61% 107.49%
Total (Excl Sk Ctr) $10,672 $11,755 10.24% $12,221 3.88% 14.52% $11,249 -7.96% 5.41% $11,175 -0.66% 4.71%
SBR AND STATEWIDE
SBR Administration $1,335 $1,344 0.67% $1,362 1.35% 2.03% $1,255 -7.83% -5.97% $1,166 -7.14% -12.69%
Other Statewide $1,699 $3,280 93.04% $2,427 -26.01% 42.84% $2,390 -1.53% 40.65% $2,240 -6.27% 31.83%
Total $3,034 $4,624 52.40% $3,789 -18.06% 24.88% $3,645 -3.80% 20.14% $3,405 -6.57% 12.24%
TOTAL USHE
Annualized FTE* 47,330 47,178 -0.32% 45,690 -3.15% -3.47% 47,849 4.73% 1.10% 51,174 6.95% 8.12%
Educ & Gen + Other Inst $200,790 $215,833 7.49% $222,413 3.05% 10.77% $205,223 -7.73% 2.21% $204,584 -0.31% 1.89%
All Other Line Items $35,985 $39,641 10.16% $39,316 -0.82% 9.26% $36,680 -6.70% 1.93% $36,261 -1.14% 0.77%
Total $236,774 $255,475 7.90% $261,729 2.45% 10.54% $241,903 -7.57% 2.17% $240,846 -0.44% 1.72%
*Excluding Medical **Including Cont Ed Centers ***Including Coop Nursing ***Includlng San Juan Center
30
1

IIIHistory 24-Dec-90 HISTORY OF ENROLLMENT AND BUDGET CHANGES, USHE
IIITABLE 4--CONSTANT Dollar State Tax
Funds in thousands of dollars
UNIVERSITY OF UTAH
Annualized FTE
Ed & Gen + Coop Nursing
Medical Programs (Incl 5th Path)
All Other (Including KUED)
Total
UTAH STATE UNIVERSITY
Annualized FTE"
Ed & Gen + CE Centers + Coop M Ed
111
Agricultural Programs
All Other (Including Prod Ctr)
Total
WEBER STATE UNIVERSITY
Annualized FTE***
II/
Ed & Gen + Coop Nursing
All Other
Total
i-' SOUTHERN UTAH UNIVERSITY
Annualized FTE
Ed & Gen + Coop M Ed
All Other
Total
SNOW COLLEGE
Annualized FTE
Education and General
111
All Other
Total
ilIDIXIE COLLEGE
Annualized FTE
111
Education and General
, All Other (Incl ZP Amp)
Total
COLLEGE OF EASTERN UTAH
III
Annualized FTE**"
Ed & Gen + San Juan Ctr
All Other
Total
II/
.UTAH VALLEY COMMUNITY COLLEGE
Annualized FTE
Education and General
. All Other
Total
SALT LAKE COMMUNITY COLLEGE
Annualized FTE
Education and General
IIIAll Other (Excl Sk Ctr)
Total (Excl Sk Ctr)
SBR AND STATEWIDE
SBR Administration
III
Otner Statewide
Total
TOTAL USHE
II/
Annualized FTE*
Educ & Gen Other Inst
All Other Line Items
Total
Paola
1981-82
Actual 1-Yr Inc 5-Yr Inc
1982-83
Actual 1-Yr Inc 6-Yr Inc
1983-84
Actual I-Yr Inc 7-Yr Inc
1984-85
Actual 1-Yr Inc 8-Yr Inc
18,833 0.35% -0.78% 19,454 3.30% 2.49% 19,492 0.20% 2.69% 19,445 -0.24% 2.44%
$93,212 2.94% 1.11% $98,584 5.76% 6.93% $98,523 -0.06% 6.87% $110,204 11.86% 19.54%
$14,715 13.62% 10.36% $15,740 6.96% 18.04% $15,790 0.32% 18.42% $17,041 7.92% 27.79%
55,457 0.50% -5.52; $5,721 4.84% -0.95% 55,635 -1.50% -2.43% $5,956 5.72% 3.16%
$113,384 4.08% 1.87% C120,045 5.87% 7.86% $119,949 -0.08% 7.77% $133,203 11.05% 19.68%
10,365 0.06% 8.90% 10,553 1.81% 10.87% 10,989 4.13% 15.45% 10,663 -2.97% 12.03%
142,995 2.04% 2.81% $45,888 6.73% 9.73% $45,904 0.03% 9.76% $52,399 14.15% 25.30%
$11,224 2.72% 14.34% $12,061 7.45% 22.86% $11,837 -1.86% 20.58% $12,663 6.98% 28.99%
$2,803 -2.36% -7.56% $2,799 -0.13% -7.68% $2,152 -23.12% -29.02% $2,809 30.52% -7.36%
$57,022 1.95% 4.30% $60,748 6.53% 11.12% $59,893 -1.41% 9.55% $67,871 13.32% 24.15%
8,924 0.06% 16.90% 9,010 0.96; 18.02% 8,822 -2.09% 15.56% 8,467 -4.02% 10.91%
$29,657 1.37% 6.33% $31,585 6.50% 13.24% $31,937 1.11% 14.50% $35,618 11.53% 27.70%
$238 -4.69% -31.60% 5241 1.45% -30.61% $238 -1.18% -31.43% $239 0.53% -31.07%
$29,895 1.32% 5.86% $31,826 6.46% 12.70% $32,175 1.10% 13.94% $35,858 11.45% 26.98%
1,922 /-I.33% 6.36% 2,173 13.06% 20.25% 2,315 6.53% 28.11% 2,410 4.10% 33.37%
$8,883 2.90% 4.06% $9,532 7.30% 11.66% 59,551 0.20% 11.89% $10,550 10.46% 23.59%
$76 24.58% 3.71% $78 2.31% 6.10% $77 -1.84% 4.15% $78 1.16% 5.36%
$8,959 3.05% 4.06% $9,610 7.26% 11.61% $9,628 0.18% 11.82% $10,628 10.39% 23.44%
1,132 2.17% 33.33% 1,025 -9.45% 20.73% 1,146 11.80% 34.98% 1,/30 -1.40% 33.104
54,877 3.47% 19.23% $5,299 8.644 29.53% $5,498 3.75% 34.39% $6,155 11.96% 50.47%
$30 -22.57% -75.00% $31 2.92% -74.26% $30 -1.69% -74.70% $30 -0.02% -74.70%
$4,907 3.26% 16.55% $5,330 8.60% 26.58% $5,528 3.72% 31.29% $6,186 11.90% 46.91%
1,380 4.15% 20.00% 1,436 4.06% 24.87% 1,449 0.91% 26.00% 1,483 2.35% 28.95%
$4,916 2.28% 13.63% $5,209 5.96% 20.40% $5,247 0.74% 21.29% $5,718 8.97% 32.17%
$60 -1.08% -60.93% $61 2.04% -60.13% $58 -4.72% -62.02% $60 2.78% -60.96%
$4,976 2.23% 11.08% $5,270 5.92% 17.66% $5,305 0.67% 18.45% $5,778 8.90% 28.99%
829 10.09% 52.67% 922 11.22% 69.80% 1,065 15.5110 96.13% 1,162 9.11% 114.00%
$3,857 2.66% 16.02% $4,141 7.36% 24.55% $4,175 0.82% 25.57% $4,896 17.28% 47.27%
$111 -5.82% -47.03% $114 2.31% -45.80% 5112 -1.97% -46.87% $116 3.46% -45.03%
$3,969 2.41% 12.26% $4,255 7.21% 20.36% $4,287 0.74% 21.26% $5,012 16.92% 41.78%
4,349 13.26% 50.95% 5,035 15.77% 74.77% 5,272 4.71% 82.99% 4,947 -6.16% 71.71%
510,056 4.35% 26.10% $10,532 4.74% 32.08% 510,579 0.45% 32.67% $12,679 19.85% 59.00%
$65 -3.34% 35.03% $62 -5.79% 27.21% $60 -2.79% 23.66% 560 0.67% 24.49%
$10,121 4.29% 26.16% $10,594 4.67% 32.05% $10,639 0.43% 32.61% 512,739 19.74% 58.79%
4,573 10.06% 15.36% 5,339 16.75% 34.69% 5,518 3.35% 39.20% 5,563 0.82% 40.30
$11,395 2.72% 7.17% $11,991 5.22% 12.77% $11,995 0.04% 12.81% $14,453 20.49% 35.92%
$79 -3.28% 100.68% $81 2.61% 105.91% $78 .-2.844 100.07% 579 0.91% 101.90%
$11,474 2.68% 7.51% 512,071 5.21% 13.11% $12,073 0.02% 13.13% $14,532 20.36% 36.16%
$1,266 8.64% -5.14% $1,340 5.7916 0.35% $1,316 -1.76% -1.42% $1,383 5.13% 3.63%
52,116 -5.544 24.52% $2,777 31.24% 63.42% $2,437 -12.22% 43.'5% $6,878 182.21% 304.84%
$3,382 -0.69% 11.47% $4,116 21.71% 35.67% $3,753 -8.82% 23.71% $8,262 120.12% 172.31%
52,306 2.21% 10.51% 54,946 5.05% 16.09% 56,068 2.04% 18.46% 55,270 -1.42% 16.78%
$209,848 2.57% 4.51% $222,760 6.15% 10.94% 9223,408 0.29% 11.26% $252,674 13.10% 25.84%
$38,240 5.46% 6.27% $41,104 7.49% 14.23% $39,821 -3.12% 10.66% 547,393 19.02% 31.71%
$248,089 3.01% 4.78% $263,865 6.36% 11.44% $263,229 -0.24% 11.17% $300,067 13.99% 26.73%
'Excluding Medical **Including Cont Ed Centers "'Including Coop Nursing ""Including San Juan Center

History 24-Deo-90
TABLE 4--CONSTANT Dollar State Tax
Funds in thousands of dollars
UNIVERSITY OF UTAH
HISTORY OF ENRCCLMENT AND BUDGET CHANGES, USHE
1985-86 1986-87 1987-88
Actual 1-Yr Inc 9-Yr Inc Actual 1-Yr Inc 10-Yr Inc Actual 1-Yr Inc 11-Yr Inc
Page 15
1988-89
Actual 1-Yr Inc 12-Yr Inc
Annualized FIE* 19,153 -1.50% 0.90% 18,892 -1.36% -0.47% 18,896 0.02% -0.45% 18,622 -1.45% -1.90%
Ed & Gen + Coop Nursing $110,010 -0.18% 19.33% $107,978 -1.85% 17.12% $109,275 1.20% 18.53% $107,410 -1.71% 16.51%
Medical Programs (Incl 5th Path) $17,651 3.58% 32.37% $17,204 -2.54% 29.02% $16,747 -2.66% 25.59% $16,428 -1.90% 23.20%
All Other (Including KUED) $6,238 4.70% 8.01% $5,916 -5.16% 2.44% $5,976 1.02% 3.48% $5,849 -2.14% 1.27%
Total 1133.900 0.52% 20.30% $131,098 -2.09% 17.79% $131,998 0.69% 18.59; $129,687 -1.75% 16.52%
UTAH STATE uNIVERSITY
Annualized FTE** 10,306 -3.35% 8.28% 10,353 0.46% 8.77% 10,397 0.42% 9.24% 10,631 2.25% 11.69%
Ed & Gen + CE Centers Coop M Ed $53,596 2.28% 28.16% $53,839 0.45% 28.74% $54,563 1.34% 30.47% $52,858 -3.12% 26.39%
Agricultural Programs $13,238 4.54% 34.84% $13,092 -1.10% 33.36% $12,861 -1.76h 31.01% $12,903 0.32% 31.44%
All Other (Including Prod Ctr) $2,631 -6.32% -13.22% $2,927 11.25% -3.45% $2,873 -1.87% -5.26% $2,852 -0.71% -5.93%
Total $69,465 2.35% 27.06% $69,859 0.57% 27.78% $70,297 0.63% 28.59% $68,614 -2.39% 25.51%
WEBER STATE UNIVERSITY
Annualized FTE*** 8,579 1.32% 12.38% 9,027 5.22% 18.25% 9,279 2.79% 21.55% 9,475 2.11% 24.12%
Ed & Gen + Coop Nursing $35,742 0.35% 28.14% $34,924 -2.29% 25.21% $35,436 1.47% 27.05% $34,564 -2.46% 23.92%
All Other $235 -1.92% -32.39% $202 -14.20% -41.99% $228 12.92% -34.49% $218 -4.23% -37.27%
Total $35,977 0.33% 27.40% $35,125 -2.37% 24.38% $35,664 1.53% 26.29% $34,782 -2.47% 23.17%
SOUTHERN UTAH UNIVERSITY
Annualized FTE 2,361 -2.03% 30.66% 2,685 13.72% 48.59% 2,779 3.50% 53.79% 2,894 4.14% 60.15%
Ed & Gen + Coop M Ed $10,786 2.23% 26.35% $10,570 -2.00% 23.82% $10,624 0.51% 24.46% $10,508 -1.09% 23.10%
All Other $78 0.29% 5.66% $73 -5.60% -0.26h $70 -5.35% -5.60% $99 42.77% 34.78%
Total $10,864 2.22% 26.18% $10,643 -2.03% 23.62% $10,694 0.47% 24.20% $10,607 -0.81% 23.20N
SNOW COLLEGE
Annualized FTE 1,142 1.06% 34.51% 1,265 10.77% 4:.00% 1,244 -1.66% 46.53% 1,375 10.53% 61.96%
Education and General $6,087 -1.11% 48.80% $6,021 -1.09% 47.18% $6,043 0.36% 47.71% $5.919 -2.05% 44.69%
All Other $30 -0.42% -74.81% $29 -5.04% -76.08% $29 -0.26% -76.14% $27 -4.23% -77.15%
Total $6,117 -1.10% 45.29% $6,050 -1.11% 43.68% $6,071 0.36% 44.19% $5,946 -2.06% 41.23%
DIXIE COLLEGE
Annualized FTE 1,646 10.99% 43.13% 1,843 11.97% 60.26% 1,812 -1.68% 57.57% 1,802 -0.55% 56.70%
Education and General $5,880 2.83% 35.92% $6,320 7.49% 46.09% $6,333 0.19% 46.38% $6,290 -0.67% 45.40%
All Other (Incl ZP Amp) $60 1.06% -60.55% $57 -4.70% -62.40% $58 1.41% -61.87% $55 -3.47% -63.19%
Total $5,940 2.81% 32.62% $6,378 7.36% 42.39% $6,391 0.21% 42.68% $6,346 -0.69% 41.69%
COtLEGE OF EASTERN UTAH
Annualized FTE**** 1,141 -1.81% 110.13% 1,309 14.72% 141.07% 1,281 -2.14% 135.91% 1,354 5.70% 149.36%
Ed & Gen + San Juan Ctr $4,895 -0.02% 47.24% $5,290 8.07% 59.12% $5,266 -0.46% 58.38% $5,228 -0.72% 57.24%
All Other $115 -0.16% -45.12% $110 -4.87% -47.79% $155 40.99% -26.39% $149 -3.73% -29.14%
Total $5,011 -0.03% 41.74% $5,400 7.77% 52.76% $5,421 0.38% 53.34% 4'1.377 -0.81k 52.09%
UTAH VALLEY COMMUNITY COLLEGE
Annualized FTE 4,899 -0.97% 70.05% 5,206 6.27% 80.70% 5,302 1.84% 84.03% 5,329 0.51% 84.97%
Education ana General $13,147 3.69% 64.86% $12,996 -1.15% 62.97% $12,962 -0.26% 62.54% $12,965 0.03% 62.58%
All Otner $62 2.25% 27.29% $59 -4.83% 21.14% $59 0.91% 22.24% $57 -3.86% 17.53%
Total $13,208 3.68% 64.64% $13,054 -1.17% 62.71% $13,021 -0.26% 62.30% $13,022 0.01% 62.31%
SALT LAKE COMMUNITY COLLEGE
Annualized FTE 5,720 2.82% 44.30% 5,845 2.19% 47.45% 6,073 3.90% 53.20% 6,530 7.53% 64.73%
Education and General $14,981 3.66% 40.89% $15,070 0.59% 41.73% $15,185 0.76% 42.81% $15,606 2.77% 46.77%
All Other (Excl Sk Ctr) $79 0.06% 102.03% $75 -5.07% 91.78% $75 -0.22% 91.35% $72 -4.23% 83.25%
Total (Excl Sk Ctr) $15,060 3.64% 41.12% $15,145 0.56% 41.91% $15,260 0.76% 42.99% $15,677 2.74% 46.90%
SBR AND STATEWIDE
SBR Administration $1,551 12.09% 16.16% $1,529 -1.38% 14.55% $1,535 0.40% 15.01% $1,506 -1.89% 12.83%
Other Statewide $2,589 -62.36% 52.37% $2,310 -10.75% 35.98% $2.326 0.66% 36.88% $1,996 -14.18% 17.47%
Total $4,139 -49.90% 36.44% $3,840 -7.24% 26.55% $3,861 0.56% 27.26% $3,502 -9.29% 15.43%
TOTAL USHE
Annualized FTE' 54,947 -0.58% 16.09% 56,425 2.69% 19.22% 57,063 1.13% 20.56% 58,012 1.66% 22.57%
Educ & Gen + Other Inst $255.125 0.97% 27.06% $253,008 -0.83% 26.01% $255,685 1.06% 27.34% $251,349 -1.70% 25.18%
All Other Line Items $44,557 -5.98% 23.82% $43,583 -2.18% 21.12% $42,991 -1.36% 19.47% $42,213 -1.81% 17.31%
Total $299,682 -0.13% 26.57% $296,591 -1.03% 25,26% $298,676 0.70% 26.14% )293,561 -1.71% 23.98%
*Excluding Medical **Including Cont Ed Centers ***Including Coop Nursing ****Including San Juan Center
32

History 24-Dec-90 HISTORY OF ENROLLMENT AND BUDGET CHANGES, USHE
iTABLE 4--CONSTANT Dollar State Tax
Funds in thousands of dollars
UNIVERSITY OF UTAH
IIIAnnualized FTE'
Ed & Gen + Coop Nursing
Medical Programs (Incl 5th Pat*1
All Other (Including HUED)I Total
JTAH STATE UNIVERSITY
Annualized FTE**
illEd & Gen + CE Centers + Coop M Ed
Agricultural Programs
All Other (Including Prod Ctr)
Total
IWEBER STATE UNIVERSITY
Annualized FTE'"
Ed & Gen + Coop Nursing
All Other
Total
Annualized FTE
SOUTHERN UTAH UNIVERSITY
Ed & Gen + Coop M Ed
All Other
Total
IRIII
SNOW COLLEGE
Annualized FTE
III
L
Total
Edcation and General
All Other
DIXIE COLLEGE
Annualized FTE
Education and General
All Other (Ind ZP Amp)
Total
iCOLLEGE OF EASTERN UTAH
Ed & Gen + San Juan Ctr
Annualized FTE""
All Other
Total
VALLEY COUNITY COLLEGE
Annualized FIE
UTAH MM
Education and General
il SALT LAXE COMMUNITY COLLEGE
All Other
Total
Annualized FTE
IIIEducation and General
All Other (Excl Sk Ctr)
Total (Excl Sk Ctr)
SBR AND STATEWIDE
III
SBR Administration
Other Statewide
Total
TOTAL USHE
III Annualized FIE*
Educ & Gen + Other Inst
All Other Line Items
Total
1989-90
Actual 1-Yr Inc 13-Yr lac
1990-91
Budget/ 1-Yr Inc 14-Yr Inc
Enr Estmt
18,996 2.01% 0.07% 19,690 3.65% 3.73%
$108,208 0.74% 17.37% $102,789 -5.01% 11.49%
$16,460 0.19% 23.44% $15,900 -3.40% 19.24%
$7,212 23.32% 24.88% $5,808 -19.47% 0.56%
$131,880 1.69% 18.49% $124,496 -5.60% 11.85%
11,205 5.40% 17.72% 12,170 8.61% 27.86%
$54,612 3.32% 30.59% $52,215 -4.39% 24.85%
$12,921 0.14% 31.62% $13,104 1.41% 33.48%
$2,802 -1.75% -7.58% $2,793 -0.34% -7.89%
$70,336 2.51% 28.66% $68,112 -3.16% 24.59%
10,034 5.90% 31.44% 10,560 5.24% 38.33%
$34,192 -1.08% 22.59% $34,254 0.18% 22.81%
$208 -4.44% -40.05% $199 -4.65% -42.84%
$34,400 -1.10% 21.82% $34,453 0.15% 22.00%
3.034 4.84% 57.90% 3,365 10.91% 86.22%
$11,366 8.17% 33.16% $11,338 -0.25% 32.82%
$65 -34.19% -11.30% $64 -2.844 -13.81%
$11,432 7.77% 32.78% $11,402 -0.26% 32.43%
1,616 17.53% 90.34% 1,763 9.10% 107.66%
$6,257 5.71% 52.96% $6,230 -0.44% 52.28%
$26 -4.44% -78.17% $25 -5.90% -79.45%
$6,263 5.66% 49.23% $6,254 -0.46% 48.54%
1,992 10.54% 73.22% 2,088 4.82% 81.57%
$6,649 5.70% 53.69% $6,565 -1.26% 51.75%
$55 -1.80% -63.86% $54 -2.64% -64.81%
$6,704 5.64% 49.68% $6,619 -1.28% 47.77%
1,420 4.87% 161.51% 1,720 21.13% 216.76%
$5,799 10.92% 74.41% $5,855 1.14% 76.39%
$145 -3.09% -31.32% $138 -4.23% -34.23%
$5,943 10.54% 68.12% $6,003 1.00% 69.81%
5,854 9.85% 103.19% 5,650 -3.48% 96.11%
$13,572 4.68% 70.20% $13,939 2.71% 74.80%
655 -2.94% 14.07% $53 -4.08% 9.41%
$13,627 4.65% 69.86% $13,992 2.68% 74.41%
7,584 16.14% 91.32% 9,281 22.38% 134.13%
$17,221 10.35% 61.96% 618,820 9.28% 77.00%
$69 -4.44% 75.11% $65 -5.90% 64.79%
$17,290 10.29% 62.01% $18,885 9.22% 76.95%
$8,866 488.60% 564.14% $1,463 -83.50% 9.59%
$2,336 17.02% 37.47% $1,776 -23.96% 4.52%
$11,201 219.85% 269.20% $3,239 -71.09% 6.75%
61,735 6.42% 30.44% 66,287 7.37% 40.05%
$257,876 2.60% 28.43% $252,014 -2.27% 25.51%
$51,221 21.34% 42.34% $41,440 -19.10% 15.16%
$309,097 5.29% 30.55% $293,454 -5.06% 23.94%
*Excluding Medical **Including Cont Ed Centers ***Including Coop Nursing ****Including San Juan Center
Page 16
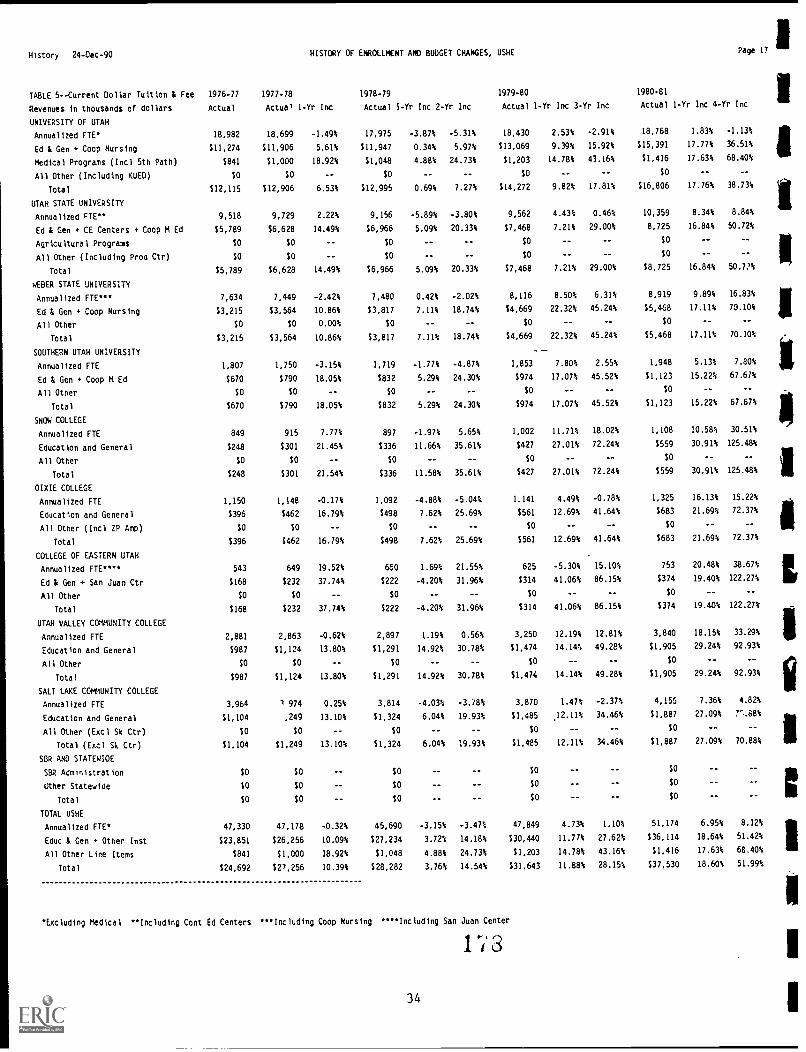
History 24-Dec-90 HISTORY OF ENROLLMENT AND BUDGET CHANGES, USHE Page 17
TABLE 5--Current Dollar Tuition & Fee
Revenues in thousands of dollars
UNIVERSITY OF UTAH
1976-77
Actual
1977-78
Actua' 1-Yr Inc
1978-79
Actual 1-Yr Inc 2-Yr Inc
1979-80
Actual 1-Yr Inc 3-Yr Inc
1980-81
Actual 1-Yr Inc 4-Yr Inc
Annualized FTE* 18,982 18,699 -1.49% 17,975 -3.87% -5.31% 18,430 2.53% -2.91% 18,768 1.83% -1.13%
Ed & Gen + Coop Nursing $11,274 $11,906 5.61% $11,947 0.34% 5.97% 513,069 9.39% 15.92% $15,391 17.77% 36.51%
medical Programs (Incl 5th Path) $841 $1,000 18.92% $1,048 4.88% 24.73% $1,203 14.78s; 43.16% $1,416 17.63% 68.40%
All Other (Including KUED) $O $O -- SO -- -- $0 -- -- $0 -- --
Total $12,115 $12,906 6.53% $12,995 0.69% 7.27% 514,272 9.82% 17.81% $16,806 17.76% 38.73%
UTAH STATE UNIVERSITY
Annualized ;TE** 9,518 9,729 2.22% 9,156 -5.89% -3.80% 9,562 4.43% 0.46% 10,359 8.34% 8.844
Ed & Gen CE Centers + Coop M Ed $5,789 $6,628 14.49% $6,966 5.09% 20.33% $7,468 7.21% 29.00% 8,725 16.84% 50.72%
Agricultural Programs $O SO -- $0 -- -- $0 -- -- $O -- -
All Other (Including Proo Ctr) $0 $0 -- $0 -- -- $0 -- -- $0 -- --
Total 55,789 $6,628 14.49% $6,966 5.09% 20.33% $7,468 7.21% 29.00% 58,725 16.84% 50.77%
WEBER STATE UNIVERSITY
Annualized FTE*** 7,634 7,449 -2.42% 7,480 0.42% -2.02% 8,116 8.50% 6.31% 8,919 9.89% 16.83%
Ed & Gen Coop Nursing $3,215 $3,564 10.86% $3,817 7.11% 18.74% $4,669 22.32% 45.24% $5,468 17.11% 70.10%
All Other $0 $0 0.00% $0 -- -- SO -- -- $0 -- --
Total $3,215 $3,564 10.86% $3,817 7.11% 18.74% $4,669 22.32% 45.24% $5,468 17.11% 70.10%
SOUTHERN UTAH UNIVERSITY - -
Annualized FTE 1,807 1,750 -3.15% 1,719 -1.77% -4.87% 1,853 7.80% 2.55% 1,948 5.13% 7.80%
Ed & Gen + Coop 14 Ed $670 $790 18.05% $832 5.29% 24.30% $974 17.07% 45.52% $1,123 15.22% 67.67%
All Other $0 $0 -- $0 -- -- $0 -- -- $0 -- --
Total $670 $790 18.05% 5832 5.29% 24.30% 5974 17.07% 45.52% 51,123 15.22% 67.67%
SNOW COLLEGE
Annualized FTE 849 915 7.77% 897 -1.97% 5.65% 1,002 11.71% 18.02% 1,108 10.58% 30.51%
Education and General $248 $301 21.45% $336 11.66% 35.61% $427 27.01% 72.24% 5559 30.91% 125.48%
All Other $0 $0 -- $0 -- -- $0 -- -- $0 -- --
Total $248 $301 21.54% $336 11.58% 35.61% $427 27.01% 72.24% $559 30.91% 125.48%
OIXIE COLLEGE
Annualized FTE 1,150 1,148 -0.17% 1,092 -4.88% -5.04% 1.141 4.49% -0.78% 1.325 16.13% 15.22%
Education and General $396 $462 16.79% $498 7.62% 25.69% $561 12.69% 41.64% $683 21.69% 72.37%
All Other (Incl ZP Amp) SO $0 -- SO -- -- SO -- -- $O -- --
Total $396 5462 16.79% $498 7.62% 25.69% $561 12.69% 41.64% 5683 21.69% 72.37%
COLLEGE OF EASTERN UTAH
Annualized FTE**** 543 649 19.52% 660 1.69% 21.55% 625 -5.30% 15.10: 753 20.48% 38.67%
Ed & Gen + San Juan Ctr $168 $232 37.74% $222 -4.20% 31.96% $314 41.06% 86.15% $374 19.40% 122.27%
All Other $0 $0 -- $0 -- -- $0 -- -- $0 -- --
Total $168 $232 37.74% $222 -4.20% 31.96% 5314 41.06% 86.15% 5374 19.40% 122.27%
UTAH VALLEY COMMUNITY COLLEGE
Annualized FTE 2,881 2,863 -0.62% 2,897 1.19% 0.56% 3,250 12.19% 12.81% 3,840 18.15% 33.29%
Education and General $987 $1,124 13.80% $1,291 14.92% 30.78% $1,474 14.14% 49.28% $1,905 29.24% 92.93%
All Other $O $0 -- SO -- -- $0 -- -- $0 -- --
Total $987 $1,124 13.80% $1,291 14.92% 30.78% $1,474 14.14% 49.28% $1,905 29.24% 92.93%
SALT LAKE CCVMUNITY COLLEGE
Annualized FTE 3.964 1 974 0.25% 3,814 -4.03% -3.78% 3,870 1.47% -2.37% 4,155 7.36% 4.82%
Education and General $1,104 ,249 13.10% $1,324 6.04% 19.93% $1,485 .12.11% 34.46% $1,887 27.09% 7.68%
All Other (Excl Sk Ctr) SO $0 -- $O -- -- $0 -- -- $0 -- --
Total (Excl Sk Ctr) $1,104 $1,249 13.10% $1,324 6.04% 19.93% $1,485 12.11% 34.46% $1,887 27.09% 70.88%
SOR AND STATEWIOE
SBR Administration $0 $0 $0 $0 $0
Uther Statewide $0 $O $O $O $O
Total $O $0 $0 $0 $0
TOTAL USHE
Annualized FTE* 47,330 47,178 -0.32% 45,690 -3.15% -3.47% 47,849 4.73% 1.10% 51,174 6.95% 8.12%
Educ & Gen Other Inst $23,851 $26,256 10.09% $27,234 3.72% 14.18% $30.440 11.77% 27.62% $36,114 18.64% 51.42%
All Other Line Items $841 $1,000 18.92% $1,048 4.88% 24.73% $1,203 14.78% 43.16% $1.416 17.63% 68.40%
Total $24,692 521,256 10.39% $28,282 3.76% 14.54% 531,643 11.88% 28.15% $37.530 18.60% 51.99%
*ExCluding Medical **Including Cont Ed Centers ***Including Coop Nursing ***Including San Juan Center
1"I 3
34
1
1
9

lli History 24-0ec-90
II/ TABLE 5--Current Dollar Tuition & Fee
Revenues in thousands of dollars
UNIVERSITY OF UTAH
IIIAnnualized FTE
Ed & Gen + Coop Nursing
Medical Programs (Inc! 5th Path)
All Other (Including KUED)
'Total
UTAH STATE UNIVERSITY
Annualized FTE"
Ed & Gen CE Centers + Coop M Ed
III
Agricultural Programs
All Other (Including Prod Ctr)
Total
WEBER STATE UNIVERSITY
IAnnualized FTE"*"
Ed & Gen Coop Nursing
All Other
Total
111
.-...
S3UTHERN UTAH UNIVERSITY
Annualized FTE
Ed & Gen Coop M Ed
All Other
ITotal
SNOW COLLEGE
Anualized FTE
Education and General
III
All Other
Total
DIXIE COLLEGE
Annualized FTE
Education and General
111All Other (Incl ZP Amp)
Total
COLLEGE OF EASTERN UTAH
III
Annual,zed FTE*"'
Ed & Gen t San Juan Ctr
All Other
Total
IIIUTAH VALLEY COMMUNITY COLLEGE
Annualized TIE........,
Education and General
111
All Other
Total
SALT LAKE COMMUNITY COLLEGE
Annualized FTE
IEducation and General
All Other (Excl Sk Ctr)
Total (Excl Sk Ctr)
SEIR AND STATEWIDE
ISFR Administration
Other Statewide
Total
TOTAL UWE
Annuallzed FTE+
III
.
All Other Line Items
Educ & Gen Other Inst
Total
1
1
HISTCRY Of ENROLLMENT AND BUDGET CHANGES, USHE
1981-82 1982-83 1983-84
Actual 1-Yr Inc 5-Yr Inc Actual 1-Yr Inc 6-Yr Inc Actual 1-Yr Inc 7-Yr Inc 1:::"u8a51
Page 18
1 -Yr Inc 8-Yr Inc
18,833 0.35% -0.78% 19,454 3.30% 2.49% 19,492 u . s 2.6916 19,445 -0.24% 2.44%
$17,140 11.37% 52.03% $18,935 10.47% 67.95% $20,458 8.04% 81.46% $21,771 6.41% 93.10%
$1,294 -8.564 53.99% $1,343 3.74% 59.744 $1,420 5.78% 68.97% $1.567 10.29% 86.37%
$0 -- -- $0 -- -- SO -- -- $0 -- --
$18,434 9.69% 52.17% 520,278 10.00% 67.38% $21,879 7.89% 80.60% $23,337 6.67% 92.63%
10,365 0.06% 8.90% 10,553 1.81% 10.87% 10,989 4.13% 15.45% 10,663 -2.97% 12.03%
$9,515 9.05% 64.36% $10,142 6.59% 75.19% $10,370 2.24% 79.12% $10,490 1.16% 81.20%
$0 -- -- SO -- -- $O -- -- SO -- --
$O -- -- $O -- -- $O -- -- $0 -- --
59,515 9.05% 64.36% $10,142 6.59% 75.19% $10,370 2.24% 79.12% $10,490 1.16% 81.20%
8,924 0.06% 16.90% 9,010 0.96% 18.02% 8,822 -2.09% 15.56% 8,467 -4.02% 10.91%
$5,971 9.20% 85.75% $6,628 11.01% 106.19% $6,868 3.62% 113.65% $7,109 3.52% 121.16%
$0 -- -- $0 -- .... $0 -- -- $0 -- --
55,971 9.20% 85.75% $6,628 11.01% 106.19% $6,868 3.62% 113.65% 17,109 3.52% 121.16%
1,922 -1.33% 6.36% 2,173 13.06% 20.25% 2,315 6.53% 28.11% 2,410 4.10% 33.37%
$1,182 5.28% 76.52% $1,407 19.07% 110.19% $1,482 5.30% 121.33% $1,642 10.82% 145.28%
$0 -- -- $0 -- -- SO -- -- $0 -- --
51,182 5.28% 76.52% $1,407 19.07% 110.19% $1,482 5.30% 121.33% $1,642 10.82% 145.28%
1,132 2.17% 33.33% 1,025 -9.45% 20.73% 1,146 11.80% 34.98% 1,130 -1.40% 33.10%
$683 22.23% 175.61% $624 -8.65% 151.77% $746 19.50% 200.86% $755 1.27% 204.68%
SO -- -- $O -- -- $O -- -- SO -- --
$683 22.23% 175.61% $624 -8.65% 151.77% $746 19.50% 200.86% $755 1.27: 204.68%
1,380 4.15% 20.00% 1,436 4.06% 24.87% 1,449 0.91% 26.00% 1,483 2.35% 28.96%
S7I9 5.35% 81.60% $789 9.77% 99.33% $838 6.15% 111.58% $033 11.35% 135.59%
$0 -- -- SO -- -- $O -- -- SO -- --
$719 5.35% 81.60% 5789 9.77% 99.33% 5838 6.15% 111.58% 5933 11 ,5% 135.59%
829 10.09% 52.67% 922 11.22% 69.80% 1.065 15.51% 96.13% 1,162 9.11% 114.00%
$450 20.32% 167.43% $517 14.76% 206.91% 5590 14.13% 250.27% $630 6.70% 273..4%
$0 -- -- $0 -- -- $0 -- -- SO -- --
$450 20.32% 167.43% $517 14.76% 206.91% $590 14.13% 250.27% /630 6.70% 273.74%
4,349 13.26% 50.95% 5,035 15.77% 74.77% 5,272 4.71% 82.99% 4,947 -6.16% 71.71%
$2,285 19.96% 131.44% $2,953 29.21% 199.05% $3,298 11.71% 234.06% 53,394 2.90% 243.76%
SO -- -- $0 -- -- $O -- -- .a -- --
52,285 19.96% 131.44% $2,953 29.21% 199.05% 53,298 11.71% 234.06% $3,394 2.90% 243.76%
4,573 10.06% 15.36% 5,339 16.75% 34.69% 5,518 3.35% 39.20% 5,563 0.82% 40.34%
52,444 29.54% 121.35% $3,156 29.15% 185.87% 53,820 21.04% 246.01% $3,865 1.17% 250.07%
SO -- -- $0 -- -- $O -- -- SO -- --
$2,444 29.54% 121.35% $3,156 29.1514 185.87% $3,820 21.04% 246.01% $3,865 1.17% 250.07%
$O SO $0 SO
$O SO $0 SO
SO SO $0 SO
52.306 2.21% 10.51% 54,946 5.05% 16.09% 56,068 2.04% 18.46% 55,270 -1.42% 16.78%
$40,390 11.84% 69.34% 545,152 11.79% 89.31% 548,470 7.35% 103.22% $50,589 4.37% 112.10%
51.294 -8.56% 53.99% 51,343 3.74% 59.74% 51,420 5.78% 68.97% 51,567 10.29% 86.37%
$41,684 11.07% 68.82% 546,495 11.54% 88.30% $49,890 7.30% 102.05% 552,156 4.54% 111.23%
*Excluding Medical **Including Cont Ed Centers ***Including Coop Nursing ***InCluding San Juan Center
35

History 24-Dec-90
TABLE 5--Current Oollar Tuition & Fee
Revenues in thousands of dollars
UNIVERSITY OF UTAH
HISTORY OF ENROLLMENT AND BUDGET CHANGES, USHE
1985-86 1986-87 1987-88
Actuai 1-Yr Inc 9-Yr Inc Actual 1-Yr Inc 10-Yr Inc Actual 1-Yr Inc 11-Yr Inc
Page 19
1988-89
Actual 1-Yr Inc 12-Yr Inc
Annualized FTE* 19.153 -1.50% 0.90% 18,892 -1.36% -0.47% 18,896 0.02% -0.45% 18,622 -1.45% -1.90%
Ed & Gen 4. Coop Nursing $23,244 6.77% 106.17% $25,457 9.52% 125.80% $25,942 1.90% 130.10% $27,501 6.01% 143.93%
Medical Programs (Ind 5th Path) $2,210 41.05% 162.87% $1,994 -9.76% 137.23% $1,969 -1.28% 134.20% $2,177 10.61% 159.04%
All Other (Including KUED) $0 -- -- $0 -- -- $0 SO --
Total 125,453 9.07% 110.10% $27,451 7.85% 126.59% $27,911 1.67% 130.39% $29,679 6.33% 144.98%
UTAH STATE UNIVERSITY
Annualized FTE** 10,306 -3.35% 8.28% 10,353 0.46% 8.77% 10,397 0.42% 9.24% 10,631 2.25% 11.69%
Ed & Gen + CE Centers + Coop PI Ed 510,783 2.79% 86.26% $11,707 8.57% 102.23% 611,788 0.69% 103.63% $12,987 10.17% 124.34%
Agricultural Programs $0 -- -- $0 -- -- $0 -- $0 --
All Other (Including Prod Ctr) $O -- -- $0 -- -- $0 -- $0 --
Total $10,783 2.79% 86.26% $11,707 8.57% 102.23% $11,788 0.691; 103.63% 112,987 10.17% 124.34%
WEBER STATE UNIVERSITY
Annualized FTE*** 8,579 1.32% 12.38% 9,027 5.22% 18.25% 9,279 2.79% 21.55% 9,475 2.11% 24.12%
Ed & Gen + Coop Nursing $7,695 8.24% 139.39% $8,749 13.70: 172.18% $9,378 7.18% 191.72% $10,645 13.51% 231.14%
All Other $0 -- -- $0 -- -- $O -- $O --
Total 17,695 8.24% 139.39% $8,749 13.70% 172.18% $9,378 7.18% 191.72% $10,645 13.51% 231.14%
SOUTHERN uTAH UNIVERSITY
Annualized FTE 2,361 -2.03% 30.66% 2,685 13.72% 48.59% 2,779 3.50% 53.79% 2,894 4.14% 60.15%
Ed & Gen Coop M Ed $1,717 4.54% 156.41% 62,073 20.72% 209.55% 62,169 4.66% 223.98% $2,426 11.85% 262..7%
All Other $0 -- -- $O -- -- $O -- $O --
Total $1,717 4.54% 156.41% $2,073 20.72% 209.55% $2,169 4.66% 223.98% $2,426 11.85% 262.37%
SNOW COLLEGE
Annualized FTE 1,142 1.06% 34.51% 1,265 10.77% 49.00% 1,244 -1.66% 46.53% 1,375 10.53% 61.96%
Education and General $816 8.04% 229.19% $973 19.16% 292.28% $1,058 8.81% 326.84% $1,157 9.29% 366.49%
All Other $0 -- -- $O -- -- $O $O
Total $816 8.04% 229.19% 1973 19.16% 292.28% 11,058 8.81% 326.84% $1,157 9.29% 366.49%
DIXIE COLLEGE
Annualized FTE 1,646 10.99% 43.13% 1,843 11.97% 60.26% 1,745 -5.32% 51.74% 1,802 3.27% 56.70%
Education and General $1,141 22.26% 188.04% $1,317 15.42% 232.46% $1,569 19.18% 296.24% $1,622 3.35% 309.520;
All Other (Incl ZP Amp) $0 -- -- $0 -- -- $0 -- $0 --
Total $1,141 22.26% 188.04% 61,317 15.42% 232.46% $1,569 19.18% 296.24% 11,622 3.35% 309.52%
COLLEGE OF EASTERN UTAH
Annualized FTE**** 1,141 -1.81% 110.13% 1,309 14.72% 141.07% 1,281 -2.14% 135.91% 1,354 5.70% 149.36:
Ed & Gen 4. San Juan Ctr $714 13.48% 324.13% $842 17.79% 399.59% 6810 -3.79% 380.68% $884 9.21% 424.96%
All Other SO -- -- SO -- -- $O -- $O --
Total $714 13.48% 324.13% $842 17.79% 399.59% $810 -3.79% 380.6811 $884 9.21% 424.96%
UTAH VALLEY COMMUNITY COLLEGE
Annualized FTE 4,899 -0.97% 70.05% 5,206 6.27% 80.70% 5,302 1.84% 84.03% 5,329 0.51% 84.97%
Education and Gereral $3,834 12.96% 288.31% $4,594 19.83% 365.32% $4,854 5.65% 391.63% $5,284 8.85% 435.16%
All Other $0 -- -- $0 -- -- $O SO --
Total $3,834 P.96% 288.31% $4,594 19.83% 365.32% $4,854 5.65% 391.63% $5,284 8.85% 435.16%
SALT LAKE COMMUNITY COLLEGE
Annualized FTE 5,720 2.82% 44.30% 5,845 2.19% 47.45% 6,073 3.90% 53.20% 6,530 7.53% 64.73%
Education and General $4,606 19.18% 317.20% $5,304 15.14% 380.36% $5,478 3.29% 396.18% $6,422 17.23% 481.66%
All Other (Excl Sk Ctr) $O -- -- $O -- -- $O -- $O --
Total (Excl Sk Ctr) $4,606 19.18% 317.20% $5,304 15.14% 380.36% $5,478 3.29% 396.18% $6,422 17.23% 481.66%
SBR AND STATEWIDE
SBR Administration $0 $O $O $0
Other Statewide $O $O $O $O
Total SO $O $0 $0
TOTAL USHE
Annualized FTE' 54,947 -0.58% 16.09% 56,425 2.69% 19.22% 57,063 1.13% 20.56% 58,012 1.66% 22.57%
Educ & Gen Other Inst $54,550 7.83% 128.71% $61,015 11.85% 155.81% $63,046 3.33% 164.33% $68,928 9.33% 188.99%
AlI Otner Line Items $2,210 41.05% 162.87% $1,994 -9.76% 137.23% $1,9R9 -1.28% 134.20% 62,I77 10.61% 159.04%
Total 656,759 8.83% 129.87% $63,009 11.01% 155.18% 165,015 3.18% 163.31% $71,105 9.37% 187.97%
*Excluding Helical **Including Cont Ed Centers ***Including Coop Nursing ****Including San Juan Center
36 1 )
1

yistor 24-Dec-90It HISTORY OF ENROLLMENT AND BUDGET CHANGES, USHE
1989-90 1990-91
Actual 1-Yr Inc 13-Yr Inc Budget/ 1-Yr Inc 14-Yr Inc
Enr Estmt
18,996 2.01% 0.07% 19,690 3.65% 3.73%
$30,453 10.73% 170.12% $34,721 14.01% 207.97%
$2,430 11.59% 189.05% $2,770 13.99% 229.49%
$0 -- -- $0 -- --
532,883 10.80% 171.43% $37,491 14.01% 209.46%
11,205 5.40% 17.72% 12,170 8.61% 27.86%
$14,874 14.53% 156.93% $17,217 15.75% 197.40%/
-- -- $0 -- --
$0 -- -- $0 -- --
$14,874 14.53% 156.93% $17,217 15.75% 197.40%
10,034 5.90% 31.44% 10.560 5.24% 38.33%
$12,066 13.36% 275.36% $12,982 7.59% 303.84%
$0 -- -- $0 -- --
$12,066 13.36% 275.36% 112,982 7.59% 303.84%
3,034 4.84% 67.90% 3,365 10.91% 86.22%
$2,978 22.72% 344.70% $3,466 16.39% 417.56%
$O -- -- $0 -- --
12,978 22.72% 344.70% $3,466 16.39% 417.56%
1,616 17.53% 90.34% 1,763 9.10% 107.66%
$1,594 37.81% 542.88% $1,732 8.65% 598.46%
$0 -- -- $O -- --
$1,594 37.81% 542.88% $1,732 8.65% 598.46%
1,992 10.50 73.22% 2,088 4.82% 81.57%
$1,877 15.74% 373.99% $1,974 5.16% 398.46%
$0 -- -- SO -- --
11,877 15.74% 373.99% $1,974 5.16% 398.46%
1,420 4.87% 161.51% 1,720 21.13% 216.76%
$1,030 16.48% 511.46% $1,284 24.67% 662.30%
10 -- -- SO -- --
11,030 16.48% 511.46% 11,284 24.67% 662.30%
5,854 9.85% 103.19% 5,650 -3.48% 96.11%
$6,452 22.11% 553.47% 16,788 5.21% 587.51%
$0 -- -- $0 -- --
$6,452 22.11% 553.47% $6,788 5.21% 587.51%
7,584 16.14% 91.32% 9,281 22.38% 134.13%
$8,139 26.74% 637.21% II/$8,845 8.67% 701.13%
$0 -- -- $0 -- --
S8,139 26.74% 637.21% $8,845 8.67% 701.13%
$0 SO
$0 $0
$0 SO
61,735 6.42% 30.44% 66,287 7.37% 40.05%
$79,463 15.28% 233.16% 189,008 12.01% 273.18%
$2,430 11.59% 189.05% $2.770 13.99% 229.49%
181,893 15.17% 231.66% 591,777 12.07% 271.69%
It ABLE 5--Current Dollar Tuition & Fee
evenues in thousands of dollars
UNIVERSITY OF UTAH
Annualized FTE*
11/
Ed & Gen + Coop Nursing
Medical Programs (Intl 5th Path)
All Other (Including KUED)
Total
IIIUTAH STATE UNIVERSITY
Annualized FTE**
Ed & Gen + CE Centers + Coop M Ed
111
Agricultural Programs SO
All Other (Including Prod Ctr)
. Total
WEBER STATE UNIVERSITY
IAnnualized FTE***
Ed & Gen + Coop Nursing
All Other
Total
II/SOUTHERN UTAH UNIVERSITY
Annualized FTE
Ed & Gen + Coop M Ed
All Other
111
Total
SNOW COLLEGE
Annualized FTE
Education and G.zneral
III
All Other
Total
DIXIE COLLEGE
Annualized FTE
Education and General
All Other (Incl ZP Amp)
Total
COCLEGE OF EASTERN UTAH
IIIAnnualized FTE****
Ed & Gen + San Juan Ctr
All Other
Total
11/
UTAH VALLEY COMMUNITY COLLEGE
Annualized FTE
Education and General
All Other
IIITotal
SALT LAKE COMMUNITY COLLEGE
Annualized FTE
Education and General
All Other (Excl Sk Ctr)
Total (Excl Sk Ctr)
SBR AND STATEWIDE
SBR Administration
ill
Other Statewide
Total
TOTAL USHE
III Annualized FTE*
Educ & Gen 06.er Inst
All Other Line Items
Total
*Excluding Medical **Including Cont Ed Centers ***Including Coop Nursing ****Including San Juan Center
Page 20

History 24-Dec-90 HISTORY OF ENROLLMENT AND BUDGET CHANGES, USHE Page 21
Table 6--CONSTANT Dollar Tuition &
Fee Revenues in thousands of dollars
UNIVERSITY OF UTAH
1976-77
Actual
1977-78
Actual 1-Yr Inc
1978-79
Actual 1-Yr Inc 2-Yr Inc
1979-80
Actual 1-Yr Inc 3-Yr Inc
1980-81
Actual 1-Yr Inc 4-Yr Inc
Annualized FTE* 18.982 18,699 -1.49% 17,975 -3.87% -5.31% 18,430 2.53% -2.91% 18,768 1.83% -1.13%
Ed & Gen + Coop Nursing $25,958 $25,692 -1.02% $23,647 -7.96% -8.90% $22,832 -3.45% -12.04% $23,898 4.67% -7.94%
Medical Programs (Ind 5th Path) $1,935 $2,157 11.45% $2,075 -3.80% 7.22% $2,102 1.31% 8.63% $2,198 4.55% 13.57%
All Other (Including KUED) $0 $0 -- SO -- -- $0 -- -- $O -- --
Total $27,893 $27,849 -0.16% $25,722 -7.64% -7.78% 524,934 -3.06% -10.61% $26,095 4.66% -6.44%
uTAH STAT: UNIVERSITY
Annualized FTE** 9,518 9,729 2.22% 9,156 -5.89% -3.80% 9,562 4.43% 0.46% 10.359 8.34% 8.84%
Ed & Gen + CE Centers + Coop M Ed $13,329 614,302 7.30% $13,787 -3.60% 3.44% $13,041 -5.37% -2.11% 613,548 3.84% 1.65%
Agricultural Programs SO SO -- $0 -- -- $0 -- -- $0 .._ _-
All Other (Including Prod Ctr) SO SO $0 -- -- $0 -- -- $0 -- --
Total $13,329 $14,302 7.30% $13,787 -3.60% 3.44% $13,047 -5.37% -2.11% $13,548 3.84% 1.65%
WEBER STATE UNIVERSITY
Annualized FTE*** 7,634 7,449 -2.42% 7,480 0.42% -2.02% 8,116 8.50% 6.31% 8,919 9.89% 16.83%
Ed & Gen + Coop Nursing $7,401 $7,690 3.90% $7,555 -1.75% 2.08% $8,157 7.97% 10.21% $8,490 4.09% 14.71%
All Other $O $O -- SO -- -- $0 -- -- SO -- --
Total $7,401 $7,690 3.90% 57,555 -1.75% $8,157 7.97% 10.21: $8,490 4.09% 14.71%
SOUTHERN UTAH UNIVERSITY
.2.08%
Annualized FTE 1,807 1,750 -3.15% 1,719 -1.77% -4.87% 1,853 7.80% 2.55% 1,948 5.13% 7.80%
Ed & Gen . Coop M Ed $1,542 $1,706 10.64% $1,647 -3.42% 6.86% $1,702 3.34% 10.42% $1,743 2.40% 13.07%
All Other $O $0 -- $0 -- -- $O -- -- $O -- --
Total $1,542 $1,706 10.64% 11,647 -3.42% 6.86% $1,702 3.34% 10.42% $1,743 2.40% 13.07%
SNOW COLLEGE
Annualized FTE 849 915 7.77% 897 -1.97% 5.65% 1,002 11.71% 18.02% 1,108 10.58% 30.51%
Education and General $571 $650 13.82% $665 2.42% 16.58% $746 12.10% 30.69% $868 16.35% 52.06%
All Other SO $0 -- $O .... -- $0 -- -- $O -- --
Total $571 $650 13.91% 6665 2.35% 16.58% $746 12.10% 30.69% 5868 16.35% 52.06%
DIXIE COLLEGE
Annualized FTE 1,150 1,148 -0.17% 1,092 -4.88% -5.04% 1,141 4.49% -0.78% 1,325 16.13% 15.22%
Education and General $912 $998 9.45% $985 -1.28% 8.05% 6980 -0.53% 7.48% $1,060 8.16% 16.24%
All Other (Inc) ZP Amp) $0 $0 -- $0 -- -- $0 -- -- $0 -- --
Total $912 $998 9.45% $985 -1.28% 8.05% $980 -0.53% 7.48% 61,060 8.16% 16.24%
COLLEGE OF EASTERN UTAH
Annualized FTE**** 543 649 19.52% 660 1.69% 21.55% 625 -5.30% 15.10% 753 20.48% 38.67%
Ed & Gen + San Juan Ctr $388 $501 29.09% $440 -12.12% 13.45% 6548 24.51% 41.25% 1581 6.12% 49.89%
All Other $O $0 -- $0 -- -- $0 -- -- SO --
Total' $388 $501 29.09% $440 -12.12% 13.45% $548 24.51% 41.25% $581 6.12% 49.89%
UTAH VALLEY COMMUNITY COLLEGE
Annualized FTE 2,881 2,863 -0.62% 2,897 1.19% 0.56% 3,250 12.19% 12.81% 3,840 18.15% 33.29%
Education and General $2,273 $2,424 6.65% $2,556 5.42% 12.43% $2,575 0.75% 13.27% $2,958 14.87% 30.11%
All Other SO $O -- $0 -- -- $O -- -- $0 -- --
Total $2,273 52,424 6.65% $2,556 5.42% 12.43% $2,575 0.75% 13.27% 62,958 14.87% 30.11%
SALT LAKE COMMUNITY COLLEGE
Annualized FTE 3.964 3,974 0.25% 3,814 -4.03% -3.78% 3,870 1.47% -2.37% 4,155 7.36% 4.82%
Education and General $2,542 $2.694 6.004 $2,621 -2.73% 3.10% $2,594 -1.04% 2.03% $2,929 12.95% 15.24%
All Other (Excl Sk Ctr) $0 SO -- $O -- -- $0 ERR ERR $0 _.. --
Total (Excl Sk Ctr) $2,542 $2,694 6.00% $2.621 -2.73% 3.10% $2,594 -1.04% 2.03k 62.929 12.95% 15.24%
SBR AND STATEWIDE
SEiR Administration $O $O SO SO $0
Other Statewide SO SO $0 $0 $O
Total $0 $O $0 SO $0
TOTAL USHE
Annualized FTE* 47,330 47,176 -0.33% 45,690 -3.15% -3.47% 47,849 4.73% 1.10% 51,174 6.95% 8.12%
Edix & Cen . Other Inst $54,915 $56,656 3.17% $53,904 -4.86% -1.84% $53,180 -1.34% -3.16% $56,075 5.44% 2.11%
All Other Line Items $1,935 $2,157 11.45% $2,075 -3.80% 7.22% $2,102 1.31% 8.63% $2,198 4.55% 13.57%
Total 556,850 $58,814 3.45% 555,979 -4.82% -1.53% 655,283 -1.24% -2.76% 658,273 5.41% 2.50%
+Excluding medical **Including Cont Ed Centers ***Including Coop Nursing ****Including San Juan Center
38

History 24-Dec-90 HISTORY OF ENROLLMENT AND BUDGET CHANGES, USHE
Table 6--CONSTANT Dollar Tuition &
Fee Revenues in thousands of dollars
UNIVERSITY OF UTAH
Annualized FTE*
Ed & Gen + Coop Nursing
Medical Programs (Incl 5th Path)
All Other (Including HUED)
111
Total
UTAH STATE UNIVERSITY
Annualized FTE**
Ed & Gen + CE Centers + Coop M Ed
Agricultural Programs
All Other (Including Prod Ctr)
,.. Total
WEBER STATE UNIVERSITY
IAnnualized FTE***
Ed & Gen Coop Nursing
All Other
Total
ISOUTHERN UTAH UNIVERSITY
Annualized FTE
Ed & Gen * Coop M Ed
All Other
11/
Total
SNOW COLLEGE
- Annualized FTE
Education and General
111A11 Other
Total
DIXIE COLLEGE
Annnalizea FTE
IIIEducation and General
All Other (:ncl ZP Amp)
Total
COLLEGE OF EASTERN uTAH
/IIAnnualized FTE****
Ed & Gen San Juan Ctr
All Other
Total'
IIIUTAH VALLEY COMMUNITY COLLEGE
Annualized FTE
Education and General
All Other
IIITotal
SALT LAKE COMMUNITY COLLEGE
Annualized FTE
Education and General
i. All Other (Excl Sk Ctr)
Total (Excl Sk Ctr)
SBR AND STATEWIDE
58R Administration
IIIOther Statewide
Total
TOTAL USHE
IIIAnnualized FTE*
Eat & Gen 4. Other Inst
All Other Line Items
Total
Page 22
1981-82
Actual 1-Yr Inc 5-Yr Inc
1982-83
Actual 1-Yr Inc 6-Yr Inc
1983-84
Actual 1-Yr Inc 7-Yr Inc
1984-85
Actual 1-Yr Inc 8-Yr Inc
18,833 0.35% -0.78% 19,454 3.30% 2.49% 19,492 0.20% 2.69% 19,445 -0.24% 2.44%
$24,434 2.24% -5.87% $25,997 6.40% 0.15% $27,062 4.10% 4.26% $27,704 2.37% 6.7321
$1,845 -16.05% -4.66% $1,843 -0.09% -4.75% $1,879 1.92% -2.92% $1,993 6.11% 3.01%
SO -- -- $0 -- -- $0 -- -- $O -- --
$26,279 0.70% -5.79% $27,841 5.94% -0.19% $28,941 3.95% 3.76% 129,698 2.61% 6.47%
10,365 0.06% 8.90% 10,553 1.81% 10.87% 10,989 4.13% 15.45% 10,663 -2.97% 12.03%
113,564 0.12% 1.77% $13,925 2.66% 4.47% $13,717 -1.49% 2.91% $13,349 -2.68% 0.15%
$O -- -- $O -- -- $0 -- -- $0 -- --
$O $O -- -- SO $O
113,564 0.12% 1.77% $13,925 2.66% 4.47% $13,717 -1.49% 2.91% $13,349 -2.68% 0.15%
8,924 0.06% 16.90% 9,010 0.96% 18.02% 8.822 -2.09% 15.56% 8,467 -4.02% 10.91%
$8,512 0.25% 15.00% $9,100 6.91% 22.96% $9,085 -0.17% 22.75% $9,047 -0.42% 22.244
$O -- -- $O -- -- $O $O -- --
$8,512 0.25% 15.00% $9,100 6.91% 22.96% $9,085 -0.17% 22.75% $9,047 -0.42% 22.241;
1,922 -1.33% 6.36% 2,173 13.06% 20.25% 2,315 6.53% 28.11% 2,410 4.10% 33.37,6
$1,685 -3.34% 9.29% $1,932 14.68% 25.34% $1,960 1.45% 27.16% $2,090 6.61% 35.57%
SO -- -- 10 -- -- SO -- -- Si -- ....
$1,685 -3.34% 9.29% 11,932 14.68% 25.34% $1,960 1.459; 27.16% 12,0J0 6.61% 35.57%
1,132 2.17% 33.33% 1,025 -9.45% 20.73% 1,146 11.80% 34.98% 1,130 -1.40% 33.10%
6974 12.22% 70.64% $857 -12.02% 50.13% 087 15.13% 72.85% $961 -2.57% 68.40%
$O -- -- $0 -- -- SO -- -- SO -- --
$974 12.22% 70.64% $857 -12.02% 50.13% $987 15.13% 72.85% $961 -2.57% 68.40k
1,380 4.15% 20.00% 1,436 4.064 24.87% 1,449 0.91% 26.00% 1,483 2.35% 28.96%
$1,025 -3.28% 12.43% $1,084 5.72% 18.86% $1,108 2.27% 21.56% $1,187 7.12% 30.21%
$0 -- -- $0 -- -- $0 -- -- $0 -- --
11,025 -3.28% 12.43% 51,084 5.72% 18.86% $1,108 2.27% 21.56% $1,187 7.12% 10.21%
829 10.09% 52.67% 922 11.22% 69.80% 1,065 15.51% 96.13% 1,162 9.11% 114.00%
$642 10.46% 65.58% $710 10.53% 83.02% $780 9.96% 101.24% $801 2.65% 106.57%
$O -- -- $0 -- -- SO -- -- $O -- --
$642 10.46% 65.58% $710 10.53% 83.02% $780 9.96% 101.24% $801 2.65% 106.57%
4,349 13.26% 50.95% 5,035 15.77% 74.77% 5,272 4.71% 82.99% 4,947 -6.16% 71.71%
$3,257 10.13% 43.30% $4,054 24.45% 78.33% $4,363 7.63% 91.93% $4,319 -1.01% 90.00%
SO -- -- 10 -- -- $O -- -- $O -- --
$3,257 10.13% 43.30% $4,054 24.45% 78.33% $4,363 7.63% 91.93% $4,319 -1.01% 90.00%
4,573 10.06% 15.36% 5,339 16.75% 34.69% 5,518 3.35% 39.20% 5363 0.82% 40.34%
13,484 16.93% 37.05% $4,333 24.38% 70.47% $5,053 16.62% 98.79% $4.918 -2.67% 93.48:
$O -- -- $O -- -- $0 -- -- $O -- --
$3,484 15.93% 37.05% 14,333 24.38% 70.47% $5,053 16.62% 98.79% $4,918 -2.67% 93.48%
$O SO $0 $0
SO SO SO SO
SO SO SO $0
52,306 2.21% 10.51% 54,946 5.05% 16.09% 56,068 2.04% 18.46% 55,270 -1.42% 16.78%
157,577 2.58% 4.854 $61,992 7.67% 12.89% $64,116 3.43% 16.76% $64,377 0.41% 17.23%
$1,845 -16.05% -4.66% 11,843 -0.09% -4.75% $1,879 1.92% -2.92% $1,993 6.11% 3.01%
559 422 1.97% 4.52% $63,835 7.43% 12.29% $65,995 3.38% 15.09% $66,371 0.57% 16.75%
*ExCluding Medical **Including Cont Ed Centers ***Including Coop Nursing *1**Including San Juan Center
49r. r)

History 24-0ec-90
Table 6--CONSTANT Dollar Tuition &
Fee Re,..enues in thousands of dollars
UNIVERSITY OF UTAH
HISTORY OF ENROLLMENT AND BUDGET CHANGES, USHE
1985-86 1986-87 1987-88
Actual 1-Yr Inc 9-Yr Tnc Actual 1-Yr Inc 10-Yr Inc Actual 1-Yr Inc II-Yr Inc
Page 23
1988-89
Actual 1-Yr Inc I2-Yr Inc
Annualized FTE* 19,153 -1.50% 0.90% 18,892 -1.36% -0.47N 18,896 0.02% -0.45% 18,622 -1.45% -1.90%
Ed & Gen + Coop Nursing $28,496 2.864 9.78% $30,871 8.33% 18.93% $30,123 -2.42% 16.05% $30,582 1.52% 17.82%
Medical Programs (Inc) 5th Path) $2.709 35.89% 39.98% $2,418 -10.74% 24.95% $2,286 -5.47% 18.11% $2,421 5.93% 25.11%
All Other (Including KUED) $O -- -- $O -- -- $0 -- SO --
Total $31,205 5.08% 11.87% $33,289 6.68% 19.35% $32,409 -2.64% 16.19% $33,004 1.83% 18.32%
UTAH STATE UNIVERSITY
Annualized FTE** 10,306 -3.35% 8.28% 10,353 0.46% 8.77% 10,397 0.42% 9.24% 10,631 2.25% 11.69%
Ed & Gen * CE Centers + Coop M Ed $13,219 -0.97% -0.82% $14,197 7.39% 6.51% $13,688 -3.58% 2.70% $14,442 5.51% 8.35%
Agricultural Programs $0 -- -- $O -- -- $0 -- SO --
All Other (Including Prod Ctr) $0 -- -- SO -- SO $O --
Total $13,219 -0.97% -0.821; $14,197 7.39% 6.51% $13,688 -3.58% 2.70% $14,442 5.51% 8.35%
wEBER STATE UNIVERSITY
Annualized EU*** 8,579 1.32% 12.384 9,027 5.22% 18.25% 9,279 2.79% 21.55% 9,475 2.11% 24.12%
Ea a Gen * Coop Nursing $9,434 4.28% 27.47% $10,610 12.46% 43.36% $10,889 2.63% 47.13% $11.837 8.71% 59.94%
All Other $O -- SO -- -- $O $0 --
Total $9,434 4.26% 27.47% $10,610 12.46% 43.36% $10,889 2.63% 47.13: $11,837 8.71% 59.94%
SOUTHERN UTAH uNIVERSITY
Annualized FTE 2,361 -2.03% 30.66% 2,685 13.72% 48.59% 2,779 3.50% 53.79% 2,894 4.14% 60.15%
Ed & Gen 4 Coop M Ed $2,105 0.71% 36.53% $2,514 19.41% 63.04% $2,519 0.22% 63.40% $2,698 7.11% 75.02%
All Other SO -- -- SO -- -- $O -- $0 --
Total $2,105 0.71% 36.53% $2,514 19.41% 63.04% $2,519 0.22% 63.40% $2,698 7.11% 75.02%
SNOW COLLEGE
Annualized FTE 1,142 1.06% 34.51% 1,265 10.77% 49.00% 1,244 -1.66% 46.53% 1,375 10.53% 61.96%
Education and General $1,001 4.09% 75.29% $1,179 17.87% 106.61% $1,229 4.19% 115.27% $1,286 4.66% 125.31%
All Other $0 -- -- $O -- -- SO SO --
Total $1,001 4.09% 75.29% $1,179 17.137% 106.61% $1,229 4.19% 115.27% 51,286 4.66% 125.31%
DIXIE COLLEGE
Annualized FTE 1,646 10.99% 43.13% 1,843 11.97% 60.26% 1,812 -1.68% 57.57% 1,802 -0.55t 56.70#
Education and General $1,398 17.79% 53.38% $1,597 14.17% 75.11% $1,822 14.12% 99.84% $1,803 -1.02% 97.79%
All Other (Incl ZP Amp) $O -- -- SO -- -- SO -- $0 --
Total 51,398 17.79% 53.38% $1,597 14.17% 75.11% $1,822 14.12% 99.84% $1,803 -1.02% 97.79%
COLLEGE OF EASTERN UTAH
Annualized FTE**** 1 141 -1.81: 110.13% 1,309 14.72% 141.07% 1,281 -2.14% 135.91% 1.354 5.70% 149.36%
Ed & Gen 4. San Juan Ctr $876 9.33% 125.84% $1,021 16.51% 163.13% $940 -7.87% 142.42% $983 4.59% 153.55%
All Other $0 -- -- $0 -- -- SO -- SO --
Total $876 9.33% 125.84% $1,021 16.51% 163.13% $940 -7.87% 142.42% $983 4.59% 153.55%
UTAH VALLEY COMMUNITY COLLEGE
Annualized FTE 4,899 -0.97% 70.05% 5,206 6.27% 80.70% 5,302 1.84% 84.03% 5,329 0.51% 84.97%
Education and General $4,700 8.83% 106.77% $5,571 18.53% 145.08% $5,636 1.17% 147.95% $5,876 4.25% 158.47%
All Other SO -- -- $0 $0 -- SO --
Total $4,700 8.83% 106.77% 55,571 18.53% 145.08% $5,636 1.17% 147.95% 55,876 4.25% 158.47%
SALT LAKE COMMUNITY COLLEGE
Annualized FTE 5,720 2.82% 44.30% 5,845 2.19% 47.45% 6.073 3.90% 53.20% 6,530 7.534 64.73%
Education and General $5,647 14.82% 122.15% $6,432 13.89% 153.01% $6,361 -1.09% 150.24% $7,141 12.27% 180.94%
All Other (Excl Sk Ctr) SO -- -- $0 -- -- $O SO --
Total (Excl Sk Ctr) $5,647 14.82% 122.15% $6,432 13.89% 153.01% $6,361 -1.09% 150.24% $7,141 12.27% 180.94%
SIR AND STATEWIDE
58R Adwhistration $0 SO SO SO
Cther Statewide SO $O SO So
Total SO $0 SO SO
TOTAL USHE
Annual:zed FTE 54,947 -0.58% 16.09% 56,425 2.69% 19.22% 57,063 1.13% 20.56% 58,012 1.66% 22.57%
Educ & Gen + Other Inst $66,871 3.88% 21.78% $73,991 10.64% 34.74% $73,208 -1.06% 33.31% $76,650 4.70% 39.58%
All Other Line Items $2,709 35.89% 39.98% $2,418 -10.74% 24.95% $2,286 -5.47% 18.111 $2,421 5.93% 25.11%
Total 569,586 4.84% 22.40% 576,409 9.80% 34.40% $75,494 -1.20% 32.79% $79,071 4.74% 39.09%
*Excluding Medical **Including Cost Ed Centers "'Including Coop Nursing ****Including San Juan Center
40
I 4
1

111History 24-Dec-90 HISTORY OF ENROLLMENT ANO BUDGET CHANGES, USHE
II/ Table 6--CONSTANT Oollar Tuition &
Fee Revenues in thousands of dollars
UNIVERSITY OF UTAH
III
Annualized FTE
Ed & Gen + Coop Nursing
Medical Programs (Incl 5th Path)
All Other (Including KUED)
gTotal
UTAH STATE UNIVERSITY
Annualized FTE'"
Ed & Gen + CE Centers + Coop 14 Ed
IIIAgricultural Programs
All Other (Including Prod Ctr)
Total
WEBER STATE UNIVERSITY
IAnnualized FTE"'
Ed & Gen + Coop Nursing
All Other
Total
ISOUTHERN UTAH UNIVERSITY
Annualized FTE
Ed & Gen + Coop M Ed
All Other
III
Total
SNOW COLLEGE
Annualized FTE
Education and General
All Other
Total
DIXIE COLLEGE
Annualized FTE
III
Education and General
All Other (Incl ZP Amp)
Total
COLLEGE OF EASTERN UTAH
IIIAnnualized FTE"'"
Ed & Gen + San Juan Ctr
All Other
Total
IIIUTAH VALLEY COMMUNITY COLLEGE
Annualized FTE
Education and General
All Other
111
Total
SALT LAKE COMMUNITY COLLEGE
Annualized FTE
Education and General
IAll Other (Excl Sk Ctr)
Total (Excl Sk Ctr)
SBR ANO STATEWIDE
SBR Administration
III
Other Statewide
Total
TOTAL USHE
111
nnualized FTE'
Educ & Gen + Other Inst
All Other Line Items
Total
1989-90
Actual 1-Yr Inc 13-Yr Inc
1990-91
Budget/ 1-Yr Inc 14-Yr Inc
Enr Estmt
18,996 2.01% 0.07% 19,690 3.65% 3.73%
$32,361 5.82% 24.67% $34,721 7.29% 33.76%
$2,582 6.63% 33.41% $2,770 7.27% 43.11%
$0 -- -- $0 -- --
$34.943 5.88% 25.28% $37,491 7.29% 34.41%
11,205 5.40% 17.72% 12,170 8.61% 27.86%
$15,806 9.44% 18.58% $17,217 8.93% 29.17%
$O -- -- $O -- --
$O -- -- $O -- --
$15,806 9.44% 18.58% 517,217 8.93% 29.17%
10,034 5.90% 31.444 10,560 5.24% 38.33%
$12,822 8.32% 73.24% $12,982 1.24% 75.40%
$O -- -- $0 -- --
:12,822 8.32% 73.248 $12,982 1.24% 75.40%
3,034 4.84% 67.90% 3,365 10.91% 86.22%
$3,164 17.27% 105.25% $3,466 9.52% 124.79%
$0 -- -- $0 -- --
$3,164 17.27% 105.25% $3,466 9.52% 124.79%
1,616 17.53% 90.34% 1,763 9.10% 107.66%
$1,694 31.69% 196.71% $1,732 2.24% 203.36%
$O -- -- $0 -- --
$1,694 '41.69% 196.71% 51,732 2.24% 203.36%
-
1,992 10.54,1 73.22% 2,088 4.82% 81.57%
$1,995 10.60% 118.76% $1,974 -1.04% 116.50%
$0 -- -- $O -- --
$1.995 10.60% 118.76% $1,974 -1.04% 116.50%
1,420 4.87% 161.51% 1,720 21.13% 216.76%
$1,095 11.30% 182.21% $1,284 17.32% 231.09%
$O -- -- $0 -- --
$1,095 11.30% 182.21% 51,284 17.32% 231.09%
5,854 9.85% 103.19% 5,650 -3.48% 96.11%
$6,856 16.69% 201.60% $6.788 -0.99% 198.61%
$O -- -- $0 -- --
56,856 16.69% 201.60% $6,788 -0.99% 198.61%
7,584 16.14% 91.32% 9,281 22.38% 134.13%
$8,649 21.11% 240.25% $8,845 2.26% 247.95%
$0 -- -- $0 -- --
58.649 21.11% 240.25% C8,845 2.26% 247.95%
SO $O
$0 SO
SO SO
61,735 6.42% 30.44%66A.287 7.37% 40.05%
$84,441 10.17% 53.77% $89,008 5.41% 62.08%
$2,582 6.63N 33.41% $2,770 7.27% 43.11%
$87,023 10.06% 53.07% $91,777 5.46% 61.44%
'Excluding Medical **Including Cont Ed Centers ***Including Coop Nursing ****Including San Juan Center
4 1

mistory 24-Dec-90 HISTCRY OF ENROLLMENT AND BUDGET CHANGES, USHE Page 25
TABLE 7--CURRENT DOLLAR EXPENDITURES, 1976-77
TAx FUNDS, & TUITION/FEES PER FTE Actual
UNIVERSITY OF uTAH--E&G + Coop Nurs
1977-78
Actual 1-Yr Inc
1978-79
Actual 1-Yr Inc 2-Yr Inc
1979-80
Actual 1-Yr Inc 3-Yr Inc
1980-81
Actual 1-Yr Inc 4-Yr Inc
Annualized FTE* 18,982 18,699 -1.49% 17,975 -3.87% -5.31% 18,430 2.53% -2.91% 18,768 1.83% -1.13%
Current S Expenditures/FTE $2,917 $3,249 11.39% $3,715 14.35% 27.38% $3,880 4.43% 33.02% $4,134 6.54% 41.72%
Current $ Tax Fund Approp/FTE $2,109 $2,431 15.25% $2,813 15.69% 33.33% $2,848 1.25% 35.00% $3,107 9.11% 47.31%
Current S Tuition & Fees/FTE $594 $637 7.21% $665 4.38% 11.91% $709 6.69% 19.39% $820 15.65% 38.07%
UTAH STATE UNIVERSITY--E&G + Ctrs + M Ed
Annualized FTE** 9,518 9,729 2.22% 9,156 -5.89% -3.80% 9,562 4.43% 0.46% 10,359 8.34% 8.84%
Current $ Expenditures/FTE $2,679 $2,914 8.77% $3,410 17.03% 27.30% $3,553 4.19% 32.63% $3,612 1.66% 34.83%
Current $ Tax Fund Approp/FTE $1,908 $2,099 9.97% $2,500 19.13% 31.00% $2,543 1.74% 33.28% $2,620 2.99% 37.27%
Current $ Tuition & Fees/FTE $608 $681 12.01% $761 11.67% 25.08% $781 2.66% 28.41% $842 7.85% 38.49%
WEBER STATE UNIVERSITY--E & G + Coop N
Annualized FTC*** 7,634 7,449 -2.42% 7,480 0.42% -2.02% 8,116 8.50% 6.31% 8,919 9.89% 16.83%
Current S Expenditures/FTC $2,121 52.446 15.34% $2,697 10.25% 27.17% $2,680 -0.62% 26.39% $2,797 4.34% 31.88%
Current $ Tax Fund Approp/FTE $1,587 $1,919 20.95% $2,128 10.90% 34.13% t7,023 -4.95% 27.49% $2,113 4.42% 33.13%
Current $ Tuition & Fees/FTE $421 $478 13.61% $510 6.67% 21.18% $575 12.73% 36.62% 5613 6.57% 45.59%
SOUTHERN uTAH UNIVERSITY--Ed & Gen
Annualized FTE 1,807 1,750 -3.15% 1,719 -1.77% -4.87% 1,853 7.80% 2.55% 1,948 5.13% 7.80%
Current $ Expenditures/FTE $2,480 $2,898 16.85% $3,224 11.24% 29.98% $3,294 2.17% 32.81% $3,503 6.34% 41.22%
Current $ Tax Fund Approp/FTE $2,052 $2,364 15.23% $2,715 14.85% 32.33% $2,666 -1.82% 29.92% $2,854 7.07% 39.10%
Current S Tuition & Fees/FTE $371 $452 21.90% $484 7.19% 30.66% $526 8.61% 41.91% $576 9.60% 55.53%
SNOW COLLEGE--Ed & Gen
Annualized FTE 849 915 7.77% 897 -1.97% 5.65% 1,002 11.71% 18.02% 1,108 10.58% 30.51%
Current $ Expenditures/FTE $2,455 $2,650 7.95% $3,165 19.42% 28.91% $3,242 2.45% 32.07% 13,302 1.85% 34.51%
Current $ Tax Fund Approp/FTE $2,093 $2,302 9.98% $2,814 22.27% 34.47% $2,689 -4.44% 28.50% $2,740 1.89% 30.93%
Current $ Tuition & Fees/FTE $292 $329 12.69% $375 13.90% 28.35% $426 13.70% 45.94% $505 18.39% 72.77%
DIXIE COLLEGE--Ed & Gen
Annualized FTE 1,150 1,148 -0.17% 1,092 -4.88% -5.04% 1,141 4.49% -0.78% 1,325 16.13% 15.22%
Current $ Expenditures/FTE $2,094 $2,349 12.19% $2,755 17.29% 31.59% 12,901 5.27% 38.52% $2,887 -0.47h 37.87%
Current $ Tax Fund Approp/FTE 11,634 $1,847 13.02% $2,286 23.81% 39.93% $2,351 2.84% 43.90% $2,336 -0.64% 42.98%
Current S Tuition & Fees/FTE $344 $403 16.99% $456 13.14% 32.36% $492 7.85% 42.76% $515 4.79% 49.60%
COLLEGE OF EASTERN UTAH--E&G + SJC
Annualized FTE*** 543 649 19.52% 660 1.69% 21.55% 625 -5.30% 15.10% 753 20.48% 38.67%
Current $ Expenditures/FTE $2,998 $2,965 -1.10% $3,416 15.21% 13.94% $4,091 19.76% 36.45% $3,810 -6.86% 27.09%
Current $ Tax Fund Approp/FTE $2,659 $2,511 -5.58% $2,876 14.53% 8.13% $3,363 16.96% 26.47% $3,213 -4.46% 20.84%
Current $ Tuition & Fees/FTE $310 $358 15.25% $337 -5.79% 8.57% $502 48.96% 61.73% $497 -0.89% 60.28%
UTAH VALLEY COMMUNITY COLLEGE
Annualized FTE 2,881 2,963 -0.62% 2,897 1.19% 0.56% 3,250 12.19% 12.81% 3,840 18.15% 33.29%
Current $ Expenditures/FTE $1,702 $2,024 18.96% $2,440 20.53% 43.38% $2,296 -5.89% 34.95% 52,254 -1.83% 32.48%
Current $ Tax Fund Approp/FTE $1,202 $1,551 29.03% $1,825 17.63% 51.78% $1,673 -8.32% 39.14% 11,616 -3.38% 34.44%
Current S Tuition & Fees/FTE $343 $392 14.51% $446 13.57% 30.06% $453 1.74% 32.33% $496 9.39% 44.75%
SALT !NKE COMMUNITY COLLEGE
Annualize., FTE 3,964 3,974 0.25% 3,814 -4.03k -3.78% 3,870 1.47% -2.37% 4,155 7.36% 4.82%
Current $ Expenditures/FTE $1,638 $1,818 11.00% $2,135 17.46% 30.38% $2,201 3.09% 34.41% 52,303 4.66% 40.66%
Current $ Tax Fund Approp/FTE $1,165 $1,364 17.04% $1,607 17.86% 37.90 $1,650 2.69% 41.65% $1,720 4.19% 47.59%
Current $ Tuition & Fees/FTE $279 $314 12.81% $347 10.49% 24.65% $384 10.49% 37.72% $454 18.37% 63.02%
ToTAL USHE--Ed & Gen + Related Inst
Annualized FTE* 47,330 47,178 -0.30. 45,690 -3.15% -3.47% 47,849 4.73% 1.10% 51,174 6.95% 8.12%
Current $ Expenditures/FTC $2,515 $2,808 11.63% $3,218 14.61% 27.94% $3,311 2.89% 31.64% $3,426 3.48% 36.22%
Cu*rent $ Tax Fund Approp/FTE $1,843 $2,120 15.06% $2,459 16.00% 33.48% $2,455 -0.18% 33.24% $2,575 4.88% 39.74%
Current $ Tuition I. Fees/FTE $504 $557 10.44% $596 7.10% 18.28% $636 6.73% 26.24% $706 10.93% 40.04%
*Excluding Medical **Including Cant Ed Centers ***Including Coop Nursing ***Including San Juan Center
42

iHistory 24-Dec-90
IIITABLE 7--CURRENT DOLLAR EXPENDITURES,
TAx FUNDS, & TUITION/FEES PER FIE
IIIUNIVERSITY OF UTAH--E&G + Coop Nurs
Annualized FTC*
Current S Expenditures/FTE
Current $ Tax Fund Approp/FTE
IIICurrent $ Tuition & Fees/FTE
UTAH STATE uNIVERSITY--E&G + Ctrs + M
Annualized FTE**
/ Current S Expenditures/FIE
ICurrent $ Tax Fund Approp/FTE
Current $ Tuition & Fees/FTE
WEBER STATE UNIVERSITY--E & G + Coop N
Annualized FTE***
ICurrent $ Expenditures/FTE
Current $ Tax Fund Approp/FTE
Current $ Tuition & Fees/FTE
SOUTHERN UTAH UNIVERSITY--Ed & Gen
IIIAnnualized FTE
Current S Expenditures/FTE
Current $ Tax Fund Approp/FTE
Current $ Tuition & Fees/FTE
IIISNOW COLLEGE--Ed & Gen
Annualized FTE
Current $ Expenditures/FTE
Current $ Tax Funa Approp/FTE
III
Current $ Tuition & Fees/FIT
DIXIE COLLEGE--Ed & Gen
Annualized FIE
Current $ Expenditures/FTE
111
Current $ Tax Fund Approp/FTE
Current $ Tuition & Fees/FTE
COLLEGE OF EASTERN UTAH--E&G + SJC
Annualized FTC
IIICurrent $ Expenditures/FIE
Current $ Tax Fund Approp/FTE
Current S Tuition & Fees/.
UTAH VALLEY COMMUNITY COLLEGE
IAnnualized FTE
Current $ Expenditures/FTE
Current S Tax Fund Approp/FTE
, Current $ Tuition & Fees/FTE
ISALT LAKE COMMUNITY COLLEGE
Annualized FTC
Current S Expenditures/FIT
Current $ Tax Fund Approp/FTE
ICurrent $ Tuition & Fees/FTE
TOTAL USHE--Ed & Gen + Related Inst
Annualized FTE*
Current S Expenditures/FTE
IIICurrent S Tax Fund Approp/FTE
Current $ Tuition & Fees/FTE
'Ext 1 ud ng
HISTORY OF ENROLLMENT AND BUOGET CHANGES, USHE Page 26
1981-82
Actual 1-Yr Inc 5-Yr Inc
1982-83
Actual 1-Yr Inc 6-Yr Inc
1983-84
Actual I-Yr Inc 7-Yr Inc
1984-85
Actual I-Yr Inc 8-Yr Inc
18,833 0.35% -0.78% 19,454 3.30% 2.49% 19,492 0.20% 2.69% 19,445 -0.24% 2.44%
$4,630 12.00% 58.72% 55,074 9.60% 73.97% 55,202 2.51% 78.33% 55,700 9.58% 95.43%
$3,472 11.73% 64.59% $3,691 6.31% 74.97% 53,821 3.52% 81.14% 54,454 16.55% 111.13%
$910 10.98% 53.23% 5973 6.95% 63.88% $1,050 7.83% 76.71% 51,120 6.67% 88.50%
10,365 0.06% 8.90% 10,553 1.81% 10.87% 10,989 4.13% 15.45% 10,663 -2.97% 12.03%
54.043 11.93% 50.92% 54,368 8.04% 63.06% 54,306 -1.41% 60.75% 54,932 14.54% 84.13%
52,910 11.08% 52.48% $3,167 8.84% 65.96% $3,158 -0.29% 65.47% 53,862 22.29% 102.35%
5918 8.99% 50.93% $961 4.69% 58.01% 5944 -1.81% 55.15% $984 4.25% 61.75%
8,924 0.06% 16.90% 9,010 0.96% 18.02% 8,822 -2.09% 15.56% 8,467 -4.02% 10.91%
53,068 9.69% 44.66% 53,450 12.45% 62.67% $3,564 3.32% 68.07% $4,084 14.59% 92.59%
$2,331 10.35% 46.91% $2,553 9.53% 60.90% 52,737 7.18% 72.46% $3,306 20.79% 108.32%
5669 9.14% 58.90% $736 9.95% 74.70% 5778 5.82% 84.88% $840 7.86% 99.40%
1,922 -1.33% 6.36% 2,173 '.3.06% 20.25% 2,315 6.53% 28.11% 2,410 4.10% 33.37%
$3,960 13.05% 59.65% $3,940 -0.49% 58.86% $3,831 -2.76% 54.47% $4,144 8.16% 67.08%
$3,242 13.60% 58.02% $3,195 -1.46% 55.72% $3,119 -2.38% 52.01% $3,440 10.30% 67.67%
$615 6.70% 65.96% $648 5.32% 74.78% 5640 -1.16% 72.76% $681 6.45% 83.91%
1,132 2.17% 33.33% 1,025 -9.45% 20.73% 1,146 11.80% 34.98% 1,130 -1.40% 33.10%
53,671 11.17% 49.53% $4,381 19.34% 78.45% $4,373 -0.19% 78.12% $4,827 10.39% 96.63%
$3,023 10.31% 44.43% $3,765 24.58% 79.92% $3,627 -3.68% 73.29% $4,281 18.03% 104.54%
$604 19.64% 106.70% $609 0.89% 108.54% $651 6.88% 122.89% $668 2.71% 128.92%
1,380 4.15% 20.00% 1,436 4.06% 24.87% 1,449 0.91% 26.00% 1,483 2.35% 28.96%
$3,116 7.93% 48.80% $3,321 6.58% 58.60% $3,373 1.56% 61.08% $3,666 8.69% 75.07%
$2,499 6.96% 52.94% $2,642 5.73% 61.70% $2,738 3.62% 67.55% $3,030 10.68% 85.44%
$521 1.15% 51.33% $550 5.49% 59.63% $578 5.19% 67.92% $629 8.80% 82.69%
829 10.09% 52.67% 922 11.22% 69.80% 1,065 15.51% 96.13% 1,162 9.11% 114.00%
53,940 3.40% 31.42% 53,959 0.49% 32.06% $3,663 -7.47% 22.20% $3,738 2.05% 24.70%
$3,264 1.57% 22.74% $3,271 0.22% 23.01% $2,963 -9.41% 11.43% $3,311 11.74% 24.51%
5543 9.29% 75.17% $561 3.19% 80.75% $554 -1.20% 78.59% $542 -2.21% 74.65%
4,349 13.26% 50.95% 5,035 15.77% 74.77% 5,272 4.714 82.99% 4,947 -6.16% 71.71%
52,364 4.87% 38.93% $2,260 -4.41% 32.80% $2,273 0.61% S3.o0% $2,769 21.82% 62.75%
$1,622 0.35% 34.92% $1,524 -6.07% 26.74% $1,517 -0.43% 26.19% $2,014 32.76% 67.53%
$525 5.92% 53.32% $586 11.61% 71.11% $626 6.69% 82.56% $686 9.66% 100.19%
4,573 10.06% 15.36% 5,339 16.75% 34.69% 5,518 3.35% 39.20% 5.563 0.82% 40.34%
$2,438 5.83% 48.86% 52.286 -6.21% 39.62% $2,457 7.48% 50.06% $2,751 11.94% 67.98%
$1,748 1.66% 50.04% $1,636 -6.42% 40.41% $1,643 0.46% 41.05% $2.042 24.23% 75.23%
5534 17.70% 91.87% $591 10.62% 112.25% $692 47.11% 148.56% 5695 0.36% 149.45%
52,306 2.21% 10.51% 54,946 5.05% 16.09% 56,068 2.04% 18.46% 55,270 -1.42% 16.78%
S3,771 10.05% 49.91% $4,021 6.64% 59.87% $4,073 1.29% 61.93% 54,564 12.05% 81.45%
$2,814 9.31% 52.74% $2,953 4.92% 60.26% $3,012 2.01% 63.48% $3,592 19.26% 94.97%
$772 9.42% 53.23% 5822 6.42% 63.07% $864 5.20% 71.55% $915 5.88% 81.63%
Medical **Including Cont Ed Centers ***Inclueing Coop Nursing '***Including San Jon Center

History 24-0ec-90 HISTORY OF ENROLLMENT AND BUDGET CHANGES, USHE Page 27
TABLE 7--CURRENT DOLLAR EXPENDITURES,
TAX FUNDS, & TUITION/FEES PER FTE
UNIVERSITY OF UTAH--E&G + Coop Nurs
1985-86
Actual 1-Yr Inc 9-Yr Inc
1986-87
Actual 1-Yr Inc 10-Yr Inc
1987-88
Actual 1-Yr Inc 11-Yr Inc
1988-89
Actual 1-Yr Inc 12-Yr Inc
Annualized FTE* 19,153 -1.50% 0.90% 18,892 -1.36% -0.47% 18,896 0.02% -0.45% 18,622 -1.45% -1.90%
../Current 1 Expenditures/FTE $6,280 i./10.18% 115.32% $6,289 0.14% 115.61% 16,504 3.43% 123.00% 16,807 4.66% 133.38%
Current S Tax Fund Approp/FTE 14,685 5.20% 122.10% 54,713 0.60% 123.43% 54,980 5.67% 136.09% 55,187 4.15% 145.89%
Current S Tuition & Fees/FTE 51,214 8.39% 104.33% 51,348 11.04% 126.88% 51.373 1.88% 131.15% $1,477 7.57% 148.65%
UTAH STATE UNIVERSITY--E&G + Ctrs + M
Annualized FTE** 10,306 -3.35% 8.28% 10,353 0.46% 8.77% 10,397 0.42: 9.24% 10,631 2.25% 11.69:
Current $ Expenditures/FTE $5,576 13.06% 108.18% $5,451 -2.25% 103.48% 55,724 5.01% 113.68% 15,851 2.23% 118.44%
Current $ Tax Fund Approp/FTE 54,242 9.85% 122.28% $4,288 1.09% 124.71% 54,520 5.39% 136.83% 54,471 -1.07% 134.29%
Current $ Tuition & Fees/FTE 51,046 6.35% 72.02% $1,131 8.08% 85.92% 11,134 0.27% 86.41% 11,222 7.75: 100.85%
WEBER STATE UNIVERSITY--E & G + Coop N
Annualized FTE*** 8,579 1.32% 12.38% 9,027 5.22% 18.25% 9,279 2.79% 21.55% 9,475 2.11% 24.12%
Current $ Expenditures/FTE 14,427 8.38% 108.74% 54,167 -5.86% 96.51% 54,280 2.70% 101.82% 54,235 -1.06% 99.68%
Current $ Tax Fund Approp/FTE 13.398 2.80% 114.15% $3,190 -6.12% 101.04% 13,289 3.09% 107.25% $3,280 -0.26% 106.72%
Current $ Tuition & Fees/FTE 5897 6.83% 113.02% 1969 8.06% 130.18% $1.011 4.27% 140.01% $1,123 11.16% 166.80%
SOUTHERN UTAH UNIVERSITY--Ed & Gen
Annualized FTE 2,361 -2.03% 30.66% 2,685 13.72% 48.59% 2,779 3.50% 53.79% 2,894 4.14% 60.15%
Current $ Expenditures/FTE $4,636 11.86% 86.90% $4,087 -11.85% 64.76% 54,162 1.85% 67.82% $4,168 0.12% 68.02%
Current $ Tax Fund Approp/FTE 53,726 8.32% 81.61% 53,246 -12.88% 58.22% 53.292 1.42% 60.46% 53,265 -0.82% 59.14%
Current $ Tuition & Fees/FTE 5727 6.71% 96.24% $772 6.16% 108.32% 5781 1.12% 110.67% $838 7.40% 126.26%
SNOW COLLEGE--Ed & Gen
Annualized FTE 1,142 1.06% 34.51% 1,265 10.77% 49.00% 1.244 -1.66% 46.53% 1.375 :C.53% 61 96%
Current $ Expenditures/FTE 15,346 10.74% 117.76% S4,596 -14.02% 87.22% $5,180 12.69% 110.99% 14,539 -10.48% 88 ,,:%
Current S Tax Fund Approp/FTE 14,348 1.57% 107.75: 13.925 -9.72% 87.55% 14,183 6.58% 99.89% 53.87I -7.46% 84
Current $ Tuition & Fees/FTE $715 6.91% 144.73% 5769 7.58% 163.27% $851 10.65% 191.31% 5841 -1.12%, 188A:
DIXIE COLLEGE--Ed & Gen
Annualized FTE 1,646 10.99% 43.13% 1,843 11.97% 60.26% 1,812 -1.68% 57.57% 1,802 -0.55% 56.70%
Current $ Expenditures/FTE $3,786 3.28% 80.82% 13,579 -5.47% 70.92% 53,723 4.01% 77.78% 54,144 11.32% 97.91%
Current $ Tax Fund Approp/FTE 52,914 -3.83% 78.34% $2,828 -2.95% 73.08% 53,010 6.43% 84.20% $3,139 4.30% 92.12%
Current $ Tuition & Fees/FTE 1693 10.16% 101.25% 1714 3.08% 107.45% 5866 21.22% 151.48% $900 3.93% 161.35%
COLLEGE OF EASTERN UTAH--E&G + SJC
Annualized FTE**** 1,141 -1.81% 110.13% 1,309 14.72% 141.07% 1,281 -2.14% 135.91% 1.354 5.70% 149.36%
Current $ Expenditures/FTE $4,640 24.11% 54.77% 53,998 -13.83% 33.37% t. .310 7 "A 43.76% 54,230 -1.86% 41.08%
Current $ Tax Fund Approp/FTE 53,499 5.68% 31.59% $3,333 -4.76% 25.32% $3,540 6.22% 33.12% $3,472 -1.93% 30.56%
Current $ Tuition & Fees/FTE $626 15.57% 101.84% $643 2.67% 107.24% 5632 -1.68% 103.75% 1653 3.33% 110.53%
tiTAH VALLEY COMMUNITY COLLEGE
Annualized FTE 4,899 -0.97% 70.05% 5,206 6.27% 80.70% 5,302 1.84% 84.03% 5,329 0.51% 84.97%
Current $ Expenditures/FTE $3,144 13.51% 84.74% $3,063 -2.56% 80.01% $3.092 0.94% 81.70% 13,277 5.99% 92.58;
Current $ Tax Fund Approp/FTE 52,189 8.68% 82.08% 52,058 -5.96% 71.23% 12,105 2.27% 75.12% 12,188 3.92% 81.99%
Current $ Tuition & Fees/FTE 5783 14.07% 128.36% $882 12.76% 157.51% 5915 3.74% 167.14% $991 8.30% 189.32%
SALT LAKE COMMUNITY COLLEGE
Annualized FTE 5,720 2.82% 44.30% 5,845 2.19% 47.45% 6,073 3.90% 53.20% 6,530 7.53% 64.73%
Current 1 Expenditures/FTE $3,115 13.23% 90.21% $3,088 -0.86% 88.58% 52.973 -3.74% 81.53% 13,256 9.52% 98.80%
Current $ Tax Fund Approp/FTE $2,136 4.64% 83.37% 52,126 -0.48t 82.49% $2,153 1.28% 84.83% $2,149 -0.20% 84.46%
Current $ Tuition & Fees/FTE 5805 15.91% 189.13% 1907 12.68% 225.78% 5902 -0.59% 223.87% 5983 9.02% 253.09%
TOTAL USHE--Ed & Gen + Related Inst
Annualized FTE* 54,947 -0.58% 16.09% 56,425 2.69% 19.22% 57,063 1.13% 20.56% 58,012 1.66% 22.57%
Current S Expenditures/FTE 55,051 10.67% 100.81% 54,882 -3.34% 94.10% $5,027 2.97% 99.86% 55,162 2.68% 105.22%
Current S Tax Fund Approp/FTE 13,787 5.42% 105.54% $3,698 -2.37% 100,68% 53,859 4.6% 109.43% 13,896 0.97% 111.46:
Current $ Tuition & Fees/FTE $993 8.46% 97.00% $1,081 8.92% 114.58% $1,105 2.17% 119.25% 51,188 7.54% 135.78%
1
'Excluding Medical **Including Cont Ed Centers **Including Coop Nursing ****Including San Juan Center
44 ib3
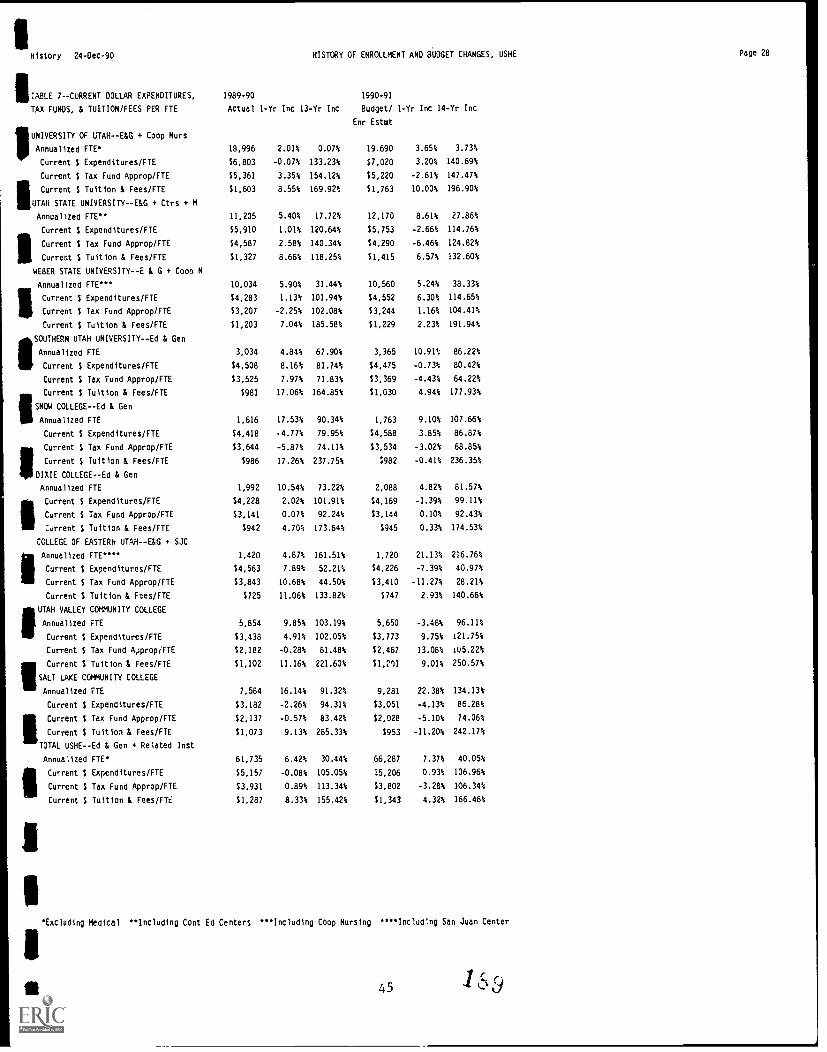
History 24-Dec-90 HISTORY OF ENROLLMENT AND BUDGET CHANGES, USHE
II/ TABLE 7--CuRRENT DOLLAR EXPENDITURES,1989-90 1990-91
TAX FUNDS, & TUITION/FEES PER FTE Actual 1-Yr Inc 13-Yr Inc Budget/ 1-Yr Inc 14-Yr Inc
Enr Estet
111
UNIVERSITY OF UTAH--E&G + Coop Nurs
Annualized FTE*
Current $ Expenditures/FTE
Current $ Tax Fund Approp/FTE
III
Current $ Tuition & Fees/FTE
UT AH STATE UNIVERSITY--E&G Ctrs + M
Annualized FTE**
Current $ Expenditures/FTE
iCurrent $ Tax Fund Approp/FTE
Current $ Tuition & Fees/FTE
WEBER STATE UNIVERSITY--E & G + CM N
Annualized FTE***
IICurrent $ Expenditures/FIE
Current $ Tax Fund Approp/FTE
Current $ Tuition & Fees/FTE
ISOUTHERN UTAH UNIVERSITY--Ed & Gen
Annualized FTC
Current $ Expenditures/FTE
Current $ Tax Fund Approp/FTE
Current $ Tuition & Fees/FTE
IIISNOW COLLEGE--Ed & Gen
Annualized FTE
Current $ Expenditures/FTE
IIICurrent $ Tax Fund Approp/FTE
Current S Tuition & Fees/FTE
DIXIE COLLEGE--Ed & Gen
Annualized FTE
IIICurrent $ Expenditures/FTE
Current S Tax Fund Approo/FTE
:urrent $ Tuition & Fees/FIE
COLLEGE OF EASTERN UTAH--E&G + SJC
III
Annualized FTE**
Current $ Expenditures/FTE
Current $ Tax Fund Approp/FTE
Current $ Tuition & Fees/FTE
II/UTAH VALLEY COMMUNITY COLLEGE
Annualized FTE
Current $ Expenditures/FTE
Current $ Tax Fund A4ropiFTE
ICurrent $ Tuition & Fees/FTE
SALT LAKE COMMUNITY COLLEGE
Annualized FTE
Current $ Expenaitures/FTE
ICurrent $ Tax Fund Approp/FTE
Current S Tuition & Fees/FTE
TOTAL USHE--Ed & Gen + Related Inst
Annualized FTE'
ICurrent $ Expenditures/FIE
Current $ Tax Fund Approp/FTE
Current $ Tuition & Fees/FTE
18,996 2.01% 0.07% 19 690 3.65% 3.73%
$6,803 -0.07% 133.23% $7,020 3.20% 140.69%
55,361 3.35% 154.12% $5,220 -2.61% 147.47%
51,603 8.55% 169.92% $1,763 10.00% 196.90%
11,205 5.40# 17.72% 12,170 8.61% 27.86%
$5,910 1.01% 120.64% 55,753 -2.66% 114.76%
54,587 2.58% 140.34% $4,290 -6.46% 124.82%
51,327 8.66% 118.25% 51,415 6.57% 132.60%
10,034 5.90% 31.44% 10,560 5.24% 38.33%
$4,283 1.13% 101.94% 54,552 6.30% 114.65%
53,207 -2.25% 102.08% 53,244 1.16% 104.41%
$1,203 7.04% 185.58% $1,229 2.23% 191.94:
3,034 4.84% 67.90% 3,365 10.91% 86.22%
64,508 8.16% 81.74% 54,475 -0.73% 80.42%
53,525 7.97% 71.83% $3,369 -4.43% 64.22%
5981 17.06% 164.85% $1,030 4.94% 177.93%
1,616 17.53% 90.34% 1,763 9.10% 107.65%
54,418 .4.77% 79.95% $4,588 3.85% 86.87%
$3,644 -5.87% 74.11% 53,534 -3.02% 68.85%
5986 17.26% 237.75% $982 -0.41% 236.35%
1,992 10.54% 73.22% 2,088 4.82% 81.57%
$4,228 2.02% 101.91% 54,169 -1.39% 99.11%
53,141 0.07% 92.24% 53,144 0.10% 92.43%
5942 4.70% 173.64% 5945 0.33% 174.53%
1,420 4.87% 161.51% 1,720 21.13% 216.76%
54,563 7.89% 52.21% $4,226 -7.39% 40.97%
$3,843 10.68% 44.50% $3,410 -11.27% 28.21%
$725 11.06% 133.82% $747 2.93% 140.66%
5,854 9.85% 103.19% 5,650 -3.48% 96.11%
$3,438 4.91% 102.05% 53,773 9.75% 121.75%
$2,182 -0.28% 81.48% 62,467 13.08% iu5.22%
51,102 11.16% 221.60% $1,211 9.01% 250.57%
7,584 16.14% 91.32% 9,281 22.38% 134.13%
53,182 -2.26% 94.31% $3,051 -4.13% 86.28%
$2,137 -0.57% 83.42% $2,028 -5.10% 74.06%
51,073 9.13% 285.33% $953 -11.20% 242.17%
61,735 6.42% 30.44% 66,287 7.37% 40.05%
$5,157 -0.08% 105.05% 15.206 0.93% 106.96%
53,931 0.89% 113.34% $3,802 -3.28% 106.34%
$1,287 8.33% 155.42% 61,343 4.32% 166.46%
'Excluding Medical **Including Cont Ed Centers ***Including COop Nursing ****IncluCng San Juan Center
451
Page 28
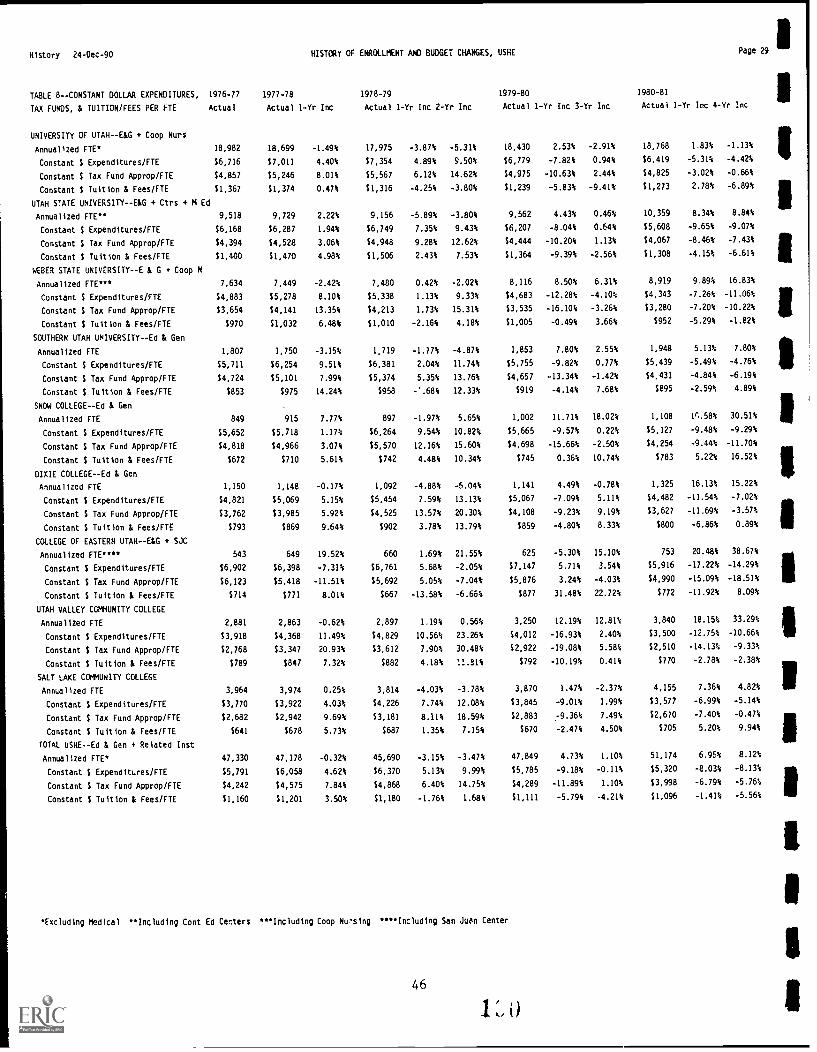
History 24-Dec-90 HISTORY OF ENROLLMENT AND BUDGET CHANGES, USHE Page 29
TABLE 8--CONSTANT DOLLAR EXPENDITURES, 1976-77
TAX FUNDS, & TUITION/FEES PER FTE Actual
UNIVERSITY OF UTAH--E&G + Coop Nurs
1977-78
Actual 1-Yr Inc
1978-79
Actual I-Yr Inc 2-Yr Inc
1979-80
Actual 1-Yr Inc 3-Yr Inc
1980-81
Actual 1-Yr Inc 4-Yr Inc
Annualized FTE* 18,982 18,699 -1.49% 17,975 -3.87% -5.31% 18,430 2.53% -2.91% 18,768 1.83% -1.13%
Constant $ Expenditures/FTE $6,716 $7,011 4.40% $7,354 4.89% 9.50% $6,779 -7.82% 0.94% $6,419 -5.31% -4.42%
Constant S Tax Fund Approp/FTE $4,857 $5,246 8.01% $5,567 6.12% 14.62% $4,975 -10.63% 2.44% $4,825 -3.02% -0.66%
Constant $ Tuition & Fees/FTE $1,367 $1,374 0.47% $1,316 -4.25% -3.80% $1,239 -5.83% -9.41% $1,273 2.78% -6.89%
UTAH STATE UNIVERSITY--E&G + Ctrs + M Ed
Annualized FTE" 9,518 9,729 2.22% 9,156 -5.89% -3.80% 9,562 4.43% 0.46% 10,359 8.34% 8.84%
Constant $ Expenditures/FTE $6,168 $6,287 1.94% $6,749 7.35% 9.43% $6,207 -8.04% 0.64% $5,608 -9.65% -9.07%
Constant $ Tax Fund Approp/FTE $4,394 $4,528 3.06% $4,948 9.28% 12.62% $4,444 -10.20% 1.13% $4,067 -8.46% -7.43%
Constant S Tuition & Fees/FTE $1,400 $1,470 4.98% $1,506 2.43% 7.53% $1,364 -9.39% -2.56% $1,308 -4.15% -6.61%
WEBER STATE UNIVERSITY--E & G + Coop N
Annualized FIE*** 7,634 7,449 -2.42% 7,480 0.42% -2.02k 8,116 8.50% 6.31% 8.919 9.89% 16.83%
Constant $ Expenditures/FTE $4,883 $5,278 8.10% $5,338 1.13% 9.33% $4,683 -12.28% -4.10% $4,343 -7.26% -11.06%
Constant $ Tax Fund Approp/FTE $3,654 $4,141 13.35% $4,213 1.73% 15.31% $3,535 -16.10% -3.26% $3,280 -7.20% -10.22%
Constant $ Tuition & Fees/FTE $970 $1,032 6.48% $1,010 -2.16% 4.18% $1,005 -0.49% 3.66% $952 -5.29% -1.82%
SOUTHERN UTAH UNIVERSITY--Ed & Gen
Annualized FTE 1.807 1,750 -3.15% 1,719 -1.77% -4.87% 1,853 7.80% 2.55% 1,948 5.13% 7.80%
Constant $ Expenditures/FTE $5,711 $6,254 9.51% $6,381 2.04% 11.74% $5,755 -9.82% 0.77% $5,439 -5.49% -4.76%
Constant $ Tax Fund Approp/FTE $4,724 $5,101 7.99% $5,374 5.35% 13.76% $4,657 -13.34% -1.42% $4,431 -4.84% -6.19%
Constant $ Tuition & Fees/FTE $853 $975 14.24% $958 -'.68% 12.33% $919 -4.14% 7.68% $895 -2.59% 4.89%
SNOW COLLEGE--Ed & Gen
Annualized FTE 849 915 7.77% 897 -1.97% 5.65% 1,002 11.71% 18.02% 1,108 lrl.58% 30.51%
Constant $ Expenditures/FTE $5,652 $5,718 1.17% $6,264 9.548 10.82% $5,665 -9.57% 0.22% $5,127 -9.48% -9.29%
Constant $ Tax Fund Approp/FTE $4,818 $4,966 3.07% $5,570 12.16% 15.60% $4,698 -15.66% -2.50% 54,254 -9.44% -11.70%
Constant $ Tuition & Fees/FTE $672 $710 5.61% $742 4.48% 10.34% $745 0.36% 10.74% $783 5.22% 16.52%
DIXIE COLLEGE--Ed & Gen
Annualized FIE 1.150 1,148 -0.17% 1,092 -4.88% -5.04% 1,141 4.49% -0.78% 1,325 16.13% 15.22%
Constant S Expenditures/FTE $4,821 $5,069 5.15% $5,454 7.594 13.13% $5,067 -7.09% 5.11% $4,482 -11.54% -7.02%
Constant S Tax Fund Approp/FTE $3,762 $3,985 5.92% $4,525 13.57% 20.30% $4,108 -9.23% 9.19% $3,627 -11.69% -3.57%
Constant $ Tuition & Fees/FTE $793 $869 9.648 $902 3.78% 13.79% $859 -4.80% 8.33% $800 -6.86% 0.89%
COLLEGE OF EASTERN UTAH--E&G + SJC
Annualized FTE**** 543 649 19.52% 660 1.69% 21.55% 625 -5.30% 15.10% 753 20.48% 38.67%
Constant $ Expenditures/FTE $6,902 $6,398 -7.31% $6,761 5.68% -2.05% $7,147 5.71% 3.54% $5,916 -17.22% -14.29%
Constant $ Tax Fund Approp/FTE $6,123 $5,418 -11.51% $5,692 5.05% -7.04% $5,876 3.24% -4.03% $4,990 -15.09% -18.51%
Constant $ Tuition & Fees/FTE S714 $771 8.01% $667 -13.58% -6.66% $877 31.48% 22.72% $772 -11.92% 8.09%
UTAH VALLEY COMMUNITY COLLEGE
Annualized FTE 2.881 2,863 -0.62% 2,897 1.19% 0.56% 3,250 12.19% 12.81% 3,840 18.15% 33.29%
Constant $ Expenditures/FTE $3,918 $4,368 11.49% $4,829 10.56% 23.26% $4,012 -16.93% 2.40% $3,500 -12.75% -10.66%
Constant $ Tax Fund Approp/FTE $2,768 $3,347 20.93% $3,612 7.90% 30.48% $2,922 -19.08% 5.58% $2,510 -14.13% -9.33%
Constant $ Tuition & Fees/FTE $789 $847 7.32% $882 4.18% 11.81% $792 -10.19% 0.41% $770 -2.78% -2.38%
SALT LAKE COMMUNITY COLLEGE
Annualized FTE 3.964 3,974 0.25% 3,814 -4.03% -3.78% 3,870 1.47% -2.37% 4,155 7.36% 4.82%
Constant $ Expenditures/FTE $3,770 $3,922 4.03% $4,226 7.74% 12.08% 53,845 -9.01% 1.99% $3,577 -6.99% -5.14%
Constant $ Tax Fund Approp/FTE $2,682 $2,942 9.69% $3,181 8.11% 18.59% $2,883 :9.36% 7.49% $2,670 -7.40% -0.47%
Constant $ Tuition & Fees/FTE $641 $678 5.73% $687 1.35% 7.15% $670 -2.47% 4.50% $705 5.20% 9.94%
TOTAL USHE--Ed & Gen + Related Inst
Annualized FTE* 47,330 47,178 -0.32% 45,690 -3.15% -3.47% 47,849 4.73% 1.10% 51,174 6.95% 8.12%
Constant $ Expenditures/FTE $5,791 $6,058 4.62% $6,370 5.13% 9.99% 55,785 -9.18% -0.11% $5,320 -8.03% -8.13%
Constant S Tax Fund Approp/FTE $4,242 $4,575 7.84% $4,868 6.40% 14.75% $4,289 -11.89% 1.10% $3,998 -6.79% -5.76%
Constant $ Tuition & Fees/FTE $1,160 $1,201 3.50% $1,180 -1.76% 1.68% $1,111 -5.79% -4.21% $1,096 -1.41% -5.56%
'Excluding Medical **Including Cont Ed Centers ***Including Coop Nu-sing ***Including San Juan Center
46
1
1

History 24-Dec-90
IIITABLE 8--CONSTANT DOLLAR EXPENDITURES,
TAX FUNDS, & TUITION/FEES PER FTE
1/1
UNIVERSITY OF UTAH--E&G + Coop Nurs
Annualized FTE*
Constant S Expenditures/FIE
Constant $ Tax Fund Approp/FTE
IConstant $ Tuition & Fees/FTE
UTAH STATE UNIVERSITY--E&G + Ctrs + M
Annualized FTE**
Constant S Expenditures/FTE
iConstant S Tax Fund Approp/FTE
Constant $ Tuition & Fees/FTE
WEBER STATE UNIVERSITY--E & G + Coop N
Annualized FTE***
iConstant $ Expenditures/FTE
Constant $ Tax Fund Approp/FTE
Constant $ Tuition I. Fees/FTE
iSOUTHERN UTAH UNIVERSITY--Ed & Gen
Annualized FTE
Constant $ Expenditures/FTE
Constant $ Tax Fund Approp/FTE
Constant $ Tuition & Fees/FTE
IIISNOW COLLEGE--Ed & Gen
Annualized FIE
Constant S Expenditures/FIE
IConstant $ Tax Fund Approp/FTE
Constant S Tuition & Fees/FTE
DIXIE COLLEGE--Ed & Gen
Annualized FIE
IConstant $ Expenditures/FTE
Constant $ Tax Fund Approp/FTE
Constant $ Tuition & fees/FTE
COLLEGE OF EASTERN UTAH--E&G + SJC
IIIAnnualized FTE****
Constant $ Expenditures/FTE
Constant S Tax Fund Approp/FTE
Constant $ Tuition & Fees/FTE
IUTAH VALLEY COMMUNITY COLLEGE
Annualized FIE
Constant $ Expenditures/FIE
Constant $ Tax Fund Approp/FTE
IConstant $ Tuition & Fees/FTE
SALT LAKE COMMUNITY COLLEGE
Annualized FIE
Constant $ Expenditures/FIE
III
Constant $ Tax Fund Approp/FTE
Constant $ Tuition & Fees/FTE
TOTAL USHE--Ed & Gen + Related Inst
Annualized FTE*
111
Constant $ Expenditures/FTE
Constant $ Tax Fund Approp/FTE
Constant S Tuition & Fees/FTE
1
HISTORY Of ENROLLMENT AND BUDGET CHANGES, USHE Page 30
1981-82
Actual 1-Yr Inc 5-Yr Inc
1982-83
Actual 1-Yr Inc 6-Yr Inc
1983-84
Actual I-Yr Inc 7-Yr Inc
1984-85
Actual 1-Yr Inc 8-Yr Inc
18,833 0.35% -0.78t 19,454 3.30% 2.49% 19,492 0.20% 2.69% 19,445 -0.24% 2.44%
56,600 2.82% -1.73% 56,967 5.56% 3.74% 56,881 -1.23% 2.46% 57,254 5.42% 8.01%
$4,949 2.58% 1.91% 55,068 2.39% 4.34% 55,055 -0.26% 4.07% 55,667 12.13% 16.69%
$1,297 1.89% -5.13% $1,336 3.00% -2.28% 51,388 3.89% 1.53% 51,425 2.62% 4.19%
10,365 0.06% 8.90% 10,553 1.81% 10.87% 10,989 4.13% 15.45% 10,663 -2.97% 12.03%
55,763 2.76% -6.56% 55.997 4.06% -2.77% $5,696 -5.01% -7.64% 56,277 10.19% 1.77%
54,148 1.98% -5.59% $4,348 4.83% -1.04% 54,177 -3.93% -4.93% $4,914 17.64% 11.84%
51,309 0.06% -6.55% $1,319 0.83% -5.78% 51,248 -5.40% -10.86% 51,252 0.29% -10.60%
8,924 0.06% 16.904 9,010 0.96% 18.02% 8,822 -2.09% 15.56% 8,467 -4.02% 10.91%
54,373 0.71% -10.43% $4,738 8.30% -3.00% 54,715 -0.46% -3.44% 55,197 10.24% 6.45%
$3,323 1.31% -9.04% $3,506 5.49% -4.05% 53,620 3.27% -0.92% $4,207 16.20% 15.14%
5954 0.20% -1.62% 51,010 5.89% 4.18% 51,030 1.96% 6.22% 51,069 3.76% 10.21%
1,922 -1.33% 6.36% 2,173 13.06% 20.25% 2,315 6.53% 28.11% 2,410 4.10% 33.37%
55,645 3.79% -1.15h $5,410 -4.16% -5.27% 15,068 -6.31% -11.25% $5,274 4.05% -7.65%
$4,622 4.29% -2.16% $4,386 -5.09% -7.14% $4,126 -5.94% -12.66% $4,378 6.11% -7.33%
5877 -2.04% 2.75% $889 1.43% 4.23% $847 -4.77% -0.74% $867 2.41% 1.65%
1,132 2.17% 33.33% 1,025 -9.45% 20.73% 1,146 11.80% 34.98% 1,130 -1.40% 33.10%
55,233 2.06% -7.42% $6,015 14.94% 6.41% 55,784 -3.83% 2.33% $6,143 6.20% 8.68%
$4,309 1.28% -10.58% 55,170 19.98% 7.29% 54,797 -7.20% -0.44% $5,447 13.55% 13.05%
5860 9.84% 27.98% $836 -2.83% 24.36% $861 2.97% 28.05% $851 -1.20% 26.52%
1,380 4.15% 20.00% 1,436 4.06% 24.87% 1,449 0.91% 26.00% 1 483 2.35% 28.96%
$4,442 -0.91% -7.87% $4,559 2.65% -5.43% $4,462 -2.15% -7.46% $4,665 4.56% -3.24i
53,562 -1.80% -5.31% $3,627 1.83% -3.58% $3,621 -0.17% -3.74% 53,856 6.47% 2.49%
5743 -7.13% -6.30% 1755 1.59% -'.81% $765 .1.35% -3.52% 1801 4.66% 0.97%
829 10.09% 52.67% 922 11.22% 69.80% 1,065 15.51% 96.13% 1,162 9.11% 114.00%
55,616 -5.07% -16.63% $5,435 -3.22% -21.25% $4,846 -10.85% -29.79% 54,757 -1.83% -31.08%
$4,653 -6.75% -24.01% $4,491 -3.47% -26.65% $3,920 -12.72% -35.98% $4,214 7.49% -31.18%
5775 0.34% 8.45% 5770 -0.62% 7.78% 5733 -4.81% 2.61% $689 -5.92% -3.47%
4,349 13.26% 50.95% 5,035 15.77% 74.77% 5,272 4.71% 82.99% 4,947 -6.16% 71.71%
53,370 -3.72% -13.98% $3,102 -7.94% -20.81% 53,007 -3.07% -23.24% $3,524 17.19% -10.04%
$2,312 -7.87% -16.46% $2,092 -9.53% -24.43% $2,007 -4.07% -27.50% $2,563 27.72% -7.40%
5749 -2.76% -5.07% $805 7.49% 2.04% $828 2.79% 4.88% $873 5.50% 10.65%
4,573 10.06% 15.36% 5,339 16.75% 34.69% 5,518 3.35% 39.20% 5,563 0.82% 40.34%
53,475 -2.84% -7.84% $3,139 -9.67% -16.74% $3,251 3.55% -13.78% $3,501 7.69% -7.16%
$2,492 -6.67% -7.10% $2,246 -9.87% -16.27% $2,174 -3.21% -18.96% $2,598 19.51% -3.15%
$762 8.06% 18.80% $812 6.54% 26.56% $916 12.83% 42.81% $884 -3.46% 37.87%
52,306 2.21% 10.51% 54,946 5.05% 16.09% 56,068 2.04% 18.40 55,270 -1.42% 16.78%
55,375 1.03% -7.18% 55,521 2.71% -4.67% $5,388 -2.41% -6.96% $5,808 7.79% 0.29%
$4,012 0.35% -5.43% $4,054 1.05% -4.44% $3,985 -1.72% -6.08% $4,572 14.73% 7.76%
$1,101 0.46% -5.13% $1,128 2.49% -2.76% $1,144 1.36% -1.44% $1,165 1.86% 0.39%
*Excluding Medical **Including Cont Ed Centers ***Including Coop Nursing ****Including San Juan Center
47

History 24-Dec-90 HISTORY OF ENROLLMENT AND BUDGET CHANGES, USHE Page 31
TABLE 8--CONSTANT DOLLAR EXPENDITURES,
TAX FUNDS, & TUITION/FEES PER FTE
UNIVERSITY OF UTAH--E&G + Coop Nurs
1985-86
Actual I-Yr Inc 9-Yr Inc
1986-87
Actual I-Yr Inc 10-Yr Inc
1987-88
Actual 1-Yr Inc 11-Yr Inc
1988-89
Actual 1-Yr Inc 12-Yr Inc
Annualized FTE* 19,153 -1.50% 0.90% 18,892 -1.36% -0.47% 18,896 0.02% -0.45% 18,622 -1.45% -1.90%
Constant S Expenditures/FTE $7,700 6.15% 14.65% $7,626 -0.95% 13.56% $7,553 -0.97% 12.47% $7,570 0.23% 12.72%
Constant S Tax Fund Approp/FTE $5,744 1.35% 18.26% $5,716 -0.49% 17.68% $5,783 1.18% 19.07% $5.768 -0.26% 18.76%
Constant $ Tuition & Fees/FTE $1,488 4.43% 8.80% $1,634 9.83% 19.50% $1,594 -2.44% 16.58% $1,642 3.02% 20.09%
uTAH STATE UNIVERSITY--E&G + Ctrs + M
Annualized FTE** 10,306 -3.35% 8.28% 10,353 0.46% 8.77% 10.397 0 42% 9.24% 10,631 2.25% 11.69%
Constant $ Expenditures/FTE $6,837 8.92% 10.85% $6,610 -3.32% 7.17% $6,646 0.55% 7.76% $6,507 -2.10% 5.50%
Constant $ Tax Fund Approp/FTE $5,201 5.83% 18.36% $5,200 -0.00% 18.36% $5,248 0.92% 19.44% $4,972 -5.26% 13.16%
Constant $ Tuition & Fees/FTE $1,283 2.46% -8.40% $1,371 6.91% -2.08% $1,317 -3.99% -5.99% 11,358 3.19% -2.99%
wEBER STATE UNIVERSITY--E & G + Coop N
Annualized FTE*** 8,579 1.32% 12.38% 9,027 5.22% 18.25% 9,279 2.79% 21.55% 9,475 2.11% 24.12%
Constant $ Expenditures/FTE $5,427 4.42% 11.15% $5,054 -6.88% 3.50% $4,970 -1.66% 1.79% $4,709 -5.25: -3.56%
Constant $ Tax Fund Approp/FTE $4,166 -0.96% 14.03% $3,869 -7.14% 5.89% $3,819 -1.29% 4.53% 13,648 -4.48% -0.16k
Constant $ Tuition & Fees/FTE $1,100 2.92% 13.43% $1,175 6.88% 21.23% $1,174 -0.16% 21.04% $1,249 6.46% 28.86%
SOUTHERN UTAH UNIVERSITY--Ed & Gen
Annualized FTE 2,361 -2.03% 30.66% 2,685 13.72% 48.59% 2,779 3.50% 53.79% 2,894 4.14% 60.15%
Constant $ Expenditures/FTE $5,684 7.77% -0.48% $4,956 -12.80% -13.22% $4,833 -2.47% -15.36% $4,634 -4.11% -18.85%
Constant $ Tax Fund Approp/FTE 54,568 4.35% -3.30% $3,937 -13.83% -16.67% $3,823 -2.89% -19.07% $3,631 -5.02% -23.14%
Constant $ Tuition & Fees/FIE $892 2.80% 4.50% $936 5.00% 9.72% $906 -3.17% 6.25% $932 2.86% 9.28%
SNOW COLLEGE--Ed & Gen
Annualized FTE 1,142 1.06% 34.51% 1,265 10.77% 49.00% 1,244 -1.66% 46.53% 1,375 10.53% 61.96%
Constant $ Expenditures/FTE $6,554 6.69% 15.95% $5,574 -14.96% -1.39i $6,015 7.91% 6.41% $5,158 -14.23% -8.74%
Constant S Tax Fund Approp/FTE 55.330 -2.15% 10.62% $4,760 -10.70% -1.22% $4,857 2.05% 0.81% $4,305 -11.38% -10.66%
Constant $ Tuition & Fees/FTE $876 3.00% 30.31% $932 6.41% 38.67% $988 5.95% 46.91% $935 -5.31% 39.12%
DIXIE COLLEGE--Ed & Gen
Annualized FTE 1,646 10.99% 43.13% 1.843 11.97% 60.26% 1,812 -1.68% 57.57% 1,802 -0.55% 56.70%
Constant $ Expenditures/FTE $4,642 -0.50% -3.72% $4,340 -6.50% -9.98% $4,323 -0.40% -10.34% $4,608 6.61% -4.41%
Constant $ Tax Fund Approp/FTE $3,572 -7.35% -5.04% $3,429 -4.00% -8.84% $3,495 1.91% -7.10% $3,491 -0.12% -7.21%
Constant S Tuition & Fees/FTE $850 5.13% 7.16% $866 1.96% 9.26% $1,006 16.08% 26.83% $1,001 -0.47% 26.23%
COLEGE OF EASTERN UTAH--E&G + SJC
Annualtzed FTE**** 1,141 -1.814 110.13% 1,309 14.72% 141.07% 1,281 -2.14% 135.91% 1,354 5.70% 149.36%
Constant $ Expenditures/FTC $5,688 19.57% -17.59% $4,849 -14.76% -29.75% $5,004 3.21% -27.50% 14,703 -6.02% -31.86%
Constant $ Tax Fund Approp/FTE $4,290 1.82% -29.93% $4,041 -5.80% -33.99% $4,111 1.71% -32.86% $3,861 -6.08% -36.94%
Constant $ Tuition & Fees/FTE $768 11.34% 7.48% $780 1.56% 9.15% $734 -5.86% 2.76% $726 -1.05% 1.68%
UTAH VALLEY COMMUNITY COLLEGE
Annualized FTE 4,899 -0.97% 70.05% 5,206 6.27% 80.70% 5,302 1.84% 84.03% 5,329 0.511/4 84.97%
Constant $ Expenditures/FTC $3,854 9.35% -1.63% 53,715 -3.62% -5.19% $3,590 -3.35% -8.36: $3,644 1.50% -6.98%
Constant $ Tax Fund Approp/FTE $2,684 4.70% -3.05% $2,496 -6.98% -9.81% $2,445 -2.07% -11.68% $2,433 -0.48% -12.10%
Constant S Tuition & Fees/FTE $959 9.89% 21.60% $1,070 11.54% 35,.63% $1,063 -0.66% 34.73% $1,103 3.72% 39.74%
SALT LAKE COMMUNITY COLLEGE
Annualized FTE 5,720 2.82% 44.30% 5,845 2.19% 47.45% 6,073 3.90% 53.20% 6,530 7.53: 64.73%
Constant S Expenditures/FTC $3,819 9.09% 1.29% $3,745 -1.93% -0.67% $3,452 -7.83% -8.45% $3 620 4.88% -3.98%
Constant $ Tax Fund Approp/FTE $2,619 0.81% -2.36% $2,578 -1.56% -3.88% $2,500 -3.02% -6.79% $2,390 -4.42% -10.91%
Constant $ Tuition & Fees/FTE $987 11.67% 53.95% $1,100 11.45% 71.59% $1,047 -4.81% 63.34% $1,094 4.41% 70.54%
TOTAL USHE--Ed & Gen + Related Inst
Annualized FTE* 54,947 -0.58% 16.09% 56,425 2.69% 19.22% 57,063 1.13% 20.56% 58,012 1.66% 22.57%
Constant S Expenditures/FTE $6,192 6,62% 6.93% 55,920 -4.39% 2.23% $5,837 -1.41% 0.80% $5,740 -1.66% -0.88%
Constant $ Tax Fund Approp/FTE S4,643 1.56% 9.45% 54,484 -3.43% 5.70% $4,481 -0.07% 5.62% 54,333 -3.30% 2.13%
Constant $ Tuition & Fees/FTE $1,217 4.49% 4.90% $1,311 7.74% 13.02% $1,283 -2.16% 10.57% $1,321 2.99% 13.88%
*ExCluding Medical **Including Cont Ed Centers ***Including Coop Nursing ****Incluoing San Juan Center
48 no

History 24-0ec-90 HISTCRY OF ENROLLMINT AND BUDGET CHANGES, USHE
IIIABLE 8--CONSTANT DOLLAR EXPENDITURES,
TAX FUNDS, & TUITION/FEES PER FTE
1UNIVERSITY OF UTAH--E&G + Coop Nurs
Annualized FTE*
Constant S Expenditures/FTE
Constant $ Tax Fund Approp/FTE
III
Constant $ Tuition & Fees/FTE
TAH STATE UNIVERSITY--E&G + Ctrs + M
Annualized FTE**
Constant S Expenditures/FTE..
Constant $ Tax Fund Approp/FTE
Constant S Tuition & Fees/FTE
WEBER STATE UNIVERSITY--E & G + Coop N
Annualized FTE***
IConstant S Expenditures/FTE
Constant S Tax Fund Approp/FTE
Constant S Tuition & Fees/FTE
1-SOUTHERN UTAH UNIVERSITY--Ed & Gen
Annualized FTE
Constant $ Expenditures/FTE
Constant $ Tax Fund Approp/FTE
Constant $ Tuition & Fees/FTE
ISNOW COLLEGE--Ed & Gen
Annualized FTE
Constant $ Expenditures/FTE
Ilt
Constant $ Tax Fund Approp/FTE
Constant $ 7uition & Fees/FTE
IXIE COLLEGE--Ed & Gen
Annualized FTE
11/
Constant S Expenditures/FTE
Constant $ Tax Fund Approp/FTE
Constant S Tuition & Fees/FTE
COLLEGE OF EASTERN UTAH--E&G + SJC
illAnnualized FTE****
Constant $ Expenditures/FTE
Constant $ Tax Fund Approp/FTE
Constant S Tuition & Fees/FTE
iUTAH VALLEY COMMUNITY COLLEGE
Annualized FTE
Constant $ Expenditures/FTE
Constant $ Tax Fund Approp/FTE
11
Constant $ Tuition & Fees/FTE
SALT LAKE COMMUNITY COLLEGE
Annualized FTE
Constant $ Expenditures/FTE
It
Constant $ Tax Fund Approp/FTE
Constant $ Tuition & Fees/FTE
OTAL USHE--Ed & Gen + Related lust
Annualized FTE*
IConstant $ Expenditures/FTE
Constant $ Tax Fund Approp/FTE
Constant $ Tuition & Fees/FTE
1989-90
Actual 1-Yr Inc 13-Yr Inc
1990-91
Budget/ 1-Yr Inc 14-Yr Inc
Enr Estmt
18,996 2.01% 0.07% 19,690 3.65% 3.73%
$7,229 -4.50% 7.64% $7,020 -2.89% 4.54%
$5,696 -1 24% 17.29% $5,220 -8.36% 7.49%
$1,704 3.73% 24.58% $1,763 3.51% 28.95%
11,205 5.40% 17.72% 12,170 8.61% 27.86%
$6,281 -3.48% 1.83% 55,753 -8.40% -6.72%
$4,874 -1.98% 10.93% $4,290 -11.97% -2.35%
$1,411 3.844 0.73% $1,415 0.29% 1.02%
10,034 5.90% 31.44% 10,560 5.24% 38.33%
$4,551 -3.36% -6.80% $4,552 0.03% -6.77%
$3,408 -6.59% -6.73% $3,244 -4.81% -11.22%
$1,278 2.29% 31.81% $1,229 -3.80% 26.80%
3,034 4.84% 67.90% 3,365 10.91% 86.22%
$4,790 3.36% -16.12% 54,475 -6.58% -21.64%
$3,746 3.18% -20.69% $3,369 -10.06% -28.67%
$1,043 11.86% 22.24% $1,030 -1.25% 20.71%
1,616 17.53% 90.34% 1,763 9.10% 107.66%
$4,694 -8.99% -16.95% $4,588 -2.28% -18.84%
$3,872 -10.05% -19.64% $3,534 -8.74% -26.67%
$1,048 12.05% 55.88% $982 -6.28% 46.09%
1,992 10.54% 73.22% 2.088 4.82% 81.57%
$4,493 -2.51% -6.81% $4,169 -7.20% -13.52%
$3,338 -4.38% -11.27% $3,144 -5.80% -16.42%
$1,001 0.05% 26.29% $945 -5.59% 19.24%
1,420 4.87% 161.51% 1,720 21.13% 216.76%
$4,849 3.10% -29.75% $4,226 -12.85% -38.77h
$4,084 5.77% -33.31% $3,410 -16.50% -44.31%
$771 6.13% 7.92% 5747 -3.14% 4.52%
5,854 9.85% 103.19% 5,650 -3.48% 96.11%
53,653 0.26% -6.75% 53,773 3.28% -3.69%
$2,318 -4.71% -16.24% $2,467 6.42% -10.87%
$1,171 6.22% 48.43% $1,201 2.58% 52.26%
7,584 16.14% 91.32% 9,281 22.38% 134.13%
$3,381 -6.60% -10.32% $3,051 -9.78% -19.09%
$2,271 -4.98% -15.35% $2,028 -10.70% -24.40%
$1,140 4.28% 77.84% 5953 -16.44% 48.61%
61,735 6.42% 30.44% 66,287 7.37% 40.05%
$5,481 -4.52% -5.36% $5,206 -5.02% -10.11%
$4,177 -3.59% -1.5455 $3,802 -8.98% -10.38%
$1,368 3.52% 17.89% $1,343 -1.83% 15.73%
*Excluding Medical **Including Cont Ed Centers ***Including Coop Nursing ***Including San Juan Center
r- r,
4 9 Iui
Page.32

TABLE 9
CALCULATION OF CONSTANT DOLLAR INFLATORS BASED ON CPI AT DECEMBER 31:
1975-76 1976-77 1977-78 1978-79 1979-80 1980-81 1981-82 1982-83 1983-84 1984-85 1985-86 1986-87 1987-88 1988-89 1989-90 1990-91
CP/: CPI: CPI: CPI: CPI: CPI: CPI: CPi: CPI: CPI: CPI: CPI: CPI: CPI: CPI:
101.3 105.3 109.3 110.5 115.4 120.5 126.1 134.055.5 58.2 62.1 67.7 76.7 86.3 94.0 97.6
CPI
Change: 4.86% 6.70% 9.02% 13.29% 12.52% 8.92% 3.83%
Dollar
3.79% 3.95% 3.80% 1.10% 4.43% 4.42% 4.65% 6.26%
Inflator 2.302405 2.157810 1.979321 1.747066 1.552723 1.425532 1.372951 1.322804 1.272555 1.225984 1.212670 1.161179 1.112033 1.062649 1.000000
50

TAB H ICOST STUDY
Introduction to the USHE Cost Study 1
TABLE 1 Annualized FTE Student Enrollment 3
TABLE 2 Annualized FTE Instructional Faculty 4
TABLE 3 Appropriated Student/Faculty Ratios 5
TABLE 4 Appropriated Direct Cost per FTE Student 6
SCHEDULE A Analysis of Full Costs Education and General 7
SCHEDULE B Instructional Costs Analysis 7

THE UTAH SYSTEM OF HIGHER EDUCATION
COST STUDY
The USHE Cost Study provides/information by major program ondirect and calculated indirect instructional costs for eachinstitution and for the total system. The Cost Study is preparedtwo ways: for Appropriated Funds only, and for Total Fundsincluding non-appropriated restricted and auxiliary enterprisefunds.
Direct and indirect costs of instruction in courses creditablefor degrees or other formal awards arel broken down betweenVocational Education, Lower Division, Upper Division, BasicGraduate, and Advanced Graduate courses, and the following figuresare provided for each institutional category: (1) TotalAppropriated Instructional Expenditures; (2) Calculated EstimatedFull Cost of Instruction; (3) Annualized number of Academic YearEquivalent FTE Students ("annualized count equating instruction inall four quarters to equivalent enrollments for a three-quarteracademic year]; (4) Calculated Appropriated FTE Student/FacultyRatio (students per faculty FTE); (5) Appropriated Direct Cost perFTE Student; and Calculated Full Cost of Instruction per FTEStudent.
Appropriated direct costs of instruction include applicableexpenditures from Education and General line items, other lineitems that support instruction.
Four summary tables from the Cost Study are provided in thefollowing pages, followed by two sets of schedules showing greaterdetail on the calculations. Table 1 shows Annualized FTE StudentEnrollment by institution, with subtotals for ResearchUniversities, Comprehensive Universities, Combined Four-YearInstitutions, and Community Colleges. Table 2 shows Annualized FTEInstructional Faculty. Table 3 shows Appropriated Student/FacultyRatios. Table 4 shows Appropriated Direct Costs per FTE Student.
Schedule A for total USHE and for each institution providesinformation on the indirect cost allocations by major program, andSchedule B provides both dollar amounts and amounts per FTE studentfor Full as well as Direct costs of instruction. The Schedules arearranged so that for Total USHE and for each institution thes:hedule from Appropriated Funds cost study is on the left-handpage and the equivalent schedule from the Total Funds Cost Study ison the facing right-hand page.
In looking at the cost information for different institutions,the reader should keep in mind the factors that influence costs,particularly direct and indirect costs of instruction. Theseinclude level of instruction (advanced courses typically are moreexpensive), subject matter mix (Natural Sciences, Engineering, FineArts, Health Professions typically are more expensive),

Arts, Health Professions typically are more expensive),institutional size, and amount of physical plant in relation toenrollment size.
It is not invalid to compare USHE instructional costsdesegregated by level and subject matter cluster. Such additionalinformation is available upon request. But this information shouldnot be the exclusive basis for judging relative adequacy ofinstitutional budgets. Equally appropriate and useful arecomparisons of Utah institutions with external comparison groupshaving similar missions, as provided under Tab L of this Data Book.
Readers who would like additional information on the CostStudy methodology or have questions about the data should contactthe Associate Commissioner for Finance.
2

111Cst90Cll UTAH SYSTEM Of HIGHER EDUCATION 09-Jan-91
VOLE 1
1989-90 COST STUDY INFORMATION BY FIELD AND DISCIPLINE CLUSTERS AND BY PROGRAM/LEVEL DIVISIONS
Vocational-Technical EdTOTAL
Non-SCH SCH TOTAL Lower Upper TOTAL TOTAL Basic Advance ALL
Gnrtg Gnrtg VOC-TECH Div Div BACC UNDRGRD Grad Grad LEVELS
IIII. Annualized FTE Student Enrollment
G. TOTAL ALL FIELDS AND DISCIPLINES
1. University of Utah
2. Utah State University
3. RESEARCH UNIV SUBTOTAL
4. Weber State University
5. Southern Utah University
6. COMPREHENSIVE/BACC SUBTOTAL
7. COMBINED FOUR-YEAR SUBTOTAL
8. Snow College
9. Dixie College
10. College of Eastern Utah
11. Utah Valley CuMM College
12. Salt Lake Community College
13. COMMUNITY COLLEGE SUBTOTAL
14. USHE GRAND TOCAL
9,115.0 6,864.6 15,979.6 15,979.6 2,198.0 818.2 18,995.8
361.5 361.5 5,488.3 3,572.4 9,060.7 9,422.2 1,53.7 248.8 11,204.7
361.5 361.5 14,603.3 10,437.0 25,040.3 25,401.8 3,731.7 1,067.0 30,200.5
2,946.9 2,946.9 4,691.2 2,266.1 6,957.3 9,904.2 129.6 10,033.9
466.1 466.1 1,501.6 1,045.4 2,547.0 3,013.1 31.1 3,044.2
3,413.0 3,413.0 6,192.8 3,311.6 9,504.3 12,917.3 160.7 13,078.0
3,774.5 3,774.5 20,796.1 13,748.6 34,544.7 38,319.2 3,892.4 1,067.0 43,278.6
321.6 321.6 1,291.9 1,291.9 1,613.5 1,613.5
501.8 501.8 1,489.9 1,489.9 1,991.8 1,991.8
561.7 561.7 858.4 858.4 1,420.2 1,420.2
2,174.5 2,174.5 3,679.3 3,679.3 5,853.8 5,853.8
140.1 3,341.1 3,481.2 4,102.6 4,102.6 7,583.7 7,583.7
140.1 6,900.7 7,040.'.; 11,422.1 11,422.1 18,462.9 18,462.9
140.1 10,675.2 10,815.3 32,218.2 13,748.6 45,966.8 56,782.1 3,892.4 1,067.0 61,741.5
3

111Cst90Cll UTAH SYSTEM Of HIGHER EDUCATION 09-Jan-91
TABLE 2
1989-90 COST STUDY INFORMATION BY FIELD AND DISCIPLINE CLUSTERS AND BY PROGRAM/LEVEL DIVISIONS
Vocational-Technical Ed
TOTAL
Non-SCH SCH TOTAL Lower Upper TOTAL TOTAL Basic Advance ALL
Gnrtg Gnrtg VOC-TECH Div Div BACC UNDRGRD Grad Grad LEVELS
II. Annualized Instructional Faculty
G. TOTAL ALL FIELDS AND DISCIPLINES
1. University of Utah 370.3 483.6 853.9 853.9 222.5 142.9
2. Utah State University 15.5 15.5 174.6 237.7 412.3 427.8 108.5 34.5
3. RESEARCH UNIV SUBTOTAL 15.5 15.5 544.9 721.4 1,266.2 1,281.7 331.0 177.4
4. Weber State University 132.0 132.0 155.1 158.0 313.1 44.5.1 6.4
5. Southern Utah Univetsity 20.6 20.6 57.9 65.2 123.1 143.7 1.7
6. COMPREHENSIVE/BACC SUBTOTAL 152.6 152.6 213.0 223.2 436.2 588.8 8.1
7. COMBINED FOUR-YEAR SUBTOTAL 168.1 168.1 757.9 944.6 1,702.4 1,870.5 339.1 177.4
8. Snow College 17.9 17.9 48.9 48.9 66.8
9. Dixie College 27.1 27.1 55.8 55.8 82.9
10. College of Eastern Utah 33.0 33.0 36.7 36.7 69.7
11. Utah Valley Comm College 132.6 132.6 105.7 105.7 238.3
12. Salt Lake Community College 10.0 181.6 191.6 109.5 109.5 301.1
13. COMMUNITY COLLEGE SUBTOTAL 10.0 392.2 402.2 356.6 356.6 758.8
14. USHE GRAND TOTAL 10.0 560.3 570.3 1,114.4 944.6 2,059.0 2,629.3 339.1 177.4
41 ti.b.9
1,219.3
570.8
1,790.1
451.5
145.4
596.9
2,387.0
66.8
82.9 i
69.7 III
238.3 I
301.1
111
758.8
3,145.7
a

11/Cst90Cll UTAH SYSTEM Of HIGHER EDUCATION 09-Jan-91
TABLE 3
1989-90 COST STUDY INFORMATION BY FIELD AND DISCIPLINE CLUSTERS AND BY PROGRAM/LEVEL DIVISIONS
111 III. Appropriated Student/Faculty Ratios
G. TOTAL ALL FIELDS AND DISCIPLINES
I. University of Utah
2. Utah State University
3. RESEARCH UNIV SUBTOTAL
4. Weber State University
5. Southern Utah University
6. COMPREHENSIVE/BACC SUBTOTAL
7. COMBINED FOUR-ITAR SUBTOTAL
8. Snow College
9. Dixie College
10. College of Eastern Utah
11. Utah Vallv Comm College
12. Salt Lake Community College
13. COMMUNITY COLLEGE SUBTOTAL
14. USHE GRAND TOTAL
Vocational-Technical Ed
TOTAL
Non-SCH SCH TOTAL Lower Upper TOTAL TOTAL Basic Advance ALL
Gnrtg Gnrtg VOC-TECH Div Div BACC UNDRGRD Grad Grad LEVELS
0.0 0.0 0.0 24.6 14.2 18.7 18.7 9.9 5.7 15.6
0.0 23.4 23.4 31.4 15.0 22.0 22.0 14.1 7.2 19.6
0.0 23.4 23.4 26.8 14.5 19.8 19.8 11.3 6.0 16.9
0.0 22.3 22.3 30.2 14.3 22.2 22.3 20.3 0.0 22.2
0.0 22.6 22.6 25.9 16.0 20.7 21.0 18.3 0.0 20.9
0.0 22.4 22.4 29.1 14.8 21.8 21.9 19.8 0.0 21.9
0.0 22.5 22.5 27.4 14.6 20.3 20.5 11.5 6.0 18.1
0.0 17.9 17.9 26.4 0.0 26.4 24.2 0.0 0.0 24.2
0.0 18.5 18.5 26.7 0.0 26.7 24.0 0.0 0.0 24.0
0.0 17.0 17.0 23.4 0.0 23.4 20.4 0.0 0.0 20.4
0.0 16.4 16.4 34.8 0.0 34.8 24.6 0.0 0.0 24.6
14.0 18.4 18.2 37.5 0.0 37.5 25.2 0.0 0.0 25.2
14.0 17.6 17.5 32.0 0.0 32.0 24.3 0.0 0.0 24.3
14.0 19.1 19.0 28.9 14.6 22.3 21.6 11.5 6.0 19.6

Cst90C11 UTAH SYSTEM Of HIGHER EDUCATION 09-Jan-91111
TABLE 4
1989-90 COST STUDY INFORMATION BY FIELD AND DISCIPLINE CLUSTERS AND BY PROGRAM/LEVEL DIVISIONS
Vocational-Technical EdTOTAL III
Non-SCH SCH TOTAL Lower Upper TOTAL TOTAL Basic Advance ALL
Gnrtg Gnrtg VOC-TECH Div Div BACC UNDRGRD Grad Grad LEVELS
IV. Appropriated Direct Cost per FTE Student
G. TOTAL ALL FIELDS AND DISCIPLINES
1. University of Utah $0 $0 $0 $1,861 $4,247 $2,886 $2,886 $7,035 $13,939 $3,842
2. Utah State University $0 $2,149 $2,149 $1,619 $4,117 $2,604 $2,587 $4,977 $10,389 $3,081
3. RESEARCH UNIV SUBTOTAL $0 $2,149 $2,149 $1,770 $4,203 $2,784 $2,775 $6,189 $13,111 $3.562
4. Weber State University $0 $2,395 $2,395 $1,714 $4,035 $2,470 $2,448 $2,565 $0 $2,449
5. Southern Utah University $0 $2,153 $2,153 $1,588 $2,903 $2,128 $2,132 $3,087 $0 $2,141
6. COMPREHENSIVE/BACC SUBTOTAL $0 $2,362 $2,362 $1,683 $3,678 t',378 $2,374 $2,666 $0 $2,378
7. COMBINED FOUR-YEAR SUBTOTAL $0 $2,342 $2,342 $1,744 $4,076 $2,672 $2,640 $6,044 $13,111 $3,204
8. Snow College $0 $2,694 $2,594 $1,650 $0 $1,650 $1,839 $0 $0 $1,839
9. Dixie College $0 $2,425 $2,425 $1,631 $0 $1,631 $1,831 $0 $0 $1,831
10. College of Eastern Utah $0 $2,472 $2,472 $1,753 $0 $1,753 $2,037 $0 $0 $2,037
11. Utah Valley Comm College $0 $2,853 $2,853 $1,042 $0 $1,042 $1,715 $0 $0 $1,715
12. Salt Lake Community College $3,393 $2,673 $2,702 $1,048 $0 $1,048 $1,807 $0 $0 $1,807
13. COMMUNITY COLLEGE SUBTOTAL $3,393 $2,692 $2,706 $1,243 $0 $1,243 $1,801 $0 $0 $1,801
14. USHE GRAND TOTAL $3,393 $2,568 $2,579 $1,567 $4,076 $2,317 $2,367 $6,044 $13,111 $2,785
2'6
1

I USHE
11/ 1. School of Medicine
2. Instruction
11/
Research
4. Public Service
5. Academic Support
6. Student Services
111
8. Institutional Support
9. Plant Operation
and Maintenance
II/
10. Scholarships and
Fellowships
11. Ed & Gen Transfers
to Other Funds
111
12. TOTAL EDUCATION
AND GENERAL
I
IB. OTHER INSTRUCTIONAL ACTIVITIES
IC. TOTAL INSTRUCTION
REGULAR INSTRUCTION
1. Vocational Education
2. Lower Division
3. Upper Division
4. Basic Graduate
5. Advanced Graduate
6. TOTAL
APPROPRIATED FUNDS COST STUDY 09-Jan-91
TOTAL USHE
1989-90
SCHEDULE A
ANALYSIS OF FULL COSTS
EDUCATION AND GENERAL
Allocations From
Appropriated
Direct
Expenditures
(1)
Physical
Plant
(2)
Institutional
Support
(3)
Academic
Support
(4)
Student
Services
(5)
Appropriated
Full Cost
(6)
14,773,589 0 1,913,521 144,886 0 16,831,995
177,587,067 26,628,414 29,694,630 41,455,239 30,808,851 306,174,202
17,128,292 2,199,847 1,753,533 3,766,503 0 24,848,175
14,477,335 1,911,646 1,626,033 3,278,440 0 21,293,454
37,323,404 5,471,332 5,850,332 (48,645,068) 0 (0)
22,948,060 3,595,367 4,265,425 0 (30,808,851) (0)
39,056,859 6,046,614 (45,103,473) 0 0 0
45,853,220 (45,853,220) 0 0 0
1,004,626 0 0 0 1,004,626
528,267 0 0 0 528,267
370,680,719 0 (0) 0 0 370,680,719
SCHEDULE B
INSTRUCTIONAL COSTS ANALYSIS
[Excluding School of Medicine and Skill Center]
Total
Appropriated
Instructional
Expenditures
Calculated
Estimated
.Full Cost Of
Instruction
Academic Year
Equivalent
FTE
Students
Calculated
Appropriated
FTE Student/
Faculty Ratio
Appropriated
Direct Cost Of
Instruction
Per FTE
Student
Appropriated
Full Cost Of
Instruction
Per FTE
Studelt
(1) (2) (3) (4) (5) (6)
27,887,689 46,152,911 10,815 19.0 2,579 4,267
50,478,765 115,272,948 32,218 28.9 1,567 3,578
56,040,814 86,279,958 13,749 14.6 4,076 6,276
23,524,696 32,174,532 3,892 11.5 6,044 8,266
13,988,985 16,535,920 1,067 6.0 13,111 15,498
171,920,948. 296,416,269 61,741 19.6 2,785 4,801
5,666,119 9,757,933
177,587,067 306,174,202

USHE TOTAL FUNDS COST STUDY
TOTAL USHE
1989-90
SCHEDULE A
ANALYSIS OF FULL COSTS
EDUCATION AND GENERAL
Allocations From
09-Jan-91
All Funds
Direct
Expenditures
(1)
Physical
Plant
(2)
Institutional
Support
(3)
$
Academic
Support
(4)
$
Student
Services
(5)
$
All Funds
Full Cost
(6)
$
1. School of Medicine 111,642,329 0 8,357,076 181,089 0 120,180,494
2. Instruction 202,974,885 21,038,278 26,080,398 40,152,093 41,719,954 331,965,608
3. Research 97,050,906 7,058,103 7,498,630 12,934,532 0 124,542,171
4. Public Service 43,112,302 3,847,975 4,072,132 7,885,681 0 58,918,090
5. Academic Support 50,174,806 4,999,985 5,978,604 (61,153,395) 0 0
6. Student Services 32,772,674 3,810,039 5.137,241 0 (41,719,954) 0
8. Institutional Support 51,573,258 5,550,824 (57,124,082) 0 0 (0)
9. Plant Operation
and Maintenance 46,305,203 (46,305,203)
10. Scholarships and
Fellowships 52,107,179 0 0 0 0 52,107,179
11. Ed & Gen Transfers
to Other Funds 16,147,291 0 0 0 0 16,147,291
12. TOTAL EDUCATION
AND GENERAL 703,860,833 0 0 0 0 703,860,833
SCHEDULE 8
INSTRUCTIONAL COSTS ANALYSIS
[Excluding School of Medicine and Skill Center]
Appropriated All Funds
Total Calculated Academic Year Calculated Direct Cost Of Full Cost Of
Appropriated Estimated Equivalent Appropriated Instruction Instruction
Instructional Full Cost Of FTE FTE Student/ Per rTE Per FIT
Expenditures Instruction Students Faculty Ratio Student Student
A. REGULAR INSTRUCTION
(1) (2) (3) (4) (5) (6)
1. Vocational Education 27,887,689 51,769.841 10,815 19.0 2,579 4,787
2. Lower Division 50,478,765 128,671,551 32,218 28.9 1,567 3,994
3. Upper Division 56,040,814 90,536,749 13,749 14.6 4,076 6,585
4. Basic Graduate 23,524,696 33,460,666 3,892 11.5 6,044 8,596
5. Advanced Graduate 13,988,985 16,819,079 1,067 6.0 13,111 15,763
6. TOTAL 171,920,948 321,257,886 61,741 19.6 2,785 5,203
B. OTHER INSTRUCTIONAL ACTIVITIES 5,666,119 10,707,722
C. TOTAL INSTRUCTION 177,587,067 331,965,608
2 .23

II/ USHE APPROPRIATED FUNDS COST STUDY
1. School of Medicine
2. Instruction
3. Research
4. Public Service
5. Academic Support
6. Student Services
7. Institutional Support
8. Plant Operation
and Maintenance
II/
Scholarships and
Fellowships
10. Ed & Gen Transfers
to Other Funds
I11. fOTAL EDUCATION
AND GENERAL
A. REGULAR INSTRUCTION
1. Vocational Education
2. Lower Division
3. Upper Division
4. Basic Graduate
5. Advanced Graduate
6. TOTAL
OTHER INSTRUCTIONAL ACTIVITIES
TOTAL INSTRUCTION
UNIVERSITY OF UTAH
1989-90
SCHEDULE A
ANALYSIS OF FULL COSTS
EDUCATION AND GENERAL
Allocations From
09-Jan-91
Appropriated
Direct
Expenditures
(1)
Physical
Plant
(2)
$
Institutional
Support
(3)
$
Academic
Support
(4)
$
Student
Services
(5)
$
Appropriated
Full Cost
(6)
$
14,773,589 o 1,913,521 144,886 0 16,831,99574,820,251 10,858,963 11,097,434 19,237,419 9,055,354 125,069,4213,441,988 499,550 510,520 891,652 o 5,343,710
4,607,142 668,653 683,337 1,193,487 o 7,152,62016,596,975 2,408,786 2,461,684 (21,467,445) o o7,000,902 1,016,069 1,038,383 0 (9,055,354) (0)15,460,967 2,243,912 (17,704,879) o o o
17,695,932 (17,695,932) o o o o
423,400 o o o o 423,400
283,706 o o o o 283,706
155,104,852 (0) 0 (0) 0 .155,104,852
Total
Appropriated
Instructional
Expenditures
SCHEDULE 8
INSTRUCTIONAL COSTS ANALYSIS
[Excluding School of Medicine]
Calculated
Estimated
Full Cost Of
Instruction
Academic Year
tquivalent
FTE
Students
Calculated
Appropriated
FTE Student/
Faculty Ratio
Appropriated
Direct Cost
Of Instruction
Per FTE
Student
Appropriated
Full Cost
Of Instruction
Per FTE
Student
(1) (2) (3) (4) (5) (6)
16,966,802 40,487,702 9,115 24.6 1,861 4,44229,153,102 46,867,033 6.865 14.2 4,247 6,82715,462,710 21,134,663 2,198 9.9 7,035 9,615
11,404,626 13,515,964 818 5.7 13,939 16,519
72,987,239 122,005,361 18,996 15.6 3,842 6,423
1,833,012 3,064,060
74,820,251 125,069,421
9
1

USHE TOTAL FUNDS COST STUDY
UNIVERSITY OF UTAH
1989-90
SCHEDULE A
ANALYSIS OF FULL COSTS
EDUCATION AND GENERAL
Allocations From
09-Jan-91
All Funds
Direct
Expenditures
(1)
Physical
Plant
(2)
Institutional
Support
(3)
Academic
Support
(4)
Student
Services
(5)
All Funds
Full Cost
(6)
1. School of Medicine 111,642,329 0 8,357,076 181,089 0 120,180,494
2. Instruction 83,878,890 7,807,654 6,863,270 18,735,321 11,318,067 128,603,201
3. Research 28,367,275 2,640,496 2,321,112 6,397,402 0 39,726,285
4. Public Service 22,435,978 2,088,396 1,835,792 5,059,773 0 31,419,939
5. Academic Support 25,851,927 2,406,361 2,115,297 (30,373,585) 0 (0)
6. Student Services 9,633,168 896,679 788,220 0 (11,318,067) 0
7. Institutional Support 20,383,427 1,897,340 (22,280,767) 0 0 (0)
8. Plant Operation
and Maintenance 17,736,925 (17,736,925) 0 0 0
9. Scholarships and
Fellowships 14,105,650 0 0 0 14,105,650
10. Ed & Gen Transfers
to Other Funds 12,928,837 0 0 0 12,928,837
11. TOTAL EDUCATION
AND GENEkAL 346,964,406 0 (0) (0) 0 346,964,406
Total
Appropriated
Instructional
Expenditures
SCHEDULE B
INSTRUCTIONAL COSTS ANALYSIS
[Excluding School of Medicine)
Calculated
Estimated
Full Cost Of
Instruction
Academic Year
Equivalent
FTE
Students
Calculated
Appropriated
FTE Student/
Faculty Ratio
Appropriated
Direct Cost
Of Instruction Of
Per FTE
Student
All Funds
Full Cost
Instruction
Per FTE
Student
A. REGULAR INSTRUCTION
I. Vocational Education
(1) (2) (3) (4) (5) (6)
2. Lower Division 16,966,802 42,141,812 9,115 24.6 1,861 4,623
3. Upper Division 29,153,102 48,112,768 6,865 14.2 4,247 7,009
4. Basic Graduate 15,462,710 21,533,544 2,198 9.9 7,035 9,797
5. Advanced Graduate 11,404,626 13,664,444 818 5.7 13,939 16,701
6. TOTAL 72,987,239 125,452,567 18,996 15.6 3,842 6,604
B. OTHER INSTRUCTIONAL ACTIVITIES 1,833,012 3,150,634
C. TOTAL INSTRUCTION 74,820,251 128,603,201
4#c-
.,t)
10
111
11/

IIIUSNE APPROPRIATED FUNDS COST STUDY
1. School of Medicine
2. Instruction
3. Research
4. Public Service
5. Academic Support
6. Student Services
7. Institutional Support
8. Plant Operation
and Maintenance
9. Scholarships and
11/
Fellowships
10. Ed & Gen Transfers
to Other Funds
I11. TOTAL EDUCATION
AND GENERAL
UTAH STATE UNIVERSITY
1989-90
SCHEDULE A
ANALYSIS OF FULL COSTS
EDUCATIONAL AND GENERAL
Allocations From
09-Jan-91
Appropriated
Direct
Expenditures
(1)
Physical
Plant
(2)
Institutional
Support
(3)
$
Academic
Support
(4)
$
Student
Services
(5)
$
Appropriated
Full Cost
(6)
$
0 0 0 0 0 0
35,831,431 4,451,462 3,254,251 7,526,505 5,092,205 56,155,854
13,686,220 1,700,286 1,242,998 2,874,834 0 19,504,338
9,503,000 1,180,590 863,073 1,996,135 0 13,542,799
10,203,224 1,267,582 926,668 (12,397,474) 0 0
4,190,927 520,653 380,625 0 (5,092,205) (0)
5,930,810 736,805 (6,667,615) 0 0 (0)
9,857,378 (9,857,378)
137,253 0 o o o 137,253
84,413 0 o o o 84,413
89,424,656 (0) o (0) o 89,424,656
SCHEDULE 13
INSTRUCTIONAL COSTS ANALYSIS
Total
Appropriated
Instructional
Expenditures
(1)
Calculated
Estimated
Full Cost Of
Instruction
(2)
Academic Year
Equivalent
FTE
Students
(3)
Calculated
Appropriated
FTE Student/
Faculty Ratio
(4)
Appropriated
Direct Cost
Of Instruction
Per FTE
Student
(5)
Appropriated
Full C5st
Of Instruction
Per FTE
Student
(6)
II/
A. REGULAR INSTRUCTION
1. Vocational Education 776,822 1,409,838 362 23.4 2,149 3,900
2. Lower Division 8,885,936 18,496,162 5,488 31.4 1,619 3,370
3. Upper Division 14,708,494 20,963,906 3,572 15.0 4,117 5,868
4. Basic Graduate 7,633,594 10,319,146 1,534 14.1 4,977 6,728
5. Advanced Graduate 2,584,359 3,019,956 249 7.2 10,389 12,140
6. TOTAL 34,589,205 54,209,008 11,205 19.6 3,087 4,838
IB. OTHER INSTRUCTIONAL ACTIVITIES 1,242,226 1,946,846
TOTAL INSTRUCTION
IC35,831,431 56,155,854

USHE TOTAL FUNDS COST STUDY
UTAH STATE UNIVERSITY
1989-90
SCHEDULE A
ANALYSIS OF FULL COSTS
EDUCATIONAL AND GENERAL
Allocations From
09-Jan-91
All Funds
Direct
Expenditures
(1)
$
Physical
Plant
(2)
$
Institutional
Support
(3)
$
Academic
Support
(4)
$
Student
Services
(5)
All Funds
Full Cost
(6)
1. School of Medicine 0 0 0 0 0 0
2. Instruction 45,365,620 2,903,452 3,396,479 4,293,133 6,481,101 62,439,785
3. kesearch 68,320,741 4,372,607 5,115,106 6,465,469 0 84,273,923
4. Public Service 15,062,597 964,024 1,127,722 1,425,435 0 18,579,777
5. Academic Support 10,698,355 684,707 800,975 (12,184,037) 0 0
6. Student Services 5,690,816 364,219 426,066 0 (6,481,101) 0
7. Institutional Support 10,212,721 653,626 (10,866,347) 0 0 0
8. Plant Operation
and Maintenance 9,942,635 (9,942,635) 0 0
9. Scholarships and
Fellowships 12,389,773 0 0 0 0 12,389,773
10. Ed & Gen Transfers
to Other Funds 1,641,533 0 0 0 0 1,641,533
11. TOTAL EDUCATION
AND GENERAL 179,324,791 0 (0) (0) 0 179,324,791
Total
Appropriated
Instructional
Expenditures
SCHEDULE B
INSTRUCTIONAL COSTS ANALYSIS
Calculated
Estimated
Full Cost Of
Instruction
Academic Year
Equivalent
FTE
Students
Calculated
Appropriated
FTE Student/
Faculty Ratio
Appropriated
Direct Cost
Of Instruction
Per FTE
Student
Of
All Funds
Full Cost
Instruction
Per FTE
Student
A. REGULAR INSTRUCTION
(1) (2) (3) (4) (5) (6)
1. Vocational Education 776,822 1,605,555 362 23.4 2,149 4,441
2. Lower Division 8,885,936 21,467,464 5,488 31.4 1,619 3,911
3. Upper Division 14,708,494 22,897,962 3,572 15.0 4,117 6,410
4. Basic Graduate 7,633,594 11,149,468 1,534 14.1 4,977 7,270
5. Advanced Graduate 2,584,369 3,154,635 249 7.2 10,389 12,681
6. TOTAL 34,589,205 60,275,084 11,205 19.6 3,087 5,379
B. OTHER INSTRUCTIONAL ACTIVITIES 1,242,226 2,164,701
C. TOTAL INSTRUCTION 35,831,431 62,439,785
2 E712

IIUSHE APPROPRIATED FUNDS COST STUDY
1. School of Medicine
2. Instruction
3. Research
III4.Public Service
5. Academic Support
6. Student Services
7. Institutional Support
8. Plant Operation
and Maintenance
9. Scholarships and
Fellowships
1110. kd & Gen Transfers
to Other Funds
all. TOTAL EDUCATIONAND GENERAL
IC
WEBER STATE UNIVERSITY
1989-90
SCHEDULE A
ANALYSIS OF FULL COSTS
EDUCATIONAL AND GENERAL
Allocations From
09-Jan-91
Appropriated
Direct
Expenditures
(1)
$
Physical
Plart
(2)
$
Institutional
Support
(3)
$
Academic
Support
(4)
$
Student
Services
(5)
Appropriated
Full Cost
(6)
0 0 0 0 0 0
25,544,205 3,563,595 4,605,394 5,012,993 4,567,646 43,293,832
84 12 15 16 0 127
173,929 24,264 31,358 34,133 0 263,684
3,824,178 533,500 689,465 (5,047,143) 0 (0)
3,460,867 482,815 623,964 0 (4,567,646) 0
5,221,728 '728,467 (5,950,195) 0 0 0
5,332,653 (5,332,653) 0 0 0 0
161,761 0 0 0 0 161,761
0 0 0 0 0 0
43,719,405 0 0 (0) 0 43,719,405
SCHEDULE B
INSTRUCTIONAL COSTS ANALYSIS
Appropriated Appropriated
Total Calculated Academic Year Calculated Direct Cost Of Full Cost Of
Appropriated Estimated Equivalent Appropriated Instruction irtruction
Instructional Full Cost Of FTE FTE Student/ Per FTE Per FTE
Expenditu,es Instruction Students Faculty Ratio Student Student
REGULAR INSTRUCTION
I. Vocational Education
2. Lower Division
3. Upper Division
4. Basic Graduate
5. Advanced Graduate
6. TOTAL
OTHER INSTRUCTIONAL ACTIVITIES
TOTAL INSTRUCTION
(1) (2) (3) (4) (5) (6)
7,057,848 2,947 22.3 2,395 4,097
8,040,432 16,024,292 4,691 30.2 1,714 3,416
9,144,698 13,001,403 2,266 14.3 4,035 5,737
332,502 553,123 130 20.3 2,565 4,267
0 0 0 0.0 0 0
24,575,480 41,651,980 10,034 22.2 2,449 4,151
968,725 1,641,853
25,544,205 43,293,832
2, ,
13

USHE
1.
2.
3.
4.
5.
6.
7.
8.
9.
10.
11.
A.
B.
C.
TOTAL FUNDS COST STUDY
WEBER STATE UNIVERSITY
1989-90
SCHEDULE A
ANALYSIS OF FULL COSTS
EDUCATIONAL AND GENERAL
All Funds
irect
Expenditures
(1)
$
Physical
Plant
(2)
$
School of Medicine 0 0
Instruction 28,676,783 3,521,288
Research 355,377 43,638
Public Service 1,452,149 178,313
Academic Support 4,609,387 565,997
Student Services 3,725,837 457,504
Institutional Support 5,850,937 718,450
Plant Operation
and Maintenance 5,485,189 (5,485,189)
Scholarships and
Fellowships 7,881,559 0
Ed & Gen Transfers
to Other Funds 838,625 0
TOTAL EDUCATION
AND GENERAL 58,875,843 0
Allocations From
Institutional
D Support
SCHEDULE B
(3)
$
0
4,852,940
60,140
245,746
780,041
630,519
(6,569,387)
INSTRUCTIONAL COSTS ANALYSIS
REGULAR INSTRUCTION
Total
Appropriated
Instructional
Expenditures
(1)
Calculated
Estimated
Full Cost Of
Instruction
(2)
1. Vocational Education 7,057,848 13,252,377
2. Lower Division 8,040,432 17,901,481
3. Upper Division 9,144,698 13,908,204
4. Basic Graduate 332,502 604,997
5. Advanced Graduate 0 0
6. TOTAL 24,575,480 45,667,058
OTHER INSTRUCTIONAL ACTIVITIES 968,725 1.800,120
TOTAL INSTRUCTION 25,544,205 47,467,178
14
0
0
0
0
Academic Year
Equivalent
FTE
Students
(3)
2,947
4,691
2,266
130
0
10,034
2.,;)
09 Jan 91
Academic
Support
(4)
$
Student
Services
(5)
$
All Funds
Full Cost
(6)
$
0 0 0
5,602,307 4,813,860 47,467,178
69,427 0 528,581
283,692 0 2,159,900
(5,955,426) 0 (0)
0 (4,813,860) (0)
0 0 (0)
0 0 0
0 0 7,881,559
0 0 838,625
(0) 0 58,875,843
Calculated
Appropriated
FTE Student/
Faculty Ratio
Appropriated
Direct Cost Of
Instruction
Per FTE
Student
All Funds
Full Cost Of
Instruction
Per FTE
Student
(4) (5) (6)
22.3 2,395 4,497
30.2 1,714 3,816
14.3 4,035 6,137
20.3 2,565 4,667
0.0 0 0
22.2 2,449 4,551

USHE APPROPRIATED FUNDS COST STUDY 09-Jan-91
IISOUTHERN UTAH UNIVERSITY
1989-90
111
SCHEDULE A
ANALYSIS OF FULL COSTS
EDUCATION AND GENERAL
IAllocations From
Appropriated Physical Institutional Academic Student Appropriated
Direct Plant Support Support Services Full Cost
Expenditures
0 "
TOTAL INSTRUCTION 6,578,260 13,669,183
Medicine 0 0 0 0 0 0
2. Instruction 6,578,260 1,281,672 1,503,086 2,272,022 2,034,144 13,669,183
I3 Researrst 0 0 0 0 0 0
4. Public Service 61,577 11,997 14,070 21,268 0 108,912
5. Academic Support 1,611,217 313,921 368,152 (2,293,289) 0 (0)
6. Student Services 1,429,147 278,447 326,550 0 (2,034,144) 0
11/
Institutional Support 1,851,183 360,674 (2,211,857) 0 0 0
8. Plant Operation
and Maintenance 2,246,711 (2,246,711) 0 0 0 0
9. Scholarships and
Fellowships 30,093 0 0 0 0 30,093
10. Ed & Gen Transfers
to Other Funds 0 0 0 0 0 0
TOTAL EDUCATION
AND GENERAL 13,808,188 (0) 0 0 0 13,808,188
11/
SCHEDULE B
INSTRUCTIONAL COSTS ANALYSIS
I Total
Appropriated Appropriated
Calculated Academic Year Calculated Direct Cost Full Cost
Appropriated Estimated Equivalent Appropriated Of Instruction Of Instruction
III
Instructional Full Cost Of FTE FTE Student/ Per FTE
Expenditures Instruction Students Faculty Ratio Student Student
(3) (4) (5)
Per FTE
(1) (2) (5)
$ $ $ $
IIIA. REGULAR INSTRUCTION
1. Vocational Education 1,003,534 2,079,383 466 22.6 2,153 4,461
2. Lower Division 2,384,709 5,850,725 1,502 25.9 1,588 3,896
3. Upper Division 3,034,520 5,447,615 1,045 16.0 2,903 5,211
III
4. Basic Graduate
5. Advanred Graduate
95,890
0
167,600
0
31
0
18.3
0.0
3,087
0
5,395
0
6. TOTAL 6,518,653 13,545,324 20.9 2,141 4,450
IB. OTHER INSTRUCTIONAL ACTIVITIES 59,607 123,859
3,044
15
TOTAL INSTRUCTION 6,578,260 13,669,183
0 "
1515

USHE TOTAL FUNDS COST STUDY 09-Jan-91
SOUTHERN UTAH UNIVERSITY
1989-90
SCHEDULE A
ANALYSIS OF FULL COSTS
EDUCATION AND GENERAL
Allocations From
All Funds
Direct
Expenditures
(1)
$
Physical
Plant
(2)
$
Institutional
Support
(3)
$
Academic
Support
(4)
$
Student
Services
(5)
$
All Funds
Full Cost
(6)
$
1. School of Medicine 0 0 0 0 0 0
2. Instruction 7,362,618 1,016,644 1,366,893 1,994,748 2,428,418 14,169,320
3. Research 0 0 0 0 0 0
4. Public Service 2,953,102 407,770 548,253 800,081 0 4,709,206
5. Academic Support 2,111,321 291,535 391.973 (2,794,829) 0 (0)
6. Student Services 1,834,520 253,314 340,584 0 (2,428,418) (0)
7. Institutional Support 2,326,461 321,242 (2,647,703) 0 0( 0
8. Plant Operation
and Maintenance 2,290,504 (2,290,504) 0 0 0 0
9. SOolarships and
Fellowships 3,461,512 0 0 0 0 3,461,512
10. Ed & Gen Transfers
to Other Funds 86,369 0 0 0 0 86,369
11. TOTAL EDUCATION
AND GENERAL 22,426,407 (0) (0) 0 0 22,426,407
SCHEDULE B
INSTRUCTIONAL COSTS ANALYSIS
Appropriated All Funds
Total Calculated Academic Year Calculated Direct Cost Full Cost
Appropriated Estimated Equivalent Appropriated Of Instruction Of Instruction
Instructional Full Cost Of FTE FTE Student/ Per FTE Per FTE
Expenditures Instruction Students Faculty Ratio Student Student
A. REGULAR INSTRUCTION
(1)
$
(2)
$
(3) (4) (5)
$
(6)
$
1. Vocational Education 1,003,534 2,155,265 466 22.6 2,153 4,624
2. Lower Division 2,384,709 6,095,190 1,502 25.9 1,588 4,059
3. Upper Division 3,034,520 5,617,816 1,045 16.0 2,903 5,374
4. Basic Graduate 95,890 172,657 31 18.3 3,087 5,558
5. Advanced Graduate 0 0 0 0.0 0 0
6. TOTAL 6,518,653 14,040,929 3,044 20.9 2,141 4,612
B. OTHER INSTRUCTIONAL ACTIVITIES 59,607 128,391
C. TOTAL INSTRUCTION 6,578,260 14,169,320
16
1
1
1
1

1
USHE APPROPRIATED mins cosT STUDY 09-Jan-91
1. School of Medicine
2. Instruction
3. Research
4. Public Service
5. Academic Support
6. Student Services
7. Institutional Support
8. Plant Operation
and Maintenance
Scholarships and
Fellowships
Ed & Gen Transfers
to Other Fund.;
TOTAL EDUCATION
AND GENERAL
A.
111
18
I
REGULAR INSTRUCTION
1. Vocational Education
2. Lower Division
3. Upper Division
4. Basic Graduate
5. Advanced Graduate
6. TOTAL
OTHER INSTRUCTIONAL ACTIVITIES
TOTAL INSTRUCTION
SNOW COLLEGE
1989-90
SCHEDULE A
ANALYSIS OF FULL COSTS
EDUCATIONAL AND GENERAL
Allocations From
Appropriated
Direct
Expenditures
(1)
$
Physical
Plant
(2)
$
Institutional
Support
(3)
$
Academic
Support
(4)
$
Student
Services
(5)
$
Appropriated
Full Cost
(6)
$
0 0 0 0 0 0
3,124,551 697,976 1,040,174 940,320 1,494,054 7,297,075
0 0 0 0 0 0
0 0 0 0 0 0
604,207 134,970 201,143 (940,320) 0 (0)
960,011 214,452 319,591 0 (1,494,054) (0)
1,275,893 285,015 (1,560,908) 0 0 0
1,332,413 (1,332,413) 0 0 0 0
24,600 0 0 0 0 24,600
0 0 0 0 0 0
7,321,675 0 (0) 0 0 7,321,675
SCHEDULE B
INSTRUCTIONAL COSTS ANALYSIS
Total
Appropriated
Instructional
Expenditures
Calculated
Estimated
Full Cost Of
Instruction
Academic Year
Equivalent
ETE
Students
Calculated
Appropriated
FTE Student/
Faculty Ratio
Appropriated
Direct Cost Of
Instruction
Per FTE
Student
Appropriated
Full Cost Of
Instruction
Per FTE
Student
(1) (2) (3) (4) (5) (6)
834,227 1,623,698 322 18.0 2,594 5,050
2,132,210 5,304,117 1,292 26.4 1,650 4,106
0 0 0 0.0 0 0
0 0 0 0.0 0 0
0 0 0 0.0 0 0
2,966,437 6,927,816 1,613 24.2 1,839 4,294
158,114 369,259
3,124,551 7,297,075
Vi 2
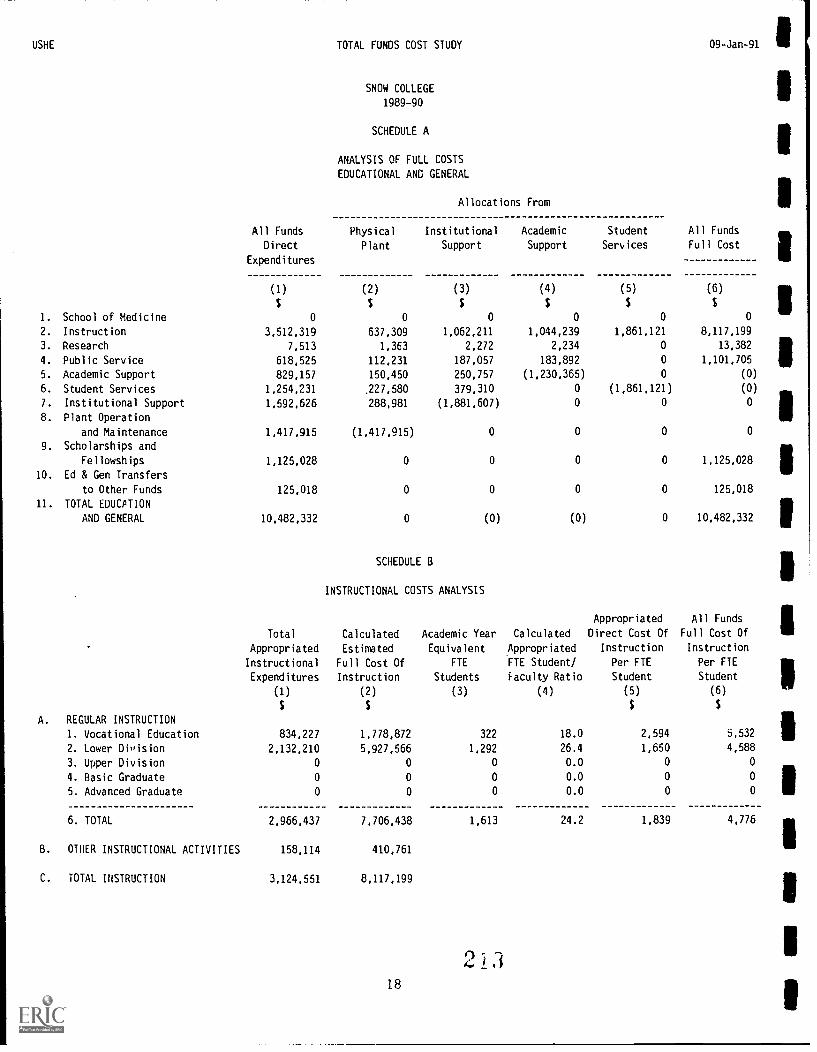
USHE TOTAL FUNDS COST STUDY 09-Jan-91
SNOW COLLEGE
1989-90
SCHEDULE A
ANALYSIS OF FULL COSTS
EDUCATIONAL ANC GENERAL
Allocations From
All Funds
Direct
Expenditures
(1)
$
Physical
Plant
(2)
$
Institutional
Support
(3)
$
Academic
Support
(4)
$
Student
Services
(5)
$
All Funds
Full Cost
(6)
$
1. School of Medicine 0 0 0 0 0 0
2. Instruction 3,512,319 637,309 1,062,211 1,044,239 1,861,121 8,117,199
3. Research 7,513 1,363 2,272 2,234 0 13,382
4. Public Service 618,525 112,231 187,057 183,892 0 1,101,705
5. Academic Support 829,157 150,450 250,757 (1,230,365) 0 (0)
6. Student Services 1,254,231 .227,580 379,310 0 (1,861,121) (0)
7. Institutional Support 1,592,626 288,981 (1,881,607) 0 0 0
8. Plant Operation
and Maintenance 1,417,915 (1,417,915) 0 0 0 0
9. Scholarships and
Fellowships 1,125,028 0 0 0 0 1,125,028
10. Ed & Gen Transfers
to Other Funds 125,018 0 0 0 0 125,018
11. TOTAL EDUCATION
AND GENERAL 10,482,332 0 (0) (0) 0 10,482,332
SCHEDULE 13
INSTRUCTIONAL COSTS ANALYSIS
Appropriated All Funds
Total Calculated Academic Year Calculated Direct Cost Of Full Cost Of
Appropriated Estimated Equivalent Appropriated Instruction Instruction
Instructional Full Cost Of FIE FTE Student/ Per FIE Per FTE
Expenditures Instruction Students Faculty Ratio Student Student
A. REGULAR INSTRUCTION
(1) (2) (3) (4) (5) (6)
1. Vocational Education 834,227 1,778,872 322 18.0 2,594 5,532
2. Lower Division 2,132,210 5,927,566 1,292 26.4 1,650 4,588
3. Upper Division 0 0 0 0.0 0 0
4. Basic Graduate 0 0 0 0.0 0 0
5. Advanced Graduate 0 0 0 0.0 0 0
6. TOTAL 2,966,437 7,706,438 1,613 24.2 1,839 4,776
B. OTHER INSTRUCTIONAL ACTIVITIES 158,114 410,761
C. TOTAL INSTRUCTION 3,124,551 8,117,199
2 318

IIIUSHE APPROPRIATED FUNDS COST STUDY 09-Jan-91
IDIXIE COLLEGE
1989-90
ISCHEDULE A
ANALYSIS OF FULL COSTS
EDUCATIONAL AND GENERAL
IAllocations From
I
1111. School of Medicine
2. InstructionI 3. Research
4. Public Service
5. Academic Support
6. Student Services
i7. Institutional Support
8. Plant Operation
and Maintenance
9. Scholarships and
Fellowships
10. Ed & Gen Transfers
to Other Funds
11. TOTAL EDUCATION
AND GENERAL
Appropriated
Direct
Expenditures
(1)
$
Physical
Plant
(2)
$
Institutional
Support
(3)
$
Academic
Support
(4)
$
Student
Services
(5)
$
Appropriated
Full Cost
(6)
$
0 0 0 0 0 0
3,743,796 743,174 972,148 950,020 1,975,808 8,384,947
0 0 0 0 0 0
131,687 26,141 34,195 33,417 0 225,440
674,429 133,880 175,128 (983,437) 0 0
1,354,985 268,976 351,848 0 (1,975,808) (0)
1,279,357 253,963 (1,533,320) 0 0 (0)
1,426,133 (1,426,133) 0 0 0 0
15,100 0 0 0 0 15,100
58,462 0 0 0 0 58,462
8,683,949 0 0 (0) 0 8,683,949
Reconciliation to Summary of Current Funds Revenues, Expenditures and Transfers:
11/
$37,413 for Telephone and Postage moved from Institutional Support to Instruction.
II
A. REGULAR INSTRUCTIOHN
1. Vocational Education
I2. Lower Division
3. Upper Division
4. Basic Graduate
I 5. Advanced Graduate
6. TOTAL
IB. OTHER INSTRUCTIONAL ACTIVITIES
C. TOTAL INSTRUCTION
SCHEDULE 8
Total
INSTRUCTIONAL COSTS ANALYSIS"
C:lttatteedd Academic Year Calculated
Appropriated Appropriated
Direct Cost Of Full Cost Of
Appropriated E Equivalent Appropriated Instruction Instruction
Instructional Full Cost Of FTE FTE Student/ Per FTE Per FTE
Expenditures Instruction Students Faculty Ratio Student Student
(1)
$
1,216,891
2,430,731
0
0
0
3,647,622
96,174
3,743,796
(2)
$
2,356,240
5,813,308
0
0
0
8,169,548
215,400
8,384,947
(3)
502
1,490
0
0
0
1,992
(4)
18.5
26.7
0.0
0.0
0.0
24.0
(5)
$
2,425
1,631
0
0
0
1,831
(6)
$
4,695
3,902
0
0
0
4,102
0

USHE TOTAL FUNDS COST STUDY 09-Jan-91
DIXIE COLLEGE
1989-90
SCHEDULE A
ANALYSIS OF FULL COSTS
EDUCATIONAL AND GENERAL
Allocations From
All Funds
Direct
Expenditures
(1)
$
Physical
Plant
(2)
$
Institutional
Support
(3)
$
Academic
Support
(4)
$
Student
Services
(5)
$
1. School of Medicine 0 0 0 0 0
2. Instruction 4.525,696 756,082 956,315 1,018,350 1,949,338
3. Research 0 0 0 0 0
4. Public Service 549,246 91,759 116,060 123,589 0
5. Academic Support 828,469 138,408 175,062 (1,141,939) 0
6. Student Services 1.414,232 236,268 298,838 0 (1,949,338)
7. Institutional Support 1,324,927 221,348 (1,546,275) 0 0
8. Plant Operation
and Maintenance 1,443,865 (1,443,865) o 0 0
9. Scholarships and
Fellowships 2,012,264 0 o 0 0
10. Ed & Gen Transfers
to Other Funds (66,979) 0 o 0 0
11. TOTAL EDUCATION
AND GENERAL 12,031,720 0 o (0) 0
Reconciliation to Summary of Current Funds Revenues, Expenditures and Transfers:
$37,413 for Telephone and Postage moved from Institutional Support to Instruction.
Total
Appropriated
Instructional
Expenditures
SCHEDULE B
INSTRUCTIONAL COSTS ANALYSIS
Calculated
Estimated
Full Cost Of
Instruction
Academic Year
Equivalent
FTE
Students
Calculated
Appropriated
FTE Student/
Faculty Ratio
Appropriated
Direct Cost Of
Instruction
Per FTE
Student
IIII
All Funds
Full Cost 1
(6)
$
0
9,205,781
0
880.654
0
0
(0)
0
2,012,264
(66,979)
12,031,720
All Funds
Full Cost Of
Instruction
Per FTE
Student
A. REGULAR INSTRUCTIOHN
(1)
$
(2)
$
(3) (4) (5) (6)
$ $
1. Vocational Education 1,216,891 2,557,745 502 18.5 2,425
2. Lower bivision 2,430,731 6,411,551 1,490 26.7 1,631
3. Upper Division 0 0 0 0.0 0
4. Basic Graduate 0 0 0 0.0 0
5. Advanced Graduate 0 0 0 0.0 0
6. TOTAL 3,647,622 8,969,295 1,992 24.0 1,831
8. OTHER INSTRUCTIONAL ACTIVITIES 96,174 236,486
C. TOTAL INSTRUCTION 3,743,796 9,205,781
2 i 520
5,097
4,303
0
0
0
4,503
IIIIIIIIIIIIII

IIIUSHE APPROPRIATED FUNDS COST STUDY 09-Jan-91
1. School of Medicine
2. Instruction
3. Research
4. Public Service
5. Academic Support
6. Student Services
7. Institutional Support
8. Plant Operation
and Maintenance
9. Scholarships and
Fellowships
10. Ed & Gen Transfers
to Other Funds
11. TOTAL EDUCATION
AND GENERAL
1
I
8
IC.
COLLEGE OF EASTERN UTAH
1989-90
SCHEDULE A
ANALYSIS OF FULL COSTS
EDUCATIONAL AND GENERAL
Allocations From
Appropriated
Direct
Expenditures
(1)
S
Physical
Plant
(2)
$
Institutional
Support
(3)
$
Academic
Support
(4)
$
Student
Services
(5)
$
Appropriated
Full Cost
(6)
S
0 0 0 0 0 0
2,924,957 506,090 996,840 888,199 1,338,522 6,654.609
0 0 0 0 0 0
0 0 0 0 0 0
586,723 101,518 199,958 (888,199) 0 (0)
884,196 152,988 301,339 0 (1,338,522) (0)
1,277,157 220,980 (1,498,137) 0 0 0
981,576 (981,576) 0 0 0 0
147,919 0 0 0 0 147,919
101,686 0 0 0 0 101,686
6,904,214 0 (0) 0 0 6,904,214
SCHEDULE B
INSTRUCTIONAL COSTS ANALYSIS
Appropriated Appropriated
Total Calculated Academic Year Calculated Direct Cost Of Full Cost Of
Appropriated Estimated Equivalent Appropriated Instruction Instruction
Instructional Full Cost Of FTE FTE Student/ Per FTE Per FTE
Expenditures Instruction Students Faculty Ratio Student Student
REGULAR INSTRUCTION
1. Vocational Education
2. Lower Division
3. Upper Division
4. Basic Graduate
5. Advanced Graduate
6. TOTAL
OTHER INSTRUCTIONAL ACTIVITIES
TOTAL INSTRUCTION
(1)
$
(2)
$
(3) (4) (5)
$
(6)
$
1,388,615 2,847,748 562 17.0 2,472 5,0/0
1,504,452 3,734,308 858 23.4 1,753 4,350
0 0 0 0.0 0 0
0 0 0 0.0 0 0
0 0 0 0.0 0 0
2,893,067 6,582,056 1,420 20.4 2,037 4,635
31,890 72,553
2.924,957 6,654,609
2 1
2 i;

USHE TOTAL FUNDS COST STUDY
COLLEGE OF EASTERN UTAH
1989-90
SCHEDULE A
ANALYSIS OF FULL COSTS
EDUCATIONAL AND GENERAL
Allocations From
09 Jan 91
All Funds
Direct
Expenditures
(1)
$
Physical
Plant
(2)
$
Institutional
Support
(3)
$
Academic
Support
(4)
$
Student
Services
(5)
$
All Funds
Full Cost
(6)
$
1. School of Medicine 0 0 0 0 0 0
2. Instruction 3,858,195 519,604 1,090,376 873,772 2,081,670 8,423,617
3. Research 0 0 0 0 0 0
4. Public Service 40,705 5,482 11,504 9,219 0 66,909
5. Academic Support 623,014 83,905 176,072 (882,990) 0 (0)
6. Student Services 1,468,770 197,807 415,093 0 (2,081,670) 0
7. Institutional Support 1,492,096 200,949 (1,693,045) 0 0 0
8. Plant Operation
and Maintenance 1,007,746 (1,007,746) 0 0 0 0
9. Scholarships and
Fellowships 1,535,155 0 0 0 0 1,535,155
10. Ed & Gen Transfers
to Other Funds 125,578 0 0 0 0 125,578
11. TOTAL EDUCATION
AND GENERAL 10,151,259 0 (0) (0) 0 10,151,259
SCHEDULE 13
INSTRUCTIONAL COSTS ANALYSIS
Appropriated All Funds
Total Calculated Academic Year Calculated Direct Cost Of Full Cost Of
Appropriated Estimated Equivalent Appropriated Instruction Instruction
Instructional Full Cost Of FIE FTE Student/ Per FTE Per FTE
Expenditures Instruction Students Faculty Ratio Student Student
A. REGULAR INSTRUCTION
(1) (2) (3) (4) (5) (6)
1. Vocational Education 1,388,615 3,539,828 562 17.0 2,472 6,302
2. Lower Division 1,504,452 4,791,949 858 23.4 1,753 5,582
3. Upper Division 0 0 0.0
4. Basic Graduate 0 0 0.0
5. Advanced Graduate 0 0 0.0
6. TOTAL 2,893,067 8,331,776 1,420 20.4 2,037 5,867
B. OTHER INSTRUCTIONAL ACTIVITIES 31,890 91,840
C. TOTAL INSTRUCTION 2,924,957 8,423,617
2
2 2
7 7

1
USHE
1. School of Medicine
2. Instruction
3. Research
4. Public Service
5. Academic Support
6. Student Services
8. Institutional Support
9. Plant Operation
and Maintenance
10. Scholarships and
Fellowships
11. Ed & Gen Transfers
to Other Funds
12. TOTAL EDUCATION
AND GENERAL
IREGULAR INSTRUCTION
1. Vocational Education
2. Lower Division
3. Upper Division
4. Basic Graduate
5. Advanced Graduate
6. TOTAL
iB. OTHER INSTRUCTIONAL ACTIVITIES
TOTAL INSTRUCTION
IC.
APPROPRIATED FUNDS COST STUDY
UTAH VALLEY COMMUNITY COLLEGE
1989-90
SCHEDULE A
ANALYSIS OF FULL COSTS
EDUCATION AND GENERAL
Allocations From
09-Jan-91
Appropriated
Direct
Expenditures
(1)
$
Physical
Plant
(2)
$
Institutional
Support
(3)
$
Academic
Support
(4)
$
Student
Services
(5)
$
Appropriated
Full Cost
(6)
$
0 0 0 0 0 0
10,555,376 1,839,707 2,948,007 2,702,309 2,544,080 20,589,479
0 0 0 0 0 0
0 0 0 0 0 0
1,859,071 324,019 519,219 (2,702,309) 0 (0)
1,750,216 305,047 488,817 0 (2,544,080) (0)
3,368,878 587,165 (3,956,043) 0 0 (0)
3,055,938 (3,055,938) 0 0 0 0
0 0 0 0 0 0
0 0 0 0 0 0
4%589,479 0 (0) 0 0 20,589,479
SCHEDULE 13
INSTRUCTIONAL COSTS ANALYSIS
Appropriated Appropriated
Total Calculated Academic Year Calculated Direct Cost Of Full Cost Of
Appropriated Estimated Equivalent Appropriated Instruction Instruction
Instructional Full Cost Of FTE FTE Student/ Per FTE Per FTE
Expenditures Instruction Students Faculty Ratio Student Student
(1) (2) (3) (4) (5) (6)
6,203,488 9,748,251 2,174 16.4 2,853 4,483
3,834,896 9,832,776 3,679 34.8 1,042 2,672
0 0 0 0.0 0 0
0 0 0 0.0 0 0
0 0 0 0.0 0 0
10,038,384 19,581,026 5,854 24.6 1,715 3,345
516,992 1,008,453
10,555,376 20,589,479
2 3
2 3

1.
2.
3.
4.
5.
6.
8.
9.
10.
11.
12.
A.
B.
C.
TOTAL FUNDS COST STUDY 09-Jan-91 I
UTAH VALLEY COMMUNITY COLLEGE
1989-90
SCHEDULE A
ANALYSIS OF FULL COSTS
EDUCATION AND GENERAL
Allocations From
All Funds
Direct
Expenditures
(1)
$
Physical
Plant
(2)
$
Institutional
Support
(3)
$
Academic
Support
(4)
$
Student
Services
(5)
$
All Funds
Full Cost
(6)
$
School of Medicine 0 0 0 0 0 0
Instruction 11,157,510 1,594,563 3,444,391 4,706,669 3,535,878 24,439,011
Research 0 0 0 0 0 0
Public Service 0 0 0 0 0 0
Academic Support 3,242,356 463,378 1,000,935 (4,706,669) 0 0
Student Services 2,435,815 348,112 751,951 0 (3,535,878) 0
Institutional Support 4,547,392 649,885 (5,197,277) 0 0 (0)
Plant Operation
and Maintenance 3,055,938 (3,055,938) 0 0 0 0
Scholarships and
Fellowships 4,262,500 0 0 0 0 4,262,500
Ed & Gen Transfers
to Other Funds 188,549 0 0 0 0 188,549
TOTAL EDUCATION
AND GENERAL 28,890,060 0 (0) 0 0 28,890,060
Total
Appropriated
Instructional
Expenditures
SCHEDULE B
INSTRUCTIONAL COSTS ANALYSIS
Calculated
Estimated
Full Cost Of
Instruction
Academic Year
Equivalent
FTE
Students
Calculated
Appropriated
FTE Student/
Faculty Ratio
Appropriated
Direct Cost Of
Instruction
Per FTE
Student
All Funds
Full Cost Of
Instruction
Per FTE
Student
REGULAR INSTRUCTION
(1) (2) (3) (4) (5) (6)
1. Vocational Education 6,203,488 11,108,181 2,174 16.4 2,853 5,108
2. Lower Division 3,834,896 12,133,832 3,679 34.8 1,042 3,298
3. Upper Division 0 0 0 0.0 0 0
4. Basic Graduate 0 0 0 0.0 0 0
5. Advanced Graduate 0 0 0 0.0 0 0
6. TOTAL 10,038,384 23,242,012 5,854 24.6 1,715 3,970
OTHER INSTRUCTIONAL ACTIVITIES 516,992 1,196,999
TOTAL INSTRUCTION 10,555,376 24,439,011
2:1,;(:)
24
1
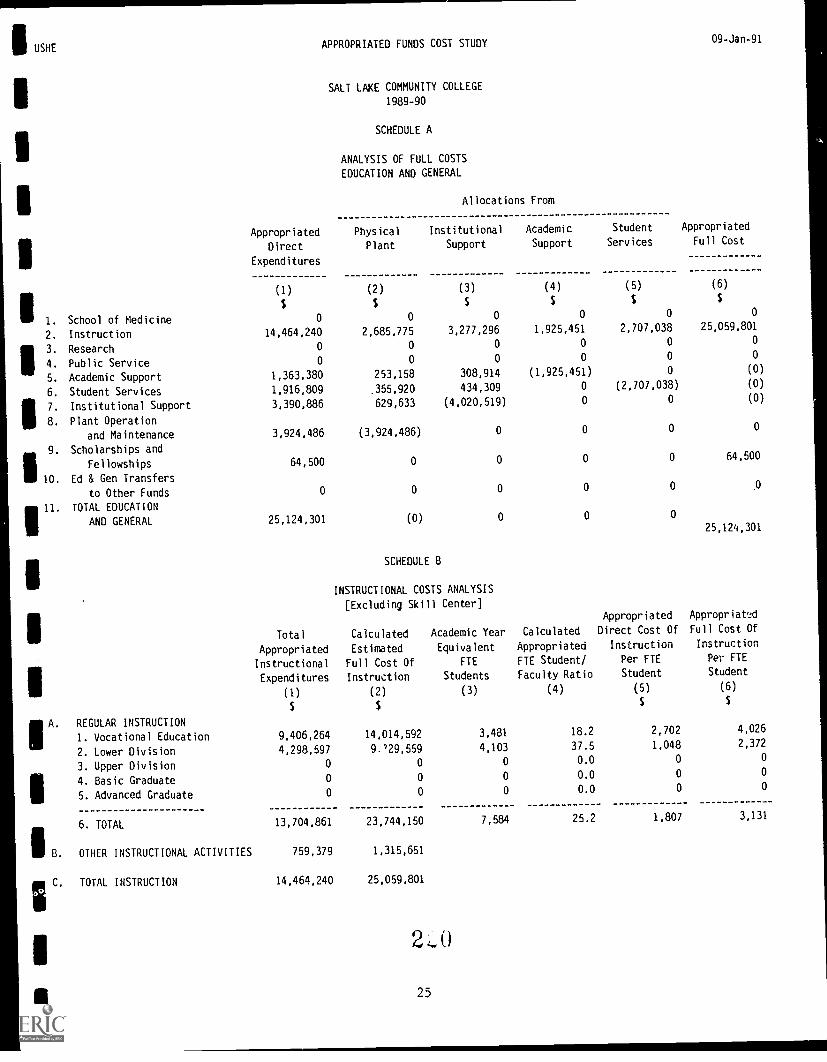
USHE APPROPRIATED FUNDS COST STUDY 09-Jan-91
1.
2.
3.
4.
5.
6.
7.
8.
9.
10.
11.
SALT LAKE COMMUNITY COLLEGE
1989-90
SCHEDULE A
ANALYSIS OF FULL COSTS
EDUCATION AND GENERAL
Allocations From
Appropriated
Direct
Expenditures
(I)
$
Physical
Plant
(2)
$
Institutional
Support
(3)
$
Academic
Support
(4)
$
Student
Services
(5)
$
Appropriated
Full Cost
(5)
$
School of Medicine 0 0 0 0 0 0
Instruction 14,464,240 2,685,775 3,277,296 1,925,451 2,707,038 25,059,801
Research 0 0 0 0 0 0
Public Service 0 0 0 0 0 0
Academic Support 1,363,380 253,158 308,914 (1,925,451) 0 (0)
Student Services 1,916,809 .355,920 434,309 0 (2,707,038) (0)
Institutional Support 3,390,886 629,633 (4,020,519) 0 0 (0)
Plant Operation
and Maintenance 3,924,486 (3,924,486) 0 0 0 0
Scholarships and
Fellowships 64,500 0 0 0 0 64,500
Ed & Gen Transfers
to Other Funds 0 0 0 0 0 0
TOTAL EDUCATION
AND GENERAL 25,124,301 (0) 0 0 0
25,124,301
SCHEDULE B
INSTRUCTIONAL COSTS ANALYSIS
[Excluding Skill Center]
REGULAR INSTRUCTION
Total
Appropriated
Instructional
Expenditures
(1)
$
Calculated
Estimated
Full Cost Of
Instruction
(2)
$
Academic Year
Equivalent
FTE
Students
(3)
Calculated
Appropriated
FTE Student/
Faculty Ratio
(4)
Appropriated
Direct Cost Of
Instruction
Per FTE
Student
(5)
$
Appropriatexi
Full Cost Of
Instruction
Per FTE
Student
(6)
$
1. Vocational Education 9,406,264 14,014,592 3,481 18.2 2,702 4,026
2. Lower Division 4,298,597 9.29,559 4,103 37.5 1,048 2,372
3. Upper Division 0 0 0 0.0 0 0
4. Basic Graduate 0 0 0 0.0 0 0
5. Advanced Graduate 0 0 0 0.0 0 0
6. TOTAL 13,704,861 23,744,150 7,584 25.2 1,807 3,131
OTHER INSTRUCTIONAL ACTIVITIES 759,379 1,315,651
TOTAL INSTRUCTION 14,464,240 25,059,801
2
25

USHE TOTAL FUNDS COST STUDY 09-Jan-91
SALT LAKE COMMUNITY COLLEGE
1989-90
SCHEDULE A
ANALYSIS OF FULL COSTS
EDUCATION AND GENERAL
Allocations From
All Funds Physical Institutional Academic Student All FundsDirect Plant Support Support Services Full Cost
Expenditures
(1) (2) (3) (4) (5) (6)$ $ $ $ $ $
1. School of Medicine 0 0 0 0 0 02. Instruction 14,637,254 2,281,682 3,047,523 1,883,556 7,250,501 29,100,5163. Research 0 0 0 0 0 04. Public Service 0 0 0 0 0 05. Academic Support 1,380,820 215,245 c87,491 (1,883,556) 0 (0)6. Student Services 5,315,285 828,556 1,106,659 0 (7,250,501) (0)7. Institutional Support 3,842,671 599,003 (4,441,674) 0 0 (0)8. Plant Operation
and Maintenance 3,924,486 (3,924,486) 0 0 0 09. Scholarships and
Fellowships 5,333,738 0 0 0 0 5,333,73810. Ed & Gen Transfers
to Other Funds 279,761 0 0 0 0 279,76111. TOTAL EDUCATION
AND GENERAL 34,714,015 0 (0) (0) 0
34,714,015
SCHEDULE B
INSTRUCTIONAL COSTS ANALYSIS
[Excluding Skill Center]
Appropriated All FundsTotal Calculated Academic Year Calculated Direct Cost Of Full Cost Of
Appropriated Estimated Equivalent Appropriated Instruction InstructionInstructional Full Cost Of FTE FTE Student/ Per FTE Per FTEExpenditures Instruction Students Faculty Ratio Student Student
(1) (2) (3) (4) (5) (6)
$ $ $ $A. REGULAR INSTRUCTION
I. Vocational Education 9,406,264 15,772,020 3;481 18.2 2,702 4,5312. Lower Division 4,298,597 11,800,706 4,103 37.5 1,048 2,8763. Upper Division 0 0 0 0.0 0 04. Basic Graduate 0 0 0 0.0 0 05. Advanced Graduate 0 0 0 0.0 0 0
6. TOTAL 13,704,861 27,572,726 7,584 25.2 1,807 3,636
B. OTHER INSTRUCTIONAL ACTIVITIES 759,379 1,527,790
C. TOTAL INSTRUCTION 14.464,240 29,100,516
26
1

TAB ISTAFFING
TABLE 1 USHE Education and General Salaried Personnel 1
TABLE 2 USHE Summary of Faculty Positions and Average Faculty SalaryEducation and General 1988-89, 1989-90, and 1990-91 3
TABLE 3 USHE Faculty Salaries in Current and 1990 DollarsEducation and General 5
TABLE 4 USHE Total Benefits as a Percentage of TotalSalaries and Wages 6
2 `r.. 2

TABLE 1Utah System of Higher Education
Education and General Salaried Personnelfor 1983-84 through 1990-91
Page 1 of 2
Full-Time-Equivalent (FTE) Positions
1983-84 1984-85 1985-86
FTE % of Total FTE % of Total FTE % of Total
University of Utah
1986-87FTE % of Total
Regular Faculty 965.08 32.17% 937.60 33.41% 929.96 31.96% 937.97 33.09%
Wage Rated 134.57 4.49% 186.29 6.64% 179.82 6.18% 147.67 5.21%
Teaching Assistants 312.52 10.42% 222.56 7.93% 293.76 10.09% 237.92 8.39%
Executive 88.46 2.95% 90.77 3.23% 87.33 3.00% 94.39 3.33%
Staff 1,499.34 49.98% 1,368.87 48.78% 1,419.16 48.77% 1,416.76 49.98%
Total 2,999.97 100.00% 2,806.09 100.00% 2,910.03 100.00% 2,834.71 100.00%
Utah State University*Regular Faculty 513.98 40.28% 519.05 39.83% 526.50 39.31% 505.53 37.71%
Wage Rated 16.58 1.30% 19.18 1.47% 25.27 1.89% 44.21 3.30%
Teaching Assistants 23.23 1.82% 30.45 2.34% 21.30 1.59% 18.85 1.41%
Executive 47.66 3.74% 47.87 3.67% 48.29 3.61% 49.65 3.70%
Staff 674.56 52.86% 686.52 52.68% 718.04 53.61% 722.43 53.89%
Total 1,276.01 100.00% 1,303.07 100.00% 1,339.40 100.00% 1,340.67 100.00%
Weber State UniversityRegular Faculty 345.46 40.86% 357.48 41.40% 356.03 41.25% 337.40 39.56%
Wage Rated 80.00 9.46% 50.88 5.89% 37.03 4.29% 49.40 5.79%
Executive 51.49 6.09% 59.13 6.85% 61.14 7.08% 61.00 7.15%
Staff 368.44 43.58% 395.94 45.86% 408.92 47.384 405.10 47.50%
Total 845.39 100.00% 863.43 100.00% 863.12 100.00% 852.90 100.00%
Southern Utah UniversityRegular Faculty 118.12 50.47% 125.42 50.98% 124.63 49.384 123.92 46.82%
Wage Rated 0.00 0.00% 0.00 0.00% 0.00 0.00% 0.00 0.00%
Executive 16.49 7.05% 17.88 7.274 17.61 6.98% 18.19 6.87%
Staff 99.41 42.48% 102.72 41.75% 110.13 43.64% 122.56 46.31%
Total 234.02 100.00% 246.02 100.00% 252.37 100.00% 264.67 100.00%
Snow CollegeRegular Faculty 58.00 49.01% 60.76 50.01% 62.01 47.89% 61.01 47.06%
Wage Rated 0.00 0.00% 0.00 0.00% 0.00 0.00% 0.00 0.00%
Executive 8.13 6.87% 8.11 6.67% 8.11 6.26% 8.11 6..26%
Staff 52.21 44.12% 52.63 43.32% 59.36 45.84% 60.52 46.68%
Total 118.34 100.00% 121.50 100.00% 129.48 100.00% 129.64 100.00%
Dixie CollegeRegular Faculty 66.42 45.44% 61.83 39.16% 63.61 38.20% 67.19 38.91%
Wage Rated 6.31 4.32% 10.39 6.58% 11.92 7.16% 11.89 6.89%
Executive 18.49 12.65% 10.18 6.45% 11.11 6.67% 10.73 6.21%
Staff 54.96 37.60% 75.49 47.81% 79.89 47.97% 82.86 47.99%
Total 146.18 100.00% 157.89 100.00% 166.53 100.00% 172.67 100.00%
College of Eastern UtahRegular Faculty 43.45 42.81% 43.83 39.37% 46.09 39.54% 46.95 40.02%
Wage Rated 7.17 7.06% 11.00 9.88% 7.23 6.20% 8.49 7.24%
Executive 6.28 6.19% 7.40 6.65% 6.71 5.76% 7.47 6.37%
Staff 44.59 43.94% 49.11 44.11% 56.54 48.50% 54.40 46.37%
Total 101.49 100.00% 111.34 100.00% 116.57 100.00% 117.31 100.00%
Utah Valley Comm. CollegeRegular Faculty 165.00 44.00% 171.00 42.75% 179.00 43.98% 175.40 42.77%
Wage Rated 70.00 18.67% 74.00 18.50% 60.00 14.74% 57.50 14.02%
Executive 16.00 4.27% 20.00 5.00% 23.00 5.65% 23.00 5.61%
Staff 124.00 33.07% 135.00 33.75% 145.00 35.63% 154.20 37.60%
Total 375.00 100.00% 400.00 100.00% 407.00 100.00% 410.10 100.00%
Salt Lake Comm. CollegeRegular Faculty 167.16 44.90% 177.60 44.36% 179.71 41.89% 176.90 39.95%
Wage Rated 57.19 15.36% 57.28 14.31% 66.55 15.51% 71.24 16.09%
Executive 16.00 4.30% 16.00 4.00% 16.00 3.73% 16.00 3.61%
Staff 131.98 35.45% 149.45 37.33% 166.75 38.87% 178.62 40.34%
Total 372.33 100.00% 400.33 100.00% 429.01 100.00% 442.76 100.00%
Nine Institution Total
Regular Faculty 2,442.67 37.76% 2,454.57 38.29% 2,467.54 37.31% 2,432.27 37.05%
Wage Rated 371.82 5.754 409.02 6.38% 387.82 5.86% 390.40 5.95%
Teaching Assistants 335.75 5.19% 253.01 3.95% 315.06 4.76% 256.77 3.91%
Executive Staff 269.00 4.16% 277.34 4.33% 279.30 4.22% 288.54 4.39%
Staff 3,049.49 47.14% 3,015.73 47.05% 3,163.79 47.84% 3,197.45 48.70%
Total 6,468.73 100.00% 6,409.67 100.00% 6,613.51 100.00% 6,565.43 100.00%
* Cooperative Masters with SUU included in USU figures for 1985 and thereafter
c:;? 1

TABLE 1 (Cont.)Utah System of Higher Education
Education and General Salaried Personnelfor 1983-84 through 1990-91
1
Page 2 of 2
University of Utah
1987-88FTE of Total
Full-Time-Equivalent (FTE) Positions
1988-89 1989-90FTE % of Total FTE % of Total
1990-91 BudgetFTE % of Total
Regular Faculty 913.03 33.10% 868.78 32.07% 869.94 32.17% 958.91 34.22%
Wage Rated 153.20 5.55% 146.72 5.42% 144.38 5.34% 139.80 4.99%
Teaching Assistants 220.71 8.00% 220.54 8.14% 221.01 8.17% 219.20 7.82%
Executive 91.51 3.32% 91.00 3.36% 88.25 3.26% 88.70 3.17%
Staff 1,380.19 50.03% 1,382.00 51.01% 1,380.58 51.05% 1,395.20 49.80%
Total 2,758.64 100.00% 2,709.04 100.00% 2,704.16 100.00% 2,801.81 100.00%
Utah State University*Regular Faculty 493.10 36.75% 502.98 37.90% 489.12 37.45% 531.23 37.69%
Wage Rated 41.74 3.11% 35.77 2.70% 34.66 2.65% 44.17 3.13%
Teaching Assistants 38.73 2.89% 29.05 2.19% 26.88 2.06% 28.80 2.04%
Executive 51.17 3.81% 51.05 3.85% 51.46 3.94% 53.46 3.79%
Staff 717.02 53.44% 708.38 53.37% 703.99 53.90% 751.81 53.34%
Total 1,341.76 100.00% 1,327.23 100.00% 1,306.11 100.00% 1,409.47 100.00%
Weber State UniversityRegular Faculty 359.10 42.67% 360.50 42.44% 377.20 42.59% 401.10 40.77%
Wage Rated 50.10 5.95% 54.60 6.43% 54.80 6.19% 65.30 6.60Executive 50.00 5.94% 46.70 5.50% 48.00 5.42% 52.90 5.38%
Staff 382.40 45.44% 387.60 45.63% 405.70 45.81% 464.60 47.22%
Total 841.60 100.00% 849.40 100.00% 885.70 100.00% 983.90 100.00%
Southern Utah UniversityRegular Faculty 113.00 42.98% 115.37 41.95% 118.77 39.73% 127.97 39.21%
Wage Rated 12.40 4.72% 15.15 5.51% 26.48 8.86% 23.40 7.17%
Executive 18.30 6.96% 18.60 6.76% 18.20 6.09% 19.90 6.10%
Staff 119.20 45.34% 125.90 45.78% 135.50 45.33% 155.10 47.52%
Total 262.90 100.00% 275.02 100.00% 298.95 100.00% 326.37 100.00%
Snow CollegeRegular Faculty 55.56 42.90% 57.60 43.02% 58.00 40.85% 64.80 40.26%
Wage Rated 6.98 5.39% 7.00 5.23% 8.80 6.20% 6.95 4.32%
Executive 8.11 6.26% 8.10 6.05% 7.60 5.35% 8.40 5.22%
Staff 58.85 45.44% 61.20 45.71% 67.60 47.61% 80.80 50.20%
Total 129.50 100.00% 133.90 100.00% 142.00 100.00% 160.95 100.00%
Dixie CollegeRegular Faculty 63.15 37.77% 67.34 38.39% 68.48 37.61% 71.10 37.52%
Wage Rated 15.89 9.50% 15.17 8.65% 17.46 9.59% 18.10 9.55%
Executive 10.03 6.00% 10.13 5.77% 10.13 5.56% 10.50 5.54%
Staff 78.12 46.73% 82.79 47.19% 86.00 47.23% 89.80 47.39%
Total 167.19 100.00% 175.43 100.00% 182.07 100.00% 189.50 100.00%
College of Eastern UtahRegular Faculty 47.73 43.96% 44.96 41.69% 52.70 44.55% 54.60 40.63%
Wage Rated 6.00 5.53% 5.58 5.17% 8.10 6.85% 11.20 8.33%
Executive 7.34 6.76% 7.20 6.68% 6.70 5.66% 6.60 4.91%
Staff 47.50 43.75% 50.10 46.46% 50.80 42.94% 62.00 46.13%
Total 108.57 100.00% 107.84 100.00% 118.30 100.00% 134.40 100.00%
Utah Valley Comm. CollegeRegular Faculty 163.10 39.81% 161.80 39.01% 166.16 36.20% 184.30 35.72%
Wage Rated 59.80 14.60% 63.80 15.38% 80.80 17.60% 94.10 18.24%
Executive 21.50 5.25% 21.70 5.23% 23.20 5.05% 12.80 2.48%
Staff 165.30 40.35% 167.50 40.38% 188.90 41.15% 224.80 43.57%
Total 409.70 100.00% 414.80 100.00% 459.06 100.00% 516.00 100.00%
Salt Lake Comm. CollegeRegular Faculty 171.58 39.86% 173.20 36.46% 188.80 36.31% 241.70 39.49%
Wage Rated 80.35 18.67% 99.80 21.01% 113.30 21.79% 99.60 lu.27%
Executive 16.00 3.72% 16.30 3.43% 15.00 2.89% 15.00 2.45%
Staff 162.52 37.76% 185.70 39.09% 202.80 39.01% 255.80 41.79%
Total 430.45 100.00% 475.00 100.00% 519.90 100.00% 612.10 100.00%
Nine Institution Total
Regular Faculty 2,379.35 36.89% 2,352.53 36.37% 2,389.17 36.11% 2,635.71 36.94%
Wage Rated 426.46 6.61% 443.59 6.86% 488.78 7.39% 502.62 7.04%
Teaching Assistants 259.44 4.02% 249.59 3.86% 247.89 3.75% 248.00 3.48%
Executive Staff 273.96 4.25% 270.78 4.19% 268.54 4.06% 268.26 3.76%
Staff 3,111.10 48.23% 3,151.17 48.72% 3,221.87 48.70% 3,479.91 48.78%
Total 6,450.31 100.00% 6,467.66 100.00% 6,616.25 100.00% 7,134.50 100.00%
* Cooperative Masters with SUU included in USU figures for 1985 and thereafter
2
224
BudgetChange
88.97-4.58-1.810.45
14.6297.65
42.119.511.922.0047.82103.36
23.9010.504.9058.9098.20
9.20-3.081.70
19.6027.42
6.80-1.850.80
13.2018.95
2.620.640.373.807.43
1.903.10
-0.1011.2016.10
18.1413.30-10.4035.9056.94
-13.7052.90 I
0.0053.0092.20
246.5413.840.11 I(0.28)
258.04518.25

TABLE 2
UTAH SYSTEM OF HIGHER EDUCATION
SUMMARY OF FACULTY POSITIONS AND AVERAGE FACULTY SALARY
EDUCATION AND GENERAL
1988-89, 1989-90, AND 1990-91
University of Utah
1988-89 Actual
Number % of Average
of FTE Total FTE
Faculty FTE Salary
1989-90 Actual
Number % of Average
of FTE Total FTE
Faculty FTE Salary
1990-91 Budgeted
Number % of Average
of FTE Total FTE
Faculty FTE Salary
Professors 372.69 30.15% 47,729 381.84 30.91% 50,160 397.83 30.19% 53,935
Associate Professors 255.53 20.67% 35,246 250.54 20.28% 37,121 253.13 19.21% 39,530
Assistant Professors 221.35 17.91% 30,102 205.42 16.63% 32,657 266.89 20.25% 33,445
Instructors & Lecturers 19.21 1.55% 21,015 32.14 2.60% 27,118 41.06 3.12% 27,143
Subtotal Regular Faculty 868.78 70.29% 38,976 869.94 70.42% 41,421 953.91 72.76% 43,283
Wage Rated Instructors 146.72 11.87% 23,345 144.38 11.69% 24,852 139.80 10.61% 25,964
Teaching Assistants 220.54 17.84% 11,976 221.01 17.89% 12,796 219.20 16.63% 13,052
Total Teaching Faculty 1236.04 100.00% 32,302 1235.33 100.00% 34,363 1317.91 100.00% 36,417
Utah State University
Professors 167.43 29.49% 40,950 161.36 29.30% 43,055 155.08 25.67% 45,917
Associate Professors 160.34 28.24% 32,580 149.64 27.17% 34.247 157.07 26.00% 36,748
Assistant Professors 117.45 20.69% 27,753 119.84 21.76% 29,410 163.88 27.12% 32,678
Instructors & Lecturers 57.76 10.17% 22,357 58.28 10.58% 23,062 55.20 9.14% 26,388
Subtotal Regular Faculty 502.98 88.58% 33,065 489.12 88.82% 34,635 531.23 87.92% 37,093
Wage Rated Instructors 35.77 6.30% 19,821 34.66 6.29% 20,769 44.17 7.31% 22,256
Teaching Assistants 29.05 5.12% 12,462 26.88 4.88% 12,873 28.80 4.77% 13,496
Total Teaching Faculty 567.80 100.00% 31,177 550.66 100.00% 32,700 604.20 100.00% 34,883
Weber State University
Professors 116.30 28.02% 40,678 121.30 28.08% 42,489 128.69 27.59% 44,633
Associate Professors 97.20 23.42% 32,136 94.10 21.78% 33,453 87.99 18.87% 36,312
Assistant Professors 98.80 23.80% 28,613 110.80 25.65% 30,312 143.58 30.78% 30,691
Instructors & Lecturers 48.20 11.61% 22,558 51.00 11.81% 23,515 40.84 8.76% 24,824
Subtotal Regular Faculty 360.50 86.85% 32,646 377.20 87.31% 34,093 401.10 86.00% 35,800
Wage Rated Instructors 54.60 13.15% 21,231 54.80 12.69% 22,322 65.30 14.00% 23,436
Total Teaching Faculty 415.10 100.00% 31,144 432.00 100.00% 32,600 466.40 100.00% 34,069
Southern Utah University
Professors 28.42 21.77% 34,357 26.32 18.12% 36,694 26.38 17.43% 38,119
Associate Professors 37.65 28.85% 28,595 41.85 28.81% 29,774 51.14 33.78% 30,612
Assistant Professors 35.42 27.14% 23,718 36.46 25.10% 25,005 38.97 25.74% 25,570
Instructors & Lecturers 13.88 10.63% 21,947 14.14 9.73% 24,033 11.48 7.58% 23,687
Subtotal Regular Faculty 115.37 88.39% 27,717 118.77 81.77% 29,160 127.97 84.54% 30,003
Wage Rated Instructors 15.15 11.61% 1;,490 26.48 18.23% 13,511 23.40 15.46% 14,596
Total Teaching Faculty 130.52 100.00% 26,066 145.25 100.00% 26,307 151.37 100.00% 27,621
Snow Collf.ge
Professors 11.70 18.11% 32,939 11.70 17.51% 34,522 9.70 13.52% 37,959
Associate Professors 12.40 19.20% 31,478 12.40 i8.56% 32,321 12.40 17.28% 34,992
Assistant Professors 16.50 25.54% 25,810 16.38 24.52% 25,950 20.38 28.40% 28,322
Instructors & Lecturers 17.00 26.32% 23,678 17.52 26.23% 25,702 22.32 31.11% 25,573
Subtotal Regular Faculty 57.60 89.16% 27,849 58.00 86.83% 28,966 64.80 90.31% 30,094
Wage Rated Instructors 7.00 10.84% 18,286 8.80 13.17% 19,209 6.95 9.69% 19,856
Total Teaching Faculty 64.60 100.00% 26,813 66.80 100.00% 27,681 71.75 100.00% 29,102
2 2 53

TABLE 2
UTAH SYSTEM OF HIGHER EDUCATION
SUMMARY OF FACULTY POSITIONS AND AVERAGE FACULTY SALARY
EDUCATION AND GENERAL
1988-89, 1989-90, AND 1990-91
Dixie College
Professors
Associate Professors
Assistant Professors
Instructors & Lecturers
1988-89 Actual
Number % of Average
of FTE Total FTE
Faculty FTE Salary
1989-90 Actual
Number % of Average
of FTE Total FTE
Faculty FTE Salary
1990-91 Budgeted
Number % of Average
of FTE Total FTE
Faculty FTE Salary
Subtotal Regular Faculty 67.34 81.61% 26,231 68.48 79.68% 28,175 71.10 79.71% 29,438
Wage Rated Instructors 15.17 18.39% 17,311 17.46 20.32% 18,585 18.10 20.29% 19,417
Total Teaching Faculty 82.51 100.00% 24,591 85.94 100.00% 26,227 89.20 100.00% 27,405
College of Eastern Utah
Professors
Associate Professors
Assistant Professors
Instructors & Lecturers
Subtotal Regular Faculty 44.96 88.96% 25,520 52.70 86.684 26,329 54.60 82.98% 28,259
Wage Rated Instructors 5.58 11.04% 16,780 8.10 13.32% 17,890 11.20 17.02% 18,033
Total Teaching Faculty 50.54 100.00% 24,555 60.80 100.00% 25,205 65.80 100.00% 26,519
Utah Valley Community College
Professors
Associate Professors
Assistant Professors
Instructors & Lecturers
Subtotal Regular Faculty 161.80 71.72% 27,706 166.16 67.28% 29,487 184.30 66.20% 30,050
Wage Rated Instructors 63.80 28.28% 18,284 80.80 32.72% 19,428 94.10 33.80% 19,209
Total Teaching Faculty 225.60 100.00% 25,043 246.96 100.00% 26,196 278.40 100.00% 26,598
Salt Lake Community College
Professors 39.00 14.29% 31,003 37.64 12.46% 32,141 45.20 13.24% 33,790
Associate Professors 42.90 15.71% 27,228 41.58 13.76% 29,215 53.20 15.59% 30,338
Assistant Professors 38.50 14.10% 24,677 49.10 16.25% 25,883 64.80 18.99% 27,022
Instructors & Lecturers 52.80 19.34% 24,570 60.48 20.02% 24,671 78.50 23.00% 24,558
Subtotal Regular Faculty 173.20 63.44% 26,700 188.80 62.50% 27,476 241.70 70.82% 28,217
Wage Rated Instructors 99.80 36.56% 17,344 113.30 37.50% 18,142 99.60 29.18% 19,151
Total Teaching Faculty 273.00 100.00% 23,280 302.10 100.00% 23.976 341.30 100.00% 25,571
2
4
1

TABLE 3
UTAH SYSTEM OF HIGHER EDUCATION
FACULTY SALARIES IN CONSTANT AND CURRENT DOLLARS
EDUCATION AND GENERAL
1969 Actual
Ave. FTE
Salary
Ave. FIE in 1990
Salary Dollars*
University of Utah
1978-79 Actual
Ave. FTE
Salary
Ave. FTE in 1990
Salary Dollars*
1988-89 Actual
Ave. FTE
Salary
Avg. FTE In 1990
Salary Dollars*
1989-90 Actual
Ave. FTE
Salary
Avg. FTE 11 1990
Salary Dollars*
1990-91 Budget
Avg. FTE
Salary
Professors 16,253 57,769 28,554 49,886 47,729 53,077 50,160 53,302 53,935
Assoc. Professors 12,840 45,638 21,199 37,036 35,246 39,194 37,121 39,447 39,530
Assist. Professors 11,065 39,329 17,518 30,605 30,102 33,474 32,657 34,703 33,445
Instructors & Lecturers 9,223 32,782 14,282 24,952 21,015 23,369 27,118 28,817 27,141
Weighted Average 13,450 47,806 22 522 39,522 38,976 43,342 41,421 44,016 43,282
Utah State University
Professors 14,732 52,363 25,068 43,795 40,950 45,538 43,055 45,752 45,917
Assoc. Professors 12,228 43,463 20,111 35,135 32,580 36,230 34,247 36,392 36,748
Assist. Professors 10,513 37,367 16,877 29,485 27,753 30,863 29,410 31,253 32,678
Instructors & Lecturers 8,078 28,712 12,980 22,677 22,357 24,862 23,062 24,507 26,388
Weighted Average 12,139 43,147 20,098 35,113 33,065 36,769 34,635 36,804 37,093
Weber State University
Professors 13,969 49,651 22,440 39,204 40,678 45,235 42,489 45,151 44,633
Assoc. Professors 11,468 40,762 18,805 32,854 32,136 35,736 33,453 35,549 36,312
Assist. Professors 9,166 32,579 16,383 28,622 28,613 31,818 30,312 32.211 30,691
Instructors & Lecturers 8,161 29,007 14,431 25,212 22,558 25,085 23,515 24,988 24.824
weighted Average 11,047 39,265 18,533 32,378 32,646 36,303 34,093 36,229 35,800
Southern Utah University
Professors 13,487 47,938 22,004 38,442 34,357 38,206 36,694 38,993 38,119
Assoc. Professors 11,032 39,212 17,521 30,610 28,595 31,798 29,774 31,639 30,612
Assist. Professors 8,748 31,094 14,864 25,968 23,718 26,375 25,005 26,572 25,570
Instructors & Lecturers 7,282 25,883 12,248 21,398 21,947 24,405 24,033 25,539 23,687
Weighted Average 10,241 36,400 16,769 29,297 27,717 30,822 29,160 30,987 30,003
Snow College
Professors 20,884 36,486 32,939 36,629 34,522 36,685 37,959
Assoc. Professors 18,355 32,067 31,478 35,004 32,321 34,346 34,992
Assist. Professors 15,397 26,900 25,810 28,702 25,950 27,576 28,322
Instructors & Lecturers 13,059 22,815 23,678 26,331 25,702 27,312 25,573
Weighted Average 9,233 32,818 15,657 27,354 27,849 30,969 28,966 30,781 30,094
Dixie College
Total Regular Faculty 9,417 33,472 16,005 27,962 26.231 29,169 28,175 29,940 29,438
College of Eastern Utah
Total Regular Faculty 9,565 33,998 15,929 27,829 25,520 28,379 26,329 27,978 28,259
Utah Valley Community College
Total Regular Faculty 8,807 31,303 15,400 26,905 27,706 30,810 29,487 31,334 30,050
Sait Lake Community College
Professors 31,003 34,476 32,141 34,154 33,790
Assoc. Professors 27,228 30,278 29,215 31,046 30,338
Assist. Professors 24,677 27,442 25,883 27,505 27,022
Instructors & Lecturers 24,570 27,322 24,671 26,217 24,558
Weighted Average 9,018 32,053 15,631 27,308 26,700 29,692 27,476 29,198 28,217
*Oecember CPI (1982-82-100) used to compute real dollars:
1969-37.7; 1979-76.7; 1988.120.5; 1989-126.1; 1990.134.0 (Est.)

Table 4
Utah System of Higher Education
Total Benefits as a Percentage of
Total Salaries and Wages
1978-79 1983-84 1984-85
University of Utah 18.96% 23.684 24.65%
Utah State University 20.58% 25.08% 24.63%
Weber State University 22.49% 28.31% 28.48%
Southern Utah University 23.90% 28.70% 27.98%
Snow College 23.61% 29.14% 31.38%
Dixie College 26.79% 28.93% 27.85%
College of Eastern Utah 22.63% 28.91% 28.18%
Utah Valley Comm. College 24.99% 27.85% 26.54%
Salt Lake Comm. College 23.14% 27.23% 28.25%
State Board of Regents 21.73% 26.48% 26.01%
Budget
1985-86 1986-87 1987-88 1988-89 1989-90 1990-91
24.48% 24.76% 25.53% 26.25% 26.76% 26.83%
25.55% 26.07% 25.96% 28.21% 29.54% 30.01%
29.17% 28.98% 29.61% 29.90% 30.83% 31.45%
27.99% 28.60% 29.66% 31.54% 32.58% 34.52%
30.67% 29.98% 31.02% 32.78% 35.06% 38.30%
27.81% 27.F?% 28.74% 31.63% 33.06% 34.53%
27.38% 26.62% 27.56% 30.32% 33.48% 35.23%
28.38% 27.37% 28.14% 30.25% 31.33% 34.90%
28.18% 29.98% 31.98% 30.10% 30.96% 35.02%
26.72% 26.13% 26.49% 27.35% 28.83% 29.73%
6

PART 1:
FIGURE 1
FIGURE 2
FIGURE 3
FIGURE 4
FIGURE 5
FIGURE 6
FIGURE 7
FIGURE 8
FIGURE 9
FIGURE 10
FIGURE 11
FIGURE 12
FIGURE 13
FIGURE 14
FIGURE 15
FIGURE 16
FIGURE 17
FIGURE 18
rSTAB J
ALARY & COMPENSATION
Comparative Recent History of Faculty Salaries and Compensationin Utah Public Higher Education
Figures 1 through 18 represent Dollar Compensation- All Ranks Combined
University of Utah Current 2
University of Utah Constant 2
Utah State University Current 3
Utah State University Constant 3
Weber State University Current 4
Weber State University Constant 4
Southern Utah University Current 5
Southern Utah University Constant 5
Snow College Current 6
Snow College Constant 6
Dixie College Current 7
Dixie College Constant 7
College of Eastern Utah Current 8
College of Eastern Utah Constant 8
Utah Valley Community College Current 9
Utah Valley Community College Constant 9
Salt Lake Community College Current 10
Salt Lake Community College Constant 10

TAB JSALARY & COMPENSATION
--Continued--
TABLE 1 Salaries 11
TABLE 2 Total Compensation 16
TABLE 3 Salaries in 1990 Constant Dollars 21
TABLE 4 Total Compensation in 1990 Constant Dollars 26
TABLE 5 Inflation 31
PART 2: 1990-91 Analysis of Faculty Salary and Compensation Comparability
TABLE I Percentage Salary Increase by Year 34
TABLE II Recent History of USHE Increases and Compensation Differentials 35
TABLE III Summary of Faculty Salaries and Compensation Comparability1996-91 36
TABLE 1 Analysis of Estimated Faculty Salary Comparability 1990-91 38
TABLE 2 Analysis of Estimated Faculty Compensation Comparability1990-91 43
TABLE 3 Calculation of Competitive Faculty Salary Adjustment 48
PART 3: 1990-91 Analysis of Classified Staff Salary and CompensationComparability
TABLE 1 Classified Salary Survey Results 1990-91 54
TABLE 2 Total Compensation Cost Analysis 55
FIGURES 1-9 Total Compensation by School 1986-87 to 1990-91 56
2,10

COMPARATIVE RECENT HISTORY OF FACULTY SALARIES AND COMPENSATION
IN UTAH PUBLIC HIGHER EDUCATION
Background
The analysis presented in the following graphs and tables outlines recent
historical relationships between average faculty salary and compensation data for
USHE institutions and for groups of schools similar to USHE institutions. The
purpose of this analysis is to provide a historical context and a wider breadth
of comparison for faculty salary and compensation data.
Explanation of Attachments
A ten-year history (which includes the current fiscal year) of average
faculty salary and compensation data for each USHE institution and for its
corresponding groups is included in Tables 1 and 2. These data are then adjusted
to reflect constant 1990 dollars in Tables 3 and 4.
The University of Utah and Utah State University are compared to three
groups:o Comparison (Peer) Institutionso All Research 1 Institutions (U of U's classification)
O A composite of Research 1 and 2 Institutions (USU's previousclassification was Research 2, but it presently meets criteria
for Research 1 status.)
Weber State University and Southern Utah University are also compared to
three groups:O Comparison (Peer) InstitutionsO All Comprehensive 1 Institutions (WSC's and SUSC's current
classification)O A composite of Comprehensive 1 and 2 Institutions
The five community colleges are compared to two groups:o Comparison (Peer) Institutionso Institutions Without Academic Ranks (almost all of which are
community colleges)
Figures 1 through 18 graph compensation (salary plus benefits) data for
each USHE institution. The top graph on eich page compares one USHE institution
to the above-mentioned groups on a current dollar basis. The bottom graph on
each page adjusts all data to constant dollar levels.
Trend Analysis
Trends in compensation increases, as shown on the graphs, indicate that
USHE institutions have not kept pace with similar groups of schools, particularly
since 1985-86. The constant dollar graphs show that some institutions have fared
better than others in regard to the inflation of the 1980's, but most have lost
ground since 1985-86. Some schools have gained ground in 1990-91, primarily
because of internal reallocation to faculty compensation.
c:\databk\facrev.txt
1

FIGURES 1 & 2
70
60
60
40
30
University of UtahCurr $ CompensationAll Ranks Combined
Current Dollars (Thousands)
2081-82 82-83 83-84 84-85 86-86 86-87 87-88 88-89 89-90
Year
70
60
60
40
30
Rsch 1 Rech 1&2 Peer Grp -9- Uof U
90-91
University of UtahCons $ Compensation--All Ranks Combined
Constant Dollars (Thousands)
2081-82 82-83 83-84 84-86 86-86 86-87 87-88 88-89 89-90 90-91
Year
Rsch 1 Rsch 1&2 Peer Grp 9 UofU
° 22 4,

1
JI
FIGURES 3 & 4
70
60
60
40
30
Utah State UniversityCurr Compensation--All Ranks Combined
Current Dollars (Thousands)
2081-82 82-83 83-84 84-86 86-86 86-87 87-88 88-89 89-90 90-91
Year
70
60
40
30
Rach 1 Rsch 1&2 Peer Grp 43-- USU
Utah State UniversityCons $ Compensation--All Ranks Combined
Constant Dollars (Thousands)
2081-82 82-83 83-84 84-86 86-86 86-87 87-88 88-89 89-90 90-91
Year
Rsch 1 Rsch 1&2 * Peer Grp USU
2:533

FIGURES 5 & 6
70
60
60
40
30
Weber State UniversityCurr $ Compensation--All Ranks Combined
Current Dollars (Thousands)
2081-82 82-83 83-84 84-86 86-86 86-87 87-88 88-89 89-90 90-91
Year
70
60
60
Inst-IIA -4- Inst-IIB -IC- Peer a WSU
Weber State UniversityCons $ Compensation--All Ranks Combined
Constant Dollars (Thousands)
30
2081-82 82-83 83-84 84-86 86-86 86-87 87-88 88-89 89-90 90-91
Year
Inst-IIA Inst-IIB Peer 14-- WSU
4 2 3 4 1

FIGURES 7 & 8
70
60
60
40
30
Southern Utah UniversityCurr $ CompensationAll Ranks Combined
Current Dollars (Thousands)
2081-82 82-83 83-84 84-86 86-86 86-87 87-88 88-89 89-90 90-91
Year
70
60
60
Inst-HA Inst-HS Peer -9- SUU
Southern Utah UniversityCons $ CompensationAll Ranks Combined
Constant Dollars (Thousands)
404"
30
2081-82 82-83 83-84 84-86 86-86 86-87 87-88 88-89 89-90 90-91
Year
Inst-IIA -4- Inst-HI3 * Peer 43-- SUU

FIGURES 9 & 10
70
60
50
40
Snow CollegeCurr $ Compensation--All Ranks Combined
Current Dollars (Thousands)
2082-83 83-84 84-86 85-86 86-87 87-88 88-89 89-90 90-91
Year
W/out Ranks Peer Snow
Snow CollegeCons $ CompensationAll Ranks Combined
Constant Dollars (Thousands)70
60
50
40,
30
2082-83 83-84 84-86 85-86 86-87 87-88 88-89 89-90 90-91
Year
W/out Ranks Peer Snow
6 23;-;

FIGURES 11 & 12
70
60
60
40
30
Dixie CollegeCurr $ CompensationAll Ranks Combined
Current Dollars (Thousands)
2082-83 83-84 84-85 86-86 86-87 87-88 88-89 89-90 90-91
Year
70
60
60
40
30
W/out Ranks -4- Peer 14 Dixie
Dixie CollegeCons $ Compensation--All Ranks Combined
Constant Dollars (Thousands)
2082-83 83-84 84-86 86-86 86-87 87-88 88-89 89-90 90-91
Year
W/out Ranks Peer Dixie
2377

FIGURES 13 & 14
70
College of Eastern UtahCurr $ Compensation--All Ranks Combined
Current Dollars (Thousands)
60
60
40
30A
2082-83 83-84 84-85 86-86 86-87 87-88 88-89 89-90 90-91
Year
70
60
60
40
30
2082-83 83-84 84-85 86-86 86-87 87-88 88-89 89-90 90-91
Year
W/out Ranks Peer 4-- CEU
College of Eastern UtahCons $ Compensation--All Ranks Combined
Constant Dollars (Thousands)
W/out Ranks Peer CEU
8

FIGURES 15 & 16
70
60
60
40
30
Utah Valley Community CollegeCurr $ Compensation--All Ranks Combined
Current Dollars (Thousands)
2082-83 83-84 84-86 86-86 86-87 87-88 88-89 89-90 90-91
Year
70
60
60
40
30
W/out Ranks Peer -4`-- UVCC
Utah Valley Community CollegeCons $ Compensation--All Ranks Combined
Constant Dollars (Thousands)
2082-83 83-84 84-86 86-86 86-87 87-88 88-89 89-90 90-91
Year
W/out Ranks Peer UVCC
2339

FIGURES 17 & 18
Salt Lake Community CollegeCurr $ Compensation--All Ranks Combined
Current Dollars (Thousands)70
60
60
40
30,p
2082-83 83-84 84-86 86-86 86-87 87-88 88-89 89-90 90-91
Year
, i
70
60
60
40
30
2082-83 83-84 84-86 86-86 86-87 87-88 88-89 89-90 90-91
Year
W/out Ranks -+- Peer --*- SLCC
Salt Lake Community CollegeCons $ Compensation--All Ranks Combined
Constant Dollars (Thousands)
__------+A---............"
4
44'................11,
W/out Ranks -4- Peer --*- SLCC
IiI1
II1
I1
iiI

90FacRev COMPARATIVE RECENT HISTORY OF FACULTY SALARIES AND COMPENSATION IN UTAH PUBLIC HIGHER EDUCATION
TABLE 1 -- SALARIES
21-Dec-90
Page 1-A
Estimated
1981-82
1. Research Univ--Carnegie Class 1 and 2
(I) All Ranks Combined $28,700
1982-83
$30,900
1983-84
$31,700
1984-85
$34,400
1985-86
$36,800
1986-87
$39,300
1987-88
$41,100
1988-89
$43,600
1989-90 1990-91
$46,200
(2) Professor $36,300 $38,700 $39,600 $42,900 $45,900 $48,800 $51,100 $54,300 $57,400
(3) Associate Professor $26,900 $28,700 $29,200 $31,600 $33,800 $36,000 $37,600 $40,000 $42,200
(4) Assistant Professor $21,900 $23,500 $24,200 $26,700 $28,700 $30,500 $31,900 $33,900 $35,800
(5) Instructor $17,100 $18,500 $18,900 $19,900 $21,700 $22,600 $24,300 $25,100 $26,300
2. Research Universities--Carnegie Class 1
(1) All Ranks Combined $29,400 $31,900 $32,800 $35,500 $38,200 $41,000 $42,800 $45,500 $47,900
(2) Professor $37,300 $39,900 $41,100 $44,400 $47,800 $51,000 $53,400 $56,700 $59,700
(3) Associate Professor $27,300 $29,200 $29,900 $32,200 $34,600 $37,100 $38,500 $41,000 $43,000
(4) Assistant Professor 522,300 $23,900 $24,900 $27,100 $29,300 $31,500 $32,800 $35,000 S36,700
(5) Instructor $17,400 $19,200 $19,500 $20,400 $22,000 $23,100 $24,600 $25,600 $26,700
3. University of Utah Peer Group 4' @
(1) All Ranks Combined $31,100 $32,400 $34,600 $37,000 $39,700 $42,600 $45,800 $48,100 $50,800 $53,700
(2) Professor $37,600 $40,500 $42,400 $45,400 $48,700 $52,300 $56,100 $59,100 $61,900 $65,500
(3) Associate Professor $27,600 $29,500 $30,600 $32,400 $34,600 $36,900 $39,400 $41,700 544,700 $47,200
(4) Assistant Professor $22,400 $23,800 $25,300 $27,100 $29,300 $31,400 $33,500 $35,600 $38,500 $40,700
(5) Instructor $18,100 $18,000 $19,100 $19,800 $21,400 $22,400 $23,600 $24,300 $28,600 $30,200
4. UNIVERSITY OF UTAH
(1) All Ranks Combined $29,000 $31,500 $31,600 $34,400 $36,500 $36,600 $38,500 $39,400 $42,000 $44,800
a. Diff from Res U 1+2 National Ave $300 $600 ($100) $O ($300) ($2,700) ($2,600) ($4,200) ($4,200)
b. Diff from Res Unv 1 National Ave ($400) ($400) ($1,200) ($1,100) ($1,700) ($4,400) ($4,300) ($6,100) ($5,900)
c. Difference from Peer Grp Ave ($2,100) ($900) ($3,000) ($2,600) ($3,200) ($6,000) ($7,300) ($8,700) ($8,800) ($8,900)
(2) Professor $35,100 $38,300 $38,200 $41,600 $44,200 $44,500 $46,700 $47,900 $50,800 $54,200
a. Diff from Res U 1+2 National Ave ($1.200) ($400) ($1,400) ($1,300) ($1,700) ($4,300) ($4,400) ($6,400) ($6,600)
b. Diff from Res Unv 1 National Ave ($2,200) ($1,600) ($2,900) ($2,800) ($3,600) ($6,500) ($6,700) ($8,800) ($8,900)
c. Difference from Peer Grp Ave ($2,500) ($2,200) ($4,200) ($3,800) ($4,500) ($7,600) ($9.400)($11,200)(S11,100)($11,300)
(3) Associate Professor $25,500 $27,700 $27,600 $29,800 $31,300 $31,600 $33,800 $34,300 $36,700 639.100
a. Diff from Res U 1+2 National Ave ($1,400) 01,000 ($1,600) ($1,800) ($2,500) ($4,400) ($3,800) ($5,700) ($5,500)
b. Diff from Res Unv 1 National Ave ($1,800) ($1,500) ($2,300) ($2,400) ($3,300) ($5,500) ($4,700) ($6,700) ($6,300)
c. Difference from Peer Grp Ave ($2,100) ($1,800) ($3,000) ($2,600) ($3,300) ($5,300) ($5,600) ($7,400) ($8,000) ($8,100)
(4) Assistant Professor $20,900 $22,300 $22,600 $25,400 $27,700 $28,000 $29,400 $31,000 $33,300 $35,500
a. Diff from Res U 1+2 National Ave ($1,000) (61.200) ($1,600) ($1,300) ($1,000) ($2,500) ($2,500) ($2,900) ($2,500)
b. Diff from Res Unv 1 National Ave ($1,400) ($1,600) ($2,300) ($1,700) ($1,600) ($3,500) ($3,400) (mom) ($3,400)
c. Difference from Peer ;rp Ave ($1,500) ($1,500) ($2,700) ($1,700) ($1,600) ($3,400) ($4,100) ($4,600) ($5,200) ($5,200)
(5) Instructor $17,800 $18,800 $19.000 $20,900 $23,100 $22,600 $24,900 $26,300 $26,500 $28,300
a. Diff from Res U 1+2 National Ave $700 $300 $100 $1,000 $1,400 $0 $600 $1,200 $200
b. Diff from Res One 1 National Ave $400 ($400) ($500) $500 $1,100 ($500) $300 $700 ($200)
c. Difference from Peer Grp Ave ($300) $800 ($100) $1,100 $1,700 $200 $1,300 $2,000 ($2,100) ($1,900)
*Peer Group, Prior to 1982-83: University of Arizona; University of Southern California; University of Colorado (Boulder);
University of Florida; University of Iowa; University of Kentucky; University of North Carolina (Chapel Hill);
University of Oklahoma; University of Pittsburgh; University of Virginia.
/Peer Group, 1982-83 to 1988-89: University of Arizona; University of California, Los Angeles;
University of Cincinnati; University of Colorado (Boulder); University of Iowa; University of Michigan;
University of North Carolina; University of Pittsburgh; Purdue University; University of Texas (Austin);
University of Virginia; University of Washington.
@Peer Group, 1989-90 and subsequent years: University of Iowa; University of Virginia (MC); University of Colorado (Boulder);
University of Cincinnati (MC); University of Washington; University of North Carolina (Chapel Hi)l); Purdue University (MC);
University of Florida; University of California (Los Angeles); University of Arizona.
BEST COPY AVAILABLE
241

90FacRev COMPARATIVE RECENT HISTORY OF FACULTY SALARIES AND COMPENSATION IN UTAH PUBLIC HIGHER EDUCATION
TABLE 1 -- SALARIES
21-Dec-90
Page 1-B
Estimated
1981-82 1982-83 1983-84 1984-85 1985-86 1986-87 1987-88 1988-89 1989-90 1990-91
S. Utah State University Peer Group * f @
(1) All Ranks Combined $28,400 $30,600 $32,100 $34,000 $36,900 $39,700 $42,200 $44,600 $46,800 $49,300
(2) Professor $34,800 $38,600 $40,500 $42,900 $46,400 $49,900 $52,900 $56,200 $58,400 $61,500
(3) Associate Professor $26,700 $28,900 $30,300 $31,800 $34,100 $36,600 $38,900 $41,200 $42,700 $45,000
(4) Assistant Professor $21,900 $23,600 $24,900 $26,100 $28,400 $30,700 $32,500 $34,400 $35,900 $37,800
(5) Instructor $16,700 $18,400 $18,000 $18,600 $19,900 $21,000 $22,000 $23,100 $24,500 $25,900
6. UTAH STATE UNIVERSITY
(1) All Ranks Combined $25,400 $27,300 $27,700 $30,400 $32,500 $33,000 $34,000 $33,900 $35,500 $37,500
a. Diff from Res U 1+2 National Ave ($3,300) ($3,600) ($4,000) ($4,000) ($4,300) ($6,300) ($7,100) ($9,700)($10,700)
b. Diff from Res Unv 1 National Ave ($4,000) ($4,600) ($5,100) ($5,100) ($5,700) ($8,000) ($8,800)($11,600)($12,400)
c. Difference from Peer Grp Ave ($3,000) ($3,300) ($4,400) ($3,600) ($4,400) ($6,700) ($8,200)($10,700)($11,300)($11,800)
(2) Professor $31,200 $33,500 $33,400 $36,800 $39,100 $40,400 $41,500 $41,500 $43,400 $45,800
a. Diff from Res U 1+2 National A a ($5,100) ($5,200) ($6,200) ($6,100) ($6,800) ($8,400) ($9,600)($12,800)($14,000)
b. Diff from Res Unv I National Ave ($6,100) ($6,400) ($7,700) ($7,600) (68,700)($10,600)(S/2,900)($15,200)(S16,300)
c. Difference from Peer Grp Ave ($3,600) ($5,100) ($7,100) ($6,100) ($7,300) ($9,500)($11,400)($14,700)(515,000)($15,700)
(3) Associate Professor $24,400 $26,500 $26,500 $29,100 $31,400 $31,700 $33,000 $33,000 $34,500 $36,400
a. Diff from Res U 1+2 National Ave ($2,500) ($2,200) ($2,700) ($2,500) ($2,400) ($4,300) ($4,600) ($7,000) ($7,700)
b. Diff from Res Unv 1 National Ave ($2,900) ($2,700) ($3,400) ($3,100) ($3,200) ($5,400) ($5,500) ($8,000) ($8,500)
c. Difference from Peer Grp Ave ($2,300) ($2,400) ($3,800) ($2,700) ($2,700) ($4,900) ($5,900) ($8,200) ($8,200) ($8,600)
(4) Assistant Professor $19,700 $21,800 $22,100 $24,300 $25,800 $26,000 $27,400 $27,300 $29,200 $30,800
a. Diff from Res U 1+2 National Ave ($2,200) ($1,700) ($2,100) ($2,400) ($2,900) ($4,500) ($4,500) ($6,600) ($6,600)
U. Diff from Res Unv 1 National Ave ($2,600) ($2,100) ($2,800) ($2,800) ($3,500) ($5,500) ($5,400) ($7,700) ($7,500)
c. Difference from Peer Grp Ave ($2,200) ($1.800) ($2,800) ($1,800) ($2,600) ($4,700) ($5,100) ($7,100) ($6,700) ($7,000)
(5) Instructor $15,900 $17,800 $19,200 $21,000 $21,900 $22,500 $22,500 $23,600 $25,300 $26,700
a. Diff from Res U 1+2 National Ave ($1,200) ($700) $300 $1,100 $200 ($100) ($1,800) ($1,500) ($1,000)
b. Diff from Res Unv 1 National Ave ($1,500) ($1,400) ($300) $600 ($100) ($600) ($2,100) ($2,000) ($1,400)
c. Difference from Peer Grp Ave ($800) ($600) $1,200 $2,400 $2,000 $1,500 $500 $500 $800 $800
*Peer Group, prior to 1982-83: Colorado State University; Iowa State University; Kansas State University;
New Mexico State University; North Carolina State University (Raleigh); Oklahoma State University; Oregon State University;
Texas A & M University; Virginia Tech University; Washington State University.
Peer Group, 1982-83 to 1988-89: University of California, Davis; Colorado State Vni':ersity;
University of Connecticut; Iowa State University; New Mexico State University; North Carolina State University;
Oregon State University; Pennsylvania State University; Rutgers University; Texas A & M University;
Virginia Tech University; Washington State University.
@Peer Group, 1989-90 and subsequent years: New Mexico State University (MC); Oregon State University; Washington State University;
Colorado State University; North Carolina State University (Raleigh); Iowa State University; University of Maryland (College Park);
Virginia Tech University; Texas A&M University; University of California (Davis).
12 242

90FacRev COMPARATIVE RECENT HISTORY OF FACULTY SALARIES AND COMPENSATION IN UTAH PUBLIC HIGHER EDUCATION
7. Comprehensive Institutions--IIA
(1) All Ranks Combined
(2) Professor
(3) Associate Professor
(4) Assistant Professor
(5) Instructor
8. Gen Baccalaureate Institutions--IIB
(1) All Ranks Combined
(2) Professor
(3) Associate Professor
(4) Assistant Professor
(5) Instructor
TABLE 1 -- SALARIES
21-Dec-90
Page 1-C
Estimated
1981-82 1982-83 1983-84 1984-85 1985-86 1986-87 1987-88 1988-89 1989-90 1990-91
$25,300 $26,900 $28,200 $29,900 $32,100 $34,100 $35,300 $38,100 $40,100
$31,700 $33,500 $34,600 $37,100 $39,700 $42,300 $46,100 $46,900 $49,600
$25,200 $26,800 $27,800 $29,600 $31,600 $33,300 $34,700 $37,400 $39,700
$20,800 $22,000 $23,000 $24,400 $26,000 $27,500 $28,400 $30,900 $32,700
$16,900 $17,700 $19,100 $19,600 $20,800 $21,600 $21,800 $24,000 $25,100
$22,600 $24,500 $25,100 $26,900 $28,400 $29,700 $31,100 $32,900 $34,400
$28,900 $30,800 $31,600 $33,900 $35,600 $36,900 $38,700 $41,100 $43,300
$23,800 $25,500 $26,300 $28,200 $29,800 $31,200 $32,400 $34,300 135,900
$20,100 $21,600 $22,200 $23,500 $24,900 $25,900 $27,100 $28,400 $29,700
$16,200 $18,200 $18,600 $19,000 $20,100 $21,600 $21,900 $23,000 $24,200
9. Weber State University Peer Group * 0 @
(1) All Ranks Combined $24,800 $28,000 $28,800 $30,500 $32,400 $34,700 $36,800 $38,100 $39,200 $41,300
(2) Professor $30,600 $33,300 $34,300 $36,200 $38,500 $41,100 $43,600 $45,500 $46,400 $48,900
(3) Associate Professor $25,100 $27,500 $28,200 $29,700 $31,300 $33,700 $35,900 $37,500 $37,100 $39,100
(4) Assistant Professor $20,900 $22,900 $23,400 $24,700 $26,300 $28,200 129,800 $31,200 $32,100 $33,800
(5) Instructor $17,700 $18,500 $19,100 $20,200 $21,300 $22,600 $24,200 $24,100 $25,300 $26,700
10. So Utah University Peer Grp ** it @@
(I) All Ranks Combined
(2) Professor
(3) Associate Professor
(4) Assistant Professor
(5) Instructor
$24,400 $28,000 $28,800 $30,500 $32,400 $34,700 $36,800 $38,100 $39,200 $41,300
$29,900 $33,300 $34,300 $36,200 $38,500 $41,100 $43,600 $45,500 $46,400 $48,900
$2°,400 $27,500 $28,200 $29,700 $31,300 $33,700 $35,900 $37,500 $37,100 $39,100
$21,100 $22,900 $23,400 $24,700 $26,300 $28,200 $29,800 $31,200 $32,100 $33,800
$17,600 $18,500 119,100 $20,200 $21,300 $22,600 $24,200 $24,100 $25,300 $26,700
*Peer Group, prior to 1982-83: University of Colorado at Colorado Springs; Metropolitan State College (Denver);
Boise State University; Indiana University, Northwest; University of Northern Iowa; Boston State College (MA);
Ferris State College (MI); Jersey City State College (NJ); Southern Oregon State College; West Chester University (PA);
Pan American University (TX); Central Washington University; University of Wisconsin, Oshkosh.
OPeer Group, 1982-83 to 1988-89: Boise State University (ID): University of California, Hayward;
Eastern Washington University; Jersey City State College (NJ); Metropolitan State College (CO);
University of Nevada, Las Vegas; University of Northern Arizona; University of Northern Iowa; Portland State University
(CR); State University of New York, College at Brockport; West Chester University (PA); University of Wisconsin, Oshkosh.
@Peer Group, 1989-90 and subsequent years: Indiana Univeristy Northwest; University of Southern Colorado;
Southern Oregon State College; Austin Peay State Univerity (TN); California State Univeristy (Dominguez Hills);
Eastern Washington University; Boise State University (ID); SUNY College at Brockport; University of Nevada (Las Vegas);
University of Wisconsin, Oshkosh.
*Peer Group, prior to 1982-83: Adams State College (CO); Fort Lewis College (CO); Delaware State College (DE);
Lewis and Clark State College (ID); Indiana State University, Evansville; New Mexico Highlands University;
Pembroke State University (NC); Southwest State University (MN); Central State University (OH); Lock Haven University
(PA); Southern Oregon State College.
Weer Group, 1982-83 to 1988-89: WSU group used for salary and tuition comparison purposes.
(I@Peer Group, 1989-90 and subsequent years: WSU group used for salary and tuition comparison purposes.

90FacRev COMPARATIVE RECENT HISTORY OF FACULTY SALARIES AND COMPENSATION IN UTAH PUBLIC HIGHER EDUCATION 21-Dec-90
TABLE 1 -- SALARIES Page 1-0
Estimated
1981-82 1982-83 1983-84 1984-85 1985-86 1986-87 1987-88 1988-89 1989-90 1990-91
11. WEBER STATE UNIVERSITY
(1) All Ranks Combined $23,500 $25,100 525,100 $27,500 $28,700 $29,400 $28,900 $29,100 $30,300 $32,200
t. Diff from Comp Nat Ave (1IA) ($1,800) ($1,800) ($3,100) ($2,400) (53,400) ($4,700) ($6,400) ($9,000) ($9,800)
b. Diff from Bacc Nat Ave (1IB) $900 5600 $0 $600 $300 ($300) ($2,200) ($3,800) ($4.100)
c. Difference from Peer Grp Ave ($1,300) ($2,900) ($3,700) $27,500 ($3,700) ($5,300) ($7,900) ($9,000) ($8,900) (19,100)
(2) Professor $28,500 $30,500 $30,300 $33,600 $34,800 $35,500 $35,200 $35,400 $36,600 $38,900
a. Diff from Comp Nat Ave (IIA) ($3,200) ($3,000) ($4,300) ($3,500) ($4,900) ($6,800)($10,900)($11,500)(513,000)
b. Diff from Bacc Nat Ave (1IB) ($400) ($300) ($1,300) ($300) ($800) ($1,400) ($3,500) ($5,700) ($6,700)
c. Difference from Peer Grp Ave ($2,100) ($2,800) ($4,000) ($2,600) ($3,700) ($5,600) ($8,400)($10,100) ($9,800)($10,000)
(3) Associate Professor $23,800 $25,500 $24,900 $28,000 $29,400 $29,400 $29,300 $29,000 $30,600 $32,500
a. Diff from Comp Nat Ave (IIA) ($1.400) ($1,300) (12,900) ($1,600) ($2,200) ($3,900) (55.400) ($8,400) (59,100)
b. Diff from Bacc Nat Ave (1IB) $0 $O ($1,400) ($200) ($400) ($1,800) ($3,100) ($5,300) ($5,300)
c. Difference from Peer Grp Ave ($1,300) ($2,000) ($3,300) ($1,700) ($1,900) ($4,300) ($6,600) ($8,500) ($6,500) ($6,600)
(4) Assistant Professor 520.400 $22,300 $22,200 $24,300 $25,800 $25,700 $25,800 $26,100 $27,200 $28,900
a. Diff from Comp Nat Ave (114) ($400) $300 ($800) ($100) ($2OO) ($1,800) ($2,600) (14,800) ($5,500)
b. Diff from Bacc Nat Ave (IIB) $300 $700 $0 1800 $900 (5200) ($1,300) ($2,300) ($2,500)
c. Difference from Peer Grp Ave (55OO) ($600) ($1,200) ($400) ($500) ($2,500) ($4,000) ($5,100) ($4,900) ($4,900)
(5) Instructor $15,900 $17,500 $18,000 $19,600 $19,300 $20,900 $19,900 $20,100 $20,800 122,100
a. Oiff from Comp Nat Ave (IIA) ($1,000) ($200) ($1,100) $0 ($1,500) (5700) (11,900) ($3,900) ($4,300)
b. Diff from Bacc Nat Ave (IIB) ($300) ($700) ($600) $600 ($800) ($700) ($2,000) ($2,900) ($3,400)
c. Difference from Peer Grp Ave ($1,800) ($1,000) ($1,100) ($600) ($2,000) ($1,700) ($4,300) ($4,000) ($4,500) ($4,600)
12. SOUTHERN UTAH UNIVERSITY
(1) All Ranks Combined $22,200 $22,900 $23,100 $25,500 $27,100 126,900 $28,100 527,800 529,000 530,700
a. Diff from Comp Nat Ave (IIA) ($3,100) ($4,000) ($5,100) ($4,400) ($5,000) ($7,200) ($7,200)($10,300)(S11,100)
b. Diff from Bacc Nat Ave (IIB) ($400) ($1,600) ($2,000) ($1,400) ($1,300) ($2,800) ($3,000) (55,100) ($5,400)
c. Difference from Peer Grp Ave ($2,200) ($5,100) ($5,700) ($5,000) ($5,300) ($7,800) ($8,700)($10,300)($10,200)($10,600)
(2) Professor $27,400 $28,100 $27,700 $30,800 $33,100 $33,300 $34,600 $34,600 $35,500 $37,600
a. Diff from Comp Nat Ave (IIA) (54,300) ($5,400) ($6,900) ($6,300) ($6,600) ($9,000)($11,500)($12,300)($14,100)
U. Diff from Bacc Nat Ave (11B) ($1.500) ($2,700) ($3,900) ($3,100) ($2,500) ($3,600) ($4,100) ($6,500) ($7,800)
c. Difference from Peer Grp Ave ($2,500) ($5,200) (56.600) (55,400) (55,400) ($7,800) (59,000)($10,900)($10,900)($11,300)
(3) Associate Professor $21,500 $23,100 $23,500 $25,500 $27,000 $26,800 $28,000 $27,700 $29,500 $31,300
a. Diff from Comp Nat Ave (11A) (53,700) (53,700) (54,300) ($4,100) ($4,600) ($6,500) ($6,700) ($9,700)($10,200)
b. Diff from Bacc Nat Ave (JIB) ($2,300) ($2,400) ($2,800) ($2,700) ($2,800) ($4,400) ($4,400) ($6,600) ($6,400)
c. Difference from Peer Grp Ave ($2,900) ($4,400) ($4,700) ($4,200) ($4,300) ($6,900) ($7,900) ($9,800) ($7,600) ($7,800)
(4) Assistant Professor $19,100 $19,600 $19,900 $22,000 $22,700 $23,500 $23,500 $23,600 $25,100 $26,600
a. Diff from Comp Nat Ave (IIA) ($1,700) ($2,400) ($3,100) ($2,400) ($3,300) (14,000) ($4,900) ($7,100) ($7,600)
b. Diff from Bacc Nat Ave (IIB,
c. Difference from Peer Grp Ave
($1,000)
($2,000)
($2,000)
($3,300)
($2,300)
($3,500)
($1,500)
($2,700)
($2,200)
($3,600)
($2,400)
($4,700)
($3,600) ($4,600) (14,600)
($6,300) ($7,400) ($7,000) ($7,200)
(5) Instructor $17,300 $17,300 $17,000 $19,600 520,300 $20,200 $20,500 $21,600 $23,300 $24,700
a. Diff from Comp Nat Ave (IIA) $400 ($400) ($2,100) 10 (5500) ($1,400) ($1,300) ($2,400) ($1,800)
b. Diff from Bacc Nat Ave (JIB) $1,100 ($900) ($1,600) $600 $200 ($1,400) ($1,400) ($1,400) ($900)
c. Difference from Peer Grp Ave ($300) ($1,200) ($2,100) ($600) ($1,000) ($2,400) ($3,700) ($2,500) ($2,000) ($2,000)

90FacRev COMPARATIVE RECENT HISTORY OF FACULTY SALARIES AND COMPENSATION IN UTAH PUBLIC HIGHER EDUCATION 21-Dec-90
TABLE 1 -- SALARIES Page 1-E
Estimated
1981-82 1982-83 1983-84 1984-85 1985-86 1986-87 1987-88 1988-89 1989-90 1990-91
13. Institutions Without Academic Ranks--IV
Essentially All Two-Year Institutions
(1) All Faculty Combined $23,000 525,000 $24,400 $24,800 $28,600 $31,400 $29,100 $31,200 534,500
14. Metro Community College Peer Grp * I
(1) All Faculty Combined N/A $25,700 $27,200 $28,70. $30,100 $31,100 $32,600 $34,300 $35,500 $37,500
15. Rural Community College Peer Grp ** i
(1) All Faculty Combined N/A $24,100 $25,100 $28,700 $30,100 $31,100 $32,600 $34,300 $35,500 $37,500
16. Snow College ** /I
(1) All Faculty Combined 520,100 $21,500 $21,800 $23,300 $25,300 $25,700 $27,100 $26,300 $27,600 $30,200
a. Diff from National Ave (IV) ($2,900) ($3,500) ($2,600) ($1,500) ($3,300) ($5,700) ($2,000) ($4,900) (56,900)
b. Difference from Peer Grp Ave ($2,600) ($3,300) ($5,400) ($4,800) ($5,400) ($5,600) ($8,000) ($7,900) ($7,300)
17. Dixie College
(1) All Faculty Combined $21;100 $23,000 $22,200 $24,500 $25,700 $25,700 $25,800 $25,800 $26,700 $28,200
a. Diff from National Ave (IV) ($1,900) ($2,000) ($2,200) ($300) ($2,900) ($5,700) ($3,300) ($5,400) ($7,800)
b. Difference from Peer Grp Ave ($1,100) ($2,900) ($4,200) ($4,400) ($5,400) ($6,800) ($8,500) ($8,800) ($9,300)
18. College of Eastern Utah
(1) All Faculty Combined $20,000 $22,200 $21,500 $23,200 $24,500 $25,700 $25,600 $25,200 $26,100 $28,100
8. Diff from National Ave (IV) 03,000) ($2,800) ($2.900) ($1,600) ($4,100) ($5,700) ($3,500) ($6,000) ($8,400)
b. Difference from Peer Grp Ave ($1,900) ($3,600) ($5,500) ($5,600) ($5,400) ($7,000) ($9,100) ($9,400) ($9,400)
19. Utah Valley Community College
(1) All Faculty Combined $20,600 $22,000 $21,600 $24,400 $26,500 $26,600 $27,500 $27,600 $28,600 530,300
a. Diff from National Ave (IV) ($2,400) ($3,000) ($2,800) ($400) ($2,100) ($4,800) ($1,600) ($3,600) ($5,900)
b. Difference from Peer Grp Ave ($3,700) ($5,600) $24,400 ($3,600) ($4,500) ($5,100) ($6,700) ($6,900) ($7,200)
20. Salt Lake Community College
(1) All Faculty Combined $20,600 $21,600 $21,400 $23,800 $25,300 $24,800 $25,800 $25,600 $25,300 $27,900
a. Diff from National Ave (IV) ($2,400) ($3,400) ($3,000) ($1,000) ($3,300) ($6,600) ($3,300) ($5,600) ($8,200)
h. Difference from Peer Grp Ave ($4,100) ($5,800) $23,800 ($4,800) ($6,300) ($6,800) ($8,700) ($9,200) ($9,600)
*Peer Group, prior to 1982-83: Clark Co CC (NV); Chemeketa CC (OR); College of Southern Idaho; CC of Denver (CO);
Des Moines Area CC (IA); Lee College (TX); Maricopa Co CC (A2); North Dakota State School of Science;
North Hennepin CC (MN); Penn Valley CC (MO); Pikes Peak CC (CO); Central Arizona College; Olympia Technical CC (WA);
Western Nevada CC.
Veer Group, 1982-83 to 1988-89: Ann Arundel CC (MO); Austin CC (TX); Bergen CC (MD); Chemeketa CC (OR);
Clark Co CC (NV); College of Southern Idaho; Delaware CC (PA); Madison Area Tech Col (WI); Mount Hood CC (OR);
North Seattle CC (WA); Spokane CC (WA; (San Diego City College (CA)--1982-83 only).
**Peer Group, prior to 1982-83: Big Bend CC (WA); Blue Mountain CC (OR); Colorado Mt JC (CO); Flathead Valley CC (MT);
Miles CC (MT); Northern Nevada CC; North Idaho College; Northwest CC (WY); Northwestern JC (CO): Treasure Valley CC (OR);
Wenatchee Valley CC (WA); Western Wyoming CC.
Oi Peer Group, 1982-83 and 1983-84: [Big Bend CC (WA)--1982-83 only]; Blue Mountain CC (OR);
College of the Siskiyous (CA); North Central Michigan College; Northeastern JC (CO); North Idaho College;
Northwest CC (WY); Treasure Valley CC (OR); Wenatchee Valley College (WA): Western Texas College;
Western Wyoming College; Yavapai College (AZ).
(Weer GrOup, 1984-85 to 1988-89: Matro Group used for faculty compensation and tuition and fee comparisons.
-Peer Group for All Community Lolleges, 1989-90 and subsequent years: Western Wyoming Community College;
Danville Community College (VA). Yavapai College (AZ); North Idaho College; Joliet Junior College (IL);
Chemeketa Community College (uR); Anne Arundel Community College (MD); Spokane Community College (WA);
Onandaga Community College (NY); Grand Rapids Jr College (MI).
2 4
BEST COPY AVAILABLE15

90FacRev COMPARATIVE RECENT HISTORY Of FACULTY SALARIES AND COMPENSATION IN UTAH PUBLIC HIGHER EDUCATION 2I-Dec-90
1. Research Univ--Carnegie Class I add 2
(1) All Ranks Combined
(2) Professor
(3) Associate Professor
(4) Assistant Professor
(5) Instructor
2. Research Universities--Carnegie Class 1
(1) All Ranks Combined
(2) Professor
(3) Associate Professor
(4) Assistant Professor
(5) Instructor
3. University of Utah Peer Group f @
(1) All Ranks Combined
(2) Professor
(3) Associate Professor
(4) Assistant Professor
(5) Instructor
TABLE 2 -- TOTAL COMPENSATION Page 2-A
1981-82
$34,300
$43,000
$32,200
$26,300
$20,400
$35,500
$44,300
$32,900
$26,900
$20,800
$36,400
$43.900
$32,600
$26,500
$21,300
4. UNIVERSITY OF UTAH
(1) All Ranks Combined $35,800
a. Diff from Res U 1+2 National Ave $1,500
b. Diff from Res Unv 1 National Ave $300
c. Difference from Peer Grp Ave ($600)
(2) Professor 142,900
a. Diff from Res U 1+2 National Ave ($100)
b, Diff from Res Unv 1 National Ave ($1,400)
c. Difference from Peer Grp Ave ($1,000)
(3) Associate Professor $31,800
a. Diff from Res U 1+2 National Ave ($400)
b. Diff from Res Unv 1 National Ave ($1,100)
c, Difference from Peer Grp Ave ($800)
(4) Assistant Professor $26,300
a. Diff from Res U 1+2 National Ave $O
b. Diff from Res Unv 1 National Ave ($600)
c. Difference from Peer Grp Ave ($200)
(5) Instructor $22,500
a. Diff from Res U 1+2 National Ave $2,100
b. Diff from Res Unv 1 National Ave $1,700
c. Difference from Peer Grp Ave $1,200
Estimated
1982-83 1983-84 1984-85 1985-86 1986-87 1987-88 1988-89 1989-90 1990-91
Estimated
$36,800 $38.100 $41,700 $44,800 $47,700 $49,900 $53,100 $56,600
$45,800 $47,600 $51,700 $55,400 $58,900 $61,600 $55,500 $69,700
$34,200 $35,100 $38,500 $41,300 $44,000 $46,100 $49,100 $52,200
$28,300 $29,100 $32,500 $35,000 $37,300 $39,200 $41,700 $44,400
$22,000 $22,400 $24,800 $26,700 $27,900 $29,100 $31,300 $33,000
$38,100 $39,600 $43,300 $46,600 $49,700 $51,900 $55,100 $58,600
$47,300 $49,600 $53,800 $57,700 $61,500 $64,200 $68,200 $72,300
$34,900 $36,100 $39,500 $42,400 $45,300 $47,200 $50,100 $53,100
$28,800 $30,100 $33,400 $36,100 $38,500 140,300 $42,900 $45,600
$22,800 $23,200 $25,300 $27,300 $28,600 $29,800 $31,800 $33,600
$39,100 $41,300 $45.000 $48,300 $51,400 $55,500 $58,900 $62,500 $65,100
$48,900 $50,700 $54,700 $58,700 $62,400 $67,300 $71,500 $75,300 $79,700
$35,600 $36,600 $39,800 $42,500 $45,100 $48,500 $51,700 $55,600 $58,800
$28,700 $30,200 $33,400 $35,000 $38,500 $41,300 $44,300 $48,200 $50,900
$21,700 $22,800 $25,000 $26,200 $27,200 $29,000 $29,900 $35,900 $37,900
$39,600 $39,700 $43,800 $45,600 $46,900 $49,300 $50,900 $54,600 $58,200
$2,800 $1,600 $2,100 $1,800 ($800) ($600) ($2,200) ($2,000)
$1,500 $100 $500 $O ($2,800) ($2,600) ($4,200) ($4,000)
$500 ($1,600) ($1,200) ($1,700) ($4,500) ($6,200) ($8,000) ($7,900) ($7,900)
$47,700 $47,600 $52,500 $55,500 $56,500 $59,100 $61,300 $65,300 $69,600
$1,900 $0 $800 $1,100 ($2,400) ($2,500) ($4,200) ($4,400)
$400 ($2,000) ($1,300) ($1,200) ($5,000) ($5,100) ($6,900) ($7,000)
($1,200) ($3,100) ($2,200) ($2,200) ($5,900) ($8,200)($10,300)($10,000)(110,100)
$35,100 $35,000 $38,200 $39,900 $40,700 $43,600 $44,700 $48,100 $51,300
$900 ($100) ($400) ($1,400) ($3,300) ($2,500) ($4,400) ($4,100)
$200 ($1,100) ($1,300) ($2,500) ($4,600) ($3,600) ($5,400) ($5,000)
($500) ($1,600) ($1,600) ($2,600) ($4,400) ($4,9001 ($7,000) ($7,500) ($7,500)
$2. 100 $28,900 $32,800 $35,400 $36,300 $38,400 $40,700 $44,000 $46,900
$200 ($200) $300 $400 ($1,000) ($800) ($1,000) ($400)
($300) ($1,200) ($600) ($700) ($2,200) ($1,900) ($2,200) ($1,600)
($200) ($1,300) ($600) ($600) ($2,200) ($2,900) ($3,600) ($4,200) ($4,000)
$24,300 $24,600 $27,200 $29,600 $29,600 $32,900 $34,900 $35,800 $38,200
$2,300 $2,200 $2,400 $2,900 $1,700 $3,800 $3,600 $2,800
$1,500 $1,400 $1,900 $2,300 $1,000 $3,100 $3,100 $2,200
$2,600 $1,800 $2,200 $3,40C $2,400 $3,900 $5,000 ($100) $300
+Peer Group, Prior to 1982-83: University of Arizona; University of Southern California; University of Colorado (Boulder);
university of Florida; University of Iowa; University of Kentucky; University of North Carolina (Chapel Hill);
university of Oklahoma; University of Pittsburgh; University of Virginia.
/Peer Group, 1982-83 to 1988-89: University of Arizona; University of California, Los Angeles;
University of Cincinnati; University of Colorado (Boulder); University of Iowa; University of Michigan;
University of North Carolina; University of Pittsburgh; Purdue University; University of Texas (Austin);
University of Virginia; University of Washington.
@Peer Group, 1989-90 and subsequent years: University of Iowa; University of Virginia (MC); University of Colorado (Boulder);
University of Cincinnati (MC); University of Washington; University of North Carolina (Chapel Hill); Purdue University (MC);
University of Florida; University of California (Los Angeles); University of Arizona.

90EacAv COMPARATIVE RECENT HISTORY OF FACULTY SALARIES ANO COMPENSATION IN UTAH PUBLIC HIGHER EDUCATION
TABLE 2 -- TOTAL COMPENSATION
21-0ec-90
Page 2-8
Estimated
1981-82
1r 15. Utah State University Peer Group
1982-83 1983-84 1984-85
ESTIMATED
1985-86 1986-87 1987-88 1988-89 1989-90 1990-91
(I) All Ranks Combined $33,600 $36,414 $38,400 $41,400 $44,600 $47,900 $51,400 $54,500 $57,400 $60,400
(2) Professor $41,000 $45,934 $48,400 $51,800 $55,600 $59,500 $63,700 $67,800 $70,900 $74,500
(3) Associate Professor $31,800 $34,391 $36,200 $38,800 $41,500 $44,500 $47,800 $50,700 $52,800 $55,600
(4) Assistant Professor $26,100 $28,084 $29,800 $32,100 $34,700 $37,300 $40,000 $42,500 $44,400 $46,700
(5) Instructor $20,100 $21,696 $21,500 $23,500 $24,900 $26,200 $27,800 $29,600 $31,700 $33,500
6. UTAH STATE UNIVERSITY
(1) All Ranks Combined $31,400 $34,500 $35,000 $39,000 $41,700 $42,400 $44,000 $44,200 $46,800 $49,400
a. Diff from Res U 1+2 National Ave ($2,900) ($2,300) ($3,100) ($2,700) ($3,100) ($5,300) ($5,900) ($8,900) ($9,800)
b. Diff from Res Unv 1 National Ave ($4,100) ($3.600) ($4,600) ($4,300) ($4,900) ($7,300) ($7,900)($10,900)($11,800)
C. Difference from Peer Grp Ave ($2,200) ($1,914) ($3,400) ($2.400) ($2,900) ($5,500) ($7,400)($10,300)($10,600)($11,000)
(2) Professor $38,400 $42,200 $42,100 $47,000 $50,20: $51,700 $53,400 $53,900 $56,900 $60,000
a. Diff from Res U 1+2 National Ave ($4,600) ($3,600) ($5,500) ($4,700) ($5,200) ($7,200) ($8,200)($11,600)($12,800)
b. Diff from Res Unv 1 National Ave ($5,900) ($5,100) ($7,500) ($6,800) ($7.500) ($9.800)($10,800)($14,300)($15,400)
c. Difference from Peer Grp Ave ($2,600) ($3,734) ($5,300) ($4,800) ($5,400) ($7,800)($10,300)($13,900)($14,000)($14,600)
(3) Associate Professor $30,300 $33,600 $33,600 $37,300 $40,400 $41,000 $42,900 $43,300 $45,800 $48,300
a. Diff from Res U 1+2 National Ave ($1,900) ($600) ($1,500) ($1,300) ($900) ($3,000) ($3,200) ($5,800) ($6,400)
b. Diff from Res Unv I National Ave ($2,600) ($1,300) ($2,500) ($2,200) ($2,000) ($4,300) ($4,300) ($6,800) ($7,300)
c. Difference from Peer Grp Ave ($1,500) ($791) ($2,600) ($1,500) ($1,100) ($3,500) ($4,900) ($7,400) ($7,000) ($7,300)
(4) Assistant Professor $24,500 $27,800 $28,200 $31,200 $33,100 $33,600 $35,400 $35,800 $38,600 $40,700
a. Diff from Res U 1+2 National Ave ($1,800) ($500) ($900) ($1,300) ($1,900) ($3,700) ($3,600) ($5,900) ($5,800)
b. Diff from Res Unv 1 National Ave ($2,400) ($1,000) ($1,900) ($2,200) ($3,000) ($4,900) ($4,900) ($7,100) ($7,000)
c. Difference from Peer Grp Ave ($1,600) ($284) ($1,600) ($900) ($1,600) ($3,700) ($4,600) ($6,700) ($5,800) ($6,000)
(5) Instructor $19,600 $22,400 $24,200 $26,700 $28,100 $28,900 $29,100 $30,800 $33,300 $35,100
a. Diff from Res U 1+2 National Ave ($800) $400 $1,800 $1,900 $1,400 $1,000 $0 ($500) $300
b. Diff from Res Unv 1 National Ave ($1,200) ($400) $1,000 $1,400 $800 $300 ($700) ($1,000) ($300)
c. Difference from Peer Grp Ave ($500) $504 $2,700 $3,200 $3,200 $2,700 $1,300 $1,200 $1,600 $1,600
'Peer Group, prior to 1982-83: Colorado State University; 'Iwa State University; Kansas State University;
New Mexico State University; North Carolina State University (Raleigh); Oklahoma State University; Oregon State
University; Texas A & M University; Virginia Tech University; Washington State University.
/Peer Group, 1982-83 and subsequent years: University of California, Davis; Colorado State University;
University of Connecticut; Iowa State University; New Mexico State University; North Carolina State University;
Oregon State University; Pennsylvania State University; Rutgers University; Texas A & M University;
Virginia Tech University; Washington State University.
@Peer Group, 1989-90 and subsequent years: New Mexico State University (MC); Oregon State University; Washington State University;
Colorado State University; North Carolina State University (Raleigh);Iowa State University; University of Maryland (College Park);
Virginia Tech University; Texas API University; University of California (Davis).
247
BEST COPY AVAILABLE17

90FacRev COMPARATIVE RECENT HISTORY OF FACULTY SALARIES AND COMPENSATION IN UTAH PUBLIC HIGHER EDUCATION 21-Dec-90
7. Comprehensive Institutions--IIA
(1) All Ranks Combined
(2) Professor
(3) Associate Professor
(4) Assistant Professor
(5) Instructor
8. Gen Baccalaureate Institutions--IIB
(1) All Ranks Combined
(2) Professor
(3) Associate Professor
(4) Assistant Professor
(5) Instructor
9. Weber State University Peer Group * @
(1) All Ranks Combined
(2) Professor
(3) Associate Professor
(4) Assistant Professor
(5) Instructor
10. So Utah University Peer Grp ** t @@(1) All Ranks Combined
(2) Professor
(3) Associate Professor
(4) Assistant Professor
(5) Instructor
TABLE 2 -- TOTAL COMPENSATION Page 2-C
Estimated
1981-82 1982-83 1983-84 1984-85 1985-86 1986-87 198748 1988-89 1989-90 1990-91
Estimated
$30,600 $32,300 $34,300 $37,000 $39,100 $41,500 $43,000 $46,900 $49,700
$38,500 $40,100 $42,100 $45,900 $48,200 $51,200 $53,400 $57,300 $61,000
$30,500 $32,100 $33,800 $36,600 $38,600 $40,800 $42,500 $46,200 $49,400
$24,900 $26,400 $28,000 $30,100 $31,800 $33,700 $34,800 $38,300 $40,800
$20,100 $21,000 $23,200 $24,100 $25,500 $26,400 $26,900 $29,900 $31,400
$26,600 $29,000 $29,900 $32,500 $34,600 $36,100 $37,700 $40,300 $42,600
$34,000 $36,300 $37,700 $40,700 $43,200 $44,800 $46,700 $49,900 $53,200
$28,100 $30,400 $31,400 $34,000 $36,300 $38,200 $39,400 $41,900 $44,200
$23,600 $25,500 $26,500 $28,500 $30,300 $31,600 $32,900 $34,900 $37,000
$19,000 $21,600 $22,200 $23,100 $24,500 $26,200 $26,800 $28,300 $30,300
$30,100 $34,500 $34,400 $37,600 $39,500 $42,200 $44,900 $46,900 $49,200 $51,800
$36,900 $41,000 $41,000 $44,700 $46,900 $49,700 $52,900 $55,700 $57,300 $60,400
$30,600 $33,900 $33,500 $36,500 $38,200 $41,000 $44,000 $46,300 $47,800 $50,400
$25,500 $28,200 $28,000 $30,600 532,200 $34,500 $36,600 $38,700 $40,100 $42,300
$21,800 $22,800 $22,800 $25,200 $26,100 $27,900 $29,900 $30,200 $32,100 $33,800
$29,100 $34,500 $34,400 $37,600 $39,500 $42,200 $44,900 $46,900 $49,200 $51,800
$35,400 $41,000 $41,000 $44,700 $46,900 $49,700 $52,900 $55,700 $57,300 160,400
$29,200 $33,900 $33,500 $36,500 $38,200 $41,000 $44,000 $45,300 $47,800 $50,400
$25,300 $28,200 $28,000 $30,600 $32,200 $34,500 $36,600 $38,700 $40,100 $42,300
$21,300 $22,800 $22,800 $25,200 $26,100 $27,900 $29,900 $30,200 $32,100 $33,800
*Peer Group, prior to 1982-83: University of Colorado at Colorado Springs; Metropolitan State College (Denver);
Boise State University; Indiana University, Northwest; University of Northern lowa; Boston State College (MA);
Ferris State College (MI); Jersey City State College (NJ); Southern Oregon State College; West Chester University (PA);
Pan American University (TX); Central Washington University; University of Wisconsin, Oshkosh.
fPeer Group, 1982-83 to 1988-89: Boise State University (ID); University of California, Hayward;
Eastern Washington University; Jersey City State College (NJ); Metropolitan State College (CO);
University of Nevada, Las Vegas; University of Northern Arizona; University of Northern Iowa; Portland State University
(OR); State University of New York, College at Brockport; West Chester University (PA); University of Wisconsin, Oshkosh.
Peer Group, 1989-90 and subsequent years: Indiana Univeristy Northwest; University of Southern Colorado;
Southern Oregon State College; Austin Peay State Univerity (TN); California State Univeristy (Dominguez Hills);
Eastern Washington University; Boise State University (ID); SUNY College at Brockport; University of Nevada (Las Vegas);
University of Wisconsin. Oshkosh.
**Peer Group, prior to 1982-83: Adams State College (CO); Fort Lewis College (CO); Delaware State College (OE);
Lewis and Clark State College (ID); Indiana State University, Evansville; New Mexico Highlands University;
Pembroke State university (NC); Southwest State University (MN); CentralState University (OH); Lock Haven University
(PA): Southern Oregon State College.
Meer Group, 1982-83 to 1988-89: WSU group used for salary and tuition comparison purposes.
O@Peer Group, 1989-90 and subsequent years: WSU group used for salary and tuition Comparison purposes.
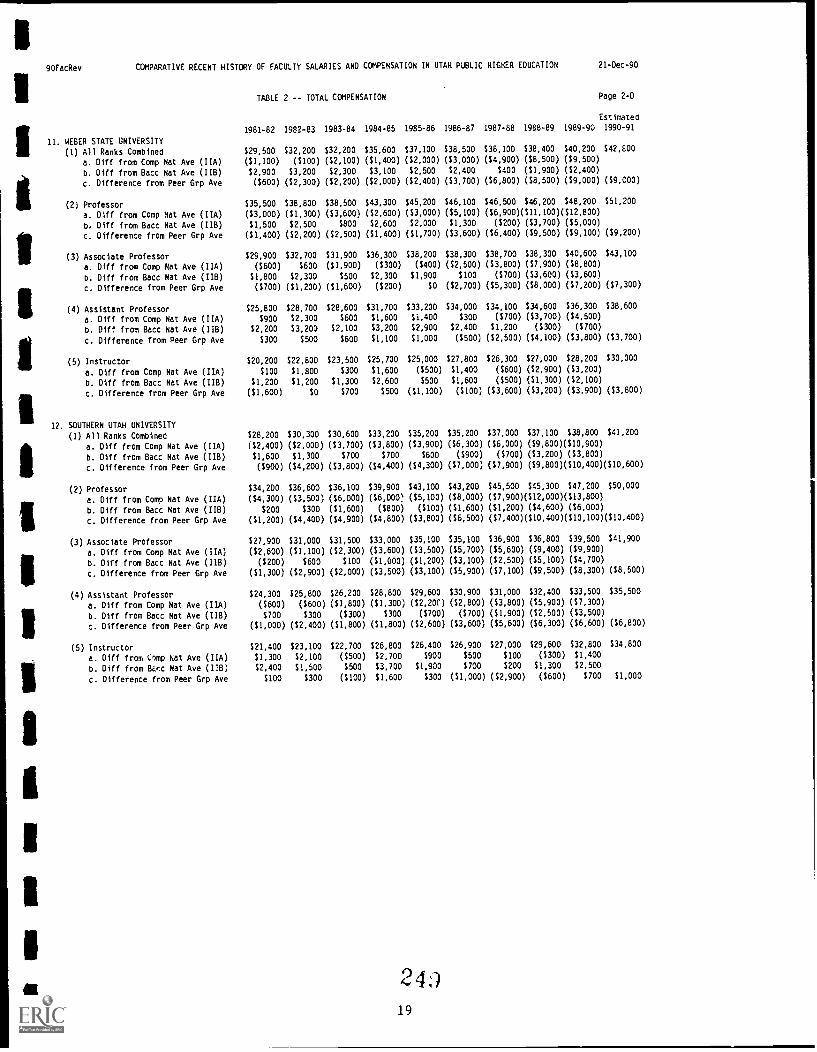
90FacRev COMPARATIVE RECENT HISTORY OF FACULTY SALARIES AND COMPENSATION IN UTAH PUBLIC HIGHER EDUCATION 21-Dec-90
TABLE 2 -- TOTAL COMPENSATION Page 2-0
Estimated
1981-82 1982-83 1983-84 1984-85 1985-86 1986-87 1987-88 1988-89 1989-90 1990-91
11. WEBER STATE UNIVERSITY
(1) All Ranks Combined $29,500 $32,200 $32,200 $35,600 $37,100 $38,500 $38,100 $38,400 $40,200 542,800
a. Diff from Comp Nat Ave (IIA) ($1.100) ($100) ($2,100) ($1,400) (52,000) ($3,000) ($4,900) (58,500) ($9,500)
b. Diff from Bacc Nat Ave (IIB) $2,900 $3,200 $2,300 $3,100 $2,500 52,400 $400 ($1,900) ($2,400)
c. Difference from Peer Grp Ave ($600) ($2,300) ($2,200) ($2,000) ($2,400) ($3,700) ($6,800) ($8,500) ($9,000) (59,000)
(2) Professor $35,500 $38,800 $38,500 $43,300 $45,200 $46,100 546,500 $46,200 $48,200 $51,200
a. Diff from Comp Nat Ave (IIA) (53,000) ($1,300) ($3,600) ($2,600) ($3,000) ($5,100) ($6,900)($11,100)($12,800)
b. Diff from 8acc Nat Ave (11B) $1,500 $2,500 $800 $2,600 $2,000 $1,300 ($200) ($3,700) ($5,000)
c. Difference from Peer Grp Ave ($1,400) ($2,200) ($2,500) ($1,400) ($1,700) ($3,600) ($6,400) (59,500) ($9.100) ($9,200)
(3) Associate Professor $29,900 $32,700 $31,900 $36,300 $38,200 $38,300 $38,700 $38,300 $40,600 $43,100
a. Diff from Comp Nat Ave (h1A) ($600) $600 ($1,900) ($300) ($400) ($2,500) ($3,800) ($7,900) ($8,800)
b. Diff from Bacc Nat Ave (IIB) $1,800 $2,300 $500 $2,300 $1,900 $100 ($700) ($3,600) ($3,600)
c. Difference from Peer Grp Ave ($700) ($1,200) ($1,600) ($200) $0 ($2,700) ($5,300) ($8,000) ($7,200) ($7,300)
(4) Assistant Professor $25,800 $28,700 $28,600 531,700 $33,200 $34,000 $34,100 $34,600 $36,300 $38,600
a. Diff from Comp Nat Ave (IIA) 5900 52,300 5600 51,600 51,400 5300 ($700) (53.700) (54,500)
b. Diff from Bacc Nat Ave (1113) $2,200 $3,200 52,100 53,200 $2,900 $2,400 $1,200 ($300) ($700)
c. Difference from Peer Grp Ave $300 $500 $600 $1,100 $1,000 ($500) ($2.500) ($4,100) (53,800) (53,700)
(5) Instructor $20,200 $22,800 $23,500 $25,700 $25,000 $27,800 $26,300 $27,000 528,200 530,000
a. Diff from Comp Nat Ave (IIA) $100 $1,800 $300 $1,600 ($500) $1,400 ($600) ($2,900) ($3,200)
b. Diff from Bacc Nat Ave (IIB) $1,200 $1,200 $1,300 12,600 $500 $1,600 ($500) ($1,300) ($2,100)
c. Difference from Peer Grp Ave ($1,600) $0 $700 $500 ($1,100) ($100) ($3,600) ($3,200) ($3,900) (13,800)
12. SOUTHERN UTAH UNIVERSITY
(1) All Ranks Combined $28,200 $30,300 $30.600 $33,200 $35,200 $35,200 $37,000 $37,100 $38,800 $41,200
a. Diff from Comp Nat Ave (IIA) ($2,400) ($2,000) ($3,700) ($3,800) ($3,900) ($6,300) ($6,000) ($9,800)($10,900)
b. Diff from Bacc Nat Ave (118) $1,600 $1,300 $700 $700 $600 ($900) ($700) (53,200) (33,800)
c. Difference from Peer Grp Ave ($900) ($4,200) ($3,800) ($4,400) ($4,300) ($7,000) ($7,900) ($9,800)($10,400)($10,600)
(2) Professor 534,200 536,600 536,100 $39,900 543,100 543,200 545,500 145,300 $47,200 $50,000
a. Diff from Comp Nat Ave (IIA) (54,300) ($3,500) ($6.000) ($6,000 ($5,100) ($8,000) ($7,900)($12,000)($13,800)
b. Diff from Bacc Nat Ave (118) $200 $300 ($1,600) ($800) ($100) ($1,600) ($1,200) ($4,600) ($6,000)
c. Difference from Peer Grp Ave ($1,200) ($4,400) ($4,900) ($4,800) ($3,800) ($6,500) ($7,400)($10,400)($10,100)($10,400)
(3) Associate Professor 527,900 531,000 531,500 $33,000 $35,100 535,100 536,900 $36,800 539,500 541,900
a. Diff from Comp Hat Ave (IIA) (52,600) ($1,100) ($2,300) ($3,600) (53,500) (55,700) (55,600) ($9,400) ($9,900)
b. Diff from Bacc Nat Ave (118) (5200) 5600 $100 ($1,000) (51,200) (53,100) (52,500) ($5,100) ($4,700)
c. Difference from Peer Grp Ave ($1,300) ($2,900) ($2,000) ($3,500) ($3,100) ($5,900) ($7,100) ($9,500) ($8,300) (58,500)
(4) Assistant Professor $24,300 325,800 326,200 $28,800 $29,600 $30,900 $31,000 $32,400 $33,500 535,500
a. Diff from Comp Nat Ave (IIA) ($600) ($600) ($1,800) ($1,300) ($2,20C) ($2,800) ($3,800) ($5,900) ($7,300)
b. Diff from Bacc Nat Ave (IIB) $700 $300 ($300) $300 ($700) ($700) ($1,900) ($2,500) ($3,500)
c. Difference from Peer Grp Ave ($1.000) ($2,400) ($1,800) ($1,800) ($2,600) ($3,600) ($5,600) ($6,300) ($6,600) ($6,800)
(5) Instructor $21,400 $23,100 $22,700 $26,800 526,400 526,900 $27,000 529,600 532,800 534,800
a. Diff from (Amp Nat Ave (IIA) $1,300 $2,100 (5500) 52,700 5900 5500 5100 (5300) $1,400
b. Diff from Bv.c Nat Ave (IIB) $2,400 51,500 $500 $3,700 51,900 5700 $200 $1,300 $2,500
c. Difference from Peer Grp Ave 5100 5300 (5100) 51,600 $300 ($1,000) ($2,900) (5600) 5700 $1,000

90FacRev COMPARATIVE RECENT HISTORY OF FACULTY SALARIES AND COMPENSATION IN UTAH PUBLIC HIGHER EDUCATION
TABLE 2 -- TOTAL COMPENSATION
2I-Dec-90
Page 2-E
Estimated
1981-82 1982-83 1983-84 1984-85 1985-86 1986-87 1987-88 1988-89 1989-90 1990-91
13. Institutions Without Academic Ranks--IV Estimated
Essentially All Two-Year Institutions
(1) All Faculty Combined $27,000 $29,300 $29,156 $30,200 534,700 $37,800 $35,600 $38,200 142,300
14. Metro Community College Peer Grp * I
(1) All Faculty Combined N/A $31,457 $32,502 $35,900 $37,900 $38,300 $41,300 $44,000 $45,400 $47.800
15. Rural Community College Peer Grp ** PP @@
(1) All Faculty Combined N/A $29,788 $31,427 $35,900 $37,900 $38,300 $41,300 $44,000 545,400 547,800
16. Snow College ** II
(1) All Faculty Combined $25,400 $28,000 $28,400 $30,800 $33,400 $33,900 $35,900 $34,600 $37,700 $41,300
a. Diff from National Ave (IV) ($1,600) ($1,300) ($756) $600 (51,300) ($3,900) $300 ($3,600) ($4,600)
b. Difference from Peer Grp Ave ($1,788) ($3,027) ($5,100) ($4,500) ((4,400) ($5,400) ($9,400) ($7.700) (56,500)
17. Dixie College
(1) All Faculty Combined $27,000 $30,400 $29,300 $31,700 $33,200 $33,400 $33,700 $34,100 $35,800 $37,800
a. Diff from National Ave (IV) SO $1,100 $144 $1,500 ($1,500) ($4,400) (51.900) ($4,100) ($6,500)
b. Oifference from Peer Grp Ave $612 ($2,127) ($4,200) ($4,700) ($4,900) ($7,600) ($9,900) ($9,600)($10,000)
18. College of Eastern Utah
(1) All Faculty Combined 524,800 528,800 $27,900 $30,600 $32,000 $33,100 $33,800 $34,600 $35,700 $38,500
a. Diff from National Ave (IV) ($2,200) ($500) ($1,256) $400 ($2,700) ($4,700) ($1,800) ($3,600) ($6,600)
b. Difference from Peer Grp Ave ($988) ($3,527) ($5,300) ($5,900) ($5,200) ($7,500) ($9,400) ($9,700) ($9,300)
19. Utah Valley Community College
(1) All Faculty Combined $26,300 $29,300 $28,800 $32,000 534,400 $34,700 $36,000 $36,800 $38,800 $41,100
a. Diff from National Ave (IV) ($700) $O ($356) $1,800 ($300) ($3,100) $400 ($1,400) ($3,500)
b. Difference from Peer Grp Ave ($2,157) ($3,702) ($3,900) ($3,500) ($3,600) ($5,300) ($7,200) ($6,600) ($6,700)
20. Salt Lake Community College
(1) All Faculty Combined $26,000 $28,600 $28,300 $31,100 $33,100 $32,700 $34,400 $34,800 $38,100 $38,300
a. Diff from National Ave (IV) (51.000) ($700) ($856) $900 ($1,600) ($5,100) ($1,200) ($3,600) ($6,200)
b. Difference from Peer Grp Ave ($2,857) ($4,202) ($4,800) ($4,800) ($5,600) ($6.900) ($9,400) ($9,300) ($9,500)
oPeer Group, prior to 1982-83: Clark Co CC (NV); Chemeketa CC (OR); College of Southern Idaho; CC of Denver (CO);
Des Moines Area CC (IA); Lee College (TX); Maricopa Co CC (AZ); North Dakota State School of Science;
North Hennepin CC (MN); Penn Valley CC (MO); Pikes Peak CC (CO); Central Arizona College; Olympia Technical CC (WA);
Western Nevada CC.
IPeer Group, 1982-83 to 1988-89: Ann Arundel CC (MD); Austin CC (TX); Bergen CC (MD); Chemeketa CC (OR);
Clark Co CC (NV); College of Southern Idaho; Delaware CC (PA); Madison Area Tech Col (WI); Mount Hood CC (OR);
North Seattle CC (WA); Spokane CC (WA; [San Diego City College (CA)--1982-83 only].
*Peer Group, prior to 1982-83: Big Bend CC (WA); Blue Mountain CC (OR;; Colorado Mt JC (CO); Flathead Valley CC (MT);
Miles CC (MT); Northern Nevada CC; North Idaho College; Northwest CC (WY);Northwestern JC (CO); Treasure Valley CC (OR);
Wenatchee Valley CC (WA); Western Wyoming CC.
II Peer Group, 1982-83 and 1983-84: [Big Bend CC (WA)--1982-83 only]; Blue Mountain CC (OR);
College of the Siskiyous (CA); North Central Michigan College; Northeastern JC (CO); North Idaho College;
Northwest CC (WY); Treasure Valley CC (OR); Wenatchee Valley College (WA); Western Texas College;
Western Wyoming College; Yavapai College (AZ).
@Peer Group, 1984-85 to 1988-89: Metro Group used for faculty compensation and tuition and fee comparisons.
-Peer Group for All Community Colleges, 1989-90 and subsequent years: Western Wyoming Community College;
Danville Community College (VA); Yavapai College (AZ); North Idaho College; Joliet Junior College (IL);
Chemeketa Community College (OR); Anne Arundel Community College (MD); Spokane Community College (WA);
Onandaga Community College (NY); Grand Rapids Jr College (MI).
ci ;
20
BEST COPY AVAILABLE

90FacRev COMPARATIVE RECENT HISTORY OF FACULTY SALARIES AND COMPENSATION IN UTAH PUBLIC HIGHER EDUCATION 21-Dec-90
1. Research Univ--Carnegie Class 1 and 2
(1) All Ranks Combined
(2) Professor
(3) Associate Profe..or
(4) Assistant Professor
(5) Instructor
2. Research Universities-Carnegle Class 1
(I) All Ranks Combined
(2) Professor
(3) Associate Professor
(4) Assistant Professor
(5) Instructor
3. University of Utah Peer Group * @
(1) All Ranks Combined
(2) Professor
(3) Associate Professor
(4) Assistant Professor
(5) Instructor
TABLE 3 -- SALARIES Page 3-A
IN 1990 CONSTANT DOLLARS
1981-82
$40,900
$51,700
$38,300
$31,200
$24,400
$41,900
$53,200
$38,900
$31,800
$24,800
$44,300
$53,600
$39,300
$31,900
$25,800
4. UNIVERSITY OF UTAH
(1) All Ranks Combined $41,300
a. Diff from Res U 1+2 National Ave $400
b. Diff from Res Unv 1 National Ave ($600)
c. Difference from Peer Grp Ave ($3,000)
(2) Professor $50,000
a. Diff from Res U 1+2 National Ave ($1,700)
b. Dlff from Res unv I National Ave ($3,200)
c. Difference from Peer Grp Ave ($3,600)
(3) Associate Professor $36,400
a. Diff from Res U 1+2 National Ave ($1,900)
b. Diff from Res Unv 1 National Ave ($2,500)
c. Difference from Peer Grp Ave ($2,900)
(4) Assistant Professor $29,800
a. Diff from Res U 1+2 National Ave ($1,400)
b. Diff from Res Unv 1 National Ave ($2,000)
c. Difference from Peer Grp Ave ($2,100)
(5) Instructor $25,400
a. Diff from Res U 1+2 National Ave $1,000
b. Diff from Res Unv 1 National Ave $600
c. Difference from Peer Grp Ave ($400)
Estimated
1982-83 1983-84 1984-85 1985-86 1986-87 1987-88 1988-89 1989-90 1990-91
$42,400 $41,900 $43,800 $45,100 $47,700 $47,700 $48,500 $49,100
$53,100 $52,400 $54,600 $56,300 $59,200 $59,300 $60,400 $61,000
$39,400 $38,600 $40,200 $41,400 $43,700 $43,700 $44,500 $44,800
$32,300 $32,000 $34,000 $35.200 $37,000 $37,000 $37,700 $38,000
$...5,400 $25,000 $25,300 $26,600 $27,400 $28,200 $27,900 $27,900
$43,800 $43,400 $45,200 $46,800 $49,700 $49,700 $50,600 $50,900
$54,800 $54,400 $56,500 $58,600 $61,800 $62,000 $63,100 $63,400
$40,100 $39,600 $41,000 $42,400 $45,000 $44,700 $45,600 $45,700
$32,800 $32,900 $34,500 $35,900 $38,200 $38,100 $38,900 $39,000
$26,400 $25,800 $26,000 $27,000 $28,000 $28,600 $28,500 $28,400
$44,500 $45,800 $47,100 $48,700 $51,700 $53,200 $53,500 $54,000 $53,700
$55,600 $56,100 $57,800 $59,700 $63,400 $65,100 $65,700 $65,800 $65,500
$40,500 $40,500 $41,200 $42,400 $44,700 $45,800 $46,400 $47,500 $47,200
$32,700 $33,500 $34,500 $35,900 $38,100 $38,900 $39,600 $40,900 $40,700
$24,700 $25,300 $25,200 $26,200 $27,200 $27,400 $27,000 $30,400 $30,200
$43,200 $41,800 $43,800 $44,700 $44,400 $44,700 $43,800 $44,600 $44,800
$800 ($100) $0 ($400) ($3,300) ($3,000) ($4,700) ($4,500)
($600) ($1,600) ($1,400) ($2,100) ($5,300) ($5,000) ($6,800) ($6,300)
($1,300) ($4,000) ($3,300) ($4,000) ($7,300) ($8,500) ($9,700) ($9,400) ($8,900)
$52,600 $50,500 $52,900 $54,200 $54,000 $54,200 $53,300 $54,000 $54,200
($500) ($1,900) ($1,700) ($2,100) ($5,200) ($5,100) ($7,100) ($7,000)
($2,200) ($3,900) ($3,600) ($4,400) ($7,800) ($7,800) ($9,800) ($9,400)
($3,000) ($5,600) ($4,900) ($5,500) ($9,400)($10,900)($12,400)($11,800)($11,300)
$38,000 $36,500 $37,900 $38,400 $38,300 $39,200 $38,100 $39,000 $39,100
($1,400) ($2,100) 02,300) ($3,000) ($5,40C. ($4,500) ($6,400) ($5,800)
($2,100) ($3,100) ($3,100) ($4,000) ($6,7001 ($5,500) ($7,500) ($6,700)
($2,500) ($4,000) ($3,300) ($4,000) ($6,400) ($6,600) ($8,300) ($8,500) ($8,100)
$30,600 $29,900 $32,300 $34,000 $34,000 $34,100 $34,500 $35,400 $35,500
($1,700) ($2,100) ($1,700) ($1,200) ($3,000) ($2,900) ($3,200) ($2,600)
($2,200) ($3,000) ($2,200) ($1,900) ($4,200) ($4,000) ($4,400) ($3,600)
($2,100) ($3,600) ($2,200) ($1,900) ($4,100) ($4,800) ($5,100) ($5,500) ($5,200)
$25,800 $25,100 $26,600 $28,300 $27,400 $28,900 $29,200 $28,200 $28,300
$400 $100 $1,300 $1,700 $0 $700 $1,300 $300
($600) ($700) $600 $1,300 ($600) $300 $700 ($200)
$1,100 ($200) '$1,400 $2,100 $200 $1,500 $2,200 ($2,200) ($1,900)
*Peer Group, Prior to 1982-83: University of Arizona; University of Southern California; University of Colorado (Boulder);
University of Florida; University of Iowa; University of Kentucky; University of North Carolina (Chapel Hill);
University of Oklahoma; University of Pittsburgh; University of Virginia.
Peer Group, 1982-83 to 1988-89: University of Arizona; University of California, Los Angeles;
University of Cincinnati; University of Colorado (Boulder); University of Iowa; University of Michigan;
University of North Carolina; University of Pittsburgh; Purdue University; University of Texas (Austin);
University of Virginia; University of Washington.
Peer Group, 1989-90 and subsequent years: University of Iowa; University of Virginia (MC); University of Colorado (Boulder);
University of Cincinnati (MC); University of Washington; University of North Carolina (Chapel Hill); Purdue University (MC);
University of Florida; University of California (Los Angeles); University of Arizona.

90FacRev COMPARATIVE RECENT HISTORY OF FACULTY SALARIES AND COMPENSATION IN UTAH PUBLIC HIGHER EDUCATION 21-Dec-90
5. Utah State University Peer Group 0
(1) All Ranks Combined
(2) Professor
(3) Associate Professor
(4) Assistant Professor
(5) Instructor
6. UTAH STA UNIVERSITY
(1) All Ranks Combined
a. Diff from Res U 1+2 National Ave
b. Diff from Res Unv I National Ave
c. Difference from Peer Grp Ave
TABLE 3 -- SALARIES
IN 1990 CONSTANT DOLLARS
1981-82 1982-83 1983-84 1984-85
$40,500 $42,000 $42,500 $43,300
$49,600 $53,000 $53,600 $54,600
$38,100 $39,700 $40,100 $40,500
$31,200 $32,400 $32,900 $33,200
$23,800 $25,300 $23,800 $23,700
Page 3-8
Estimated
1985-86 1986-87 1987-88 1988-89 1989-90 1990-91
$45,200 $48,100 $49,000 $49,600
$56,900 $60,500 $61,400 $62,500
$41,800 $44,400 $45,200 $45,800
$34,800 $37,200 $37,700 $38,300
$24,400 $25,500 $25,500 $25,700
$49,700
$62,100$45,400
$38,100
$26.000
$49,300
$61,500
$45,000
$37,800
$25,900
$36,200 $37,500 $36,600 $38,700 $39,800 $40,000 $39,500 $37,700 $37,700 $37,500
($4,700) ($4,900) ($5,300) ($5,100) ($5,300) ($7,700) ($8,200)($10,800)($11,400)
($5.700) ($6,300) ($6,800) ($6,500) ($7,000) ($9,700)($10,200)(512,900)($13,200)
($4,300) ($4,500) ($5,900) ($4,600) ($5,400) ($8,100) ($9,500)($11,900)($12,000)($11,800)
(2) Professor $44,500
a. Diff from Res V 1+2 National Ave ($7,200)
b. Diff from Res Unv 1 National Ave ($8.700)
c. Difference from Peer Grp Ave ($5,100)
(3) Associate Professor $34;800
a. Diff from Res U 1+2 National Ave ($3,500)
b. Diff from Res Unv 1 National Ave ($4,100)
c. Difference from Peer Grp Ave ($3,300)
$46,000 $44,200 $46,800 $47,900 $49,000 $48,200 $46,100 $46,100 $45,800
($7,100) ($8,200) ($7,800) ($8,400)($10,200)($11,100)($14,300)($14,900)
($8,800)($10.200) ($9.700)($10,700)($12,800)($13,800)($17,000)($17,300)($7,000) ($9,400) ($7,800) ($9,000)($11,500)($13,200)($16,400)($16,000)(S15,700)
$35,400 $35,100 $37,000 $38,500 $38,400 $38,300
($3,000) ($3,500) ($3,200) ($2,900) ($5,300) (15,400)
($3,700) ($4,500) ($4,000) ($3,900) ($6,600) ($6,400)
($3,300) ($5,000) ($3,500) ($3,300) ($6,000) ($6,900)
(4) Assistant Professor $28,100 $29,900
a. Diff from Res U 1+2 National Ave ($3,100) ($2,400)
b. Diff from Res Unv 1 National Ave ($3,700) ($2,900)
c. Difference from Peer Grp Ave ($3,100) ($2,500)
(5) Instructor $22,700 $24,400
a. Diff from Res U 1+2 National Ave ($1,700) ($1,000)
b. Diff from Res Unv 1 National Ave ($2,100) ($2,000)
c. Oifference from Peer Grp Ave ($1,100) ($900)
$29,200 $30,900
($2,800) ($3,100)
($3,700) ($3,600)($3,700) ($2,300)
$25,400 $26,700
$400 $1,400
($400) $700
$1,600 $3,000
$31,600 $31,500 $31,800
($3,600) ($5,500) ($5,200)
($4,300) ($6,700) ($6,300)
($3,200) ($5,700) ($5,900)
$36,700 $36,700 $36,400
($7,800) ($8,100)
($8,900) ($9,000)
($9,100) ($8,700) ($8,600)
$30,400 $31,000 $30,800
($7,300) ($7,000)
($8,500) ($8,000)
($7,900) ($7,100) ($7,000)
$26,800 $27,300 $26,100 $26,200 $26,900 $26,700
$200 ($100) ($2,100) ($1,700) ($1,000)
($200) ($700) ($2,500) ($2,300) ($1,500)
$2,400 $1,800 $600 $500 $900 $800
'Peer Group, prior to 1982-83: Colorado State University; Iowa State University; Kansas State University;
New Mexico State University; North Carolina State University (Raleigh); Oklahoma State University; Oregon State
University; Texas A & M University; Virginia Tech University; Washington State University.
/Peer Group, 1982-83 to 1988-89: University of California, Davis; Colorado State University;
University of Connecticut; Iowa State University; New Mexico State University; North Carolina State University;
Oregon State University; Pennsylvania State University; Rutgers University;. Texas A & M University;
Virginia Tech University; Washington State University.
@Peer Group, 1989-90 and subsequent years: New Mexico State University (MC); Oregon State University; Washington State University;
Colorado State University; North Carolina State University (Raleigh); Iowa State University; University of Maryland (College Park);
Virginia Tech University; Texas A&M University; University of California (Davis).

90FacRev COMPARATIVE RECENT HISTORY OF FACULTY SALARIES AND COMPENSATION IN UTAH PUBLIC HIGHER EDUCATION
7. Comprehensive Institutions--IIA
(1) All Ranks Combined
(2) Professor
(3) Associate Professor
(4) Assistant Professor
(5) Instructor
8. Gen Baccalaureate Institutions--IIB
(1) All Ranks Combined
(2) Professor
(3) Associate Professor
(4) Assistant Professor
(5) Instructor
TABLE 3 -- SALARIES
IN 1990 CONSTANT COLLARS
21-0ec-90
Page 3-C
Estimated
1981-82 1982-83 1983-84 1984-85 1985-86 1986-87 1987-88 1988-89 1989-90 1990-91
$36,100 $36,900 $37,300 $38,000 $39,400 $41,400 $41,000 $42,400 $42,600
$45,200 $46,000 $45,800 $47,200 $48,700 $51,300 $53,500 $52,200 $52.700
$35,900 $36,800 $36,800 $37,700 $38,700 $40,400 $40,300 $41,600 $42,200
$29,700 $30,200 $30,400 $31,100 $31,900 $33,300 $33,000 334,400 $34,700
$24,100 $24,300 $25,300 $24,900 $25,500 $26,200 $25,300 $26,700 $26,700
$32,200 $33,600 $33,200 $34,200 $34,800 $36,000 $36,100 $36,600 $36,600
$41,200 $42,300 $41,800 $43,100 $43,600 $44,700 $44,900 $45,700 $46,000
$33,900 $35,000 $34,800 $35,900 $36,500 $37,800 $37,600 $38,100 $38,100
$28,700 $29,700 $29,400 $29,900 $30,500 $31,400 $31,500 $31,600 $31,600
$23,100 $25,000 $24,600 $24,200 $24,600 $26,200 $25,400 $25,600 $25,700
9. Weber State University Peer Group * I @
(1) All Ranks Combined 535,400 $38,400 $38,100 $38,800 $39,700 $42,100 $42.700 $42,400 $41,700 $41,300
(2) Professor $43,600 $45,700 $45,400 $46,100 $47,200 $49,800 $50,600 $50,600 $49,300 $48,900
(3) Associate Professor $35,800 $37,800 $37,300 $37,800 $38,400 $40,900 $41,700 $41,700 $39,400 $39,100
(4) Assistant Professor $29,800 $31,400 $31,000 $31,400 $32,200 $34,200 $34,600 $34,700 $34,100 $33,800
(5) Instructor $25,200 $25,400 $25,300 $25,700 $26,100 $27,400 $28,100 $26,800 $26,900 $26,700
10. So Utah University Peer Grp
(1) All Ranks Combined
(2) Professor
(3) Associate Professor
(4) Assistant Professor
(5) Instructor
11, 00 98
$34,800 $38,400 $38,100 $38,800 $39,700 $42,100 $42,700 $42,400 $41,700 $41,300
$42,600 $45,700 $45,400 $46,100 $47,200 $49,800 $50,600 $50,600 $49,300 $48,900
$34,800 $37,800 $37,300 $37,800 $38,400 $40,900 $41,700 $41,700 $39,400 $39,100
$30,100 $31,400 $31,000 $31,400 $32,200 $34,200 $34,600 $34,700 $34,100 $33,800
$25,100 $25,4G. $25,300 $25,700 $26,100 $27,400 $28,100 326,800 $26,900 $26,700
*Peer Group, prior to 1982-83: University of Colorado at Colorado Springs; Metropolitan State College (Denver);
Boise State University; Indiana University, Northwest; University of Northern Iowa; Boston State College (MA);
Ferris State College (MI); Jersey City State College (NJ); Southern Oregon State College; West Chester University (PA);
Pan American University (TX); Central Washington University; University of Wisconsin, Oshkosh.
OPeer Group, 1982-83 to 1988-89: Boise State University (ID); University of California, Hayward;
Eastern Washington University; Jersey City State College (NJ); Metropolitan State College (CO);
University of Nevada, Las Vegas; University of Northern Arizona; University of Northern Iowa; Portland State University
(OR); State University of New York, College at Brockport; West Chester University (PA); University of Wisconsin, Oshkosh.
@Peer Group, 1989-90 and subsequent years: Indiana Univeristy Northwest; University of Southern Colorado;
Southern Oregon State College; Austin Peay State Univerity (TN); California State Univeristy (Dominguez Hills);
Eastern Washington University; Boise State University (ID); SUNY College at Brockport; University of Nevada (Las Vegas);
University of Wisconsin, Oshkosh.
**Peer Group, prior to 1982-83: Adams State College (CO); Fort lewis College (CO); Delaware State College (DE);
Lewis and Clark State College (ID); Indiana State University, Evansville; New Mexico Highlands University;
Pembroke State University (NC); Southwest State University (MN); Central State University (OH); Lock Haven University
(PA); Southern Oregon State College.
00Peer Group, 1982-83 to 1988-89: WSU group used for salary and tuition comparison purposes.
@Peer Group, 1989-90 and subsequent years: WSU group used for salary and tuition comparison purposes.
BEST COPY AVAILABLE
I
2 3

90FacRev COMPARATIVE kcCENT HISTORY OF FACULTY SALARIES AND COMPENSATION IN UTAH PUBLIC HIGHER EDUCATION 2I-Dec-90
11. WEBER STATE UNIVERSITY
(I) All Ranks Combined
a. Diff from Comp Nat Ave (IIA)
b. Diff from Bacc Nat Ave (IIB)
c. Difference from Peer Grp Ave
(2) Professora. Diff from Comp Nat Ave (IIA)
b. Diff from Bacc Nat Ave (IIB)
c. Difference from Peer Grp Ave
(3) Associate Professor
a. Diff from Comp Nat Ave (IIA)
b. Diff from Bacc Nat Ave (IIB)
c. Difference from Peer Grp Ave
(4) Assistant Professor
a. Diff from Comp Nat Ave (IIA)
b. Diff from Bacc Nat Ave (IIB)
c. Difference from Peer Grp Ave
(5) Instructor
a. Diff from Comp Nat Ave (IIA)
b. Diff from Bacc Nat Ave (IIB)
c. Difference from Peer Grp Ave
12. SOUTHERN UTAH UNIVERSITY
(1) All Ranks Combined
a. Diff from Comp Nat Ave (IIA)
b. Diff from Bacc Nat Ave (IIB)
c. Difference from Peer Grp Ave
(2) Professor
a. Diff from Comp Nat Ave (IIA)
b. Diff from Bacc Nat Ave (IIB)
c. Difference from Peer Grp Ave
(3) Associate Professor
a. Diff from Comp Nat Ave (IIA)
U. Diff from Boa Nat Ave (118)
c. Difference from Peer Grp Ave
(4) Assistant Professor
a. Diff from Comp Nat Ave (IIA)
U. Diff from Bacc Nat Ave (II8)
c. Difference from Peer Grp Ave
(5) Instructora. Diff from Comp Nat Ave (IIA)
U. Diff from Bacc Nat Ave (II8)
c. Difference from Peer Grp Ave
TABLE 3 -- SALARIES
IN 1990 CONSTANT DOLLARS
Page 3-D
Estimated
1981-82 1982-83 1983-84 1984-85 1985-86 1986-87 1987-88 1988-89 1989-90 1990-91
933,500 934,500 933,200 935,000 935,200 $35,700 933,600 932,400 932,200 932,200
($2,600) ($2,400) ($4,100) ($3,000) ($4,200) ($5,700) ($7,400)($10,000)($10,400)
$1,300 $900 $0 $800 $400 ($300) ($2,500) ($4,200) ($4,400)
($1,900) ($3,900) ($4,900) ($3,800) ($4,500) ($6,400) ($9,100)($10,000) ($9,500) (0,100)
$40,600 $41,900 $40,100 $42,800 $42,700 $43,000 $40,900 $39,400 938,900 938.900
($4,600) ($4,100) ($5,700) ($4,400) ($6,000) ($8,300)($12,600)($12,800)($13,800)
($600) ($400) ($1,700) ($300) ($900) ($1,700) ($4,000) ($6,300) ($7,100
($3,000) (0,800) ($5,300) ($3,300) (94,500 (96,800) ($9,700)($11,200)($10,400)($10,000)
$33,900 $35,000 02,900 $35,600 936,000 $35,700 $34,000 $32,200 532.500 02.500
($2,000) ($1,800) ($3,900) ($2,100) ($2,700) ($4,700) (56,300) ($9,400) ($9,700)
$O SO ($1,900) ($300) (1500) ($2,100) ($3,600) ($5,900) ($5,600)
($1,900) (12,800) (94,400) (92,200) ($2,400) ($5,200) ($7,700) (59,500) ($6,900) (96,600)
$29,100 $30,600 $29,400 930,900 $31,600 $31,200 $30,000 $29,000 $28,900 $28,900
($600) 1400 ($1,000) ($200) ($300) ($2,100) ($3,000) ($5,400) ($5,800)
$400 $900 $0 $1,000 $1,100 ($200) ($1,500) ($2,600) ($2,700)
($700) ($800) ($1,600) ($500) ($600) ($3,000) ($4,600) ($5,700) ($5,200) ($4,900)
$22,700 $24,000 923,800 04,900 $23,700 $25,300 $23,100 $22,400 $22,100 $22,100
($1,400) ($300) 01,500 $0 ($1,800) ($900) ($2,200) ($4,300) ($4,600)
($400) ($1,000) ($800) $700 (000) ($900) ($2,300) ($3,200) ($3,600)
($2.500) ($1,400) ($1,500) ($800) ($2,400) ($2,100) ($5,001) ($4,400) ($4,800) ($4,600)
$31,600 $31,400 $30,600 $32,500 $33,200 932,600 932,600 930,900 $30,800 930,700
($4,500) ($5,500) ($6,700) ($5,500) ($6,200) ($8,800) ($8,400)($11,500)(S11,800)
($600) (92,200) (92,600) ($1,700) ($1,600) ($3,400) ($3,500) ($5,700) ($5,800
($3,200) (97,000) ($7,500) (56,300) ($6,500) ($9,500)($10,100)($11,500)($10,900)(S10,600)
$39,100 $38,600 $36,600 939,200 940,600 940,400 $40,200 938,500 937,700 $37,600
($6,100) ($7,400) ($9,200) ($8,000) ($8,100)($10,900)($13,300)($13,700)($15,000)
($2,100) ($3,700) ($5,200) ($3,900) ($3,000) ($4,300) ($4,700) ($7,200) (0,300)
($3,500) ($7,100) ($8,800) ($6,900) ($6,600) ($9,400)($10,400)($12,100)($11,600)($11,300)
$30,600 $31,700 $31,100 $32,500 $33,100 $32,500 $32,500 $30,800 $31,300 931,300
($5,300) ($5,100) ($5,700) ($5,200) ($5,600) ($7,900) ($7,800)($10,800)($10,900)
($3.300) ($3,300) (93.700) ($3,400) ($3,400) ($5,300) ($5,100) ($7,300) ($6,800)
($4,200) ($6,100) ($6,200) ($5,300) ($5,300) ($8,400) ($9,200)($10,900) ($8,100) ($7,800)
$27,200 $26,900 $26,300 $28,000 927,800 $28,500 527,300 926,500 $26,700 226,600
(92,500) ($3,300) ($4,100) ($3,100) ($4,100) ($4,800) ($5,700) ($7,900) ($8,000)
($1,500) ($2,800) ($3,100) (91,900) ($2,700) ($2,900) ($4,200) ($5,100) ($4,900)
($2,900) ($4,500) ($4,700) ($3,400) ($4,400) ($5,700) ($7,300) ($8,200) ($7,400) ($7,200)
$24,700 $23,800 $22,500 $24,900 $24,900 924,500 923,800 924,000 $24,800 $24,700
$600 ($500) ($2,800) $0 ($600) ($1,700) ($1,500) (92,700) ($1,900)
$1,600 ($1,200) ($2,100) $700 $300 (91,700) (51,600) (91,600) (9900)
($400) ($1,600) ($2.800) ($800) ($1,200) ($2.900) ($4,300) ($2,800) (0,100) ($2,000)

1
1
a
90FacRevCOMPARATIVE RECENT HISTORY OF FACULTY SALARIES ANO COMPENSATION IN UTAH PUBLIC HIGHER EDUCATION 21-Dec-90
TABLE 3 -- SALARIES
IN 1990 CONSTANT DOLLARS
Page 3-E
Estimate°
1981-82 1982-83 1983-84 1984-85 1985-86 1986-87 1987-88 1988-89 1989-90 1990-91
13. Institutions Without Academic Ranks--IV
Essentlaily All Two-Year Institutions
(1) All Faculty Combined $32,800 $34,300 $32,300 $31,600 $35,100 $38,100 $33,800 $34,700 $36,700
14. Metro Community College Peer Grp * "
(1) All Faculty Combined N/A $35,300 $36,000 $36,500 $36,900 $37,700 $37,900 $38,100 $37,700 $37,500
15. Rural Community College Peer Grp ** II
(1) All Faculty Combined N/A $33,100 $33,200 $36,500 $36,900 $37,700 $37,900 $38,100 $37,700 $37,500
16. Snow College ** Of
(1) All Faculty Combined $28,700 $29,500 $28,800 $29,700 $31,000 $31,200 $31,500 $29,200 $29,300 $30,200
a. Diff from National Ave (IV) ($4,100) ($4,800) ($3,500) ($1,900) ($4,100) ($6,900) ($2,300) ($5,500) ($7,400)
0. Difference from Peer Grp Ave ($3,800) ($4,400) ($6,800) ($5,900) ($6,500) ($6,400) ($8,900) ($8,400) ($7,300)
17. Dixie College
(1) All Faculty Combined $30,100 $31,600 $29,400 $31,200 $31,500 $31,200 $30,000 $28,700 $26,400 $26,200
a. Diff from National Ave (IV) ($2,700) ($2,700) ($2,900) ($400) ($3,600) ($6,900) ($3,800) ($6,000) ($8,300)
b. Difference from Peer Grp Ave ($1,500) ($3,800) ($5,300) ($5,400) ($6,500) ($7,900) ($9,400) ($9,300) ($9,300)
18. College of Eastern Utah
(1) All Faculty Combined $28,500 $30,500 $28,400 $29,500 $30,000 $31,200 $29,700 $28,000 $27,700 $28,100
a. Diff from National Ave (IV) ($4,300) ($3,800) ($3,900) ($2,100) ($5,100) ($6,900) ($4,100) ($6,700) ($9,000)
b. Difference from Peer Grp Ave ($2,600) ($4,800) ($7,000) ($6,900) ($6,800) ($8,200)($10,100)($10,000) ($9,400)
19. Utah Valley Community College
(1) All Faculty Combined $29,400 $30,200 $28,600 $31,100 $32,500 $32,300 $31,900 $30,700 $30,400 $30,300
a. Diff from National Ave (IV) ($3,400) ($4,100) ($3,700) ($500) ($2,600) ($6,800) ($1,900) ($4,000) ($6,300)
b. Difference from Peer Grp Ave ($5,100) ($7,400) ($5,400) ($4,400) ($5,400) ($6,000) ($7,400) ($7,300) ($7,200)
20. Salt Lake Community College
(1) All Faculty Combined $29,400 $29,700 $28,300 $30,300 $31,000 $30,100 $30,000 $28,500 $27,900 127,900
a. Diff from National Ave (IV) ($3,400) ($4,600) ($4,000) ($1,300) ($4,100) ($8,000) ($3,800) ($6,200) ($8,800)
b. Difference from Peer Grp Ave ($5,600) ($7,700) ($6,200) ($5,900) ($7,600) ($7,900) ($9,600) ($9,803) ($9,600)
*Peer Group, prior to 1982-83: Clark Co CC (NV); Chemeketa CC (OR); College of Southern Idaho; CC of Denver (CO);
Des Moines Area CC (IA); Lee College (TX); Maricopa Co CC (AZ); North Dakota State School of Science;
North Hennepin CC (MN); Penn Valley CC (MO); Pikes Peak CC(CO); Central Arizona College; Olympia Technical CC (WA);
Western Nevada CC.
tPeer Group, 1982-83 to 1988-89: Ann Arundel CC (MD); Austin CC (TX); Bergen CC (MD); Chemeketa CC (OR);
Clark Co CC (NV); College of Southern Idaho; Delaware CC (PA);Madison Area Tech Col (WI); Mount Hood CC (OR);
North Seattle CC (WA); Spokane CC (WA; [San Diego City College (CA)--1982-83 only].
**Peer Group, prior to 1982-83: Big Bend CC (WA); Blue Mountain CC (OR); Colorado Mt JC (CO); Flathead Valley CC (MT);
Miles CC (MT); Northern Nevada CC; North Idaho College; NorthwestCC (Wre); Northwestern JC (CO); Treasure Valley CC (OR);
Wenatchee Valley CC (WA); Western Wyoming CC.
Of Peer Group, 1982-83 and 1983-84: [Big Bend CC (WA)--1982-83 only]; Blue Mountain CC (OR);
College of the Siskiyous (CA); North Central Michigan College;Northeastern JC (CO); North Idaho College;
Northwest CC (WY); Treasure Valley CC (OR); Wenatchee Valley College (WA); Western Texas College;
Western Wyoming College; Yavapai College (AZ).
Weer Group, 1984-85 to 1988-89: Metro Group used for faculty compensation and tuition and fee comparisons.
-Peer Group for All Community Colleges, 1989-90 and subsequent years:Western Wyoming Community College;
Danville Community College (VA); Yavapal College (AZ); North Idaho College; Joliet Junior College (IL);
Chemeketa Community College (OR); Anne Arundel Community College (MD); Spokane Community College (WA);
2
25

90FacRev COmPARATIVE RECENT HISTORY OF FACULTY SALARIES AND COMPENSATION IN UTAH PUBLIC HIGHER EDUCATION
TABLE 4 -- TOTAL COMPENSATION
IN 1990 CONSTANT DOLLARS
21-Dec-90
Page 4-A
Estimateo
1981-82 1982-83 1983-84 1984-85 1985-86 1986-87 1987-86 1988-89 1989-90 1990-91
Estimated
Researlt '..h.tv--Carnegie Class 1 and 2
(1) Al'. Rank: Combined $48,900 $50,500 $50,400 $53,100 $54,900 $57,800 $57,900 $59,000 $60,100
(2) P:ofessor $61,300 $62,900 $63,000 $65,800 $67,900 $71,400 $71,500 $72,800 $74,100
(3) issociate Professor $45,900 $47,000 $46,400 $49,100 $50,600 $53,400 $53,500 $54,600 $55,500
(4) Assistant Professor $37,500 $38,900 $38,500 $41,400 $42,900 $45,200 $45,500 $46,400 $47,200
(5) Ihntrur:or $29,100 $30,200 $29,600 $31,600 $32,700 $33,800 $33,800 $34,800 $35,100
2. Research Universities-Carnegie Class
(1) All Ranks Combined $50,600 $52,300 $52,400 $55,100 $57,100 $60,300 $60,300 $61,300 $62,300
(2) Professor $63,200 $64,900 $65,600 $68,500 $70,700 $74,600 $74,500 $75,800 $76,800
(3) Associate Professor $46,900 $47,900 $47,800 $50,300 $52,000 $54,900 $54,800 $55,700 $56,400
(4) Assistant Professor $38,300 $39,500 $39,800 $42,500 S44,300 $46,700 $46,800 $47,700 $48,500
(5) Instructor $29,700 $31,300 $30,700 $32,200 $33,5C0 $34,700 $34,600 $35,400 $35,700
3. University of Utah Peer Group $
(1) All Ranks Combined $51,900 $53,700 $54,600 $57,300 $59,200 $62,300 $64,400 $65,500 $66,400 $65,100
(2) Professor $62,600 $67,100 $67,100 $69,600 $72,000 $75,700 $78,100 $79,600 $80,000 $79,700
(3) Associate Professor $46,500 $48,900 $48,400 $50,600 552,100 $54,700 $56,300 $57,500 $59,100 $58,800
(4) Assistant Professor $37,800 $39,400 $39,900 $42,500 $44,100 $46,700 $48,000 $49,300 551,200 850,900
(5) Instructor $30,400 $29,600 $30,200 $31,800 $32,100 $33,000 $33,700 $33,200 $38,100 $37,900
4. UNIVERSITY OF UTAH
(1) All Ranks Combined $51,000 $54,400 $52,500 855,700 $57,100 $56,900 857,200 $56,600 $58,000 $513,200
a. Diff from Res U 1+2 National Ave 82,100 $3,900 $2,100 82,600 $2,200 ($900) ($700) ($2,400) ($2,100)
b. Diff from Res Unv 1 National Ave $400 $2,100 $100 $600 $0 ($3,400) ($3,100) ($4,700) ($4,300)
c. Difference from Peer Grp Ave ($900) $700 ($2,100) ($1,600) ($2,100) ($5,400) ($7,200) ($8,900) ($8,400) ($7,900)
(2) Professor $61,200 $65,500 $63,000 $66,800 $69,300 $68,500 $68,600 $68,200 $69,400 $69,600
a. Diff from Res U 1+2 National Ave ($100) $2,600 $0 $1,000 $1,400 ($2,900) ($2,900) ($4,600) ($4,700)
b. Diff from Res Unv 1 National Ave ($2,000) $600 ($2,600) ($1,700) ($1,400) ($6,100) ($5,900) ($7,600) ($7,400)
c. Difference from Peer Grp Ave ($1,400) ($1,600) ($4,100) ($2,800) ($2,700) ($7,200) ($9,500)($11,400)($10,600)($10,100)
(3) Associate Professor $45,300 $48,200 $46,300 $48,600 $48,900 $49,400 $50,600 $49,700 $51,100 $51,300
a. Diff from Res U 1+2 National Ave ($600) $1,200 ($100) ($500) ($1,700) ($4,000) ($2,900) ($4,900) ($4,400)
b. Diff from Res Unv I National Ave ($1,600) $300 ($1,500) (51,700) ($3,100) ($5,500) ($4,200) ($6,000) ($5,300)
c. Difference from Peer Grp Ave ($1,200) ($700) ($2,100) ($2,000) ($3,200) ($5,300) ($5,700) ($7,800) ($8,000) (5 7.500)
(4) Assistant Professor $37,500 $39,100 $38,200 $41,700 $43,400 844,000 $44,600 $45,300 $46,800 $46,900
a. Diff from Res U 1+2 National Ave SO $200 ($300) $300 $500 ($1,200) ($900) ($1,100) ($400)
b. Diff from Res Unv 1 National Ave ($800) ($400) ($1,600) ($800) ($900) ($2,700) ($2,200) ($2,400) ($1,700)
c. Difference from Peer Grp Ave ($300) ($300) ($1,700) ($800) ($700) ($2,700) ($3,400) ($4,000) ($4,400) ($4,000)
(5) Instructor $32,100 $33,400 $32,500 $34,600 $36,300 $35,900 $38,200 $38,800 $38,000 $38,200
a. Oiff from Res U 1+2 National Ave $3,000 $3,200 $2,900 83.000 $3,600 $2,100 $4,400 $4,000 $2,900
b. Diff from Res Unv 1 National Ave $2,400 $2,100 $1,800 $2,400 $2,800 $1,200 $3,600 $3,400 $2,300
c. Difference from Peer Grp Ave $1,700 $3,600 $2,300 $2,800 $4,200 $2,900 $4,500 $5,600 ($100) $303
*Peer Group, Prior to 1982-83: University of Arizona; University of Southern California; University of Colorado (Boulder);
University of Florida; University of Iowa; University of Kentucky; University of North.Carolina (Chapel Hill);
University of Ok'ahoma; University of Pittsburgh; University of Virginia.
/Peer Group, 1982-83 and subsequent years: University of Arizona; University of California, Los Angeles;
University of Cincinnati; University of Colorado (Boulder); University of Iowa; University of Michigan;
University of North Carolina; University of Pittsburgh; Purdue University; University of Texas (Austin);
University of Virginia; University of Washington.
@Peer Group, 1989-90 and subsequent years: University of Iowa; University of Virginia (MC); University of Colorado (Boulder);
University of Cincinnati (MC); University of Washington; University of North Carolina (Chapel Hill); Purdue University (MC);
University of Florida; University of California (Los Angeles); University of Arizona.
26
BEST COPY AVAILABLE

90FacRev COMPARATIVE RECENT HISTORY OF FACULTY SALARIES AA COMPENSATION IN UTAH PUBLIC HIGHER EDUCATION 21-Dec-90
TABLE 4 -- TOTAL COMPENSATION Page 4-8
IN 1990 CONSTANT DOLLARS
Estimated
1981-82 1982-83 1983-84 1984-85
ESTIMATED
1985-86 1986-87 1987-88 1988-89 1989-90 1990-91
5. Utah State University Peer Group t @
(1) All Ranks Combined $47,900 $50,000 $50,800 $52,700 $54,700 $58,100 $59,700 $60,600 $61,000 $60,400
(2) Professor $58,400 $63,100 $64,000 $65,900 568,200 $72,200 $74,000 $75,400 $75,300 $74,600
(3) Associate Professor $45,300 $47,200 $47,900 $49,400 $50,900 $54,000 $55,500 $56,400 $56,100 $55,600
(4) Assistant Professor $37,2^ $38,800 $39,400 $40,800 $42,500 $45,200 $46,400 $47,300 $47,200 546,700
(5) Instructor $28,700 $30,100 $28,400 $29,900 $30,500 $31,800 $32,300 $32,900 $33,700 $33,500
6. UTAH STATE UNIVERSITY
(1) All Ranks Combined $44,800 $47,400 $46,300 $49,600 $51,100 $51,400 551,100 $49,200 $49,700 $49,400
a. Diff from Res U 1+2 National Ave ($4,100) ($3,100) ($4,100) ($3,500) ($3,800) ($6.400) ($6,800) ($9,800)($10,400)
b. Diff from Res Unv 1 National Ave ($5,800) ($4,900) ($6,100) ($5,500) ($6,000) ($8,900) (59,200)($12,100)($12,600)
c. Difference from Peer Grp Ave ($3,100) ($2,600) ($4,500) ($3,100) ($3,600) ($6,700) ($8,600)($11,400)($11.300)($11,000)
(2) Professor $54,700 $57,900 $55,700 $59,800 $61,500 $62,700 $62,000 $59,900 $60,500 $60,000
a. Diff from Res U 1+2 National Ave ($6,600) ($5,000) ($7,300) ($6,000) ($6,400) ($8,700) ($9,500)($12,900)($13,600)
b. Diff from Res Unv 1 National Ave ($8,500) ($7,000) ($9,900) ($8,700) ($9,200)($11,900)($12,500)($15,900)($16,300)
c. Difference from Peer Grp Ave ($3,700) ($5,200) ($8,300) ($6,100) ($6,700) ($9,500)($12,000)($15,500)($14,800)($14,600)
(3) Associate Professor $43,200 $46,100 $44,400 $47,500 $49,500 $49,700 $49,800 $48,200 $48,700 $48,300
a. Diff from Res U 1+2 National Ave ($2,700) ($900) ($2,000) ($1,600) ($1,100) ($3,700) ($3,700) ($6,400) ($6,800)
b. Diff from Res Unv 1 National Ave ($3,700) ($1,800) ($3,400) ($2,800) ($2,500) ($5,200) ($5,000) ($7,500) ($7,700)
c. Difference from Peer Grp Ave ($2,100) ($1,100) ($3,500) ($1,900) ($1,400) ($4,300) ($5,700) ($8,200) ($7,400) ($7,300)
(4) Assistant Professor $34,900 $38,200 $37,300 $39,700 $40,600 $40,700 $41,100 $39,800 $41,000 $40,700
a. Diff from Res U 1+2 National Ave ($2,600) ($700) ($1.200) ($1,700) ($2,300) ($4,500) ($4,400) ($6,600) ($6,200)
b. Diff from Res Unv I National Ave ($3,400) ($1,300) ($2,500) ($2,800) ($3,700) ($6,000) ($5,700) ($7,900) ($7,500)
c. Difference from Peer Grp Ave ($2,300) ($400) ($2,100) ($1,100) ($1,900) ($4,500) ($5,300) ($7,500) ($6,200) ($6,000)
(5) Instructor $27,900 $30,800 $32,000 $34,000 $34,500 $35,000 $33,800 $34,300 $35,400 $35,100
a. Diff from Res U 1+2 National Ave ($1,200) $600 $2,400 $2,400 $1,800 $1,200 $0 ($500) $300
b. Diff from Res Unv 1 National Ave ($1,800) ($500) $1,300 51,800 $1,000 $300 ($800) ($1,100) ($300)
c. Difference from Peer Grp Ave ($800) $700 $3,600 $4,100 $4,000 $3,200 $1,500 $1,400 $1,700 $1,600
=Peer Group, prior to 1982-83: Colorado State University: Iowa State University; Kansas State University;
New Mexico State University; North Carolina State University (Raleigh); Oklahoma State University; Oregon State
University; Texas A & 11 University; Virginia Tech University; Washington State University.
tPeer Group, 1982-83 to 1988-89: University of California, Davis; Colorado State University;
University of Connecticut; Iowa State University; New Mexico State University; North Carolina State University;
Oregon State University; Pennsylvania State University; Rutgers University; Texas A & M University;
Virginia Tech University; Washington State University.
@Peer Group, 1989-90 and subsequent years: New Mexico State University (MC); Oregon State University; Washington State University;
Colorado State University; North Carolina State University (Raleigh); Iowa State University; University of Maryland (College Park);
Virginia Tech University; Texas A&M University; University of California (Davis).

90FacRev COMPARATIVE RECENT HISTORY OF FACULTY SALARIES AND COMPENSATION IN UTAH PUBLIC HIGHER EDUCATION 21-Dec-9C
7. Comprehensive Institutions-IIA
(1) All Ranks Combined
(2) Professor
(3) Associate Professor
(4) Assistant Professor
(5) Instructor
8. Gen Baccalaureate Institutions-418
(1) All Ranks Combined
(2) Professor
(3) Associate Professor
(4) Assistant Professor
(5) Instructor
9. Weber State University Peer Group * #
(1) All Ranks Combined
(2) Professor
(3) Associate Professor
(4) Assistant Professor
(5) Instructor
10. So Utah University Peer Grp
(1) All Ranks Combined
(2) Professor
(3) Associate Professor
(4) Assistant Professor
(5) Instructor
It*
TABLE 4 -- TOTAL COMPENSATION Page 4-C
Ili 1990 CONSTANT DOLLARSEstimated
1981-82 1982-83 1983-84 1984-85 1985-86 1986-87 1987-88 1988-89 1989-90 1990-91
Estimated
$43,600 $44,300 $45,400 $47,100 547,900 $50,300 $49,900 $52,200 $52,800
$54,900 $55,100 $55,700 $58,400 $59,100 $62,100 $62,000 $63,700 $64,800
$43,500 $44,100 $44,700 $46,600 $47,300 $49,500 $49,400 $51,400 $52,500
$35,500 $36,200 $37,000 $38,300 $39,000 $40,900 $40,400 $42,600 $43,400
$28,700 $28,800 $30,700 $30,700 $31,300 $32,000 $31,200 $33,200 $33,400
$37,900 $39,800 $39,600 $41,400 $42,400 $43,800 $43,800 $44,800 $45,300
$48,500 $49,800 $49,900 $51,800 $53,000 $54,300 $54,200 $55,500 $56,500
$40,100 $41,700 $41,500 $43,300 $44,500 $46,300 $45,800 $46,600 $47,000
$33,600 $35,000 $35,100 $36,300 $37,100 $38,300 $38,200 $38,800 $39,300
$27,100 $29.700 $29,400 $29,400 $30,000 $31,800 $31,100 $31,500 $32,200
$42,900 $47,400 $45,500 $47,800 $48,400 $51,200 $52,100 $52,200 $52,300 $51,800
$52,600 $56,300 $54,200 $56,900 $57,500 $60,300 $61,400 $61,900 $60,900 560,400
$43,600 $46,500 $44,300 $46,400 $46,800 $49,700 $51,100 $51,500 $50,800 $50,400
$36,400 $38,700 $37,000 $38,900 $39,500 $41,800 $42,500 $43,000 $42,600 $42,300
531,100 $31,300 $30,200 $32,100 $32,000 $33,800 $34,700 $33,600 $34,100 $33,800
$41,500 $47,400 $45,500 $47,800 $48,400 $51,200 $52,100 $52,200 $52,300 $51,800
$50,500 $56,300 $54,200 $56,900 $57,500 $60,300 $61,400 $61,900 $60,900 $60,400
$41.600 $46,500 $44,300 $46,400 $46,800 $49,700 $51,100 $51,500 $50,800 $50,400
$36,100 $38,700 $37,000 $38,900 $39,500 $41,800 542,500 $43,000 $42,600 $42,300
$30,400 $31,300 $30,200 $32,100 $32,000 $33,800 $34,700 $33,600 $34,100 $33,800
*Peer Group, prior to 1982-83: University of Colorado at Colorado Springs; Metropolitan State College (Denver);
Boise State University; Indiana University, Northwest; University of Northern Iowa; Boston State College (MA);
Ferris State College (MI); Jersey City State College (NJ); Southern Oregon State College; West Chester University (PA);
Pan American University (TX); Central Washington University; University of Wisconsin, Oshkosh.
Veer Group, 1982-83 to 1988-89: Boise State University (ID); University of California, Hayward;
Eastern Washington University; Jersey City State College (NJ); Metropolitan State College (CO);
University of Nevada, Las Vegas; University of Northern Arizona; University of Northern Iowa; Portland State University
(OR); State University of New York, College at Brockport; West Chester University (PA); University of Wisconsin, Oshkosh.
@Peer Group, 1989-90 and subsequent years: Indiana Univeristy Northwest; University of Southern Colorado;
Southern Oregon State College; Austin Peay State Univerity (TN); California State Univeristy (Dominguez Hills);
Eastern Washington University; Boise State University (ID); SUNY College at Brockport; University of Nevada (Las Vegas);
University of Wisconsin, Oshkosh.
**Peer Group, prior to 1982-83: Adams State College (CO); Fort Lewis College (CO); Delaware State College (DE);
Lewis and Clark State College (ID); Indiana State University, Evansville; New Mexico Highlands University;
Pembroke State University (NC); Southwest State University (MN); Central State University (OH); Lock Haven University
(PA); Southern Oregon State College.
Weer Group, 1982-83 to 1988-89: WSU group used for salary and tuition comparison purposes.
El@Peer Group, 1989-90 and subsequent years: WSU group used for salary and tuition comparison purposes.

90FacRev COMPARATIVE RECENT HISTORY OF FACULTY SALARIES AND COMPENSATION IN UTAH PUBLIC HIGHER EDUCATION 21-Dec-90
11. WEBER STATE UNIVERSITY
(I) All Ranks Combined
a. Diff from Comp Nat Ave (IIA)
b. Diff from Bacc Nat Ave (II8)
c. Difference from Peer Grp Ave
(2) Professora. Diff from Comp Nat Ave (IIA)
b. Diff from Bacc Nat Ave (IIB)
c. Difference from Peer Grp Ave
(3) Associate Professor
a. Diff from Comp Nat Ave (IIA)
b. Diff from Bacc Nat Ave (IIB)
c. Difference from Peer Grp Ave
(4) Assistant Professor
a. Diff from Comp Nat Ave (IIA)
b. Diff from Bacc Nat Ave (IIB)
c. Difference from Peer Grp Ave
(5) Instructor
a. Diff from Comp Nat Ave (IIA)
b. Diff from Bacc Nat Ave (110)
c. Difference from Peer Grp Ave
12. SOUTHERN UTAH UNIVERSITY
(1) All Ranks Combined
a. Diff from Comp Nat Ave (IIA)
b. 01ff from Bacc Nat Ave (IIB)
c. Difference from Peer Grp Ave
(2) Professor
a. Diff from Comp Nat Ave (IIA)
b. Diff from Bacc Nat Ave (IIB)
c. Difference from Peer Grp Ave
(3) Associate Professor
a. Diff from Comp Nat Ave (IIA)
b. Diff from Bacc Nat Ave (IIB)
c. Difference from Peer Grp Ave
(4) Assistant Professor
a. Diff from Comp Nat Ave (IIA)
b. Diff from Bacc Nat Ave (IIB)
c. Difference from Peer Grp Ave
(5) Instructor
a. Diff from Comp Nat Ave (IIA)
b. Diff from Bacc Nat Ave (IIB)
c. Difference from Peer Grp Ave
TABLE 4 -- TOTAL COMPENSATION
IN 1990 CONSTANT DOLLARS
Page 4-D
Estimated
1981-82 1982-83 1983-84 1984-85 1985-86 1986-87 1987-88 1988-89 1989-90 1990-91
$42,100 $44,200 $42,600 $45,300 $45,500 $46,700 $44,200 $42,700 $42,700 $42,800
($1.500) (5100) ($2,800) ($1,800) (52,400) (53,600) ($5,700) ($9,500)($10,100)
$4,200 $4,400 $3,000 $3,900 $3,100 $2,900 $400 ($2,100) ($2,600)
($800) ($3,200) (52,900) ($2,500) (02,900) ($4,500) ($7,900) ($9,500) ($9,600) ($9,000)
$50,600 $53,300 $50,900 $55,100 555,400 $55,900 $54,000 $51,400 $51,200 $51,200
($4,300) ($1,800) ($4,800) ($3,300) ($3,700) ($6,200) ($8,000)($12,300)($13,600)
$2,100 $3,500 $1,000 $3,300 $2,400 $1,600 ($200) ($4,100) ($5,300)
($2,000) ($3,000) ($3,300) ($1,800) ($2,100) ($4,400) ($7,400)($10,500) ($9,700) ($9,200)
$42,600 $44,900 $42,200 $46,200 $46,800 $46,400 $44,900 $42,600 $43,100 $43,100
($900) $800 ($2.500) ($400) ($500) ($3,100) ($4,500) ($8,800) ($9,400)
$2,500 $3,200 5700 $2,900 22,300 $100 (5900) (54,000) ($3,900)
($1,000) ($1,600) ($2,100) ($200) $O ($3,300) ($6,200) ($8,900) ($7,700) ($7,300)
$36,800 $39,400 $37,800 $40,300 $40,700 $41,200 $39,600 $38,500 $38,600 $38,600
$1,300 $3,200 $800 $2,000 $1,700 $300 ($800) ($4,100) ($4.800)
$3,200 $4,400 $2,700 $4,000 $3,600 $2,900 $1,400 ($300, ($700)
$400 $700 $800 $1,400 $1,200 ($600) ($2,900) ($4,500) ($4,000) ($3,700)
$28,800 $31,300 $31,100 $32,700 $30,600 $33,700 $30,500 $30,000 $30,000 $30,000
$100 $2,500 $400 52,000 (5700) $1,700 ($700) ($3,200) ($3,400)
$1,700 $1,600 51,700 53,300 0600 51,900 (5600) ($1,500) ($2,200)
($2,300) $0 $900 5600 ($1,400) ($100) ($4,200) ($3,600) ($4,100) ($3,800)
$40,200 $41,600 $40,500 $42,200 $43,200 $42,700 $43,000 $41,300 $41,200 $41,200
($3,400) ($2,700) ($4,900) ($4,900) ($4,700) ($7,600) ($6,900)($10,900)($11,600)
$2,300 $1,800 $900 $800 $800 ($1,100) ($800) ($3,500) ($4,100)
($1,300) ($5,800) ($5,000) (0,600) ($5,200) ($8,500) ($9.100)($10,900)($11,100)(510,600)
$48,800 $50,300 $47,800 $50,800 $52,800 $52,400 $52,800 $50,400 $50,200 $50,000
($6,100) ($4,800) ($7,900) ($7,600) ($6,300) ($9,700) ($9,200)($13,300)($14,600)
$300 $500 ($2,100) ($1,000) ($200) ($1,900) ($1,400) ($5,100) ($6,300)
($1,700) ($6,000) ($6,400) ($6,100) ($4,700) ($7,900) ($8,600)($11,500)($10,700)($10,400)
$39,800 $42,600 $41,700 $42,000 $43,000 $42,600 $42.800 $40,900 $42,000 541,900
($3,700) ($1,500) ($3,000) ($4,600) ($4,300) ($6,900) ($6,600)($10,500)(510,500)
($300) $900 $200 ($1,300) ($1,500) ($3,700) ($3,000) ($5,700) (55,000)
($1,800) ($3,900) ($2,600) ($4,400) ($3,800) ($7,100) ($8,300)(S10,600) ($8,800) (58,500)
$34,600 $35,400 $34,700 $36,600 $36,300 $37,500 $36,000 $36,000 $35,600 $35,500
($900) ($800) ($2,300) ($1,700) ($2,700) ($3,400) ($4,400) ($6,600) ($7,800)
$1,000 $400 ($400) $300 ($800) ($800) ($2,200) ($2,800) ($3,700)
($1,500) ($3,300) ($2,300) ($2,300) (53,200) ($4,300) ($6,500) ($7,000) (17,000) ($6,800)
$30,500 $31,700 $30,000 $34,100 $32,400 $32,600 $31,400 $32,900 $34,900 $34,800
$1,800 $2,900 ($700) $3,400 $1,100 $600 $200 ($300) $1,500
$3.400 $2,000 $600 $4,700 $2,400 $800 $300 $1,400 $2,700
$100 $400 ($200) $2,000 $400 ($1,200) ($3,300) ($700) $800 $1,000

90FacRev COMPARATIVE RECENT HISTORY OF FACULTY SALARIES AND COMPENSATION IN UTAH PUBLIC HIGHER EDUCATION
TABLE 4 -- TOTAL COMPENSATION
IN 1990 CONSTANT DOLLARS
21-Elec-90
Page 4-E
Estimated
1981-82 1982-83 1983-84 1984-85 1985-86 1986-87 1987-88 1988-89 1989-90
13. Institutions Without Academic Ranks--IV Estimated
Essentially All Two-Year Institutions
(1) All Faculty Combined $38,500 $40,200 $38,600 $38,400 $42,500 $45,800 $41,300 $42,500 $45,000
14. Metro Community College Peer Grp *
(1) Al/ Faculty Combined N/A $43,200 $43,000 $45,700 $46,500 $46,400 148,000 $413,900 $48,200 $47,800
15. Rural Community College Peer Grp ** #1
(1) All Faculty Combined N/A $40,900 $41,600 $45,700 $46,500 $46,400 $48,000 $48,900 $48,200 $47,800
16. Snow College ** ##
(1) All Faculty Combined $36,200 538,400 $37,600 $39,200 $40,900 541,100 $41,700 538,500 $40,100 $41,300
a. Diff from National Ave (IV) ($2.300) ($1,800) ($1,000) $800 ($1,600) ($4,700) $400 ($4,000) ($4,900)
b. Difference from Peer Grp Ave ($2,500) ($4,000) ($6,500) ($5,600) ($5,300) ($6,300)($10,400) ($8,100) ($6,500)
17. Dixie College
(I) All Faculty Combined $38.500 $41,700 $38,800 $40,300 $40,700 $40,500 $39,100 $37,900 538,000 537,800
a. Diff from National Ave (IV) $0 $1,500 $200 $1,900 ($1,800) ($5,300) ($2,200) ($4,600) ($7,000)
b. Difference from Peer Grp Ave $800 ($2,800) ($5,400) ($5,800) ($5,900) ($8,900)($11,000)($10,200)($10,000)
18. College of Eastern Utah
(1) All Faculty Combined $35,400 $39,500 $36,900 $38,900 $39,200 $40,100 $39,200 $38,500 $37,900 $38,500
a. Diff from Ngional Ave (IV) ($3,100) ($700) ($1,700) $500 ($3,300) ($5,700) ($2,100) ($4,000) ($7,100)
b. Difference from Peer Grp Ave ($1,400) ($4,700) ($6,800) ($7,300) ($6,300) ($8,800)($10,400)($10,300) ($9,300)
19. Utah Valley Community College
(1) All Faculty Combined $37,500 $40,200 $38,100 140,700 $42,200 $42,100 $41,800 $40,900 $41,200 $41,100
a. Diff from National Ave (IV) ($1.000) $0 ($500) $2,300 ($300) ($3,700) $500 ($1,600) ($3,800)
b. Difference from Peer Grp Ave ($3,000) ($4,900) ($5,000) ($4.300) ($4,300) ($6,200) ($8,000) ($7,000) ($6,700)
21. Salt Lake Community College
(1) All Faculty Combined Ss100 $39,300 $37,400 $39,600 $40,600 $39,700 $39,900 $38,500 $38,400 $36,300
a. Diff from National Ave (I1./ ($1,400) ($900) ($1,200) $1,200 ($1,900) ($6,100) ($1,400) ($4,000) ($6,600)
b. Difference from Peer Crp Ave ($3,900) ($5,600) ($6,100) ($5,900) ($6,700) ($8.100)($10,400) ($9,800) ($9,500)
*Peer Group, prior to 1982-83: Clark Co CC (NV); Chemeketa CC (OR); College of Southern Idaho; CC of Denver (CO);
Des Moines Area CC (IA); Lee College (TX); Maricopa Co CC (AZ); North Dakota State School of Science;
North Hennepin CC (MN); Penn Valley CC (MO); Pikes Peak CC (CO); Central Arizona College; OlyMpia Technical CC (WA);
Western Nevada CC.
/Peer Group, 1982-83 to 1988-89: Ann Arundel CC (MD); Austin CC (TX); Bergen CC (MD); Chemeketa CC (OR);
Clark Co CC (NV); College of Southern Idaho; Delaware CC (PA); Madison Area Tech Col (WI); Mount Hood CC (OR);
North Seattle CC (WA); Spokane CC (WA; (San Diego City College (CA)--1982-83 only).
**Peer Group, prior to 1982-83: Big Bend CC (WA); Blue Mountain CC (OR); Colorado Mt JC (CO); Flathead Valley CC (MT);
Miles CC (MT); Northern Nevada CC; North Idaho College; NorthwestCC (WY); Northwestern JC (CO); Treasure Valley CC (OR);
Wenatchee Valley CC (WA); Western Wyoming CC.
#0 Peer Group, 1982-83 and 1983-84: [Big Bend CC(WA)--1982-83 only); Blue Mountain CC (OR);
College of the Siskiyous (CA); North Central Michigan College;Northeastern JC (CO); North Idaho College;
Northwest CC (WY); Treasure Valley CC (OR); Wenatchee Valley College (WA); Western Texas College;
Western Wyoming College; Yavapai College (AZ).
@Peer Group, 1984-85 to 1988-89: Metro Group used for faculty compensation and tuition and fee comparisons.
"Peer Group for All Community Colleges, 1989-90 and subsequent years: Western Wyoming Community College;
Danville Community College (VA); Yavapai College (A2); North Idaho College; Joliet Junior College (IL);
Chemeketa Community College (OR); Anne Arundel Community College (MD); Spokane Community College (WA);
BEST COPY AVAILABLE
2Gi)

90FacRev COMPAR:TIVE RECENT HISTORY OF FACULTY SALARIES AND COMPENSATION IN UTAH PUBLIC HIGHER EDUCATION 21-Dec-90
TABLE 5 -- INFLATIONEstimated
1981-82 1982-83 1983-84 1984-85 1985-86 1986-87 1987-88 1968-89 1989-90 1990-91
December Consumer Price Index 94.0 97.6 101.3 105.3 109.3 110.5 115.4 120.5 126.1 134
(1982-84 100)
% Increase over previous year 3.83% 3.79% 3.95% 3.80% 1.10% 4.43% 4.42% 4.65% 6.26%

UTAH SYSTEM OF HIGHER EDUCATIONOFFICE OF THE COMMISSIONER OF HIGHER EDUCATION
September 5, 1990
1990-91 ANALYSIS OF FACULTY SALARYAND COMPENSATION COMPARABILITY
Each year the Office of the Commissioner prepares a comparative analysisto determine the relative positions of faculty salaries and compensation in Utahinstitutions to standard sets of comparison institutions. The report is a
principle source for determination of recommendations the Commissioner makes, inconsultation with the Presidents of USHE institutions, for competitive equityadjustments.
The primary source of information for the analysis is "The Annual Reporton the Economic Status of the Profession 1989-90," published by the AmericanAssociation of University Professors (AAUP) in Academe, March-April 1990.
In order to update the AAUP data to 1990-91 levels, the Commissioner'sOffice obtained information from each comparison institution regarding averagefaculty salary increases for the 1990-91 academic year. This information wasthen used to estimate current compensation. Two of the peer institutions had notyet ascertained increases, therefore their percentage increases were estimatedusing an average of the other responding comparison institutions.1
Because the average percentage increases were not reported by rank, it hasbeen necessary to assume that average increases are the same for all ranks. Thisassumption will cause the estimated comparisons to differ slightly from actualnumbers when reported by individual rank.
The data are analyzed by individual faculty rank for the four-yearinstitutions and by all faculty combined for the two-year institutions. The
four-year institutions are analyzed in this manner because each institution hasa unique distribution of faculty members across ranks. Use of all-rank averagesin determining equity comparisons for a specific college or university woulddistort the comparison. Averages are used for two-year institutions, however,because comparable data by rank are not available at all of these institutions.
To better convey the comparison between Utah institutions and their peerinstitutions, the following table shows percentage increases in faculty salaryfor these groups for the past four years.
'Onandaga Community College qwyl and Chemetaka CommunityCollege (OR) 4
33

PercentageTable I
Salary Increase By Year
1987-88 1988-89 1989-90 1990-91
University of Utah 5.4% 3.33% 6.21% 6.61%Old Comparison Group, 6.5% 5.36% 5.58% --
New Comparison Group' 5.77%
Utah State University 4.1% 0.79% 6.70% 5.50%Old Comparison Group, 6.6% 6.50% 5.90% --New Comparison Group'. 5.31%
Four-Year InstitutionsWeber State Univ. 2.4% 0.79% 5.65% 6.26%Southern Utah Univ. 3.8% 1.47% 6.15% 5.99%
Old Comparison Group, 5.1% 4.83% 5.18% --
New Comparison Group' 5.41%
Community CollegesSnow College 9.9% 0.95% 6.41% 9.49%Dixie College 5.1% 1.23% 4.76% 5.50%College of Eastern UT 5.9% 1.56% 6.67% 7.80%Utah Valley CC 4.5% 0.52% 4.15% 6.07%Salt Lake CC 5.2% 0.34% 5.10% 6.12%
Old Comparison Group, 4.3% 4.76% 5.04% --
New Comparison Group' 5.46%
Faculty salary increases for 1987-88 were totally funded from reallocationof institutional budget reductions. That year the universities and four-yearcolleges were able to award less than the average salary increases of theircomparis)n institutions while the community colleges awarded higher percentageincreases. Due to limited state revenue, the legislature was unable to providefunding for 1988-89 salary increases, and again institutional internalreallocations provided the small percentage increases reported. For 1989-90, thepercent increases were slightly higher than that of the comparison group.Increases of three percent were funded by the Appropriations Act, and balanceswere funded through internal reallocations. For 1990-91, 4.5 percent was fundedby the legislature for most institutions; however, Dixie College received 5.5percent and the College of Eastern Utah received 5 percent. Additional increasesagain were funded by internal reallocations.
Table II displays Utah's actual compensation standing in relation tocomparison institutions. Represented in Table II is a three-year history ofpercent increases and net percent differences in total compensation.Differentials for both the old comparison group and the new comparison group areshown for 1989-90.
2New comparison groups were determined for Utah institutionsat the May 1990 meeting of the State Board of Regents.
2 :3

Table IIUtah Institution E&G Increases and Compensation Differentials
In Percents
1988-89 1989-90 1990-91
%
Inc
% NetDiff
%
Inc
% NetDiff
Old Grp
% NetDiff
New Grp3
%
Inc% NetDiff
New Grp3
UofU 3.33 -13.80 6.21 -13.74 -14.01 6.61 -13.06USU 0.79 -21.02 6.70 -20.57 -18.36 5.50 -18.11
WSU 0.79 -16.72 5.65 -18.73 -15.97 6.26 -14.98SUU 1.47 -21.44 6.15 -22.19 -19.23 5.99 -18.51
Snow 0.95 -19.43 6.41 -21.89 -20.34 9.49 -15.88Dixie 1.23 -26.87 4.76 -28.36 -26.73 5.50 -26.64
CEU 1.56 -26.09 6.67 -28.72 -27.09 7.80 -24.29UVCC 0.52 -19.61 4.15 -18.54 -17.03 6.07 -16.32
SLCC 0.34 -25.39 5.10 -27.30 -25.68 6.12 -24.86
Minimal salary increases in 1988-89 caused wider compensation gaps todevelop while 1989-90 salary increases were enough to sustain that gap. Higherpercentage increases in 1990-91 served to narrow the gap for all institutionswhen compared to their new comparison group. The introduction of new comparisongroups also served to narrow the gap for all schools except the University ofUtah.
A summary of actual salary and compensation dollars for all institutionsis provided in Table III. The first section on each page shows comparisons ofsalaries only. The second section shows total compensation. And the thirdsection shows the composite equity gap percentages for each institution. The
data confirms that faculty salaries in Utah institutions trail their comparisongroup and that total compensation equity differences are less because of aboveaverage fringe benefits offered by Utah institutions.
The detail for the individual comparison institutions and the Utah
institutions are provided in the following tables.
UofU Tables 1-A to 3-A Dixie Tables 1-E to 3-E
USU Tables 1-B to 3-B CEU Tables 1-E to 3-EWSU Tables 1-C to 3-C UVCC Tables 1-E to 3-E
SUU Tables 1-D to 3-D SLCC Tables 1-E to 3-E
Snow Tables 1-E to 3-E
For each institution, Table 1 represents the 1990-91 estimated salarycomparisons; Table 2 shows the 1990-91 estimates for compensation comparisons.The preliminary calculation of competitive faculty salary adjustment and
recommendation for 1991-92 budget is shown for each institution in Table 5.
c:\databk\facsur.txt LAP
3New comparison groups were determined for Utah institutionsat the May 1990 meeting of the State Board of Regents.
35 26-4

Table IIISummary of Faculty Salaries
And Compensation Comparability 1990-91
Estimated 1990-91 AverageSalaries, By Rank
ProfessorUtah InstitutionComp Inst Wtd AveDifference
Associate Professor
U of U
$54,158$65,476($11,318)
USU
$45,787$61,501($15,714)
WSU
$38,891$48,904($10,013)
SUU
$37,626$48,904($11,278)
Utah Institution $39,126 $36,398 $32,516 $31,267Comp Inst Wtd Ave $47,207 $44,986 $39,133 $39,133Difference ($8,081) ($8,588) ($6,617) ($7,866)
Assistant ProfessorUtah Institution $35,501 $30,806 $28,903 $26,603Comp Inst Wtd Ave $40,672 $37,795 $33,810 $33,810Difference ($5,171) ($6,989) ($4,907) ($7,207)
InstructorUtah Institution $28,252 $26,692 $22,102 $24,696Comp Inst Wtd Ave $30,244 $25,893 $26,656 $26,656Difference ($1,992) $799 ($4,554) ($1,960)
....M.==========================.=========m.Estimated 1990-91 AverageCompensation, By Rank
ProfessorUtah Institution $69,616 $60,030 $51,217 $50,027Comp Inst Wtd Ave $79,659 $74,648 $60,363 $60,363
Difference ($10,043) ($14,618) ($9,146) ($10,336)
Associate ProfessorUtah Institution $51,279 $48,319 $43,142 $41,866Comp Inst Wtd Ave $58,765 $55,612 $50,397 $50,397
Difference ($7,486) ($7,293) ($7,255) ($8,531)
Assistant ProfessorUtah Institution $46,908 $40,723 $38,572 $35,507Comp Inst Wtd Ave $50,911 $46,735 $42,251 $42,251Difference ($4,003) ($6,012) ($3,679) ($6,744)
InstructorUtah Institution $38,166 $35,132 $29,965 $34,765Comp Inst Wtd Ave $37,873 $33,491 $33,804 $33,804
Difference $293 $1,641 ($3,839) $961
Composite Equity GapSalaries -19.41Z -26.86Z -21.72% -26.01Z
Total Comp -13.06Z -18.11% -14.98% -18.512
36

Table IIISummary of Faculty Salaries
And Compensation Comparability 1990-91
Estimated 1990-91 AverageSalaries, By Rank
All Faculty
SnowCollege
DixieCollege
College ofEastern Ut
Ut ValleyC College
Salt LakeC College
Utah Institution $30,219 $28,206 $28,136 $30,314 $27,910Comp Inst Wtd Ave $37,454 $37,454 $37,454 $37,454 $37,454Difference ($7,235) ($9,248) ($9,318) ($7,140) ($9,544). .."'".=
Estimated 1990-91 AverageCompensation, By Rank
All FacultyUtah Institution $41,278 $37,769 $38,485 $41,120 $38,309Comp Inst Wtd Ave $47,832 $47,832 $47,832 $47,832 $47,832Difference ($6,554) ($10,063) ($9,347) ($6,712) ($9,523)
======================== = . . . .Composite Equity Gap
Salaries -23.942 -32.792 -33.12Z -23.56% -34.20%Total Comp -15.88Z -26.64% =24.29Z -16.32Z -24.862
37

C:\DATABK\FACSR90a LAP:06-Dec-90
Table 1-AANALYSIS OF ESTIMATED FACULTY SALARY COMPARABILITY AS OF 1990-91
UNIVERSITY OF UTAHInformation on Percent Increase obtained from institution
Rptd Ave FOUR RANKS ASSOCIATE ASSISTANTInc COMBINED PROFESSOR PROFESSOR PROFESSOR INSTRUCTOR
Univ of Arizona 8.75% 1,322 612 364 321 2551,127 62,205 45,240 38,498 27,840
Univ of California 4.88% 1,466 892 275 299 0
Los Angeles 62,001 73,521 46,776 41,637 0
Univ of Cincinnati 5.002 1,037 383 381 255 18Main Campus 51,211 64,050 48,090 38,115 29,610
Univ of Colorado 5.50% 896 445 243 187 21at Boulder 50,557 58,658 45,365 40,196 31,228
Univ of Florida 5.00% 2,642 1,034 776 716 11653,847 64,470 50,085 45,675 34,755
Univ of Iowa 6.00% 1,004 473 301 220 1054,473 64,872 48,760 40,810 35,192
Univ of North Carolina 6.00% 1,061 524 300 225 12Chapel Hill 54,795 66,462 47,382 38,796 30,634
Purdue University 6.00% 1,468 574 412 418 64Main Campus 50,744 66,144 46,216 38,372 22,578
Univ of Virginia 4.78% 937 425 285 209 18Main Campus 57,747 73,451 49,351 39,816 28,081
Univ of Washington 6.10% 1,700 874 463 349 1450,728 60,265 42,864 38,090 30,451
UNIVERSITY OF 6.61% 835 379 239 189 28UTAH 44,764 54,158 39,126 35,501 28,252
AVG # FACULTYWith UU 1,306 601 367 308 30W/Out UU 1,353 624 380 320 30
UNWEIGHTED AVGWith UU 5.872 52,909 64,387 46,296 J9,591 29,862W/Out UU 5.80% 53,723 65,410 47,013 40,000 30,041
WEIGHTED AVGWith UU 5.82% 53,187 64,828 46,729 40,383 30,073W/Out UU 5.772 53,707 65,476 47,207 40,672 30,244
2G7

C:\DATABK\FACSR90a LAP:06-Dec-90
Table 1-BANALYSIS OF ESTIMATED FACULTY SALARY COMPARABILITY AS OF 1990-91
UTAH STATE UNIVERSITYInformation on Percent Increase obtained from institution
Rptd Ave FOUR RANKS ASSOCIATE ASSISTANT2 Inc COMBINED PROFESSOR PROFESSOR PROFESSOR INSTRUCTOR
Univ of CaliforniaDavis
Colorado State Univ
Iowa State Univ
Univ of MarylandColleg. Park
New Mexico State UnivMain Campus
North Carolina State UnivRaleigh
Oregon State Univ
Texas A & M Univ
Virginia Tech Univ
IIWashington State UnivState Univ
UTAH STATEUNIVERSITY
Ave // FacultyWith Utah StW/Out Utah St
Unwgtd AveWith Utah StW/Out Utah St
Weighted AveWith Utah StW/Out Utah St
1
4.882 963 548 1^8 21756,010 66,599 45,098 39,225
6.5C2 890 440 271 179 -
46,817 54,102 41,855 3E,423 -
6.302 1,265 513 324 300 12850,016 64,312 47,729 38,906 24,555
5.25% 1,274 505 432 242 9553,361 68,518 48,520 40,206 28,312
6.002 549 195 141 182 3139,447 47,700 39,326 33,390 23,638
6.002 984 407 328 236 1352,188 64,448 46,640 39,962 30,316
5.002 605 209 190 149 5739,928 49,035 39,690 33,495 24,150
3.202 1,403 578 438 38748,977 60,578 44,479 36.739
5.102 1,530 562 544 356 6851,707 66,423 47 295 39,833 27,536
6.102 797 286 242 214 5542,084 52,201 39,363 36,074 24,827
5.502 458 155 147 133 2337,464 45,787 36,398 30,806 26,692
974 400 296 236 431,026 424 311 246 45
5.442 47,091 58,155 43,308 36,824 26,2535.43% 48,053 59,392 44,000 37,425 26.191
5.322 48,754 60,947 44,598 37,436 25,9325.312 49,258 61,501 44,986 37,795 25,893
268
39

Table 1-CANALYSIS OF ESTIMATED FACULTY SALARY COMPARABILITY AS OF 1990-91
WEBER STATE UNIVERSITYInformation on Percent Increase obtained from institution
Rptd Ave FOUR RANKS ASSOCIATE ASSISTANTInc COMBINED PROFESSOR PROFESSOR PROFESSOR INSTRUCTOR
California State Univ 4.902 247 173 49 19 6
Dominguez Hills 54,739 59,688 46,156 39,652 29,897
Univ of Southern Colorado 6.002 167 60 51 47 9
37,918 43,884 37,206 33,178 26,924
Boise State Univ 6.502 339 141 108 81 9
Idaho 36,811 40,790 35,571 32,589 27,371
Indiana University 5.402 105 21 52 32
Northwest 39,981 51,541 40,263 31,936
Univ of Nevada Las Vegas 5.002 418 119 139 160 0
45,348 56,490 45,465 36,960 0
SUNY College at Brockport 5.502 295 97 120 78 0
49,066 58,447 48,003 39,035 0
So. Oregon State Univ 5.002 189 74 56 52 7
33,707 39,900 32,970 26,775 25,620
Austin Peay State Univ 5.402 203 76 50 68 9
Tennessee 35,921 45,427 34,150 28,353 22,661
Eastern Washington Univ 6.402 339 185 83 71 0
37,963 41,922 35,218 30,856 0
Univ of Wisconsin Oshkosh 4.252 384 128 105 141 1037,769 48,268 30,128 34,611 28,148
WEBER STATE 6.26% 393 133 94 112 54
UNIVERSITY 32,213 38,891 32,516 28,903 22,102
Ave # FacultyWith WSC 280 110 82 78 9
W/Out WSC 269 107 81 75 5
Unwgtd AveWith WSC 5.512 40,130 47,750 37,968 32,986 26,103W/Out WSC 5.442 40,922 48,636 38,513 33,395 26,770
Weighted AveWith WSC 5.522 40,161 47,801 38,447 33,172 24,291W/Out WSC 5.412 41,323 48,904 39,133 33,810 26,656
26:r40

I.
1
Table 1-DANALYSIS OF ESTIMATED FACULTY SALARY COMPARABILITY AS OF 1990-91
SOUTHERN UTAH UNIVERSITYinformation on Percent Increase obtained from institution
Rptd Ave FOUR RANKS ASSOCIATE ASSISTANTInc COMBINED PROFESSOR PROFESSOR PROFESSOR INSTRUCTOR
California State UnivDominguez Hills
Univ of Southern Colorado
Boise State UnivIdaho
Indiana UniversityNorthwest
Univ of Nevada Las Vegas
SUNY College at Brockport
So. Oregon State Univ
Austin Peay State UnivTennessee
Eastern Washington Univ
Univ of Wisconsin Oshkosh
SOUTHERN UTAHUNIVERSITY
Ave # FacultyWith WSCW/Out WSC
Unwgtd AveWith WSCW/Out WSC
Weighted AveWith WSCW/Out WSC
4.902 247 173 49 19 6
54,739 59,688 46,156 39,652 29,897
6.00% 167 60 51 47 9
37,918 43,884 37,206 33,178 26,924
6.50% 339 141 108 81 9
36,811 40,790 35,571 32,589 27,371
5.40% 105 21 52 32 -
39,981 51,541 40,263 31,936 -
5.00% 418 119 139 160 0
45,348 56,490 45,465 36,960 0
5.50% 295 97 120 78 0
49,066 58,447 48,003 39,035 0
5.00% .89 74 56 52 7
33,707 39,900 32,970 26,775 25,620
5.40% 203 76 50 68 9
3,921 45,427 34,150 28,353 22,661
6.40Z 339 185 83 71 0
37,963 41,922 35,218 30,856 0
4.25% 384 128 105 141 10
37,769 48,268 30,128 34,611 28,148
5.99% 113 27 40 37 9
30,736 37,626 31,267 26,603 24,696
254 100 78 71 5
269 107 81 75 5
5.492 39,996 47,635 37,854 32,777 26,4745.44% 40,922 48,636 38,513 33,395 26,770
5.442 40,896 48,628 38,764 33,471 26,3575.412 41,323 48,904 39,133 33,810 26,656
2;"04 1

C:\DATABK\FACSR90b LAP:06-Dec-90
Table 1-EANALYSIS OF ESTIMATED FACULTY SALARY COMPARABILITY AS OF 1990-91
Information on Percent Increases obtained from institutionsRptd Avg AllZ Inc Faculty
Anne Arundel Comm 5.00% 194College, MD 40,530
Onandaga Community 5.43% 207College, NY 35,319
Chemetaka Community 5.43% 200College, OR 34,792
Spokane Community 6.20% 145College, WA 32,922
Danville Community 5.10% 56College, VA 36,680
Yavapai College 4.002 82AZ 35,464
North Idaho 8.10% 85College 31,349
JoliPt Junior 6.00% 143College, IL 42,824
Grand Rapids Junior 5.00% 209College, MI 43,890
Western Wyoming 4.00% 47Community College* 29,952
**UTAH INST** SNOW DIXIE CEU UVCC SLCC9.49% 5.50,1 7.80% 6.07% 6.12%
64 68 60 157 19030,219 28,206 28,136 30,314 27,910
AVG # FACULTYWith Ut Inst 130 131 130 139 142W/Out Ut Inst 137 137 137 137 137
UNWEIGHTED AVGWith Ut Inst 35,813 35,630 35,623 35,821 35,603W/Out Ut Inst 5.43% 36,372 36,372 36,372 36,372 36,372
WEIGHTED AVGWith Ut Inst 37,131 37,016 37,063 36,719 36,290W/Out Ut Inst 5.46Z 37,454 37,454 37,454 37,454 37,454

1
4
C:\DATABK\FACSR90a LAP:06-Dec-90
Table 2-AANALYSIS OF ESTIMATED FACULTY COMPENSATION COMPARABILITY A...; OF 1990-91
UNIVERSITY OF UTAHInformation on Percent Increase obtained from institution
Rptd Ave FOUR RANKS ASSOCIATE ASSISTANT% Inc COMBINED PROFESSOR PROFESSOR PROFESSOR INSTRUCTOR
Univ of Arizona 8.75Z 1,322 612 364 321 2562,667 74,711 56,333 48,938 36,323
Univ of California 4.882 1,466 892 275 299
Los Angeles 75,037 88,204 57,579 51,811
Univ of Cincinnati 5.002 1,037 383 381 255 18
Main Campus 64,804 81,060 60,795 48,300 37,590
Univ of Colorado 5.50% 896 445 243 187 21
at Boulder 59,632 68,681 53,911 48,003 37,664
Univ of Florida 5.00% 2,642 1,034 776 716 11667,530 80,115 63,000 57,960 44,730
Univ of Iowa 6.00% 1,004 473 301 220 10
67,456 79,394 61,268 51,304 44,414
Univ of North Carolina 6.00% 1,061 524 300 225 12
Chapel Hill 64,751 78,440 56,180 45,792 36,782
Purdue University 6.00% 1,468 574 412 418 64
Main Campus 63,550 82,680 58,724 47,806 25,864
Univ of Virginia 4.78% 937 425 285 209 18
Main Campus 71,240 89,168 61,820 50,714 35,416
Univ of Washington 6.10% 1,700 874 463 349 14
62,262 73,103 53,368 47,851 38,833
UNIVERSITY OF 6.61% 835 379 239 189 2,
UTAH 58,173 69,616 51,279 46,908 38,166
Ave # FacultyWith Utah 1,306 601 367 308 30
W/Out Utah 1,353 624 380 320 30
Unwgtd AveWith Utah 5.87% 65,191 78,652 57,660 54,539 37,578
W/Out Utah 5.80% 65,893 79,556 58,298 55,386 37,513
Weighted AveWith Utah 5.82% 65,617 79,083 58,322 50.688 37,899W/Out Utah 5.77% 66,076 79,659 58,765 50,911 37,873
2724 3

C:\DATABK\FACSR90a LAP:06-Dec-90
Table 2-BANALYSIS OF ESTIMATED FACULTY COMPENSATION COMPARABILITY AS OF 1990-91
UTAH STATE UNIVERSITYInformation on Percent Increase obtained from institution
Rptd Ave FOUR RANKS ASSOCIATE ASSISTANTInc .COMBINED PROFESSOR PROFESSOR PROFESSOR INSTRUCTOR
Univ of California 4.88% 963 548 198 217Davis 67,746 79,814 55,377 48,559
Colorado State Univ 6.502 890 440 271 179 0
56,206 64,965 50,268 43,665 0
Iowa State Univ 6.302 1,265 513 324 300 12862,174 78,662 59,847 49,323 32,103
Univ of Maryland 5.252 1,274 505 432 242 95College Park 66,496 84,726 60,940 49,889 37,153
New Mexico State Univ 6.002 549 195 141 182 31Main Campus 47,364 57,134 47,276 40,174 28,514
North Carolina State Univ 6.002 984 407 328 236 13
Raleigh 61,724 76,002 55,332 47,382 36,358
Oregon State Univ 5.002 605 209 190 149 5752,379 63,630 52,185 44,310 32,865
Texas A & M Univ 3.202 1,403 578 438 387 0
59,909 73,066 54,902 45,924 0
Virginia Tech Univ 5.102 1,530 562 544 356 6863,504 80,612 58,541 49,607 34,578
Washington State Univ 6.102 797 286 242 214 55State Univ 51,860 64,191 49,230 43,501 31,830
UTAH STATE 5.50% 458 155 147 133 23UNIVERSITY 49,414 60,030 48,319 40,723 35,132
Ame # FacultyWith Utah St 974 400 296 236 43W/Out Utah St 1,026 424 311 246 45
Unwgtd AveWith Utah St 5.44% 58,070 71,166 53,838 45,732 33,567W/Out Utah St 5.43% 58,936 72,280 54,390 46,233 33,343
Weighted AveWith Utah St 5.32Z 59,921 74,132 55,282 46,427 33,571W/Out Utah St 5.31% 60,390 74,648 55,612 46,735 33,491
44

Table 2-CANALYSIS OF ESTIMATED FACULTY COMPENSATION COMPARABILITY AS OF 1990-91
WEBER STATE UNIVERSITYInformation on Percent Increase obtained from institution
Rptd Ave FOUR RANKS ASSOCIATE ASSISTANTZ Inc COMBINED PROFESSOR PROFESSOR PROFESSOR INSTRUCTOR
California State Univ 4.90% 247 173 49 19 6
Dominguez Hills 67,608 73,220 58,010 50,457 38,498
Univ of Southern Colorado 6.00% 167 60 51 47 9
44,320 51,304 43,460 38,796 31,482
Boise State Univ 6.50% 339 141 108 81 9
Idaho 45,347 50,055 43,878 40,364 34,080
Indiana University 5.40% 105 21 52 32
Northwest 51,576 65,770 51,962 41,633
Univ of Nevada Las Vegas 5.00% 418 119 139 160 0
52,590 64,995 52,710 43,260 0
SUNY College at Brockport 5.50% 295 97 120 78 0
62,349 73,956 61,401 49,374 0
So. Oregon State Univ 5.00% 189 74 56 52 7
44,678 52,395 43,680 36,120 34,650
Austin Peay State Univ 5.40% 203 76 50 68 9
Tennessee 44,706 56,178 42,476 35,731 28,036
Eastern Washington Univ 6.40% 339 185 83 71 0
47,622 52,242 44,475 39,262 0
Univ of Wisconsin Oshkosh 4.25% 384 128 105 141 1052,635 61,925 52,542 45,349 37,426
WEBER STATE 6.26% 393 133 94 112 54
UNIVERSITY 42,762 51,217 43,142 38,572 29,965
Ave # FacultyWith WSC 280 110 82 78 9
W/Out WSC 269 107 81 75 5
Unwgtd AveWith WSC 5.51% 50,563 59,387 48,885 41,720 33,448W/Out WSC 5.44% 51,343 60,204 49,459 42,034 34,029
Weighted AveWith WSC 5.52% 50,648 59,356 49,645 41,773 31,811W/Out WSC 5.41% 51,802 60,363 50,397 42,251 33,804
1

C
-able 2-DANALYSIS OF ESTIMATED FACULTY COMPENSATION COMPARABILITY AS OF 1990-91
SOUTHERN UTAH UNIVERSITYInformation on Percent Increase obtained institution
Rptd Ave FOUR RANKS ASSOCIATE A SISTANZ Inc COMBINED PROFESSOR PROFESSOR PROFESSOR INSTRUCTOR
California State Univ 4.902 247 173 49 19 6
Dominguez Hills 67,608 73,220 58,010 50,457 38,498
Univ of Southern Colorado 6.002 167 60 51 47 9
44,320 51,304 43,460 38,796 31,482
Boise State Univ 6.502 339 141 103 81 9
Idaho 45,347 50,055 43,878 40,364 34,080
Indiana University 5.402 105 21 52 32Northwest 51,576 65,770 51,962 41,633
Univ of Nevada Las Vegas 5.00% 418 119 139 160 0
52,590 64,995 52,710 43,260 0
SUNY College at Brockport 5.50% 295 97 120 78 0
62,349 73,956 61,401 49,374 0
So. Oregon State TJniv 5.00% 189 74 56 52 7
44,678 52,395 43,680 36,120 34,650
Austin Peay State Univ 5.40% 203 76 50 68 9
Tennessee 44,706 56,178 42,476 35,731 28,036
Eastern Washington Univ 6.402 339 185 83 71 0
47,622 52,242 44,475 39,262 0
Univ of Wisconsin Oshkosh 4.25% 384 128 105 141 1052,635 61,925 52,542 45,349 37,426
SOUTHERN UTAH 5.99% 113 27 40 37 9
UNIVERSITY 41,168 50,027 41,866 35,507 34,765
Ave # FacultyWith WSC 254 100 78 71 5
W/Out WSC 269 107 81 i5 5
UnwEtd AveWith WSC 5.492 50,418 59,279 48,769 41,441 34,134W/Out WSC 5.442 51,343 60,204 49,459 42,034 34,029
Weighted AveWith WSC 5.44% 51,372 60,110 49,997 41,934 33,950W/Out WSC 5.41% 51,802 60,363 50,397 42,251 33,804

C:\DATABK\FACSR90b LAP:06-Dec-90
Table 2-EANALYSIS OF ESTIMATED FACULTY COMPENSATION COMPARABILITY AS OF 1990-91
Information on Percent Increases obtained from institutions
line Arundel Comm.liege, MD
Onandaga CommunityItllege, NY
5.00% 19454,075
5.43% 20747,444
emetaka Communit 5.43% 200College, OR 47,022
liokane Communitygllege, WA
nville CommunityIlaollege, VA
Yavapai College
North Idaho
oliet JuniorCollege, IL
6.20% 14541,153
5.10% 5646,139
4.00% 8239,416
8.10% 8539,457
6.00% 14350,986
land Rapids Junio 5.00% 209ollege, MI 54,915
ilestern Wyomingommunity College*
UT Inst % IncIIA7e # FacAve Sal
FACULTYWith Ut InstW/Out Ut Inst
AVGWith Ut InstW/Out Ut Inst
AVGWith Ut InstW/Out Ut Inst
4.00% 4738,584
SNOW DIXIE CEU UVCC SLCC9.49% 5.50% 7.80% 6.07% 6.122
64 68 60 157 19041,278 37,769 38,485 41,120 38,309
130 131 130 139 142137 137 137 137 137
45,497 45,178 45,243 45,483 45,2275.43% 45,919 45,919 45,919 45,919 45,919
47,539 47,355 47,439 47,141 46,6715.462 47,832 47,832 47,832 47,832 47,832
IIEstimated by Institution
1
2 747

C:\DATABK\FACSR90a LAP:06-Dec-90
Estimated1990-91
Table 3-ACALCULATION OF COMPETITIVE FACULTY SALARY ADJUSTMENT
UNIVERSITY OF UTAHAssociate Assistant Four Ranks
Professor Professor Professor Instructor Combined
a. TOtal Salariesof ContinuingFaculty Mmbrs
b. Compensationto Salary Rati
c. Total Compof Continuing
20,525,837 9,351,083
1.29 1.31
6,709,714
1.32
791,046 37,377,679
1.35
Faculty Mmbrs
d. Ave Fac Salof UU
e. Ave Fac Compof UU
f. Wghtd Ave Salof Comp Inst
g. Wghtd Ave Compof Comp Inst
h. Average Salary
26,384,589 12,255,779
54,158 39,126
69,616 51,279
65,476 47,207
79,659 58,765
8,865,688
35,501
46,908
40,672
50,911
1,068,659 48,574,714
28,252
38,166
30,244
37,873
Difference(d. minus f.)
i. Average Comp
(11,319) (8,081) (5,170) (1,992)
Difference(e. minus g.)
j. Number of
(10,042) (7,486) (4,003) 293
ContinuingFaculty Mmbrs
k. Total Salary
379 239 189 28
Ldfference(h. times j.) (4,289,744)(1,931,387) (977,207) (55,779)(7,254,117)
1. Total CompDifference(i. times j.)
m. Salary Gap(k / a)
n. Comp Gap(1 / c)
(3,806,050)(1,789,161)
-20.90% -20.65%
-14.432 -14.60%
(756,523)
-14.56%
-8.53%
8,205 (6,343,529)
-7.05% -19.41%
0.77Z -13.062

C:\DATABK\FACSR90a LAP:06-Dec-90
Table 3-BCALCULATION OF COMPETITIVE FACULTY SALARY ADJUSTMENT
UTAH STATE UNIVERSITYEstimated Associate Assistant Four Ranks1990-91 Professor Professor Professor Instructor Combined
a. Total Salariesos.: ContinuingFaculty Mmbrs
b. Compensationto Salary Rati
c. Total Compof Continuing
7,096,985
1.31
5,350,433
1.33
4,097,198
1.32
613,905 17,158,520
1.32
Faculty Mmbrs
d. Ave Fac Salof USU
e. Ave Fac Compof USU
f. Wghtd Ave Salof Comp Inst
g. Wghtd Ave Compof Comp Inst
9,304,573
45,787
60,030
61,501
74,648
7,102,893
36,398
48,319
44,986
55,612
5,416,159
30,806
40,723
37,795
46,735
808,025 22,631,649
26,692
35,132
25,893
33,491
h. Average SalaryDifference(d. minus f.)
i. Average Comp
(15,714) (8,589) (6,989) 799
Difference(e. minus g.)
j. Number of
(14,618) (7,293) (6,012) 1,640
ContinuingFaculty Mmbrs
k. Total Salary
155 147 133 23
Difference(h. times j.) (2,435,648)(1,262,540) (929,479) 18,367 (4,609,300)
1. Total CompDifference(i. times j.)
m. Salary Gap Z(k / a)
n. Comp Gap Z(1 / c)
(2,265,801)(1,072,004)
-34.321 -23.60%
-24.35% -15.09Z
(799,586)
-22.69%
-14.76%
37,729 (4,099,663)
2.99% -26.861
4.67% -18.112
1
2?3
49

Table 3-CCALCULATION OF COMPETITIVE FACULTY SALARY ADJUSTMENT
WEBER STATE UNIVERSITYEstimated Associate Assistant Four Ranks1990-91 Professor Professor Professor Instructor Combined
a. Total Salariesof ContinuingFaculty Mmbrs
b. Compensationto Salary Rati
c. Total Compof Continuing
5,172,524
1.32
3,056,463
1.33
3,237,105
1.33
1,193,512 12,659,604
1.36
Faculty Mmbrs
d. Ave Fac Salof WSC
e. Ave Fac Compof WSC
f. Wghtd Ave Salof Comp Inst
g. Wghtd Ave Compof Comp Inst
h. Average Salary
.6,811,904
38,891
51,217
48,904
60,363
4,055,307
32,516
43,142
39,133
50,397
4,320,107
28,903
38,572
33,810
42,251
1,618,127 16,805,444
22,102
29,965
26,656
33,804
Difference(d. minus f.)
i. Average Comp
(10,013) (6,617) (4,908) (4,554)
Difference(e. minus g.)
j. Number of
(9,146) (7,256) (3,679) (3,838)
ContinuingFaculty Mmbrs
k. Total Salary
133 94 112 54
Difference(h. times j.) (1,331,754) (622,003) (549,656) (245,905)(2,749,317)
1. Total CompDifference(i. times j.)
m. Salary Gap Z(k / a)
n. Comp Gap Z(1 / c)
(1,216,429)
-17.86Z
(682,021)
-20.35Z
-16.822
(412,040)
-16.98Z
-9.542
(207,270)(2,517,761)
-20.60Z -21.72Z
-12.81Z -14.98Z

1
1
1
Estimated1990-91
Table 3-DCALCULATION OF COMPETITIVE FACULTY SALARY ADJUSTMENT
SOUTHERN UTAH UNIVERSITYAssociate Assistant Four Ranks
Professor Professor Professor Instructor Combined
a. Total Salariesof ContinuingFaculty Mmbrs
b. Compensationto Salary Rati
c. Total Compof ContinuingFaculty Mmbrs
d. Ave Fac Salof SUSC
e. Ave Fac Compof SUSC
f. Wghtd Ave Salof Comp Inst
g. Wghtd Ave Compof Comp Inst
h. Average SalaryDifference(d. minus f.)
i. Average CompDifference(e. minus g.)
j. Number ofContinuingFaculty Mmbrs
k. Total SalaryDifference(h. times j.)
1. Total CompDifference(i. times j.)
m. Salary Gap Z(k / a)
n. Comp Gap(1 / c)
1,015,914 1,250,682 984,329 222,261 3,473,186
1.33 1.34 1.33 1.41
1,350,737 1,674,642 1,313,746 312,882 4,652,007
37,626 31,267 26,603 24,696
50,027 41,866 35,507 34,765
48,904 39,133 33,810 26,656
60,363 50,397 42,251 33,804
(11,278) (7,866) (7,207) (1,960)
(10,336) (8,531) (6,745) 961
27 40 37 9
(304,503) (314,622) (266,654) (17,642) (903,4!k42)
(279,075) (341,242) (249,552) 8,650 (861,220)
-29.97% -25.16% -27.09% -7.94% -26.01%
-20.66Z -20.38% -19.00% 2.76% -18.51%
51

C:\DATABK\FACSR90b LAP:06-Dec-90
Table 3-ECALCULATION OF COMPETITIVE FACULTY SALARY ADJUSTMENT
ALL FacultyEstimated1990-91 Snow Dixie CEU UVCC
a. Total Salariesof Continuing
SLCC
Faculty Mmbrs
b. Compensationto Salary Ratio
c. Total Compof Continuing
1,934,031
1.37
1,917,990
1.34
1,688,148
1.37
4,759,258
1.36
5,302,816
3.37
Faculty Mmbrs
d. Ave Fac Sal,of Utah Inst
e. Ave Fac Comp,of Utah Inst
f. Wghtd Ave Salof Comp Inst
g. Wghtd Ave Compof Comp Inst
h. Average Salary
2,641,775
30,219
41,278
37,454
47,832
2,568,292
28,206
37,769
37,454
47,832
2,309,076
28,136
38,485
37,454
47,832
6,455,865
30,314
41,120
37,454
47,832
7,278,771
27,910
J8,309
37,454
47,832
Difference[d. minus f.]
i. Average Comp
(7,235) (9,248) (9,318) (7,140) (9,545)
Difference[e. minus g.]
j. Number of
(6,554) (10,063) (9,347) (6,712) (9,523)
ContinuingFaculty Members
k. Total Salary
64 68 60 157 190
Difference[h. times j.] (463,036) (628,894) (559,102) (1,121,047) (1,813,476)
1. Total CompDifference[i. times j.]
m. Salary Gap Z[k / a]
n. Comp Gap Z[1 / c]
(419,474)
-23.94Z
-15.882
(684,285)
-32.79Z
-26.64%
(560,845)
-33.12Z
-24.292
(1,053,762)
-23.56Z
-16.321
(1,809,312)
-34.20Z
-24.86Z

UTAH SYSTEM OF HIGHER EDUCATIONOFFICE OF THE COMMISSIONER OF HIGHER EDUCATION
September 5, 1990
1990-91 ANALYSIS OF CLASSIFIED STAFF SALARYAND COMPENSATION COMPARABILITY
This report constitutes the annual update of the Classified Salary Survey.The attached table and graphs exhibit a five-year time series of the salary,benefits, and total compensation analysis for each institution.
The following methodology section outlines the processes used in gatheringthe data and the assumptions employed in analysis.
Methodology
For several years, the three largest institutions of the Utah System ofHigher Education have conducted annual salary surveys for classified staffpositions. The results of these surveys have been used both for marketplacecomparisons that influence budget requests and for internal salary administrationby the institutions.
Administration of the survey involved considerable effort to insure thatbenchmark ositions were used consistently and appropriately by participatinginstitutions.
Survey administration also included the decision to use aggregated localmarketplace data as a statewide basis of comparison for the smaller institutionslocated in sparsely populated regions. This statewide marketplace comparison--used for Southern Utah University, Snow College, Dixie College, and College ofEastern Utah--includes the combined local marketplace data for Provo, Ogden, SaltLakt City, and Logan. At the recommendation of the Business Affairs Council,Utah Valley Community College and Utah State University are also compared to thestatewide marketplace. Local marketplace comparisons are used for Salt LakeCommunity College, University of Utah, and Weber State University.
In order to implement the above decisions, salary data are gathered yearlyfor Northern Utah by Utah State University, for the Greater Ogden Area by WeberState University, for the Greater Salt Lake Area by University of Utah/Salt LakeCommunity College, and for Utah County by Utah Valley Community College. Everythree years all local marketplaces for the nine institutions are surveyed.
In addition to providing salary information, the attached exhibits showcomparisons for benefits. The relationship between benefits and salaries foreach institutions for 1988-89 is used to estimate benefits and total compensationfor 1990-91. The percentage relationship for both institutions and their marketsis applied to the actual average salaries of each.
2c()53

This relationship is projected because the gathering of benefits dataimposes a substantial extra burden on respondents in the private sector and mightdepress response level. Therefore, the benefits survey is also conducted onlyevery three years.
Results
The 1986-87 through 1990-91 comparisons by institutions are summarized inthe table and graphs on the following pages. Using percentages, these exhibitsshow salary, benefit, and total compensation comparisons for each institutionrelative to its above-described market.
The salary and compensation results for 1990-91 are summarized below foreasy access.
TABLE 1
Classified Salary Survey Results for 1990-91
Institutions Salary CompensationUniversity of Utah -21.2004 -10.86%
Utah State University -23.90% -13.07%Weber State University -32.10% -18.90%So. Utah University -26.10% -11.81%Snow College - 8.90% 4.78%Dixie College -26.10% -13.89%College of Eastern Utah -18.10% - 7.82%Utah Valley Comm. College -26.80% -14.46%Salt Lake Comm. College -16.50% - 2.09%
The average salary gaps for 1990-91 range from -32.10% at Weber State tc -
8.90% at Snow College. After considering the impact of fringe benefits nn total
compensation, the gaps narrow to -18.90% and 4.78% at the two schools,
respectively.
This information was derived from the tables for each institution at theend of this report.
c:\databk\css90.txtLAP
54

a:\sbr\9091como
TABLE 21986-87 TO 1990-91 CLASSIFIED SALARY SURVEY
TOTAL COMPENSATION COST ANALYSIS
Institution
Salary & BenefitDifferentialsFrom Market
University of Utah a. Salaryb. Benefitsc. Compensation
Utah State University a. Salaryb. Benefitsc. Compensation
Weber State University a. Salary
b. Benefitsc. Compensation
So. Utah University a. Salaryb. Benefitsc. Compensation
Snow College a. Salaryb. Benefitsc. Compensation
Dixie College a. Salaryb. Benefitsc. Compensation
College of Eastern Utah a. Salaryb. Benefitsc. Compensation
Utah Valley Comm. College a. Salaryb. Benefitsc. Compensation
Salt Lake Comm. College a. Salaryb. Benefitsc. Total
1986-87 1987-88 1988-89 1989-90 1990-91
..
-21.07% -19.81% -26.10% -17.00% -21.20%
27.584 28.33% 30.86% 33.03% 32.73%
-11.37% -10.21% -15.18% -7.74% -10.86%
-24.74% -17.96% -26.10% -23.40% -23.90%
21.35% 25.63% 23.35% 24.99% 27.09%-15.18% -8.91% -15.60% -13.12% -13.07%
-25.14% -28.17% -30.10% -25.00% -32.10%
26.57% 24.79% 31.42% 34.11% 29.39%-14.34% -17.12% -16.89% -12.31% -18.90%
-28.58% -24.99% -30.30% -24.10% -26.10%
28.84% 30.83% 33.14% 36.32% 38.99%
-16.81% -13.54% -16.37% -10.84% -11.81%
-17.39% -16.06% -22.80% -16.10% -8.90%
32.08% 32.86% 36.36% 39.83% 50.40%
-7.49% -6.27% -9.15% -3.20% 4.78%
-17.65% -15.21% -30.20% -19.60% -26.10%24.91% 26.47% 25.32% 31.40% 32.02%
-9.03% -6.77% -18.53% -8.88% -13.89%
-14.63% -7.80% -17.90% -19.10% -18.10%
26.01% 30.42% 29.45% 28.73% 31.69%
-7.03% -0.65% -8.13% -9.22% -7.82%
-18.74% -14.35% -22.40% -21.00% -26.80%
27.87% 30.53% 28.92% 29.74% 29.49%-9.04% -5.01% -11.15% -9.87% -14.46%
-14.584 -11.11% -22.70% -20.40% -16.50%
29.13% 31.28% 38.73% 39.884 48.43%
-5.66% -2.46% -9.06% -7.02% -2.09%
Footnote:a. Local Markets were used for University of Utah, Weber State University,
and Salt Lake Community College. Statewide Markets were used for all others.b. Benefit Costs were estimated during 1986-87 and 1987-88 based on 1985-86 actuals.
Benefit Costs were estimated during 1989-90 and 1990-91 based on 1988-89 actuals.
ct2
55

Uni
vers
ity o
f Uta
hT
otal
Com
pens
atio
n C
ost A
naly
sis
Pco
ant 0
41fw
ntla
ls F
rom
Mar
ket
0.4
0.3
0.2
0.1 0
-0.1
-0.2
-0.3
1966
-37
1987
-66
1988
-89
19e9
-90
1990
-91
Yea
r
II[In
'Sal
ary
ES
S:1
Bon
.fits
MC
onlm
onsa
tion
Cla
yat S
ad S
alar
y S
ans,
lalla
rmat
ioa
0 ;)
Uta
h S
tate
Uni
vers
ityT
otal
Com
pens
atio
n C
ost A
naly
sis
Por
oont
Drn
eren
tlals
Fro
m M
arke
t0.
3
0.2
0.1 0
-0.1
-0.2
-0.3
1938
-67
1987
-36
1033
-60
1909
-90
1940
-91
Yea
r
1111
1 S
alar
yC
O03
nollt
ioE
D C
oo's
:401
41bn
l
Cla
* M
od S
alar
y S
erar
ry la
lorn
alls
o
1111
11N
M II
1 O
M II
I MI
IIIIII
IMO
Web
er S
tate
Uni
vers
ityT
otal
Com
pens
atio
n C
ost A
naly
sis
Perc
ent D
iffe
rent
ials
Fro
m M
arke
t0.
4-
0.3
02 -
0.1 0
-0.1
--0
2 -
-0.3
--0
.4 -r 19
86-8
719
87-8
819
88-8
919
89-9
019
90-9
1
Yea
r
=Sa
lary
Ben
efits
1-1C
ompe
nsat
ion
Cjs
0M
rJ rri
1111
111"
1111
1ry
1111
11r1
1111
11O
N O
MO
M

as a
m m
e N
s am
me
am a
m a
sum
Sou
ther
n U
tah
Uni
vers
ityT
otal
Com
pens
atio
n C
ost A
naly
sis
Per
cent
DIff
eren
ttala
Fro
m M
arke
t0.
6 -+
0.4
0.3
02 0.1
-
-0.1
--0
.2-0
.3 -
-0.4
1986
-87
tO87
-88
1988
-89
1989
-90
1990
-91
Yea
r
[1
MI S
alar
yF
il B
enef
itsE
D C
ompe
nsat
ion
Cia
evlS
ad g
aiet
y S
urve
y in
form
atio
n
2S7
Sno
w C
olle
geT
otal
Com
pens
atio
n C
ost A
naly
sis
Per
cent
Dif
fore
ntla
la F
rom
14a
rlot
1988
-87
198T
-88
1911
6-89
Yea
r19
119-
9019
90-9
1
iMS
ttal
ary
Ecl
a.ro
nts
=I C
ompe
nsat
ion
Cla
ssifi
ed S
alar
y S
urve
y lu
terr
natle
aD
ixie
Col
lege
Tot
al C
ompe
nsat
ion
Cos
t Ana
lysi
sP
erow
n D
Iflar
entia
ls F
ront
War
hol
0 4
0.3
0.2
0.1
-0.1
teee
-57
108T
-se
1098
-89
1089
-90
1990
-01
Yea
r
IMIS
alar
yE
D B
enef
its[._
3Com
pans
stlo
n
Mas
ai/1
M S
alar
y S
erve
" Is
tsra
eSem
2SE

IIIM
MI e
alar
yE
il B
anol
itsE
D c
omp.
fisao
an
0.4
0.3
0.2
0.1
-0.1
-0.2
Col
lege
of E
aste
rn U
tah
Tot
al C
ompe
nsat
ion
Cos
t Ana
lysi
sIlo
roon
t Diff
oroo
f lob
Fro
m M
ale/
1067
-111
116
66-9
9
Yea
r10
69-9
010
004/
IN s
alar
yB
nefit
sE
D C
orsp
onsa
tFon
Clo
ut"
led
Sala
ry &
arra
y lo
lorm
aNar
V-
C°
2' 9
Uta
h V
alle
y C
omm
unity
Col
lege
Tot
al C
ompe
nsat
ion
Cos
t Ana
lysi
s13
roon
t Dfif
oron
tIoM
Fro
m M
arlo
t0.
4 -
0.3
-
0.2
-
0.1
-
-0.1
-
-0.2
-
-0.3
1994
3-97
1911
7-99
1941
a-es
1999
-90
1990
-91
Yea
r
Cla
solf
lod
Sala
ry a
nyw
ay la
term
atie
,
II1M
I
Sal
t Lak
e C
omm
unity
Col
lege
Tot
al C
ompe
nsat
ion
Cos
t Ana
lysi
sP
orco
ot D
Iffor
ontla
l Fro
m M
ario
t0.
6
0.4
-
0.2
-
-0.2
- 0
.4
/919
6-67
19e
7-66
ame-
asY
ear
i909
-90
1900
-91
/11
/War
yC
O B
onen
.E
D C
orsp
onsa
t ion
2"'
0
Cla
calS
ed
6811
211,
11.
MB
11.1
1111
/11
1111

The statistics included in Tab K for Libraries are compiled from the IPEDS Libraryand Finance surveys.
TABLE 1 Library Staffing 1
TABLE 2 Library Operating Expenditures 1
TABLE 3 Library Collections - Books, Bound Serials & Government Documents 1
TABLE 4 Library Collections - Microforms 2
TABLE 5 Library Collections - Other Items 2
TABLE 6 Library Loan Transactions 3
TABLE 7 Library Service Per Typical Week 3
TABLE 8 Library Expenditures History 4
2911

Ili
1IIISource: IPEDS Library Survey 1990
Table 1
UTAH SYSTEM Cf HIGHER EDUCATICM
Library Staff
1
Librarians &
Institutions Professional Staff Other Paid Staff Student Assistants Total FTE Staff
IIIFall 1988 Fall 1990 Fall 1988 Fall 1990 Fall 1988 Fall 1990 Fall 1988 Fall 1990
University of Utah 64.50 63.00 137.80 139.00 87.50 100.00 289.80 302.00
Utah State University 23.00 21.00 25.00 27.00 22.00 20.00 70.00 68.00
Weber State University
Snow College
9.00 11.00 18.25 22.00 30.00 18.00 57.25 51.00
Southern Utah University 4.00 6.00
3.00
6.20 5.50 2.40
2.65
2.50 12.60 14.00
2.66 2.99 3.66 1.53 8.30 8.19
Dixie College 2.00 1.75 3.75 3.59 3.10 2.88 8.85 8.22
College of Eastern Utah 1.00 1.00 3.50 3.00 1.85 1.13 6.35 5.13
Utah Valley Comm. College 1.00 1.00 5.50 6.50 2.72 2.35 9.22 9.85
Salt Lake Comm. College 1.75 1.75 3.00 4.95 3.50 5.00 8.25 11.70
SYSTEM TOTAL 108.91 109.50 205.99 215.20 155.72 153.39 470.62 478.09
1111
III
III
Cther includes postage, telecommunication, database searches, computer services, etc
Source: IPEDS Library Survey 1990
III
Table 3
111
UTAM SYSTEM Of HIGHDI EDUCATION
Library Collections: Books, Bound Serials and Gov't Documents
Fiscal Year 1989-90
111
111
III
III
Table 2
m i SYSTEM OF HIGHER EDUCATION
Library Operating Expenditures
Other Operating Total Operating
Institutions Salaries & Wages Collections Preservation Equipment Expenditures * Expenditures
FY 87-88 FY 89-90 FY 87-88 FY 89-90 FY 87-88 FY 89-90 FY 87-88 FY 89-90 FY 87-88 FY 89-90 FY 87-88 FY 89-90
University of Utah $4,174,220 $4,468,260 $3,728,300 $3,913,006 $133,604 $195,551 $531,677 $305,845 $1,075,688 $1,147,878 $9,643,489 $10,030,540
Utah State University $1,095,646 $1,118,786 $1,290,092 $1,458,077 $72,616 $78,061 $38,061 $78,807 $187,946 $184,795 $2,684,361 $2,918,526
Weber State University $681,150 $791,642 $376,193 $521,550 $13,573 $791 $7,063 $67,272 $71,740 $140,156 $1,149,719 $1,521,411
;outhern Utah University $248,367 $223,363 $105,174 $130,884 $0 $0 $36,698 $21,222 $36,649 $22.666 $426,888 $398,135
Snow College
Dixie College 1:14)::
College of Eastern Utah $61,159 $69,570
$119;:01 $28,563 $40,526
$35,390
$33,831
$56,409
$467
$486
$799
$0 $3,4205
$5f133:: $8,700 $15,768 $17,321 $114,084 $179,442
$1,210
$21,385 $21,775 $19,915 $143,565 $194,888
$2,343 $28,364 $6,738 $124,564 $135,053$52,977
Utah Valley Comm. College $111,814 $142,053 $85,995 $115,516 $0 $1,532 $15,162 $10,883 $20,940 $25,882 $233,911 $295,866
Salt Lake Comm. College $123,823 $244,259 $107,802 $162,254 $0 $0 $0 $9,924 $3,508 $18,468 $235,133 $434,905
IIISYSTEM TOTAL $6,645,908 $7,267,208 $5,791,340 $6,451,199 $220,746 $280,159 $635,342 $526,381 $1,462,378 $1,583,819 $14,755,714 $16,108,766
Volumes Titles Government Documents
Added I Held at I Added I Held at I Added I Held at
Institutions During Year Year End During Year Year End During Year Year End
Uriversity of Utah 68,207 2,153,403 n/a n/a 31,278 659,736
Utah State University 25,364 815,797 21,855 473,334 229,547 382,183
Weber State University 5,760 324,823 2,594 288,801 6,061 229,860
Southern Utah University 23,085 169,800 n/a n/a 0 8,279
Snow College 1,381 30,217 1,219 27,195 n/a n/a
Dixie College , 2,438 57,015 2,070 n/a
College of Eastern ah 278 34,413 250 34,350 12 212
Utah Valley Comm. College 6,450 44,224 4,810 35,949
0
Ut
0
0
0
Salt Lake C. College 3,789 46,215 3,543 42,001 o o
SYSTEM TOTAL
Number Added does not include the numbe:3:17t:draw7.75,907
341 901,633 266,898 1,280,270
Source: IPEDS Library Survey 1990
1

Table 4
UTAH SYSTEM OF HIGHER EDUCATInN
Library Collections: Microforms
Fiscal Year 1989-90
Institutions
Book Titles
Added I Held at
During Year Year End
Serial Titles
I Added f Reid at
During Year Year End
Government Documents
I Added I Held at
During Year Year End
Total Physical Units
f Added I Held at
During Year Year End
University of Utah * n/a n/a n/a n/a n/a 'Vet 104,347 2,863,675
Utah State University 19.091 585,611 0 410 28,694 375,673 91,913 1,607,099
Weber State University 0 0 9 118 0 0 10.013 561,456
Southern Utah University n/a n/a 7 47 0 24,850 16,105 492,458
Snow College 0 10 0 67 0 0 7,064 28,800
Dixie College 0 13,575 2 40 0 0 390 17,346
College of Eastern Utah 0 0 0 29 0 0 1,536 3,500
Utah Valley Comm. College 0 0 0 0 0 0 0 3,038
Salt Lake Comm. College 0 20 29 56 0 0 0 0
SYSTEM TOTAL 19,091, 599,216 47 767 28,694 400,523 241,368 5,577,372
* Total added for book, serial, and government document icroforms equals 1,834. Total microforms held at year end equals 9,484.
Humber Added does not include the number withdrawn.
Source: IPEDS Library Survey 1990
Table 5
UTAH SYSTEM OF HIGHER EDUCATION
Library Collections: Other
Fiscal Year 1989-90
Institutions
Serial
Subscriptions
f Added I Held at
During Year Year End
Manuscripts & Archives
(in linear feet)
0 Added 0 Held at
During Year Year End
Cartographic
Materials
Added
During Year
Held at
Year End
Graphic
Materials
f Added
During Year
t Held at
Year End
University of Utah 50 15,474 900 9,915 5,919 150,600 21,937 494,165
Utah State University 151 5,988 2C. 5,259 3,120 72,392 30,000 318,950
Weber State University 61 2,778 120 1,389 2,211 49,996 0 0
Southern Utah University 9 654 70 208 370 940 118 5.841
Snow College 0 196 0 10 153 1,958 359 n/a
Dixie College 10 201 n/a 93 0 307 0 0
College of Eastern Utah 2 6 1 30 0 50 0 469
Utah Valley Comm. College 4 364 0.5 7 0 142 0 49
Salt Lake Comm. College 15 319 3 17 0 691 19 2,254
SYSTEM TOTAL 302 25,980 1,294.5 '5,928 11,773 277,076 52,433 821,728
Institutions
Audio
Materials
I Added
Durird Year
f Held at
Year End
Films
I Added
During Year
f Held at
Year End
Video
Materials
I Added
During Year
I Held at
Year End
Machine Readable
Materials
0 Added S Held at
During Year Year End
University of Utah 171 28,060 n/e 686 1,024 4,972 53 82
Utah State University 7 16,665 22 2,310 444 1,788 2 39
Weber State University 5 3,204 0 2,511 271 1.449 10 244
Southern Utah University 320 2,803 13 615 127 427 76 2,037
Snow Coliege 29 n/a 2 n/a 24 n/a 1 n/a
Dixie College 160 1,050 0 13 54 59 2 10
College of Eastern Utah 3 812 0 40 4 112 1 1
Utah Valley Comm. College 7 547 0 98 11 188 0 0
Salt Lake Comm. College 35 4,298 0 729 279 1,730 6 37
SYSTEM TOTAL 566 29,379 37 6,316 1,214 5,753 98 2,368
Total held at end of year for graphic, audio, film, and video materials equals 1,876.
Number Added does not include the number withdrawn.
Source: IPEDS Library Survey 1990
2 f
2
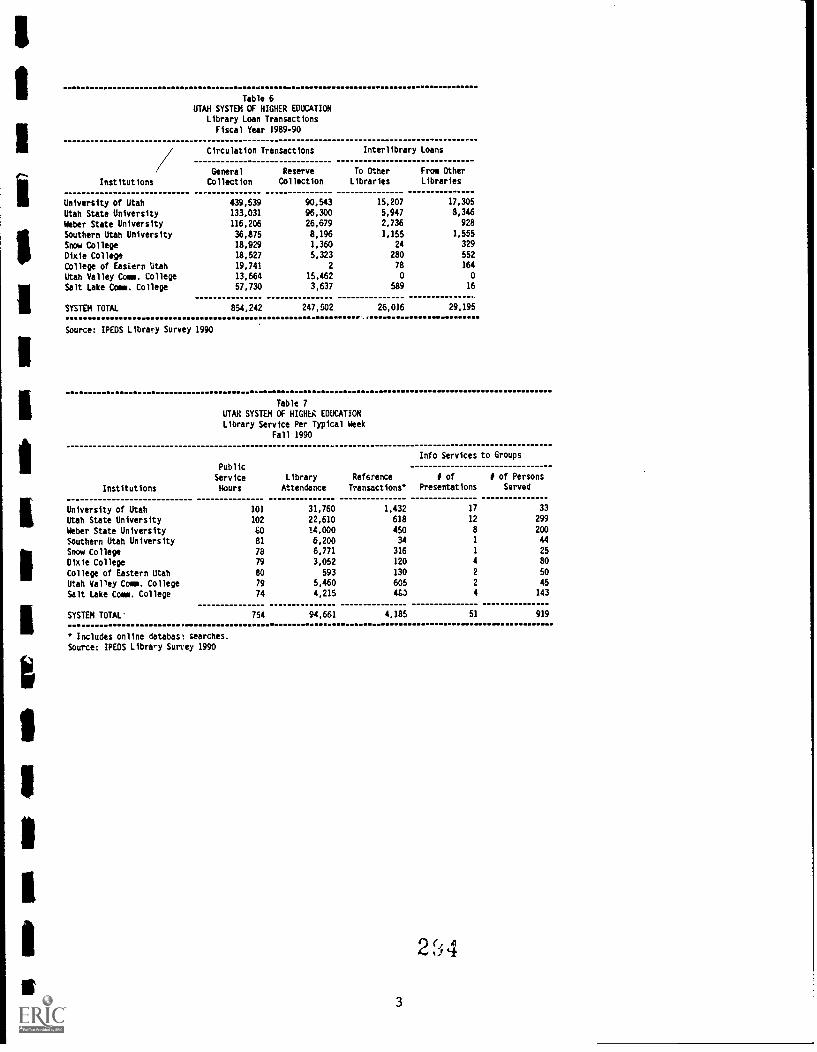
Table 6
UTAH SYSTEM OF HIGHER EDUCATION
Library Loan Transactions
Fiscal Year 1989-90
Institutions
Circulation Transactions
General Reserve
Collection Collection
Interlibrary Loans
To Other From Other
Libraries Libraries
University of Utah 439,539 90,543 15,207 17,305
Utah State University 133,031 96.300 5,947 8,346
Weber State University 116,206 26,679 2,736 928
Southern Utah University 36,875 8,196 1,155 1,555
Snow College 18.929 1,360 24 329
Dixie College 18,527 5,323 280 552
College of Eastern Utah 19.741 2 78 164
Utah Valley Comm. College 13,664 15,462 0 0
Salt Lake Comm. College 57,730 3,637 589 16
SYSTEM TOTAL 854,242 247,502 26,016 29,195
Source: IPEDS Library Survey 1990
Table 7
UTAH SYSTEM OF HIGHER EDUCATION
Library Service Per Typical Week
Fall 1990
Institutions
Public
Service
Hours
Library
Attendance
Reference
Transactions*
Info Services to Groups
of 1 of Persons
Presentations Served
University of Utah 101 31,760 1,432 17 33
Utah State University 102 22,610 618 12 299
Weber State University GO 14,000 450 8 200
Southern Utah University 81 6,200 34 1 44
SDOW College 78 6,771 316 1 25
Dixie College 79 3,052 120 4 80
College of Eastern Utah 80 593 130 2 50
Utah Valley Coen. College 79 5,460 605 2 45
Salt Lake Comm. College 74 4,215 43 4 143
SYSTEM TOTAL- 754 94,661 4,185 51 919
* Includes online databast searches.
Source: IPEDS Libriry Survey 1940

Table 8
UTAH SYSTEM OF HIGHER EDUCATION
Library Expenditures History
Fiscal Years 1986-89 through 1989-90
Institution
Expenditures
Library For Acquisition of
Year Expenditures Library Materials
University of Utah 1986-87 $7,377,371 $4,203,887
1987-88 $10,014,158 $3,854,685
1988-89 $9,830,813 $4,454,686
1989-90 $9,482,227 $4,488,787
Utah State University 1986-87 $2,737,488 $1,140,640
19E17-88 $3,243,497 $1,276,648
1988-89 $3,402,692 $1,516,047
1989-90 $2,998,188 $1,542,138
Weber State University 1986-87 $1,536,018 $465,654
1987-88 $1,426,141 $426,353
1988-89 $1,551,651 $545,246
1989-90 $1,769,545 $547,197
Southern Utah University 1986-8i $437,993 $86,427
1987-88 $426,772 $107,190
1988-89 $496,160 $125,688
1989-90 $569,872 $177,075
Snow Colleim 1986-87 $204,634 $50,487
1987-88 $117,087 $37,569
1988-89 $235,680 $19,142
1989-90 $251,817 $23,444
Dixie College 1986-87 $166,522 $35,560
1987-88 $216,010 $38,242
1988-89 $165,952 $34,350
1989-90 $182,874 $21,954
College of Eastern Utah 1986-87 $141,218 $14,553
1987-88 $168,604 $23,955
1988-89 $147,470 $24,699
1989-90 $148,795 $33,793
Utah Valley Comm. College 1986-87 $396,630 $83,266
1987-88 $233,204 $43,005
1988-89 $495,927 $34,769
1989-90 $305,490 $39,038
Salt Lake Comm. College 1986-87 $372,283 $151,405
1987-88 $301,475 $97,426
1988-89 $335,295 $101,805
1989-90 $446,347 $153,156
SYSTEM TOTAL 1986-87 $13,370,157 $6,231,879
198748 $16,146,448 $5,905,073
1988-89 $16,661,640 $6,856,432
1989-90 $16,155,155 $7,026,582
Source: 1PEDS Finance Survey
4

I
TAB LCOMPARISONS
I
Explanation and Analysis 1
FIGURE 1 University of Utah Profile, 1987-88 2
FIGURE 2 Utah State University Profile, 1987-88 3
FIGURE 3 Weber State University Profile, 1987-88 4
FIGURE 4 Southern Utah University Profile, 1987-88 5
FIGURE 5 Snow College Profile, 1987-88 6
FIGURE 6 Dixie College Profile, 1987-88 7
FIGURE 7 College of Eastern Utah Profile, 1987-88 8
FIGURE 8 Utah Valley Community College Profile, 1987-88 9
FIGURE 9 Salt Lake Community College, 1987-88 10
Fall FTE Enrollment, 1984-85 to 1987-88 11
Tax Funds Appropriations per FTE 13
Tax Appropriations % of Education & General Revenues 15
Tuition and Fees per FTE 17
Tuition and Fees % of Instruction Direct Expenditures 19
Endowment Revenue per FTE 21
Government Grants & Contracts per FTE 23
Private Gifts, Grants & Contracts per FTE 25
Total Revenues per FTE 27
Instruction Expenditures per FTE 29
2 6
TAB LCOMPARISONS
--Continued--
Research Expenditures per FTE 31
Research Expenditures % of Instruction Expenditures 33
Academic Support Expenditures per FTE 35
Student Services Expenditures per FTE 37
Scholarships & Fellowships per FTE 39
Institutional Support Expenditures per FTE 41
Physical Plant 0 & M Expenditures per FTE 43
Total Expenditures and Transfers per. FTE 45
2 7

PEER GROUP FINANCIAL COMPARISONS
Background
The Commissioner's Office develops annual analyses of faculty compensation and of tuitionand fees for USHE institutions compared to selected sets of "peer or comparison institutions. Thecomparison institution sets were updated last year, to correct for changes in status of some of theinstitutions on the previous comparison lists. In every case, the result of the changes was lower, nothi her differences in facult salaries and total corn ensation between USHE institutions and theircomparison groups. Four sets of comparison institutions are used: one each for the University ofUtah and Utah State University, a single set for both Weber State University and Southern UtahUniversity (comprehensive institutions), and one set for all five community colleges.
Broad comparisons of revenues and expenditures per FTE student also are available for FiscalYears 1985 through 1988 based on data reported annually to the U.S. Department of Education, Centerfor Education Statistics. Comparisons based on the national data base, edited and processed by theNational Center for Higher Education Management Systems (NCHEMS), are presented in the followinggraphs and tables.
Description of Data Presented
Figures 1 through 9 provide individual Financial Indicators Profiles for the latest available year!or each of the nine USHE institutions, comparing the Utah institution to the appropriate comparisongroup on eleven of the most relevant indicators. The first three indicators are key revenuerelationships and the remaining eight are key expenditure relationships.
These eleven indicators plus a few additional ones are presented in greater detail in the tablesthat begin on page 13. Data are shown, by institution, for the four latest years available from thenational data base. Institutions are listed in each table in high to low rank order based on the mostrecent year.
What the Comparisons Show
Based on the Financial Profiles in Figures 1 through 9, the following observations seemwarranted:
University of Utah: Below average appropriations and tuition/fees, but above-averageproductivity in obtaining government grant and contract funding. Below-average expenditures across-the-board, most especially in instruction and in scholarships/fellowships.
Utah State University: Below average appropriations and tuition/fees, but substantially above-average in obtaining grant and contract funds. Below average expenditures in most categories, withthe notable exception of Research and Scholarships/Fellowships.
Weber State University and Southern Utah University: Below average tax appropriations andtuition and fees. Below average instructional expenditures, markedly so at SUU.
Community Colleges: Average or above average tax appropriations at Snow and CEU, belowaverage at the other Colleges. About average tuition and fees at the three smaller colleges, aboveaverage at SLCC. Generally above-average performance in obtaining grants and contracts. Belowaverage instruction expenditures at all five Colleges, markedly so at Dixie and UVCC. Generally aboveaverage r ?port program expenditures at the two smallest Colleges, and moderately below averageat the others, with a few minor exceptions.

FINANCIAL INDICATORS PROFILEUniversity of Utah 1987-8E
20,000$ Par FTE
15,000
10,000
U of U ISM Comp Group
5,000
I i 1 I leI I I I I
T T G I R Aa u o n a cx I v s s a
t t t a dF I r au 0 e u r Sn n r c C ud a t h p$ a n I P
t 0 EA F I n x Ep a p xP a I E a pr a x n aO C p d np 0 a d
n nt d
a
ifa
if
a
U of UComp GroupU of U %
6,0947,43082.02
1,9052,87666.24
4,4374,064109.2
5,2656,68078.82
3,1353,73883.87
1,3461,69479.46
418533
78.42
637904
70.47
1,0681,21887.69
1,0891,19990.83
15,83117,65189.69
2,')

FINANCIAL INDICATORS PROFILEUtah State University 1987-88
$ Per FTE
5,000
IMUSU agComp Group
...... ....... .
0
0
aa
aa
a
a
0
a
1
0
a
a

FINANCIAL INDICATORS PROFILEWeber State University 1987-88
$ Per FTE
MN WSU =Comp Group
Tax
Funda
ApproP
Tu
I1
0n
a
Faas
00vt
eranta
a
C0nt
1
natruct1
0n
ExPand
R
aaarch
Expand
Acad
$uPFt
Exaand
8tudant3vc
E
aand
Sch1
rahP
a
F1
wahP
I
nsti
t
SuPa
ExPand
P1
antMa0Exaand
T0ta
1
Eaa
ExPand
3,604,5479.3
1,3341,647
81
897938
95.63
2,0233,36386.9
56145
38.62
52164880.4
423611
69.23
587608
96.55
553838
65.99
692799
86.6
5,6887,42276.64
3 ,1

FINANCIAL INDICATORS PROFILESouthern Utah University 1987-88
$ Par FTE
1111118UU ESSIComp Group
1
a
naa
0fl
a
0
a
0A
aa
00 a
3,558 1,129 1,103 2,1304,545 1,647 938 3,36373.28 68.55 117.6 63.34
T-Ra
aa
X
aEl
0145
0
InnF
A
a
aEl
aEl
aIi
a
a
aEl
0
aEl
656 580 909 764 754648 611 608 aaa 799101.2 94.93 149.5 91.17 94.37
0
a
a
aEl
6,5177,422137.81
5 )2

FIGURE 5
FINANCIAL INDICATORS PROFILESnow College 1987-88
20,000$ Par FTE
15,000
10,000
5,000
0
111111 Snow ES210Ornp Group
1
a
A
1
0Ii
a
aa
0
a
a
0
a
aa
a
1
a
a
1
a
a0
a
0
a
aa
13
aii
SnowComp GroupSnow %
4,287 945 1,232 2,472 7 400 806 6223,716 1,062 693 2,749 3 502 521 457115.4 88.98 177.8 89.92 233.3 79.68 154.7 136.1
1,072812132
1,051610
172.3
7,2345,762125.6
6 3
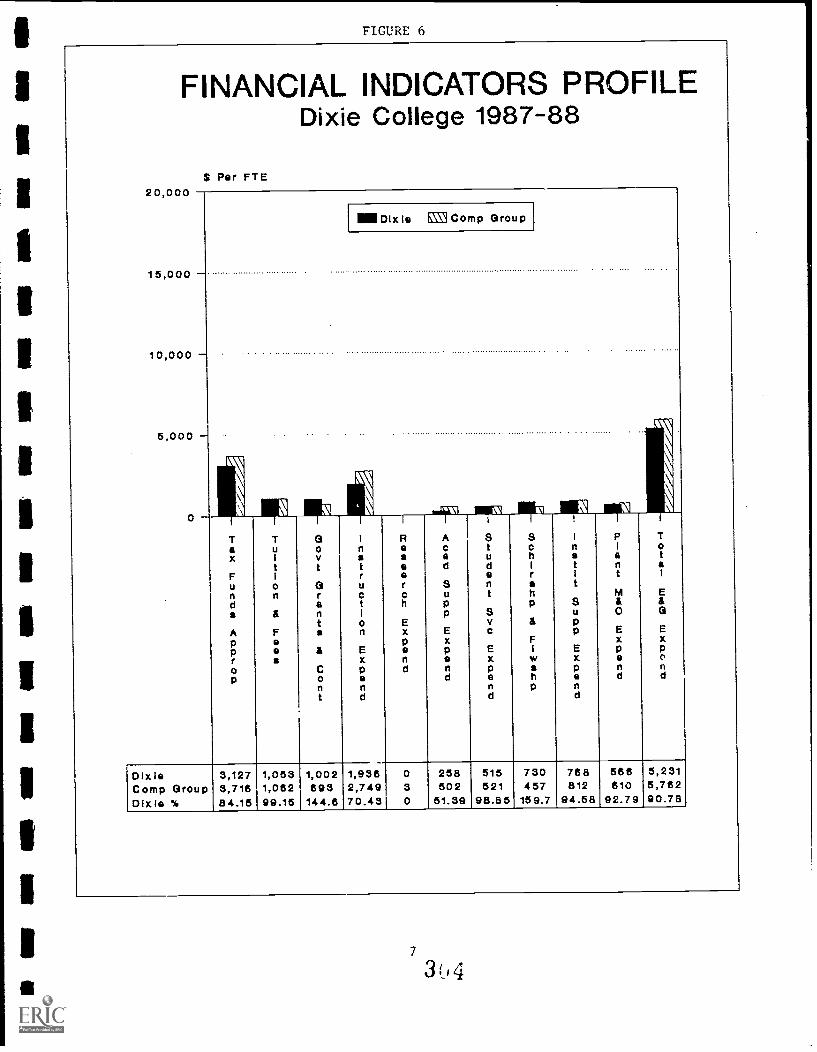
FIGURE 6
FINANCIAL INDICATORS PROFILEDixie College 1987-88
$ Per FT E
NM Dixie &Cornp Group
,arZ1 MIEN

FINANCIAL INDICATORS PROFILECollege of Eastern Utah 1987-88
0
$ Per FT E
IIIICEU CM Comp Group
ti
Ii
a
aaa
a
aaI.
a
maiq
a
a0
a
a
a
a
a
a
3,6583,71698.44
7421,06269.87
1,450693
2092 .
2,2962,74983.52
0
0
391502
77.E9
687521
131.9
894457
195.6
1,079812
132.9
814610
133.4
6,2395,762108.3
8

FINANCIAL INDICATORS PROFILEUtah Valley Comm. College 1987-88
0
$ Per FTE
i1
11111UVCC EES] Comp Group

FIGURE 9
FINANCIAL INDICATORS PROFILESalt Lake Comm. College 1987-88
$ Par FTE
SLCC ESS Comp Group 1
INV0
a
A
0
0
a
aa
aa
0
a
a
aa
aIi
A
a
a
a
a
a
a
a
a
a
a
a
2,816 1,311 973 2,398 288 570 586 678 493 5,0733,716 1,062 693 2,749 3 502 52 457 812 610 5,76275.78 123.4 140.4 87.23 57.37 109.4 128.2 83.5 80.82 88.04

Indicator: FALL FTE ENROLLMENT, 1984-85 TO 1987-88
1989-90 1988-89
Amount Rank Amount Rank
1987-88
Amount Rank
Comparison Group:
1986-87
Amount Rank
UNIVERSITY OF UTAH
1985-86 1984-85
Amount Rank Amount Rank
Univ California, Los Angeles 33,802 1 32,727 1 32,645 1 32,645 1
Purdue University. Main Campus 30,786 2 30,001 3 29,750 3 29,184 4
University of Florida 29,823 3 31,213 2 31,666 2 31,611 2
University of Washington 29,010 4 29,177 4 29,384 4 29,445 3
University of Arizona 27,147 5 25,793 5 25,418 6 24,869 6
University of Iowa 25,071 6 25,611 6 25,637 5 25,776 5
Univ Cincinnati, Main Campus 24,123 7 22,366 7 22,518 7 22,826 7
Univ of Colorado, Boulder 22,006 8 20,987 8 20,997 8 20,650 8
Univ North Carolina (Ch Hill) 20,207 9 20,228 9 19,733 9 19,365 9
UNIVERSITY OF UTAH 18,504 10 18,417 10 18,359 10 18,481 10
Univ of Virginia. Main Campus 17,817 11. 17,972 11 16,462 11 16,168 11
COMPARISON GROUP AVERAGE 25,979 25,608 25,421 25,254
PERCENT OF COMP GROUP AVE:
University of Utah 71.23% 71.92% 72.22% 73.18%
Indicator: FALL FTE ENROLLMENT, 1984-85 TO 1987-88
1989-90 1988-89
Amount Rank Rank
1987-88
Amount Rank
Comparison Group:
1986-87
Amount Rank
UTAH STATE UNIVERSITY
1985-86 1984-85
Amount Rank Amount Rank
Texas A & M Univer;ity 36,196 1 33,763 1 32,820 1 33,835 1
Univ of Maryland, :ollege Pk 31,576 2 31,989 2 32,118 2 31,700 2
Iowa State University 23,817 3 24,502 3 24,569 3 24,463 3
Virginia Tech University 22,587 4 22,264 4 21,888 4 21,288 4
Univ of California, Davis 19,319 5 18,421 6 18,205 6 18,205 6
North Carolina State Univ 19,182 6 19,633 5 19,340 5 19,083 5
Colorado State University 17,695 7 17,350 7 16,698 7 16,722 7
Washington State University 15,489 8 15,286 8 15,357 8 15,721 8
Oregon State University 13,800 9 14,295 9 14,376 9 14,784 9
New Mexico State University 11,878 10 11,538 10 11,282 10 11,271 10
UTAH STATE UNIVERSITY 9,719 11 9,649 11 9,147 11 9,262 11
COMPARISON GROUP AVERAGE 21,154 20,904 20,665 20,707
PERCENT OF COMP GROUP AVE:
Utah State University 45.94% 46.16% 44.26% 44.73%
3,3
11

Indicator: FALL FTE ENROLLMENT, 1984-85 TO 1987-88 Comparison Group: COMPREHENSIVE INSTITUTIONS
1989-90 1988-89 1987-88 1986-87 1985-86 1984-85
Amount Rank Rank Amount Rank Amount Rank Amount Rank Amount Rank
Univ of Wisconsin, Oshkosh 9,339 1 9,375 1 9,242 1 9,058
WEBER STATE UNIVERSITY 8,706 2 8,299 2 8,029 2 7,685
Univ of Nevada, Las Vegas
Boise State University
8,565
8,096
3
4
7,950
7,717
3
4
7,521
7,667
4
3
7,006
8,109
Eastern Washington University 6,889 5 6,967 5 7,422 5 7,422
SUNY College at Brockport 6,072 6 5,826 6 5,715 6 5,795
Calif St Univ, Dominguez Hills
S outhern Oregon State College
4,975
3,960
7
8
4,764
3,595
7
9
5,555
3,678
7
9
5,555
3,631
Univ of Southern Colorado 3,450 9 3,257 10 3,653 10 4,197
Austin Peay State University 2,857 10 3,886 8 3,947 8 4,161
Indiana University Korthwest 2,841 11 2,769 11 2,745 11 2,813
Southern Utah University 2,644 12 2,522 12 2,280 12 2,265
COMPARISON GROUP AVERAGE 5,704 5,611 5,715 5,775
PERCENT OF COMP GROUP AVE:
Weber State University 152.63% 147.91% 140.49% 133.07%
Southern Utah University 46.35% 44.95% 39.90% 39.22%
1
3
4
2 15
6
i7
10
8
9
I11
12
III
(
1Indicator: FALL FTE ENROLLMENT, 1984-85 TO 1987-88 Comparison Group: COMMUNITY COLLEGES
1989-90 1988-89 1987-88 1986-87 1985-86 1984-85
IAmount Rank Rank Amount Rank Amount Rank Amount Rank Amount Rank
I
I
I
111
I
1
I
Grand Rapids Junior College 6,190 1 6,005 1 5,693 1 5,472 1
SALT LAKE COMMUNITY COLLEGE 5,551 2 5,437 2 5,162 2 5,068 2
Anne Arundel Comm College 5,225 3 4,943 3 4,544 6 4,415 7
UTAH VALLEY COMMUNITY.COLLEGE 5,043 4 4,544 6 4,697 5 4,584 6
Joliet Junior College 4,991 5 4,793 4 5,161 3 5,042 3
Onandaga Community College 4,626 6 4,534 7 4,527 7 4,685 5
Spokane Community College 4,617 7 4,595 5 4,785 4 4,938 4
Chemeketa Community College 4,325 8 4,276 8 4,420 8 4,395 8
Yavapai College 2,404 9 2,159 9 2,172 9 2,181 9
North Idaho College 1,937 10 1,778 11 1,710 10 1,766 10
DIXIE COLLEGE 1,804 11 1,811 10 1,705 11 1,556 11
Danville Community College 1,307 12 1,146 14 1,138 12 1,235 12
COLLEGE OF EASTERN UTAH 1,303 13 1,241 13 1,114 14 892 14
SNOW COLLEGE 1,241 14 1,295 12 1,143 13 1,168 13
Western Wyoming Comm College 890 15 779 15 873 15 839 15
COMPARISON GROUP AVERAGE 3,651 3,501 3,502 3,497
PERCENT OF COMP GROUP AVE:
Salt Lake Comm College 152.04% 155.30% 147.40% 144.92%
Utah Valley Comm College 138.13% 129.79% 134.12% 131.08%
Dixie Collegc 49.41% 51.73% 48.69% 44.50%
College of Eastern Utah 35.69% 35.45% 31.81% 25.51%
Snow College 33.99% 36.99% 32.64% 33.40%

iIndicator: TAX FUNDS APPROPRIATIONS PER FTE Comparison Group: UNIVERSITY OF UTAH
Univ California, Los Angeles
IUniv North Carolina (Ch Hill)
University of Florida
University of Arizona
University of Washington
IUniv of Virginia, Main Campus
UNIVERSITY OF UTAH
University of Iowa
IPurdue University, Main Campus
Univ Cincinnati, Main Campus
Univ of Colorado, Boulder
COMPARISON GROUP AVERAGE
IPERCENT OF COMP GROUP AVE:
University of Utah
1989-90 1988-89 1987-88
Amount Rank Rank Amount Rank
1986-87
Amount Rank
1985-86
Amount Rank
1984-85
Amount Rank
$12,473 1 $12,128 1 $11,455 1 $10,493 1
$11,421 2 $10,618 2 $10,140 2 $9,453 2
$10,842 3 $9,700 3 $8,544 3 $8,157 3
$7,774 4 $7,527 4 $7,350 5 $6,639 5
$6,760 5 $6,198 5 $5,941 8 $5,626 8
$6,360 6 $5,922 6 $7,706 4 $7,082 4
$6,094 7 $5,819 7 $6,064 7 $5,701 7
$5,736 8 $5,493 8 $6,437 6 $6,524 6
$5,467 9 $5,255 10 $4,865 10 $4,498 10
$5,010 10 $5,273 9 $5,686 9 $5,441 9
$2,458 11 $2,315 11 $2,213 11 $2,161 11
$7,430 $7,043 $7,034 $6,608
82.02% 82.62% 86.21% 86.27%
Indicator: TAX FUNDS APPROPRIATIONS PER FTE
I
iUniv of California, Davis
North Carolina State Univ
ITexas A & M University
Washington State University
Virginia Tech University
Oregon State University
iUniv of Maryland, College Pk
UTAH SYATE UNIVERSITY
Iowa State University
New Mexico State University
IIIColorado State University
COMPARISON GROUP AVERAGE
PERCENT OF COMP GROUP AVE:
IUtah State University
1989-90
Amount Rank
1988-89 1987-88
Comparison Group:
1986-87
UTAH STATE UNIVERSITY
1985-86 1984-35
Rank Amount Rank Amount Rank Amount Rank Amount Rank
$14,274 1 $14,267 I $13,621 1 $12,334 1
$10,638 2 $9,592 2 $9,113 2 $8,293 2
$7,777 3 $6,889 4 $8,109 3 $7,933 3
$7,639 4 $7,174 3 $6,848 4 $6,555 4
$7,159 5 $6,828 5 $6,283 6 $5,943 5
$6,528 6 $5,925 7 $5,288 8 $4,633 10
$6,424 7 $5,739 8 $5,213 10 $4,735 9
$6,372 8 $6,132 6 $6,423 5 $5,924 6
$6,196 9 $5,607 9 $5,278 9 $5,276 7
$5,046 10 $5,088 10 $5,303 7 $5,045 8
$3,917 11 $3,668 11 $3,590 11 $3,457 11
$7,560 $7,078 $6,865 $6,421
84.29% 86.63% 93.56% 92.26%
3 0
13

Indicator: TAX FUNDS APPROPRIATIONS PER FTE
1989-90 1988-89
Amount Rank Rank
1987-88
Amount Rank
Comparison Group:
1986-87
Amount Rank
COMPREHENSIVE INSTITUTIONS
1985-86 1984-85
Amount Rank Amount Rank
Calif St Univ, Dominguez Hills $7,153 1 $8,256 1 $6,706 1 $6,050 2
SUNY College at Brockport $6,543 2 $6,530 2 $6,526 2 $6.271 1
Austin Peay State University $5,744 3 $4,093 4 $3,491 9 $2,963 9
Eastern Washington University $4,620 4 $4,370 3 $3,874 4 $3,990 3
Univ of Nevada, Las Vegas $4,050 5 $3,925 5 $3,802 5 $3,495 6
Boise State University $3,952 6 $3,714 6 $3,505 8 $3,099 8
WEBER STATE UNIVERSITY $3.605 7 $3,496 9 $3,661 6 $3,608 5
Indiana University Northwest $3,567 8 $3,605 7 $3,546 7 $3,221 7
SOUTHERN UTAH UNIVERSITY $3,558 9 $3,554 8 $3,964 3 $3,756 4
Univ of Southern Colorado $3,434 10 $3,236 10 $2,863 12 $2,344 12
Univ of Wisconsin, Oshkosh $3,283 11 $3,019 12 $3,116 10 $2,912 10
Southern Oregon State College $3,102 12 $3,123 11 $2,935 11 $2,554 11
COMPARISON GROUP AVERAGE $4,545 $4,387 $4,036 $3,690
PERCENT OF COMP GROUP AVE:
Weber State University 79.32% 79.69% 90.71% 97.78%
Southern Utah University 78.28% 81.01% 98.22% 101.79%
Indicator: TAX FUNDS APPROPRIATIONS PER FTE
1989-90 1988-89
Amount Rank Rank
1987-88
Amount Rank
Comparison Group:
1986-87
Amount Rank
COMMUNITY COLLEGES
1985-86 1984-85
Amount Rank Amount Rank
Western Wyoming Comm College $6,902 1 $8,122 1 $7,495 1 $7,080 1
Chemeketa Community College $4,663 2 $4,455 2 $3,904 5 $3,796 4
SNOW COLLEGE $4,287 3 $3,919 4 $4,417 2 $4,229 3
North Idaho College $4,102 4 $4,143 3 $4,066 3 $3,717 5
COLLEGE OF EASTERN UTAH $3,658 5 $3,643 6 $3,944 4 $4,321 2
Yavapai College $3,503 6 $3,495 7 $3,235 7 $3,147 7
Danville Community College $3,496 7 $3,754 5 $3,581 6 $3,206 6
Onandaga Community College $3,212 8 $3,072 8 $3,011 9 $2,728 11
DIXIE COLLEGE $3,127 9 $2,973 10 $2,971 10 $2,984 8
Spokane Community College $3,107 10 $3,071 9 $2,916 11 $2,761 10
Anne Arundel Comm College $2.940 11 $2,972 11 $3,093 8 $2,772 9
SALT LAKE COMMUNITY COLLEGE $2,816 12 $2,706 13 $2,731 12 $2,665 12
Grand Rapids Junior College $2,715 13 $2,373 15 $2,265 14 $2,136 15
Joliet Junior College $2,522 14 $2,811 12 $2,159 15 $2,461 13
UTAH VALLEY COMMUNITY COLLEGE $2,291 15 $2,471 14 $2,370 13 $2,217 14
COMPARISON GROUP AVERAGE $3,716 $3,827 $3,572 $3,380
PERCENT OF COMP GROUP AVE:
Snow College 115.37% 102.40% 123.66% 125.12%
College of Eastern Utah 98.44% 95.19% 110.41% 127.84%
Dixie College 84.15% 77.68% 83.17% 88.28%
Salt Lake Community College 75.78% 70.71% 76.46% 78.85%
Utah Valley Community College 61.65% 64.57% 66.35% 65.59%
3 1 714
IIa
I1
II1
IIIIIIIIIII
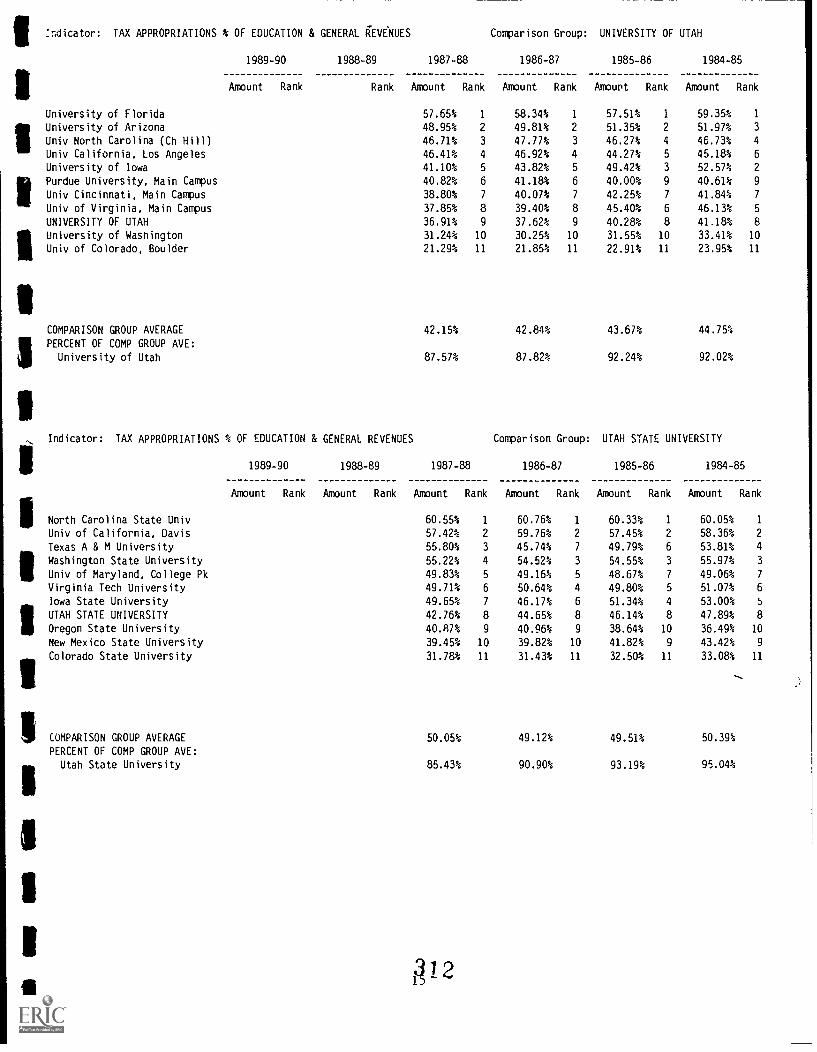
:ndicator: TAX APPROPRIATIONS % OF EDUCATION & GENERAL kEVCNUES
1989-90 1988-89
Amount Rank Rank
1987-88
Amount Rank
Comparison Group:
1986-87
Amount Rank
UNIVERSITY OF UTAH
1985-86 1984-85
Amount Rank Amount Rank
University of Florida 57.65% 1 58.34% 1 57.51% 1 59.35% 1
University of Arizona 48.95% 2 49.81% 2 51.35% 2 51.97% 3
Univ North Carolina (Ch Hill) 46.71% 3 47.77% 3 46.27% 4 46.73% 4
Univ California, Los Angeles 46.41% 4 46.92% 4 44.27% 5 45.18% 6
University of Iowa 41.10% 5 43.82% 5 49.42% 3 52.57% 2
Purdue University, Main Campus 40.82% 6 41.18% 6 40.00% 9 40.61% 9
Univ Cincinnati, Main Campus 38.80% 7 40.07% 7 42.25% 7 41.84% 7
Univ of Virginia, Main Campus 37.85% 8 39.40% 8 45.40% 6 46.13% 5
UNIVERSITY OF UTAH 36.91% 9 37.62% 9 40.28% 8 41.18% 8
University of Washington 31.24% 10 30.25% 10 31.55% 10 33.41% 10
Univ of Colorado, Boulder 21.29% 11 21.85% 11 22.91% 11 23.95% 11
COMPARISON GROUP AVERAGE 42.15% 42.84% 43.67% 44.75%
PERCENT OF COMP GROUP AVE:
University of Utah 87.57% 87.82% 92.24% 92.02%
Indicator: TAX APPROPRIATIONS % OF EDUCATION & GENERAL REVENUES
1989-90 1988-89
Amount Rank Amount Rank
1987-88
Amount Rank
Comparison Group:
1986-87
Amount Rank
UTAH STATE UNIVERSITY
1985-86 1984-85
Amount Rank Amount Rank
North Carolina State Univ 60.55% 1 60.76% 1 60.33% 1 60.05% 1
Univ of California, Davis 57.42% 2 59.76% 2 57.45% 2 58.36% 2
Texas A & M University 55.80% 3 45.74% 7 49.79% 6 53.81% 4
Washington State University 55.22% 4 54.52% 3 54.55% 3 55.97% 3
Univ of Maryland, College Pk 49.83% 5 49.16% 5 48.67% 7 49.06% 7
Virginia Tech University 49.71% 6 50.64% 4 49.80% 5 51.07% 6
Iowa State University 49.65% 7 46.17% 6 51.34% 4 53.00%
UTAH STATE UNIVERSITY 42.76% 8 44.65% 8 46.14% 8 47.89% 8
Oregon State University 40.87% 9 40.96% 9 38.64% 10 36.49% 10
New Mexico State University 39.45% 10 39.82% 10 41.82% 9 43.42% 9
Colorado State University 31.78% 11 31.43% 11 32.50% 11 33.08% 11
COMPARISON GROUP AVERAGE 50.05% 49.12% 49.51% 50.39%
PERCENT OF COMP GROUP AVE:
Utah State University 85.43% 90.90% 93.19% 95.04%
1 2

INDCTRS FINANCIAL COMPARISON INDICATORS 07-Jan-91
Indicator: TAX APPROPRIATIONS % OF EDUCATION & GENERAL REVENUES Comparison Group: COMPREHENSIVE INSTITUTIONS
1989-90 1988-89
Amount Rank Amount Rank
1987-88
Amount Rank
1986-87
Amount Rank
1985-86
Amount Rank
1984-85
Amount Rank
Calif St Univ, Dominguez Hills 79.50% 1 77.63% 1 74.68% 1 72.784 1
SUNY College at Brockport 68.84% 2 68.50% 2 71.31% 2 69.76% 2
Boise State University 62.70, 3 61.69% 4 57.67% 8 59.14% 7
Austin Peay State University 62.47% 4 63.78% 3 63.94% 3 61.52% 6
Univ of Wisconsin, Oshkosh 58.63% 5 58.84% 7 60.86% 4 57.59% 9
WEBER STATE UNIVERSITY 58.58% 6 57.76% 8 60.78% 5 62.45% 5
Eastern Washington University 58.25% 7 60.23% 5 60.40% 6 64.68% 3
Indiana University Northwest 56.52% 8 59.40% 6 59.74% 7 63.51% 4
SOUTHERN UTAH UNIVERSITY 52.96% 9 53.95% 9 57.11% 9 58.17% 8
Southern Oregon State College 49.73% 10 49.50% 10 49.89% 11 48.06% 11
Univ of Nevada, Las Vegas 49.13% 11 48.82% 11 51.07% 10 49.62% 10
univ of Southern Colorado 47.10% 12 43.93% 12 44.22% 12 42.73% 12
COMPARISON GROUP AVERAGE 60.10% 60.28% 60.29% 60.00%
PERCENT OF COMP GROUP AVE:
Weber State University 97.47% 95.82% 100.81% 104.08%
Southern Utah University 88.12% 89.50% 94.73% 96.95%
Indicator: TAX APPROPRIATIONS % OF EDUCATION & GENERAL REVENUES
1989-90 1988-89
Amount Rank Amount Rank
1987-88
Amount Rank
Comparison Group:
1986-87
Amount Rank
COMMUNITY COLLEGES
1985-86 1984-85
Amount Rank Amount Rank
Western Wyoming Comm College 79.80% 1 75.76% 1 68.95% 4 78.00% 1
Yavapai College 70.75% 2 68.72% 4 69.39% 3 70.58% 3
Danville Community College 70.58% 3 72.49% 2 70.33% 2 69.15% 6
Anne Arundel Comm College 69.23% 1 70.96% 3 71.46% 1 69.91% 4
Chemeketa Community College 68.64% 5 67.61% 5 67.28% 5 69.55% 5
North Idaho College 62.89% 6 62.75% 7 58.83% 10 60.55% 10
Spokane Community College 59.67% 7 62.32% 8 65.05% 6 72.30% 2
SNOW COLLEGE 58.12% 8 60.29% 10 64.47% 7 65.11% 7
COLLEGE OF EASTERN UTAH 57.66% 9 55.49% 13 54.99% 14 56.15% 14
Joliet Junior College 57.42% 10 65.91% 6 57.73% 12 61.46% 9
DIXIC COLLEGE 56.46% 11 61.71% 9 62.39% 8 63.65% 8
Onondaga Community College 53.71% 12 56.20% 17 59.68% 9 E!.82% 12
SALT LAKE COMMUNITY COLLEGE 53.14% 13 56.62% 11 58.07% 11 59.47% 11
UTAH VALLEY COMMUNITY COLLEGE 51.88% 14 54.96% 14 56.60% 13 56.33% 13
Grand Rapids Junior College*
*College has 7 times ave "Other Funds," in 87-88
26.55% 15 47.68% 15 47.99% 15 44.94% 15
COMPARISON GROUP AVERAGE 60.01% 65.98% 64.18% 66.24%
PERCENT OF COMP GROUP AVE:
Snow College 96.85% 91.38% 100.45% 98.29%
College of Eastern Utah 96.08% 84.10% 85.68% 84.77%
Dixie College 94.08% 93.53% 97.21% 96.09%
Salt Lake Community College 88.55% 85.81% 90.48% 89.78%
Utah Valley Community College 86.45% 83.30% 88.19% 85.04%
16 3 1:1

IIIIndicator: TUITION AND FEES PER FTE Comparison Group: UNIVERSITY OF UTAH
Univ of Colorado, Boulder
IUniv of Virginia, Main Campus
University of Washington
Purdue University, Main Campus
Univ Cincinnati, Main Campus
IUniv California, Los Angeles
University of Arizona
University of Iowa
UNIVERSITY OF UTAH
111
Univ North Carolina (Ch Hill)
University of Florida
COMPARISON GROUP AVERAGE
III PERCENT OF COMP GROUP AVE:
University of Utah
1989-90 1988-89 1987-88
Amount Rank Rank Amount Rank
1986-87
Amount Rank
1985-86
Amount Rank
1984-85
Amount Rank
$4,239 1 $3,900 1 $3,436 1 $3,119 1
$3,695 2 $3,464 2 $3,378 2 $2,980 2
$3,538 3 $3,384 3 $2,740 5 $2,242 6
$3,111 4 $2,941 5 $2,744 4 $2,442 5
$2,984 5 $2,953 4 $2,740 5 $2,657 3
$2,794 6 $2,632 6 $2,787 3 $2,654 4
$2,568 7 $2,393 7 $2,056 7 $1,795 8
$2,476 8 $2,100 8 $1,959 8 $1,812 7
$1,905 9 $1,865 9 $1,683 9 $1,465 9
$1,846 10 $1,792 10 $1,556 10 111,441 10
$1,513 11 $1,314 11 $1,150 11 $1,029 11
$2,876 $2,687 $2,455 $2,217
66.24% 69.41% 68.55% 66.08%
Indicator: TUITION AND FEES PER FTE
1989-90
iColorado State University
Virginia Tech University
IIIUniv of Maryland, College Pk
Iowa State University
Univ of California, Davis
Texas A & M University
iOregon State University
Washington State University
UTAH STATE UNIVERSITY
North Carolina State Univ
IIINew Mexico State University
iCOMPARISON GROUP AVERAGE
PERCENT OF COMP GROUP AVE:
IUtah State University
Amount Rank
1988-89 1987-88
Rank Amount Rank
Comparison Group:
1986-87
Amount Rank
UTAH STATE UNIVERSITY
1985-86 1984-85
Amount Rank Amount Rank
$3,154 1 $2,880 1 $2,673 1 $2,569 1
$3,146 2 $2,865 2 $2,620 2 $2,395 2
$2,772 3 $2,520 3 $2,302 3 $2,189 3
$2,381 4 $2,171 4 $1,559 8 $1,613 6
$2,173 5 $1,962 5 $2,071 4 $1,975 4
$2,099 6 $1,785 7 $1,999 5 $1,236 9
$2,003 7 $1,922 6 $1,940 6 $1,834 5
$1,740 8 $1,656 8 $1,599 7 $1,353 8
$1,652 9 $1,613 9 $1,511 9 $1,411 7
$1,536 10 $1,412 10 $1,341 10 $1,231 10
$1,406 11 $1,259 11 $1,131 11 $1,027 11
$2,241 $2,043 $1,924 $1,742
73.72% 78.95% 78.53% 81.00%
1 7
3 1 4

Indicator: TUITION AND FEES PER FTE
1989-90 1988-89
Amount Rank Rank
1987-88
Amount Rank
Comparison Group:
1986-87
Amount Rank
COMPREHENSIVE INSTITUTIONS
1985-86 1984-85
Amount Rank Amount Rank
Austin Peay State University $2,095 1 $1,413 6 $1,146 11 $1,036 11
Eastern Washington University $1,956 2 $1,607 4 $1,477 4 $1,255 6
Univ of Southern Colorado $1,833 3 $1,905 1 $1,739 I $1,643 I
Indiana University Northwest $1,822 4 $1,499 5 $1,355 7 $1,158 7
Southern Oregon State College $1,701 5 $1,687 2 $1,559 3 $1,484 3
SUNY College at Brockport $1,585 6 $1,608 3 $1,570 2 $1,561 2
Univ of Wisconsin, Oshkosh $1,498 7 $1,385 7 $1,244 8 $1,147 8
Calif St Univ, Dominguez Hills $1,368 8 $1,353 8 $1,430 5 $1,323 4
Univ of Nevada, Las Vegas $1,339 9 $1,314 9 $1,423 6 $1,266 5
WEBER STATE UNIVERSITY $1,334 10 $1,286 10 $1,161 10 $1,137 9
Boise State University $1,275 11 $1,228 11 $1,198 9 $1,051 10
SOUTHERN UTAH UNIVERSITY $1,129 12 $1,097 12 $972 12 $935 12
COMPARISON GROUP AVERAGE $1,647 $1,500 $1,414 $1,292
PERCENT OF COMP GROUP AVE:
Weber State University 81.00% 85.73% 82.11% 88.00%
Southern Utah University 68.55% 73.13% 68.74% 72.37%
Indicator: TUITION AND FEES PER FTE
1989-90 1988-89
Amount Rank Rank
1987-88
Amount Rank
Comparison Group:
1986-87
Amount Rank
COMMUNITY COLLEGES
1985-86 1984-85
Amount Rank Amount Rank
Grand Rapids Junior College $1,827 1 $1,531 1 $1,531 1 $1,580 1
Onandaga Community College $1,625 2 $1,485 2 $1,411 2 $1,401 2
SALT LAKE COMMUNITY COLLEGE $1,311 3 $1,136 4 $1,057 4 $909 5
North Idaho College $1,220 4 $1,184 3 $1,120 3 $955 3
UTAH VALLEY COMMUNITY COLLEGE $1,056 5 $1,060 5 $852 7 $762 8
DIXIE COLLEGE $1,053 6 $822 8 $754 10 $673 II
Anne Arundel Comm College $1,043 7 $980 6 $904 6 $943 4
SNOW COLLEGE $945 8 $785 13 $791 9 $681 10
Joliet Junior College $913 9 $818 9 $723 11 $748 9
Danville Community College $906 10 $902 7 $916 5 $817 7
Yavapai College $849 11 $794 11 $696 13 $671 12
Chemeketa Community College $844 12 $815 10 $709 12 $657 13
COLLEGE OF EASTERN UTAH $742 13 $786 12 $799 8 $881 6
Spokane Community College $727 14 $673 15 $554 15 $449 15
Western Wyoming Comm College $666 15 $693 14 $564 14 $521 14
COMPARISON GROUP AVERAGE $1,062 $987 $913 $874
PERCENT OF COMP GROUP AVE:
salt Lake Community College 123.45% 115.10% 115.77% 104.00%
Utah Valley Community College 99.44% 107.40% 93.32% 87.19%
Dixie College 99.15% 83.28% 82.58% 77.00%
Snow College 88.98% 79.53% 86.64% 77.92%
College of Eastern Utah 69.87% 79.64% 87.51% 100.80%
111
i
III
I
III
I
1
II
1 8
1

Indicator: TUITION AND FEES % OF INSTRUCTION DIRECT EXPENDITURES
1989-90 1988-89 1987-88
Amount Rank Amount Rank Amount Rank
Comparison Group:
1986-87
Amount Rank
UNIVERSITY OF UTAH
1985-86 1984-85
Amount Rank Amount Rank
Univ of Colorado, Boulder 106.32% 1 104.03% 1 97.98% 1 96.89% 1
Purdue University, Main Campus 58.19% 2 55.74% 3 56.67% 3 55.60% 4
Univ Cincinnati, Main Campus 57.50% 3 53.39% 4 53.62% 4 59.53% 2
Univ of Virginia, Main Campus 56.65% 4 58.81% 2 59.97% 2 58.63% 3
University of Arizona 48.27% 5 46.58% 5 41.10% 6 37.85% 7
University of Iowa 43.21% 6 40.86% 7 39.83% 7 38.38% 5
University of Washington 43.20% 7 44.33% 6 43.75% 5 37.94% 6
UNIVERSITY OF UTAH 36.18% 8 36.36% 8 32.75% 8 31.25% 9
Univ California, Los Angeles 26.37% 9 26.055; 9 29.10% 9 31.84% 8
University of Florida 23.92% 10 23.74% 10 20.35% 10 19.02% 10
Univ North Carolina (Ch Hill) 19.24% 11 19.33% 11 17.76% 11 17.44% 11
COMPARISON GROUP AVERAGE 43.05% 42.47% 41.42% 40.65%
PERCENT OF COMP GROUP AVE:
University of Utah 84.04% 85.61% 79.07% 76.88%
Indicator: TUITION AND FEES % OF INSTRUCTION DIRECT EXPENDITURES
1989-90 1988-89 1987-88
Amunt Rank Amount Rank Amount Rank
Comparison Group:
1986-87
Amount Rank
UTAH STATE UNIVERSITY
1985-86 1984-85
Amount Rank Amount Rank
Colorado State University 75.76% 1 71.55% 1 66.18% 2 68.40% 1
Univ of Maryland, College Pk 69.30% 2 67.45% 2 67.69% 1 66.09% 2
Iowa State University 63.73% 3 61.17% 4 45.81% 6 47.40% 5
Virginia Tech University 62.84% 4 61.30% 3 60.78% 3 59.92% 3
Texas A & M University 49.76% 5 43.34% 6 47.83% 5 31.22% 9
Oregon State University 48.49% 6 48.76% 5 53.70% 4 55.39% 4
New Mexico State University 47.20% 7 43.19% 7 38.42% 8 38.38% 7
UTAH STATE UNIVERSITY 39.06% 8 39.40% 8 36.38% 9 38.50% 6
Washington State University 38.70% 9 38.54% 9 39.36% 7 35.37% 8
North Carolina State Univ 26.06% 10 26.55% 10 26.76% 10 26.99% 10
Univ of California, Davis 24.53% 11 22.64% 11 25.61% 11 26.93% 11
COMPARISON GROUP AVERAGE 47.20% 45.16% 44.69% 43.41%
PERCENT OF COMP GROUP AVE:
Utah State University 82.75% 87.25% 81.41% 88.69%
3 /
1 9

Indicator: TUITION AND FEES % OF INSTRUCTION DIRECT EXPENDITURES Comparison Group: COMPREHENSIVE INSTITUTIONS
1989-90 1988-89 1987-88 1986-87 1985-86 1984-85
Amount Rank Amount Rank Amount Rank Amount Rank Amount Rank Amount Rank
II/
I
I
I
Univ of Southern Colorado 73.384 1 79.54% 1 83.37% 1 84.21% 1
Indiana University Northwest 62.91% 2 51.78% 4 49.40% 5 47.75% 4Southern Oregon State College 60.11% 3 59.19% 2 62.06% 2 64.69% 2Eastern Washington University 57.87% 4 50.61% 5 52.45% 4 46.31% 5
SOUTHERN UTAH UNIVERSITY 53.00% 5 53.02% 3 41.97% 9 43.21% 9
Austin Peay State University 49.18% 6 46.13% 8 43.07% 8 44.18% 8Univ of Wisconsin, Oshkosh 48.76% 7 47.94% 6 45.27% 6 45.03% 6Univ of Nevada, Las Vegas 46.59% 8 47.40% 7 54.07% 3 51.01% 3WEBER STATE UNIVERSITY 45.64% 9 42.72% 10 38.86% 11 40.32% 11SUN? College at Brockport 41.86% 10 42.89% 9 44.10% 7 44.64% 7Boise State University 40.61% 11 40.28% 11 41.64% 10 42.59% 10Calif St Univ, Dominguez Hills 27.94% 12 29.12% 12 37.61% 12 36.83% 12
COMPARISON GROUP AVERAGE 48.97% 47.65% 49.72% 49.11%PERCENT OF COMP GROUP AVE:
Southern Utah University 108.23% 111.27% 84.41% 87.99%Weber State University 93.20% 89.65% 78.16% 82.10%
Indicator: TUITIION AND FEES % OF INSTRUCTION DIRECT EXPENDITURES
1989-90 1988-89 1987-88
Amount Rank Amount Rank Amount Rank
Comparison Group:
1986-87
Amount Rank
COMMUNITY COLLEGES
1985-86 1984-85
Amount Rank Amount Rank
Onandaga Community College 62.81% 1 68.18% 1 66.90% 1 70.72% 1
Grand Rapids Junior College 61.81% 2 58.55% 2 62.24% 2 57.64% 2UTAH VALLEY COMMUNITY COLLEGE 56.84% 3 55.32% 3 45.15% 3 42.55% 4SALT LAKE COMMUNITY COLLEGE 54.67% 4 45.79% 4 43.97% 4 40.10% 6DIXIE COLLEGE 54.39% 5 45.09% 5 40.73% 5 36.34% 7
Anne Arundel Comm College 44.55% 6 40.75% 6 40.18% 7 45.12% 3North Idaho College 41.08% 7 39.89% 7 35.10% 10 33.45% 9Yavapai College 38.66% 8 36.71% 8 37.62% 8 31.71% 11SNOW COLLEGE 38.23% 9 34.28% 10 28.72% 11 30.04% 12Joliet Junior College 36.02% 10 35.70% 9 40.62% 6 40.63% 5Danville Community College 34.53% 11 33.71% 11 37.40% 9 33.51% 8COLLEGE OF EASTERN UTAH 32.32% 12 33.66% 12 29.80% 12 32.78% 10Spokane Community College 30.02% 13 29.06% 13 25.49% 13 23.26% 13Chemeketa Community College 28.79% 14 25.34% 14 23.52% 14 23.17% 14Western Wyoming Comm College 16.96% 15 14.84% 15 11.18% 15 17.31% 15
COMPARISON GROUP AVERAGE 38.63% 35.89% 35.03% 36.66%PERCENT OF COMP GROuP AVE:
Utah Valley Community College 147.14% 154.14% 128.89% 116.07%Salt Lake Community College 141.52% 127.58% 125.52% 109.38%Dixie College 142.27% 131.53% 141.82% 120.97%Snow College 98.96% .1.51% 81.99% 81.94%College of Eastern Utah 83.67% 93.79% 85.07% 89.42%
I
i
1
III
111
III
I
111
i

Indicator: ENDOWMENT REVENUE PER FTE
1989-90 1988-89
Amount Rank Rank
1987-88
Amount Rank
Comparison Group:
1986-87
Amount Rank
UNIVERSITY OF UTAH
1985-86 1984-85
Amount Rank Amount Rank
Univ of Virginia, Main Campus $759 1 $675 1 $685 1 $651 1
Univ Cincinnati, Main Campus $481 2 $520 2 $491 2 $449 2
UNIVERSITY OF UTAH $274 3 $264 3 $264 4 $225 4
Univ North Carolina (Ch Hill) $223 4 $203 4 $200 5 $182 5
University of Arizona $190 5 $124 7 $171 6 $31 8
University of Washington $173 6 $171 5 $150 7 $130 6
Purdue University, Main Campus $131 7 $146 6 $139 8 $105 7
University of Iowa $94 8 $56 8 $60 9 $25 9
Univ of Colorado, Boulder $11 9 $11 9 $11 10 $9 10
University of Florida $1 10 $1 10 $0 11 $0 11
Univ California, Los Angeles $0 11 $0 11 $371 3 $309 3
COMPARISON GROUP AVERAGE $206 $191 $228 $189
PERCENT OF COMP GROUP AVE:
University of Utah 133.01% 138.22% 115.79% 119.05%
Indicator: ENDOWMENT REVENUE PER FTE
1989-90 1988-89
Amount Rank Rank
1987-88
Amount Rank
Comparison Group:
1986-87
Amount Rank
UTAH STATE UNIVERSITY
1985-86 1984-85
Amount Rank Amount Rank
Colorado State University $360 1 $367 1 $224 2 $244 2
Oregon State University $168 2 $145 2 $76 8 $96 4
Texas A & M University $132 3 $131 3 $118 4 $74 5
New Mexico State University $117 4 $114 4 $121 3 $114 3
Washington State University $67 5 $60 5 $34 7 $30 9
North Carolina State Univ $44 6 $41 6 $38 6 $49 6
Virginia Tech University $44 6 $35 7 $30 8 $33 7
UTAH STATE UNIVERSITY $36 8 $32 8 $28 9 $33 7
Univ of Maryland, College Pk $33 9 $25 9 $21 10 $26 10
Iowa State University $10 10 $10 10 $3 11 $4 11
Univ of California, Davis $0 11 $0 11 $346 1 $288 1
COMPARISON GROUP AVERAGE $98 $93 $101 $96
PERCENT OF COMP GROUP AVE:
Utah State University 36.73% 34.41% 27.72% 34.38%
3 3
21
BEST COPY MAILABLE

Indicator: ENDOWMENT REVENUE PER FTE
1989-90 1988-89
Amount Rank Rank
1987-88
Amount Rank
Comparison Group:
1986-87
Amount Rank
COMPREHENSIVE INSTITUTIONS
1985-86 1984-85
Amount Rank Amount Rank
Univ of Nevada, Las Vegas $65 1 $51 1 $52 1 $68 2
Austin Peay State University $34 2 $14 4 $2 5 4;2 4
SOUTHERN UTAH UNIVERSITY $31 3 $34 2 $34 2 $132 1
WEBER STATE UNIVERSITY $19 4 $22 3 $20 3 $23 3
Univ of Wisconsin, Oshkosh $3 5 ** 5 $3 4 $2 4
Indiana University Northwest ** 6 **7 ** 7
** 7
Southern Oregon State College ** 7 ** 8 ** 8 ** 8
Boise State University $0 8 $0 9 $0 9 $O 9
Calif St Univ, Dominguez Hills $0 8 ** 6 ** 6 $1 6
Eastern Washington University $0 8 $0 9 $0 9 $0 9
SUNY College at Brockport $0 8 $0 9 $0 9 $0 9
Univ of Southern Colorado $0 8 $0 9 $0 9 $0 9
**Less than $0.50
COMPARISON GROUP AVERAGE $10 $7 $6 $7
PERCENT OF COMP GROUP AVE:
Southern Utah University 310.00% 485.71% 566.67% 1885.71%
Weber State University 190.00% 314.29% 333.33% 328.57%
Indicator: ENDOWMENT REVENUE PER FTE
1989-90 1988-89
Amount Rank Rank
1987-88
Amount Rank
Comparison Group:
1986-87
Amount Rank
COMMUNITY COLLEGES
1985-86 1984-85
Amount Rank Amount Rank
SNOW COLLEGE $11 1 $14 1 $15 2 $14 1
DIXIE COLLEGE $10 2 $8 2 $8 3 $1 5
COLLEGE OF EASTERN UTAH $3 3 $2 3 $18 1 $10 2
SALT LAKE COMMUNITY COLLEGE $2 4 $2 3 $2 5 $2 4
Danville Community College $1 5 $2 3 $2 5 $0 6
Anne Arundel Comm College $0 6 $0 7 $3 4 $0 6
Chemeketa Community College $0 6 $0 7 $0 8 $0 6
Grand Rapids Junior College $0 6 $0 7 $0 8 $0 6
Joliet Junior College $0 6 $0 7 $0 8 $0 6
North Idaho College $0 6 $0 7 $0 8 $0 6
Onondaga Community College $0 6 $0 7 $0 8 $0 6
Spokane Community College $0 6 ** 6 $0 8 $0 6
UTAH VALLEY COMMUNITY COLLEGE $0 6 $0 7 $2 5 $10 2
Western Wyoming Comm College $0 6 $0 7 $0 8 $O 6
Yavapai College $0 6 $0 7 $0 8 $0 6
COMPARISON GROUP AVERAGE ** ** ****
PERCENT OF COMP GROUP AVE:
Snow College
Dixie College
College of Eastern Utah
Salt Lake Community College
Utah Valley Community College
3
22
1
1

Indicator: GOVERNMENT GRANTS AND CONTRACTS PER FTE
1989-90 1988-89
Amount Rank Rank
1987-88
Amount Rank
Comparison Group:
1986-87
Amount Rank
UNIVERSITY OF UTAH
1985-86 1984-85
Amount Rank Amount Rank
University of Washington $7,635 1 $7,036 1 $6,610 1 $5,959 1
Univ California, Los Angeles $5,511 2 $5,684 2 $5,278 2 $4,609 3
Univ North Carolina (Ch Hill) $5,410 3 $4,877 3 $4,603 3 $4,805 2
UNIVERSITY OF UTAH $4,437 4 $3,818 4 $3,650 4 $3,444 4
University of Arizona $3,753 5 $3,514 5 $3,244 5 $2,910 5
University of Florida $3,665 6 $3,096 7 $2,850 8 $2,441 9
Univ of Virginia, Main Campus $3,558 7 $3,114 6 $3,238 6 $2,822 6
University of Iowa $3,494 8 $2,990 8 $2,880 7 $2,604 7
Univ of Colorado, Boulder $3,063 9 $2,793 9 $2,713 9 $2,588 8
Purdue University, Main Campus $2,376 10 $2,219 10 $2,184 10 $1,953 10
Univ Cincinnati, Main Campus $2,121 11 $2,075 11 $1,894 11 $1,732 11
COMPARISON GROUP AVERAGE $4,064 $3,740 $3,549 $3,242
PERCENT OF COMP GROUP AVE:
University of Utah 109.18% 102.09% 102.85% 106.23%
Indicator: GOVERNMENT GRANTS AND CONTRACTS PER FTE
1989-90 1988-89
Amount Rank Rank
1987-88
Amount Rank
Comparison Group:
1986-87
Amount Rank
UTAH STATE UNIVERSITY
1985-86 1984-85
Amount Rank Amount Rank
UTAH STATE UNIVERSITY $5,065 I $4,193 2 $4,105 2 $3,491 3
Oregon State University $4,587 2 $4,430 1 $4,350 1 $4,255 1
Univ of California, Davis $4,362 3 $4,170 3 $3,826 3 $3,252 4
New Mexico State University $4,276 4 $3,929 4 $3,419 4 $3,527 2
Colorado State University $3,430 5 $3,158 5 $2,647 5 $2,347 5
Univ of Maryland, College Pk $2,844 6 $2,767 6 $2,510 6 $2,199 6
Virginia Tech University $2,522 7 $2,292 8 $2,314 7 $1,957 8
Washington State University $2,378 8 $2,302 7 $2,242 8 $2,114 7
North Carolina State Univ $1,955 9 $1,900 9 $1,792 9 $1,775 9
Iowa State University $1,693 10 $1,780 10 $1,455 10 $1,692 10
Texas A & M University $1,132 11 $1,170 11 $793 11 $626 11
COMPARISON GROUP AVERAGE $2,918 $2,790 $2,535 $2,374
PERCENT OF COMP GROUP AVE:
Utah State University 173.58% 150.29% 161.93% 147.05%
23

Indicator: GOVERNMENT GRANTS AND CONTRACTS PER FTE Comparison Group: COMPREHENSIVE INSTITUTIONS
1989-90 1988-89
Amount Rank Rank
1987-88
Amount Rank
1986-87
Amount Rank
1985-86
Amount Rank
Univ of Southern Colorado $1,904 1 $2,034 1 $1.771 1
Univ of Nevada, Las Vegas $1,173 2 $1,038 5 $859 7
Eastern Washington University $1,130 3 $1,015 6
SOUTHERN UTAH UNIVERSITY $1,103 4 $1,082 4 $1,116
::::
2
:SUNY College at Brockport $1,024 5 $1,133 2
Southern Oregon State College $980 6 $1,101 3 $1,091 3
WEBER STATE UNIVERSITY $897 7 $808 7 8
Austin Peay State University $884 8 $631 10
18$76936100 114Boise State University $629 9 $556 12
Univ of Wisconsin, Oshkosh $609 10 $583 11 $621 12
Indiana University Northwest $584 11 $632 9 0
Calif St Univ, Dominguez Hills $461 12 $699 8 1633 10
COMPARISON GROUP AVERAGE $938 $942 !;902
PERCENT OF COMP GROUP AVE:
Southern Utah University 117.59% 114.86% 123.73%
Weber State University 95.63% 85.77% 86.59%
Indicator: GOVERNMENT GRANTS AND CONTRACTS PER FTE
1989-90 1988-89
Amount Rank Rank
1987-88
Amount Rank
Comparison Group:
1986-87
Amount Rank
COLLEGE OF EASTERN UTAH $1,450 1 $1,631 1
SNOW COLLEGE $1,232 ? $1,031 2
Spokane Community College $1,138 . $1,008 4
Chemeketa Community College $1,060 4 $1,050 3
DIXIE COLLEGE $1,002 5 $767 9
SALT LAKE COMMUNITY COLLEGE $973 6 $778 8
Onandaga Community College $907 7 $633 11
North Idaho College 838 8 $903 6
Western Wyoming Comm College $804 9 $847 7
UTAH VALLEY COMMUNITY COLLEGE $738 10 $575 12
Grand Rapids Junior College $591 11 $1,001 5
Danville Community College $496 12 $461 13
Yavapai College $465 13 $687 10
Joliet Junior College $420 14 $111 15
Anne Arundel Comm College $208 15 $199 14
COMPARISON GROUP AVERAGE $693 $690
PERCENT OF COMP GROUP AVE:
College of Eastern Utah 209.24% 236.38%
Snow College 177.78% 149.42%
Dixie College 144.59% 111.16%
Salt Lake Community College 140.40% 112.75%
Utah Valley Community College 106.49% 83.33%
1984-85
Amount Rank
I$1,452 1
$769 5
:::: :
$1,041 2 I$982 3
1$7660; 8
$578 10
15546 119 I6
12
$782
133.12%
90.15%
1984-85
COMMUNITY COLLEGES
1985-86
Amount Rank Amount Rank
$1,705 1 $1,680
$1,103 3 $1,116
$780 7 $550
$914 4 $729
$758 9 $735
$765 8 $711
$385 14 $318
$1,321 2 $1,069
$800 6 $525
$650 10 $528
$808 5 $907
$459 12 $454
$578 11 $481
$432 13 $375
$212 15 $160
$669 $557
254.86% 301.62%
164.87% 200.36%
113.30% 131.96%
114.35% 127.65%
97.16% 94.79%
1 I2
8
6
5 I7
13
3
10
9
4
12
11
14
15

1
Indicator: PRIVATE GIFTS, GRANTS, & CONTRACTS PER FTE
1989-90 1988-89
Amount Rank Rank
1987-88
Amount Rank
Comparison Group:
1986-87
Amount Rank
UNIVERSITY OF UTAH
1985-86 1984-85
Amount Rank Amount Rank
Univ California, Los Angeles $2,121 1 $1,887 1 $1,789 1 $1.509 1
Univ North Carolina (Ch Hill) $2,020 2 $1,644 3 $1,498 3 $1,470 3
University of Florida $1,968 3 $1,464 1 $1,708 2 $1,495 2
Univ of Virginia, Main Campus $1,697 4 $1,253 2 $1,200 5 $1,067 5
University of Washington $1,585 5 $1,702 2 $1,408 4 $1,209 4
University of Arizona $1,182 6 $1,172 6 $1,142 6 $950 6
Purdue University, Main Campus $1,046 7 $898 9 $936 7 $906 7
University of Iowa $944 8 $746 10 $715 10 $582 9
Univ Cincinnati, Main Campus $891 9 $913 8 $800 9 $447 10
Univ of Colorado, Boulder $773 10 $583 11 $553 11 $428 11
UNIVERSITY OF UTAH $758 11 $1,029 7 $905 8 $771 8
COMPARISON GROUP AVERAGE $1,423 $1,226 $1,175 $1.006
PERCENT OF COMP GROUP AVE:
University of Utah 53.27% 83.93% 77.02% 76.64%
Indicator: PRIVATE GIFTS, GRANTS, & CONTRACTS PER FTE
1989-90 1988-89
Amount Rank Rank
1987-88
Amount Rank
Comparison Group:
1986-87
Amount Rank
UTAH STATE UNIVERSITY
1985-86 1984-85
Amount Rank Amount Rank
North Carolina State Univ $1,585 1 $1,256 1 $1,150 1 $891 2
Texas A & M University $1,497 2 $1,187 2 $1,237 2 $1,121 1
Oregon State University $1,366 3 $826 6 $800 6 $759 4
Univ of California, Davis $1,191 4 $939 4 $1,054 3 $876 3
Washington State University $999 5 $903 5 $830 5 $601 7
Virginia Tech University $806 6 $747 7 $636 9 $558 8
New Mexico State University $779 7 $1,115 3 $973 4 $663 6
Iowa State University $661 8 $695 8 $784 7 $725 5
UTAH STATE UNIVERSITY $599 9 $557 9 $649 8 $539 9
Univ of Maryland, College Pk $411 10 $287 10 $289 11 $252 11
Colorado State University $0 11 $0 11 $503 10 $414 10
COMPARISON GROUP AVERAGE $929 $796 $826 $686
PERCENT OF COMP GROUP AVE:
University of Utah 64.48% 69.97% 78.57% 78.57%
25
3

Indicator: PRIVATE GIFTS, GRANTS, & CONTRACTS PER FTE
1989-90 1988-89
Amount Rank Rank
1987-88
Amount Rank
Comparison Group:
1986-87
Amount Rank
COMPREHENSIVE INSTITUTIONS
1985-86 1984-85
Amount Rank Amount Rank
Univ of Nevada, Las Vegas $463 1 $498 1 $317 1 $426 1
SuNY College at Brockport $290 2 $217 2 $178 2 $124 3
Southern Oregon State College $223 3 $193 4 $153 3 $125 2
Eastern Washington University $168 4 $180 5 599 7 $89 7
WEBER STATE UNIVERSITY $166 5 $205 3 $127 6 $104 6
Boise State University $147 6 $149 6 $133 4 $108 5
SOUTHERN UTAH UNIVERSITY $140 7 $133 7 $132 5 $123 4
Austin Peay State University $108 8 $61 9 $49 8 $46 8
Univ of Wisconsin, Oshkosh $52 9 $25 11 $21 11 $14 11
Indiana University Northwest $51 10 $52 10 $26 10 $36 9
Calif St Univ, Dominguez Hills 50 11 $114 8 $30 9 $31 10
Univ of Southern Colorado $0 11 $0 12 $0 12 $0 12
COMPARISON GROUP AVERAGE $150 $149 $100 $100
PERCENT OF COMP GROUP AVE:
Weber State University 110.67% 137.58% 127.00% 104.00%
Southern Utah University 93.33% 89.26% 132.00% 123.00%
Indicator: PRIVATE GIFTS, GRANTS, & CONTRACTS PER FTE
1989-90 1988-89
Amount Rank Rank
1987-88
Amount Rank
Comparison Group:
1986-87
Amount Rank
COMMUNITY COLLEGES
1985-86 1984-85
Amount Rank Amount Rank
DIXIE COLLEGE $132 1 $77 2 $160 2 $129 2
SNOW COLLEGE $127 2 $73 3 $32 7 $44 7
COLLEGE OF EASTERN UTAH $96 3 $78 1 $84 3 $95 4
Spokane Community College $68 4 $39 5 $7 10 $8 9
North Idaho College $44 5 $51 4 $53 6 $50 6
Danville Community College $25 6 $23 8 $74 4 $107 3
SALT LAKE COMMUNITY COLLEGE $24 7 $22 9 $21 8 $12 8
Yavapai College $20 8 $6 11 $0 12 $0 11
Western Wyoming Comm College $15 9 $26 7 $18 9 $0 11
Joliet Junior College $12 10 $32 6 $273 1 $232 1
UTAH VALLEY COMMUNITY COLLEGE $11 11 $13 10 $2 11 $5 10
Onondaga Community College $4 12 $0 12 $0 12 $0 11
Anne Arundel Comm College $0 13 $0 12 $62 5 $67 5
Chemeketa Community College $0 13 $0 12 $0 12 $0 11
Grand Rapids Junior College $0 13 $0 12 $0 12 $0 11
COMPARISON GROUP AVERAGE $19 $18 $49 $46
PERCENT OF COMP GROUP AVE:
Dixie College 694.74% 427.78% 326.53% 280.43%
Snow College 668.42% 405.56% 65.31% 95.65%
College of Eastern Utah 505.26% 433.33% 171.43% 206.52%
Salt Lake Community College 126.32% 122.22% 42.86% 26.09%
Utah Valley Community College 57.89% 72.22% 4.08% 10.87%
26
1

Indicator: TOTAL REVENUES PER FTE
1989-90 1988-89
Amount Rank Rank
1987-88
Amount Rank
Comparison Group:
1986-87
Amount Rank
UNIVERSITY OF UTAH
1985-86 1984-85
Amount Rank Amount Rank
Univ California, Los Angeles $26,874 1 $25,847 1 $25,877 1 $23,224 1
Univ North Carolina (Ch Hill) $24,450 2 $22,227 2 $21,915 2 $20,227 2
University of Washington $21,642 3 $20,489 3 $18,830 3 $16.837 3
University of Florida $18,806 4 $16,628 4 $14,856 6 $13,745 6
Univ of Virginia, Main Campus $16,803 5 $15,031 7 $16,975 4 $15,351 4
UNIVERSITY OF UTAH $16,512 6 $15,466 5 $15,056 5 $13,845 5
University of Arizcia $15,882 7 $15,111 6 $14,313 7 $12,774 8
University of Iowa $13,956 8 $12,535 10 $13,025 9 $12,410 9
Purdue University, Main Campus $13,392 9 $12,761 9 $12,161 10 $11,076 10
Univ Cincinnati, Main Campus $12,913 10 $13,160 8 $13,457 8 $13,004 7
Univ of Colorado, Boulder $11,548 11 $10,596 11 $9,661 11 $9,024 11
COMPARISON GROUP AVERAGE $17,627 $16,439 $16,107 $14,767
PERCENT OF COMP GROUP AVE:
University of Utah 93.67% 94.08% 93.47% 93.76%
Indicator: TOTAL REVENUES PER FTE
1989-90 1988-89
Amount Rank Rank
1987-88
Amount Rank
Comparison Group:
1986-87
Amount Rank
UTAH STATE UNIVERSITY
1985-86 1984-85
Amount Rank Amount Rank
Univ of California, Davis $24,857 1 $23,873 1 $23,708 1 $21,135 1
North Carolina State Univ $17,568 2 $15,787 2 $15,106 3 $13,811 3
Oregon State University $15,971 3 $14,467 4 $13,684 5 $12,696 4
UTAH STATE UNIVERSITY $14,901 4 $13,732 5 $13,950 4 $12,370 5
Virginia Tech University $14,401 5 $13,483 6 $12,617 7 $11,637 7
Texas A & M University $13,938 6 $15,062 3 $16,285 2 $14,742 2
Washington State University $13,833 7 $13,158 7 $12,553 8 $11,729 6
Univ of Maryland, College Pk $12,893 8 $11,674 10 $10,711 10 $9,652 11
New Mexico State University $12,791 9 $12,777 8 $12,682 6 $11,618 8
Iowa State University $12,479 10 $12,143 9 $10,281 11 $9.955 10
Colorado State University $12,326 11 $11,671 11 $11,045 9 $10,450 9
COMPARISON GROUP AVERAGE $15,106 $14,409 $13,867 $12,742
PERCENT OF COMP GROUP AVE:
Utah State University 98.64% 95.30% 100.60% 97.08%
3 (; 4
2 7

Indicator: TOTAL REVENUES PER FTE
1 1989-90 1988-89
Amount Rank Rank
1987-88
Amount Rank
Comparison Group:
1986-87
Amount Rank
COMPREHENSIVE INSTITUTIONS
1985-86 1984-85
Amount Rank Amount Rank
SUNY College at Brockport $9,505 1 $9,533 2 $9,152 1 $8,990 1
Austin Peay State University $9,195 2 $6,417 7 $5,460 11 $4,816 12
Calif St Univ, Dominguez Hills $8,997 3 $10,635 1 $8,980 2 $8,313 2
Univ of Nevada, Las Vegas $8,244 4 $8,039 3 $7,444 3 $7,044 3
Eastern Washington University $7,931 5 $7,256 5 $6,414 6 $6,169 5
Univ of Southern Colorado $7,291 6 $7,366 4 $6,475 5 $5,485 7
SOUTHERN UTAH UNIVERSITY $6,718 7 $6,588 6 $6,941 4 $6,457 4
Indiana University Northwest $6,311 8 $6,069 9 $5,936 9 $5,072 10
Boise State University $6,303 9 $6,020 11 $6,078 7 $5,240 9
Southern Oregon State College $6,238 10 $6,309 8 $5,883 10 $5,314 8
WEBER STATE UNIVERSITY $6,154 11 $6,053 10 $6,023 8 $5,777 6
Univ of Wisconsin, Oshkosh $5,600 12 $5,131 12 $5,120 12 $5,056 11
COMPARISON GROUP AVERAGE $7,562 $7,278 $6,694 $6,150
PERCENT OF COMP GROUP AVE:
Southern Utah University 88.84% 90.52% 103.69% 104.99%
Weber State University 81.38% 83.17% 89.98% 93.93%
Indicator: TOTAL REVENUES PER FTE
1989-90 1988-89
Amount Rank Rank
1987-88
Amount Rank
Comparison Group:
1986-87
Amount Rank
COMMUNITY COLLEGES
1985-86 1984-85
Amount Rank Amount Rank
Grand Rapids Junior College $10,226 1 $4,977 9 $4,720 9 $4,753 6
Western Wyoming Comm College $8,649 2 $10,721 1 $10,870 1 $9,077 1
SNOW COLLEGE $7,376 3 $6,500 5 $6,851 4 $6,495 3
Chemeketa Community College $6,793 4 $6,589 3 $5,803 5 $5,458 5
North Idaho College $6,522 5 $6,602 2 $6,911 3 $6,139 4
COLLEGE OF EASTERN UTAH $6,344 6 $6,565 4 $7,172 2 $7,695 2
Onondaga Community College $5,980 7 $5,466 6 $5,045 7 $4,718 7
DIXIE COLLEGE $5,538 8 $4,818 11 $4,762 8 $4,688 8
SALT LAKE COMMUNITY COLLEGE $5,299 9 $4,779 12 $4,703 10 $4,481 10
Spokane Community College $5,207 10 $4,928 10 $4,483 12 $3,819 15
Danville Community College $4,953 11 $5,179 7 $5,092 6 $4,636 9
Yavapai College $4,951 12 $5,086 8 $4,662 11 $4,459 11
UTAH VALLEY COMMUNITY COLLEGE $4,416 13 $4,496 13 $4,187 14 $3,936 14
Joliet Junior College $4,392 14 $4,265 14 $3,740 15 $4,004 12
Anne Arundel Comm College $4,247 15 $4,188 15 $4,328 13 $3,965 13
COMPARISON GROUP AVERAGE $6,192 $5,800 $5,566 $5,103
PERCENT OF COMP GROUP AVE:
Snow College 119.12% 112.07% 123.09% 127.28%
College of Eastern Utah 102.45% 113.19% 128.85% 150.79%
Dixie College 89.44% 83.07% 85.56% 91.87%
Salt Lake Community College 85.58% 82.40% 84.50% 87.81%
Utah Valley Community College 71.32% 77.52% 75.22% 77.13%
3 5
28

Indicator: INSTRuilrON EXPENDITURES PER FTE
1989-90 1988-89
Amount Rank Rank
1987-88
Amount Rank
Comparison Group:
1986-87
Amount Rank
UNIVERSITY OF UTAH
1985-86 1984-85
Amount Rank Amount Rank
Univ ...difornia, Los Angeles $10,595 1 $10,104 1 $9,576 1 $8,336 1
Univ North Carolina (Ch Hill) $9,597 2 $9,271 2 $8,761 2 $8,261 2
University of Washington $8,189 3 $7,633 3 $6,263 3 $5,909 3
Univ of Virginia, Main Campus $6,523 4 $5,890 4 $5,633 5 $5,083 5
University of Florida $6,326 5 $5,534 5 $5,652 4 $5,411 4
University of Iowa $5,730 6 $5,140 8 $4,919 9 $4,721 7
Purdue University, Main Campus $5,346 7 $5,276 7 $4,842 10 $4,392 10
University of Arizona $5,320 8 $5,137 9 $5,002 8 $4,742 6
UNIVERSITY OF UTAH $5,265 9 $5,129 10 $5,139 6 $4,688 8
Univ Cincinnati, Main Campus $5,190 10 $5,531 6 $5,110 7 $4,463 9
Univ of Colorado, Boulder $3,987 11 $3,749 11 $3,507 11 $3,219 11
COMPARISON GROUP AVERAGE $6,680 $6,327 $5,927 $5,454
PERCENT OF COMP GROUP AVE:
University of Utah 78.82% 81.07% 86.70% 85.96%
Indicator: INSTRUCTION EXPENDITURES PER FTE
1989-90 1988-89
Amount Rank Rank
1987-88
Amount Rank
Comparison Group:
1986-87
Amount Rank
UTAH STATE UNIVERSITY
1985-86 1984-85
Amount Rank Amount Rank
Unif of California, Davis $8,858 1 $8,665 1 $8,088 1 $7,333 1
North Carolina State Univ $5,893 2 $5,319 2 $5,012 2 $4,561 2
Virginia Tech University $5,006 3 $4,674 3 $4,311 3 $3,997 3
Washington State University $4,496 4 $4,297 4 $4,063 6 $3,825 5
UTAH STATE UNIVERSITY $4,229 5 $4,094 6 $4,154 5 $3,665 7
Texas A & M University $4,218 6 $4,119 5 $4,179 4 $3,959 4
Colorado State University $4,163 7 $4,025 7 $4,039 7 $3,756 6
Oregon State University $4,131 8 $3,942 8 $3,613 8 $3,311 10
Univ of Maryland, College Pk $4,000 9 $3,736 9 $3,401 10 $3,312 9
Iowa State University $3,736 10 $3,549 10 $3,403 9 $3,403 8
New Mexico State University $2,979 11 $2,915 11 $2,944 11 $2,676 11
COMPARISON GROUP AVERAGE $4,748 $4,F,24 $4,305 $4,013
PERCENT OF COMP GROUP AVE:
Utah State University 89.07% 90.50% 96.49% 91.33%

Indicator: INSTRUCTION EXPENDITURES PER FTE
1989-90 1988-89
Amount Rank Rank
1987-88
Amount Rank
Comparison Group:
1986-87
Amount Rank
COMPREHENSIVE INSTITUTIONS
1985-86 1984-85
Amount Rank Amount Rank
Calif St Univ. Dominguez Hills $4,896 1 $4,646 1 $3,802 1 $3,592 1
Austin Peay State University $4,260 2 $3,063 4 12,661 8 $2,345 8
SUNY College at Brockport $3,786 3 $3,749 2 $3,560 2 $3,497 2
Eastern Washington University $3,380 4 $3,175 3 $2,816 5 $2,710 4
Boise State University $3,140 5 $3,049 5 $2,877 4 $2,468 7
Univ of Wisconsin, Oshkosh $3.072 6 $2,889 8 $2,748 6 $2,547 5
WEBER STATE UNIVERSITY $2,923 7 $3,010 6 $2,988 3 $2,820 3
Indiana University Northwest $2,896 8 $2,895 7 $2,743 7 $2,164 10
Univ of Nevada, Las Vegas $2,874 9 $2,772 10 $2,632 9 $2,482 6
Southern Oregon State College $2,830 10 $2,850 9 $2,512 10 $2,294 9
Univ of Southern Colorado $2,498 11 $2,395 11 $2,086 12 $1,951 12
SOUTHERN UTAH UNIVERSITY $2,130 12 $2,069 12 $2,316 11 $2,164 10
COMPARISON GROUP AVERAGE $3,363 $3,148 $2,844 $2,631
PERCENT OF COMP GROUP AVE:
Weber State University 86.92% 95.62% 105.06% 107.18%
Southern Utah University 63.34% 65.72% 81.43% 82.25%
Indicator: INSTRUCTION EXPENDITURES PER FTE
1989-90 1988-89
Amount Rank Rank
1987-88
Amount Rank
Comparison Group:
1986-87
Amount Rank
COMMUNITY COLLEGES
1985-86 1984-85
Amount Rank Amount Rank
Western Wyoming Comm College $3,927 1 $4,670 1 $4,776 1 $3,010 1
North Idaho College $2,970 2 $2,968 3 $3,191 2 $2,855 2
Grand Rapids Junior College $2,956 3 $2,615 5 $2,460 6 $2,741 4
Chemeketa Community College $2,932 4 $3,216 2 $3,015 3 $2,836 3
Danville Community College $2,624 5 $2,676 4 $2,449 7 $2,438 6
Onondaga Community College $2,587 6 $2,178 12 $2,109 11 $1,981 11
Joliet Junior College $2,535 7 $2,291 10 $1,780 15 $1,841 14
SNOW COLLEGE $2,472 8 $2,290 11 $2,754 4 $2,267 7
Spokane Community College $2,422 9 $2,316 9 $2,173 10 $1,930 12
SALT LAKE COMMUNITY COLLEGE $2,398 10 $2,481 6 $2,404 8 $2,267 7
Anne Arundel Comm College $2.341 11 $2,405 7 $2,250 9 $2,090 10
COLLEGE OF EASTERN UTAH $2,296 12 $2,335 8 $2,681 5 $2,688 5
Yavapai College $2,196 13 $2,163 13 $1,850 14 $2,116 9
DIXIE COLLEGE $1,936 14 $1,823 15 $1,851 13 $1,352 13
UTAH VALLEY COMMUNITY COLLEGE $1,858 15 $1,916 14 $1,887 12 $1,791 15
COMPARISON GROUP AVERAGE $2,749 $2,750 $2,606 $2,384
PERCENT OF COMP GROUP AVE:
Snow College 89.92% 83.27% 105.684 95.09%
Salt Lake Community College 87.23% 90.22% 92.25% 95.09%
College of Eastern Utah 83.52% 84.91% 102.884 112.75%
Dixie College 70.43% 66.29% 71.03% 77.68%
Utah Valley Community College 67.59% 69.67% 72.41% 75.13%
3 "7
30
1
1

IIIIndicator: RESEARCH EXPENDITURES PER FTE
1989-90
Amount Rank
IUniversity of Washington
University of Florida
Univ California, Los Angeles
University of Arizona
Univ North Carolina (Ch Hill)
IUniv of Virginia, Main Campus
UNIVERSITY OF UTAH
Purdue University, Main Campus
IUniversity of Iowa
Univ of Colorado, Boulder
Univ Cincinnati, Main Campus
ICOMPARISON GROUP AVERAGE
PERCENT OF COMP GROUP AVE:
University of Utah
Indicator: RESEARCH EXPENDITURES PER FTE
i
Univ of California, Davis
New Mexico State University
IOregon State University
UTAH STATE UNIVERSITY
North Carolina State Univ
Texas A & M University
IVirginia Tech University
Iowa State University
Univ of Maryland, College Pk
Washington State University
IColorado State University
COMPARISON GROUP AVERAGE
PERCENT OF COMP GROUP AVE:
IUtah State University
1988-89 1987-88
Rank Amount Rank
Comparison Group:
1986-87
Amount Rank
UNIVERSITY OF UTAH
1985-86 1984-85
Amount Rank Amount Rank
$5,666 1 $5,588 1 $5,776 1 $5,289 1
$5,615 2 $4,760 3 $4,377 3 $3.835 3
$5,231 3 $4,905 2 $4,626 2 $4,426 2
$4,142 4 $3,921 4 $3,529 4 $3,129 5
$3,868 5 $3,437 5 $3,218 5 $3,727 4
$3,202 6 $2,751 7 $2,716 6 $2,363 8
$3,135 7 $2,923 6 $2,620 7 $2,403 7
$2,796 8 $2,578 8 $2,614 8 $2,410 6
$2,583 9 $2,135 10 $1,965 10 $1,783 10
$2,547 10 $2,310 9 $2,03R 9 $1,897 9
$1,729 11 $1,620 11 $1,337 11 $1,263 11
$3,738 . $3,401 $3,220 $3,012
83.87% 85.95% 81.37% 79.78%
Comparison Group: UTAH STATE UNIVERSITY
1989-90 1988-89 1987-88
Amount Rank Rank Amount Rank
1986-87
Amount Rank
1985-86
Amount Rank
1984-85
Amount Rank
$6,157 1 $5,987 1 $5,622 1 $5,145 1
$5,260 2 $5,091 2 $4,941 2 $4,227 2
$5,127 3 $4,643 3 $4,294 3 $4,132 3
$4,841 4 $3,765 5 $3,939 5 $3,449 5
$4,737 5 $4,216 4 $3,948 4 $3,642 4
$3,501 6 $3,365 6 $2,912 6 $2,584 6
$3,194 7 $2,880 7 $2,779 7 $2,429 7
$3,010 8 $2,395 10 $2,335 8 $2,260 9
$2,820 9 $2,526 9 $2,104 10 $1,847 11
$2,664 10 $2,614 8 $2,503 9 $2,394 8
$2,293 11 $2,167 11 $2,089 11 $1,961 10
$3,876 $3,588 $3,353 $3,062
124.90% 104.93% 117.48% 112.64%
3 83]

Indicator: RESEARCH EXPENDITURES PER FTE Comparison Group: COMPREHENSIVE INSTITUTIONS
1989-90 1988-89 1987-88 1986-87 1985-86 1984-85
Awunt Rank
Univ of Nevada, Las Vegas
Indiana University Northwest
Eastern Washington University
liniv of Southern Colorado
doise State University
SUNY College at Brockport
WEBER STATE UNIVERSITY
Univ of Wisconsin, Oshkosh
Austin Peay State University
Southern Oregon State College
Calif St Univ, Dominguez Hills
SOUTHERN UTAH UNIVERSITY
"Less than $0.50
COMPARISON GROUP AVERAGE
PERCENT OF COMP GROUP AVE:
Weber State University
Southern Utah University
Rank Amount Rank Amount Rank Amount Rank Amount
$593 1 $553 1 $421 1 $344
$204 2 $49 7 $34 7 $26
$192 3 $212 3 $196 2 $139
$185 4 $168 4 $134 4 $123
$133 5 $104 5 $101 5 $82
$95 6 $79 6 $73 6 $50
$56 7 $17 9 $12 9 $13
$23 8 $18 8 $16 8 $16
$21 9 $2 10 $1 10 $1
** 10 ** 11 $1 10 $1
$0 11 $290 2 $189 3 $148
$0 11 $0 12 $0 12 $0
$145 $147 $117 $93
38.62% 11.56% 10.26% 13.98%
0.00% 0.00% 0.00% 0.00%
Rank
I1
7
3
4 I5
6
9
I8
10
10
2
I12
Indicator: RESEARCH EXPENDITURES PER FTE
1989-90 1988-89
Amount Rank Rank
1987-88
Amount Rank
Comparison Group:
1986-87
Amount Rank
COMMUNITY COLLEGES
1985-86 1984-85
Amount Rank Amount Rank
Onandaga Community College $28 1 $25 3 $35 1 $31 1
SNOW COLLEGE $7 2 $7 4 $13 2 $5 2
Anne Arundel Comm College $0 3 $37 2 $0 3 $0 3
Chemeketa Community College $0 3 $0 5 $0 3 $0 3
COLLEGE OF EASTERN UTAH $0 3 $0 5 $0 3 $O 3
Danville Community College $0 3 $0 5 $0 3 $0 3
DIXIE COLLEGE $0 3 $0 5 $0 3 $0 3
Grand Rapids Junior College $0 3 $0 5 $0 3 $0 3
Joliet Junior College $0 3 $0 5 $0 3 $0 3
North Idaho College $0 3 $0 5 $0 3 $0 3
SALT LAKE COMMUNITY COLLEGE $0 3 $0 5 $0 3 $0 3
Spokane Community College $0 3 $0 5 $0 3 $0 3
UTAH VALLEY COMMUNITY COLLEGE $0 3 $92 1 $0 3 $0 3
Western Wyoming Comm College $0 3 $0 5 $0 3 $0 3
Yavapai College $0 3 $0 5 $0 3 $0 3
COMPARISON GROUP AVERAGE $3 $6 $3 $3
PERCENT OF COMP GROUP AVE:
Snow College 233.33% 116.67% 433.33% 166.67%
College of Eastern Utah 0.00% 0.00% 0.00% 0.00%
Dixie College 0.00% 0.00% 0.00% 0.00%Salt Lake Community College 0.00% 0.00% 0.00% 0.00%
Utah Valley Community College 0.00% 1533.33% 0.00% 0.00%
I
I
32

Indicator: RESEARCH EXPENDITURES % OF INSTRUCTION EXPENDITURES
1989-90 1988-89
Amount Rank Amount Rank
1987-88
Amount Rank
Comparison Group:
1986-87
Amount Rank
UNIVERSITY OF UTAH
1985-86 1984-85
Amount Rank Amount Rank
University of Florida 88.76% 1 86.01% 1 77.44% 2 70.87% 2
University of Arizona 77.86% 2 76.33% 2 70.55% 3 65.98% 3
University of Washington 69.19% 3 73.21% 3 92.22% 1 89.51% 1
Univ of Colorado, Boulder 63.88% 4 61.62% 4 58.11% 4 58.93% 4
UNIVERSITY OF UTAH 59.54% 5 56.99% 5 50.98% 6 51.26% 7
Purdue University, Main Campus 52.30% 6 48.86% 6 53.99% 5 54.87% 5
Univ California, Los Angeles 49.37% 7 48.55% 7 48.31% 7 53.10% 6
Univ of Virginia, Main Campus 49.09% 8 46.71% 8 48.22% 8 46.49% 8
University of Iowa 45.08% 9 41.54% 9 39.95% 9 37.77% 10
Univ North Carolina (Ch Hill) 40.30% 10 37.07% 10 36.73% 10 45.12% 9
Univ Cincinnati, Main Campus 33.31% 11 29.29% 11 26.16% 11 28.30% 11
COMPARISON GROUP AVERAGE 55.96% 53.75% 54.33% 55.23%
PERCENT OF COMP GROUP AVE:
University of Utah 106.40% 106.03% 93.83% 92.81%
Indicator: RESEARCH EXPENDITURES % OF INSTRUCTION EXPENDITURES
1989-90 1988-89
Amount Rank Amount Rank
1987-88
Amount Rank
Comparison Group:
1986-87
Amount Rank
UTAH STATE UNIVERSITY
1985-86 1984-85
Amount Rank Amount Rank
New Mexico State University 176.57% 1 174.65% 1 167.83% 1 157.96% 1
Oregon State University 124.11% 2 117.78% 2 118.85% 2 124.80% 2
UTAH STATE UNIVERSITY 114.47% 3 91.96% 3 94.82% 3 94.11% 3
Texas A & M University 83.00% 4 81.69% 5 69.68% 5 65.27% 7
Iowa State University 80.57% 5 67.48% 8 68.62% 7 66.41% 6
North Carolina State Univ 80.38% 6 79.26% 4 78.77% 4 79.85% 4
Univ of Maryland, College Pk 70.50% 7 67.61% 7 61.86% 9 55.77% 10
Univ of California, Davis 69.51% 8 69.09% 6 69.51% 6 70.16% 5
Virginia Tech University 63.80% 9 61.62% 9 64.46% 8 60.77% 9
Washington State University 59.25% 10 60.83% 10 61.61% 10 62.59% 8
Colorado State University 55.08% 11 53.84% 11 51.72% 11 52.21% 11
COMPARISON GROUP AVERAGE 81.63% 79.31% 77.89% 76.30%
PERCENT OF COMP GROUP AVE:
Utah State University 140.23% 115.95% 121.74% 123.34%
:L33

Indicator: RESEARCH EXPENDITURES % OF INSTRUCTION EXPENDITURES Comparison Group: COMPREHENSIVE INSTITUTIONS
Univ of Nevada, Las Vegas
Univ of Southern Colorado
Indiana University Northwest
Eastern Washington University
Boise State University
SUNY College at Brockport
WEBER STATE UNIVERSITY
Univ of Wisconsin, Oshkosh
Austin Peay State University
Calif St Univ, Dominguez Hills
Southern Oregon State College
SOUTHERN UTAH UNIVERSITY
COMPARISON GROUP AVERAGE
PERCENT OF COMP GROUP AVE:
Weber State University
Southern Utah University
1989-90 1988-89 1987-88 1986-87 1985-86 1984-85
Amount Rank Amount Rank Amount Rank Amount Rank Amount Rank Amount Rank
20.63% 1 19.95% 1 16.00% 1 13.86% 1
7.41% 2 7.01% 2 6.42% 3 6.30% 2
7.04% 3 1.69% 7 1.24% 7 1.07% 7
5.68% 4 6.68% 3 6.96% 2 5.13% 3
4.24% 5 3.41% 5 3.51% 5 3.32% 5
2.51% 6 2.11% 6 2.05% 6 1.43% 6
1.92% 7 0.56% 9 0.40% 9 0.46% 9
0.75% 8 0.62% 8 0.58% 8 0.63% 8
0.49% 9 0.07% 10 0.04% 10 0.04% 10
0.00% 10 6.24% 4 4.97% 4 4.12% 4
0.00% 10 0.00% 11 0.04% 10 0.04% 10
0.00% 10 0.00% 11 0.00% 12 0.00% 12
4.31% 4.67%
44.55%
0.00%
11.99%
0.00%
4.11% 3.53%
9.73%
0.00%
13.03%
0.00%
Indicator: RESEARCH EXPENDITURES % OF INSTRUCTION EXPENDITURES Comparison Group: COMMUNITY COLLEGES
1989-90 1988-89 1987-88 1986-87 1985-86 1984-85
Amount Rank Rank Amount Rank Amount Rank Amount Rank Amount Rank
Onondaga Community College 1.08% 1 1.15% 3 1.66% 1 1.56% 1
SNOW COLLEGE 0.284 2 0.31% 4 0.47% 2 0.22% 2
Anne Arundel Comm College 0.00% 3 1.54% 2 0.00% 3 0.00% 3
Chemeketa Community College 0.00% 3 0.00% 5 0.00% 3 0.00% 3
COLLEGE OF EASTERN UTAH 0.00% 3 0.00% 5 0.00% 3 0.00% 3
Danville Community College 0.00% 3 0.00% 5 0.00% 3 0.00% 3
DIXIE COLLEGE 0.00% 3 0.00% 5 0.00% 3 0.00% 3
Grand Rapids Junior College 0.00% 3 0.00% 5 0.00% 3 0.00% 3
Joliet Junior College 0.00% 3 0.00% 5 0.00% 3 0.00% 3
North Idaho College 0.00% 3 0.00% 5 0.00% 3 0.00% 3
SALT LAKE COMMUNITY COLLEGE 0.00% 3 0.00% 5 0.00% 3 0.00% 3
Spokane Community College 0.00% 3 0.00% 5 0.00% 3 0.00% 3
UTAH VALLEY COMMUNITY COLLEGE 0.00% 3 4.80% 1 0.00% 3 0.00% 3
Western Wyoming Comm College 0.00% 3 0.00% 5 0.00% 3 0.00% 3
Yavapai College 0.00% 3 0.00% 5 0.00% 3 0.00% 3
COMPARISON GROUP AVERAGE 0.11% 0.22% 0.47% 0.13%
PERCENT OF COMP GROUP AVE:
Snow College 254.55% 140.91% 100.00% 169.23%
College of Eastern Utah 0.00% 0.00% 0.00% 0.00%
Dixie College 0.00% 0.00% 0.00% 0.00%
Salt Lake Community College 0.00% 0.00% 0.00% 0.00%
Utah Valley Community College 0.00% 2181.82% 0.00% 0.00%
34
1

Indicator: ACADEMIC SUPPORT EXPENDITURES PER FTE
1989-90 1988-89
Amount Rank Rank
1987-88
Amount Rank
Comparison Group:
1986-87
Amount Rank
UNIVERSITY OF UTAH
1985-86 1984-85
Amount Rank Amount Rank
Univ California, Los Angeles $4,121 1 $4,138 1 $4,110 1 $3,216 1
Univ of Virginia, Main Campus $2,286 2 $1,821 3 $1,829 2 $1,883 2
University of Washington $1,987 3 $1,877 2 $1,504 4 $1,531 3
University of Arizona $1,583 4 $1,545 4 $1,525 3 $1,358 4
Univ North Carolina (Ch Hill) $1,427 5 $1,301 5 $1,211 5 $1,118 5
UNIVERSITY OF UTAH $1,346 6 $1,212 6 $1,195 6 $1,041 7
University of Iowa $1,286 7 $1,159 8 $1,068 8 $1,043 6
Univ of Colorado, Boulder $1,208 8 $1,125 9 $991 9 $895 9
Univ Cincinnati, Main Campus $1,201 9 $1,209 7 $1,069 7 $962 8
University of Florida $1,016 10 $967 10 $391 11 $354 11
Purdue University, Main Campus $822 11 $757 11 $754 10 $463 10
COMPARISON GROUP AVERAGE $1,694 $1,590 $1,445 $1,282
PERCENT OF COMP GROUP AVE:
University of Utah 79.46% 76.23% 82.70% 81.20%
Indicator: ACADEMIC SUPPORT EXPENDITURES PER FTE
1989-90 1988-89
Amount Rank Rank
1987-88
Amount Rank
Comparison Group:
1986-87
Amount Rank
UTAH STATE UNIVERSITY
1985-86 1984-85
Amount Rank Amount Rank
Univ of California, Davis $3,177 1 $2,977 1 $2,699 1 $2,503 1
Washington State University $1,614 2 $1,499 2 $1,512 2 $1,410 2
Oregon State University $1,169 3 $1,077 3 $967 4 $917 5
Virginia Tech University $1,129 4 $1,074 4 $966 -5 $929 3
North Carolina State Univ $1,072 5 $951 5 $877 6 $929 3
UTAH STATE UNIVERSITY $1,011 6 $948 6 $999 3 $847 6
Univ of Maryland, College Pk $810 7 $758 7 $655 8 $636 7
Iowa State University $693 8 $597 9 $545 10 $530 10
Colorado State University $649 9 $650 8 $684 7 $605 8
Texas A & M University $606 10 $465 11 $292 11 S238 11
New Mexico State University $568 11 $566 10 $584 9 $575 9
COMPARISON GROUP AVERAGE $1,149 $1,061 $978 $927
PERCENT OF COMP GROUP AVE:
Utah State University 87.99% 89.35% 102.15% 91.37%
33235

Indicator: ACADEMIC SUPPORT EXPENDITURES PER FTE
1989-90 1988-89
Amount Rank Rank
1987-88
Amount Rank
Comparison Group:
1986-87
Amount Rank
COMPREHENSIVE INSTITUTIONS
1985-86 1984-85
Amount Rank Amount Rank
Univ of Nevada, Las Vegas $1,048 1 $974 2 $815 2 $734 2
Calif St Univ, Dominguez Hills $870 2 $856 3 $755 3 5721 3
Eastern Washington University $740 3 $630 7 $568 7 $620 4
Southern Oregon State College 5671 4 $695 4 $631 5 $590 6
SOUTHERN UTAH UNIVERSITY $656 5 $1,085 1 $1,099 1 $1,008 1
Austin Peay State University $634 6 $441 11 $381 11 $375 9
Boise State University $606 7 $690 5 $554 8 $512 8
Indiana University Northwest 5595 8 $682 6 $647 4 $600 5
WEBER STATE UNIVERSITY 5521 9 $603 9 $585 6 $554 7
Univ of Southern Colorado $504 10 $604 8 $507 9 $352 10
SUNY College at Brockport $487 11 $477 10 $492 10 $484 11
Univ of Wisconsin, Oshkosh $323 12 $318 12 $376 12 $285 12
COMPARISON GROUP AVERAGE $648 $637 $573 $527
PERCENT OF COMP GROUP AVE:
Southern Utah University 101.23% 170.33% 191.80% 191.27%
Weber State University 80.40% 94.66% 102.09% 105.12%
Indicator: ACADEMIC SUPPORT EXPENDITURES PER FTE
1989-90 1988-89
Amount Rank Rank
1987-88
Amount Rank
Comparison Group:
1986-87
Amount Rank
COMMUNITY COLLEGES
1985-86 1984-85
Amount Rank Amount Rank
Western Wyoming.Comm College $1,583 1 $1,543 1 $1,685 1 $1,627 1
Chemeketa Community College $1,111 2 $717 3 $416 6 $395 5
Yavapai College $467 3 5480 4 $421 4 $206 13
Danville Community College $456 4 $718 2 $670 2 $587 2
Anne Arundel Comm College $433 5 $416 5 5398 7 $340 6
SNOW COLLEGE $400 6 $362 9 $420 5 $408 4
UTAH VALLEY COMMUNITY COLLEGE $394 7 $365 8 $344 8 $224 11
COLLEGE OF EASTERN UTAH $391 8 $397 6 $489 3 $533 3
.Spokane Community College 5364 9 $386 7 5334 9 5266 9
SALT LAKE COMMUNITY COLLEGE $288 10 $235 13 $324 11 $336 7
North Idaho College $266 11 $243 12 $245 13 $210 12
DIXIE COLLEGE $258 12 $296 10 $328 10 $305 8
Onondaga Community College $154 13 $161 15 5153 14 $143 14
Grand Rapids Jurjor College $95 14 $255 11 $250 12 $256 10
Joliet Junior College $87 15 $162 14 $74 15 $71 15
COMPARISON GROUP AVERAGE $502 $508 $465 $410
PERCENT OF COMP GROUP AVE:
Snow College 79.68% 71.26% 90.32% 99.51%
Utah Valley Community College 78.49% 71.85% 73.98% 54.63%
College of Eastern Utah 77.89% 78.15% 105.16% 130.00%
Salt Lake Community College 57.37% 46.26% 69.68% 81.95%
Dixie College 51.39% 58.27% 70.54% 74.39%
333
36
1

Indicator: STUDENT SERVICES EXPENDITURES PER FTE
1989-90 1988-89
Amount Rank Rank
1987-88
Amount Rank
Comparison Group:
1986-87
Amount Rank
UNIVERSITY OF UTAH
1985-86 1984-85
Amount Rank Amount Rank
Univ California, Los Angeles $958 1 $922 1 $926 1 $853 1
Univ of Colorado. Boulder $816 2 $765 2 $728 2 $673 2
Univ of Virginia, Main Campus $634 3 $559 3 $577 3 $500 3
University of Iowa $573 4 $501 4 $510 4 $476 4
University of Florida $563 5 $373 8 $239 11 $222 11
University of Arizona $434 6 $412 6 $468 5 $405 5
UNIVERSITY OF UTAH $418 7 $391 7 $440 6 $348 6
Univ Cincinnati, Main Campus $416 8 $440 5 $390 7 $337 7
University of Washington $364 9 $293 9 $275 9 $256 8
Univ North Carolina (Ch Hill) $309 10 $279 10 $271 10 $255 9
Purdue University, Main Campus $259 11 $261 11 $293 8 $253 10
COMPARISON GROUP AVERAGE $533 $481 $468 $423
PERCENT OF COMP GROUP AVE:
University of Utah 78.42% 81.29% 94.02% 82.27%
Indicator: STUDENT SERVICES EXPENDITURES PER FTE
1989-90 1988-89
Amount Rank Rank
1987-88
Amount Rank
Comparison Group:
1986-87
Amount Rank
UTAH STATE UNIVERSITY
1985-86 1984-85
Amount Rank Amount Rank
Univ of California, Davis $1,233 1 $1,281 1 $1,248 1 $1,131 1
Iowa State University $508 2 $411 4 $473 2 $449 2
New Mexico State University $497 3 $419 3 $452 3 $421 4
Univ of Maryland, College Pk $489 4 $436 2 $387 4 $442 3
Virginia Tech University $419 5 $387 5 $351 5 $221 11
Colorado State University $412 6 $346 7 $342 6 $350 5
Washington State University $371 7 $358 6 $309 8 $317 6
UTAH STATE UNIVERSITY $368 8 $335 8 $342 6 $305 7
Oregon State University $362 9 $312 9 $294 9 $259 9
North Carolina State Univ $329 10 $296 10 $263 10 $250 10
Texas A & M University $197 11 $200 11 $207 11 $301 8
COMPARISON GROUP AVERAGE $482 $444 $433 $414
PERCENT OF COMP GROUP AVE:
Utah State University 76.35% 75.45% 78.98% 73.67%
334
3 7

Indicator: STUDENT SERVICES EXPENDITURES PER FTE
1989-90
Amount Rank
Austin Peay State University
Univ of Nevada, Las Vegas
Calif St Univ, Dominguez Hills
SOUTHERN UTAH UNIVERSITY
SUNY College at Brockport
Eastern Washington University
Univ of Southern Colorado
WEBER STATE UNIVERSITY
Indiana University Northwest
Univ of Wisconsin, Oshkosh
Boise State University
Southern Oregon State College
COMPARISON GROUP AVERAGE
PERCENT OF COMP GROUP AVE:
Southern Utah University
Weber State University
1988-89 1987-88 1986-87 1985-86 1984-85
Comparison Group: COMPREHENSIVE INSTITUTIONS
1Rank Amount Rank Amount Rank Amount Rank Amount
$1,203 1 $782 3 $667 3 $562
$1,076 2 $1,100 2 $1,033 1 $1,231
$923
$580
3
4
$1,165
$360
1
9
$818
$371
2
8
$835
$341
$576 5 $450 5 $438 4 $415
$470 6 $421 7 $366 9 $289
$459
$ 423
7
8
$584
$424
4
6
$375
$389
7
6
$443
$334
$413 9 $376 8 $391 5 $332
$352 10 $325 11 $324 10 $311
$324
$ 310
11
12
$302
$341
12
10
$293
$311
12
11
$245
$291
$611 $585 $502 $495
94.93% 61.54% 73.90% 68.89%
69.23% 72.48% 77.49% 67.47%
Indicator: STUDENT SERVICES EXPENDITURES PER FTE
1989-90 1988-89
Amount Rank Rank
1987-88
Amount Rank
Comparison Group:
1986-87
Amount Rank
Grand Rapids Junior College $1,042 1 $672 4
SNOW COLLEGE $806 2 $617 5
North Idaho College $191 3 $707 3
Western Wyoming Comm College $708 4 $852 1
COLLEGE OF EASTERN UTAH $687 5 $735 2
SALT.LAKE COMMUNITY COLLEGE $570 6 $449 7
DIXIE COLLEGE $515 7 $419 9
Chemeketa Community College $484 8 $481 6
Onondaga Community College $482 9 $427 8
Anne Arundel Comm College $400 10 $318 13
Spokane Community College $398 11 $366 10
UTAH VALLEY COMMUNITY COLLEGE $388 12 $237 15
Yavapai College $321 13 $334 12
Danville Community College $295 14 $302 14
Joliet Junior College $293 15 $348 11
COMPARISON GROUP AVERAGE $521 $481
PERCENT OF COMP GROUP AVE:
Snow College 154.70% 128.27%
College of Eastern Utah 131.86% 152.81%
Salt Lake Community College 109.40% 93.35%
Dixie College 98.85% 87.11%
Utah Valley Community College 74.47% 49.27%
3 538
COMMUNITY COLLEGES
1985-86 1984-85
Rank
I3
1
2
6 I5
11
I4
7
8
9
I12
10
I
Amount Rank Amount Rank
$483 5 $424 7 I$535 4 $508 4
$702 3 $615 3
$853 2 $1,431 1
$937 1 $630 2 I$405 7 $358 8
$406 6 $456 5
$362 9 $330 10
$373 8 $452 6 I$270 13 $259 13
$351 10 $313 11
$219 14 $25L 14
$319 11 $350 9 I$295 12 $260 12
$188 15 $155 15
$420 $459 i127.38% 110.68%
223.10% 137.25%
I96.43% 78.00%
96.67% 99.35%
52.14% 54.90%
I

Indicator: SCHOLARSHIPS AND FELLOWSHIPS PER FTE
1989-90 1988-89
Amount Rank Rank
1987-88
Amount Rank
Comparison Group:
1986-87
Amount Rank
UNIVERSITY OF UTAH
1985-86 1984-85
Amount Rank Amount Rank
Univ of Virginia, Main Campus $1,276 1 $1,113 3 $1,155 2 $959 3
University of Washington $1,174 2 $1,179 1 $1,178 1 $977 2
Univ California, Los Angeles $1,153 3 $1,153 2 $1,138 3 $1,003 1
Univ North Carolina (Ch Hill) $1,079 4 $790 6 $770 6 $643 6
Univ Cincinnati, Main Campus $1,017 5 $802 5 $778 5 $718 4
University of Iowa $1,015 6 $900 4 $835 4 $707 5
University of Arizona $780 7 $718 7 $662 7 $602 7
UNIVERSITY OF UTAH $637 8 $659 8 $590 8 $514 8
Univ of Colorado, Boulder $635 9 $558 10 $486 10 $465 9
Purdue University, Main Campus $520 10 $442 11 $472 11 $431 11
University of Florida $395 11 $593 9 $544 9 $463 10
COMPARISON GROUP AVERAGE $904 $825 $802 $697
PERCENT OF COMP GROUP AVE:
University of Utah 70.46% 79.88% 73.57% 73.74%
Indicator: SCHOLARSHIPS AND FELLOWSHIPS PER FTE
1989-90 1988-89
Amount Rank Rank
1987-88
Amount Rank
Comparison Group:
1986-87
Amount Rank
UTAH STATE UNIVERSITY
1985-86 1984-85
Amount Rank Amount Rank
UTAH STATE UNIVERSITY $894 1 $815 1 $799 2 $700 I
Univ of California, Davis $841 2 $797 9 $772 3 $674 3
Oregon State University $833 3 $757 3 $746 4 $691 2
Iowa State University $822 4 $739 4 $653 5 $529 7
New Mexico State University $701 5 $681 6 $634 6 $541 4
Washington State University $651 6 $623 7 $579 7 $481 9
North Carolina State Univ $628 7 $579 9 $573 8 $514 8
Colorado State University $623 8 $610 8 $610 9 $541 4
Texas A & M University $588 9 $721 5 $862 1 $322 11
Univ of Maryland, College Pk $544 10 $464 11 $455 11 $432 10
Virginia Tech University $518 11 $479 10 $479 10 $537 6
COMPARISON GROUP AVERAGE $675 $645 $636 $526
PERCENT OF COMP GROUP AVE:
Utah State University 132.44% 126.36% 125.63% 133.08%
639

Indicator: SCHOLARSHIPS AND FELLOWSHIPS PER FTE Comparison Group: COMPREHENSIVE INSTITUTIONS
Univ of Southern Colorado
SOUTHERN UTAH UNIVERSITY
Southern Oregon State College
Eastern Washington University
SUNY College at Brockport
Austin Peay State University
Indiana University Northwest
WEBER STATE UNIVERSITY
Univ of Wisconsin, Oshkosh
Univ of Nevada, Las Vegas
Calif St Univ, Dominguez Hills
Boise State University
COMPARISON GROUP AVERAGE
PERCENT OF COMP GROUP AVE:
Southern Utah University
Weber State University
1989-90 1988-89 1987-88 1986-87 1985-86 1984-85
Amount Rank Rank Amount Rank
149.51%
$980 1 $984 3 $904 3 $705 4
$909 2 $895 4 $880 4 $820 3
$901 3 $995 2 $1,000 2 $880 2
$894 4 $602 5 $541 8 $427 8
$815 5 $1,454 1 $1,206 1 $1,145 1
$654 6 $440 8 $451 9 $407 9
$607 7 $572 7 $626 5 $478 7
$587 8 $594 6 $585 7 $508 5
$424 9 $417 9 $443 10 $376 10
$343 10 $354 10 $418 11 $222 11
$286 11 $299 11 $248 12 $222 11
$179 12 $194 12 $597 6 $500 6
$608
96.55%
Amount Rank Amount Rank Amount Rank
$631
141.84%
94.14%
$643
136.86%
90.98%
$536
152.99%
94.78%
Indicator: SCHOLARSHIPS AND FELLOWSHIPS PER FTE
North Idaho College
COLLEGE OF EASTERN UTAH
Spokane Community College
DIXIE COLLEGE
Onondaga Community College
SNOW COLLEGE
SALT LAKE COMMUNITY COLLEGE
UTAH VALLEY COMMUNITY COLLEGE
Chemeketa Community College
Grand Rapids Junior Colleg,
Western Wyoming Comm College
Danville Community College
Yavapai College
Joliet Junior College
Anne Arundel Comm College
COMPARISON GROUP AVERAGE
PERCENT OF COMP GROUP AVE:
College of Eastern Utah
Dixie College
Snow College
Salt Lake Community College
Utah Valley Community College
1989-90
Amount Rank
Comparison Group:
I1988-89 1987-88 1986-87
Rank Amount Rank Amount Rank
$1,043 1 $1,087 1
$894 2 $864 2
$801 3 $537 5
$730 4 $590 4
$652 5 $603 3
$622 6 $502 6
$586 7 $455 7
$451 8 $455 7
$441 9 $406 10
$404 10 $412 9
$351 11 $212 13
$335 12 $338 11
$266 13 $249 12
$172 14 $202 14
$105 15 $74 15
$457 $412
195.62% 209.71%
159.74% 143.20%
136.11% 121.84%
128.23% 110.44%
98.69% 110.44%
COMMUNITY COLLEGES
1985-86 1984-85
Amount Rank Amount Rank
I$1,093 1 $839 2
$851 2 $957 1
$502 6 $376 10
$548 5 $482 4
I$366 12 $297 13
$575 4 $442 6
$457 8 $387 9
$422 11 $338 11
$452 9 $391 8
I$432 10 $420 7
$151 15 $444 5
$487 7 $323 12
$311 13 $259 14
I$722 3 $540 3
$256 14 $225 15
I
1
II
$477 $411
178.41% 232.85%
114.88% 117.27%
120.55% 107.54%
95.81% 94.16%
88.47% 82.24%
337 II
40
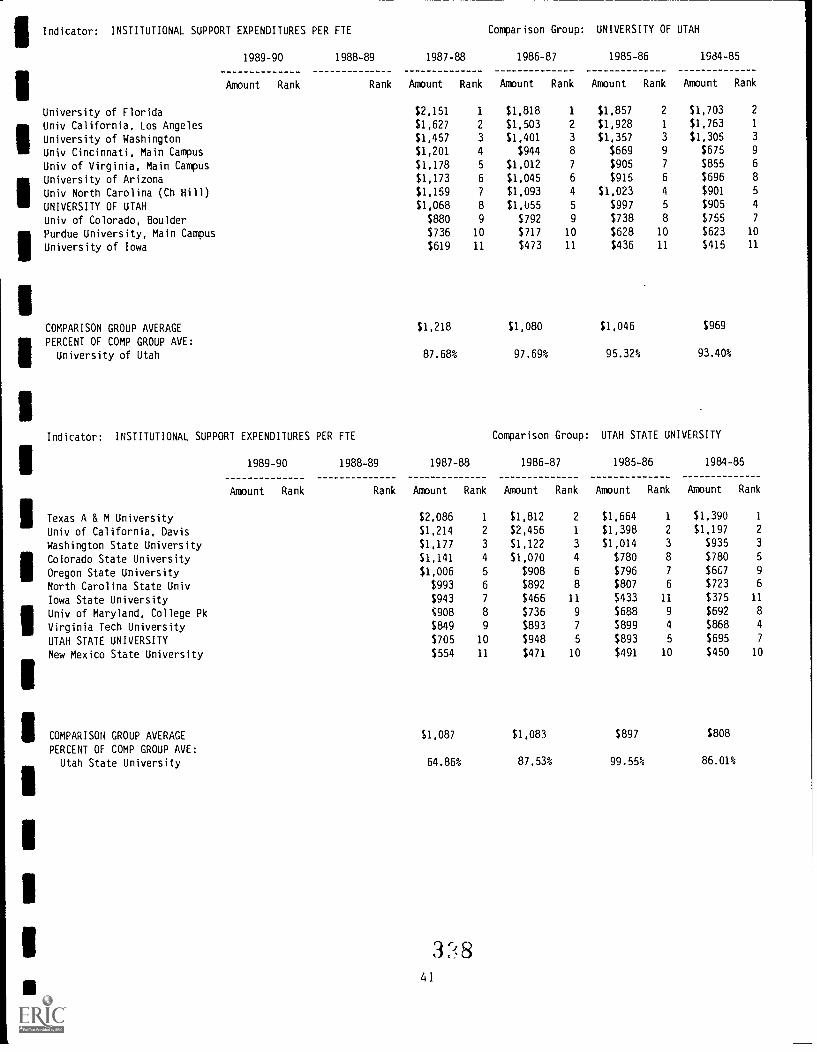
IIndicator: INSTITUTIONAL SUPPORT EXPENDITURES PER FTE
1989-90 1988-89
Amount Rank
University of Florida
IUniv California. Los Angeles
University of Washington
Univ Cincinnati, Main Campus
Univ of Virginia, Main Campus
IUniversity of Arizona
Univ North Carolina (Ch Hill)
UNIVERSITY OF UTAH
Univ of Colorado, Boulder
IPurdue University, Main Campus
University of Iowa
COMPARISON GROUP AVERAGE
PERCENT OF COMP GROUP AVE:
University of Utah
Indicator: INSTITUTIONAL SUPPORT EXPENDITURES PER FTE
ITexas A & M University
Univ of California, Davis
Washington State University
IColorado State University
Oregon State University
North Carolina State Univ
Iowa State University
IUniv of Maryland, College Pk
Virginia Tech University
UTAH STATE UNIVERSITY
New Mexico State University
ICOMPARISON GROUP AVERAGE
PERCENT OF COMP GROUP AVE:
Utah State University
Rank
1987-88
Amount Rank
Comparison Group:
1986-87
Amount Rank
UNIVERSITY OF UTAH
1985-86 1964-85
Amount Rank Amount Rank
$2,151 1 $1,818 1 $1,857 2 $1,703 2
$1,627 2 $1,503 2 $1,928 1 $1,763 1
$1,457 3 $1,401 3 $1,357 3 $1,305 3
$1,201 4 $944 8 $669 9 $675 9
$1,178 5 $1,012 7 $905 7 $855 6
$1,173 6 $1,045 6 $915 6 $696 8
$1,159 7 $1,093 4 $1,023 4 $901 5
$1,068 8 $1,055 5 $997 5 $905 4
$880 9 $792 9 $738 8 $755 7
$736 10 $717 10 $628 10 $623 10
$619 11 $473 11 $436 11 $415 11
$1,218 $1,080 $1,046 $969
87.68% 97.69% 95.32% 93.40%
Comparison Group: UTAH STATE UNIVERSITY
1989-90 1988-89 1987-88
Amount Rank Rank Amount Rank
1986-87
Amount Rank
1985-86
Amount Rank
1984-85
Amount Rank
$2,086 1 $1,812 2 $1,664 1 $1,390 1
$1,214 2 $2,456 1 $1,398 2 $1,197 2
$1,177 3 $1,122 3 $1,014 3 $935 3
$1,141 4 $1,070 4 $780 8 $780 5
$1,006 5 $908 6 $796 7 $667 9
$993 6 $892 8 $807 6 $723 6
$943 7 $466 11 $433 11 $375 11
008 8 $736 9 $688 9 $692 8
$849 9 $893 7 $899 4 $868 4
$705 10 $948 5 $893 5 $695 7
$554 11 $471 10 $491 10 $450 10
$1,087 $1,083 $897 $808
64.86% 87.53% 99.55% 86.01%
3 84 1

Indicator: INSTITUTIONAL SUPPORT EXPENDITURES PER FTE Comparison Group: COMPREHENSIVE INSTITUTIONS
1989-90 1988-89 1987-88 1986-87 1985-86 1984-85
Amount Rank Rank Amount Rank Amount Rank Amount Rank Amount Rank1
Calif St Univ, Dominguez Hills $1,651 1 $1,472 1 $2,273 1 $1,695 1
SUNY College at Brockport $1,387 2 $973 3 $1,171 3 $1,058 2
Univ of Nevada, Las Vegas $989 3 $833 4 $868 4 $729 5
Austin Peay State University $940 4 $671 7 $566 9 $445 11
SOUTHERN UTAH UNIVERSITY $764 5 $749 5 $846 5 $777 4
Eastern Washington University $735 6 $676 6 $721 6 $610 6
Univ of Southern Colorado $725 7 $1,374 2 $1,300 2 $1,043 3
Southern Oregon State College $639 8 $646 8 $597 8 $592 7
Boise State University $553 9 $542 10 $540 10 $482 9
WEBER STATE UNIVERSITY $553 10 $575 9 $645 7 $572 8
Univ of Wisconsin, Oshkosh $402 11 $352 12 $371 11 $366 12
Indiana University Northwest $350 12 $360 11 $521 12 $456 10
COMPARISON GROUP AVERAGE $838 $790 $893 $748
PERCENT OF COMP GROUP AVE:
Southern Utah University 91.17% 94.81% 94.74% 103.88%
Weber State University 65.99% 72.78% 72.23% 76.47%
Indicator: INSTITUTIONAL SUPPORT EXPENDITURES PER FTE
1989-90 1988-89
Amount Rank Rank
1987-88
Amount Rank
Comparison Group:
1986-87
Amount Rank
COMMUNITY COLLEGES
1985-86 1984-85
Amount Rank Amount Rank
Onondaga Community College $1,407 1 $1,286 2 $1,405 2 $1,067 2
Chemeketa Community College $1,168 2 $1,166 3 $1,087 4 $977 4
COLLEGE OF EASTERN UTAH $1,079 3 $1,062 4 $1,199 3 $1,371 1
SNOW COLLEGE $1,072 4 $905 7 $1,032 5 $1,019 3
Yavapai College $999 5 $1,059 5 $923 6 $786 6
Western Wyoming Comm College $849 6 $1,514 1 $2,303 1 $904 5
Danville Community College $777 7 $753 8 $756 9 $610 8
DIXIE COLLEGE $768 8 $720 9 $793 8 $520 12
UTAH VALLEY COMMUNITY COLLEGE $750 9 $923 6 $834 7 $708 7
SALT LAKE COMMUNITY COLLEGE $678 10 $634 10 $600 11 $562 10
Joliet Junior College $617 11 $509 14 $525 13 $537 11
Grand Rapids Junior College $603 12 $161 15 $203 15 $188 15
North Idaho College $601 13 $622 11 $649 10 $576 9
Anne Arundel Comm College $572 14 $560 12 $589 12 $508 13
Spokane Community College $529 15 $541 13 $493 14 $443 14
COMPARISON GROUP AVERAGE $812 $817 $893 $660
PERCENT OF COMP GROUP AVE:
College of Eastern Utah 132.88% 129.99% 134.27% 207.73%
Snow College 132.02% 110.77% 115.57% 154.39%
Dixie College 94.58% 88.13% 88.80% 78.79%
Utah Valley Community College 92.36% 112.97% 93.39% 107.27%
Salt Lake Community College 83.50% 77.60% 67.19% 85.15%
42

Indicator: PHYSICAL PLANT 0 & M EXPENDITURES PER FTE
1989-90 1988-89
Amount Rank Rank
1987-88
Amount Rank
Comparison Group:
1986-87
Amount Rank
UNIVERSITY OF UTAH
1985-86 1984-85
Amount Rank Amount Rank
Univ North Carolina (Ch Hill) $2,074 1 $1,868 1 $1,654 1 $1,315 1
University of Washington $1,416 2 $1,414 2 $1,238 3 $1,085 3
Univ California, Los Angeles $1,411 3 $1,318 3 $1,293 2 $1,232 2
University of Iowa $1,208 4 $1,033 7 $996 8 $893 8
Purdue University, Main Campus $1,184 5 $1,172 4 $1,060 5 $999 6
Univ of Virginia, Main Campus $1,158 6 $1,085 6 $1,008 7 $918 7
UNIVERSITY OF UTAH $1,089 7 $1,103 5 $1,142 4 $1,012 5
University of Florida $1,024 8 $922 10 $1,042 6 $1,041 4
University of Arizona $985 9 $954 9 $869 10 $890 9
Univ Cincinnati, Main Campus $965 10 $1,029 8 $937 9 $862 10
Univ of Colorado, Boulder $569 11 $562 11 $537 11 $545 11
COMPARISON GROUP AVERAGE $1,199 $1,136 $1,063 $998
PERCENT OF COMP GROUP AVE:
University of Utah 90.83% 97.10% 107.43% 101.40%
Indicator: PHYSICAL PLANT 0 & M EXPENDITURES PER FTE
1989-90 1988-89
Amount Rank Rank
1987-88
Amount Rank
Comparison Group:
1986-87
Amount Rank
UTAH STATE UNIVERSITY
1985-86 1984-85
Amount Rank Amount Rank
Univ of California, Davis $1,723 1 $1,633 1 $1,595 1 $1,482 1
North Carolina State Univ $1,156 2 $1,056 3 $1,049 4 $976 4
Washington State University $1,108 3 $1,144 2 $1,030 5 $1,045 3
Univ of Maryland, College Pk $1,061 4 $780 10 $949 6 $890 7
Texas A & M University $1,017 5 $974 4 $1,196 2 $1,241 2
UTAH STATE UNIVERSITY $979 6 $924 5 $1,059 3 $975 5
Oregon State University $916 7 $833 9 $754 9 $795 8
Colorado State University $906 8 $894 6 $843 8 $780 9
Iowa State University $880 9 $889 7 $864 7 $892 6
Virginia Tech University $820 10 $843 8 $694 11 $694 11
New Mexico State University $747 11 $690 11 $742 10 $726 10
COMPARISON GROUP AVERAGE $1,033 $974 $972 $952
PERCENT OF COMP GROUP AVE:
Utah State University 94.77% 94.87% 108.95% 102.42%
4 3

Indicator: PHYSICAL PLANT 0 & M EXPENDITURES PER FTE
1989-90 1988-89
Amount Rank Rank
1987-88
Amount Rank
Comparison Group:
1986-87
Amount Rank
COMPREHENSIVE INSTITUTIONS
1985-86 1984-85
Amount Rank Amount Rank
SUNY College at Brockport $1,103 1 $1,008 2 $992 1 $1,008 1
Eastern Washington University $1,032 2 $1,070 1 $887 3 $889 3
Univ of Nevada, Las Vegas $922 3 $1,000 3 $950 2 $990 2
Calif St Univ, Dominguez Hills $839 4 $951 4 $471 12 $747 5
Univ of Southern Colorado $839 4 $690 8 $627 8 $524 9
Austin Peay State University $820 6 $596 9 $577 9 $514 11
Indiana University Northwest $810 7 $767 6 $735 6 $684 7
SOUTHERN UTAH UNIVERSITY $754 8 $781 5 $864 4 $748 4
WEBER STATE UNIVERSITY $692 9 $694 7 $739 5 $707 6
Boise State University $564 10 $504 11 $638 7 $459 12
Southern Oregon State College $537 11 $583 10 $479 11 $525 8
Univ of Wisconsin, Oshkosh $527 12 $488 12 $521 10 $522 10
COMPARISON GROUP AVERAGE $799 $766 $688 $686
PERCENT OF COMP GROUP AVE:
Southern Utah University 94.37% 101.96% 125.58% 109.04%
Weber State University 86.61% 90.60% 107.41% 103.06%
Indicator: PHYSICAL PLANT 0 & M EXPENDITURES PER FTE
1989-90 1988-89
Amount Rank Rank
1987-88
Amount Rank
Comparison Group:
1986-87
Amount Rank
COMMUNITY COLLEGES
1985-86 1984-85
Amount Rank Amount Ra nk
Western Wyoming Comm College $1,520 1 $1,294 1 $1,150 1 $867 2
SNOW COLLEGE $1,051 2 $908 2 $1,023 2 $1,037 1
COLLEGE OF EASTERN UTAH $814 3 $793 3 $882 3 $781 3
North Idaho College $692 4 $763 4 $802 4 $718 4
Onondaga Community College $649 5 $578 6 $602 7 $544 6
DIXIE COLLEGE $566 6 $580 5 $620 6 $623 5
Yavapai College $519 7 $521 9 $491 8 $440 10
Chemeketa Community College $509 8 $430 13 $336 15 $318 15
SALT LAKE COMMUNITY COLLEGE $493 9 $535 8 $481 9 $417 12
Joliet Junior College $491 10 $536 7 $674 5 $527 7
Grand Rapids Junior College $468 11 $246 15 $469 11 $440 10
Spokane Community College $456 12 $481 11 $458 12 $444 9
UTAH VALLEY COMMUNITY COLLEGE $456 13 $490 10 $448 13 $390 13
Anne Arundel Comm College $421 14 $434 12 $481 9 $465 8
Danville Community College $379 15 $429 14 $386 14 $330 14
COMPARISON GROUP AVERAGE $610 $571 $585 $509
PERCENT OF COMP GROUP AVE:
Snow College 172.30% 159.02% 174.87% 203.73%
College of Eastern Utah 133.44% 138.88% 150.77% 153.44%
Dixie College 92.79% 101.58% 105.98% 122.40%
Salt Lake Community College 80.82% 93.70% 82.22% 81.93%
Utah Valley Community College 74.75% 85.81% 76.58% 76.62%
3 4 i44
1

Indicator: TOTAL EXPENDITURES AND TRANSFERS PER FTE
1989-90 1988-89
Amount Rank Rank
1987-88
Amount Rank
Comparison Group:
1986-87
Amount Rank
UNIVERSITY OF UTAH
1985-86 1984-85
Amount Rank Amount Rank
Univ California, Los Angeles 527,203 1 $25,471 1 $24,683 1 522,001 1
Univ North Carolina (Ch Hill) $23,836 2 521,860 2 $20,525 2 $19,845 2
University of Washington $21,754 3 $20,710 3 $17,915 3 516,677 3
University of Florida $18,711 4 $16,291 4 514,879 4 $13,728 4
Univ of Virginia, Main Campus $17,424 5 $15,803 5 $14,131 6 512,935 6
UNIVERSITY OF UTAH $15,831 6 $15,035 6 $14,417 5 513,028 5
University of Arizona $15,402 7 $14,681 7 $13,785 7 $12,444 7
University of Iowa $13,905 8 $12,112 10 $11,599 9 $10,732 9
Purdue University, Main Campus $13,271 9 $12,747 9 $11,932 8 $10,742 8
Univ Cincinnati, Main Campus $13,240 10 $13,173 8 $11,233 10 $10,302 10
Univ of Colorado, Boulder $11,766 11 $10,828 11 $9,158 11 $8,674 11
COMPARISON GROUP AVERAGE $17,651 $16,368 $14,984 $13,808
PERCENT OF COMP GROUP AVE:
University of Utah 89.69% 91.86% 96.22% 94.35%
Indicator: TOTAL EXPENDITURES AND TRANSFERS PER FTE
1989-90 1988-89
Amount Rank Rank
1987-88
Amount Rank
Comparison Group:
1986-87
Amount Rank
UTAH STATE UNIVERSITY
1985-86 1984-85
Amount Rank Amount Rank
Univ of California, Davis $25,052 1 $25,152 1 $22,226 1 $20.229 1
North Carolina State Univ $17,324 2 $15,590 2 $14,862 2 $13,600 2
Oregon State University $15,937 3 $14,495 3 $13,428 5 $12,636 3
UTAH STATE UNIVERSITY $14,833 4 $13,760 5 $13,647 4 $11,923 4
Virginia Tech University $14,354 5 $13,427 6 $12,534 6 $11,748 6
Washington State University $13,549 6 $13,212 7 $12,321 7 $11,639 7
Texas A & M University $13,295 7 $14,418 4 $14,217 3 $11,842 5
New Mexico State University $12,825 8 $12,570 8 $12,190 8 511,061 8
Univ of Maryland, College Pk $12,781 9 $11,186 10 $9,399 11 $8,939 11
Iowa State University $12,662 10 $10,611 11 $9,778 10 $9,495 10
Colorado State University $11,927 11 $11,467 9 $10,960 9 $10,104 9
COMPARISON GROUP AVERAGE $14,971 $14,213 513,192 $12,129
PERCENT OF COMP GROUP AVE:
Utah State University 99.08% 96.81% 103.45% 98.30%
342
4 5

IPdicator: TOTAL EXPENDITURES AND TRANSFERS PER FTE
1989-90 1988-89
Amount Rank Rank
1987-88
Amount Rank
Comparison Group:
1986-87
Amount Rank
COMPREHENSIVE INSTITUTIONS
1.485-86 1984-85
Amount Rank Amount Rank
Calif St Univ, Dominguez Hills $9,555 1 $9,862 1 $8,723 2 $8,129 2
SUNY College at Brockport $9,279 2 $9,497 2 $9,169 1 $9,061 1
Austin Peay State University $8,833 3 $6,296 8 $5,367 11 $4,714 12
Univ of Nevada, Las Vegas $7,974 4 $7,735 3 $7,295 3 $6,883 3
Eastern Washington University $7,652 5 $6,980 5 $6,235 6 $5,813 5
Univ of Southern Colorado $6,819 6 $7,315 4 $6,394 5 $5,494 7
Indiana University Northwest $6,525 7 $5,995 10 $5,721 10 $5,029 9
SOUTHERN UTAH UNIVERSITY $6,517 8 $6,460 6 $6,951 4 $6,260 4
Southern Oregon State College $6,196 9 $6,420 7 $5,737 9 $5,348 8
Boise State University $5,738 10 $5,646 11 $5,819 8 $4,960 10
WEBER STATE UNIVERSITY $5,688 11 $6,197 9 $6,028 7 $5,584 6
Univ of Wisconsin, Oshkosh $5,649 12 $5,125 12 $5,147 12 $4,746 11
COMPARISON GROUP AVERAGE $7,422 $7,087 $6,561 $6,018
PERCENT OF COMP GROUP AVE:
Southern Utah University 87.81% 91.15% 105.94% 104.02%
Weber State University 76.64% 87.44% 91.88% 92.79%
Indicator: TOTAL EXPENDITURES AND TRANSFERS PER FTE
1989-90 1988-89
Amount Rank Rank
1987-88
Amount Rank
Comparison Group:
1986-87
Amount Rank
COMMUNITY COLLEGES
1985-86 1984-85
Amount Rank Amount Rank
Western Wyoming Comm College $9,132 1 $10,099 1 $10,918 1 $8,284 1
SNOW COLLEGE $7,234 2 $6,055 5 $6,751 4 $6,098 3
Chemeketa Community College $6,746 3 $6,507 3 $5,756 5 $5,316 5
North Idaho College $6,552 4 $6,547 2 $6,853 3 $5,956 4
COLLEGE OF EASTERN UTAH $6,239 5 $6,260 4 $7,049 2 $6,959 2
Onondaga Community College $5,962 6 $5,260 6 $5,044 7 $4,516 8
Grand Rapids Junior College $5,923 7 $4,856 8 $4,745 8 $4,755 6
DIXIE COLLEGE $5,231 8 $4,661 11 $4,745 8 $4,427 9
SALT LAKE COMMUNITY COLLEGE $5,073 9 $4,800 10 $4,670 10 $4,328 10
Spokane Community College $4,970 10 $4,628 12 $4,313 12 $3,770 13
Danville Community College $4,868 11 $5,218 7 $5,046 6 $4,549 7
Yavapai College $4,785 12 $4,822 9 $4,372 11 $4,214 11
Joliet Junior College $4,408 13 $4,253 14 $4,006 15 $3,741 15
UTAH VALLEY COMMUNITY COLLEGE $4,296 14 $4,528 13 $4,154 14 $3,770 13
Anne Arundel Comm College $4,272 15 $4,244 15 $4,243 13 $3,887 12
COMPARISON GROUP AVERAGE $5,762 $5,643 $5,530 $4,899
PERCENT OF COMP GROUP AVE:
Snow College 125.55% 107.30% 122.08% 124.47%
College of Eastern Utah 108.28% 110.93% 127.47% 142.05%
Dixie College 90.78% 82.60% 85.80% 90.37%
Salt Lake Community College 88.04% 85.06% 84.45% 88.34%
Utah Valley Community College 74.56% 80.24% 75.12% 76.95%
3 d 3
4 6
11
1
1