Embed Size (px)
Citation preview
DOCUMENT RESUME
ED 362 277 PS 021 696
AUTHOR Mantzicopoulos, Panayota; Jarvinen, Denis W.TITLE An Analysis of the Brigance K & 1 Screen with a
Disadvantaged Pre-School Sample.PUB DATE 16 Apr 93NOTE 30p.; Paper presented at the Annual Meeting of the
American Educational Research Association (AtlantaGA, April 12-16, 1993).
PUB TYPE Reports Research/Technical (143)Speeches/Conference Papers (150)
EDRS PRICE MF01/PCO2 Plus Postage.DESCRIPTORS Comparative Analysis; Early Intervention; Educational
Diagnosis; Educationally Disadvantaged; FactorAnalysis; *High Risk Students; *Predictive Validity;*Preschool Children; Preschool Education; Scores;Screening Tests; Socioeconomic Status; TestConstruction; *Test Reliability
IDENTIFIERS *Brigance K and 1 Screen; *Kaufman Assessment Batteryfor Children
ABSTRACT
The Brigance K&1 test is a battery of 12 subtestswidely used to identify entering kindergarten children in need ofmore comprehensive evaluation. To gather data on the reliability ofthe test, an analysis was conducted of results for 134 children fromlow socioeconomic backgrounds. The children were administered boththe Brigance K&1 screen and a separate battery, the KaufmanAssessment Battery for Children (K-ABC), for comparison. Also, toexamine both inter-rater and test-retest reliability, 37randomly-selected children were retested 2 few months later on theBrigance screen using two evaluators, rnd all children weresubsequently retested with the K-ABC. Results of the study includedthe following findings: (1) with respect to reliability, theinter-rater measure was found to be high, while the test-retestmeasure was moderate, with considerable variation between subtests;(2) a factor analysis of results showed no evidence that the 12subtests measured distinct functionings--only 5 reliable factorsemerged; and (3) a general positive correlation was found betweenfour of these Brigance KO factors and three K-ABC subtests. The datacontraindicate the use of the K&1 screen as a single instrument inearly identification and intervention efforts. (Data tables and 14references are included.) (BCY)
***********************************************************************
Reproductions supplied by EDRS are the best that can be madefrom the original document.
***********************************************************************
U S. DEPARTMENT OF EDUCATIONOffice ol Educational Research and Improvement
EDUCATIONAL RESOURCES INFORMATIONCENTER (ERIC)
%Ares document has been reproouced as'Keened from the parson or organtralton
ortginattngO Woo; changes have peen made to tmprove
reproduction quality
Potnts ot view or ocentons statedtn silts 00Cument do not necessardy represent ofitctalOERI poittton or poltcy
1
Analysis of the Brigance K&1 Screen
An analysis of the Brigance K & 'I screen
with
a disadvantaged pre-school sample
Panayota Mantzicopoulos
Denis W. Jarvinen
Department of Educational Studies
Purdue University
PERMISSION TO REPRODUCE THISMATERIAL HAS BEEN GRANTED BY
____e_cgm yits.z- tc0-Fou.kS
TO THE EDUCATIONAL RESOURCESINFORMATION CENTER (ERIC).-
Paper presented at the annual meeting
of the American Educational Research Association
Session 57.03
Atlanta, GA
April 16,1993
RWe wish to express their deep appreciation to Linda Stephenson and Holly Kirkpatrick for their
invaluable administrative support. We also wish to thank Jill M. Braun and Michelle Dupree
for their expert help and advice in the data collection phase of this project

2Analysis of the Brigance K&1 Screen
Abstract
The present study examined the properties of the Brigance K&1 screen with a
sample of 134 preschool children preparing to enter kindergarten. Reliability
estimations indicated high inter-rater agreement and moderate internal
consistency and test-retest reliabilities. With respect to the dimensionality of
the test, there was no factor analytic support for 12 distinct components of
functioning. Only five reliable factors emerged based on 38 items. The
correlation of the total factor score with the K&1 total score (derived from 71
items) was .98. This is an important consideration because the author of the
screen cites the short administration time as an advantage of the instrument.
Prediction/outcome analyses were also carried out to explore the testis
accuracy in predicting special education status at the end of preschool. These
analyses indicated a relatively high false negative rate and a moderate true
positive rate. The data contraindicate the use of the K&1 screen as a single
instrument in early identification and intervention efforts.
3

Analysis of the Brigance K&1 Screen
An analysis of the Brigance K & 1 screen
with a disadvantaged pre-kindergarten sample
Efforts directed at the early identification of at-risk children are motvated primarily by
the assumption that early identification will lead to prevention interventions. However, a
growing body of literature suggests that the early identification of young at-risk children is a
highly complex process with major issues related to measurement, prediction, and the benefits
of early remediation (Satz & Fletcher, 1988). Although there is a critical need for accurate
early identification instruments, assessments of the reliability and validity of early screens are
lacking. For example, there is considerable evidence that a number of frequently used
screens lack documentation of suitable test-retest reliability (Lindsay a Wedell, 1982). In
addition, even instruments with high hit rates have high misciassiiication rates, frequently
yielding large numbers of false positive and false negative predictions (Mercer, Algozzine, &
Trifiletti, 1979). An important issue that is commonly ignored involves the construct validation
of these instruments. Construct validity data are sorely need to provide critical information on
the cognitive, perceptual, or language domains assessed by the instrument (Hinshaw,
Morrison, Carte, & Comsweet, 1986).
The present study reports on the kindergarten form of the Brigance K&1 screen, a brief
individually administered battery. This test is appropriate for preschool children entering
kindergarten and has been widely used in early childhood education settings. Its primary
purpose is to identify young children in need of more comprehensive evaluation. This criterion
referenced screen is also considered appropriate in planning instruction for at-risk youngsters.
(Brigance, 1992).
The Brigance K&1 screen, is a 12-subtest instrument that takes approximately 15
4

4Analysis of the Brigance K&1 Screen
minutes to administer. Its 12 subtests measure a broad range of skills which include
language, number, and motor skills, body knowludge, recognition, and ability to follow
directions. However, as Helfeldt (1984, p. 822) points out, half of the subtests (i.e. Personal
Data Responses, Rote Counting, Color Recognition, Picture Vocabulary) "rely heavily on
background experience and rote memory." A third of the tasks (i.e. Discrimination, Visual-
Motor Skills, Gross Motor Skills) appear to assess perceptual-motor skills and the remaining
tasks (i.e., Verbal Directions, Syntax and Fluency) assess dimensions of cognitive functioning.
In addition to the test form, the manual provides rating scales for the examiner,
teacher, and parents. The examinees checklist allows for recording behaviors that may be the
result of sensory, cognitive, motor, or emotional impairments. The teacher and parent forms
ask the rater to check the presence or absence of skills some of which are also assessed by
the individually administered battery. Additional categories included in the rating forms are
self-help skills, social skills, and emotional/self-reliancs.
The Brigance manual details scoring procedures for the instrument on which the
maximum score is 100. The total score for each child is derived by summing weighted raw
scores on each subtest. Weights range Worn 0.5 points to 5 points for the various subtests.
However, the rationale for assigning a particular weight to a subtest is not made clear by the
publisher. Although there are no norms provided, the manual suggests that a child with a
score of 65 or less be referred for further evaluation. At the same time it is recommended that
schools derive their own norms and criteria for referral. Again, the manual provides little
guidance on how to proceed with the establishment of local norms.
The Brigance manual reports that the screen has undergone testing in 14 states
around the country (Brigance, 1992). However, it is unclear how many students and teachers
5Analysis of the Brigance KW Screen
participated in the original sample. Furthermore the characteristics of both sites and
participants in the field tests are not described. Additionally, the reliability and validity
information found in a technical report on the K&1 screen (Brigance, 1991) can be considered
speculative at best. This is because the psychometric data reported for items on the K&1
screen are based on the performance of children on the Brigance Inventory of Early
Development (IED-R) a similar, yet longer form of the test. An introductory statement at the
begining of the technical report recognizes the problematic nature of this approach and states,
"in that the screen measures less of these items than the IED-R, the reader is cautioned that
the coefficients presented will vary dependent on the difference in the actual items addressed"
(Brigance, 1991, p. 2).
Given the psychometric status of the individually administered battery, the lack of data
for the parent and teacher checklists comes as no surprise. In fact, the overwhelming lack of
data on this test suggests that potential test users should proceed with caution when using
and interpreting of test results. Test reviewers have thus recommended that school districts,
adopting this test for screening purposes, undertake extensive validation procedures in order
to avoid labeling, misdiagnoses, and further unnecessary testing (Cohn, 1992; Helfeldt,
1984).
It can be concluded that aside from the brevity in administration and its apparent face
validity the Brigance K&1 screen has no established psychometric qualities. However, it
enjoys considerable popularity because of its attractiveness, seemingly multidimensional
nature, and the claim that it can be employed as a curriculum tool (Cohn, 1992). The
widespread use of this screen in the absence of validity and reliability information points to the
critical need for studies that address the psychometric qualities of the instrument.
6
6Analysis of the Brigance K&1 Screen
The present study provides reliability and initial validity information on the kindergarten
form of the Brigance K&1 screen with a population of pre-kindergarten children screened for
entrance in kindergarten in a midwestern school corporalion. Because the instrument is brief
and some subtests contain few items, special attention is given to the identification of reliable
domains of functioning underlying the test. In addition, the present study is designed to
explore the presence of developmental trends and to determine the screen's accuracy at
predicting special education status at the end of preschool.
Method
Sub ects
Total sample. Subjects for the study were 134 children attending a preschool program
in a midwestern school corporation. In February-March of preschool, children were screened
with the kindergarten form of the Brigance K&1 screen in preparation for entry into the
corporation's kindergarten program. The socioeconomic status of the families of these
children was low. Only 129 families had income Information available. The yearly income for
those families was as follows: (a) below $5,000: 57 (44%); (b) $5,000-$10,000: 34 (26%); (c)
$10,000-15,000: 20 (16%); and (d) above $15,000: 18 (14%). The age distribution of the
sample was from 52 to 69 months with a mean age of 61.6 (Ssl=3.37) months. There were
67 boys and 67 girls. The large majority of the children, 102 (76.1%), were Caucasian, 25
(18.7%) were African-American, and 5 (3.7%) were Other.
Four-vear-old subsample. Of the 134 children, 23 had ages below the recommended
age cutoff for the K&1 screen at the time of the first testing. The age range of that sample
was from 52 to 57 months with a mean age of 54.8 months. These children were tested with
7
7Analysis of the Brigance K841 Screen
the Brigrance Preschool Screen (Intended for 4-year-old children), in February. Three months
later they were retested with the Brigance K&1 screen, as they reached the recommended
age for that screen. The gender distribution for that sample was 12 girls and 11 boys. The
racial composition of this sample was as follows: 18 (78.3%) Caucasian, 4 (17.4%) African-
American, and 1 (4.3%) Other.
Instruments
Briaance K&1 screen (Brigance, 1992). The kindergarten form of this test consists of
12 subtests that measure: knowledge of personal data (5 items), color recognition (10 items),
picture vocabulary (10 items), visual discrimination (10 items), visual-motor skills (5 items),
gross-motor skills (10 items), rote counting from 1 to 10 (1 item), body parts identification (10
items), ability to follow verbal directions (2 items), numeral comprehension (5 items), ability to
print first name (1 item), syntax and fluency (2 items). As noted earlier, the entire battery
requires approximately 20 minutes to administer. It is intended for children between the ages
of 4 years 9 months and 6 years.
Each item is scored on a pass-fail basis. A raw score for each subtest is derived by
summing across all items answered correctly by the child. The total score on each subtest is
then calculated by multiplying the raw score with the weight assigned to that particular
subtest. For the purposes of this study the factor analysis was based on the correlation
matrix of unweighted raw scores for each subtest.
The Brigance screen was administered by personnel trained specifically in its
administration. The testing and scoring procedures described in the testis manual were
followed very carefully.
8

8Analysis of the Brigance K&1 Screen
The Br loance Preschool Screen (Brigance, 1985). This instrument was administered
to 23 children who had not yet reached the recommended 4 years 9 months of age at the time
of the Brigance K & 1 screen administration. As noted earlier, these children were first tested
with the Brigance Preschool screen and later with the Brigance K & 1 screen when they were
age-eligible (approximately 2 months later). The Brigance Preschool screen is very similar to,
yet shorter than its kindergarten,counterpart. It is intended for children between the ages of 3
years 9 months and 5 years. It is made up of 11 subtests that measure: knowledge of
personal data (4 items), knowledge of body parts (9 items), motor skills (3 items), object
identification (3 items), repetition of sentenCes (3 items), visual-motor skills (3 items); number
concepts (3 items), building a tower with blocks (5 items), matching colors (5 items), picture
vocabulary (6 items), and plurals (2 items). As with the K & 1 screen no information is
available on the characteristics of the participants of the field tests. There Is no validity or
reliability information reported for this instrument.
Brit:lance teacher's rating form: K & 1 screen. The teacher's rating form asks the
preschool teacher to rate each child moving on to kindergarten on nine areas. These areas
are intended to provide information on child's mastery of the following skills: personal data
information (5 items), begining academic skills (11 items), visual and fine motor skills (9
items), dominance/laterality (3 items), self-help skills (6 items), social skills (5 items),
emotional/self-reliance (6 items), speech (3 items), and physicalThealth status (2 items). The
teacher is asked to read each item and check one of three colums: "No" (skill has not been
mastered) , "Uncertain," and "Yes" (skill has been mastered). The basis on which items were
grouped together under the nine categories is not made clear by the publisher.
Psychometric data on the teacher's rating form are not available.
9

9
Analysis of the Brigance K&1 Screen
Kaufman Assessment Batten, for Children (K-AS C). The K-ABC (Kaufman &
Kaufman, 1983a) is a recently developed alternative to the traditional intelligence test. This
battery was used because it is appropriate for children in this age range and because of its
emphasis on processing areas (simultaneous and sequential) feit to be important to the
development of reading skills. The authors of the scale define the two processing scales as
follows: "Sequential processing places a premium on the serial or temporal order of stimuli
when solving problems; in contrast, simultaneous processing demands a gestalt-like,
frequently spatial integration of stimuli to solve problems with maximum efficiency (Kaufman &
Kaufman, 1983b, p. 2). The K-ABC is a carefully standardized measure that yields a Mental
Processing Composite (MPC) score. The short form of the test, recommended for research
and screening purposes, was used in this investigation (Applegate & Kaufman, 1989;
Kaufman & Applegate, 1988).
In addition to the cognitive component subscales, the K-ABC includes separate
achievement subscales. Of those we used the Reading/Decoding, Riddles, and Arithmetic
subtests. The Reading/Decoding subtest assesses the child's ability to identify letters and
read words. . In Riddles, the child is provided with a list of characteristics descriptive of an
object and is asked to infer the name of that object The Arithmetic subtest asseses the
child's knowldege and understanding of number concepts.
Both cognitive and achievement scales provide standard scores with M=100 and
Sd=15.
Summary of Assessment Procedures
The Brigance K&1 screen was individually administered to children in the months of
February-March. A smaller number of children under 4 years 9 months of age were tested
0

10
Analysis of the Brigance K&1 Screen
with the Preschool form of the test at that the. In March-April all children were tested with the
K-ABC cognitive ability battery. In April a sample of 37 children were randomly selected from
the original sample and retested with the Brigance KM screen to establish test-retest
reliability data. Information on inter-rater reliability was obtained at that time by two raters who
evaluated the child's performance on all subtests. Interrater reliability information was
available on a total of 42 children (37 randomly selected children and 5 children who entered
the program late). At about the same time the subsample of the 4-year-old children were
retested with the K&1 screen. In the month of May all children were individually tested with the
K-ABC achievement battery. Teachers completed the Brigance teacher's checklist in March.
Teachers were not aware of the child's scores on any of the tests administered. Information
about children receiving special education services was obtained from records kept by the
schools' director of special services.
Results
Due to the lack of a clear rationale for the use of the item weighting procedure
outlined by the test manual, only unweighted Item scores were used in the analyses reported
here. The correlation between weighted and unweighted scores was r = .97. This high
correlation between the two sets of scores was a further indication that the use of unweighted
scores was an acceptable approach. Additionally, a multivariate analysis of variance was
used to ckeck the K&1 screen for possible gender effects. No significant gender effects were
found. Therefore, all subjects were treated as one group in subsequent analyses.
ReliabilIty
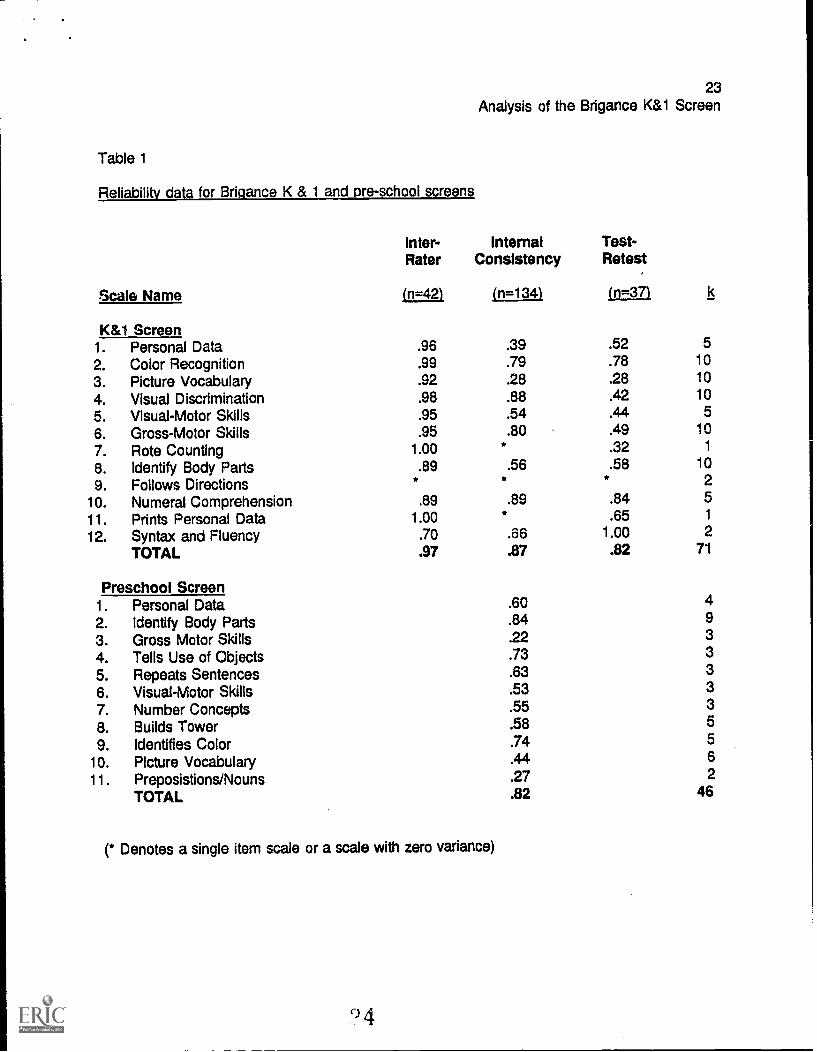
The first reliability question addressed was that of inter-rater reliability. Results of
these analyses are listed in Table 1. The generally strong inter-rater reliabilities obtained on

11
Analysis of the Brigance K&1 Screen
the scoring of the Brigance K&1 Screen subtests indicate a high level of agreement between
raters, and suggest that the scoring criteria for the subtests are adequately explained by the
manual. ....11Insert Table 1 About Here
Ovil..111.11,
The subtests were then examined for internal consistency. Coefficient Alphas were
computed for each subtest and results are listed in Table 1. The internal consistency
reliability coefficients ranged from a low of .28 for the Picture Vocabulary subtest to a high of
.89 for the Numeral Comprehension subtest. Coefficients for both the Personal Data and
Picture Vocabulary subtests were quite low.
Finally, test-retest reliabilities were computed for each subtest and for the total K&1
score. Test-retest figures are especially Important given the stated aim of the authors that this
test can be used as a screening device to detect devOopmental problems that require further
professional attention. Low test-retest reliabilities would contraindicate the use of test results
for screening purposes. Test-retest reliabilities are presented in Table 1. While the overall
test-retest reliability is moderate, there is considerable variation within subtests. The Picture
Vocabulary subtest, for example, does not demonstrate sufficient stability over time to be used
as a screening device. The same is true for the Visual Deschmination and Rote Counting
subtests. These results caution the user against relying too h9avily on any one subtest score
when considering whether or not further referral is appropriate.
Underivina Dimensions
The Brigance K&1 Screen is divided into twelve subtests, and it is implied by its author
1 2

12Analysis of the Brigance K&1 Screen
that each subtest measures a unique skill or ability. However, no evidence is presented in
support of the underlying dimensionality of the overall screen. To address this issue, results
from the current administration of th K&1 Screen were subjected to a factor analysis. Due to
the low suject-to-item ratio (approximately 2 to 1) these results should be considered
speculative. However, these results do provide potentially valuable insights into the structure
underlying the K&1 Screen.
The K&1 Screen was analyzed using a principal components analysis with a Varimax
rotation. An examination of the resulting scree plot suggested a five factor solution which
accounted for 36% of the total variance. The factor pattern matrix, with item numbers,
eigenvalues, and internal consistency information is given in Table 2. Items loading less than
.35 on a primary factor or showing multiple cross-loadings greater than .24 were excluded
from the final factor pattern matrix and were not used in calculating factor scores.
Insert Table 2 About Here
A factor with all ten items from the Visual Discrimination subtest was clearly
established. This factor reflects an ability to pick out a letter or shape that does not match
other letters or shapes in a given set. A second factor, including all ten items from the Color
Recognition subtest was also well supported. It measures the child's ability to correctly
identify the color of a presented object The third factor encompassed a logical combination
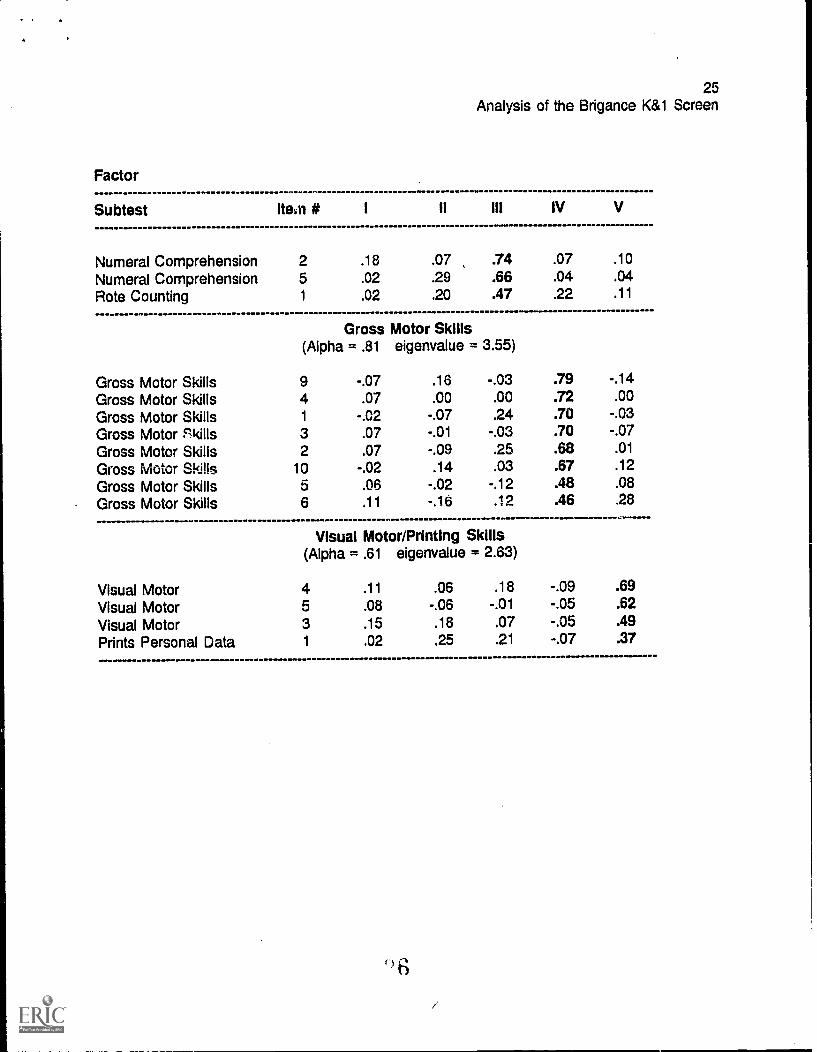
of items from the Numeral Comprhension and Rote Counting subtests. This factor reflects an
ability to understand basic number concepts. The fourth factor factor included eight of the
ten items from the Gross Motor Skills subtest. Collectively these items reflect an ability to
3

13
Analysis of the Brigance K&1 Screen
correctly imitate the body movements of an adult model. Examples of specific movements
imitated include standing on one foot, hopping on one foot, and walking a straight line. The
last factor was less clearly established. This factor was composed of the three most difficult
items from the Visual-Motor subtest and the single item from the Prints Personal Data subtest.
The three visual motor items require the child to copy an example of either a cross, square, or
triangle, and the personal data item asks the child to print their own name. Both printing skills
and letter knowledge skills are required for success.
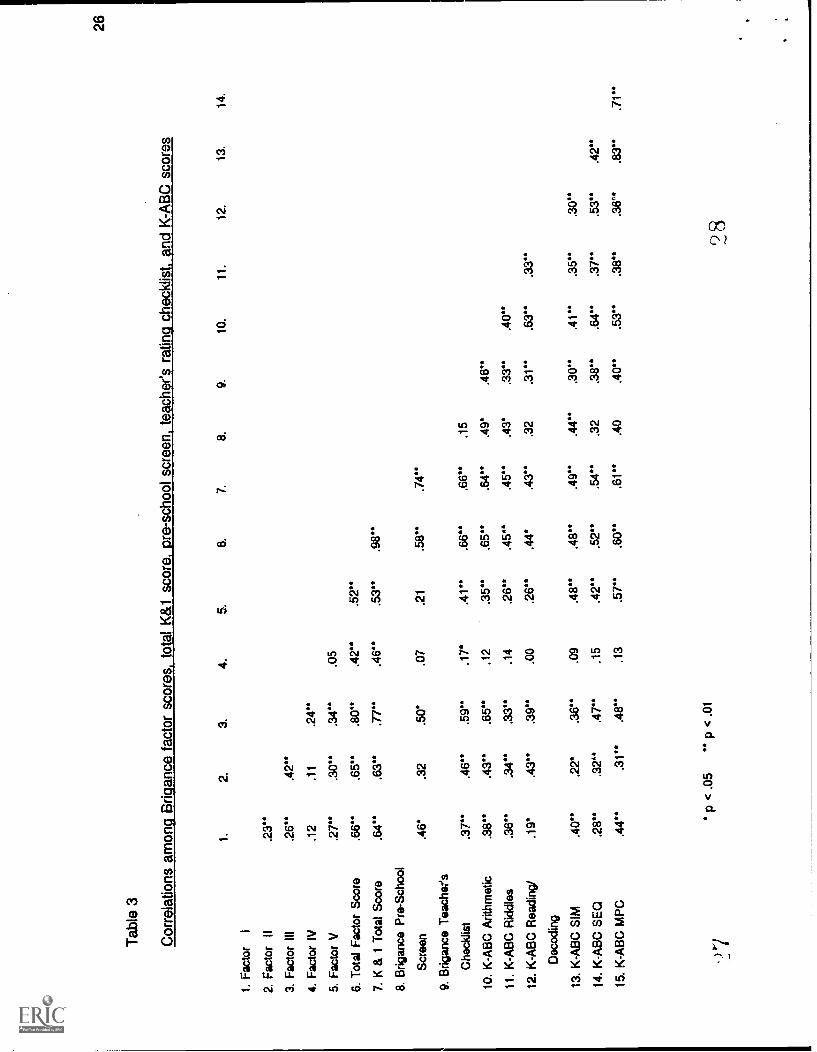
Intercorrelations among the above factors are presented in Table 3. Although a
number of the correlations are statistically significant, the generally low correlations indicate a
fair degree of independence between factors. This is especially true for Factor IV/Gross
Motor Skills which correlates significantly with just one other factor.
Insert Table 3 About Here
Based on the above results, a Total Factor Score was computed for each subject. The
correlation between this factor score and the unweighted total score was r=.98. It would
appear that the the Total Factor Score, based on 38 items, was as accurate at rank-ordering
subjects as the unweighted Total Score computed from all 71 items.
Valldltv
The technical manual for the K&1 Screen discusses issues related to content validity.
According to the manual, each item of the K&1 Screen was judged by a panel of experts on
the degree to which it matched a particular written objective, and on its age appropriateness.
The authors report acceptable results for these analyses.
1 4

14Analysis of the Brigance KW Screen
Of more relevance to the present study are issues of concurrent and construct validity.
The Brigance K&1 Screen, Preschool Screen, and Teacher Checklist, are promoted as
instruments which can help school personnel make decisions about achild's readiness for
normal classroom placement. Given this similarity of purpose across tests, a high degree of
correlation would be expected between the total scores on each test. An examination of the
correlation matrix in Table 3 does reveal a significantly high degree ci correlation between
scores on the K&1 Screen and scores on both the Preschool Screen and Teachers Checklist.
These high correlations are acceptable evidence of concurrent validity. The total score from
the K&1 Screen was also compared with the MPC Score from the K-ABC. An examination of
the correlation matrix in Table 3 supports a positive relationship between scores on these
tests.
The construct validiy of the K&1 screen was assessed by correlating the K&1 factor
scores with subtest scores from the following K-ABC achievement scales: Arithmetic, Reading,
and Riddles. Evidence for construct validity would be obtained if a particular factor score from
the KW Screen correlated highly with a subtest from the K-ABC designed to measure the
same ability. For example, it would be expected that the Number Concepts factor from the
K&1 Screen would correlate highly with the Arithmatic Subtest from the K-ABC. It would also
be expected that the Gross Motor Skills factor, which primarily examines physical skill
development, would have little relation to any subtests which primarily measured cognitive
ability and preacademic achievement skills. Results of these comparisonss are listed in Table
3.
In keeping with the above predictions, the Number Concepts factor from the K&1 did
have a high postive correlation with the Arithmatic subtest ':om the K-ABC. Contrary to
I 5
15Analysis of the Brigance K&1 Screen
expectation, factor V (Visual Motor/Printing Skills) had a low (yet statistically significant)
correlation with the K-ABC Reading/Decoding subtest. In addition, the Visual Discrimination,
Color Recognition, and Visual Motor factors from the K&1 Screen also had moderare,
significant correlations with the Arithmatic subtest from the K-ABC. In fact, there was a
general, significant, and postive correlation between four of the five KW factors and three of
the K-ABC subtests. This suggests that Factors I, II, Ill, and V, of the K&1 screen are
measuring some common ability or skill. The only factor not showing this pattern was the
Gross Motor Skills factor. As expected, it did not correlate significantly with any of the more
cognitively oriented K-ABC measures.
Analysts of developmental trends
Scores on the K&1 screen were analyzed for age-related trends. Such trends might be
expected given the stated developmental nature of the screen. For this analysis, children
were divided into three groups based on age (youngest third, middle third, oldest third). Mean
ages in months were, 57.58 (5d=1.58), 61.41 (acil=1.11), and 65.23 (SA=1.12) for the
youngest, middle and oldest groups respectively.
Trends for these three groups of children were examined through two sets of
multivariate analysis of variance using (a) uweighted subtest scores; and (b) factor scores as
dependent measures. Surprisingly, neither MANOVA revealed any significant age effects.
Prediction of special education status
During the school year 34 children (25%) were referred for special education services.
Of those, 27 (79.4%) were receiving speech therapy, 5 (14.7%) were being evaluated for
cognitive/developmental delays, 1 was physically disabled, and 1 was neurologically/
cognitively impaired. It should be noted that referrals were not made on the basis of the
6
16Analysis of the Brigance K&1 Screen
child's performance on the K&1 screen because the Brigance assessment data were not
available to teachers or parents until the end of the school year. For this reason it was
possible to evaluate the ability of the screen to identify young children in need of special
education services. A prediction/outcome matrix paradigm (Mercer, Algozzine, & Trifiletti,
1988) was used to identify hit rates, accurate, and inaccurate predictions of the K&1 screen
with special education status being the outcome variable.
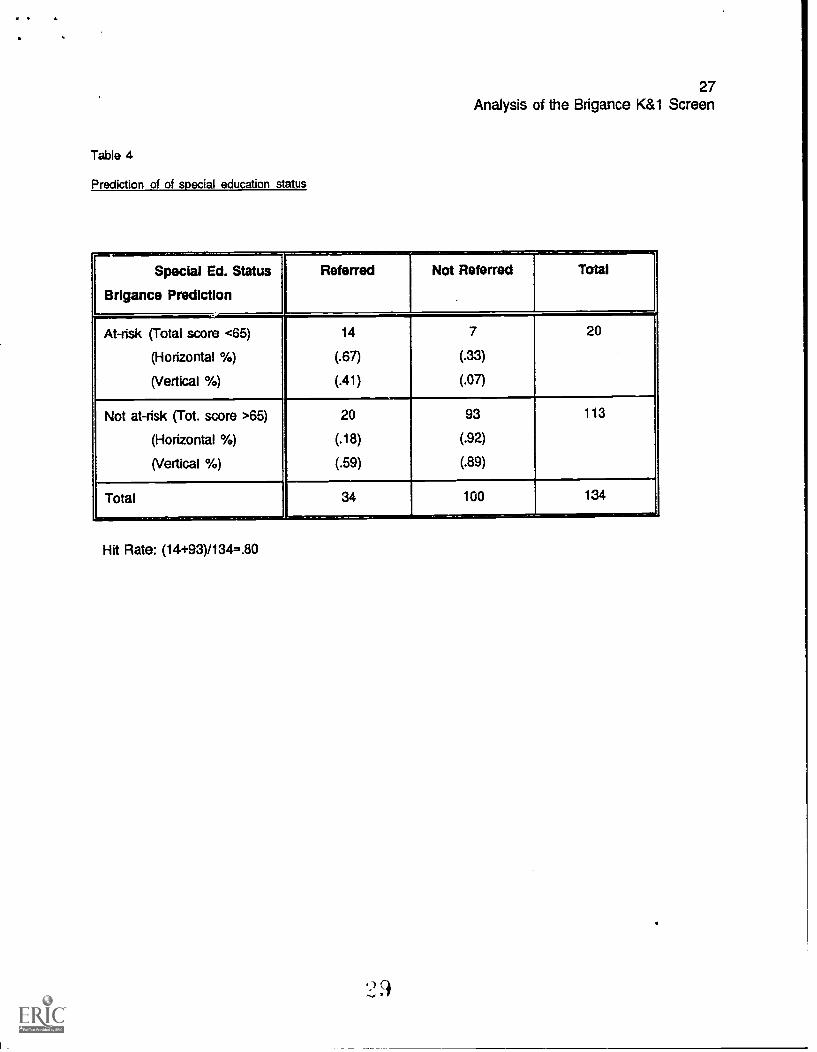
An example of this analysis is presented on Table 4. In this example a cutoff
Insert Table 4 about here
score of 65 on the K&1 screen is used as the predictor. This is based on the Brigance
weighted scores system and was used here because it is recommended as a criterion for
futher assessement in the Brigance manual. This classification yielded a hit rate of 80%.
The true positive rate (children predicted at-risk and receiving special services) was 67%,
whereas the true negative rate (children predicted not-at-risk and not receiving special
services) was 92%. False positives (children predicted at-risk but not receiving special
education) were 33% and false negatives (children predicted not-at-risk but receiving special
education) were 18%. With respect to false negatives Mercer et. al. (1988) caution that it is
important to also examine vertical proportions. This analysis provides an estimate of the
proportion of children missed when the entire sample of children receiving special services is
considered. We thus find that of the sample of special education children, the K&1 screen
misses 59%. These are children requring intervention but who would not have been referred
had Brigance scores been used as the sole indicator of at-risk status.
1 7

17Analysis of the Brigance K&1 Screen
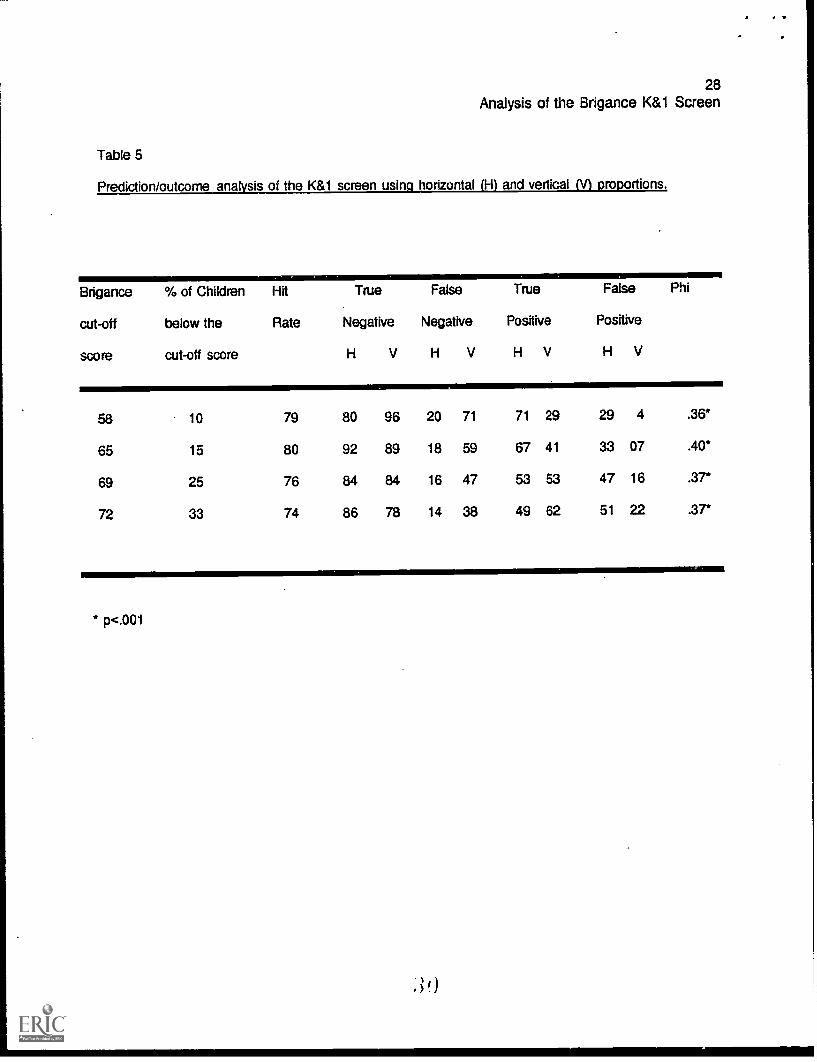
It is noteworthy that a Brigance score of 65 only identified 15% of the sample as
needing further evaluation. However, in our sample 25% were receiving special services. We
therefore carried out three additional prediction/outcome analyses to examine the accuracy of
the screen when more conservative or more liberal cutoff scores are being used. These
results are summarized in Table 5. It appears that a cut-off score of 65 yields the best hit
Insert Table 5 about here
rate. False negatives however, are quite high when this criterion is used. With the more
liberal cutoff scores of 69 and 72 there is a decrease in false negatives and an increase in
false positives. This would be expected given the moderate hit rate of the test. This is further
exemplified by an examination of the phi coefficients. As shown in Table 5 phi coefficients
ranged from .36 to .40 indicating a low-moderate association between the screening criteria
and special education status.
Discussion
The analyses peformed in this study provided useful insights into the nature of the
Brigance K&1 screen with a sample of preschool children. The lack of a cleax rationale for the
item weighting procedure used in scoring the test coupled with the high correlation between
weighted and unweighted total scores contraindicated item weighting as a useful element of
the test. This prOcedure increases the amount of time required for scoring the test, increases
the probability of scoring errors, and is psychometrically unjustifiable. In addition, the high
correlation of the K&1 with the Preschool screen suggests that the test is appropriate for
children below 58 months of age who have been exposed to 6 months of preschool activities
18

18Analysis of the Brigance K&1 Screen
and are moving on to kindergarten.
Reliability estimations with the present sample, indicated high inter-rater agreement,
generally moderate internal consistency, and lower test-retest reflabilities than those fourd in
the technical report. Two subtests, Personal Data and Picture Vocabulary, had very low
alpha coefficients. This implies that these subtests are measuring a heterogeneous set of
skills and that the addition of individual item scores to construct a subtest total, as outlined by
the scoring manual, may not be valid. An inspection of the content of these two subtests
suggests that a child's score may reflect more on the child's recent experiences than on any
diagnostically relevant abilities.
In the present study five out of the 12 subtests had low or moderately low test-retest
reliabilities. These data are much lower than those found in the technical report (Brigance,
1991). Although the source of the observed discrepancies is not entirely clear, it should be
noted that the time interval between test and retest is not stated in the technical manual
(Brigance, 1991). It must also be stressed that the reliabilities 'T.:ported in the technical
manual were computed from similar items used in a different, much lengthier inventory of
early development. They were not derived from from a direct administration of the K&1
screen. In contrast, all reliability estimations in the present study were based on an actual
administration of the K&1 Screen. Thus differences in the test-retest time interval coupled
with the fact that the technical report data do not accurately reflect the characteristics of the
K&1 screen, may well account for these discrepancies. Potential test users are thus
cautioned against relying on the technical report data to evalauate the psychometric metrits of
the K&1 screen.
With respect to the dimensional nature of the test, there was no support for 12 distinct
19
19Analysis of the Brigance K&1 Screen
components of functioning as the author of the test suggests. Rather, initial evidence with our
sample indicated the presense of only five reliable factors. The total factor score, based on
38 items that made up the five factors, had a correlation of . 98 with the total score derived
from the entire 71-item K&1 screen. This is an important consideration, because the author of
the K&1 screen cites the short administration time as an advantage of the instrument.
However, the present factor analytic findings indicate that the time required to administer the
screen can be further reduced, without any loss of normative information, if Just those items
which constitute the five factors are administered.
The small number of children in our sample and the absence of similar studies in the
literature cautions that this information should be interpreted with caution. Cross-validation of
the factorial nature of the test is needed to substantiate the present findings. At the same
time, it is clear that the results of our factor analysis mirror those obtained in analyses of other
early screens (i.e., the Metropolitan Rediness Test, SEARCH) that did not confirm the
presence of multiple, narrowly defined readiness areas (e. g., Hinshaw et al., 1986; Watkins &
Wiebe, 1984).
The concurrent validation procedures using the K-ABC cogntive and achievement
subscales suggest that the K&1 screen is a moderate predictor of cognitive ability and
preacademic achievement. The prediction/outcome analysis is also supportive of this
conclusion. The K&1 manual suggests that a score of 65 should be used as as a flag for
further assessment. Use of this score with the present sample would result in 59% of special
needs children being missed. This high error rate is probably not acceptable to most school
systems and would not support the use of this test as a single screen. Normative data must
be made available to assist test users in selecting appropriate cutoff scores for referral or
20Analysis of the Brigance Ll Screen
further testing.
The K&1 screen is not a diagnositc instrument and should only be used to indicate
that a child should probably be evaluated with more elaborate tests. This procedure would
eliminate false positives (not-at-risk children incorrectly screened as at-risk). Thus the false
positive error rate would be less of a concern in this case. If the false negative rate remains
high the screen is less helpful in a program geared toward early prevention. The present
findings indicate that lower false positive rates are obtained when a very liberal cut-off score is
used, resulting in 33% of the children screened as at-risk. When this criterion is adopted,
because the hit rate is less than optimal, higher false positive rates are obtained. This means
that follow-up evaluations, directed to identify the truly positive children who need intervention,
can be costly and time consuming. Schools might opt for this alternative if it were
accompanied by low false negative rates. However, as our data suggest, with even more
liberal cutoffs the test still yields a false negative rate of 38%.
These initial findings do not suggest that the K&1 screen is a more effective instrument
than other available screens (for an analysis of other screens see Mercer et . al., 1988) with
more clearly established psychometric characteristics. With early identification being a critical
issue, further cross-validation and longitudinal research is needed to inform practitioners of the
accuracy and potential uses of this screen.
2 I
21
Analysis of the Brigance K&1 Screen
References
Applegate, B., & Kaufman, A. S. (1989). Short form estimation of the K-ABC sequential and
simultaneous processing for research an( screening. Journal of Clinical Child
Psychology, 18(4), 305-313.
Brigance, A. (1992). Brigance K & 1 Screen (3rd ed.) North Billerica, MA: Curriculum
Associates.
Brigance, A. (1991). Brigance K&1 Screen-Revised: Technical report. North Billerica, MA:
Curriculum Associates.
Brigance, A . (1985). Brigance Preschool Screen. North Billerica, MA: Curriculum Associates.
Cohn, M. E. (1992). Screening measures. In E. V. Nutall, I. Romero, & J. Kalesnik (Eds.).
Assessing and screening preschoolers (pp. 83-98). Needharn Heights, MA; Allyn &
Bacon.
Helfeldt, J. P. (1984). The Brigance K &1 screen for kindergarten and first grade. The
Reading Teacher, 37(9), 820-824.
Hinshaw, S. P., Morrison, D. C., Carte, E. T., Comsweet, C. (1986). Factor composition of the
SEARCH scanning instrument in kindergarten. Journal of Psychoeducational
Assessment, 4, 95-101.
Kaufman, A. S., & Applegate, B. (1988). Short forms of the K-ABC Mental Processing and
achievement scales at ages 4 to 121/2 years for clinical and screening purposes.
Journal of Clinical Child PsyciLolggy, 17(4), 359-369.
Kaufman, A. S., & Kaufman, N. L. (1983a). Kaufman Assessment Battery for Children. Circle
Pines, MN: American Guidance Service.
Kaufman, A. S., & Kaufman, N. L (1983b). Kaufman Assessment Battery for Children:
22Analysis of the Brigance K&1 Screen
Interpretive manual. Circle Pines, MN: American Guidance Service.
Undsay, G. A., & Wedell, K. (1982). The early identification of educationally "at-risk" children
revisited. Journal of LearnincOlsa_tatim, 15, 212-217.
Mercer, C. D., Algozzine, B., & Trifiletti, J. (1979). Early identificationAn analysis of
research. Learning Disability Quarterly, 2, 12-24.
Satz, P., & Fletcher, J. M. (1988). Early identification of learning disabled children: An old
problem revisited. Journal of Consulting and Clinical Psvchologv, 6, 824-829.
Watkins, E. 0., & Wiebe, M. J. (1984). Factor analysis of the Metropolitan Readiness Test on
first-grade children. Psychology in the Schools, 21, 429-432.
2 3
23Analysis of the Brigance K&1 Screen
Table 1
Reliabilitv data for Brioance K & 1 and pre-school screens
Scale Name
Inter-Rater
(n=42)
InternalConsistency
(n=134)
Test-Retest
In=37)
K&1 Screen1. Personal Data .96 .39 .52 5
2. Color Recognition .99 .79 .78 10
3. Picture Vocabulary .92 .28 .28 10
4. Visual Discrimination .98 .88 .42 10
5. Visual-Motor Skills .95 .54 .44 5
6. Gross-Motor Skills .95 .80 .49 10
7. Rote Counting 1.00 * .32 1
8. Identify Body Parts .89 .56 .58 10
9. Follows Directions * * * 2
10. Numeral Comprehension .89 .89 .84 5
11. Prints Personal Data 1.00 * .65 1
12. Syntax and Fluency .70 .66 1.00 2
TOTAL 27 .87 .82 71
Preschool Screen1. Personal Data .60 4
2. Identify Body Parts .84 9
3. Gross Motor Skills .22 3
4. Tells Use of Objects .73 3
5. Repeats Sentences .63 3
6. Visual-Motor Skills .53 3
7. Number Concepts .55 3
8. Builds Tower .58 5
9. Identifies Color .74 5
10. Picture Vocabulary .44 6
11. Preposistions/Nouns .27 2
TOTAL .82 46
(* Denotes a single item scale or a scale with zero variance)
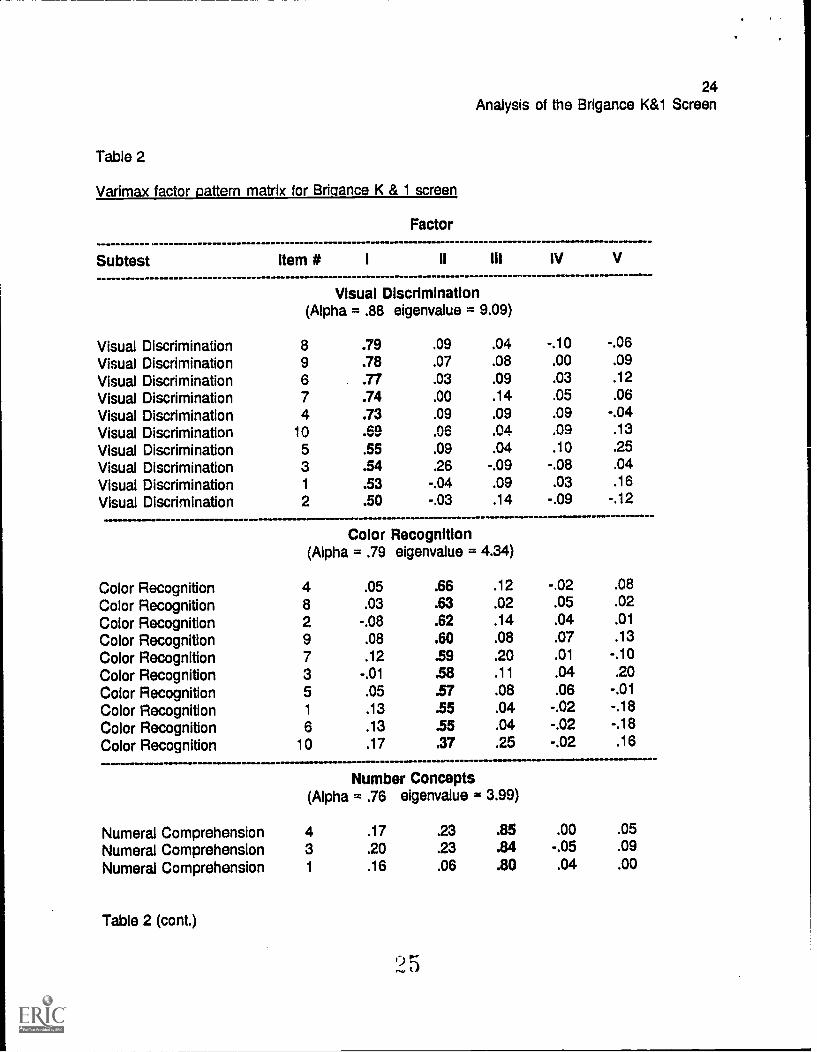
Table 2
Varimax factor pattern matrix for Brioance K & 1 screen
Factor
Subtest
24Analysis of the Brigance K&1 Screen
item # I II III IV V
Visual Discrimination(Alpha = .88 eigenvalue = 9.09)
Visual Discrimination 8 .79 .09 .04 -.10 -.06
Visual Discrimination 9 .78 .07 .08 .00 .09
Visual Discrimination 6 .7 7 .03 .09 .03 .12
Visual Discrimination 7 .74 .00 .14 .05 .06
Visual Discrimination 4 .73 .09 .09 .09 -.04
Visual Discrimination 10 co....... .06 .04 .09 .13
Visual Discrimination 5 .55 .09 .04 .10 .25
Visual Discrimination 3 .54 26 -.09 -.08 .04
Visual Discrimination 1 .53 -.04 .09 .03 .16
Visual Discrimination 2 .50 -.03 .14 -.09 -.12
Color Recognition(Alpha = .79 eigenvalue = 4.34)
IIMO..
Color Recognition 4 .05 .66 .12 -.02 .08
Color Recognition 8 .03 .63 .02 .05 .02
Color Recognition 2 -.08 .62 .14 .04 .01
Color Recognition 9 .08 .60 .08 .07 .13
Color Recognition 7 .12 .59 .20 .01 -.10
Color Recognition 3 -.01 .58 .11 .04 .20
Color Recognition 5 .05 .57 .08 .06 -.01
Color Recognition 1 .13 .55 .04 -.02 -.18
Color Recognition 6 .13 .55 .04 -.02 -.18
Color Recognition 10 .17 .37 .25 -.02 .16NVIM.MNumber Concepts
(Alpha = .76 elgenvalue = 3.99)
Numeral Comprehension 4 .17 .23 .85 .00 .05
Numeral Comprehension 3 .20 .23 .84 -.05 .09
Numeral Comprehension 1 .16 .06 .80 .04 .00
Table 2 (cont.)
25
Factor
Subtest
25Analysis of the Brigance K&1 Screen
Item # I ii lii IV V
Numeral ComprehensionNumeral ComprehensionRote Counting
2 .185 .021 .02
.07
.29
.20
Gross Motor SkillsGross Motor SkillsGross Motor SkillsGross Motor SkillsGross Motor SkillsGross Motor Ski linGross Motor SkillsGross Motor Skills
Visual MotorVisual MotorVisual MotorPrints Personal Data
.74 .07 .10
.66 .04 .04
.47 .22 .11
Gross Motor Skills(Alpha = .81 eigenvalue = 3.55)
9 -.07 .16 -.034 .07 .00 .001 -.02 -.07 .243 .07 -.01 -.032 .07 -.09 .25
10 -.02 .14 .03
5 .06 -.02 -.126 .11 -.16 .12
.79
.72.70.70.68.67.48.46
-.14.00
-.03-.07.01.12.08.28..... .
Visual Motor/Printing Skills(Alpha = .61 eigenvalue = 2.63)
4531
.11
.08
.15
.02
0 6
.06 .18 -.09 .69-.06 -.01 -.05 .62.18 .07 -.05 .49.25 .21 -.07 .37
Tab
le 3
Cor
rela
tions
am
ong
Brig
ance
fact
or s
core
s, to
tal K
M s
core
, pre
-sch
ool s
cree
n, te
ache
r's r
atin
g ch
eckl
ist,
and
K-A
BC
sco
res
1. F
acto
rI
2. F
acto
rII
3. F
acto
r IH
4. F
acto
; IV
5. F
acto
r V
6. T
otal
Fac
tor
Sco
re
7. K
& 1
Tot
al S
core
8. B
rigan
ce P
re-S
choo
l
Scr
een
9. B
rigan
ce T
each
es
Che
cklis
t
10. K
-AB
C A
rithm
etic
11. K
-AB
C R
iddl
es
12. K
-AB
C R
eadi
ng./
Dec
odin
g
13. K
-AB
C S
IM
14. K
-AB
C S
EQ
15. K
-AB
C M
PC
1.2.
3.4.
5.6.
7.8.
9.10
.11
.
.23"
.26"
42"
.12
.11
.24"
.27"
.30"
.34"
.05
.66"
.65"
.80"
.42"
.52"
.64"
.63"
.77"
.46"
.53"
.98"
.46'
.32
.50'
.07
.21
.58"
.74"
.37"
46"
.59"
.17'
41"
.66"
.66"
.15
.38"
43"
.65"
.12
35"
.65"
.64"
49'
46"
.36"
.34"
33"
.14
.26"
45"
45"
43'
.33"
AO
"
.19'
.43"
.39"
.00
.26"
.44'
.32
.31"
.33"
.40"
22'
36"
.09
48"
48"
.49"
.44"
30"
41"
.35"
.28"
.32"
47"
.15
42"
.52"
.54"
.32
.38"
.64
.37"
.31"
.48"
.13
.57"
.60"
.61"
.40
.40"
p <
.05
" p
< .0
1812
.13
.14
.
.301
'
.53.
.36"
.42"
.83"
.71"
26
27Analysis of the Brigance K&1 Screen
Table 4
Prediction of of special education status
Special Ed. Status
Brigance Prediction
Referred Not Referred
.
Total
At-risk (Total score <65) 14 7 20
(Horizontal %) (.67) (.33)
(Vertical %) (.41) (.07)
Not at-risk (Tot. score >65) 20 93 113
(Horizontal %) (.18) (.92)
(Vertical %) (.59) (.89)
Total 34 100 134
Hit Rate: (14+93)/134...80
'2 9
28Analysis of the Brigance KW Screen
Table 5
Prediction/outcome analysis of the K&1 screen using horizontal (H) and vertical (V) proportions.
Brigance
cut-off
score
% of Children
below the
cut-off score
Hit True False True False Phi
Rate Negative Negative Positive Positive
H V H V li V H V
58 10 79 80 96 20 71 71 29 29 4 .36*
65 15 80 92 89 18 59 67 41 33 07 .40*
69 25 76 84 84 16 47 53 53 47 16 .37*
72 33 74 86 78 14 38 49 62 51 22 .37*
p<.001