Embed Size (px)
Citation preview
DOCUMENT RESUME
ED 388 441 PS 023 767
AUTHOR Zill, Nicholas; And OthersTITLE Approaching Kindergarten: A Look at Preschoolers in
the United States. National Household EducationSurvey. Statistical Analysis Report.
INSTITUTION Westat, Inc., Rockville, MD.SPONS AGENCY National Center for Education Statistics (ED),
Washington, DC.REPORT NO ISBN-0-16-048368-9; NCES-95-280PUB DATE Oct 95NOTE 82p.PUB TYPE Statistical Data (110) Reports
Research/Technical (143)
EDRS PRICE MFOI/PC04 Plus Postage.DESCRIPTORS Age Differences; At Risk Persons; *Behavior Problems;
Child Development; Child Health; Early ChildhoodEducation; *Literacy; National Surveys; Numeracy;*Preschool Children; *Psychomotor Skills; RacialDifferences; *School Readiness; Sex Differences;*Socioeconomic Influences
IDENTIFIERS *Emergent Literacy; National Household EducationSurvey
ABSTRACTThis report examines the prevalence of selected
accomplishments and difficulties in a national sample of 4,423children from 3 to 5 years of age who had not yet startedkindergarten. The data were collected as part of the 1993 NationalHousehold Education Survey (NHES). The report focused on 2,000children who had turned 4 by the end of 1992 and were about 6 monthsaway from starting kindergarten. It found that more than 9 out of 10of these 4-year-olds could button their own clothes and hold a pencilproperly, and that more than 8 out of 10 could identify the primarycolors by name. Only about 6 in 10 could count to 20 or recognizemost letters of the alphabet, however. The report also found thatmore girls than boys demonstrated each of the literacy and smallmotor skills covered in the survey, and that Hispanic presch.)lerswere reported to show fewer signs of emerging literacy and to be in
less good general health than white and black children. A discussionof survey methodology and data reliability is included. Twoappendices provide information on interview items and regressionanalysis of sociodemographic risks. (Contains 75 references.)(MDM)
***********************************************************************
Reproductions supplied by EDRS are the best that can be madefrom the original document.
******************************AA**************************************
U S DEPARTMENT OP EDUCATION'Ace 01 Edt.cal.ona. Hosearen ana Immeinment
EDUCATIONAL RESOURCES INFORMATION
CENTER (ERIC)Kills document nas been reproduced aserbwod trorn tne person or organizationmiqinatino it
0 Minor cnanqes nave been made toimprove reproduction quality
- - - .
Points ot view or opinions staled in thisdocument oo not necessarily representotticial OERI position or policy
U.S. Department of EducationOffice of Educational Research and Improyement NCES 95,.280
BEST COPY AVAILABLE
NATIONAL CENTER FOR EDUCATION STATISTICS
Statistical Analysis Report October 1995
National Household Education Survey
Approaching Kindergarten:A Look at Preschoolers inthe United States
NationalHouseholdEducationSurvey
Nicholas Zill and Mary Collins, Westat, Inc.
Jerry West and Elvie Germino Hausken,National Center for Education Statistics
U.S. Department of EducationOffice of Educational Research and Improvement NCES 95-280
U.S. Department of EducationRichard W. RileySecretary
Office of Educational Research and ImprovementSharon P. RobinsonAssistant Secretary
National Center for Education StatisticsJeanne E. GriffithActing Commissioner
National Center for Education Statistics
The purpose of the Center is to collect and report "statisticsand information showing the condition and progress ofeducation in the United States and other nations in orderto promote and accelerate the improvement of Americaneducation."Section 402(b) of the National EducationStatistics Act of 1994 (20 U.S.C. 9001).
October 1995
b
Acknowledgments
The authors wish to thank NCES staff members for their comments and suggestions on earlier
drafts of this report, including Jeffrey Owings, Marilyn McMillen, Michael Cohen, Ralph Lee, and Mary
Rollefson. The report was also reviewed by Sue Bredekamp of the National Association for theEducation of Young Children, Sharon Lynn Kagan of the Bush Center in Child Development and Social
Policy of Yale University, and Naomi Karp of the National Institute on Early Childhood Development
and Education of the Office of Educational Research and Improvement of the U.S. Department ofEducation. The draft manuscript was cdrefully edited by Kathryn Perkinson of the. Office of Educational
Research and Improvement of the U.S. Department of Education. The comments and suggestions of each
of these reviewers are greatly appreciated, and the final report reflects many of their suggestions.
The art for the cover of this report was drawn by Elizabeth I. Gorman, age 5.

Executive Summary
Kindergarten is now a nearly universal experience for children in the United States: 98 percent
of children attend kindergarten prior to entering first grade. However, the population of children that
comes to kindergarten is increasingly diverse. Growing numbers of children in the United States come
from a variety of racial, ethnic, and cultural backgrounds, family types, parent-education levels, income
strata, and language backgrounds. Young children also differ in the types of preschool experiences they
bring to kindergarten. The majority of children come to kindergarten with some experience in center-
based programs such as day care centers or preschools. The percentage of children with such experience
varies, however, across groups with different backgrounds and characteristics.
Schools in the United States are expected to respond to this diversity in children's backgrounds
and educational needs, furnish all children with appropriate activities and instruction, and get each child
off to a good start in his or her schooling. An understanding of the range of accomplishments and
difficulties that children bring with them when they arrive at kindergarten can aid in understanding the
demands being placed on schools and the needs of the entering children. Indeed, some of the difficulties
discussed here are only experienced as difficulties when children enter school. Information about the
developmental characteristics of preschoolers is also relevant for assessing where the United States stands
with respect to one of the eight National Education Goals: "By the year 2000, all children in America
will start school ready to learn."
This report examines the prevalence of selected accomplishments and .41fficulties in a national
sample of 4,423 children from 3 to 5 years of age who had not yet started kindergarten. The
accomplishments and difficulties examined in this report represent characteristics related to dimensions
or domains of development that are important to a child's early learning: physical well-being and motor
development, social and emotional development, language usage, and general knowledge. The
accomplishments consist of signs of emerging literacy and numeracy, such as pretending to read stories
or counting to 20, and small motor skills, such as buttoning clothes and holding a penc't properly. The
difficulties encompass signs of physical activity-attention difficulties, speech difficulties, and less than
optimal health. The determination of whether the child displayed each of these accomplishments and
difficulties is based on reports from one of the child's parents, usually the mothei.. These data were
collected in January through April 1993 as part of the National Household Education Survey.
The study focuses on 2,000 children who had turned 4 by the end of 1992 and were about 6
months away from starting kindergarten at the time of the survey. A majority of these 4-year-olds
displays each of the small motor skills and signs of emerging literacy asked about in the survey. The size
of the majority, however, varies greatly across specific accomplishments: More than 9 out of 10 could
button their own clothes and hold a pencil properly, and more than 8 out of 10 could identify the primary
colors by name; but only about 6 in 10 could count to 20 or recognize most letters of the alphabet.
Much smaller fractions of preschoolers exhibit any of the developmental difficulties, although a
substantial minority displays signs of physical activity-attention difficulties. At age 4, nearly 3 in 10 aresaid to be very restless and fidgety, and nearly 1 in 4, to have a short attention span. Nearly 1 in 8 isreported to be in less than very good health. About 1 in 13 speak in a way that is not understandable toa stranger or have a stutter or stammer.
The percentage of children displaying signs of emerging literacy and small motor skills increases
with .ears of age within the 3- to 5-year age range, and with months of age among 4-year-olds. Forexample, the percentage of preschoolers reported to write their own names more than triples between ages
3 and 4, wh,le the percentage recognizing most letters more than doubles. Other accomplishments show
more moderate age differences. Developmental difficulties show much smaller changes across ages, andsome show no change.
More girls than boys demonstrate each of the literacy and small motor skills covered in thesurvey, and more boys than girls exhibit signs of physical activity-attention difficulties or speechdifficulties. Though differences by sex are widespread, they are not large.
Hispanic preschoolers are reported to show fewer signs of emerging literacy and more indicationsof physical activity-attention difficulties, and to be in less good general health than white non-Hispanicor black non-Hispanic children.' Controlling for related risk factors such as a mother with limitededucation and minority-language status reduces these ethnic differences but does not eliminate them.Black preschoolers show fewer signs of emerging literacy and less good health than white preschoolers.
However, racial differences are wholly accounted for by related risk factors such as low maternaleducation, poverty, and single parenthood.
The accomplishments and difficulties that children bring with them when they arrive at
kindergarten are correlated with sociodemographic risk factors that have been found to be associated withlearning difficulties after children start school. Five family risk factors are examined: The mother hasless than a high school education; the family is below the official poverty line; the mother speaks alanguage other than English as her main language; the mother was unmarried at the time of the child'sbirth; and only one parent is present in the home. Half of today's preschoolers are affected by at leastone of these risk factors, and 15 percent are affected by three or more of them.
Risk factors are found to be associated with fewer accomplishments and more difficulties inchildren, even after other child and family characteristics were controlled. Of the developmentaldomains, only small motor development is not found to be related to any of the risk factors. In general,the more risk factors the child is subject to, the lower the number of accomplishments and the higher the
'Throughout this report. references to white children refer to white non-Hispanic children, and references to blackchildren refer to black non-Hispanic children.
vi Ii
number of difficulties he or she is likely to have exhibited. Compared to children from families with no
risk factors, twice as many 4-year-olds from families with three or more risk factors have short attention
spans (37 percent versus 17 percent) and nearly double the number are said to be very restless (41 percent
versus 22 percent). Three times as many speak in a way that is not understandable to strangers (14
percent versus 5 percent) or stutter or stammer (16 percent versus 5 percent). Almost five times as many
are in less than very good health (23 percent versus 5 percent). Four-year-olds from families with three
or more risk factors have nearly one-and-a-half fewer literacy accomplishments (an average of 2.5 out
of five) than those from families with no risk factors (who have an average of 3.9 accomplishments).
The relative importance of individual risk factors varies across developmental domains. Low
maternal education and minority-language status are most consistently associated with fewer signs of
emerging literacy and a greater number of difficulties in preschoolers.
The study shows that attending Head Start, prekindergarten, or other center-based preschool
programs is linked to higher emerging literacy scores in 4-year-olds. The increase, which amounts to
an average of nearly one full accomplishment out of five, remains statistically significant when other child
and family characteristics are controlled. This benefit of preschool attendance accrues to children from
both high-risk and low-risk family backgrounds. On the other hand, preschool attendance is found not
to be associated with fewer behavioral or speech difficulties, or with better health status in preschoolers.
It is possible that further research taking into account measures of quality (e.g., child-staff ratio) would
show some effect in these other domains.
The results of the study point to a need for innovative approaches to the provision of early
education services to disadvantaged children. As previous studies have shown, existing preschool
programs have beneficial effects in the area of emerging literacy and numeracy. But they do not appear
to be ameliorating the behavioral, speech, and health difficulties of disadvantaged preschoolers. The need
for earlier and more effective interventions for young children with special educational needs has been
recognized in federal legislation.
The results also demonstrate that educational risk is a multifaceted phenomenon. Five different
risk factors are employed in the present study. All are found to have some relationship to preschoolers'
accomplishments and difficulties, although the pattern of relationships varies across developmental
domains. Many observers believe that low family income is the key factor behind educational failure,
but the results of this research do not support this view. When compared to low family income, the risk
factors of low maternal education, minority-language status, and family structure are often as good or
better predictors of the child's developmental accomplishments and difficulties.
By showing the considerable variation that exists in the accomplishments and difficulties of
children about to start school, the study highlights the challenges that kindergarten teachers face in
meeting the needs of children who are not only demographically but developmentally diverse. Teachers

must maintain the interest and promote the growth of children who have already demonstrated signs of
early literacy and numeracy while simultaneously encouraging the emergence of basic skills in children
who have not yet acquired them. Similarly, they must meet the needs of children with difficulties while
reserving sufficient attention and effort for those with few or no difficulties. While there has always been
variation in children entering kindergarten, the commitment to meeting the educational and developmental
needs of all children in an increasingly diverse society presents greater challenges to teachers and schools.
Achieving this goal requires that early childhood programs and classrooms be organized to meet
the needs of children at all levels of development, that teachers be selected who have the energy, warmth,and imagination to respond to young children with varying capabilities and needs, and that these teachers
be appropriately trained and provided with sufficient resources and assistance so they do not have toneglect some children in order to nurture others. There is still much to learn about how wellkindergarten programs around the country are meeting these requirements.
vii
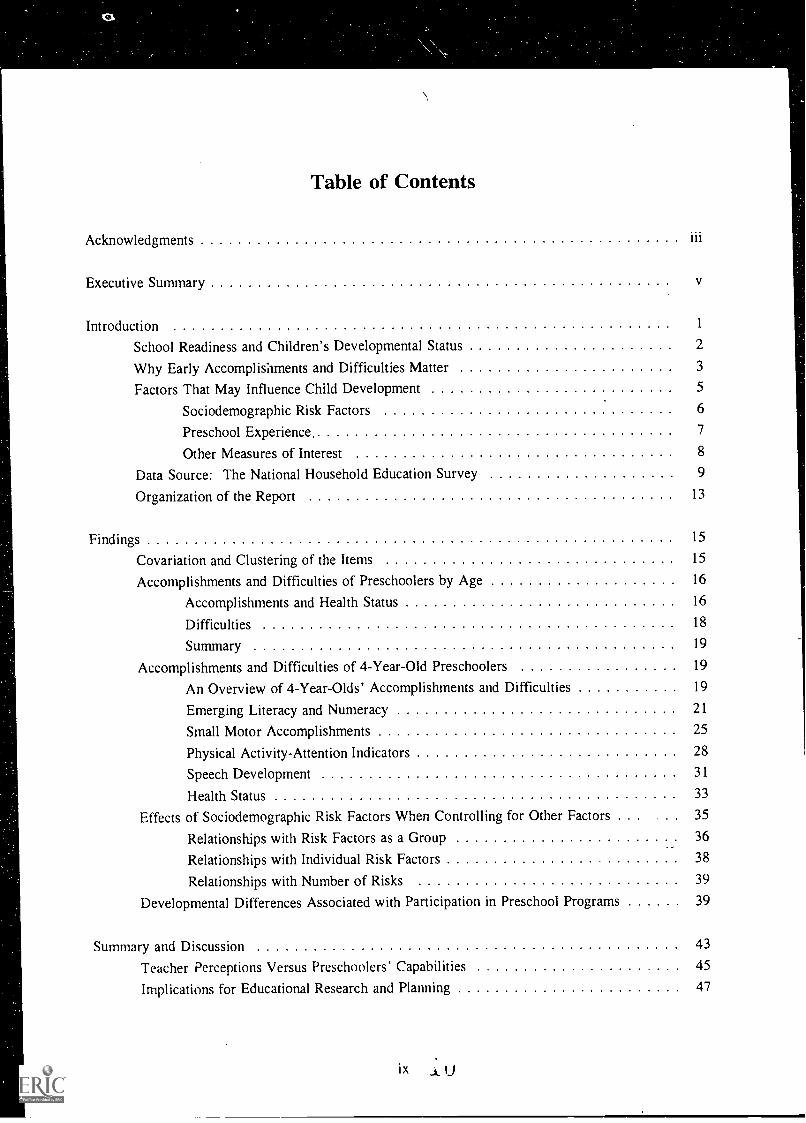
Table of Contents
Acknowledgments iii
Executive Summary
Introduction 1
School Readiness and Children's Developmental Status 2
Why Early Accomplishments and Difficulties Matter 3
Factors That May Influence Child Development 5
Sociodemographic Risk Factors 6
Preschool Experience. 7
Other Measures of Interest 8
Data Source: The National Household Education Survey 9
Organization of the Report 13
Findings 15
Covariation and Clustering of the Items 15
Accomplishments and Difficulties of Preschoolers by Age 16
Accomplishments and Health Status 16
Difficulties 18
Summary 19
Accomplishments and Difficulties of 4-Year-Old Preschoolers 19
An Overview of 4-Year-Olds' Accomplishments and Difficulties 19
Emerging Literacy and Numeracy 21
Small Motor Accomplishments 25
Physical Activity-Attention Indicators 28
Speech Development 31
Health Status 33
Effects of Sociodemographic Risk Factors When Controlling for Other Factors 35
Relationships with Risk Factors as a Group 36
Relationships with Individual Risk Factors 38
Relationships with Number of Risks 39
Developmental Differences Associated with Participation in Preschool Programs 39
Summary and Discussion 43
Teacher Perceptions Versus Preschoolers' Capabilities 45
Implications for Educational Research and Planning 47
ix
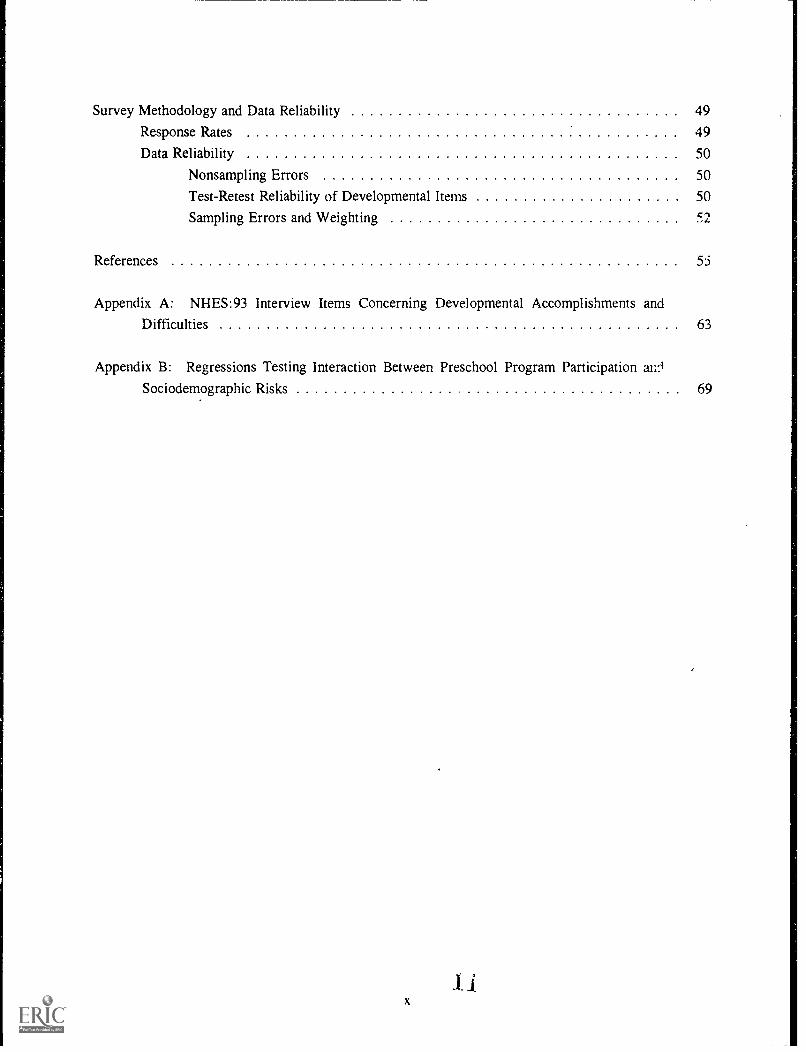
Survey Methodology and Data Reliability 49
Response Rates 49
Data Reliability 50
Nonsampling Errors 50
Test-Retest Reliability of Developmental Items 50
Sampling Errors and Weighting
References 55
Appendix A: NHES:93 Interview Items Concerning Developmental Accomplishments andDifficulties 63
Appendix B: Regressions Testing Interaction Between Preschool Program Participation ailfi
Sociodemographic Risks 69
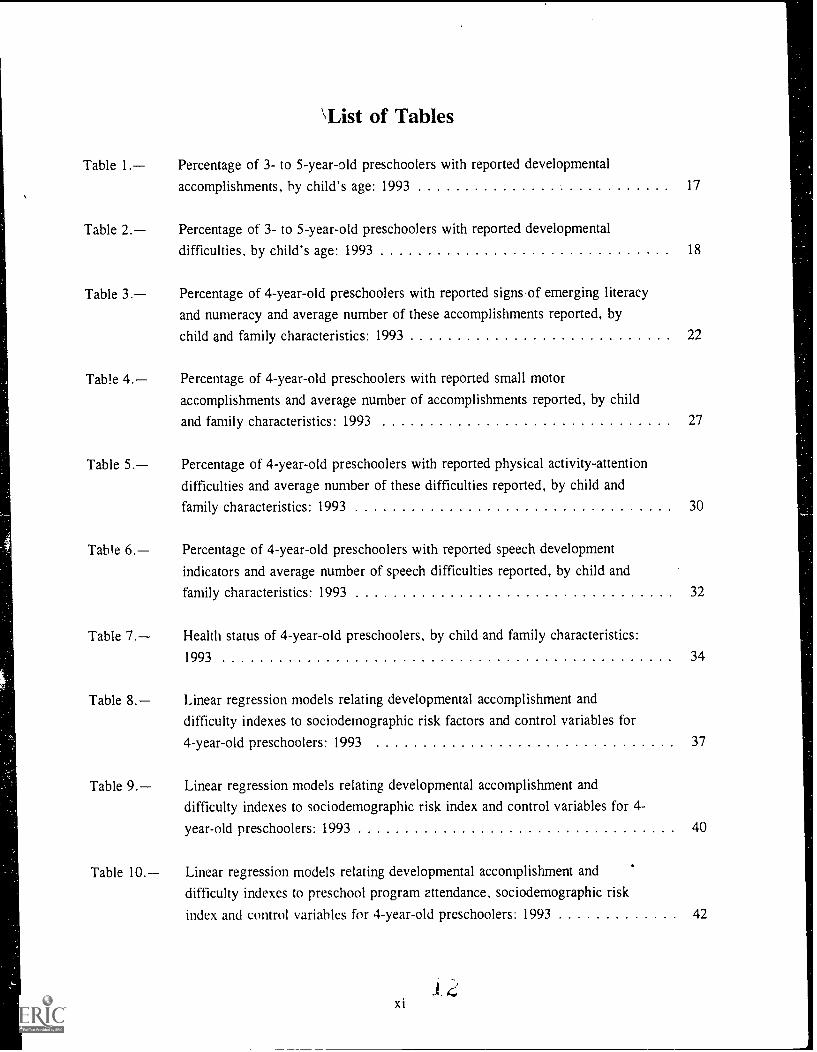
\ List of Tables
Table 1. Percentage of 3- to 5-year-old preschoolers with reported developmental
accomplishments, by child's age: 1993 17
Table 2. Percentage of 3- to 5-year-old preschoolers with reported developmental
difficulties, by child's age: 1993 18
Table 3. Percentage of 4-year-old preschoolers with reported signs of emerging literacy
and nurneracy and average number of these accomplishments reported, by
child and family characteristics: 1993 22
Table 4. Percentage of 4-year-old preschoolers with reported small motor
accomplishments and average number of accomplishments reported, by child
and family characteristics: 1993 27
Table 5. Percentage of 4-year-old preschoolers with reported physical activity-attention
difficulties and average number of these difficulties reported, by child and
family characteristics: 1993 30
Table 6. Percentage of 4-year-old preschoolers with reported speech development
indicators and average number of speech difficulties reported, by child and
family characteristics: 1993 32
Table 7. Health status of 4-year-old preschoolers, by child and family characteristics:
1993 34
Table 8. Linear regression models relating developmental accomplishment and
difficulty indexes to sociodemographic risk factors and control variables for
4-year-old preschoolers: 1993 37
Table 9. Linear regression models relating developmental accomplishment and
difficulty indexes to sociodemographic risk index and control variables for 4-
year-old preschoolers: 1993 40
Table 10. Linear regression models relating developmental accomplishment and
difficulty indexes to preschool program attendance, sociodemographic risk
index and control variables for 4-year-old preschoolers: 1993 42
I 4:xi
Table 11. Agreement and inconsistency in the interview and reinterview responses to
developmental accomplishment and difficulty items 51
Table B-1. Linear regression models relating developmental accomplishment and
difficulty indexes to preschool program attendance, sociodemographic risk
index, interaction of program attendance and risk, and control variables:
4-year-old preschoolers, United States, 1993 72
List of Figures
Figure 1. Developmental accomplishments and difficulties included in the 1993 National
Household Education Survey 11
Figure 2. Percentage of 4-year-old preschoolers with reported accomplishments and
difficulties: 1993. 20
xii

Introduction
Kindergarten is now a nearly universal experience for children in the United States. The results
of a 1991 national survey indicate that 98 percent of primary school children attended kindergarten prior
to entering first grade (West et al. 1991).2 However, the population of children that comes to
kindergarten is increasingly diverse. Growing numbers of children in the United States come from a
variety of racial, ethnic, and cultural backgrounds, family types, parent-education levels, income strata,
and language backgrounds. Young children also differ in the types of preschool experiences they bring
to kindergarten. The majority of children come to kindergarten with some experience in center-based
programs such as day care centers or preschools. The percentage of children with such experience varies,
however, across groups with different backgrounds and characteristics (West, Germino Hausken, and
Collins 1993a; Hofferth et al. 1993).
Schools in the United States are expected to respond to this diversity in children's backgrounds
and educational needs, furnish all children with appropriate activities and instruction, and get each child
off to a good start in schooling. Schools are also being asked to offer services and experiences that
families and other institutions provided in the past, for example, meals and before- and after-school child
care. An understanding of the range of accomplishments and difficulties that children bring with them
when they arrive at kindergarten can aid in understanding the demands being placed on schools. Such
knowledge can also assist teachers and administrators in planning kindergarten programs and in obtaining
sufficient resources to manage classrooms composed of children with differing needs and capacities. This
report provides findings from a national study, the 1993 National Household Education Survey
(NHES:93), based on parent reports of their children's developmental accomplishments and difficulties.
Variations in these characteristics are examined across a set of sociodemographic risk factors and
preschool experiences.
The report addresses five main research questions:
How much variation is there in the developmental accomplishments and difficulties of a
national sample of 3- to 5-year-olds who have not yet started kindergarten? For example,
what percentage of preschoolers are able to identify colors by name, hold a pencil
properly, speak in a way that is understandable to strangers, or are in very good or
excellent health? How do these percentages vary by age, sex, and race and Hispanic
origin?
How do the amount and pattern of variation differ across developmental domains? For
example, does the development of emerging literacy show a different pattern of variation
1The percentage of primary school children who were reported to have attended kindergarten in the survey that is the
subject of this report, the 1993 National Household Education Survey, is identical, i.e., 98 percent.

across groups with different backgrounds and characteristics than the development ofsmall motor skills?
Do family background factors, such as poverty and low parent education levels, that have
been found to be associated with learning difficulties after children start school also
correlate with the accomplishments and difficulties that children bring with them whenthey arrive at kindergarten?
In predicting the accomplishments and difficulties of preschool children, are some family
risk factors more important than others? Or is the number of risks that a child has moreimportant?
If there is a substantial gap between the prescnool accomplishments of children fromhigh-risk family backgrounds and those from more advantaged families, does attending
a center-based preschool program help close the gap by boosting the accomplishments ofdisadvantaged children? Does attending a center-based program make more of adifference in some developmental domains than in others?
School Readiness and Children's Developmental Status
The school readiness of young children is an area of considerable interest and debate in currenteducational policy. One of the National Education Goals states that, "By the year 2000, all children inAmerica will start school ready to learn."' There is not universal agreement within the educationalcommunity as to the criteria for defining or assessing a child's readiness for school. Indeed, someeducators question the usefulness of readiness as a concept (Crnic and Lamberty 1994; Eisenhart and
Graue 1990; Ellwein et al. 1991; Shepard and Smith 1986). Some emphasize the need for schools to beready for children (Barnett 1992; Lamberty and Crnic 1994; Shepard and Smith 1988). There is general
agreement, however, that how a child does in school depends in part on things that happen before he or
she ever enters a kindergarten classroom. Measures of the development and well-being of children as
they enter school can provide important indicators of how young children are being nurtured in oursociety and of the challenges faced by teachers and schools in preparing curricula to meet the needs ofdiverse populations of children.
Most child development specialists consider school readiness, like child development itself, to be
a multifaceted phenomenon (Resource Group on School Readiness 1991; Zill and Coiro 1992). The Goal
One Technical Planning Group of the National Education Goals Panel has identified five dimensions or
'The Goals 2000: Educate America Act, signed by President Clinton on March 31, 1994, sets into law eight NationalEducation Goals for the year 2000. The original six goals were developed in 1989 at a conference of America's governorsand the President: Congress added two new goals in 1994. The goal regarding school readiness was one of the originalgoals.
2
domains of development that are important to a child's readiness for school: physical well-being and
motor development, social and emotional development, approaches to learning, language usage, and
cognition and general knowledge (Goal One Technical Planning Group 1993). The Group has
recommended that any attempt to assess children's school readiness should involve the direct assessment
of children themselves, as well as the collection of information from parents and teachers. No such
comprehensive, multimethod assessment of the developmental status of a representative sample of U.S.
preschoolers or kindergartners is currently available.' Until a direct assessment is conducted, surveys
based on reports by parents or teachers can help provide preliminary indications as to the developmental
status of children about to enter school: however, these measures are not substitutes for direct
assessments.
This report presents estimates of the frequency of selected developmental accomplishments and
difficulties among preschoolers' in the United States, based on information reported by their parents. The
aim of the report is not to make an overall judgment on the school readiness of American children, but
rather to provide insights into what today's children who are soon to enter kindergarten are like, in terms
of both their positive achievements and some of the problems they are experiencing that are potentially
relevant to school performance and adjustment. The analysis seeks to ascertain how preschoolers'
accomplishments and difficulties change from age 3 to age 5 and to examine the relationship between
several selected risk factors and these accomplishments and difficulties among 4-year-old preschoolers,
the largest population of children who will soon be entering kindergarten.
Why Early Accomplishments and Difficulties Matter
When considering the accomplishments and difficulties of preschoolers, it is important to bear
in mind that most teachers do not consider some of the specific skills reported here as necessary for
kindergarten entry. For example, in a recent national survey of kindergarten teachers, only 21 percent
consider it "essential" or "very important" for a child to be able to use pencils or paint brushes to be
ready to start kindergarten. Likewise, only 10 percent consider it very important for the child to know
the letters of the alphabet, and just 7 percent deem it very important for children to be able to count to
20 or more at the time they entered kindergarten (Heaviside and Farris 1993).
The child characteristics that a majority of the teachers consider essential or very important for
school readiness are being well nonrished and rested (96 percent), being able to communicate needs,
'The Child Supplement to the National Longitudinal Survey of the Labor Market Experiences of Youth (NLSY-CS)
comes close to being such an assessment, but it will not be hilly representative of American preschoolers until the children
of late childbearers in the sample reach kindergarten age (Baker and Mott 1989). A multimethod assessment is currently
being designed by the National Center for Education Statistics and planned for implementation in 1998.
5Preschoolers are defined in this report as children 3 to 5 years of age as of December 31. 1992, who had not yet
enrolled in kindergarten. Using this definition, nearly all 3- and 4-year-olds, and about one-quarter of 5-year-olds,
predominantly those who have birthdays late in the year. are preschoolers.
3
1
thoughts, and wants verbally (84 percent), being enthusiastic and curious in approaching new activities(76 percent), and taking turns and sharing (56 percent) (Heaviside and Farris 1993; West, GerminoHausken, and Collins 1993b). However, even if preacademic skills such as identifying colors,recognizing letters, and counting are not requirements for kindergarten entry, they are important for tworeasons. First, knowing what skills children have and have not yet learned is important for curriculum
planning and the allocation of instructional resources. Second, early accomplishments and difficulties arepredictive of later academic performancenot perfectly sobut enough to make large developmentaldifferences among groups of children a cause for educational concern. Let us elaborate briefly on eachof these points.
Planning Programs and Allocating Resources. If the kindergarten pupils who attend a givenschool vary widely in their developmental accomplishments or a large proportion of them exhibitdevelopmental difficulties, the school must be prepared to offer a broad array of activities and materialsto the students or risk having some be unchallenged and bored, while others must struggle to keep upwith the class. It certainly is possible to carry on a diverse set of learning activities, even in a singleclassroom, provided the group size and child-to-staff ratio are not too large, and the main teacher isskilled and energetic enough to manage a class in which many different things are happening at once.
The 1993 national survey of kindergarten teachers mentioned earlier shows that 72 percent of allpublic school kindergarten teachers have classes of 20 or more pupils, and 25 percent have class sizesof 26 or more. In 39 percent of public kindergarten classes, the teacher does not have a paid adultassistant to help with the students, and the average child-to-staff ratio across all public kindergartenclasses is 15:1 (Heaviside and Farris 1993). Guidelines propounded by the National Association for the
Education of Young Children (NAEYC) call for kindergartners to be in classes of no more than 20children with 2 adults, implying a child-to-staff ratio of only 10:1 (Bredekamp 1987). Clearly, manyexisting kindergarten classes fail to meet the NAEYC guidelines. This suggests that teachers in theseclasses may have a difficult time coping with pupils with widely varying accomplishments or largenumbers of developmental difficulties.
Predicting Later Achievement. The specific accomplishments and difficulties selected for theNHES:93 were chosen in part because they had been shown to correlate significantly with children'sscores on the General Cognitive Index of the McCarthy Scales of Children's Abilities,' an assessment of
cognitive development in preschoolers (Henderson 1991; McCarthy 1970). The General Cognitive Indexhas, in turn, been shown to be among the best of an array of preschool predictors of children's lateracademic achievement (Horn and Packard 1985). However, preacademic skills represent just one ofseveral domains that are important to a whole-child developmental perspective. Children's physicalactivity and attention levels are behavioral dimensions that are important to society and to school(Pellegrini and Horvat 1995). Another fairly good predictor of later achievement, or rather, of
°See section "Specific Developmental Areas Examined" below fUr further information on the item selection process.
4
achievement difficulties, is a syndrome that is often labeled hyperactive behavior or hyperactivity. Some
of the characteristics of this syndrome include a short attention span, extreme restlessness, mental
confusion, fidgeting, and motor clumsiness (Horn and Packard 1985; Pellegrini and Horvat 1995). Items
indicative of this behavior pattern were also part of the NHES:93 developmental questionnaire, but these
few items as reported by parents should not be viewed as diagnostic.
To be sure, the prediction of later academic achievement based on preschool accomplishmentsand difficulties is far from perfect, especially at the level of the individual child. Like physical growth,
mental growth does not proceed at a constant rate for all individuals; there are spurts and lags at different
periods in each person's development (Jensen 1980). Although extremely early or extremely late
accomplishment of basic skills may foreshadow great talent or the presence of a developmental disability
(Willerman 1979), individual differences in development within the normal age range are not necessarily
significant (McCall 1970). Generally speaking, assessments made at early ages are less predictive of
achievement in adolescence than assessments made in the third grade or later (McCall 1987; Cardon et
al. 1992). Furthermore, the fact that a young child.can recite the alphabet or count from 1 to 20 may
simply reflect that the child has been drilled to perform the task by rote, rather than having a real
understanding of the information involved (Bredekamp 1987).
Nevertheless, when children's accomplishments and difficulties are combined into composite
scores, the scores tend to be more stable and predictive of differences in later achievement (Laosa 1992;
Horn and Packard 1985). Also, average developmental differences among groups of children tend to be
more reliable and prognostic than differences between individuals (Sattler 1992). Groups of youngsters
who show substantially fewer accomplishments and more difficulties as preschoolers may well require
more challenging instruction and special education resources as elementary and secondary school students
(Knapp, Shields, and Turnbull 1992). The persistence of sizable developmental differences between
young children from low-income or low-education families and more advantaged children suggests that
attempts to "level the playing field" by providing early interventions and compensatory resources have
not gone far enough or are not succeeding for other reasons.
There are many potential applications of data on young children's accomplishments and
difficulties for educational planning, prediction of future resource needs, and policy guidance. Thus,
there is much to be gained in understanding how parent reports of children's statuses on several
developmental dimensions are distributed and how they are associated with characteristics of children and
their families that put them at risk.
Factors That May Influence Child Development
In this section, we discuss several factors that may have an impact on a child's developmental
accomplishments and difficulties. These include sociodemographic risk factors, such as maternal language
and education, poverty status, being born to an unmarried mother, and living in a single-parent
5

household. Preschool experience is generally thought to have a positive effect on children's development
as it relates to preparedness for school, and is associated with lower rates of grade retention. Other
factors, including sex, race-ethnicity, and month of birth are included to show the relationship of these
basic child characteristics to development and to control for variations in the demographic characteristics
of different risk groups (see the section entitled "Other Measures of Interest," below).
Sociodemographic Risk Factors
The objectives spelled out under the National Education Goal on school readiness draw attention
to two groups of children whose developitiental status is of particular concern to the Nation. One of these
groups consists of young children who are disadvantaged, either economically or socially; the other, of
young children with disabilities (U.S. Department of Education 1995).
Several family background characteristics have often been found to be associated with pooreducational outcomes among school-aged children, such as low achievement test scores, grade repetition,
suspension or expulsion, and dropping out of high school. These include coming from a family whose
annual income is below the official poverty level (Zill et al. 1995), having parents who have notcompleted high school (West and Brick 1991; Collins and Brick 1993; Bianchi and McArthur 1993:Sattler 1992), being born to a mother who was unmarried at the time of the child's birth (Prince, Nord,
and Zill 1993), living in a single-parent family (Dawson 1991), and having a mother who speaks alanguage other than English in the home (Bianchi and McArthur 1993).
Students who have one or more of these characteristicsa group that may comprise as many as
half of all schoolchildren in the United Statesare considered educationally disadvantaged or "at risk"
of school failure (Pallas, Natriello, and Mc Dill 1989). Although not all pupils with one or more of these
characteristics will do poorly in school, those with such risk factors have, on average, a greater chance
of low achievement than those without any risk factors. Furthermore, these characteristics often occur
together, as in families started by unmarried high school dropouts who receive no support from thefathers of their children and live in poverty or depend on welfare (Haffner et al. 1992; Kaufman and
Bradt)), 1992; Nord and Zill 1993).
Children from "multiple risk families" may be most in danger of school failure. Researchers have
found a linear relationship between a cumulative risk score and measures of verbal IQ and socialadjustment in 4-year-old children (Sameroff et al. 1987), with vocabulary and math test scores in 4- and
5-year-olds (Nord et al. 1994), as well as with the chances of grade repetition or suspension in school-
aged children or adolescents (Prince, Nord, and Zill 1993). These results have led some to speculate that
the number of risk factors there are in a child's background may be more important than the nature of
the particular risk or risks (Meisels and Wasik 1990).
This report examines whether the same family factors that are associated with poor performance
in school-aged children also increase a child's chances of showing fewer developmental accomplishments
and more developmental difficulties as a 4-year-old preschooler. We also construct a cumulative risk
index and compare the strength of its relationship with child development with the relationship of child
development and individual risk factors.
Preschool Experience
The school readiness objectives of the National Education Goals commit the Nation to increased
participation by preschoolers in high-quality child care and early education programs. Increased access
to these programs is seen as especially important for children who are disadvantaged or disabled (U.S.
Department of Education 1995).
The percentage of children entering kindergarten who have had some form of nonparental child
care by relatives, nonrelatives, or in centers has increased with the participation of women in the work
force. The labor force participation rates of women with 3- to 5-year-old children increased from 32
percent in 1970 to 55 percent in 1990 (West, Germino Hausken, and Collins 1993a; U.S. Bureau of the
Census, various years). In 1990, 54 percent of mothers whose youngest child was 3 or 4 years of age
were in the labor force, and among these women, about two-thirds were employed full time (U.S. Bureau
of the Census 1992).
In 1991, 68 percent of preschoolers were currently receiving some form of nonparental care or
were participating in early childhood programs, and 80 percent had ever done so (West, Germino
Hausken, and Collins 1993a). Among 4-year-old preschoolers, 73 percent were participating in currentnonparental care arrangements or programs, and 84 percent had ever participated. The percentage of
children who had ever attended a center-based program (including day care centers, Head Start, ornursery schools) was associated with family income and parental education levels: Those in
disadvantaged households were less likely to participate in these early childhood programs. In addition,
Hispanic preschoolers, as a group, were found to be less likely than others to have early childhood
program experiences. This is consistent with previous research indicating that Hispanic children are less
likely to attend center-based programs, but more likely to receive care from a relative, that white children
(West et al. 1993)
Analyses by Bianchi and McArthur (1993) and Collins and Brick (1993) indicate that attending
center-based preschool or child care programs reduces a child's chances of having to repeat kindergarten
or first grade, even after socioeconomic differences are controlled. There is evidence that participation
in Head Start and other preschool programs can increase children's cognitive test scores, although the
gains appear to fade by the time children reach the third or fourth grade (Lee, Brooks-Gunn, and Schnur
1988; Mc Key et al. 1985). Some programs show longer term effects in terms of reducing grade retention
and special education placement (Haskins 1989; White 1986).
7
Barnett (1992) notes that the public has become convinced that preschool experience (i.e.,participation in a center-based program) enhances children's preparation for school and supports long-term
success. While the analyses cited above suggest some benefit from preschool participation, Barnett notes
that public prekindergarten programs may not necessarily convey the benefits of exemplary programs that
were studied in the past (e.g., the Perry Preschool Study). He also notes that much of the research on
preschool effects is now dated, and that considerable social change has taken place in the years sincesome of the major preschool studies were conducted. Ongoing examination of the relationship between
center-based program participation and other early childhood experiences, accomplishments, anddifficulties is therefore needed.
In this report we examine whether participation, in a center-based preschool or child care program
(i.e., a day care center, nursery school, preschool, prekindergarten, or Head Start program) is associated
with more signs of developmental accomplishments or fewer developmental difficulties in 4-year-olds,
controlling for a variety of child characteristics and sociodemographic factors correlated with preschool
participation. No attempt is made to considr... the quality of the center-based program or programs the
child attended, as it was not possible to adequately assess program quality with the NHES:93 datacollection mechanism. In addition to evaluating whether preschool participation has an overall effect on
the developmental measures, we examine whether the effect of participation is greater for children whohave one or more educational risk factors.
Other Measures of Interest
While some authors consider racial or ethnic minority group status to be a risk factor, race-ethnicity is not treated as such in this analysis. Rather, race-ethnicity is included in the tabulations and
is treated as a control variable. The reason for this is that race and ethnicity are not actionable by private
choices or public policies the way such factors as parent education level, poverty status, and preschool
program participation potentially are. At the same time, children from some racial or ethnic groups, forexample Hispanics, are underrepresented among children who attend center-based programs.Furthermore. Hispanic families and black families tend to have lower education and income levels, on
average, than non-Hispanic white families, and Hispanic parents are more likely to speak a language other
than English at home. There may also be other, unmeasured characteristics of minority families that
correlate with their children's reported accomplishments and difficulties. For example, minority parents
may have different styles of responding to survey questionnaires than nonminority parents.' Therefore,
it is desirable to take the differing racial and ethnic compositions of various risk groups into consideration
when comparing, say, the developmental accomplishments of children who did or did not attend center-
Tor example, Bachman and O'Malley (1984) fimnd that, in self-attitude items using Likert-type response categories,blai..k respondents were more likely to select the responses at either end (strongly agree, strongl . disagree) than were whiterespondents. This does not necessarily suggest. however, that differences in reporting behavior (e.g., counting, buttoningclothes, or program participation) would be observed.
8 .21

based programs. The child's sex is also included in the tables and as a control variable for similar
reasons.
Several researchers have noted that 'girls tend to perform better than boys on measures such as
readiness tests (Ellwein et al. 1991) and the Weschler Preschool and Primary Scale of Intelligence (Sattler
1992). However, Laosa (1982) did not find consistent sex differences among Chicano children on the
Preschool Inventory. Other authors have noted the higher incidence of behavior problems among young
boys (Achenbach 1982; Achenbach et al. 1991: Rutter, Tizard, and Whitmore 1970). Bianchi and
McArthur (1993) found higher incidence of delayed school entry, kindergarten retention, and repeating
first grade among boys. The presence of these sex differences in school entry and early school
experience suggests that sex is an important variable in an analysis of the accomplishments and difficulties
of young children.
In addition, because development occurs at a rapid pace in the preschool years, children born
early in the previous year ("older 4's") may be more developmentally advanced than children born late
in the previous year ("younger 4's").8 Thus, even in analyses run on 4-year-old preschoolers only, the
child's month of birth was included as a control variable. When a number of young children are present
in a household, it may diminish the amount of parental attention and other family resources available to
each child (Nord et al. 1994). Thus, the number of children under age 9 in the household was also
included as a control variable.
Data Source: The National Household Education Survey
This report is based on data from the 1993 National Household Education Survey (NHES:93).
The NHES is designed to use national telephone surveys of households to study topics that cannot be
addressed adequately through institution-based studies. This approach is particularly useful for studies
of populations such as preschoolers, who could not be sampled from institutional rosters, since no
comprehensive sampling frames are available and many children are cared for in their own homes or in
other private homes. In the NHES, households are sampled using random-digit-dialing methods and
interviews are conducted using computer-assisted telephone interviewing (CATI) technology. The survey
is designed to collect descriptive data that can be used to monitor issues that have a high priority with
the Department of Education by targeting specific populations for detailed data collection. It is intended
to provide more detailed information on topics and populations of interest than is typically available
through supplements to existing household surveys, for example, the Current Population Survey (CPS).
Reports on the developmental accomplishments and difficulties of preschool children were
collected in the NHES:93 from the parents and guardians of 4,423 preschoolers (that is, children age 3
RIn the NIIES:93 analyses, children's age was measured as of Decemher 31, 1992. Parent interviews were conducted in
the months of January through April of 1993.
9 4.

and older who were not yet enrolled in kindergarten).9 The sample represents a preschool populationestimated to number some 8.6 million children nationwide. Weights were applied to help make thesurvey estimates applicable to the entire young child population, including those living in householdswithout telephones.
Specific Developmental Areas Examined. The developmental accomplishments and difficultiesincluded in this report are based on 19 items in the NHES:93 questionnaire administered to parents ofpreschoolers (Figure 1 and Appendix A). The set of items was intended to represent a number ofdifferent domains of children's development and well-being: emerging literacy and numeracy (7 items,of which 3 were combined to form the reading measure), small motor development (3 items), gross motorfunctioning (1 item), general health (1 item), social and emotional development (4 items), and speechdevelopment (3 items).
The items were drawn from several widely used early childhood data collection and diagnosticinstruments, including a screening inventory and a readiness checklist used by public school teachers.'Some questions were written especially for the NHES, asking parents about school-related skills that havebeen tested in several early childhood assessment batteries. For example, the Developmental Indicatorsfor the Assessment of Learning-Revised battery (DIAL-R) tests color naming, rote counting, letternaming, and writing first name, among other skills (Mardell-Czudnowski and Goldenberg 1990). TheMetropolitan Readiness Test, the Early Childhood Assessment Test (Mason and Stewart 1993), and otherbatteries also assess some of the same accomplishments (Salitia. and Ysseldyke 1991). An item derivedfrom questions on whether the child pretended to read and told connected stories when doing so wasinspired by Tea le's work on the assessment of children's emerging literacy (1988, 1990).
Following analysis of the intercorrelations among these items, the indicators were grouped in asomewhat different way. That new grouping is described at the beginning of the Findings section andis reflected in the data presentations contained in Tables I through 7.
information on survey methodology. response rate, and data reliability appears in the final section of this report.
°The parent questionnaire from the Early Screening Inventory (ESI) developed by Sam Meisels of the Univer: 'ty ofMichigan, and a readiness checklist tormerly used Wpublic school teachers in Maryland supplied by Doris Entwisle ofJohns Hopkins University.
2 310
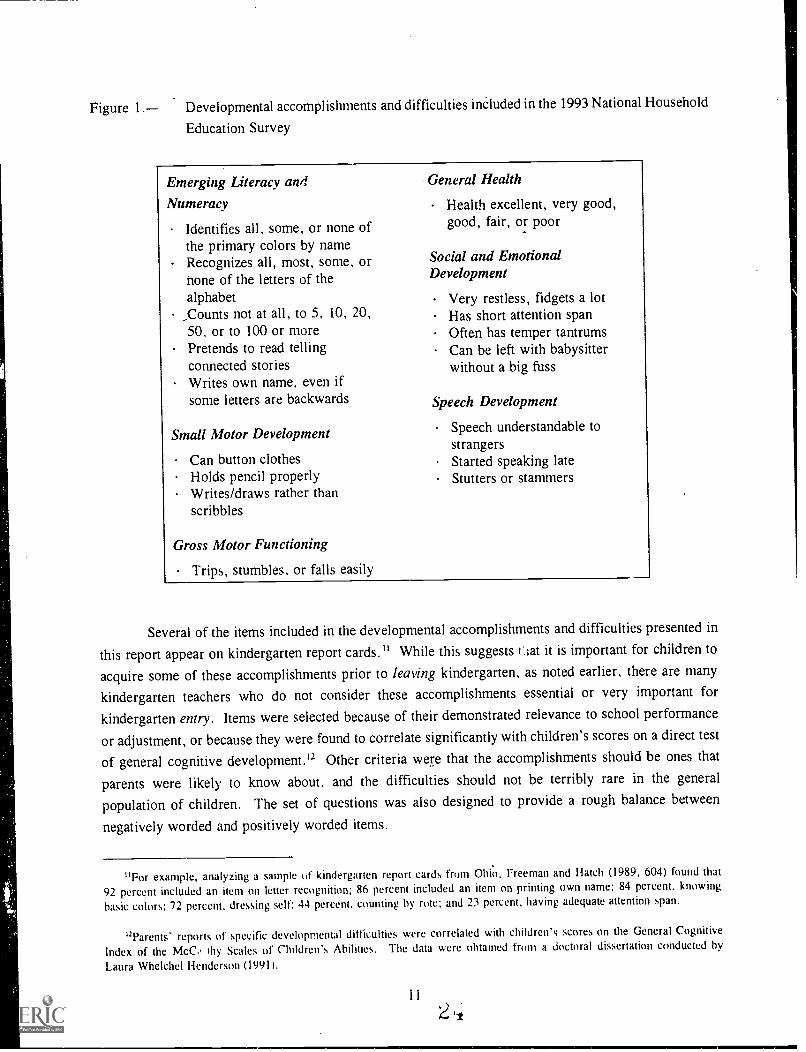
Figure 1. Developmental accomplishments and difficulties included in the 1993 National Household
Education Survey
Emerging Literacy and
Numeracy
Identifies all, some, or none ofthe primary colors by nameRecognizes all, most, some, orhone of the letters of thealphabet
;Counts not at all, to 5, 10, 20,50, or to 100 or morePretends to read tellingconnected storiesWrites own name, even ifsome letters are backwards
Small Motor Development
Can button clothesHolds pencil properlyWrites/draws rather thanscribbles
Gross Motor Functioning
Trips, stumbles, or falls easily
General Health
Health excellent, very good,good, fair, or poor
Social and EmotionalDevelopment
Very restless, fidgets a lotHas short attention spanOften has temper tantrumsCan be left with babysitterwithout a big fuss
Speech Development
Speech understandable tostrangersStarted speaking lateStutters or stammers
Several of the items included in the developmental accomplishments and difficulties presented in
this report appear on kindergarten report cards." While this suggests tliat it is important for children to
acquire some of these accomplishments prior to leaving kindergarten, as noted earlier, there are many
kindergarten teachers who do not consider these accomplishments essential or very important for
kindergarten entry. Items were selected because of their demonstrated relevance to school performance
or adjustment, or because they were found to correlate significantly with children's scores on a direct test
of general cognitive development.' Other criteria were that the accomplishments should be ones that
parents were likely to know about, and the difficulties should not be terribly rare in the general
population of children. The set of questions was also designed to provide a rough balance between
negatively worded and positively worded items.
'For example, analyzing a sample of kindergarten report cards from Ohio. Freeman and Hatch (1989, 604) found that
92 percent included an item on letter recognition: 86 percent included an item on printing own name: 84 percent, knowing
basic colors; 72 percent. dressing self; 44 percent. counting by rote; and 23 percent, having adequate attention span.
12Parents' reports of specific developmental difficulties were correlated with children's scores on the General Cognitive
Index of the McC,, ihy Scales of Children's Abilities. The data were obtained from a doctoral dissertation conducted hy
Laura Whelchel Henderson (1991).
Most of the developmental items are dichotomous, yes-no questions, but a few have severalpossible response options representing a range of accomplishment (e.g., recognizes all, most, some, ornone of the letters of the alphabet). For the analyses reported here, these items were dichotomized (e.g.,
recognizes all or most letters versus some or none).
The set of items should not be thought of as a comprehensive assessment of children'sdevelopmental status or school readiness. First, the set of items is relatively small and there are aspectsof children's development and behavior that teachers and parents believe to be very important for schoolreadiness that are not addressed by the developmental accomplishments and difficulties items in the
NHES:93. Examples are the child's ability to communicate needs, wants, and thoughts verbally; his orher curiosity and enthusiasm in approaching new activities; and his or her ability to take turns, share, andcooperate with other children (Knudsen-Lindauer and Harris 1989, Heaviside and Farris 1993; West,Germino Hausken, and Collins 1993b). Second, a comprehensive assessment of children's developmental
status would not rely solely on parent-supplied information, but would make use of information fromteacher reports and direct assessment of the child (Goal One Technical Planning Subgroup 1991). Despite
these limitations, the present survey findings provide useful insights into the status of young children andthe population of children about to enter kindergarten.
Strengths and Limitations of Parent Reports. Parent recollections of what their children haveand have not done are obviously not as objective as direct assessments by impartial observers.'Nonetheless, parents are an indispensable source of information about children's health, learning, andbehavior, because they see children over long periods of time and in a variety of settings (Goal OneTechnical Planning Subgroup 1991; Rutter, Tizard, and Whitmore 1970). Parent responses todevelopmental inventories or structured child behavior scales have been found to have reasonablereliability (Achenbach and Edelbrock 1981; Baker and Mott 1989) and to be of considerable value in
diagnosing developmental disorders in children (Graham and Rutter 1968; Meisels, Dorfman, and Steele1992).
Parent reports about individual items of behavior or attainment have to be interpreted withcaution, though, as some parents respond in idiosyncratic ways, and single responses tend to be lessreliable than summary scores or composite scales (Schreiner 1983; Zill 1990). A reinterview study with
a subsample of the NHES respondents showed moderate levels of inconsistency between parents' original
and reinterview responses to the individual questions about their children's accomplishments anddifficulties (Brick, Rizzo, and Wernimont 1993). Nevertheless, for half the items, more than 90 percentof the reinterviewed parents gave responses that were in agreement with their own earlier responses, andfor most of the remaining items, between 81 and 89 percent of the parents gave consistent responses.'
"Direct assessments have their own probk Ins, such as hdher a given sample of a child's behavior is trulyrepresentative of what the child has done in other situations.
''The reinlerview findings are described more fully in the methodology section of this report.
122
Some of the accomplishments and difficulties reported in this research involve behaviors that can
be objectively observed and reported, for example, the child's buttoning his or her clothes or writing his
or her name. Other behaviors, including several of those that represent difficulties, require parents to
make judgements about their child's behavior in comparison to norms that are less explicit and obvious,
for example, evaluating the shortness of the child's attention srm or how well his or her speech can be
understood. For many children, these behavioral characteristics may not be experienced as difficultic
until they enter school, and that experience may, in some cases, result from expectations by the school
that are inappropriate for the child's age or developmental status.
Parents also vary in their opportunity to observe their children's accomplishments. Parents who
frequently engage in formal or informal educational activities with their preschool children are not only
likely to teach their children through these activities, but also to have a better idea of what their children
can and cannot do than parents who do relatively little in the way of educational play. A parent's
negative response to a particular developmental item may not mean that the child cannot do this thing,
but merely that the parent has not observed the child doing it.
Published reports of direct observations or testing of children's accomplishments and difficulties
directly comparable to the individual items collected in the NH ES are limited. Those that are available
are at least roughly consistent with the NHES findings.' More importantly, as shown in the results
section of this report, the group differences revealed by the parent reports are congruent with findingsof previous studies that used other methods, such as direct testing of young children. Despite this
encouraging evidence, readers are advised to keep the limitations of parent reports in mind when
interpreting the findings.
Organization of the Report
The sections that follow present the findings of the NHES:93 concerning the developmentalaccomplishments and difficulties of preschoolers. The first section of findings presents data on the status
of 3- to 5-year-old preschoolers on the specific developmental measures included in the NHES:93 and
the extent to which the selected measures are associated with children's ages. The subsequent sections
focus on 4-year-old preschoolers, those who are most likely to have entered kindergarten during the fall
term following the survey. Of course, some 4-year-olds, particularly those born in the last quarter of
the year, may not have entered kindergarten in 1993. However, the analysis of the accomplishments and
difficulties of the 4-year-old preschool population provides the best overview of the status of the
population about to enter kindergarten that is available from a cross-sectional methodology. While some
5-year-olds are also preschoolers, particularly those born later in the year, these children have not been
included in the analysis of those about to enter kindergarten. The reason for this exclusion is that 5-year-
'For example, Ferrara (1987) tested how high a sample of 66 nursery school children (average age 4 years, 6 months)from a small Midwestern city could count by rote, and she found the mean number the children could count to was 30.Parents of 4-year-olds in the NI1ES reported that 62 pet cent could count to 20 or higher.
13 .4
olds not yet in kindergarten may be different from other preschoolers; that is, they may havecharacteristics that led to a decision by their parents or by a school that the child's entry should occur
at a later time. For this reason, their inclusion may introduce a bias into the analysis.
The analyses for 4-year-olds include cross-tabulations of selected child characteristics andsociodemographic risk factors for each of the selected accomplishments and difficulties. The measures
are presented in groups that represent specific domains: emerging literacy, small motor skills, speech,
and so on. Within each multi-item domain, the mean number of accomplishments and difficulties is also
presented. Each of the risk factors is examined in the analysis in terms of its individual relationship with
each of the developmental accomplishments and difficulties. In addition, the five risk factors arecombined into a total score by adding a 1 for each risk factor the child has. The possible range of this
risk index, then, is from 0 (no risk factors) to 5 (all risk factors). For presentation purposes, and owing
to the very small number of children with more than three risk factors, categories of risk were created
that represent no risk factors, one, two, or three or more risk factors.
In addition, this report describes the results of controlling for variations in demographiccomposition and for the related influences of other risk factors when examining developmental differences
between children from different risk and preschool participation groups. The kinds of questions theseresults try to answer are: What would developmental differences between poor and non-poor children
look like, if both groups had the same average parent education levels, ethnic compositions, agedistributions, and so on? Also, what would the differences in accomplishments and difficulties between
preschool attendees and nonattendees look like, if we could hold all other factors in the analysisconstant?'
The report then examines whether a risk index based on the number of risk factors that appliee
to a given child was as closely related to child development as a composite variable that gave more weight
to some individual risk factors than to others. Is there, for example, something special about therelationship between poverty and child development, or are the various risk factors about equal in their
detrimental relationships to children's accomplishments and difficulties? Again, these comparisons were
made with all other differences between the risk groups held constant.
I6Multiple linear regression was the statistical procedure used to control for compositional differences and the effects ofother factors.
14 2 ';'
Findings
Before presenting survey findings on the frequencies with which the selected accomplishments
and difficulties were reported for various groups of preschool children, the following section presents
information about the extent to which the various developmental items go together. An important
question about pa:ents' reports of children's accomplishments and difficulties is whether these reports can
legitimately be; used to form clusters or scales, as child developmentalists would expect." If a given
group of items correlate with one another in expected ways, then we are justified in summing the number
of positive (or negative) items acknowledged by parents into a summary accomplishment (or difficulty)
score. If significant correlations between items are not found, or if the patterns are different from what
one would expect from the developmental literature, then the formation of summary scores is not
justified.
Covariation and Clustering of the Items
When correlations between the selected accomplishment and difficulty items were analyzed, the
items were found to form fi ve dimensions or clusters. Four of these groupings were readily identifiable,
corresponding closely with how the items would be expected to cluster, based on prior experience withsuch measures. A fifth cluster was less readily interpretable, and so was not used in the present analysis.
However, the general health status rating, one of the items making up the fifth cluster, was used as a
single-item indicator of child health problems.'
The four identifiable clusters were
An emerging lireracy-numeracy cluster, consisting of five items (identifying primarycolors by name, telling connected stories when pretending to read, counting to 20 ormore, writing one's own name, and recognizing most or all letters of the alphabet);
A small motor cluster, consisting of three items (holding a pencil properly, buttoning ownclothes, and writing or drawing rather than scribbling);'
17 The statistical procedure used to evaluate the dimensions or clusters that the parent responses formed was principal
components analysis, a form of factor analysis.
18In addition to the general health rating, the fifth cluster included two items on children's vision and hearingdifficulties and one social-emotional item, namely, whether the child could be left with a babysitter without making a big
fuss. These three individual items were also dropped from the present analysis.
19The last item also correlated with the emerging literacy cluster, but was used only with the small motor cluster in the
present analysis.
15 2
A physical activity-attention cluster, consisting of three social-emotional items(restless/fidgets, short attention span, and frequent temper tantrums) and one gross motoritem (trips or falls easily); and
A speech problems cluster, consisting of three items (started speaking late, notunderstandable to a granger, and stutters or stammers).
Composite scores were developed for each of the domains by adding up the number of items in
the domain that were said to apply to each child. Thus, scores could range from 0-3, 4, or 5, depending
on the number of items in the cluster. For the emerging literacy and small motor scales, higher scores
meant that the child had more accomplishments, whereas for the physical activity-attention and speech
problems scales, higher scores meant that the child had more difficulties. The general health item was
dichotomized, with children rated in excellent or very good health assigned a score of 1, while those in
good, fair, or poor health were given a score of 2.
Accomplishments and Difficulties of Preschoolers by Age
While children develop at their own paces, there is a general age progression in developmental
accomplishments and difficulties. In general, the accomplishments included in this research willeventually be achieved by nearly all children, and many of the difficulties will diminish with age andmaturity for most children. Tables 1 and 2 show the prevalence of the selected measures for all 3- to5-year-old preschoolers and for each age. Because the majority of 5-year-olds are enrolled inkindergarten, the preschool population includes only about one-quarter of all 5-year-olds.
Accomplishments and Health Status
Preschoolers show increasing acquisition of each of. the literacy-numeracy accomplishments
included in this study as they grow older (table 1).' However, the extent of change by age varies across
the different accomplishments. The percentage of preschoolers who can identify four primary colorsincreases by 20 percentage points from age 3 to age 5 (from 69 to 89 percent). Much larger increasesare observed from age 3 to age 5 in the percentage of children who can recognize most or all letters(from 27 to 66 percent), count to 20 or more (from 37 to 78 percent), and write their names, even ifsome letters are backwards (from 22 to 84 percent).
About two-thirds of 3-year-old preschoolers read or tell connected stories while pretending to
read. This increases to 73 percent at age 4 and 79 percent at age 5. Of course, most preschoolers arepretending to read rather than actually reading. Parents report that, among preschoolers, 2 percent of
3-year-olds, 4 percent of 4-year-olds, and 9 percent of 5-year-olds actually read stories themselves, thatis, read the words rather than pretending to read (not shown in ables).
20A11 statements of difkrences in the text are significant at the .05 level.
16
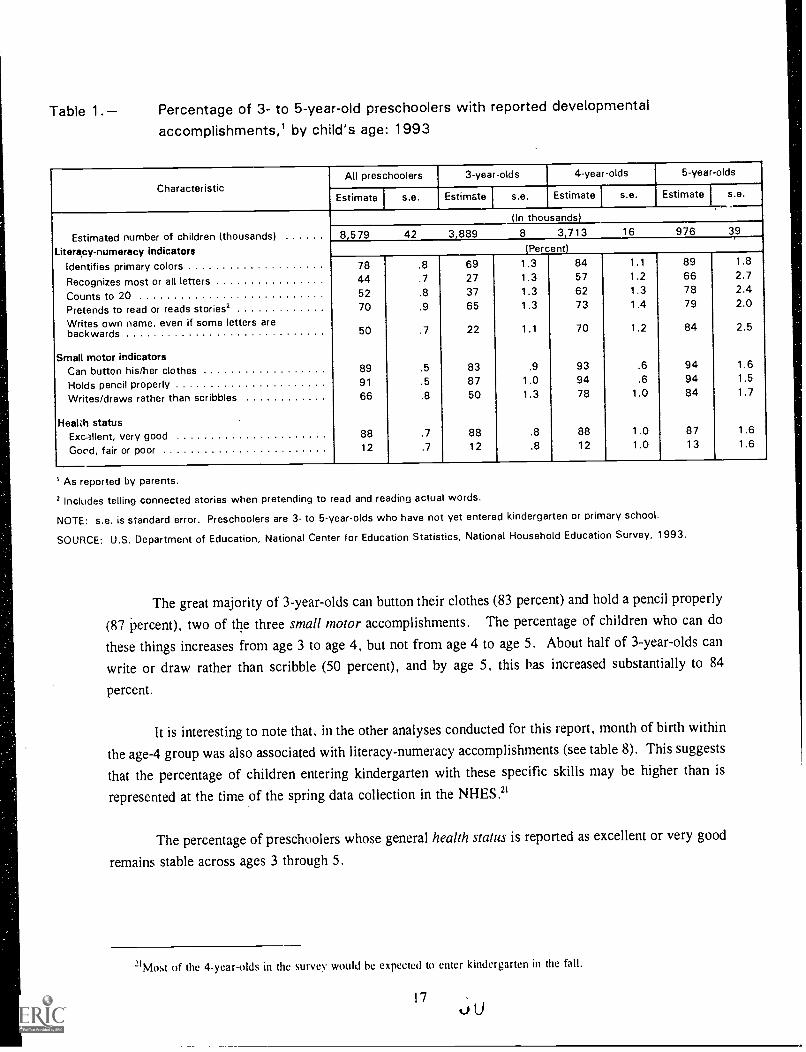
Table 1.- Percentage of 3- to 5-year-old preschoolers with reported developmental
accomplishments,' by child's age: 1993
CharacteristicAll preschoolers 3-year-olds 4-year-olds 5-year-olds
Estimate I s.e. Estimate I s.e. Estimate I s.e. Estimate I s.e.
(In thousands)
Estimated number of children (thousands) 8,579 42 3,889 8 3,713 16 976 39
Litera,cy-numeracy indicators (Percent)
Identifies primary colors 78 .8 69 1.3 84 1.1 89 1.8
Recognizes most or all letters 44 .7 27 1.3 57 1.2 66 2.7
Counts to 20 52 .8 37 1.3 62 1.3 78 2.4
Pretends to read or reads stories2 70 .9 65 1.3 73 1.4 79 2.0
Writes own name, even if some letters arebackwards 50 22 1.1 70 1.2 84 2.5
Small motor indicatorsCan button his/her clothes 89 .5 83 .9 93 .6 94 1.6
Holds pencil properly 91 .5 87 1.0 94 .6 94 1.5
Writes/draws rather than scribbles 66 .8 50 1.3 78 1.0 84 1.7
Heal:h statusExc.allent, very good 88 .7 88 .8 88 1.0 87 1.6
Good, fair or poor 12 .7 12 .8 12 1.0 13 1.6
As reported by parents.
Includes telling connected stories when pretending to read and reading actual words.
NOTE: s.e. is standard error. Preschoolers are 3- to 5-year-olds who have not yet entered kindergarten or primary school.
SOURCE: U.S. Department of Education, National Center for Education Statistics, National Household Education Survey, 1993.
The great majority of 3-year-olds can button their clothes (83 percent) and hold a pencil properly
(87 inrcent), two of the three small motor accomplishments. The percentage of children who can do
these things increases from age 3 to age 4, but not from age 4 to age 5. About half of 3-year-olds can
write or draw rather than scribble (50 percent), and by age 5, this has increased substantially to 84
percent.
It is interesting to note that, in the other analyses conducted for this report, month of birth within
the age-4 group was also associated with literacy-numeracy accomplishments (see table 8). This suggests
that the percentage of children entering kindergarten with these specific skills may be higher than is
represented at the time of the spring data collection in the NHES.'
The percentage of preschoolers whose general health status is reported as excellent or very good
remains stable across ages 3 through 5.
21Most of the 4-year-olds in the survey would he expected to enter kindergarten in the fall.
17
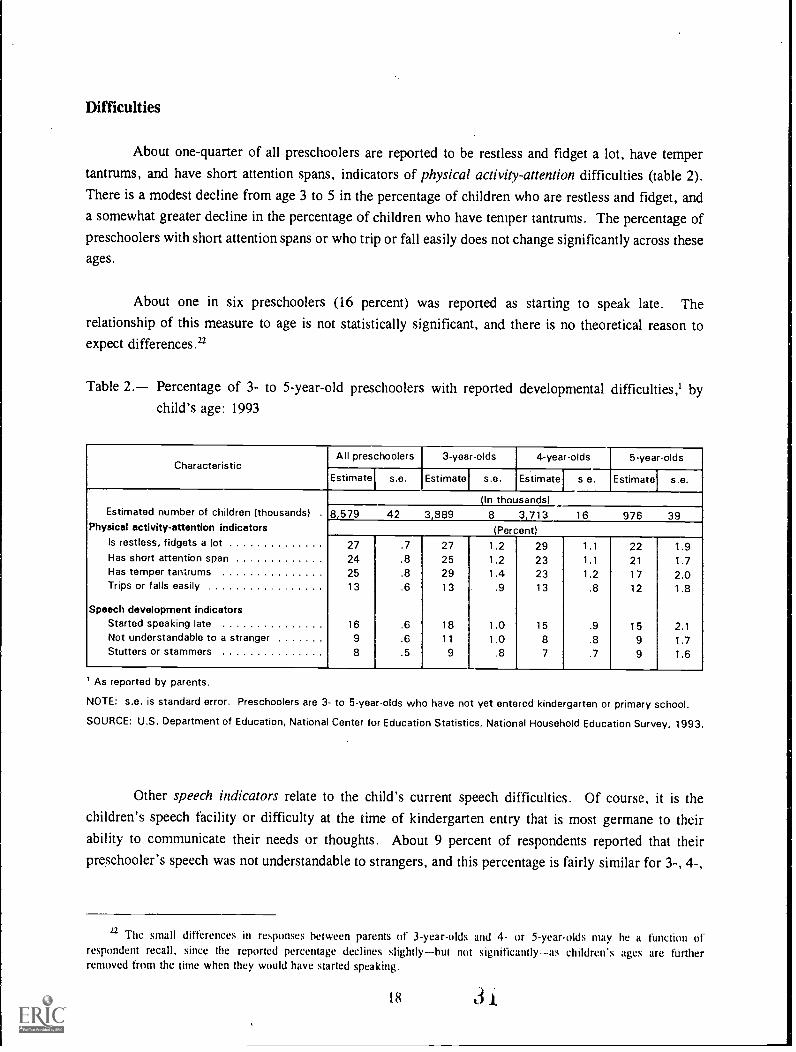
Difficulties
About one-quarter of all preschoolers are reported to be restless and fidget a lot, have tempertantrums, and have short attention spans, indicators of physical activity-attention difficulties (table 2).
There is a modest decline from age 3 to 5 in the percentage of children who are restless and fidget, anda somewhat greater decline in the percentage of children who have temper tantrums. The percentage of
preschoolers with short attention spans or who trip or fall easily does not change significantly across theseages.
About one in six preschoolers (16 percent) was reported as starting to speak late. Therelationship of this measure to age is not statistically significant, and there is no theoretical reason toexpect differences."
Table 2. Percentage of 3- to 5-year-old preschoolers with reported developmental difficulties,' bychild's age: 1993
CharacteristicAll preschoolers 3-year-olds 4-year-olds 5-year-olds
Estimate s.e. Estimate s.e. Estimate s e. Estimate s.e.
(In thousands)Estimated number of children (thousands) 8,579 42 3,389 8 3,713 16 976 39
Physical activity-attention indicators (Percent)Is restless, fidgets a lot 27 .7 27 1.2 29 1.1 22 1.9Has short attention span 24 .8 25 1.2 23 1.1 21 1.7Has temper tan1rums 25 .8 29 1.4 23 1.2 17 2.0Trips or falls easily 13 13 .9 13 .8 12 1.8
Speech development indicatorsStarted speaking late 16 .6 18 1.0 15 .9 15 2.1Not understandable to a stranger 9 .6 11 1.0 8 .8 9 1.7Stutters or stammers 8 .5 9 .8 7 .7 9 1.6
As reported by parents.
NOTE: s.e. is standard error. Preschoolers are 3- to 5-year-olds who have not yet entered kindergarten or primary school.
SOURCE: U.S. Department of Education, National Center for Education Statistics, National Household Education Survey, 1993.
Other speech indicators relate to the child's current speech difficulties. Of course, it is thechildren's speech facility or difficulty at the time of kindergarten entry that is most germane to theirability to communicate their needs or thoughts. About 9 percent of respondents reported that theirpreschooler's speech was not understandable to strangers, and this percentage is fairly similar for 3-, 4-,
22 The small differences in responses between parents of 3-year-olds and 4- or 5-year-olds may be a function ofrespondent recall, since the reported percentage declines slightlybut not significantlyas children's ages are furtherremoved from the time when they would have started speaking.
18 3i
and 5-year-old preschoolers. The percentage of preschoolers who stutter or stammer (8 percent) also does
not change significantly across these ages.
Summary
For the most part, the developmental accomplishments addressed in this report are associated with
the age of the child and are acquired by children as they grow older. A majority of preschoolers
demonstrate the accomplishments by age 4, and large majorities (more than three-quarters) acquire the
accomplishments by age 5.
The developmental difficulties examined here are exhibited by about one-twelfth to one-quarter
of all preschoolers. Unlike the temporal changes observed for accomplishments, some of the
developmental difficulties do not change from ages 3 to 5. Where differences are observed by age, they
are not large. It may be that a broader age range would show a decline in the prevalence of some of
these difficulties; that information is not available in the data set upon which this report is based.
Accomplishments and Difficulties of 4-Year-Old Preschoolers
In the next several sections, we discuss the developmental accomplishments and difficulties of 4-
year-olds. As discussed in the introduction to this report, these children represent the population about
to enter kindergarten. While not all 4-year-olds will have entered kindergarten in the school year
following the NHES:93 survey, the majority of these children will have done so. Therefore, their
accomplishments and difficulties provide a good indicat ion of the challenges that face teachers and schools
in meeting the needs of incoming kindergartners and preparing them for further schooling.
An Overview of 4-Year-Olds' Accomplishments and Difficulties
Figure 2 shows the prevalence of the selected accomplishments and difficulties among 4-year-old
preschoolers. Each of the selected accomplishments was reported for a majority of 4-year-olds, and
several of them were reported for three-fourths or more of the children. Nearly all of the children can
hold a pencil properly and button their clothes (94 and 93 percent, respectively), and 78 percent write
or draw rather than scribble. Among the literacy-numeracy indicators, 84 percent of 4-year-olds read
or tell connected stories while pretending to read, 73 percent identify primary colors, 70 percent write
their own names, 62 percent count to 20 or more, and 57 percent recognize most or all letters. A large
majority of 4-year-old preschoolers (88 percent) are reported by their parents to be in excellent or very
good health.
19 d
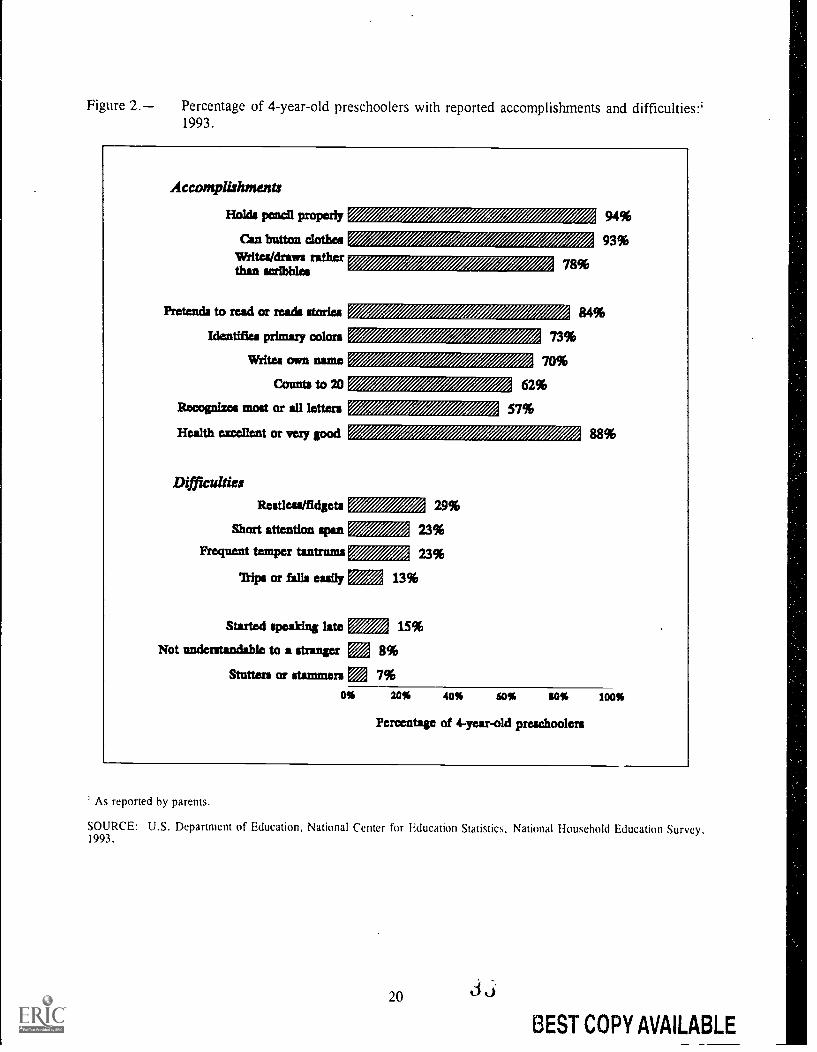
Figure 2. Percentage of 4-year-old preschoolers with reported accomplishments and difficulties:'1993.
Accomplishments
Holds pencil properly
Can button clothesWrites/draws ratherthan scribbles
Pretends to read or reads stories
Identifies primary colors
Writes tavn name
Counts to 20
Recognizes moat or all letters
Health excellent or very good
DifficultiesRestless/fidget§
Short attention span
Frequent temper tantrums
'Rips or falls eully
78%
94%
93%
84%
73%
70%
62%
57%
z
29%
23%
23%
13%
Started speaking late v , 15%
Not understandable to a stranger V 4 8%
Stutters or stammers 7%%
88%
0% 20% 40% 60% SO% 100%
Percentage of 4-year-old preschoolers
' As reported by parents.
SOURCE: U.S. Department of Education. National Center for Education Statistics, National Household Education Survey,1993.
20
BEST COPY AVAILABLE

Smaller percentages of the 4-year-olds were reported to have the developmental difficulties
studied, but they represent sizable minorities of prospective kindergartners. About one-fourth of the
children are reported to have the physical activity-attention indicators of restlessness and fidgeting (29
percent), a short attention span (23 percent), or temper tantrums (23 percent). A smaller percentage (13
percent) trip or fall easily.' About one-twelfth of 4-year-olds have current speech difficulties.
How does the prevalence of these accomplishments and difficulties vary among 4-year-olds of
different backgrounds? How are child characteristics and risk factors related to the various developmental
domains? The sections that follow present each of the developmental domains and their bivariate
relationships to selected child characteristics and risk factors.
Emerging Literacy and Numeracy
The majority of prospective kindergartners (4-year-old preschoolers) have demonstrated the
literacy and numeracy accomplishments included in the NHES;93. On average, 4-year-olds have
demonstrated 3.5 of the 5 accomplishments (table 3). However, the extent to which they have done so
is associated with a number of child characteristics and sociodemographic risk factors.
Sex. There are differences between boys and girls in emerging literacy and numeracy; higher
percentages of girls have demonstrated each of the accomplishments. The sex differences are not large,
however. About 5 to 7 percent more girls than boys identify colors, count to 20 or more, and read or
pretend to read. Girls are also more likely to recognize letters and write their own names by a slightly
larger margin (about 9 to 11 percentage points). On average, girls demonstrate 3.7 of the fiveaccoMplishments, whereas boys demonstrate fewer, 3.3 on average. These findings are consistent with
research demonstrating that boys score slightly but significantly lower on four commonly used tests of
school readiness (Ellwein et al. 1991).
While the selected items are indicators of physical activity-attention difficulties, readers should not assume that a child
who has any of these difficulties has an attention deficit disorder or is hyperactive. It is not intended that these items serve
as diagnostic tools for individual children.
21
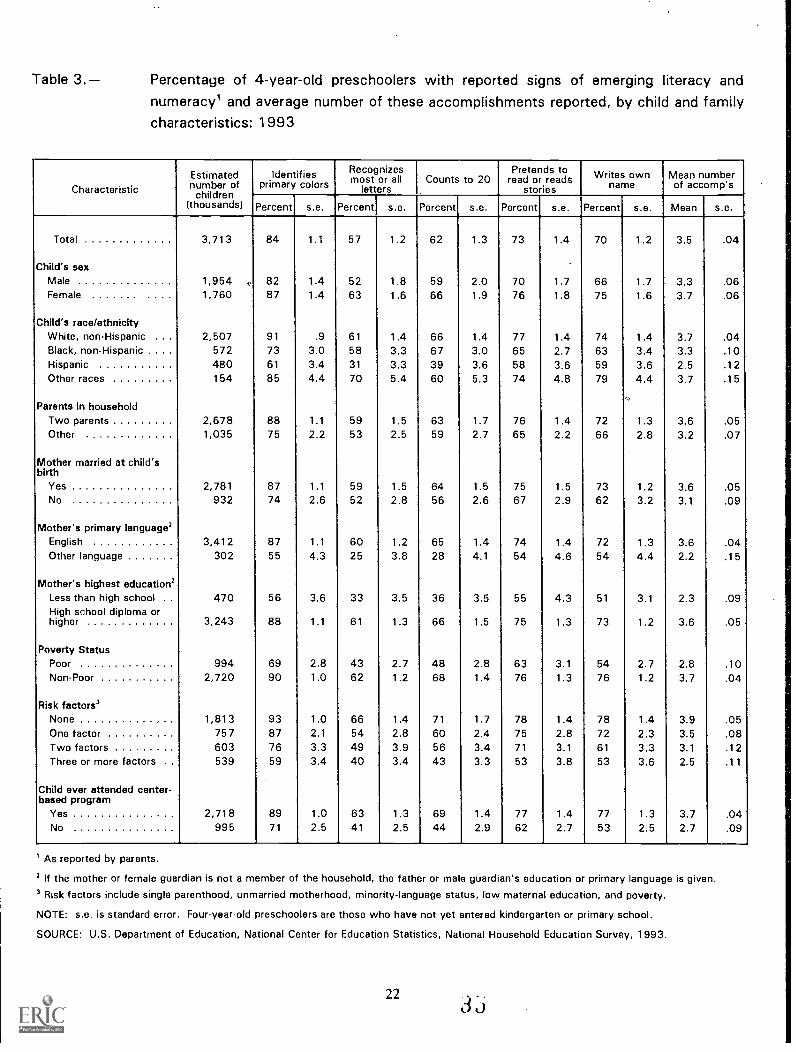
Table 3.- Percentage of 4-year-old preschoolers with reported signs of emerging literacy andnumeracy' and average number of these accomplishments reported, by child and familycharacteristics: 1993
CharacteristicEstimatednumber of
lden ifiesprimary colors
Recognizesmoesti3rr. all
I sCounts to 20
torPretendseadstoorrieresads
Writes ownname
Mean numberof accomp's
children(thousands) Percent s.e. Percent s.e. Percent s.e. Percent s.e. Percent s.e. Mean s.e.
Total 3,713 84 1.1 57 1.2 62 1.3 73 1.4 70 1.2 3.5 .04
Child's sex.
Male 1954, .,) 82 1.4 52 1.8 59 2.0 70 1.7 66 1.7 3.3 .06Female ....... .. 1,760 87 1.4 63 1.6 66 1.9 76 1.8 75 1.6 3.7 .06
Child's race/ethnicityWhite, non-Hispanic . . . 2,507 91 .9 61 1.4 66 1.4 77 1.4 74 1.4 3.7 .04Black, non-Hispanic . . . . 572 73 3.0 58 3.3 67 3.0 65 2.7 63 3.4 3.3 .10Hispanic 480 61 3.4 31 3.3 39 3.6 58 3.6 59 3.6 2.5 .12Other races 154 85 4.4 70 5.4 60 5.3 74 4.8 79 4.4 3.7 .15
Parents in householdTwo parents 2,678 88 1.1 59 1.5 63 1.7 76 1.4 72 1.3 3.6 .05Other 1,035 75 2.2 53 2.5 59 2.7 65 2.2 66 2.8 3.2 .07
Mother married at child'sbirth
Yes 2,781 87 1.1 59 1.5 64 1.5 75 1.5 73 1.2 3.6 .05No 932 74 2.6 52 2.8 56 2.6 67 2.9 62 3.2 3.1 .09
Mother's primary language2English 3,412 87 1.1 60 1.2 65 1.4 74 1.4 72 1.3 3.6 .04Other language 302 55 4.3 25 3.8 28 4.1 54 4.6 54 4.4 2.2 .15
Mother's highest education2Less than high school 470 56 3.6 33 3.5 36 3.5 55 4.3 51 3.1 2.3 .09High school diploma orhigher 3,243 88 1.1 61 1.3 66 1.5 75 1.3 73 1.2 3.6 .05
Poverty StatusPoor 994 69 2.8 43 2.7 48 2.8 63 3.1 54 2.7 2.8 .10Non-Poor 2,720 90 1.0 62 1.2 68 1.4 76 1.3 76 1.2 3.7 .04
Risk factors3None 1,813 93 1.0 66 1.4 71 1.7 78 1.4 78 1.4 3.9 .05One factor 757 87 2.1 54 2.8 60 2.4 75 2.8 72 2.3 3.5 .08Two factors 603 76 3.3 49 3.9 56 3.4 71 3.1 61 3.3 3.1 .12Three or more factors 539 59 3.4 40 3.4 43 3.3 53 3.8 53 3.6 2.5 .11
Child ever attended center-based program
Yes 2,718 89 1.0 63 1.3 69 1.4 77 1.4 77 1.3 3.7 .04No 995 71 2.5 41 2.5 44 2.9 62 2.7 53 2.5 2.7 .09
As reported by parents.
If the mother or female guardian is not a member of the household, the father or male guardian's education or primary language is given.
3 Risk factors include single parenthood, unmarried motherhood, minority-language status, low maternal education, and poverty.
NOTE: s.e. is standard error. Four-year-old preschoolers are those who have not yet entered kindergarten or primary school.
SOURCE: U.S. Department of Education, National Center for Education Statistics, National Household Education Survey, 1993.
223:)
Race and Ethnicity. Differences in literacy-numeracy accomplishments by race and Hispanic
origin are also observed. Black and white children are similar in the extent to which they recognize
letters and count to 20. However, black children are less likely than white children to identify primary
colors, read or pretend to read, or write their own names. Hispanic children are less likely than white
children to demonstrate each of the literacy-numeracy accomplishments. Differences between white and
Hispanic children are particularly largeat or near 30 percentage pointsfor identifying colors,recognizing letters, and counting to 20. Hispanic children also are less likely than black children to
identify colors, recognize letters, or count to 20. The relatively low percentages of Hispanic childrenwho demonstrate some of these accomplishments may be associated with the minority-language status of
their mothers, discussed later in this section.'
Among racial and ethnic groups, white children demonstrate more of the literacy-numeracy
accomplishments (3.7 of the 5), followed by black children (3.3), and Hispanic children (2.5). However,
being of Hispanic heritage makes less difference and being black or of another race other than white is
not significant when other factors (e.g., risk factors) are accounted for in multivariate analyses (table 8,
discussed below).
Sociodemographic Risk Factors. As discussed in an earlier section of this report (see page 6),
several sociodemographic risk factors were selected for this analysis. These include family factors
(parents in the household, mother's marital status at the time of the child's birth, and the mother's
primary language) and socioeconomic factors (maternal education and poverty status). While all of the
individual risk factors are not significantly related to all of the literacy-numeracy indicators, each factor
and the cumulative number of risks are significantly related to the number of literacy-numeracy
accomplishments .
Those children who live with two parents are more likely to identify primary colors and read or
pretend to read than children who live in single-parent or other households.25 Children in two-parenthouseholds also demonstrate more accomplishments (3.6, on average) than children in other households
(3.2).
24 Interviews were conducted in both English and Spanish. Parents were not asked whether children had demonstrated their
knowledge of colors, letters, and so on in English.
25 Children who live in circumstances other than two-parent families are grouped together. Two-parent families may
include birth, adoptive, or step-parents. Other households may include single-parent families, grandparents raising their
grandchildren, and so on.
23(-1) t)
Preschoolers whose mothers were married at the time the child was born are more likely toidentify colors, recognize most or all letters, count to 20, read or pretend to read, and write their own
names. Children of mothers who were married when the child was born also demonstrate more literacy-.
numeracy accomplishments (3.6, on average) than other 4-year-olds (3.1).
Children of non-English-speaking mothers (72 percent of whom were Hispanic) are far less likely
to demonstrate each of the accomplishments than children of English-speaking mothers, and many of the
differences are substantial. For example, 87 percent of 4-year-olds of English-speaking mothers identify
primary colors, whereas only 55 percent of others do so. Nearly three-fourths of 4-year-olds of English-
speaking mothers write their own names, compared with only 54 percent of 4-year-old children oflanguage minority mothers.' The difference in the average number of accomplishments is alsosubstantial: 3.6 for children of English-speaking mothers versus 2.2 for other children.
The level of maternal education is strongly related to each of the literacy-numeracy
accomplishments. Differences of 20 to 32 percentage points are observed in the percentages of children
who have demonstrated each of the accomplishments. Slightly more than half of children whose mothers
did not finish high school identify primary colors, read or pretend to read, or write their names, andabout one-third recognize most or all letters or count to 20 or more. In contrast, 61 to 88 percent of 4-year-old preschoolers whose mothers finished high school or more education have acquired theseaccomplishments. The difference in the average number of accomplishments is significant: 2.3 forchildren whose mothers did not complete high school or an equivalency certificate compared with 3.6 for
children whose mothers completed high school.
Four-year-olds living in poverty' are less likely than other children to demonstrate each of theliteracy-numeracy accomplishments. As differences associated with maternal education and maternal
language status are significant, so are differences between children who are poor those who are not,ranging from 13 percentage points (for reading or pretending to read) to 22 percentage points (for writing
one's own name). Whereas two-thirds of children who are not poor could count to 20 or mor, less thanhalf of the poor children could do so. Although 62 percent of 4-year-olds who are not poor couldrecognize most letters, 43 percent of the poor could. In addition, poor children demonstrate fewer of the
accomplishments (2.8 of the five measures, on average) compared with other children (3.7).
Cumulative Risk Factors. Slightly more than half of 4-year-old preschoolers have at least one
of the five risk factors, namely, coming from a family whose income is below the poverty level, having
parents who have not completed high school, having been born to an unmarried mother, living in asingle-parent family, or having a mother who speaks a language other than English at home. About 20
26Interviews were conducted in English and Spanish tor the NIIES:93. Those children residing in households in which no
parent or guardian spoke English or Spanish well enough to complete the interview could not he included in this study.
27See the methodology section of this report for a discussion of the poverty measure.
24
percent have one risk factor, about 16 percent have two risk factors, and about 15 percent have three or
more.28 The cumulative risk index is related to each of the five literacy-numeracy accomplishments.
Children with none of the risk factors are more likely to demonstrate each of the literacy-numeracy
accomplishments than are children with one or more of the risk factors. Children with three or more risk
factors show about two-thirds the number of literacy-numeracy accomplishments (2.5, on average) of
children with no risk factors (3.9). These findings are consistent with research demonstrating a linear
relationship between the numbers of risk factors children experience and their verbal IQ scores and social
adjustment (cf. Sameroff et al. 1987).
Center-Basfgl Program Participation. Four-year-old preschoolers who have attended center-
based early childhood programs (Head Start programs, nursery schools, preschools, prekindergartens,
or day care centers) are more likely to exhibit each of the literacy-numeracy accomplishments than those
who have not attended such programs. Some of the differences are fairly large. For example, while 89
percent of 4-year-olds who had ever attended a center-based program could identify the primary colors,
this was true for only 71 percent of those who had not attended center-based, programs. Differences
ranging from 15 to 25 percentage points are observed for other accomplishments. In addition, those who
had attended centers had exhibited, on average, 3.7 of the five literacy-numeracy accomplishments
studied, compared with an average of 2.7 among other 4-year-olds.
Small Motor Accomplishments
Small motor skills are essential to the accomplishment of academic and preacademic tasks such
as using pencils and writing one's own name, and are important aspects of self-maintenance capabilities
(e.g., buttoning clothes) that children are expected to acquire as they grow older. Compared to the
literacy-numeracy domain, the relationships of child characteristics and risk factors to the small motor
accomplishments is less uniform. There is little notable variation across groups in the skills of using a
pencil or buttoning clothes. At-risk children are not consistently behind in these skills, nor are not-at-risk
children consistently ahead. Nearly all 4-year-olds can do these things. On the other hand, findings for
writing or drawing rather than scribbling are more similar to the pattern of variation seen with indicators
in the literacy-numeracy domain. The Mean number of small motor accomplishments that children
demonstrate is significantly related to some child characteristics and risk factors, but he differences are
extremely small: the reader will note that the means are all within 0.2 of one another (table 4).
Sex. As was observed in the previous section on literacy-numeracy accomplishments, girls have
a small advantage over boys in the acquisition of small motor skills (table 4). The 4-year-old girls are
more likely than boys to be able to button their clothes, hold a pencil properly, and write or draw rather
than scribble. The mean number of accomplishments, that is, the number of these three skills that
2KThe percentage of children with more than three risk factors was relatively small. As a result, values of 3, 4, and 5 were
combined for presentation.
2536
children have demonstrated, on average, is slightly but significantly higher for girls than for boys (2.6versus 2.7).
Race and Ethnicity. The differences by race and Hispanic origin that were observed for literacy-
numeracy accomplishments are not observed, in general, for the selected small motor skills. Black
children are slightly more likely than white children to be able to button their clothes, but are very similarto white children in the percentages that hold a pencil properly or write or draw rather than scribble.
Hispanic children are similar to white children in their ability to button their clothes, and are similar toboth white and black children in their ability to hold a pencil. Hispanic children are, however, less likelyto write or draw rather than scribble. The mean number of small motor accomplishments was the samefor white and black 4-year-olds, 2.7 out of 3. The mean for Hispanics was slightly but significantly less(2.5). In multivariate analyses, the effects of race and Hispanic origin were no longer statisticallysignificant when the risk factors were introduced into the models (table 8, discussed below).
26
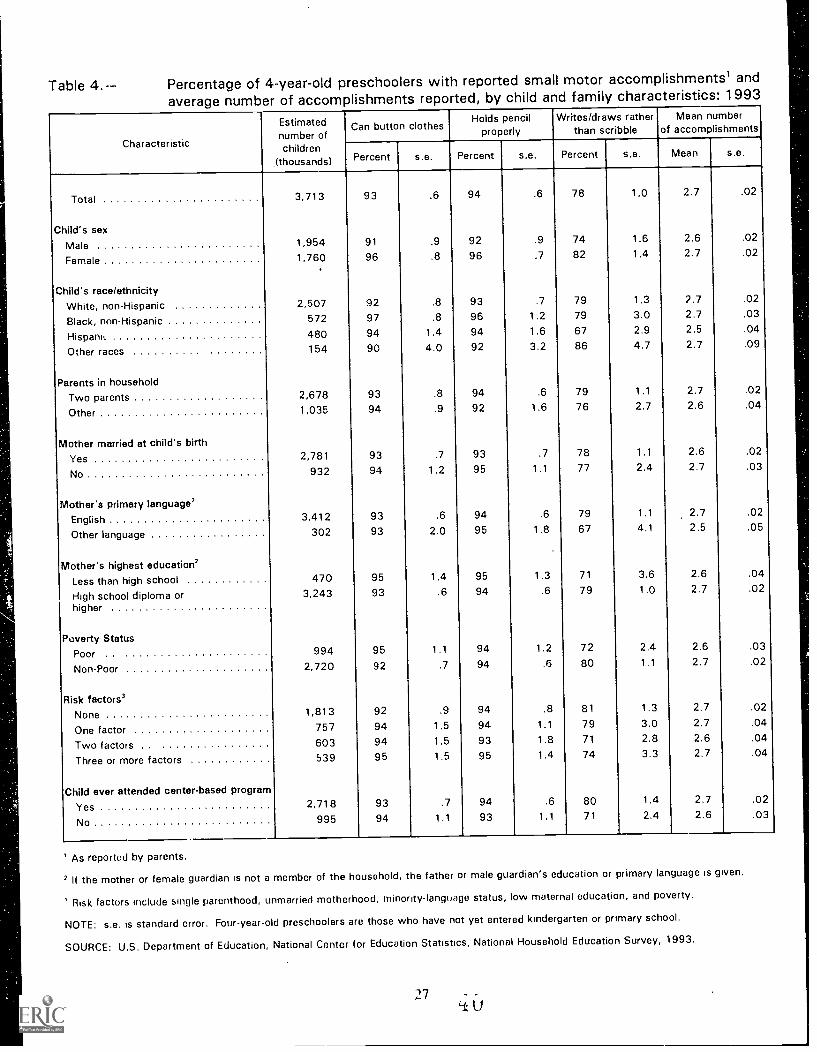
Table 4.-- Percentage of 4-year-old preschoolers with reported small motor accomplishments' andaverage number of accomplishments reported, by child and family characteristics: 1993
Characteristic
Estimatednumber of
Can button clothesHolds pencil
properlyWrites/draws rather
than scribbleMean number
of accomplishments
children(thousands) Percent s.e. Percent s.e. Percent s.e. Mean s.e.
Total 3,713 93 .6 94 .6 78 1.0 2.7 .02
Child's sexMale 1,954 91 .9 92 .9 74 1.6 2.6 .02
Female 1,760 96 .8 96 .7 82 1.4 2.7 .02
Child's race/ethnicityWhite, non-Hispanic 2,507 92 .8 93 .7 79 1.3 2.7 .02
Black, non-Hispanic 572 97 .8 96 1.2 79 3.0 2.7 .03
Hispanii 480 94 1.4 94 1.6 67 2.9 2.5 .04
Other races 154 90 4.0 92 3.2 86 4.7 2.7 .09
Parents in household
Two parents 2,678 93 .8 94 .6 79 1.1 2.7 .02
Other 1,035 94 .9 92 1.6 76 2.7 2.6 .04
Mother married at child's birthYes 2,781 93 .7 93 .7 78 1.1 2.6 .02
No 932 94 1.2 95 1.1 77 2.4 2.7 .03
Mother's primary language'English 3,412 93 .6 94 .6 79 1.1 2.7 .02
Other language 302 93 2.0 95 1.8 67 4.1 2.5 .05
Mother's highest education'Less than high school 470 95 1.4 95 1.3 71 3.6 2.6 .04
High school diploma orhigher
3,243 93 .6 94 .6 79 1.0 2.7 .02
Poverty StatusPoor 994 95 1.1 94 1.2 72 2.4 2.6 .03
Non-Poor 2,720 92 .7 94 .6 80 1.1 2.7 .02
Risk factors'None 1,813 92 .9 94 .8 81 1.3 2.7 .02
One factor 757 94 1.5 94 1.1 79 3.0 2.7 .04
Two factors 603 94 1.5 93 1.8 71 2.8 2.6 .04
Three or more factors 539 95 1.5 95 1.4 74 3.3 2.7 .04
Child ever attended center-based program
Yes 2,718 93 .7 94 .6 80 1.4 2.7 .02
No 995 94 1.1 93 1.1 71 2.4 2.6 .03
As reported by parents.
If the mother or female guardian is not a member of the household, the father or male guardian's education or primary language is given.
' Risk factors include single parenthood, unmarried motherhood, minonty-language status, low maternal education, and poverty.
NOTE: s.e. is standard error. Four-year-old preschoolers are those who have not yet entered kindergarten or primary school.
SOURCE: U.S. Department of Education, National Center for Education Statistics, National Household Education Survey, 1993.
27
Sociodemographic Risk Factors. The selected risk factors, many of which wet e issociated witheach of the literacy-numeracy accomplishments, show a very different pattern of association with thesmall motor skills (table 4). None of the risk factors is significantly associated with the 4-year-olds'abilities to hold a pencil. Although parents in the household, poverty status, and cumulative risk factorsare associated with children's ability to button their clothes, differences are small.
The relationships of some of the risk factors to the 4-year-olds' ability to write or draw ratherthan scribble are similar to those observed for the literacy-numeracy indicators. Specifically, childrenwhose mothers' primary language is not English, whose mothers did not finish high school, and who arepoor are less likely to write or draw. However, the mother's marital status at the time of the child's birthand the number of parents who live in the household are not associated with the 4-year-olds' ability to
write or draw. The cumulative number of risk factors is also associated with the ability to write or draw.While the percentage of children who can do so is lower for children with two risk factors than forchildren with no risk factors, the percentage does not decline significantly as the number of risk factorsincreases.
Center-Based Program Participation. The child's attendance at a center-based program is notrelated to a child's ability to button his/her clothes or hold a pencil properly. This may be because morethan 80 percent of children are able to do these things at age 3 (see table 1) and, therefore, many maydo so before entering a center-based program. Center-based program participation is positively relatedto a child's ability to write or draw rather than scribble. Those who have ever attended such a programare more likely to write or draw (80 percent compared with 71 percent).
The differences in the relationships of the selected risk factors and center-based programparticipation to the child's ability to write or draw may reflect a close relationship of this measure to theliteracy-numeracy dimension. While writing or drawing rather than scribbling is a measure of fine motorcontrol and does not have a specific content dimension (e.g., spelling words), this skill is associato.d tosome degree with emerging literacy and is associated with perceptual development. In the analysiz; ofthe correlations among the accomplishments and difficulties items, the ability to write or draw correlatessignificantly with both those items in the small motor cluster and those in the literacy-numeracy cluster(not shown in tables).
Physical Activity-Attention Indicators
Four indicators of physical activity-attention difficulties are included in this analysis: the childbeing restless or fidgeting, having a short attention span, having frequent temper tantrums, and trippingor falling easily. These measures represent "behavioral dimensions that are important to adaptation tosociety and to school (Pellegrini and Horvat 1995)." Each of these characteristics are reported to applyto only a minority of children, with the most common (restlessness) applying to less than 30 percent of
28
the 4-year-old preschoolers. The average 4-year-old is said to have none of the characteristics. In
general, these indicators are related to sex and several of the selected measures of risk (table 5).
Sex. Boys are more likely than girls to be restless or fidget, to have short attention spans, and
to trip or fall easily. There is no difference between boys and girls in having temper tantrums. On
average, boys exhibit one (1.0) of these four characteristics; for girls, the average is slightly less (.8)."
These findings are consistent with extant research indicating that boys tend to be overrepresented among
children diagnosed as having behavioral problems in general and the attention deficit-hyperactivity
disorder in particular (Achenbach 1982; Rutter, Tizard, and Whitmore 1970; Sattlei 1992).
Race and Ethnicity. According to their parents, Hispanic children are considerably more likely
than either white or black children to exhibit restlessness or fidgeting, a short attention span, and temper
tantrums. Race is not associated with the child's tendency to trip or fall easily; however, Hispanic
children are more likely than non-Hispanic white children to have this difficulty. On average, Hispanic
children exhibit 1.4 of these difficulties, compared to just under 1 among white and black children (.8
and .9, respectively). When risk factors are included in multivariate analyses, sex and Hispanic origin
are found to be associated with physical activity-attention difficulties; boys are more likely to demonstrate
the physical activity-attention difficulties than girls, and Hispanic children are more likely to demonstrate
them than non-Hispanic children. Race is not a predictor of the physical activity-attention score, when
the risk factors are controlled (see table 8, discussed below).
"Note that the cumulative number in this domain refers to the number of difficulties that were reported out of the group of
four.
29
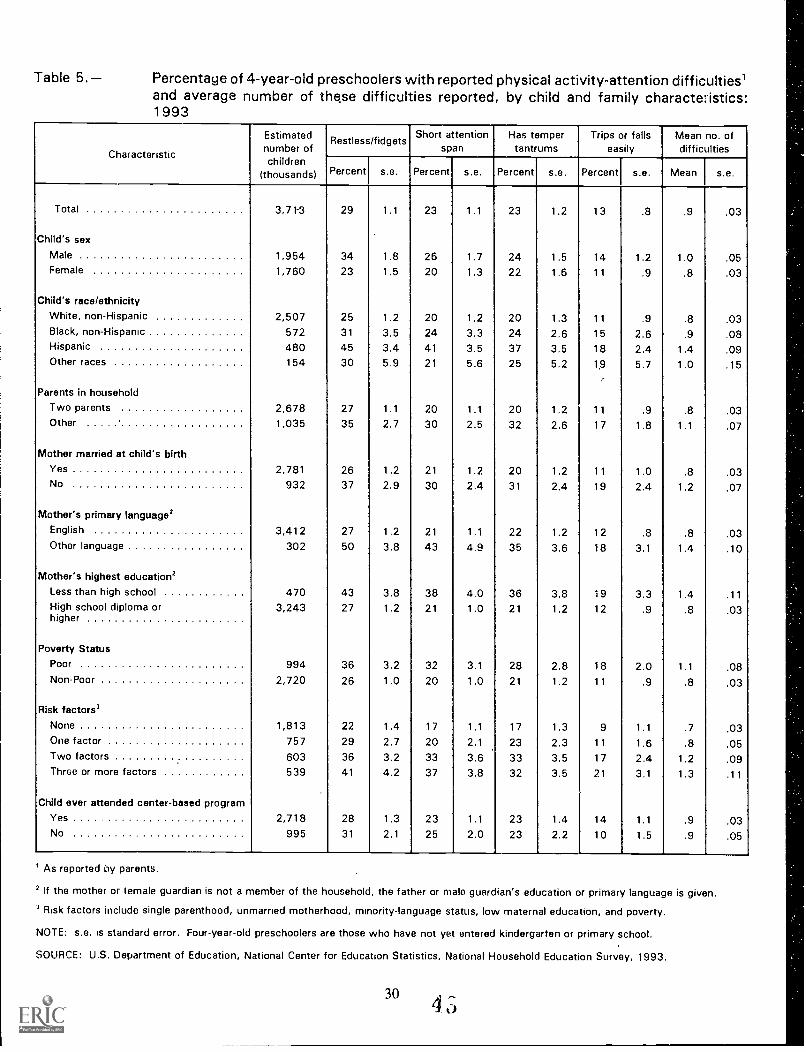
Table 5. - Percentage of 4-year-old preschoolers with reported physical activity-attention difficulties'and average number of these difficulties reported, by child and family charactejstics:1 993
Characteristic
Estimatednumber of
Restless/fidgetsShort attention
spanHas temper
tant urnsTrips or falls
easilyMean no. ofdifficulties
children(thousands) Percent s.e. Percent s.e. Percent s.e. Percent s.e. Mean s.e.
Total 3,71-3 29 1.1 23 1.1 23 1.2 13 . . .03
Child's sexMale 1,954 34 1.8 26 1.7 24 1.5 14 1.2 1.0 .05Female 1,760 23 1.5 20 1.3 22 1.6 11 .9 .8 .03
Child's race/ethnicityWhite, non-Hispanic 2,507 25 1.2 20 1.2 20 1.3 11 .9 .8 .03Black, non-Hispanic 572 31 3.5 24 3.3 24 2.6 15 2.6 .9 .08Hispanic 480 45 3.4 41 3.5 37 3.5 18 2.4 1.4 .09Other races 154 30 5.9 21 5.6 25 5.2 19 5.7 1.0 .15
Parents in householdTwo parents 2,678 27 1.1 20 1.1 20 1.2 11 .9 .8 .03Other 1,035 35 2.7 30 2.5 32 2.6 17 1.8 1.1 .07
Mother married at child's birthYes 2,781 26 1.2 21 1.2 20 1.2 11 1.0 .8 .03No 932 37 2.9 30 2.4 31 2.4 19 2.4 1.2 .07
Mother's primary language2English 3,412 27 1.2 21 1.1 22 1.2 12 .8 .8 .03Other language 302 50 3.8 43 4.9 35 3.6 18 3.1 1.4 .10
Mother's highest education2Less than high school 470 43 3.8 38 4.0 36 3.8 19 3.3 1.4 .11High school diploma orhigher
3,243 27 1.2 21 1.0 21 1.2 12 .9 .8 .03
Poverty StatusPoor 994 36 3.2 32 3.1 28 2.8 18 2.0 1.1 .08Non-Poor 2,720 26 1.0 20 1.0 21 1.2 11 .9 .8 .03
Risk factors'None 1,813 22 1.4 17 1.1 17 1.3 9 1.1 .7 .03One factor 757 29 2.7 20 2.1 23 2.3 11 1.6 .8 .05Two factors 603 36 3.2 33 3.6 33 3.5 17 2.4 1.2 .09Three or more factors 539 41 4.2 37 3.8 32 3.5 21 3.1 1.3 .11
Child ever attended center-based programYes 2,718 28 1.3 23 1.1 23 1.4 14 1.1 .9 .03No 995 31 2.1 25 2.0 23 2.2 10 1.5 .9 .05
As reported by parents.
2 If the mother or female guardian is not a member of the household, the father or male guardian's education or primary language is given.
3 Risk factors include single parenthood, unmarried motherhood, minority-language status, low maternal education, and poverty.
NOTE: s.e. is standard error. Four-year-old preschoolers are those who have not yet entered kindergarten or primary school.
SOURCE: U.S. Department of Education, National Center for Education Statistics, National Household Education Survey, 1993.
30 ,
4 5
Sociodemographic Risk Factors. In general, each of the selected risk factors is associated with
each of the physical activity-attention indicators. Four-year-old preschoolers who live in two-parent
households, whose mothers were married when they were born, whose mothers speak English in the
home, whose mothers completed high school, and who are not poor are less likely to exhibit each of the
difficulties.3° For example, more than a third of poor preschoolers are reported to be very restless and
nearly a third are reported to have short attention spans. By contrast, about one-quarter of children who
are not poor are said to be very restless, and one-fifth to have short attention spans. Also, the average
number of difficulties is greater for at-risk children for each of the individual risk measures.
The cumulative number of risk factors is also associated with each of the physical activity-attcntion indkators. Those 4-year-olds who have none of the selected risk factors are less likely than
those with risk factors to exhibit each of these difficulties. In addition, the percentage of children
demonstrating these difficulties is greater among children with higher numbers of risk factors.
Center-Based Program Participation. None of the four measures of physical activity-attention
difficulties are associated with participation in center-based programs.
Speech Development
Three measures of speech development difficulty are included in this analysis: starting to speak
late, not being understandable to a stranger, and stuttering or stammering. Each of these speech problems
is relatively rare, with the most common (starting to speak late) applying to 15 percent of 4-year-old
preschoolers. The average number of speech difficulties reported per child is well under one (mean =0.3). The relationships between these speech indicators and the child characteristics and risk factors are
mixed. That is, while few child and family characteristics are associated with speaking late, sex and
some risk factors are associated with a child's speech being understandable, and additional characteristics
are associated with stuttering and stammering (table 6).
KThere is an exception, however. concerning tripping and fallingchildren whose mothers have minority-language statusare not significantly more likely to trip or fall.
31
4 4
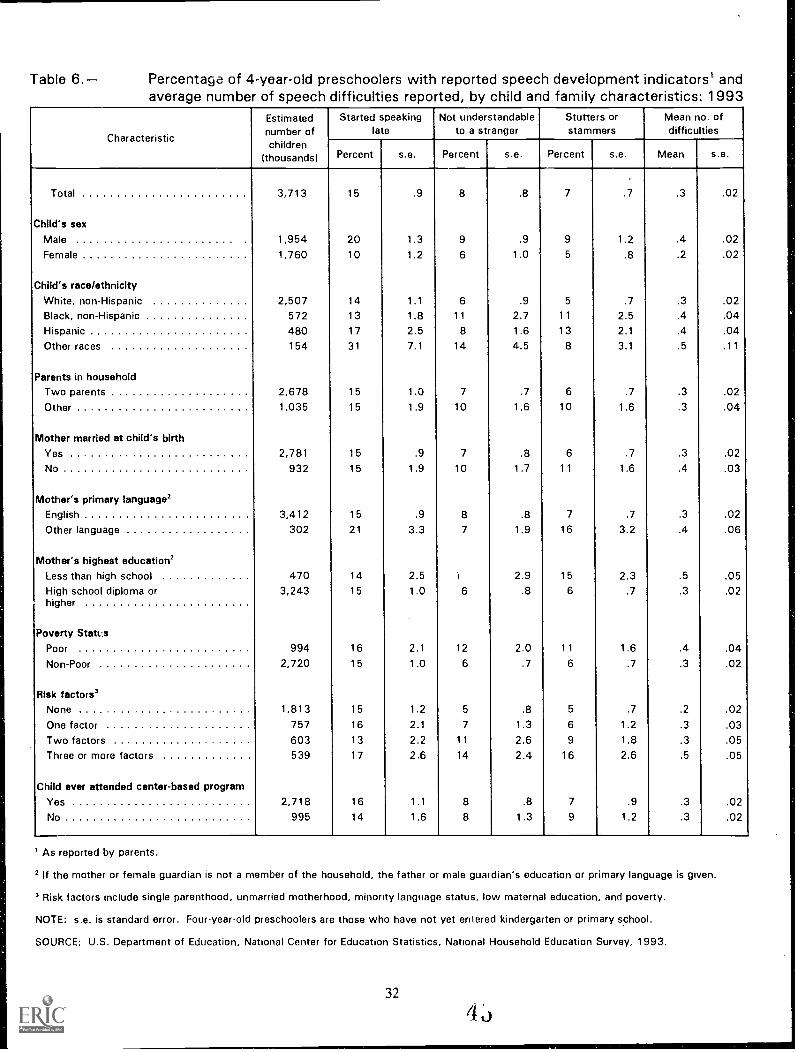
Table 6.- Percentage of 4-year-old preschoolers with reported speech development indicators' andaverage number of speech difficulties reported, by child and family characteristics: 1993
Characteristic
Estimatednumber of
Started speakinglate
Not understandableto a stranger
Stutters orstammers
Mean no. ofdifficulties
children(thousands) Percent s.e. Percent s.e. Percent s.e. Mean s.e.
Total 3,713 15 .9 8 .8 7 .7 .3 .02
Child's sexMale 1,954 20 1.3 9 .9 9 1.2 .4 .02Female 1,760 10 1.2 6 1.0 5 .8 .2 .02
Child's race/ethnicityWhite, non-Hispanic 2,507 14 1.1 6 .9 5 .7 .3 .02Black, non-Hispanic 572 13 1.8 11 2.7 11 2.5 .4 .04Hispanic 480 17 2.5 8 1.6 13 2.1 .4 .04Other races 154 31 7.1 14 4.5 8 3.1 .5 .11
Parents in householdTwo parents 2,678 15 1.0 7 .7 6 .7 .3 .02Other 1,035 15 1.9 10 1.6 10 1.6 .3 .04
Mother married at child's birthYes 2,781 15 .9 7 .8 6 .7 .3 .02No 932 15 1.9 10 1.7 11 1.6 .4 .03
Mother's primary language2English 3,412 15 .9 8 .8 7 .7 .3 .02
Other language 302 21 3.3 7 1.9 16 3.2 .4 .06
Mother's highest education2Less than high school 470 14 2.5 I 2.9 15 2.3 .5 .05High school diploma orhigher
3,243 15 1.0 6 .8 6 .7 .3 .02
Poverty Statt.sPoor 994 16 2.1 12 2.0 11 1.6 .4 .04Non-Poor 2,720 15 1.0 6 .7 6 .7 .3 .02
Risk factors 3
None 1,813 15 1.2 5 .8 5 .7 .2 .02One factor 757 16 2.1 7 1.3 6 1.2 .3 .03Two factors 603 13 2.2 11 2.6 9 1.8 .3 .05Three or more factors 539 17 2.6 14 2.4 16 2.6 .5 .05
Child ever attended center-based program
Yes 2,718 16 1.1 8 .8 7 .9 .3 .02No 995 14 1.6 8 1.3 9 1.2 .3 .02
As reported by parents.
2 If the mother or female guardian is not a member of the household, the father or male guardian's education or primary language is given.
3 Risk factors include single parenthood, unmarried motherhood, minority language status, low maternal education, and poverty.
NOTE: s.e. is standard error. Four-year-old preschoolers are those who have not yet entered kindergarten or primary school.
SOURCE: U.S. Department of Education, National Center for Education Statistics, National Household Education Survey, 1993.
32

Sex. Males are about twice as likely as females to have started speaking late (20 percent
compared with 10 percent). Sex is also associated with a child's being understandable to a stranger and
stuttering or stammering, although the differences are not large. The average number of speech
difficulties is larger for boys (.4 of the three) than for girls (.2).
Race and Ethnicity. Race and Hispanic origin are not associated with whether a child started
speaking late or whether a child is understandable to a stranger. Race and Hispanic origin are related
to whether a child stutters or stammers; white 4-year-olds are less likely to be reported as doing so than
black or Hispanic children. The mean number of speech difficulties is very similar for white, black, and
Hispanic 4-year-olds (.3, .4, and .4, respectively).
Sociodemographic Risk Factors. Many of the relationships between the sociodemographic risk
factors and the selected speech indicators are not statistically significant. However, some of the factors
are related to a child's being understandable or a child's stuttering or stammering. Specifically, whether
the child's mother finished high school and the family's poverty status are related to a child's being
understandable and stuttering or stammering. Twice as many poor 4-year-olds as other 4-year-olds are
not understandable to a stranger (12 percent versus 6 percent) or stutter or stammer (11 versus 6 percent).
Having a mother with minority-language (i.e., one whose primary language in the home is not English)
is related to the child's starting to speak late and to stuttering or stammering.
The cumulative number of risk factors is not associated with whether a child started speaking late,
but is related to whether a child's speech is understandable to a stranger and whether he or she stutters
or stammers. Children with more risk factors are more likely to have these speech difficulties.
Health Status
Kindergarten teachers overwhelmingly rate being healthy, rested, and well nourished as essential
or very important for kindergarten entry (Heaviside and Farris 1993). While not directly comparable
with the measure used in the recent survey of kindergarten teachers, the general health status of children
as reported in this study is one important indicator of the incoming school population's condition. A
substantial majority of parents (88 percent) report that their 4-year-old's health is excellent or very good
(table 7). However, variation in health status is observed across the child characteristics and risk faciors
included in this analysis.
33 4 0
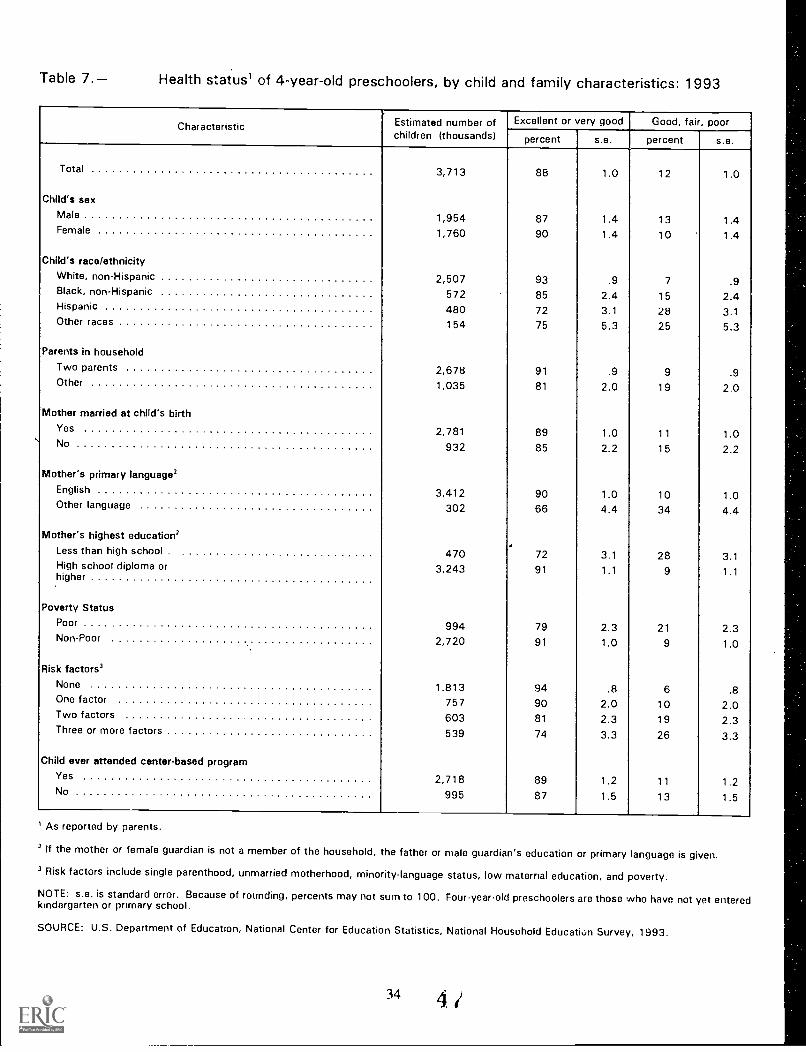
Table 7.- Health status' of 4-year-old preschoolers, by child and family characteristics: 1993
-
Characteristic Estimated number of Excellent or very good Good, fair, poorchildren (thousands) percent s.e. percent s.e.
Total 3,713 88 1.0 12 1.0
Child's sexMale 1,954 87 1.4 13 1.4Female 1,760 90 1.4 10 1.4
Child's race/ethnicityWhite, non-Hispanic 2,507 93 .9 7 .9Black, non-Hispanic 572 85 2.4 15 2.4Hispanic 480 72 3.1 28 3.1Other races 154 75 5.3 25 5.3
Parents in householdTwo parents 2,678 91 .9 9 .9Other 1,035 81 2.0 19 2.0
Mother married at child's birthYes 2,781 89 1.0 11 1.0No 932 85 2.2 15 2.2
Mother's primary language2English 3,412 90 1.0 10 1.0Other language 302 66 4.4 34 4.4
Mother's highest education2Less than high school . 470 72 3.1 28 3.1High school diploma orhigher
3,243 91 1.1 9 1.1
Poverty StatusPoor 994 79 2.3 21 2.3Non-Poor 2,720 91 1.0 9 1.0
Risk factors'None 1,813 94 .8 6 .8One factor 757 90 2.0 10 2.0Two factors 603 81 2.3 19 2.3Three or more factors 539 74 3.3 26 3.3
Child ever attended center-based programYes 2,718 89 1.2 11 1.2No 995 87 1.5 13 1.5
As reported by parents.
2 If the mother or female guardian is not a member of the household, the father or male guardian's education or primary language is given.
3 Risk factors include single parenthood, unmarried motherhood, minority-language status, low maternal education, and poverty.
NOTE: s.e. is standard error. Because of rounding, percents may not sum to 100. Four-year-old preschoolers are those who have not yet enteredkindergarten or primary school.
SOURCE: U.S. Department of Education, National Center for Education Statistics, National Household Educatic,n Survey, 1993.
34 4 /

Race and Ethnicity. The health status of white, black, and Hispanic children is different.
Parents report 93 percent of white 4-year-olds to be in excellent or very good health. The percentage
is lower for black children (85 percent) and lower still for Hispanic children (72 percent). Twice as many
black 4-year-olds (15 percent) and four times as many Hispanic 4-year-olds (28 percent) as white children
(7 percent) are reported as being in less than very good health. However, as in some other domains, no
relationship between race and health status is found for black children after controlling for risk factors
(tab1.e 8, discussed below).
Sociodemographic Risk Factors. Each of the five sociodemographic risk factors is related to
the health status of 4-year-old preschoolers. Children who do not live with two parents, whose mothers
did not finish high school, whose families are poor, whose mother's primary language is not English, and
whose mothers were not married when the child was born are less likely to be reported as being in
excellent or very good health. In fact, poor preschoolers are twice as likely to be in less than very good
health when compared with preschoolers who are not poor (21 percent versus 9 percent).
The greatest difference in the percentage of children in excellent or very good health is the
difference between children whose mothers' primary language is English and other children. This
relatic -olip remains after controlling for other risk factors (see table 8). This may be related to
differences in how English speakers and non-English speakers think about or perceive good health. Or
it may reflect a lack of access to health care because of minority-language status. In fact, responses to
other items in the NHES:93 interview indicate that 10 percent of preschoolers with mothers of minority-
language status do not have a regular health care provider for routine care such as checkups or shots,
compared with about half as many (5 percent) of the children whose mothers speak English primarily (not
shown in tables).
Center-Based Program Participation. No significant relationship is found between attendance
at a center-based program and a child's general health status.
Effects of Sociodemographic Risk Factors When Controlling
for Other Factors
One of the major questions addressed in this study is whether family risk factors that have been
found to be linked to learning difficulties after children start school are also associated with the
accomplishments and difficulties that children bring with them when they arrive at kindergarten. As
noted earlier, five sociodemographic risk factors were examined: low maternal education (less than a high
school education); family poverty status; the mother's minority-language status; the mother beinr
unmarried at the time of the child's birth; and the preschooler currently living with only one parent.
In the foregoing analyses, this research has addressed the accomplishments and difficulties of
preschoolers within specific developmental domains and has related them to child characteristics and
35
sociodemographic risk factors. In this section, the risk factors are assessed in terms of their relationships
with developmental indicators across domains, both as individual risk factors and as a group.
It is clear that the risk factors are associated with fewer accomplishments and more difficulties
in preschoolers who are about to enter kindergarten. The question now is whether these relationships aremaintained when related child and family characteristics are controlled. The control variables are: thechild's sex; month of birth; race and Hispanic origin; and the number of children under age 9 in thehousehold. If the sociodemographic risk factors are truly important for young children's development,
then they should continue to show relationships with the developmental accomplishments and difficulties
after these control variables are taken into account.
The next question is whether some family risk factors are more important than others in termsof their relationships with the accomplishments and difficulties of 4-year-old children. If so, which ones?Are some risk factors more important for particular developmental domains, or do they operate similarly
across domains? Last, does simply counting up the number of risks a child is subject to provide as strong
a relationship with development as procedures that give special weight to particular risks?
Relationships with Risk Factors as a Group
The sociodemographic risk factors as a group (low maternal education, poverty, mother'sminority-language status, unmarried mother, and single parenthood) are clearly related to three of thedevelopmental indexes, more ambiguously related to one of the indexes, and not related to the last index
(table 8). As evidenced in the increase in variance accounted for by the inclusion of these risk factors,they are related to the emerging literacy-numeracy score, the physical activity-attention score, and theindicator of general health problems. Furthermore, the risk factors operate in the manner anticipated;i.e., the presence of one or more risks is associated with fewer literacy-nutneracy accomplishments, more
signs of physical activity-attention difficulties, and an increased likelihood that the child is in less thanvery good health. This remains true when the related child and family characteristics are controlled. The
relationship is more marginal in the case of the speech difficulties index. The sociodemographic riskfactors are not related to the small motor development scale.
436
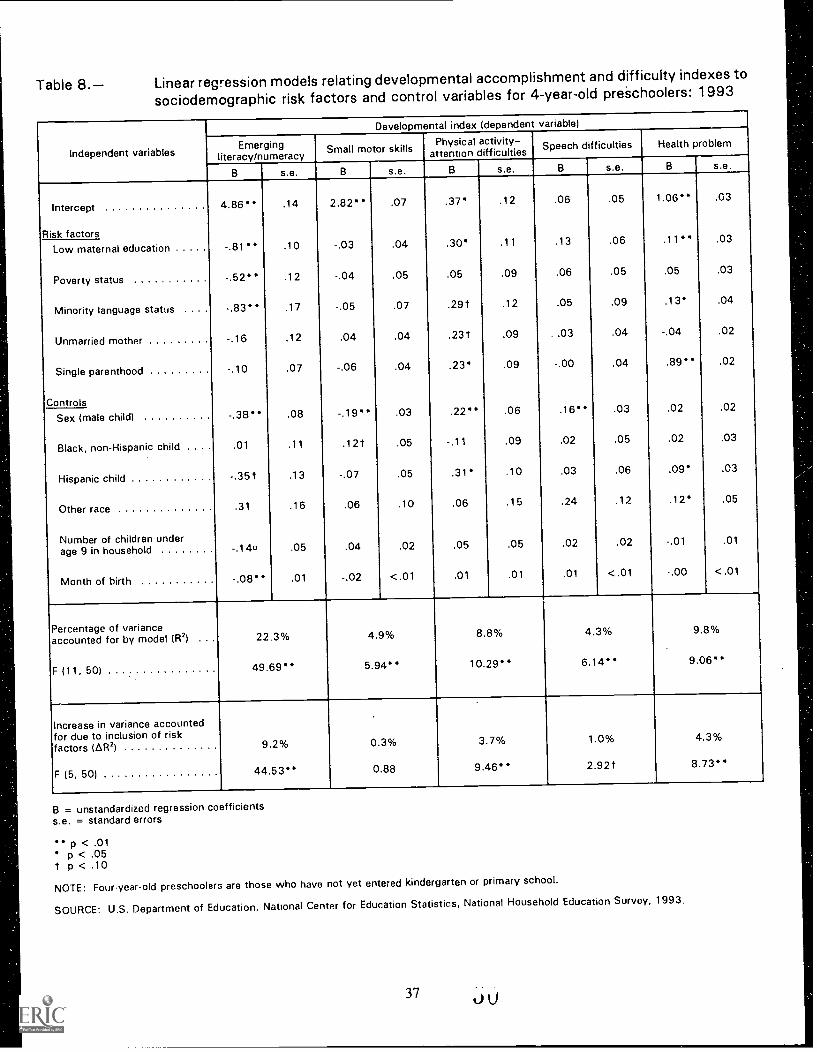
Table 8.- Linear regression models relating developmental accomplishment and difficulty indexes to
sociodemographic risk factors and control variables for 4-year-old preSchoolers: 1993
Developmental index (dependent variable)
Independent variablesEmerging
literacy/numeracySmall motor skills
Physical activity-attention difficulties
Speech difficulties Health problem
s.e.
Intercept 4.86 .14 2.82" .07 .37* .12 .06 .05 1.06" .03
Risk factorsLow maternal education -.81" .10 -.03 .04 .30* .11 .13 .06 .11" .03
Poverty status -.52" .12 -.04 .05 .05 .09 .06 .05 .05 .03
Minority language status . . . . -.83" .17 -.05 .07 .29 t .12 .05 .09 .13* .04
Unmarried mother -.16 .12 .04 .04 .23t .09 . .03 .04 -.04 .02
Single parenthood -.10 .07 -.06 .04 .23* .09 -.00 .04 .89" .02
ControlsSex (male child) -.38" .08 -.19" .03 .22" .06 .16" .03 .02 .02
Black, non-Hispanic child . .. . .01 .11 .12 t .05 -.11 .09 .02 .05 .02 .03
Hispanic child -.35 t .13 -.07 .05 .31 .10 .03 .06 .09* .03
Other race .31 .16 .06 .10 .06 .15 .24 .12 .12* .05
Number of children underage 9 in household -.140 .05 .04 .02 .05 .05 .02 .02 -.01 .01
Month of birth -.08 .01 -.02 < .01 .01 .01 .01 < .01 -.00 <.01
Percentage of varianceaccounted for by model (R2) . 22.3% 4.9% 8.8% 4.3% 9.8%
F (11, 501 49.69" 5.94" 10.29 6.14" 9.06"
Increase in variance accountedfor due to inclusion of risk
.
factors (AR2) 9.2% 0.3% 3.7% 1.0% 4.3%
F (5, 50) 44.53" 0.88 9.46" 2.92 t 8.73"
B = unstandardized regression coefficientss.e. = standard errors
p < .01p < .05
t p < .10
NOTE: Four-year-old preschoolers are those who have not yet entered kindergarten or primary school.
SOURCE: U.S. Department of Education, National Center for Education Statistics, National Household Education Survey, 1993.
37

Relationships with Individual Risk Factors
Our analyses shows that some risk factors are more important than others in terms of theirrelationship with the accomplishments and difficulties of 4-year-olds, but the identity of the related factorsvaries across the different developmental scales (table 8). With respect to the emerging literacy index,for example, the related factors are minority-language status, low maternal education, and poverty status.With respect to the physical activity-attention scale, the related factors are low maternal education, singleparenthood, minority-language status, and unmarried motherhood. However, the statistical reliability ofthe latter two factors is marginal. With respect to the general health problems indicator, the relatedfactors are single parenthood. minority-language status, and low maternal education.
A different sort of result is obtained for the speech difficulties index. Here, none of theindividual risk factors (table 8) has a relationship that is reliably greater than zero, although an indexformed by countinR the number of risk factors is related to the speech difficulties scale (table 9). In thecase of the small motor skills scale, neither any of the individual risk factors nor a count of the numberof risks to which the child is subject is related to the scale score.
Thus, across the five developmental domains, the most consistently detrimental factor is lowmaternal education, which is related to three of the developmental scales: emerging literacy, physicalactivity-attention difficulties, and health problems. Minority-language status is also related todevelopment in the same three domains, although its reliability is marginal in one of the domains(physical activity-attention difficulties). Single parenthood shows relationships in two domains: physicalactivity-attention and general health problems. After controlling for other factors, poverty status isrelated to development in only one domain, emerging literacy. Unmarried motherhood is alsosignificantly related to development in only one domain, physical activity-attention difficulties, and evenhere its reliability is marginal.
It is important to note that the various risk factors are intercorrelated. For example, a chi'dwhose mother had less than a high school education and was a single parent has a higher probability ofbeing in a poverty-level family. Likewise, a mother who was unmarried at the time of the child's birthhas a good chance of being a single parent when the child is a 4-year-old.' The stronger relationshipsthat low maternal education and single parenthood display might occur because they are root causes ofboth poverty and impaired child development. On the other hand, the stronger relationships might occurbecause these related factors are more stable over time or more reliably measured than poverty status orunmarried motherhood.
''Among the 2,000 4-year-old preschoolers in the survey, poverty ctatus correlates r = .34 with being in a single-parentfamily. r = .32 with the mother being unmarried at the child's birth, r .27 with having a mother who had not completedhigh school, and r .18 with having a mother who speaks a language other than English at home. The correlation betweenthe mother being unmarried at the child's birth and the child being in a single-parent family at the time of the survey is r =.44.
38
Relationships with Number of Risks
Does counting up the number of risks to which a child is subject provide as good a relationship
with developmental accomplishments and difficulties as analysis procedures that give special weight to
particular risk factors? A risk index based on a simple count of the number of risk factors for each child
is related to four of the five developmental scales: the emerging literacy scale, the physical activity-
attention difficulties scale, the speech difficulties scale, and the health problems indicator (table 9). The
relationship remains significant after controlling for the other child and family characteristics discussed
above. The risk index is not significantly related to the small motor skills scale. For the physical
activity-attention and speech difficulties scales, analyses that use the risk index are just as effective in
accounting for variations in the scales as analyses that give special weights to particular risks. On the
other hand, for the emerging literacy scale and the health problems indicator, analyses that take account
of which individual risk factors are involved account for more variation than analyses that use the risk
index.' For the small motor skills scales, neither the individual risk factors nor the risk index does much
to increase the amount of variation accounted for by the control variables.
Developmental Differences Associated with Participation in
Preschool Programs
In previous sections, the associations of developmental accomplishments and difficulties with
participation in center-based early childhood programs (such as day care centers, nursery schools,
preschools, and Head Start) are discussed for each domain. In this section, the findings across domains
are considered. The research questions addressed here are:
Do 4-year-olds who attend preschool programs show more literacy or small motoraccomplishments, or fewer physical activity-attention, speech, or health difficulties than
4-year-olds who do not attend preschool?
Does attending center-based programs make more of a difference in some developmental
domains than in others?
Are there indications that the benefits of preschool programs are greater for at-risk
children than for those not at risk?
To answer these questions, a variable was added to the analyses described above that indicates
whether or not each 4-year-old was then attending or had attended a center-based preschool or day care
program. If program attendance makes a difference, the participation variable should show a positive
"The increase in percent variance accounts for from using individual risk factors instead of the risk index is 3.3% for the
emerging literacy index and 1.7% for the health problem indicator. These differences are both statistically significant (F (4,
50) = 37.9 and 8.6, respectively, p < .01).
39
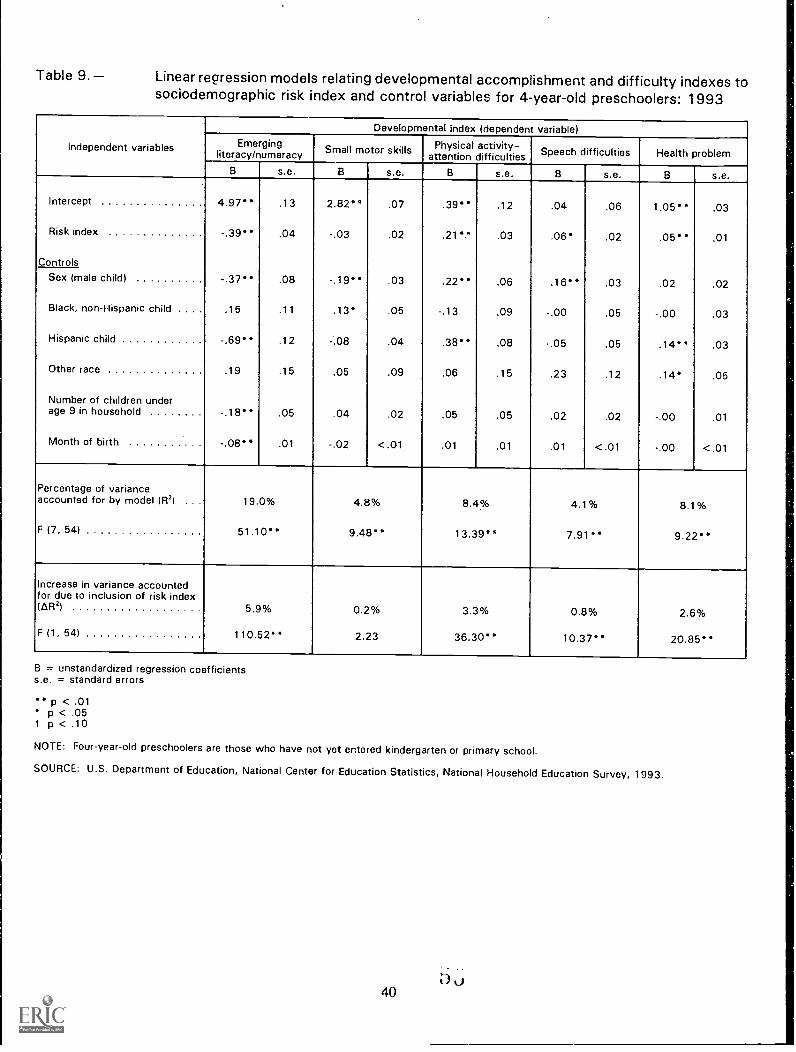
Table 9. Linear regression models relating developmental accomplishment and difficulty indexes tosociodemographic risk index and control variables for 4-year-old preschoolers: 1 993
Developmental index (dependent variable)
Independent variables Eme gingliteracy/numeracy Small motor skills Physical activity-
attention difficulties Speech difficulties Health problem
s.e.
Intercept 4.97" .13 2.82" .07 .39" .12 .04 .06 1.05" .03
Risk index -.39" .04 -.03 .02 .21`. .03 .06* .02 .05" .01
ControlsSex (male child) -.37" .08 -.19" .03 .22" .06 .16" .03 .02 .02
Black, non-Hispanic child .15 .11 .13* .05 -.13 .09 -.00 .05 -.00 .03
Hispanic child -.69" .12 -.08 .04 .38" .08 -.05 .05 .14" .03
Other race .19 .15 .05 .09 .06 .15 .23 .12 .14* .05
Number of children underage 9 in household -.18" .05 .04 .02 .05 .05 .02 .02 -.00 .01
Month of birth -.08" .01 -.02 <.01 .01 .01 .01 <.01 -.00 <.01
Percentage of varianceaccounted for by model (R2) 19.0% 4.8% 8.4% 4.1% 8.1%
F (7, 54) 51.10" 9.48" 13.39" 7.91" 9.22"
Increase in variance accountedfor due to inclusion of risk index(AR2) 5.9% 0.2% 3.3% 0.8% 2.6%
F (1, 54) 110.52" 2.23 36.30" 10.37" 20.65"
B = unstandardized regression coefficientss.e. = standard errors
p < .01p < .05
t p < .10
NOTE: Four-year-old preschoolers are those who have not yet entered kindergarten or primary school.
SOURCE: U.S. Department of Education, National Center for Education Statistics, National Household Education Survey, 1993.
LJu40
relationship with each of the developmental scales (i.e., it should be associated with more
accomplishments or, in the case of the difficulty scales, fewer difficulties). Also, the addition of the
participation variable should produce an increase in the amount of variation in each scale that is accounted
for, above that accounted for by the risk indei and control variables.
The analyses shows that preschool program participation has a clear and substantial effect on the
emerging literacy scores of 4-year-old preschoolers: Having attended such a program is associated with
a net increase of nearly one full accomplishment (.82) out of the five accomplishments in the scale. The
addition of the participation term also results in an increase in the variation in literacy scale scores
accounted for in the analysis, over and above that accounted for by the risk index and control variables
(table 10).
The results are different for the regression analyses done with the small motor accomplishment
count and the three developmental difficulty scale,,. In none of these other domains does preschool
attendance have a relationship with the scale score that is reliably greater than zero, nor does the addition
of the participation indicator produce an increase in the amount of variation accounted for.
Another analysis tests whether the benefits of preschool attendance are greater for at-risk children
than for other children, i.e., whether there is an interaction between program participation and risk
status. No solid evidence of an interaction between a child's risk status and the developmental effects
of preschool attendance is found, not even in the literacy-numeracy domain. (Analysis not shown in text
tables. See appendix table B-1 and accompanying text.)
In sum, having attended a center-based preschool program is found to produce a reliable increase
in a 4-year-old's emerging literacy skills, such as being able to count to 20, recognize letters of the
alphabet, or write his or her own name. This is true for children from both high-risk and low-risk
backgrounds. On the other hand, preschool participation is not found to reduce the prevalence of
behavioral, speech, and health difficulties that are found to be more common among at-risk preschoolers.
41
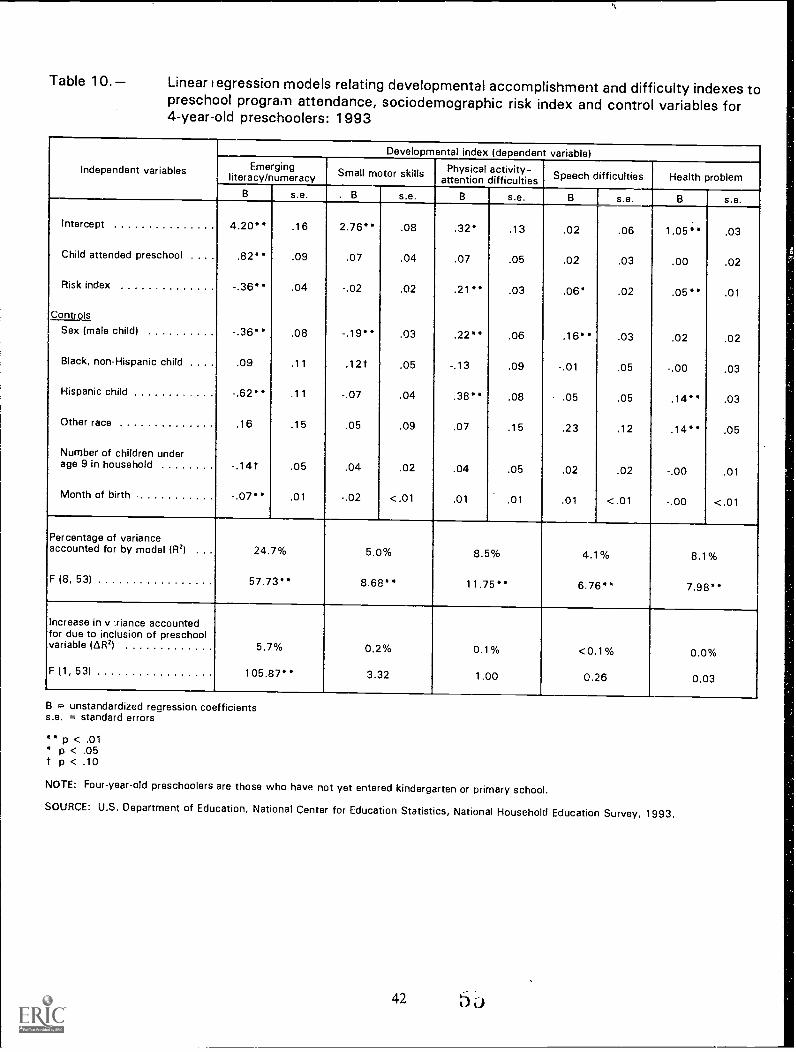
Table 10. Linear !egression models relating developmental accomplishment and difficulty indexes topreschool program attendance, sociodemographic risk index and control variables for4-year-old preschoolers: 1993
Developmental index (dependent variable)
Independent variables Emergingliteracy/numeracy Small motor skills Physical activity-
attention difficulties Speech difficulties Health problem
Intercept 4.20" .16 2.76" .08 .32* .13 .02 .06 1.05" .03
Child attended preschool . .. . .82" .09 .07 .04 .07 .05 .02 .03 .00 .02
Risk index -.36" .04 -.02 .02 .21" .03 .06* .02 .05" .01
Controls
Sex (male child) -.36" .08 -.19" .03 .22" .06 .16" .03 .02 .02
Black, non-Hispanic child .. . . .09 .11 .12t .05 -.13 .09 -.01 .05 -.00 .03
Hispanic child -.62 " .11 -.07 .04 .38" .08 .05 .05 .14 .03
Other race .16 .15 .05 .09 .07 .15 .23 .12 .14** .05
Number of children underage 9 in household -.14t .05 .04 .02 .04 .05 .02 .02 -.00 .01
Month of birth -.07" .01 -.02 < .01 .01 .01 .01 < .01 -.00 < .01
Percentage of varianceaccounted for by model (R2) . . . 24.7% 5.0% 8.5% 4.1% 8.1%
F (8, 53) 57.73" 8.68" 11.75" 6.76" 7,98"
Increase in v :riance accountedfor due to inclusion of preschoolvariable (AR2) 5.7% 0.2% 0.1% <0.1% 0.0%
F (1, 53) 105.87" 3.32 1.00 0.26 0.03
B = unstandardized rearession coefficientss.e. = standard errors
p < .01p < .05
t p < .10
NOTE: Four-year-old preschoolers are those who have not yet entered kindergarten or primary school.
SOURCE: U.S. Department of Education, National Center for Education Statistics, National Household Education Survey, 1993.
42
Summary and Discussion
This report has examined the prevalence of selected accomplishments and difficulties in a dational
sample of 4,423 children from 3 to 5 years of age who had not yet started kindergarten. The data were
collected in January through April 1993 as part of the National Household Education Survey.
The accomplishments consist of signs of emerging literacy and numeracy and small motor skills.
The difficulties encompass behavioral signs of physical activity-attention difficulties, speech difficulties,
and less than optimal health. The determination of whether the child displays each of these
accomplishments and difficulties is based on reports from one of the child's parents, usually the mother.
The accomplishments and difficulties reported in this study include some behaviors that can be observed
and reported objectivelye.g., whether a child buttons his or her clothes, counts to 20, or identifies
primary colors. Other measures, many of them difficulties, require assessments of the child's behavior
against criteria that are not explicitly described and are not universally agreed upon. These include, for
example, measures associated with temper tantrums, attention span, or a child's speech being
understandable. Parents from different backgrounds may hold different expectations in regard to these
criteria and may assess their children's behavior differently as a result.
This analysis has focused especially on children who had turned 4 by the end of the previous
calendar year and were about 6 months away from starting kindergarten at the time of the survey. A
majority of these 4-year-olds display each of the small motor skills and signs of emerging literacy asked
about in the survey. The size of the majority varies greatly across specific accomplishments, however.
More than 9 out of 10 could button their own clothes and hold a pencil properly, and more than 8 out
of 10 could identify the primary colors by name. Fewer, about 6 in 10, could count to 20 or recognize
most letters of the alphabet.
Much smaller fractions of preschoolers exhibit any of the developmental difficulties, although a
substantial minority display signs of physical activity-attention difficulties. At age 4, nearly 3 in 10 are
said to be very restless and fidgety, and nearly 1 in 4 to have short attention spans. Nearly 1 in 8 is
reported to be in less than very good health. About 1 in 13 speak in a way that is not understandable to
a stranger or has a stutter or stammer.
The percentage of children displaying signs of emerging literacy and small motor skills increases
with years of age within the 3- to 5-year age range, and with months of age among 4-year-olds. For
example, the percentage of preschoolers reported to write their own names more than triples between ages
3 and 4, while the percentage recognizing most letters more than doubles. Other accomplishments show
more moderate age differences. Developmental difficulties show much smaller changes across ages, and
some show no change.
43

More girls than boys demonstrate each of the emerging literacy and small motor skills coveredin the survey, while fewer girls exhibit signs of physical activity-attention difficulties or speechdifficulties. Though sex differences are widespread, they are not large.
Hispanic preschoolers are reported to show fewer signs of emerging literacy and more indicationsof physical activity-attention difficulties than non-Hispanic children, and their general health status is notas good. Controlling for related risk factors such as the mother having limited education and minority-
language status reduces these ethnic differences but does not eliminate them. Black preschoolers showfewer signs of emerging literacy than white preschoolers, and their health status is not as good.However, racial differences are wholly accounted for by related risk factors such as low maternaleducation, poverty, and single parenthood.
One of the questions addressed in the study is whether sociodemographic risk factors that have
been found to be associated with learning difficulties after children start school are also correlated withthe accomplishments and difficulties that children bring with them when they arrive at kindergarten. Fivefamily risk factors are examined: the mother having less than a high school education; the family beingbelow the official poverty line; the mother speaking a language other than English as her main language;the mother having been unmarried at the time of the child's birth; and only one parent being present inthe home.
The relative importance of individual risk factors varies across developmental domains. Lowmaternal education and minority language status are most consistently associated with fewer signs ofemerging literacy and a greater number of difficulties in preschoolers.
The risk factors are found to be associated with fewer accomplishments and more difficulties inthe child. This remains true after other child and family characteristics are controlled in multivariateanalyses. Of the developmental domains, only small motor development is not related to any of thesociodemographic risk factors after controlling for other risk factors and child characteristics. Maternaleducation is related to three domains (literacy-numeracy, physical attention-activity, and health) aftercontrolling for other factors. Minority-language status is related to two domains (literacy-numeracy andhealth). Poverty and single parenthood are related to only one domain each, and unmarried motherhoodto none, after controlling for other factors.
In general, the more risk factors to which the child is subject, the lower the number ofaccomplishments and the higher the number of difficulties he or she is likely to exhibit. For example.compared to children from families with none of the risk factors, children from families with three ormore risk factors are five times as likely to be in less than optimal health, three times as likely to have
speech difficulties, and twice as likely to display physical activity-attention difficulties. On average, thesepreschoolers display one and a half fewer signs of emerging literacy out of five than preschoolers with
44

no risk factors. In the multivariate analysis, the cumulative number of risk factors is found to be
associated with each domain except small motor skills, after controlling for other factors.
Another question that the study addresses is whether attending Head Start, prekindergarten, or
other center-based preschool programs is linked to more accomplishments and fewer developmental
difficulties. The study shows that preschool participation is associated with higher emerging literacy
scores in 4-year-olds. The increase, which amounts to an average of nearly one full accomplishment out
of five, remains significant when controlling for other child and family characteristics. This benefit of
preschool attendance accrues to children from both high-risk and low-risk family backgrounds. On the
other hand, preschool attendance is found not to be associated with fewer behavioral or speech
difficulties, or with better health status in preschoolers.
These findings about the importance of sociodemographic risk factors raise additional questions
for future research. What are the antecedents and consequences of the risk factors? For example, family
disruption or dissolution and adolescent pregnancy may be antecedents of poverty and single-parent
household status for many children. What are the longer-term consequences of these risk factors for
children? How do the antecedents and consequences of these risk factors affect the relationship between
risk factors and developmental measures? Such investigation is not possible with the NHES data, and
requires a more in-depth analysis, preferably with a longitudinal database. The results of such an analysis
would greatly enhance our understanding of how sociodemographic risk factors operate and interact to
affect children's development.
Teacher Perceptions Versus Preschoolers' Capabilities
It is interesting to note that a recent national survey of public school kindergarten teachers shows
that most of them do not think that preschoolers have to display signs of emerging literacy and numeracy
in order to be deemed ready for kindergarten entry (Heaviside and Farris 1993). For example, only 24
percent of the teachers consider it essential or very important for children to be able to identify primary
colors and shapes at school entry, 10 percent think that knowing the letters of the alphabet is essential
or very important, and just 8 percent think the same about counting to 20 or more. Yet the present study
shows that a majority of American 4-year-olds can do these things before they start kindergarten, at least
according to their parents.
This study shows that the month of birth affects the accomplishments of 4-year-olds in several
domains. That is, the "older 4's" demonstrate more accomplishments (e.g., in literacy-nurneracy) and
slightly fewer difficulties (e.g., in speech) than the "younger 4's." For this reason, we may expect that
more 4-year-olds would have acquired additional accomplishments or experience a diminution in
difficulties in the months between the spring data collection and the start of the school year in the fall.
45
As noted above, 4-year-olds from high-risk family backgrounds are less likely than other childrento show signs of emerging literacy prior to kindergarten. Yet, even among the 15 percent of 4-year-oldsfrom families with three or more risk factors, substantial numbers show signs of emerging literacy. Forexample, according to their parents, 59 percent of these children could identify the primary colors, 53percent could write their own names and were pretending to read, 43 percent could count to 20, and 40percent could recognize most letters of the alphabet. Clearly, there is a good deal of developmentaldiversity among preschoolers who are about to enter kindergarten, even within a relatively disadvantagedsubgroup.
In contrast to their tendency to downplay the significance of preacademic skills, a majority ofpublic school kindergarten teachers rate certain health, communication, and behavioral characteristicshighly important for school readiness. Specifically, 96 percent of the teachers consider it essential orvery important that the child be "physically healthy, rested, and well-nourished" at school entry; 84percent deem it essential or very important that the child "communicates needs, wants, and thoughtsverbally in child's primary language;" and 60 percent give a 'similar rating to the criterion that the child"is not disruptive of the class" (Heaviside and Farris 1993). A substantial minority of teachers, 42percent, consider it essential or very important that the child "sits still and pays attention;" 85 percentof the teachers think this attribute is at least "somewhat important" for kindergarten readiness.
Again, the present study shows that the majority of 4-year-old preschoolers in the United Statesseem to be able to meet these criteria. Although the characteristics assessed in the NHES:93 are notidentical to those mentioned in the teachers' survey, the NHES:93 finds that most 4-year-olds are reportedto be. in very good or excellent health, could speak in a way that is understandable to strangers, do nothave short attention spans, and are not overly restless or subject to frequent temper tantrums. Evenamong children from high-risk families, the majority are free of these potential impediments to theiracademic careers.
Unfortunately, the minorities of children who have these health, speech, and behavioral problemsare considerably larger among prLschoolers from high-risk families than among preschoolers from moreadvantaged families. For eiample, among 4-year-olds from families with three or more risk factors,compared to those from families with none of the risk factors, twice as many of the former group haveshort attention spans (37 percent versus 17 percent) and nearly double the number are said to be veryrestless (41 percent versus 22 percent). Three times as many have speech that is not understandable tostrangers (14 percent versus 5 percent) or stutter or stammer (16 percent liersus 5 percent). Almost fivetimes as many are in less than very good health (23 percent versus 5 percent).
Attendance at Head Start or other preschool programs is not found to reduce the prevalence ofthese developmental difficulties. Ironically, what preschool programs seem to accomplish is to enhancethe emerging literacy and numeracy skills of preschoolers. Yet the latter are qualities that teachers donot deem to be very important for school readiness. The present study includes a wide range of center-
46
J
based programs for preschoolers. It may be that an analysis including measures of program quality such
as child-staff ratio would show more of an effect of high-quality programs on areas of child development
and well-being other than emerging literacy.
Implications for Educational Research and Planning
The results of this study have three sorts of implications for educational research and the planning
of educational programs for young children. First, the findings point to a need for innovative approaches
to the provision of early education services to disadvantaged children. As previous studies have shown
(Haskins 1989; Lee, Brooks-Gunn, and Schnur 1988; Mc Key et al. 1985; White 1986), existing preschool
programs have beneficial effects in the area of emerging literacy and numeracy. But they do not appear
to be ameliorating the behavioral, speech, and health difficulties of disadvantaged preschoolers. The need
for earlier and more effective interventions for young children with special educational needs has been
recognized in federal legislation (Gallagher 1989). What has yet to be established is whether early
childhood educators know how to make a difference in these areas.
Second, the results emphasize the value of a multifaceted concept of educational risk. Five
different risk factors are employed in the present study. All are found to have some relationship to
preschoolers' accomplishments and diffiylties, although the pattern of relationships varies acrosse
developmental domains. Many observers believe that low family income is the key factor behind
educational failure, but the results of this research do not support this view. Low maternal education,
minority-language status, and family structure are often as good or better predictors of the child's
developmental accomplishments and difficulties.
Third, by showing the considerable variation that exists in the accomplishments and difficulties
of children about to start school, the study highlights the challenges that kindergarten teachers face in
meeting the needs of children who are not only demographically but developmentally diverse. Teachers
must maintain the interest and promote the growth of children who have already demonstrated signs of
early literacy and numeracy while simultaneously encouraging the emergence of basic skills in children
who have not yet acquired them. Similarly, they must meet the needs of children with difficulties while
reserving sufficient attention and effort for those with few or no difficulties.
Achieving this goal requires that early childhood programs and classrooms be organized to meet
the needs of children at all levels ofdevelopment, that teachers be selected who have the energy, warmth,
and imagination to respond to young children with varying capabilities and needs, that these teachers be
appropriately trained and provided with sufficient resources and assistance so they do not have to neglect
some children in order to nurture others. There is still much to learn about how well kindergarten
programs around the country are now meeting these requirements and about ways in which they might
serve young children in the future.
47 6
Finally, as noted earlier in this report, this research is based on the reports of parents about theirpreschoolers. While parent reports provide important insights into the developmental accomplishmentsand difficulties of children, a more complete assessment of children's developmental levels and schoolreadiness would require the collection of information from parents, schools or programs, and the childrenthemselves. Such an effort is now in the developmental stages at the National Center for EducationStatistics.
48
Survey Methodology and Data Reliability
The 1993 National Household Education Survey (NHES:93) is a telephone survey conducted by
Westat for the U.S. Departinent of Education's National Center for Education Statistics (NCES). Data
collection took place from January through April of 1993. When appropriately weighted, the sample is
nationally representative of all civilian, noninstitutionalized persons in the 50 States and the District of
Columbia. The sample was selected using random digit dialing (RDD) methods, and the data were
collected using computer assisted telephone interviewing (CATI) technology.
The School Readiness component of the N1-IES:93, which is the basis of this report, sampled 3-
to 7-year-olds and 8- and 9-year-olds enrolled in second grade or below. Two instruments were used to
collect information on the variables related to the school readiness of these children.. The first instrument,
a Screener administered to an adult member of the household, was used to determine whether any
children of the appropriate ages lived in the household, to collect information on each household member,
and to identify the appropriate parent/guardian to respond for the sampled child. If one or two eligible
children resided in the household, interviews were conducted about each child. If more than two eligible
children resided in the household, two children were randomly sampled as interview subjects. A School
Readiness (SR) interview was conducted with the parent/guardian most knowledgeable about the care and
education of each sampled child, usually the child's mother.
Response Rates
The NHES:93 survey completed Screeners with 63,844 households, of which 9,936 contained
at least one child eligible for the SR component. A sample of 12,905 children was selected for the SR
component from these households. The response rate for the Screener was 82 percent. The completion
rate for the SR interview, or the percentage of eligible sampled children for whom interviews were
completed, was 90 percent, or 10,888 interviews. Thus, the overall response rate for the SR interview
was 74 percent (the product of the Screener response rate and the SR completion rate). This report is
based on a subset of the total SR population: preschoolers, that is, children age 3 and older who are not
yet enrolled in kindergarten. The unweighted number of cases included in this analysis is 4,423. The
number of 4-year-old preschoolers was 2,000.
For the NHES:93, item nonresponse (the failure to complete some items in an otherwise
completed interview) was very low. The item nonresponse rates for most variables in this report were
less than 1 percent. Items with missing responses (i.e., don't know, refused, or not ascertained) were
imputed using a hot-deck procedure. As a result, no missing values remain.
496 4:
Data Reliability
Estimates produced using data from the NHES:93 are subject to two types of error, sampling andnonsampling errors. Nonsampling errors are errors made in the collection and processing of data.Sampling errors occur because the data are collected from a sample rather than a census of thepopulation.
Nonsampling Errors
Nonsampling error is the term used to describe variations in the estimates that may be caused bypopulation coverage limitations and data collection, processing, and reporting procedures. The sourcesof nonsampling errors are typically problems like unit and item nonresponse, the differences inrespondents' interpretations of the meaning of the questions, response differences related to the particulartime the survey was conducted, and mistakes in data preparation.
In general, it is difficult to identify and estimate either the amount of nonsmpling error or thebias caused by this error. In the NHES:93, efforts were made to prevent such errors from occurring andto compensate for them where possible. For instance, during the survey design phase, focus groups andcognitive laboratory interviews were conducted for the purpose of assessing-respondent knowledge of thetopics, comprehension of questions and terms, and the sensitivity of items. The design phase also entailedover 500 staff hours of CATI instrument testing and a pretest in which over 275 interviews wereconducted.
An important nonsampling error for a telephone survey is the failure to include persons who donot live in households with telephones. About 90 percent of all 3- to 7-year-olds live in households withtelephones. Estimation procedures were used to help reduce the bias in the estimates associated withchildren who do not live in telephone households.'
Test-Retest Reliability of Developmental Items
Response variance is another important source of nonsampling error in surveys. In a reinterviewstudy, parents of 360 preschoolers who had been asked the developmental items were given the samequestions again, about 2 weeks after the original interview (Brick, Rizzo, and Wernimont 1993). Theagreement between the parents' original responses to the items and their responses on reinterview rangedfrom 81 percent to 95 percent. The median item had an agreement level of 93 percent. The reliability
'For additional information on telephone coverage issues and estimation procedures to correct for coverage biaes, see j.M.Brick and J. Burke (1992), Telephone Coverage Bias of 14- to 21-year-olds and 3- to 5-year-olds. Washington, DC: U.S.Department of Education, National Center for Education Statistics, NCES 92-101.
50 6 j
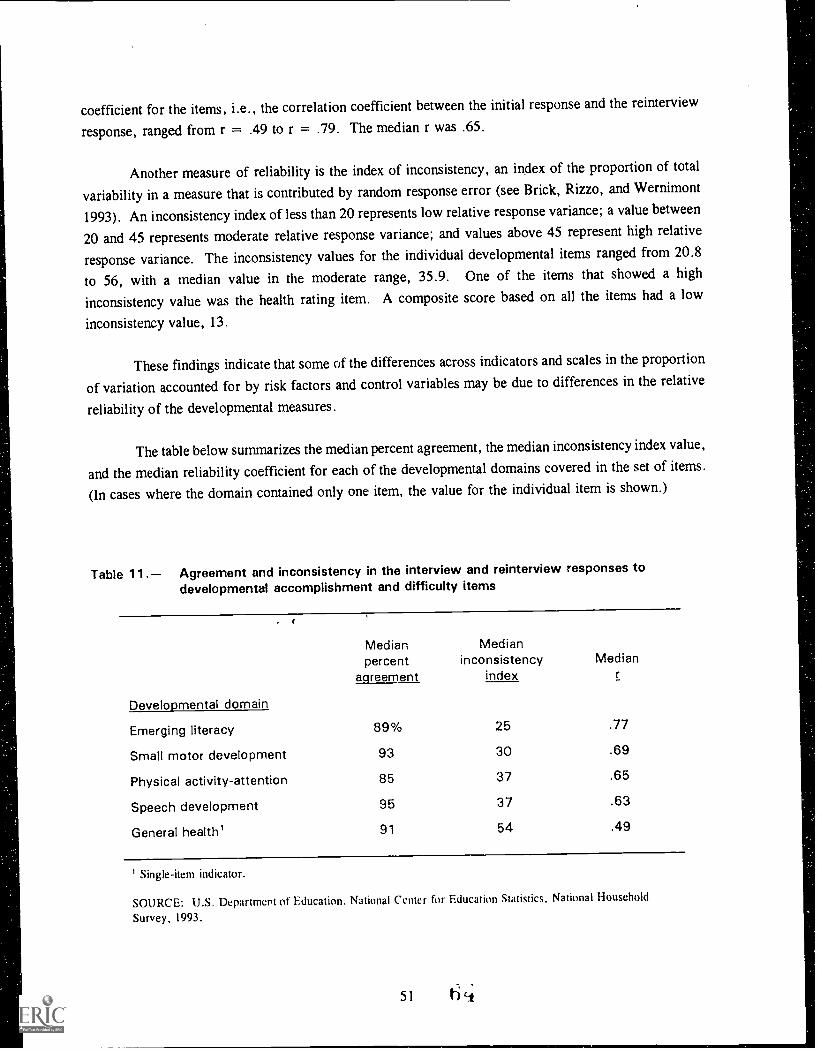
coefficient for the items, i.e., the correlation coefficient between the initial response and the reinterview
response, ranged from r = .49 to r = .79. The median r was .65.
Another measure of reliability is the index of inconsistency, an index of the proportion of total
variability in a measure that is contributed by random response error (see Brick, Rizzo, and Wernimont
1993). An inconsistency index of less than 20 represents low relative response variance; a value between
20 and 45 represents moderate relative response variance; and values above 45 represent high relative
response variance. The inconsistency values for the individual developmental items ranged from 20.8
to 56, with a median value in the moderate range, 35.9. One of the items that showed a high
inconsistency value was the health rating item. A composite score based on all the items had a low
inconsistency value, 13.
These findings indicate that some of the differences across indicators and scales in the proportion
of variation accounted for by risk factors and control variables may be due to differences in the relative
reliability of the developmental measures.
The table below summarizes the median percent agreement, the median inconsistency index value,
and the median reliability coefficient for each of the developmental domains covered in the set of items.
(In cases where the domain contained only one item, the value for the individual item is shown.)
Table 11. Agreement and inconsistency in the interview and reinterview responses todevelopmental accomplishment and difficulty items
Median Medianpercent inconsistency
agreement indexMedian
Developmental domain
Emerging literacy 89% 25 .77
Small motor development 93 30 .69
Physical activity-attention 85 37 .65
Speech development 95 37 .63
General health' 91 54 .49
Single-item indicator.
SOURCE: U.S. Deparunert of Education, National Center for Education Statistics, National Household
Survey, 1993.

Sampling Errors and Weighting
The sample of telephone households selected for the NHES:93 is just one of many possiblesamples that could have been selected. Therefore, estimates produced from the NHES:93 sample may
differ from estimates that would have been produced from other samples. This type of variability iscalled sampling error because it arises from using a sample of households with telephones, rather thanall households with telephones.
The standard error is a measure of the variability due to sampling when estimating a statistic.
Standard errors for estimates presented in this report were computed using a jackknife replication method.
Standard errors can be used as a measure of the precision expected from a particular sample. The
probability that a complete census count would differ from the sample estimate by less than 1 standard
error is about 68 percent. The chance that the difference would be less than 1.65 standard errors is about
90 percent, and that the difference would be less than 1.96 standard errors, about 95 percent.
Standard errors for all of the estimates are presented in the tables. These standard errors can be
used to produce confidence intervals. For example, an estimated 78 percent of preschoolers are able toidentify all the primary colors. This figure has an estimated standard error of 0.8 percent. Therefore,the estimated 95 percent confidence interval for this statistic is approximately 76 to 80 percent.
All of the estimates in the report are based on weighting the observations using the probabilities
of selection of the respondents and other adjustments to partially account for nonresponse and coveragebias. These weights were developed to make the estimates unbiased and consistent estimates of thenational totals.
In addition to properly weighting the responses, special procedures for estimating the statistical
significance of the 'estimates were employed because the data were collected using a complex sampledesign. Complex sample designs, like that used in the NHES:93, result in data that violate some of theassumptions that are normally required to assess the statistical significance of the results. Frequently,the sampling errors of the estimates from the survey are larger than would be expected if the sample was
a simple random sample and the observations were independent and identically distributed randomvariables.
Replication methods of variance estimation were used to reflect the actual sample design used in
the NHES:93. A form of the jackknife replication method was used to compute approximately unbiased
estimates of the sampling errors of the estimates in the report. The jackknife methods were used toestimate the precision of the estimates of the reported national totals, percentages, and regressionparameters. In addition, chi-squared tests of independence were used to evaluate the statisticalsignificance of the overall association between a child or family characteristic (e.g., age) and a
developmental indicator (e.g.. proportion counting to 20). These chi-squared tests of independence were
52

adjusted for the complex sample design using the procedures described by Rao and Thomas (1989). In
essence, these adjustments account for the lack of independent, identically distributed random variables
that are usually assumed when chi-squared tests of independence are computed. To test the differences
between two categories (e.g., 3- versus 4-year-old preschoolers), student's t statistic was employed, using
unbiased estimates of sampling errors derived by the replication methods mentioned above.
As the number of comparisons at the same significance level increases, it becomes more likely
that at least one of the estimated differences will be significant merely by chance, that is, it will be
erroneously identified as different from zero. Even when there is no statistical difference between the
means or percentages being compared, there is a 5 percent chance of getting a significant F or t value
from sampling error alone. As the number of comparisons increases, the chance of making this type of
error also increases.
A Bonferroni adjustment procedure was used to correct significance tests for multiple
comparisons. This method adjusts the significance level for the total number of comparisons made with
a particular classification variable. All the differences cited in this report are significant at the 0.05 level
of significance after a Bonferroni adjustment.
Poverty Measure. The poverty measure presented in this research was developed by combining
information about household composition and household income. The count of family members was
based on the relationships among the household members unless the child had no parents in the
household, in which case the total number of household members is used. Household income was
collected in increments of $5,000 up to $40,000, the categories relevant to the measure of poverty.
Because exact household income is not available, this poverty measure is an approximation. The
household is considered poor if
The number of family members is 3 or less and household income is $10,000 or less;
The number of family members is 4 or 5 and household income is $15,000 or less;
The number of family members is 6 or 7 and household income is $20,000 or less;
The number of family members is 8 or 9 and household income is $25,000 or less;
The number of family members is 10 or 11 and household income is $30,000 or less; or
The number of household members is 12 and household income is $35,000 or less.
This measure of poverty results in 24 percent of preschoolers being classified as in poverty. This
percentage is similar to the traditional measure of poverty status (U.S. Bureau of the Census 1993).
References
Achenbach, T.M. (1982). Developmental psychopathology. 2nd ed. New York: John Wiley and Sons.
Achenbach, T., & Edelbrock, C. (1981). Behavioral problems and competencies reported by parents of
normal and disturbed children aged four through sixteen. Monographs of the Society for Research
in Child Development, Serial No. 188.
Achenbach, T.M., Howell, C.T., Quay, H.C., & Conners, C.K. (1991). National survey of problems
and competencies among four- to sixteen-year-olds. Monographs of the Society for Research in
Child Development, Serial No. 225.
Bachman, J.G., & O'Malley, P: (1984). Black-white differences in self-esteem: Are they affected by
response styles? American Journal of Sociology, 90, 625-639.
Baker, P.C., & Mott, F.L. (1989). A guide and resource document for the National Longitudinal Survey
of Youth 1986 child data. Columbus, OH: Center for Human Resource Research, The Ohio State
University.
Barnett, W.S. (1992). Goal 1 research and dissemination: Research needs relating to readiness and the
longterm effects of preschool education. A Challenge Four Paper for the OERI Goal One Task
Force. New Brunswick, NJ: Rutgers University, Graduate School of Education.
Bianchi, S., & McArthur, E. (1993). Characteristics of children who are "behind" in school. Paper
presented at the annual meeting of the American Statistical Association, San Francisco, CA.
Bredekamp, S. (Ed.). (1987). Developmentally appropriate practice in early childhood programs serving
children from birth through age 8. Expanded ed. Washington, DC: Naional Association for the
Education of Young Children.
Brick, J.M., Rizzo, L., & Wernimont, J. (1993). NHES:93 reinterview analysis. Unpublished report to
the U.S. Department of Education, National Center for Education Statistics, Washington, DC.
Cardon, L.R., D.W., & DeFries, J.C. (1992). Continuity and change in general cognitive ability
from 1 to 7 years of age. Developmental Psychology, 28(1), 64-73.
Collins, M.A., & Brick, J.M. (1993). Parent reports on children's academic progress and school
adjustment in the National Household Education Survey. Paper presented at the Mid-Winter
Meetings of the American Statistical Association, January, Fort Lauderdale, FL.
556 if
Crnic, K., & Lamberty, G. (1994). Reconsidering school readiness: Conceptual and applied perspectives.Early Education and Development, 5(2) [Special issue, School Readiness: Scientific Perspectives],91-105.
Dawson, D. (1991). Family structure and children's health and well-being: Data from the 1988 NationalHealth Interview Survey on Child Health. Journal of Marriage and the Family, 53(August), 573-584.
Eisenhart, M.A., & Graue, M.E. (1990). Socially constructed readiness for school. Qualitative Studiesin Education, 3(3), 253-269.
Ellwein, M.C., Walsh, D.J., Eads, G.M., & Miller, A. (1991). Using readiness tests to routekindergarten students: The snarled intersection of psychometrics, policy, and practice.Educational Evaluation and Policy Analysis, 13(2), 159-175.
Ferrara, R. A. (1987). Learning mathematics in the zone of proximal development: The importance offlexible use of knowledge. Unpublished doctoral dissertation. University of Illinois at Urbana-Champaign.
,Freernan, E.B., & Hatch, J.A. (1989). What schools expect young children to know and do: An analysisof kindergarten report cards. The Elementary School Journal, 89, 595-605.
Gallagher, J.J. (1989). A new policy initiative: Infants and toddlers with handicapping conditions.American Psychologist, 44(2), 387-391.
Goal One Technical Planning Group. (1993). Reconsidering children's early development and learning:Toward shared beliefs and vocabulary. Draft report to the National Education Goals Panel.Washington, DC: National Education Goals Panel.
Goal One Technical Planning Subgroup. (1991). The Goal One Technical Planning Subgroup report onschool readiness. In National Education Goals Panel (Ed.), Potential strategies for long-termindicator development: Reports of the technical planning subgroups. Report No. 91-0, 1-18.Washington, DC: National Education Goals Panel.
Graham, P.J., & Rutter, M.L. (1968). The reliability and validity of the psychiatric assessment of thechild, II. Interview with the parent. British Journal of Psychiatry, 114, 581-592.
Haffner, A., Ingels, S., Schneider, B., Stevenson, D., & Owings, J. (1992). A profile of the Americaneighth grader: NELS:88 student descriptive summar y. Washington, DC: U.S. Department ofEducation, National Center for Education Statistics.
56tic;
Haskins, R. (1989). Beyond metaphor: The efficacy of early childhood education. American Psychologist,
44(2), 274-282.
Heaviside, S., & Farris, E. (1993). Public school kindergarten teachers' views on children's readiness
for school. Fast Response Survey System (Data Series FRSS-46). Washington, DC: U.S.
Department of Education, National Center for Education Statistics.
Henderson, L.W. (1991). Parental involvement in the developmental screening of young children: A
multiple risk perspective. Unpublished doctoral dissertation. University of Michigan, Ann Arbor.
Hofferth, S.L., West, J., Henke, R., & Kaufman, P. (1993). Access to early childhood programs for
children at risk. Washington, DC: U.S. Department of Education, National Center for Education
Statistics.
Horn, W.F., & Packard, T. (1985). Early identification of learning problems: A meta-analysis. Journal
of Educational Psychology, 77, 597-607.
Jensen, A.R. (1980). Bias in mental testing. New York: The Free Press.
Kaufman, P., & Bradby, D. (1992). Characteristics of at-risk students in NELS:88. Washington, DC:
U.S. Department of Education, National Center for Education Statistics.
Knapp, M.S., Shields, P.M., and Turnbull, B.J. (1992). Academic challenge for the children of poverty,
summary report. Washington, DC: U.S. Department of Education, Office of Policy and
Planning.
Knudsen-Lindauer, S.L., & Harris, K. (1989). Priorities for kindergarten curricula: Views of parents and
teachers. Journal of Research in Childhood Education, 4(1), 51-61.
Lamberty, G., & Crnic, K. (1994). School Readiness Conference: Recommendations. Early Education
and Development, 5(2) [Special issue, School Readiness: Scientific Perspectives], 165-176.
Laosa, L. (1982). Psychometric characteristics of Chicano and non-Hispanic white children'sperformance
on the Preschool Inventory. Journal of Applied Developmental Psychology, 3, 217-245.
Laosa, L. (1992). Predictors of individual differences in Chicano children's school readiness: Cognitive,
perceptual, motor, and behavioral. Princeton, NJ: Educational Testing Service.
57
Lee, V.E., Brooks-Gunn, J., & Schnur, E. (1988). Does Head Start work? A 1-year follow-upcomparison of disadvantaged children attending Head Start, no preschool, and other preschoolprograms. Developmental Psychology, 24, 210-222.
Mardell-Czudnowski, C., & Goldenberg, D.S. (1990). Developmental indicators for the Assessment ofLearning-Revised. Circle Pines, MN: American Guidance Service.
Mason, J., & Stewart, J. (1993). Early Childhood Assessment Test [formerly called the ComprehensiveAssessment Program (CAP)]. Iowa City, IA: ACT, Inc.
McCall, R.B. (1970). Intelligence quotient pattern over age: Comparisons among siblings and parent-child pairs. Science, 197, 644-648.
McCall, R.B. (1987). Intercorrelations of Stanford-Binet IQs at various ages in a group of eightychildren. As cited in A.J. Jensen, Bias in mental testing, Table 7.6, p. 279. New York: The FreePress.
McCarthy, D. (1970). Manual for the McCarthy Scale of Children's Abilities. New York: PsychologicalCorporation.
McKey, R.H., Condelli, L., Ganson, H., Barrett, B.J., McConkey, C., & Plantz, M.C. (1985). Theimpact of Head Start on children, families and communities. (DHHS Publication No. OHDS 85-31193). Washington, DC: U.S. Department of Health and Human Services.
Meisels, S.J., Dorfman, A., & Steele, D.M. (1992). Contrasting approaches to assessing youngchildren's school readiness and achievement. Washington, DC: U.S. Department of Education,National Center for Education Statistics, Office of Educational Research and Improvement.
Meisels, S.J., and Wasik, B.A. (1990). Who should be served? Identifying children in need of earlyintervention. In S.J. Meisels and J.P. Shonkoff (eds.), Handbook of early childhood intervention,605-632. New York: Cambridge University Press.
Nord, C.W., and Zill, N. (1993). Forty-five percent of first births in the United States in 1990 were tounmarried mothers, teen mothers, or mothers who had not completed high school. (Researchmemorandum prepared for release of 1993 KIDS COUNT report). Washington, DC: AnnieCasey Foundation and Center for the Study of Social Policy.
Nord, C.W., Zill, N., Prince, C., Clarke, S., & Ventura, S. (1994). Developing an index of educationalrisk from health and social characteristics known at birth. Bulletin of the New York Academy ofMedicine, 71(2), 167-187.
58
Pallas, A., Natriello, G., & Mc Dill, E. (1989). The changing nature of the disadvantaged population:
Current dimensions and future trends. Educational Researcher, 18, 16-22.
Pellegrini, A.D. & Horvat, M. (1995). A developmental contextual critique of attention deficit
hyperactivity disorder. Educational Researcher, 24(1), 13-19.
Prince, C., Nord, C.W., & Zill, N. (1993). Social indicators predictive of school success: Linking health
and social information available at birth to measures of children's health, behavior, and academic
status. Paper presented at the annual meetings of the American Educational Research Association,
April 12-16, Atlanta, GA.
Rao, J.N.K., & Thomas, R. (1989). Chi-squared tests for contingency table. In C.J. Skinner, D. Holt,
and T.M.F. Smith (Eds.), Analysis of complex surveys (chapter 4, p. 98). Chichester, England:
John Wiley and Sons.
Resource Group on School Readiness. (1991). An interim report from the Resource Group on School
Readiness. In National Education Goals Panel (Ed.), Measuring progress toward the National
Education Goals: Potential indicators and measurement strategies, 1-16. Washington, DC:
National Education Goals Panel.
Rutter, M., Tizard, J., & Whitmore, K. (1970). Education, health and behavior. London: Longman
Press.
Salvia, J., & Ysseldyke, J.E. (1991). Assessment. 5th ed. Boston: Houghton Mifflin.
Sameroff, A., Seifer, R., Barocas, R., Zax, M., & Greenspan, S. (1987). Intelligence quotient scores
of 4-year-old children: Social-environmental risk factors. Pediatrics, 79, 343-350.
Sattler, J.M. (1992). Assessment of children. 3rd ed. San Diego: Author.
Schreiner, I. (1983). Analysis of the reinterview data from the 1981 Child Health Supplement to the
National Health Interview Survey. Statistical Methods Division memorandum. Washington, DC:
U.S. Bureau of the Census.
Shepard, L.A., & Smith, M.L. (1986). Synthesis of research on school readiness and kindergarten
retention. Educational Leadership, 44, 78-86.
Shepard, L.A., & Smith, M.L. (1988). Escalating academic demand in kindergarten: Counterproductive
policies. The Elementary School Journal, 89(2), 135-145.
59
Tea le, W.H. (1988). Developmentally appropriate assessment of reading and writing in the earlychildhood classroom. Elementary School Journal, 89, 173-183.
Tea le, W.H. (1990). Issues in early childhood assessment. In P. Afflerbach (Ed.), Issues in statewidereading assessment, 35-53. Washington, DC: ERIC/American Institutes for Research.
U.S. Bureau of the Census. (1992). Statistical abstract of the U.S., 1992. Washington, DC: Author.
U.S. Bureau of the Census. (1992). Poverty in the United States: 1991. Current Population Reports (P-60, No. 181). Washington, DC: Author.
U.S. Bureau of the Census. (1992). Households, families, and children: A 30-year perspective. CurrentPopulation Reports, Population Characteristics (P23-181). Washington, DC: Author.
U.S. Bureau of the Census. (1992). Marital status and living arrangements: March 1992. CurrentPopulation Reports (P-20, No. 468). Washington, DC: Author.
U.S. Bureau of the Census. (1993). Poverty in the United States: 1992. Current Population Reports (P-60, No. 185). Washington, DC: Author.
U.S. Department of Education. (1995). An Invitation to Your Community: Building communitypartnerships for learning. Washington, DC: Author.
West, J., & Brick, J.M. (1991). The National Household Education Survey: A look at young children atrisk. Proceedings of the Social Statistics Section, Meetings of the American StatisticalAssociation, Anaheim, CA.
West, J., Germino Hausken, E., Chandler. K., & Collins, M. (1993). Experiences in child care andearly childhood programs of first and second graders prior to entering first grade: Findings fromthe 1991 National Household Education Survey. Washington, DC: U.S. Department ofEducation, National Center for Education Statistics.
West, J., Germino Hausken, E., & Collins, M. (1993a). Profile of preschool children's child care andearly program participation. Washington, DC: U.S. Department of Education, National Centerfor Education Statistics.
West, J., Germino Hausken, E., & Collins, M. (1993b). Readiness for kindergarten: Parent and teacherbeliefs. Washington, DC: U.S. Department of Education, National Center for EducationStatistics. ,
60
White, K.R. (1986). Efficacy of early intervention. Journal of Special Education, 41(4), 401-416.
Willerman, L. (1979). The psychology of individual and group differences. San Francisco: W.H.
Freeman and Company.
Zill, N. (1990). The Behavior Problems Index. Washington, DC: Child Trends.
Zill, N., & Coiro, M.J. (1992). Assessing the condition of children. Children and Youth Services Review,
14, 7-27.
Zill, N., Moore, K.A., Smith, E.W., Stief, T., & Coiro, M.J. (1995). The life circumstances and
development of children in welfare families: A profile based on national survey data. In P.L.
Chase-Lansdale and J. Brooks-Gunn (Eds.), Escape from poverty: What makes a difference for
poor children? New York: Cambridge University Press.
61
Appendix A
NHES:93 Interview Items Concerning Developmental
Accomplishments and Difficulties
63

NHES:93 Interview Items Concerning Developmental Accomplishments and Difficulties
DPINTRO. These next questions are about things that dif ferent chil ken do at different ages.
These things may or may not be true for (CHILD).
R14. Can (CHILD) identify the colors red, yellow, blue, and green by name? Would you say...
All of them 1
Some of them, or 2
None of them? 3
R15. Can (he/she) recognize...
All of the letters of the alphabet 1
Most of them 2
Some of them, or 3
None of them? 4
R16. How high can (CHILD) count? Would you say...
Not at all 1
Up to five 2
Up to ten 3
Up to twenty 4
Up to fifty, or 5
Up to 100 or more? 6
R17. Can (CHILD) write (his/her) first name, even if some of the letters are backwards?
YES1
NO2
R18. Can (he/she) button (his/her) clothes?
YES
NO
1119. Does (he/she) hold a pencil properly?
YES
NO
65
1
2
1
2
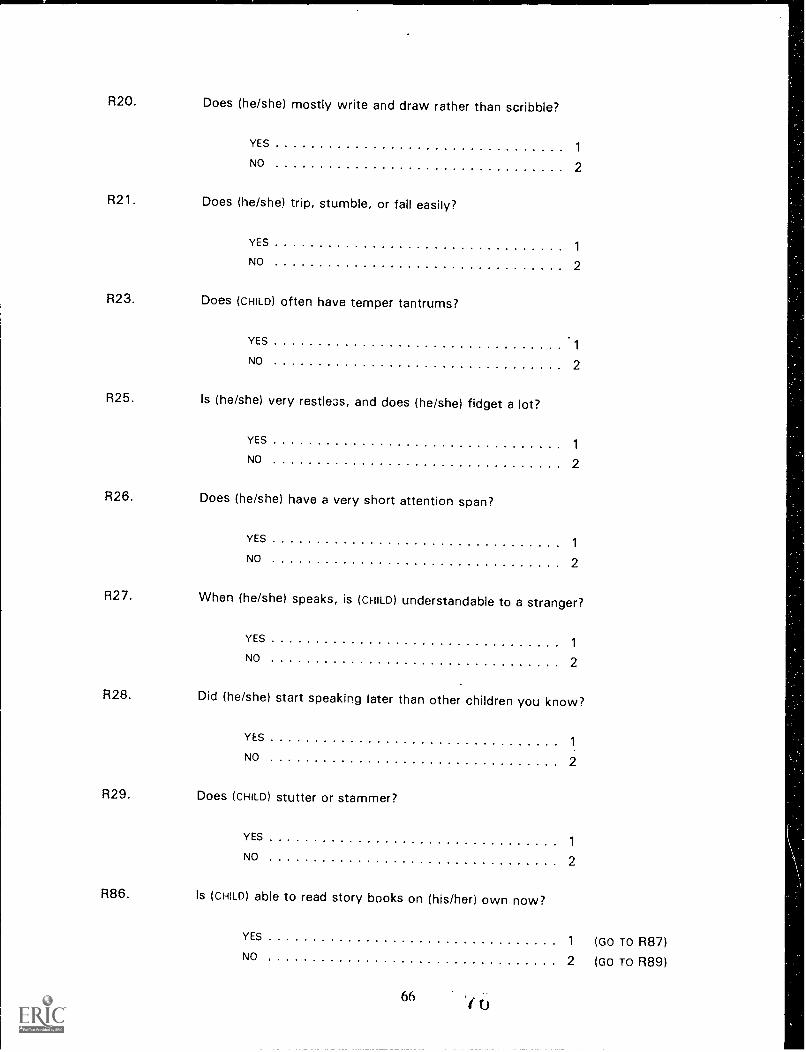
R20. Does (he/she) mostly write and draw rather than scribble?
YES1
NO 2
R21. Does (he/she) trip, stumble, or fall easily?
YES1
NO 2
R23. Does (cHILD) often have temper tantrums?
YES1
NO 2
R25. Is (he/she) very restleas, and does (he/she) fidget a lot?
YES1
NO 2
R26. Does (he/she) have a very short attention span?
YES1
NO 2
R27. When (he/she) speaks, is (cHILD) understandable to a stranger?
YES1
NO 2
R28. Did (he/she) start speaking later than other children you know?
YES
NO 2
R29. Does (CHILD) stutter or stammer?
YES1
NO 2
R86. Is (CHILD) able to read story books on (his/her) own now?
YES1 (Go To R87)
NO 2 (Go TO R89)
66
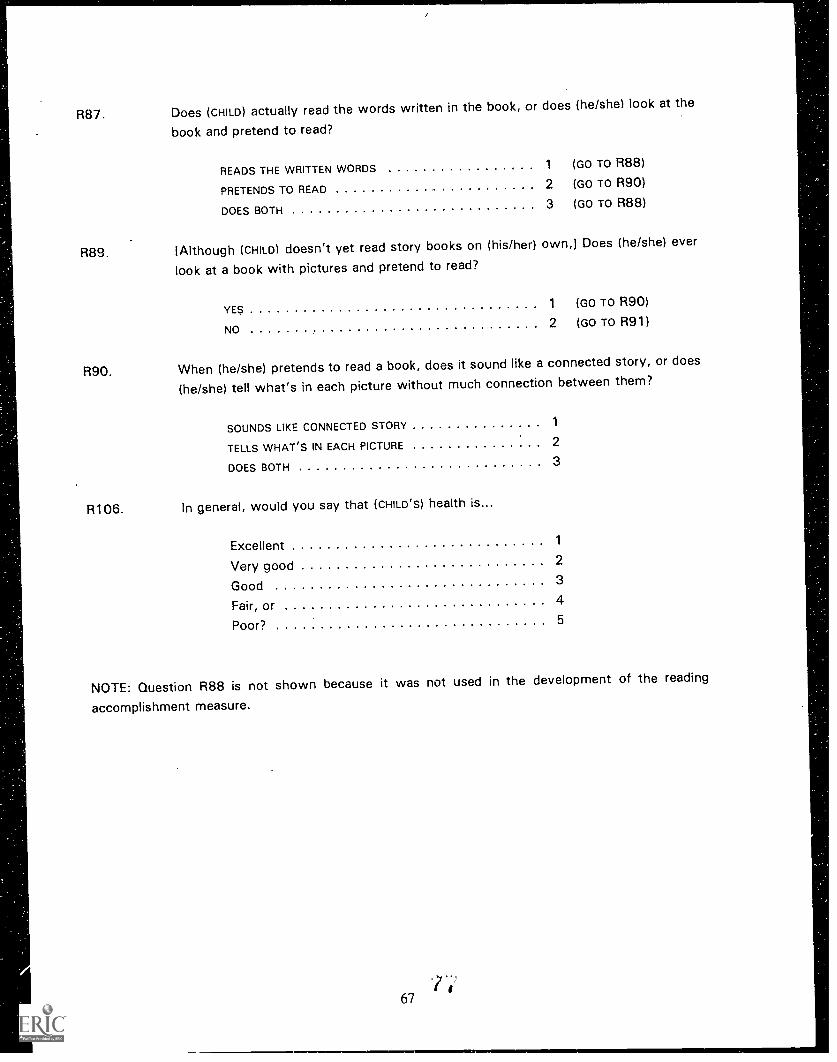
R87. Does (CHILD) actually read the words written in the book, or does (he/she) look at the
book and pretend to read?
READS THE WRITTEN WORDS 1 (GO TO R88)
PRETENDS TO READ 2 (Go To R90)
DOES BOTH 3 (GO TO R88)
R89. (Although (cHILD) doesn't yet read story books on (his/her) own,1 Does (he/she) ever
look at a book with pictures and pretend to read?
YE$ 1 (GO To R90)
NO2 (Go -ro R91)
R90. When (he/she) pretends to read a book, does it sound like a connected story, or does
(he/she) tell what's in each picture without much connection between them?
SOUNDS LIKE CONNECTED STORY 1
TELLS WHAT'S IN EACH PICTURE 2
DOES BOTH 3
R106. In general, would you say that (cHILD's) health is...
Excellent 1
Very good 2
Good 3
Fair, or 4
Poor? 5
NOTE: Question R88 is not shown because it was not used in the development of the reading
accomplishment measure.
Appendix B
Regressions Testing Interaction Between
Preschool Program Participation and Sociodemographic Risks
69
Regressions Testing Interaction BetweenPreschool Program Participation and Sociodemographic Risks
Following analyses that related participation in preschool programs to children's accomplishments
and difficulties, another set of regressions was run. These analyses tested whether the benefits ofpreschool attendance were greater for at-risk children than for other children, i.e., whether there was a
significant interaction between program participation and risk status. The equations included both theprogram participation term and three dichotomous interaction terms.. One variable was coded "1" if the
child was subject to at least one sociodemographic risk factor and had attended a preschool program.
Otherwise, the variable was coded zero. Similarly, the second variable indicated whether the child was
subject to two factors and had attended preschool; and the third, whether the child was subject to three
or more risk factors and had been tb Head Start or prekindergarten. If program attendance had aparticularly beneficial effect on the development of at-risk children, one or more of these terms should
show a regression weight that was positive and significantly different from zero. The addition of theinteraction terms should also produce a significant increase in the total variance accounted for, above and
beyond that accounted for by the program participation indicator, the risk index, and the controlvariables. Three separate interaction terms were used to examine whether preschool programs had their
greatest benefit at low, moderate, or high levels of risk. The separate terms also allowed for thepossibility of a curvilinear relationship between risk and program effects.
As shown in appendix table B-1, no solid evidence of significant interaction between a child's risk
status and the developmental effects of preschool attendance was found. In the literacy-numeracy domain,
however, there was a marginal increase in the amount of variation accounted for when interaction terms
were added to the emerging literacy analysis (AR2 = 0.6 percent; F (3, 50) = 3.66; p < .10).
71
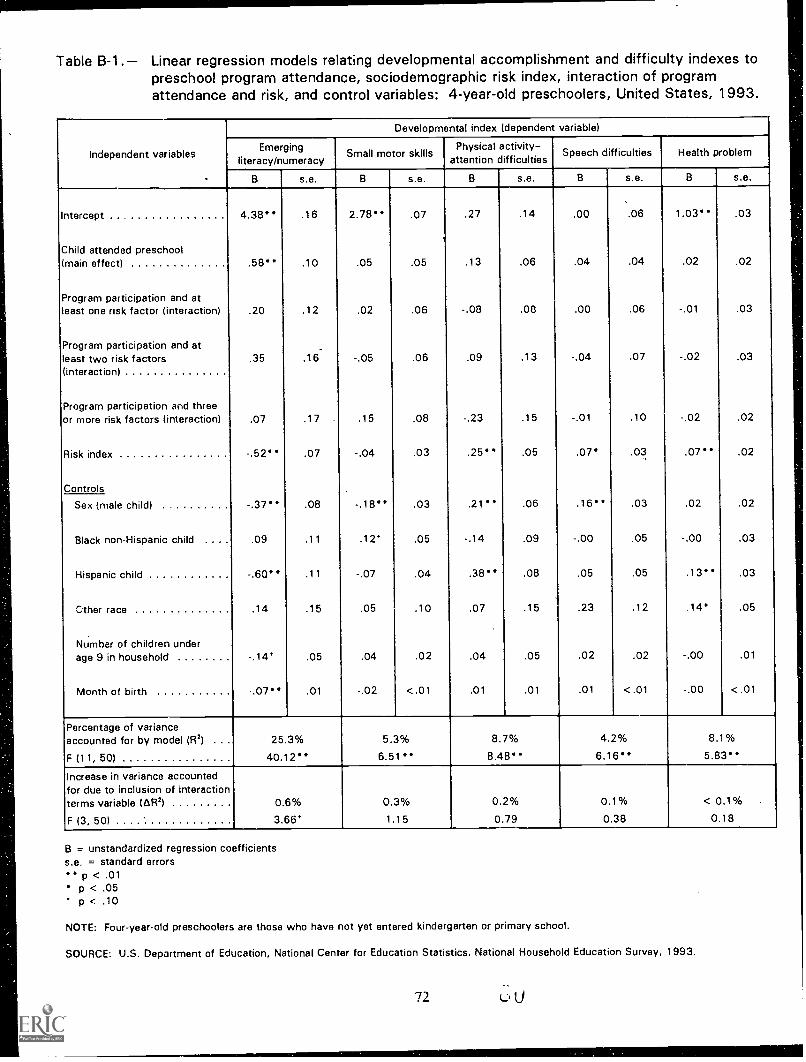
Table B-1.- Linear regression models relating developmental accomplishment and difficulty indexes topreschool program attendance, sociodemographic risk index, interaction of programattendance and risk, and control variables: 4-year-old preschoolers, United States, 1993.
Developmental index (dependent variable)
Independent variablesEmerging
literacy/numeracySmall motor skills
Physical activity-attention difficulties
Speech difficulties Health problem
. B s.e. B s.e. B s.e. B s.e. B s.e.
Intercept 4.38" .16 2.78" .07 .27 .14 .00 .06 1.03" .03
i
Child attended preschool(main effect) .58" .10 .05 .05 .13 .06 .04 .04 .02 .02
Program participation and atleast one risk factor (interaction) .20 .12 .02 .06 -.08 .08 .00 .06 -.01 .03
Program participation and atleast two risk factors(interaction)
.35 .16 -.05 .06 .09 .13 -.04 .07 -.02 .03
Program participation and threeor more risk factors (interaction) .07 .17 . .15 .08 -.23 .15 -.01 .10 -.02 .02
Risk index -.52" .07 -.04 .03 .25" .05 .07* .03 .07" .02
Controls
Sex (male child) -.37" .08 -.18" .03 .21" .06 .16" .03 .02 .02
Black non-Hispanic child .. .09 .11 .12* .05 -.14 .09 -.00 .05 -.00 .03
Hispanic child -.60" .11 -.07 .04 .38" .08 .05 .05 .13" .03
Other race .14 .15 .05 .10 .07 .15 .23 .12 .14* .05
Number of children underage 9 in household -.14' .05 .04 .02 .04 .05 .02 .02 -.00 .01
Month of birth -.07" .01 -.02 < .01 .01 .01 .01 < .01 -.00 < .01
Percentage of varianceaccounted for by model (R2) ... 25.3% 5.3% 8.7% 4.2% 8.1%
F (11, 50) 40.12" 6.51" 8.48" 6.16" 5.83"Increase in variance accountedfor due to inclusion of interactionterms variable (AR2) 0.6% 0.3% 0.2% 0.1% < 0.1% .
F (3, 50) 3.66* 1.15 0.79 0.38 0.18
B = unstandardized regression coefficientss.e. = standard errors
p < .01p < .05p < .10
NOTE: Four-year-old preschoolers are those who have not yet entered kindergarten or primary school.
SOURCE: U.S. Department of Education, National Center for Education Statistics, National Household Education Survey, 1993.
72 LU

9
I SBN 0-16-048368-9
11 60I I483684
. ..
i'...1:,?;11..ili?'7.:Tii0-;1!:::',4.1::.:1C;',itik.
. .. .. . .