Embed Size (px)
Citation preview
DOCUMENT RESUME
ED 390 865 SP 036 429
AUTHOR Snyder, John F.; And OthersTITLE Perceptions of Preservice Teachers: The Job Market,
Why Teaching, and Alternatives to Teaching.PUB DATE Nov 95NOTE 32p.
PUB TYPE Reports Research/Technical (143)
EDRS PRICE MF01/PCO2 Plus Postage.DESCRIPTORS *Career Choice; Career Planning; Element:4.ry School
Teachers; Elementary Secondary Education; HigherEducation; *Labor Market; Secondary School Teachers;*Teacher Employment; *Teacher Motivation; *TeacherSupply and Demand
IDENTIFIERS *Career Alternatives; Preservice Teachers
ABSTRACTThis publication reports on the job market for
teachers entering the work force for the first time and for careerchangers. The study, which surveyed nearly 3,000 preservice teacherscurrently enrolled in educational programs in 25 mid-Atlanticcolleges and universities, explored three areas: (1) preserviceteacher perception of the job market; (2) their motivations forchoosing teaching as a career; and (3) careers they identify asalternatives if they do not find a teaching job. A majority ofrespondents perceived a surplus of teachers in the job market: 34percent indicated some surplus and 24 percent indicated aconsiderable surplus of teachers; 21 percent perceived the job marketwith a balance of teachers and openings. Although 22 percentperceived a shortage of teachers, 33 percent rated their chances offinding full-time jobs in their certification fields right aftergraduation as good, 54 percent rated their chances as fair, and only14 percent rated their chances as poor. The major reasons cited forchoosing to teach were consistent with the literature--working withyoung people, a love of children, and desire to make a difference.Less than three percent listed income, benefits, and job security asreasons for entering the field. Over a third of respondents indicateda desire to pursue an alternative career within the field ofeducation or closely related service; 47 percent of elementarypreservice teachers and 25 percent of secondary/other preserviceteachers fell into this category. Tables of data are included, aswell as some comments from respondents. The findings suggested thatpreservice teachers seem to recognize that the job market iscompetitive, however a majority view their chances of getLing a joboptimistically. Most preservice teachers expressed willingness toserve as substitute teachers, to teach in a private school, and torelocate. (Contains 11 references.) (ND)
Reproductions supplied by EDRS are the best that can be madefrom the original .ocument.
********************i.AAi.***********************************************
t
Perceptions of Preservice Teachers:The Job Market, Why Teaching, and Alternatives to Teaching
'PERMISSION TO REPRODUCE THISMATERIAL HAS BEEN GRANTED BY
TO THE EDUCATIONAL RESOURCESINF ORMATICN CENTER (ERIC)
by
John F. SnyderAmy S. Doerr
Michael A. Pastor
Office of Career ServicesDivision of Student AffairsSlippery Rock University
Slippery Rock, PA
November 1995
BEST COPY AVAILABLE
ovr
U S DEPARTMENT OF EDUCAT IONLie . , ,
EDUCATIONAL RESOURCES INFORMATIONCENTER ERIC)
El This document lois been wpr educed m,received from the poison or ergailhenbmioriginating
0 Minor changes have been w.ide toinIplove I cploduthoo qualdy
Points of view or opannes stilted fl III1.10cooleol dO no! netessailly iepre (,11
iii OE RI po,lboo ol policy
Acknowledgements
The authors express appreciation to the following for making this research report possible.
For professional assistance:George Force, Academic Planning and Evaluation, Slippery Rock UniversityAndy Stoughton, Systems Analyst, User Services, Slippery Rock University
For hours of work inputting data and assisting with word processing and charts:Rebecca t;oron, Julie Fennick, John Leonard, student workers, Slippery Rock University
For financial support:MAASCUS, Mid-Atlantic Association for School, College and University Staffing
For printing:Robert Lutz, Bonnie Montgomery, Sara Foust, Lewis Greenawalt, Lee Regotti,
Printing Services, Slippery Rock University
Copyright © 1995, John F. Snyder, Slippery Rock University
Permission is granted to reproduce this report provided that any reproduction includes thecopyright credit line.
Another report which may be of interest is the 1995 MAASCUS Teacher Supply and DemandEmployer Survey. This report is available, while supplies last, by sending a 9x12" self-addressed envelope with $3.00 of postage attached to John F. Snyder, Office of Caree"Services, Slippery Rock University, Slippery Rock, PA 16057. Be sure to indicate what repo:1you are requesting. For ordering information about the annual ASCUS Teacher Supply andDemand in the United States report and other publications, contact ASCUS at 820 DavisStreet, Suite 222, Evanston, IL 60201-4445. ASCUS is the Association for School, Collegeand University Staffing, Inc. MAASCUS and ASCUS are not-for-profit associations servingcareer services officials and school personnel administrators. (Please note: at the time of thisprinting, ASCUS was considering a name change.)
Introduction
Well our graduations hang on the wallthough they never really helped us at allno they never told us what was realiron, coke, chromium, steel,and we're living here in Allentown.
(Billy Joel, 1983)
Twelve years ago "Allentown" conjured images of a disillusioned working class who,after following the advice of the people they trusted and doing all of the things they weresupposed to do like graduating from school, woke up to the grim reality that there were nojobs waiting for them.
Since that time, a variety of research has explored the state of the labor market in thiscountry. This research was intended to give the besi possible information to those enteringthe work force for the first time or finding new niches r themselves either by choice orbecause of company downsizing.
It is tempting to assume that, after so much good advice and insightful analysis,today's work force would know more about the opportunities that await them in the "real"world than any generation before them.
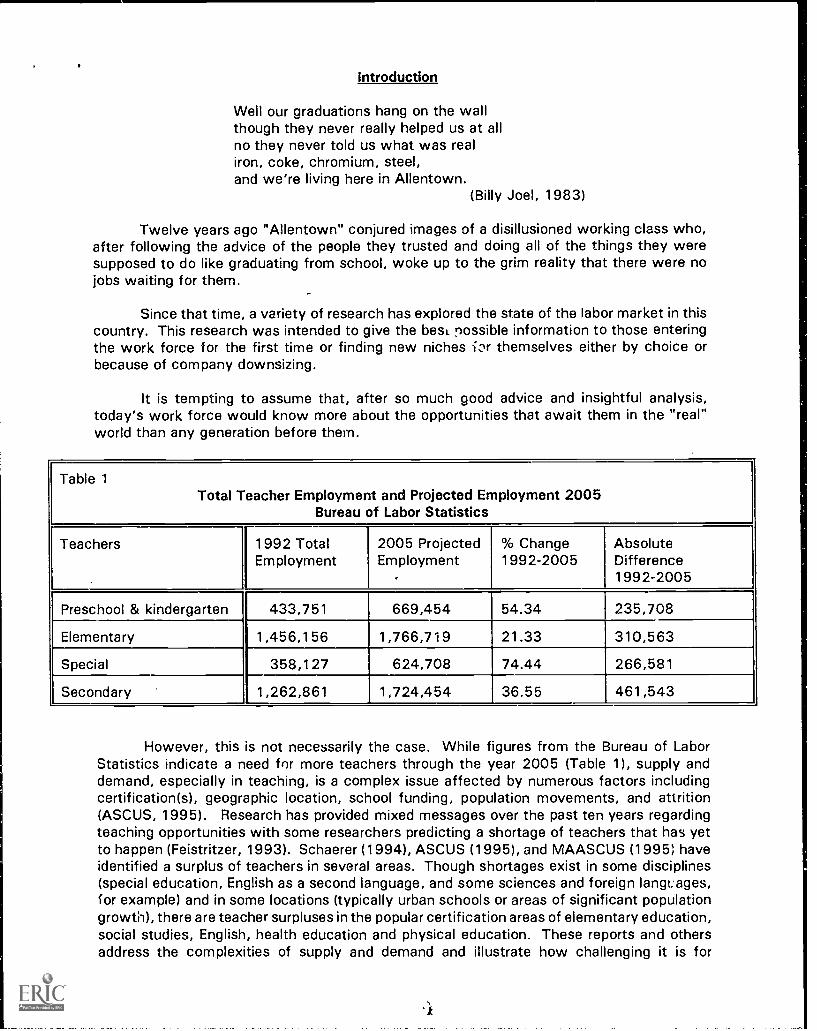
Table 1Total Teacher Employment and Projected Employment 2005
Bureau of Labor Statistics
Teachers 1992 TotalEmployment
2005 ProjectedEmployment
% Change1992-2005
AbsoluteDifference1992-2005
Preschool & kindergarten 433,751 669,454 54.34 235,708
Elementary 1,456,156 1,766,719 21.33 310,563
Special 358,127 624,708 74.44 266,581
Secondary 1,262,861 1,724,454 36.55 461,543
However, this is not necessarily the case. While figures from the Bureau of LaborStatistics indicate a need for more teachers through the year 2005 (Table 1), supply anddemand, especially in teaching, is a complex issue affected by numerous factors includingcertification(s), geographic location, school funding, population movements, and attrition(ASCUS, 1995). Research has provided mixed messages over the past ten years regardingteaching opportunities with some researchers predicting a shortage of teachers that has yetto happen (Feistritzer, 1993). Schaerer (1994), ASCUS (1995), and MAASCUS (1995) haveidentified a surplus of teachers in several areas. Though shortages exist in some disciplines(special education, English as a second language, and some sciences and foreign langt. ages,for example) and in some locations (typically urban schools or areas of significant populationgrowth), there are teacher surpluses in the popular certification areas of elementary education,social studies, English, health education and physical education. These reports and othersaddress the complexities of supply and demand and illustrate how challenging it is for
Perceptions of Preservice Teachers, page 2
students to forecast future opportunities in teaching when research sometimes producescontradictory results.
Purposes of this Study
By surveying nearly 3000 preservice teachers currently enrolled in education programsin 25 Mid-Atlantic colleges and universities, this study explores three areas:
1) Preservice teachers' perceptions of the job market;2) Their motivations for choosing teaching as a career;3) Careers they identify as alternatives if they don't pursue or find a teaching job.
Preservice Teachers' Perceptions of the Job Market
A review of the literature did not reveal any other studies which explore this issue.ASCUS has traditionally researched this question from the perspective of college anduniversity career services professionals and has started to work with regioral associations tosurvey school employers' perceptions (Schaerer, 1994; MAASCUS, 1995). The NationalCenter for Education Statistics (NCES) has conducted extensive research into numerousaspects of school staffing, but has not investigated job market perceptions of preserviceteachers. Other preservice teacher research studies explore the educational preparation andclassroom readiness of new teachers, but not their perceptions of their chances of finding ajob.
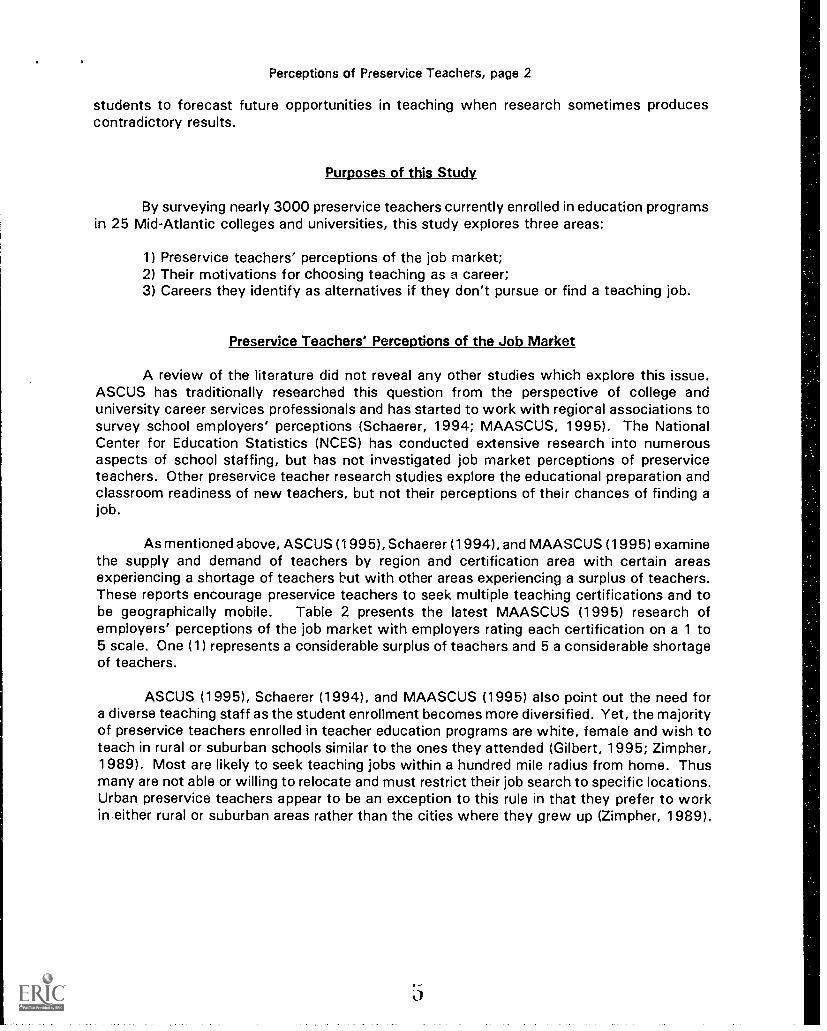
As mentioned above, ASCUS (1995), Schaerer (1994), and MAASCUS (1995) examinethe supply and demand of teachers by region and certification area with certain areasexperiencing a shortage of teachers hut with other areas experiencing a surplus of teachers.These reports encourage preservice teachers to seek multiple teaching certifications and tobe geographically mobile. Table 2 presents the latest MAASCUS (1995) research ofemployers' perceptions of the job market with employers rating each certification on a 1 to5 scale. One (1) represents a considerable surplus of teachers and 5 a considerable shortageof teachers.
ASCUS (1995), Schaerer (1994), and MAASCUS (1995) also point out the need fora diverse teaching staff as the student enrollment becomes more diversified. Yet, the majorityof preservice teachers enrolled in teacher education programs are white, female and wish toteach in rural or suburban schools similar to the ones they attended (Gilbert, 1995; Zimpher,1989). Most are likely to seek teaching jobs within a hundred mile radius from home. Thusmany are not able or willing to relocate and must restrict their job search to specific locations.Urban preservice teachers appear to be an exception to this rule in that they prefer to workin .either rural or suburban areas rather than the cities where they grew up (Zirnpher, 1989).
Table 2: 1995 MAASCUS Employer SvrveyTe 'aching Fields with Considerable Teacher Shortage (5.004.21)
Noneoaching Fields with Some Shortage (4.20-3.41)
Languages Japanese 3.91Science Physics 3.90Languages Russian 3.87Speech Pathology 3.86Bilingual Education 3.69Audiology 3.68Special Education - Hearing Impaired 3.64Special Education Visually Impaired 3.62Technology Education (Ind. Arts) 3.56Psychologist 3.55Agriculture 3.51Library Science 3.48Science Chemistry 3.48Special Education Physically Impaired 3.46English as a 2nd Language (ESL) 3.44
Teaching Fields with Balanced Supply and Demand (3.40-2.61)Languages Classics 3.40Special Education - Multiply Handicapped 3.38Languages German 3.37Special Education - Behavioral Disorders 3.36Computer Science/Education 3.22Science - Earth/Physical 3.30Languages French 3.19Special Education Mentally Handicapped 3.18Special Education Learning Disability 3.14Languages Spanish 3.13Gifted/Taiented Education 3.04Home Economics/Family Studies 2.98Social Worker (School) 2.96Science - Biology 2.93Science General 2.89Counselor Education 2.8&Mathematics 2.88Substitute Teachers 2.82Dance Education 2.81Speech/Drama/Theater 2.81Driver Education 2.79Reading 2.75Music Instrumental 2.74Music Vocal 2.70Journalism 2.61
Teaching Fields with Some SurpluP (2.60-1.81)Business Education 2.54Art/Visual 2.43Health Education 2.35English/Language Arts 1.84
Teaching Fields with Considerable Surplus (1.80-1.00)Physical Education 1.77Social Sciences/Studies 1.59Elementary Pre-K 1.54Elementary Middle Grades 1.47Elementary Kindergarten 1.31Elementary Intermediate 1.25Elementary Primary 1.20
Perceptions of Preservice Teachers, page 4
Why Preservice Teachers Choose to Teach
This is a particularly interesting question considering how demanding teaching is of anindividual's time, talent, energy and empathy. This question is not only interesting in its ownright, it is also an important indicator of how someone will succeed at their chosen profession.As Serow (1994) points out, teachers who feel that teaching is their "calling" (a naturalinclination and ability to teach that is recognized by others) are more likely to succeed thanothers.
The literature identifies a fairly consistent set of the most popular reasons thatindividuals have for becoming teachers. Myers and Neely (1990) report that most educationmajors insist that they choose to teach because they:
have experience working with children;have a rewarding experience with a former teacher;love children;want to make a difference;have relatives who taught.
According to Zimpher (1989), education majors choose to teach because:95% want to help students grow and learn;63% think that teaching is a challenging profession;45% feel that teaching is their ca:ling, that it is an honorable profession, are inspired
by one of their favorite teachers, or like the working conditions.
King (1993) reports that African American students enter teacher education programsfor similar reasons:
83% feel that they have the ability to work with young people;78% think that 'heir abilities are well suited to teaching;73% think that toey cal contribute to the betterment of society;66% believe that teaching gives them the opportunity to be creative;56% want to have the opportunity to work with diverse populations;56% think that teaching is intellectually satisfying.
Finally, Serow (1994) states that students who feel that they have been "called" toteach also think that the teaching profession is attractive for other reasons:
95% like working with children;91% want to help children;73% are inspired by their former teachers;56% feel they can bring about social change.
It is interesting, though not surprising, that the factors encouraging students to teachchange over time. Zimpher (1989) remarks that, in the 1950's, young men and womenturned to teaching because of the influence of a former teacher. In the 1960's the teachingprofession was attractive because it promised job security. In the 1970's, as society placedless emphasis on the tangible benefits of working, people were drawn to teaching becauseit would be intrinsically rewarding. In the 1980's, teachers chose their profession becauseit gave them the opportunity to help students grow and learn. In the 1990's, students whomajor in education typically believe that teaching is challenging and rewarding, and they haverespect for what teachers can accomplish.
Perceptions of Preservice Teachers, page 5
It is interesting to note that the percentage of education majors who are either"positive" or "somewhat positive" about teaching is about the same as it was at any time inthe past 50 years. By and large, however, education majors are less concerned about incomeand job security than other college students (Zimpher, 1989).
Those who are certain that they want to teach are willing to make a considerablecontribution to the profession (Zimpher, 1989):
36% 20 years or more;21 % 1 1-20 years;16% 6-10 years;8% less than 5 years.
Individuals who decide to teach are as aware of the drawbacks of the teachingprofession as teachers themselves. For example, Myers and Neely (1990) mention that themost widely perceived drawbacks to teaching include:
low pay;discipline problems;student apathy;lack of resources, support and recognition.
Preservice teachers are more quick to point out these problems than veteran classroomteachers. They also portray drawbacks like low pay and lack of prestige as being far worsethan they actualli are. However, in spite of their bleak appraisal of the profession, preserviceteachers still are determined to teach. The question that arises, then, is why do some of themen and women who have trained to be teachers enter the profession while others do not?
The answer may lie in commitment. Some individuals enter the teaching professionknowing that, despite a competitive job market, they are going to teach. Commitment isusually conceived of as a combination of experience and desire. Commitment typically beginswith an experience that is rewarding in some way. Over time, individuals begin to drawconclusions on the basis of their experiences. In time, they begin to believe that theirexperiences have pointed the way toward their future careers. Although the terms"commitment" and "calling" have often been used interchangeably, there are subtledifferences that distinguish these terms from each other. As Serow (1994) insists, a callingbegins deep inside of an individual. It is an innate sense that there is something in life thathe or she is meant to do or to be. This perception is reinforced by personal experience andothers' opinions.
Commitment often comes with age. A study by Cohen, Klink, and Grana (1990)shows 46% of the traditional students still teaching after five years, compared to 85% oftheir older colleagues. There are three possible explanations for the relationship betweencommitment and age.
First, non-traditional students are likely to have had an opportunity to work withchildren or adolescents. This experience gives them an opportunity to discover whether ornot they are apt to succeed at teaching.
Perceptions of Preservice Teachers, page 6
Second, older students are also likely to have had time to deal with many of the issues(such as establishing a family and creating a sense of stability and security for themselves)that younger students still face. Because they are able to put many of these issues behindthem, the older students are more apt to keep the commitments that they make (Cohen, Klink,and Grana, 1990).
Third, older students are more likely to see teaching as an end in itself, rather than asa means to some other professional end. Many traditional students see teaching as a steppingstone to either an administrative position, iuch as principal or superintendent, or anotherprofession, like law or medicine. This perhaps explains why many traditional secondaryeducation students either never enter the teaching profession or leave within the first fiveyears. Others naver teach because of illness, children, or spouse relocation out of town.Some secondary education students decide at some point that they want more pay,autonomy, and opportunities for travel and promotion than teaching affords (Cohen, Klink, andGrana. 1990).
Alternatives to Teaching
In an era when the job market is highly competitive for many teachers, many men andwomen who have prepared to teach have found other career opportunities. As manyobservers note, there is an obvious difference between elementary and secondary teachers.The latter are usually attracted more to their academic fields than they are to the idea ofteaching. In contrast, elementary teachers typically choose their profession because it offersthem the opportunity to work with children. This means that they see their job alternativesto be limited to areas like counseling, tutoring, pre-school, or day care.
As expected, secondary education students pursue a much more extensive variety ofalternatives. There are several routes that secondary education teachers who choose not tcteach typically follow. First, they may pick another occupation within their field. Forexample, a woman who had received a degree in math education will become an actuary foan insurance compiny rather than a middle school or high school math teacher. Second.secondary teachers who choose not to teach may fall back on their prior experience. Forexample, a man who had worked as a landscaper, a carpenter or a machinist earlier in his lifewill return to this line of work rather than teach. Third, secondary teachers who ultimatelydecide not to teach often go into other professions. Teaching may have seemed to be a morepractical perhaps attainable choice when these men and women began their collegecareers. It might have been an alternative that they always wanted to try. However,somewhere in the back of these teachers' minds, there is another profession that they willenter when the time was right. Of those who don't want to teach, according to Zimpher(1989), 25% will go on to graduate school, and 20% will go into an education field.
Schools have indicated a strong need for minority teachers (ASCUS, 1995; MAASCUS,1995) making the education profession a particularly attractive one for minorities in terms ofemployment opportunities. Higher education is also vigorously recruiting minorities, especiallythose who have exemplary grades and/or standardized test scores. After arriving at college,however, minorities tend to choose careers that typically weren't available to them in thepast. Rather than teaching, college-bound minorities are more inclined to choose professionslike engineering, medicine, computer science and the social sciences (Zimpher, 1989).
Perceptions of Preservice Teachers, page 7
The Survey and Survey Respondents
Two thousand, nine hundred, seventeen (2.917) education majors from 25 Mid-Atlanticcolleges and universities completed the two page survey during the 1994-95 academic year(see Appendix A for more information). The majority of respondents are seniors (52.5%),followed by sophomores (14.7%), juniors (13.2%), graduate students (8.1%), freshmen(6.7%), and post baccalaureate students (4.8%). Those 21-22 years-old represent 40.7%of the respondents while those 19-20 years-old represent 21.8%. Those 23 years-old andolder represent 33.9% of the respondents. Nearly three-f ourths (74.2%) of the respondentsare females and 25.8% are males. Caucasians are the majority of respondents at 94.8% withAfrican-Americans at 2.1%. All other racial groups are less than 1% of the respondents.
Appendix B shows the certification fields represented. The total number respondingby certification field is more than 2917 because students could be earning certificates in morethan one teaching field. The certification fields are based on the ASCUS supply and demandreport fields. To minimize confusion among the preservice teachers completing the survey,however, some certification fields from the ASCUS reports are combined. For example,instead of listing the various specialties in special education, the preservice teacher surveyprovides only "Special Education" as a certification field.
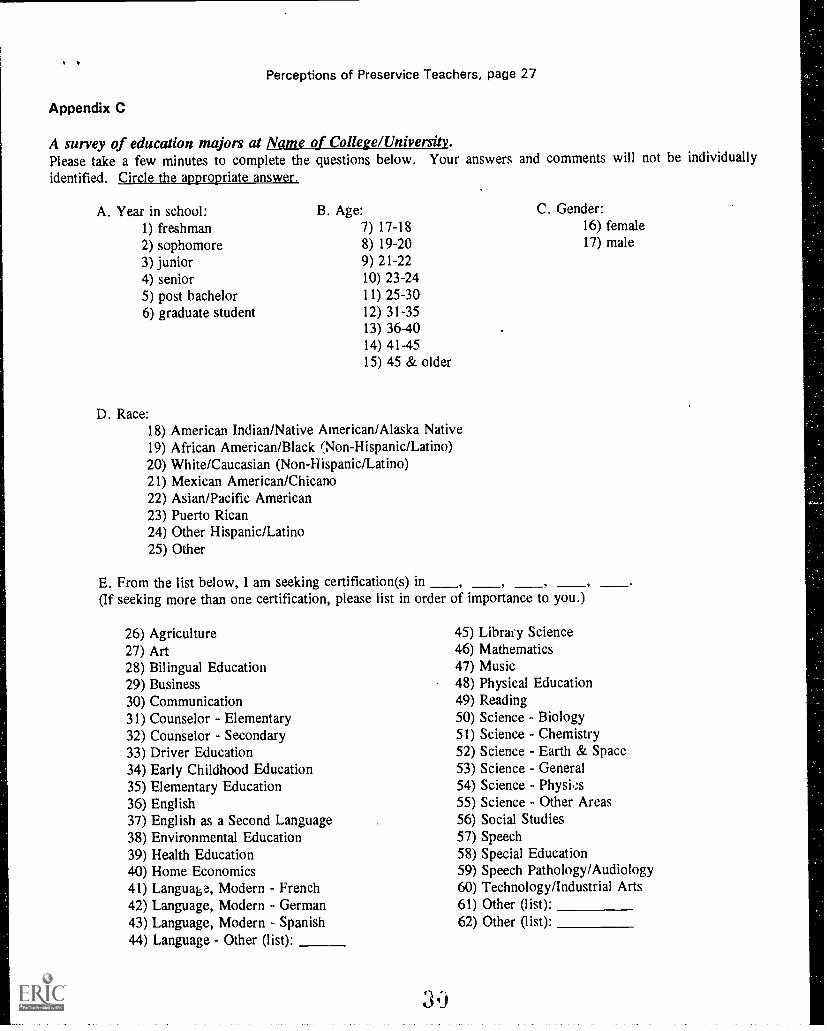
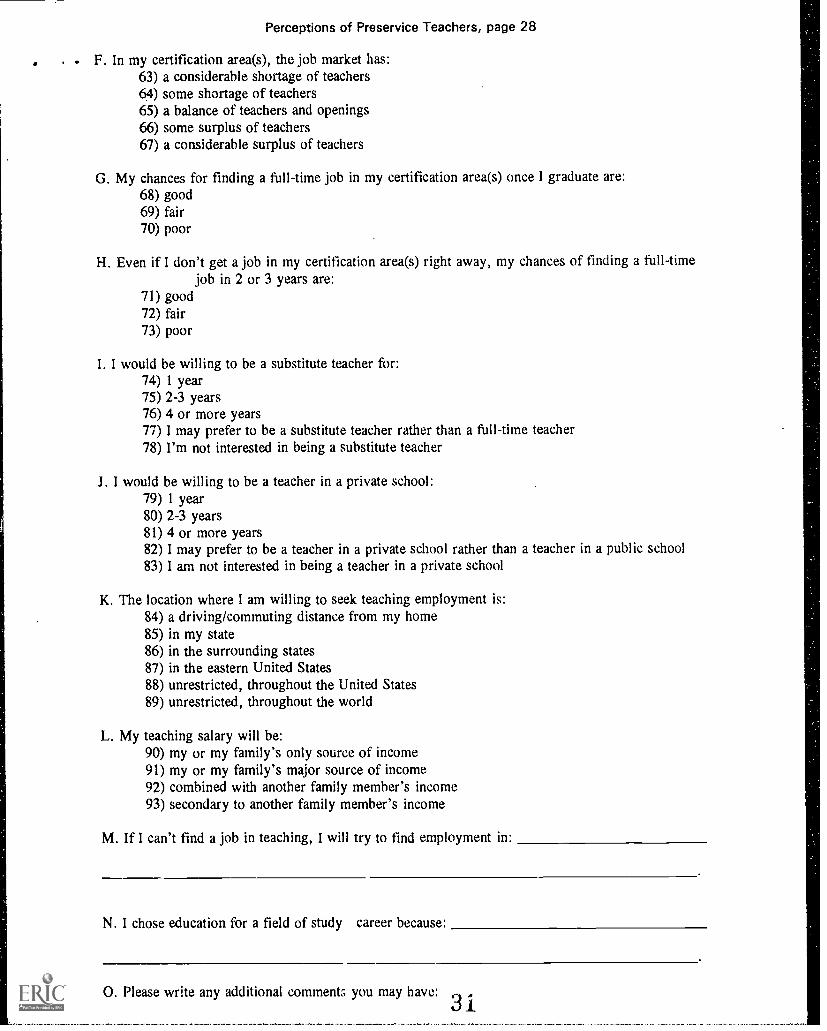
The survey gathered information about perceptions of the job market through multiplechoice questions. Preservice teachers responded to the issues of why they chose teachingand alternatives to teaching through open-ended questions. They were also provided spaceto write additional comments. Appendix C is a copy of the survey instrument. Appendix Dprovides more information about how the numerous comments were read and analyzed.
Job Market Perceptions of All Respondents
A majority of preservice teacher respondents perceives a surplus of teachers in the jobmarket with 34% indicating some surplus of teachers and 24% indicating a considerablesurplus of teachers. Seventeen percent (17%) perceive some shortage of teachers with only5% perceiving a considerable shortage of teachers. Twenty-one percent (21%) perceive thejob market with a balance of teachers and openings.
Although a total of 22% perceive a shortage of teachers, 33% rate their chances offinding a full-time job in their certification field(s) right after graduation as good; 54% ratetheir chances as fair; and 14% rate their chances as poor.
When asked about their chances of finding a full-time teaching job in two to threeyears if they don't get a job right after graduation, the optimism expressed by the respondentsincreases considerably. Only 3% rate their chances of finding a full-time job as poor, while63% see their chances as good and 35% as fair. Figure 1 illustrates this perception.
With a competitive teacher's job market, substitute teaching may be a viable optionf or entering a local district and eventually gaining full-time employment. Although 13% of thepreservice teachers surveyed will not consider subbing as an option, 48% are willing to subfor one year and 35% are willing to sub for 2 to 3 years.
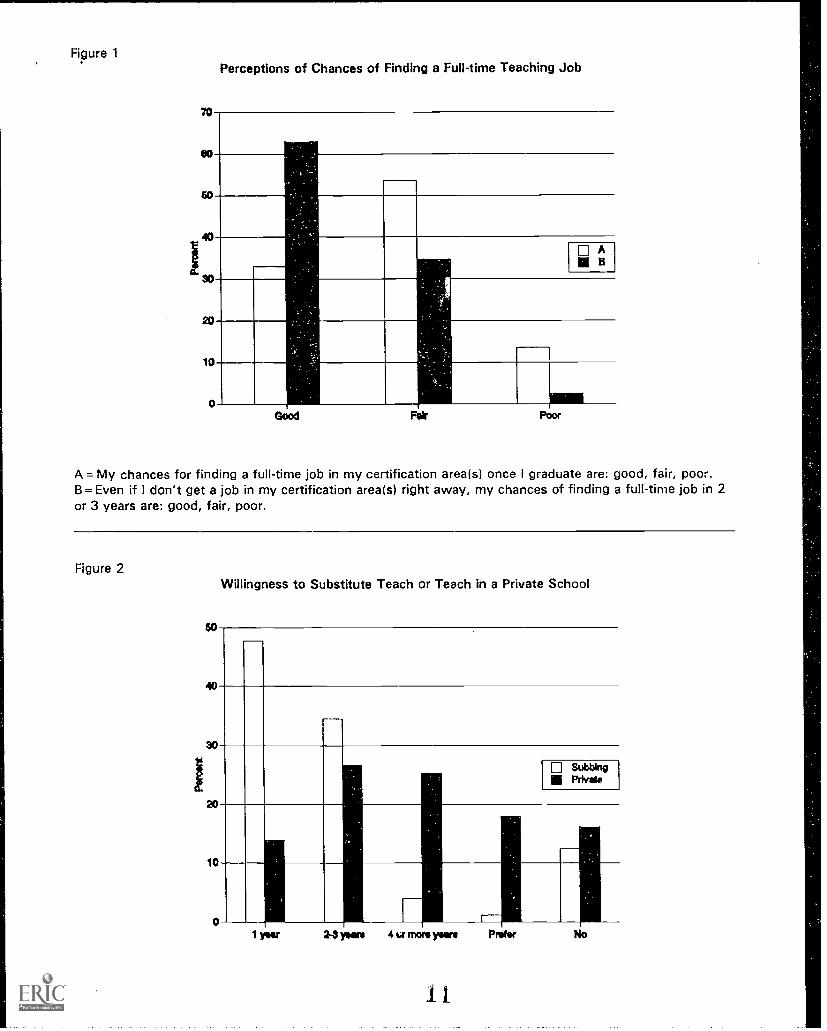
Figure 1Perceptions of Chances of Finding a Full-time Teaching Job
A = My chances for finding a full-time job in my certification area(s) once I graduate are: good, fair, poor.B = Even if I don't get a job in my certification area(s) right away, my chances of finding a full-time job in 2or 3 years are: good, fair, poor.
Figure 2
50
Willingness to Substitute Teach or Teach in a Private School
40
90
Subbingill Private
20
10
ri01 par 2-3 pars 4 more pars Pro*
ts,)
Per
cent
0._
=TR.
k..
z z.
EP i I
ENE
<
i.4,
:,....
..<
.,.,-
,t
m5,
,,,,.:
.a.m
.a...
..<.<
.< (
.4.4
,,,.z
.....w
4,.z
.u.z
.mum
uzza
ltatt<
=04:fti:titttitift'2
=tftt5;:itaUZZ:
[:w
:t1
Por
cvnt
ita
:z4E
taiti
iiitE
EM
BE
IV:ii
iiitE
RE
IBE
INE
HE
::
;%;.;
;:%.;
...?.
?....
.m...
t.
NM
*
3II
''"ig
aKE
'MN
,i,, 5
'
Perceptions of Preservice Teachers, page 10
Three years seems to be the limit of substitute teaching as only 4% indicate awillingness to sub for 4 or more years and 1% answer that they prefer subbing over full-timeteaching.
The competitive job market may also lead more teachers to consider private schoolteaching as an alternative even though private school salaries and benefits usually are muchless substantial than public school salaries and benefits. In fact, 18% answer that they preferteaching in a private school rather than a public school while 16% indicate that they are notinterested in private school teaching. A higher percentage of respondents are willing to teachfor a longer time in private schools than they are willing to serve as a substitute teacher:14% are willing to teach one year in a private school; 27% are willing to teach for two tothree years; and 25% are willing to teach four or more years. Figure 2 compares willingnessto substitute teach to willingness to teach in a private school.
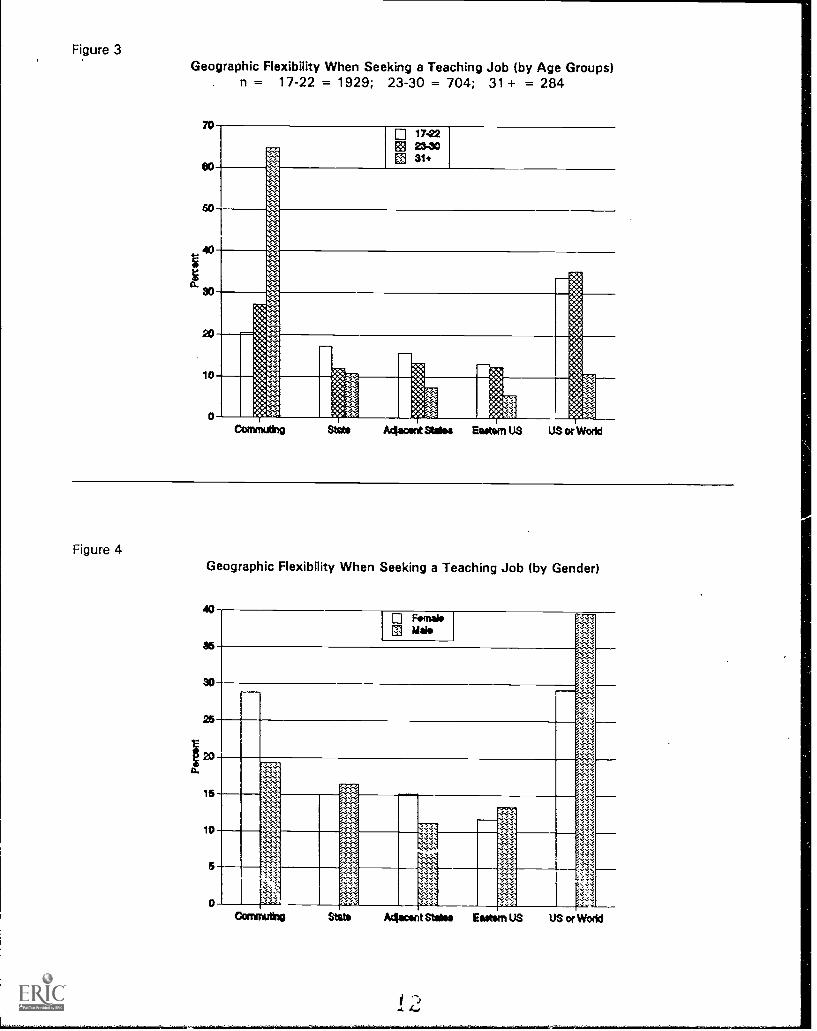
While over a quarter of the preservice teachers (26%) will limit their job search to acommuting distance, nearly a third (32%) indicate a willingness to travel throughout theUnited States (22%) or the world (10%) to find a teaching job. Overall, the preserviceteachers appear to be willing to relocate: 15% are willing to move within their state; 14% tosurrounding states; and 12% throughout the eastern United States.
As expected, older preservice teachers are less mobile than their younger colleagues.Figure 3 shows the geographic mobility of the respondents by three age groups. Males aremore mobile than females as figure 4 shows.
Almost a third (32%) respond that their teacher's salary will be their only source ofincome; 13% that their salary will be their family's major source of income; and 55% that
. their salary will be combined with or secondary to another salary in the family. More females(33%) than males (26%) indicate that their salary will be the only source of income. Over halfof both females (56%) and males (53%) respond that their salaries will be combined with orsecondary to another salary in the family.
Job Market Perceptions by Teaching Field
Opportunities in teaching are largely defined by the certification the preservice teachersearn. The 1995 MAASCUS employer survey shows that some areas have a surplus ofteachers and other areas have a shortage of teachers. Two areas worth comparing are theperceptions of the 1213 respondents seeking elementary education and/or early childhoodeducation certification only (no other certification fields were marked by these preserviceteachers) with those seeking certification in special education and possibly anothercertification field, which could include elementary and/or early childhood education (n =400).Although the special education respondents may have marked another certification area, noneof them would fall into the category of elementary and/or early childhood only. The twogroups are exclusive of each other.
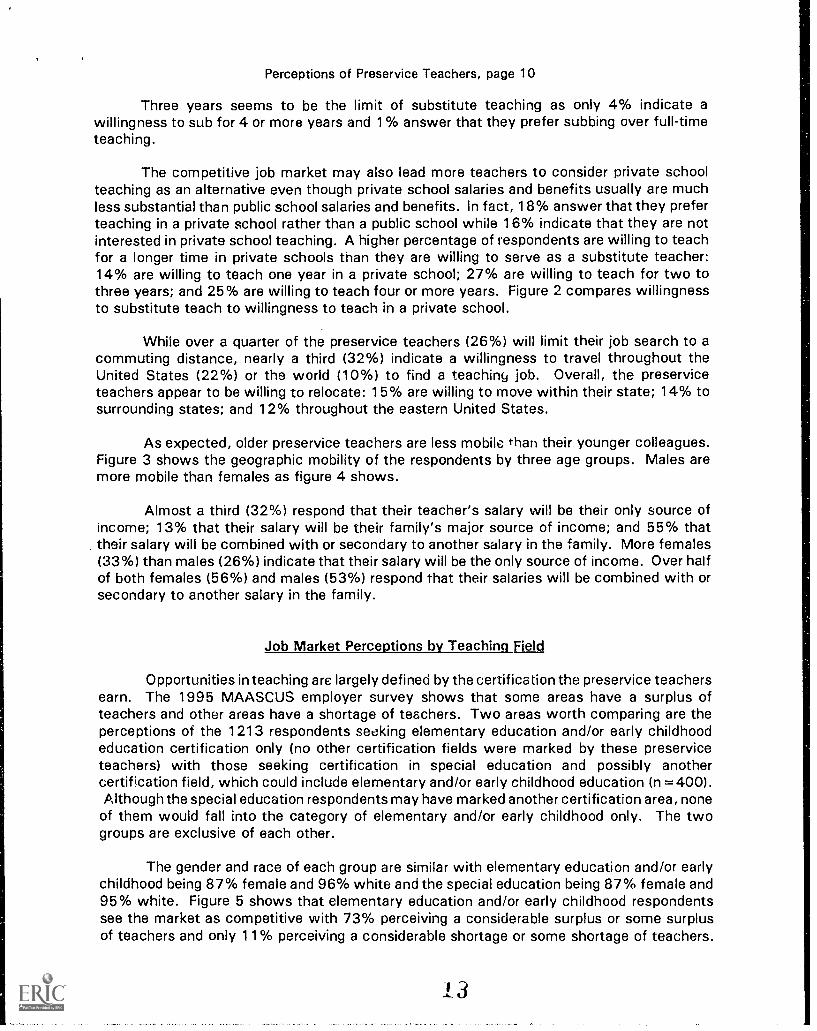
The gender and race of each group are similar with elementary education and/or earlychildhood being 87% female and 96% white and the special education being 87% female and95% white. Figure 5 shows that elementary education and/or early childhood respondentssee the market as competitive with 73% perceiving a considerable surplus or some surplusof teachers and only 11% perceiving a considerable shortage or some shortage of teachers.
Figure 5
Figure 6
Perceptions of the Supply of Teachers to Opportunities by Certification Area
40
30
25
20-
16
10
5
o ElEdSLECIISpecial Ed
10
Can Shortage Some &wisp, Balanced Some Surplus Con Surplus
Perceptions of Chances of Finding a Full-time Job in 2 to 3 YearsElementary and Early Childhood Education vs. Special Education
ElEd&EChN Special Ed
0:55551
Poor
3EST COPY AVAILABLE
Perceptions of Preservice Teachers, page 12
A higher percentage of special education preservice teachers, however, perceive aconsiderable shortage or some shortage of teachers (59%), while only 15% sense aconsiderable surplus or some surplus of teachers.
Figure 6 illustrates the two groups' perceptions of getting a full-time job in 2 to 3years. The special education preservice teachers are more optimistic about their chances offinding a job with 79% rating their chances as good, 19% as fair, and only 2% as poor.While the optimism of the elementary education and/or early childhood preservice teachersis not as strc, g as the special education respondents, the majority (57%) do rate theirchances of finding a full-time job in 2 to 3 years as good, 40% as fair, and 3% as poor.
It is important to note that the employers participating in the 1995 MAASCUS surveyperceive special education certification areas as having a balanced supply of teachers or someshortage of teachers while they perceive all elementary and early childhood education areasas experiencing a considerable surplus of teachers (see Table 2).
Both groups are similar in their willingness to substitute teach with 48% of elementaryand/or early childhood preservice teachers indicating a willingness to substitute for one yearcompared to 50% of special education preservice teachers; 36% of elementary educationand/or early childhood preservice teachers are willing to sub for 2 to 3 years compared to31% of special education; and 4% of elementary education and/or early childhood are willingto sub for 4 or more years compared to 4% of special education. A higher percentage ofspecial education preservice teachers, however, are not willing to sub (14%) compared toelementary education and/or early childhood (11%).
Despite elementary and/or early childhood preservice teachers perceiving a morecompetitive job market (Figure 5), these respondents are slightly less mobile with 29%planning to seek a job within commuting distance compared to 26% of special educationrespondents. Less elementary and/or early childhood preservice teachers are willing torelocate throughout the United States or the world (28%) compared to special education(29%).
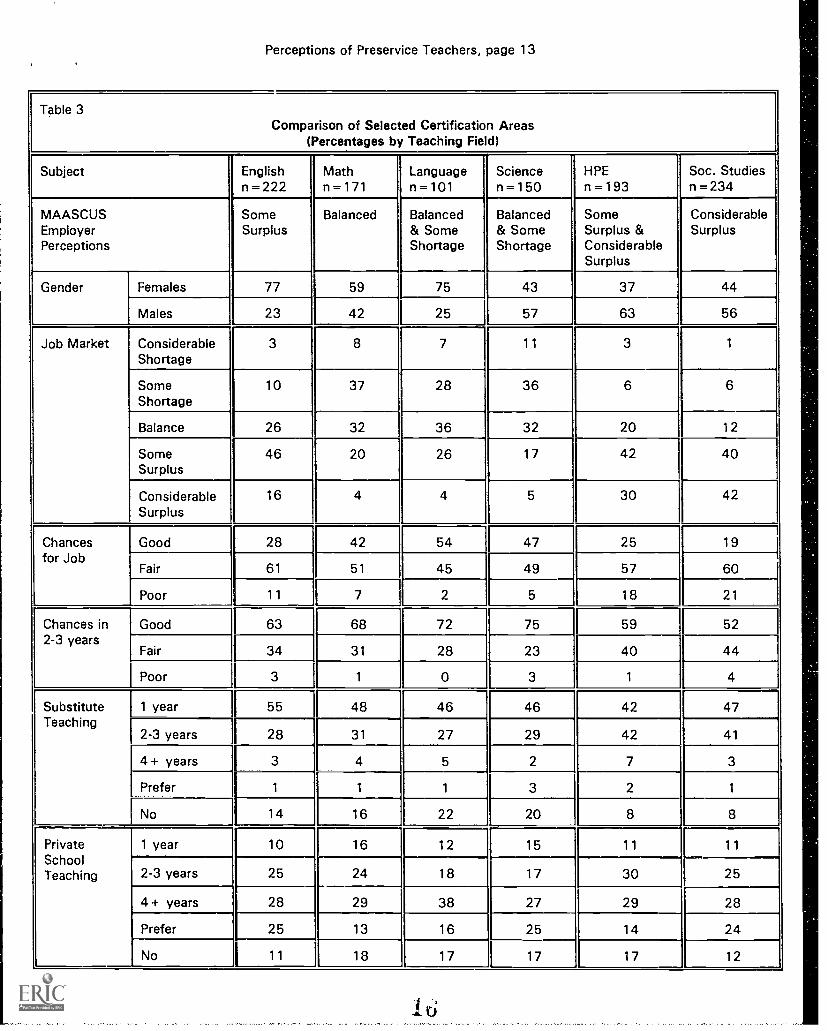
Table 3 provides a comparison of the most popular certification areas from the survey.Three of the areas, English, HPE (combined areas of health education and physical education),and social studies, are perceived by MAASCUS employers as having a surplus of teachers.The other three areas, math, language (combined areas of French, German, Spanish, andother), and science (combined ..deas of biology, chemistry, earth & space, general, physics,and other), are perceived as either having a balanced supply of teachers or a shortage ofteachers.
Social studies preservice teachers perceive the market as the most competitive with42% identifying a considerable surplus of teachers. HPE preservice teachers are next in termsof perceiving a considerable surplus of teachers with 30%. More science preservice teachersperceive a considerable shortage of teachers (11%) than any other areas.
When perceiving their chances of finding a job right after graduation, languagepreservice teachers are the most optimistic with 54% rating their chances as good. Socialstudies preservice teachers are least optimistic with 19% rating their chances as good and21% rating their chances as poor. Interestingly, 25% of HPE preservice teachers rate their
Perceptions of Preservice Teachers, page 13
Table 3Comparison of Selected Certification Areas
(Percentages by Teaching Field)
Subject Englishn =222
Mathn =171
Languagen =101
Sciencen =150
HPEn = 193
Soc. Studiesn =234
MAASCUSEmployerPerceptions
SomeSurplus
Balanced Balanced& SomeShortage
Balanced& SomeShortage
SomeSurplus &ConsiderableSurplus
ConsiderableSurplus
Gender Females 77 59 75 43 37 44
Males 23 42 25 57 63 56
Job Market ConsiderableShortage
3 8 7 11 3 1
SomeShortage
10 37 28 36 6 6
Balance 26 32 36 32 20 12
SomeSurplus
46 20 26 17 42 40
ConsiderableSurplus
16 4 4 5 30 42
Chancesfor Job
Good 28 42 54 47 25 19
Fair 61 51 45 49 57 60
Poor 11 7 2 5 18 21
Chances in2-3 years
Good 63 68 72 75 59 52
Fair 34 31 28 23 40 44
Poor 3 1 0 3 1 4
SubstituteTeaching
1 year 55 48 46 46 42 47
2-3 years 28 31 27 29 42 41
4 + years 3 4 5 2 7 3
Prefer 1 1 1 3 2 1
No 14 16 22 20 8 8
PrivateSchoolTeaching
1 year 10 16 12 15 11 11
2-3 years 25 24 18 17 30 25
4 + years 28 29 38 27 29 28
Prefer 25 13 16 25 14 24
No 11 18 17 17 17 12
16
Perceptions of Preservice Teachers, page 14
Table 3 ContinuedComparison of Selected Certification Areas
(Percentages by Teaching Field)
Subject English Math Language Science H PE Soc. Studies
Location Commuting 27 32 23 27 18 13
State 11 14 14 11 22 14
Adjacent 14 16 16 11 12 12
Eastern U.S. 10 10 7 10 14 14
U.S. or World 39 25 41 40 34 47
Salary Only Source 36 28 30 31 17 34
Major Source 14 16 15 15 19 15
Combined 39 47 45 44 52 44
Secondary 11 9 11 9 11 7
Language = cert f cat on areas of French, German, Spanish, and ot erScience = certification areas of Biology, Chemistry, Earth & Space, General, Physics, and otherHPE = certification areas of Health Education and Physical Education
chances as good although 72% perceive some or considerable surplus of teachers in themarket; and 28% of English preservice teachers rate their chances as good although 62%perceive some or considerable surplus of teachers in the market.
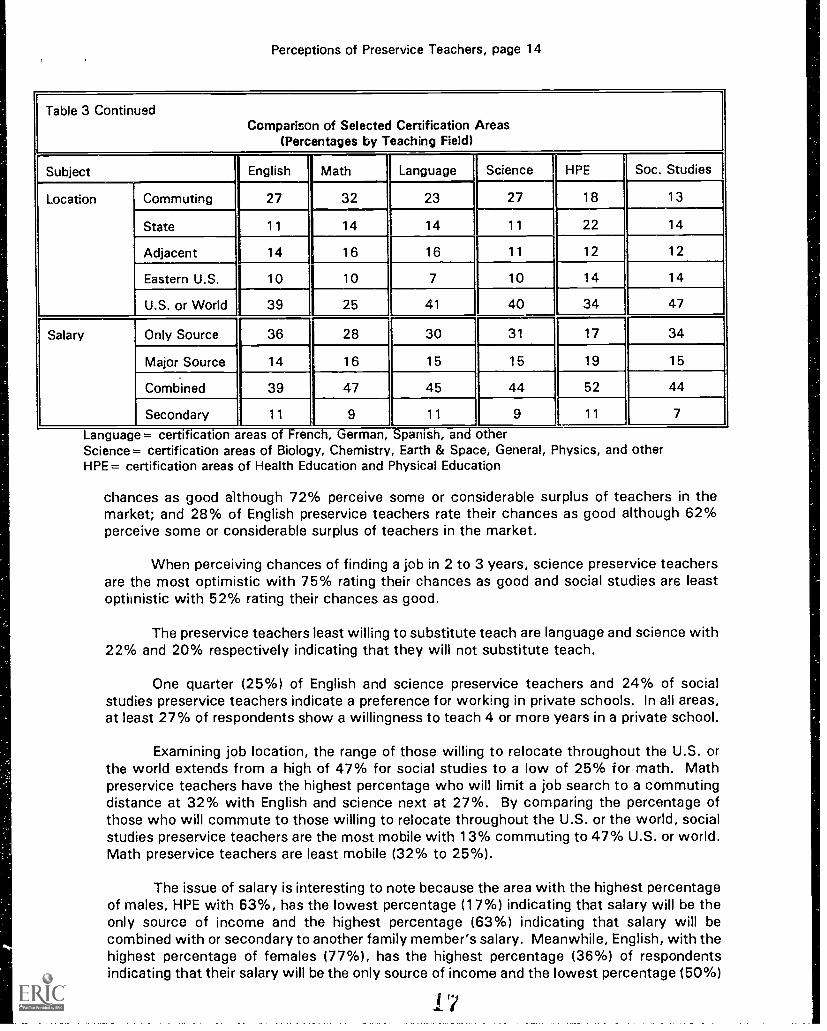
When perceiving chances of finding a job in 2 to 3 years, science preservice teachersare the most optimistic with 75% rating their chances as good and social studies are leastoptimistic with 52% rating their chances as good.
The preservice teachers least willing to substitute teach are language and science with22% and 20% respectively indicating that they will not substitute teach.
One quarter (25%) of English and science preservice teachers and 24% of socialstudies preservice teachers indicate a preference for working in private schools. In all areas,at least 27% of respondents show a willingness to teach 4 or more years in a private school.
Examining job location, the range of those willing to relocate throughout the U.S. orthe world extends from a high of 47% for social studies to a low of 25% for math. Mathpreservice teachers have the highest percentage who will limit a job search to a commutingdistance at 32% with English and science next at 27%. By comparing the percentage ofthose who will commute to those willing to relocate throughout the U.S. or the world, socialstudies preservice teachers are the most mobile with 13% commuting to 47% U.S. or world.Math preservice teachers are least mobile (32% to 25%).
The issue of salary is interesting to note because the area with the highest percentageof males, HPE with 63%, has the lowest percentage (17%) indicating that salary will be theonly source of income and the highest percentage (63%) indicating that salary will becombined with or secondary to another family member's salary. Meanwhile, English, with thehighest percentage of females (77%), has the highest percentage (36%) of respondentsindicating that their salary will be the only source of income and the lowest percentage (50%)
17
Perceptions of Preservice Teachers, page 15
indicating salary will be combined with or secondary to another family member's salary.
Why Teaching
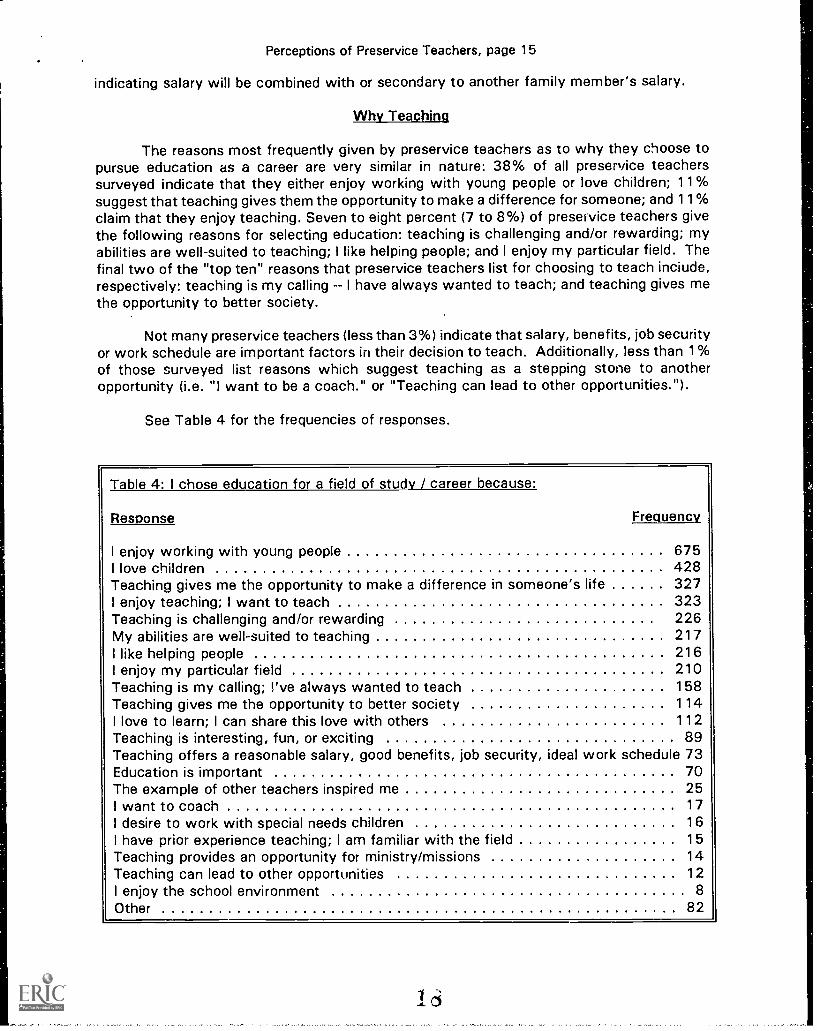
The reasons most frequently given by preservice teachers as to why they choose topursue education as a career are very similar in nature: 38% of all preservice teacherssurveyed indicate that they either enjoy working with young people or love children; 11%suggest that teaching gives them the opportunity to make a difference for someone; and 11%claim that they enjoy teaching. Seven to eight percent (7 to 8%) of presetvice teachers givethe following reasons for selecting education: teaching is challenging and/or rewarding; myabilities are well-suited to teaching; I like helping people; and I enjoy my particular field. Thefinal two of the "top ten" reasons that preservice teachers list for choosing to teach inciude,respectively: teaching is my calling -- I have always wanted to teach; and teaching gives methe opportunity to better society.
Not many preservice teachers (less than 3%) indicate that salary, benefits, job securityor work schedule are important factors in their decision to teach. Additionally, less than 1%of those surveyed list reasons which suggest teaching as a stepping stone to anotheropportunity (i.e. "I want to be a coach." or "Teaching can lead to other opportunities.").
See Table 4 for the frequencies of responses.
Table 4: I chose education for a field of study / career because:
Response Frequency
I enjoy working with young peopleI love childrenTeaching gives me the opportunity to make aI enjoy teaching; I want to teachTeaching is challenging and/or rewardingMy abilities are well-suited to teachingI like helping peopleI enjoy my particular fieldTeaching is my calling; I've always wanted to teachTeaching gives me the opportunity to better societyI love to learn; I can share this love with othersTeaching is interesting, fun, or excitingTeaching offers a reasonable salary, good benefits, jobEducation is importantThe example of other teachers inspired meI want to coachI desire to work with special needs childrenI have prior experience teaching; I am familiar with the fieldTeaching provides an opportunity for ministry/missionsTeaching can lead to other opportunitiesI enjoy the school environmentOther
675428
difference in someone's life 32732322621721621015811411289
security, ideal work schedule 7370251716151412
882
Perceptions of Preservice Teachers, page 16
Alternatives to Teaching
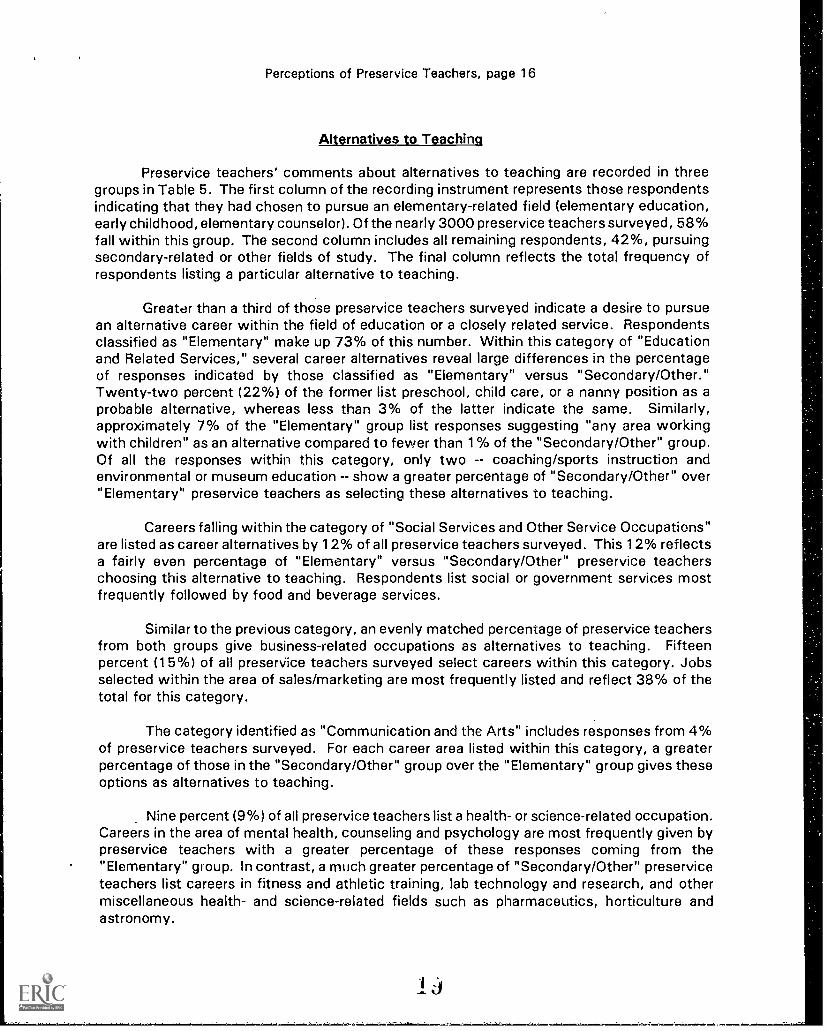
Preservice teachers' comments about alternatives to teaching are recorded in threegroups in Table 5. The first column of the recording instrument represents those respondentsindicating that they had chosen to pursue an elementary-related field (elementary education,early childhood, elementary counselor). Of the nearly 3000 preservice teachers surveyed, 58%fall within this group. The second column includes all remaining respondents, 42%, pursuingsecondary-related or other fields of study. The final column reflects the total frequency ofrespondents listing a particular alternative to teaching.
Greater than a third of those preservice teachers surveyed indicate a desire to pursuean alternative career within the field of education or a closely related service. Respondentsclassified as "Elementary" make up 73% of this number. Within this category of "Educationand Related Services," several career alternatives reveal large differences in the percentageof responses indicated by those classified as "Elementary" versus "Secondary/Other."Twenty-two percent (22%) of the former list preschool, child care, or a nanny position as aprobable alternative, whereas less than 3% of the latter indicate the same. Similarly,approximately 7% of the "Elementary" group list responses suggesting "any area workingwith children" as an alternative compared to fewer than 1 % of the "Secondary/Other" group.Of all the responses within this category, only two coaching/sports instruction andenvironmental or museum education show a greater percentage of "Secondary/Other" over"Elementary" preservice teachers as selecting these alternatives to teaching.
Careers falling within the category of "Social Services and Other Service Occupations"are listed as career alternatives by 12% of all preservice teachers surveyed. This 12% reflectsa fairly even percentage of "Elementary" versus "Secondary/Other" preservice teacherschoosing this alternative to teaching. Respondents list social or government services mostfrequently followed by food and beverage services.
Similar to the previous category, an evenly matched percentage of preservice teachersfrom both groups give business-related occupations as alternatives to teaching. Fifteenpercent (15%) of all preservice teachers surveyed select careers within this category. Jobsselected within the area of sales/marketing are most frequently listed and reflect 38% of thetotal for this category.
The category identified as "Communication and the Arts" includes responses from 4%of preservice teachers surveyed. For each career area listed within this category, a greaterpercentage of those in the "Secondary/Other" group over the "Elementary" group gives theseoptions as alternatives to teaching.
Nine percent (9%) of all preservice teachers list a health- or science-related occupation.Careers in the area of mental health, counseling and psychology are most frequently given bypreservice teachers with a greater percentage of these responses coming from the"Elementary" group. In contrast, a much greater percentage of "Secondary/Other" preserviceteachers list careers in fitness and athletic training, lab technology and research, and othermiscellaneous health- and science-related fields such as pharmaceutics, horticulture andastronomy.
j
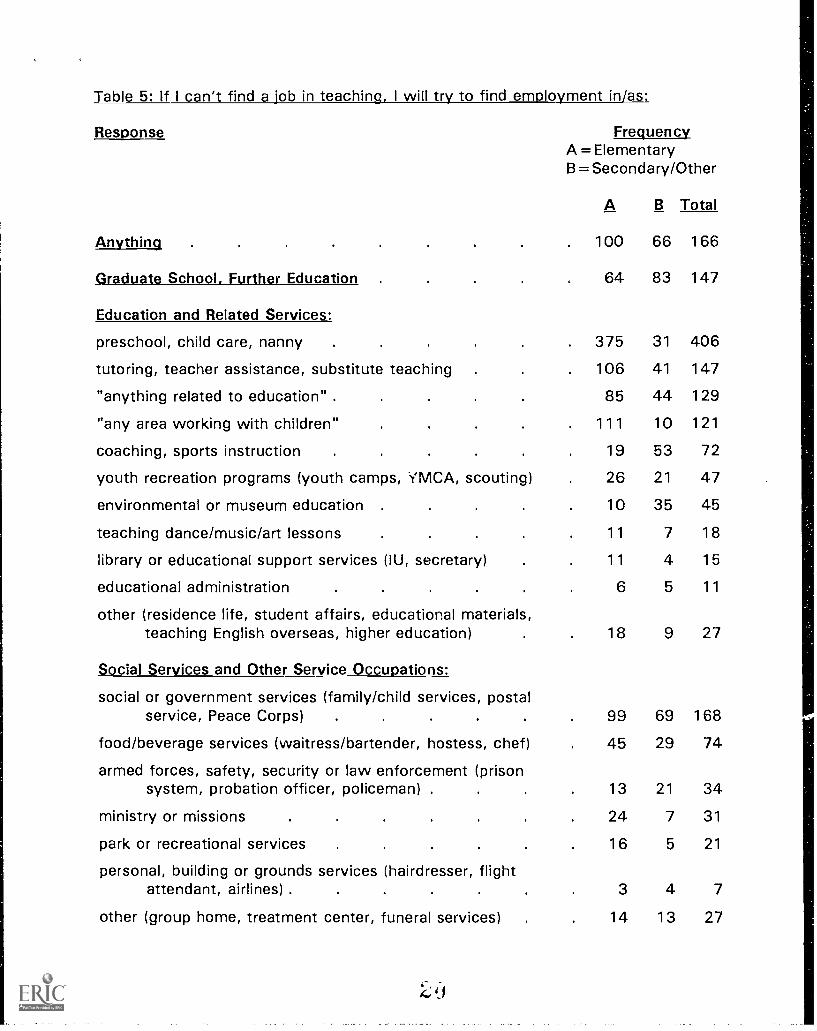
Table 5: If I can't find a job in teaching. I will try to find employment in/as:
Response
Anything .
Graduate School, Further Education
Education and Related Services:
preschool, child care, nanny .
tutoring, teacher assistance, substitute teaching
"anything related to education" .
"any area working with children"
coaching, sports instruction
youth recreation programs (youth camps, YMCA, scouting)
environmental or museum education .
teaching dance/music/art lessons
library or educational support services (IU, secretary)
educational administration
other (residence life, student affairs, educational materials,teaching English overseas, higher education)
Social Services and Other Service Occupations:
social or government services (family/child services, postalservice, Peace Corps) .
food/beverage services (waitress/bartender, hostess, chef)
armed forces, safety, security or law enforcement (prisonsystem, probation officer, policeman) .
ministry or missions
park or recreational services
personal, building or grounds services (hairdresser, flightattendant, airlines) .
other (group home, treatment center, funeral services)
FrequencyA =ElementaryB =Secondary/Other
A B Total
. 100 66 166
64 83 147
375 31 406
106 41 147
85 44 129
111 10 121
19 53 72
26 21 47
10 35 45
11 7 18
11 4 15
6 5 11
18 9 27
99 69 168
45 29 74
13 21 34
24 7 31
16 5 21
3 4 7
14 13 27
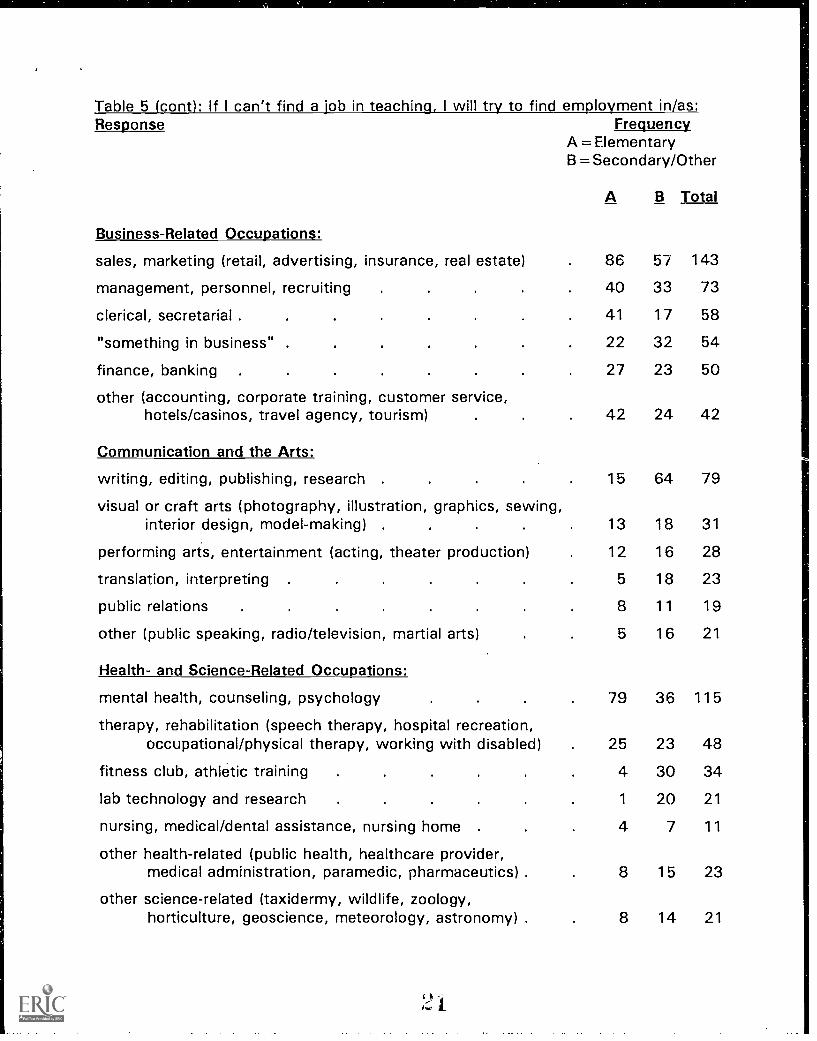
Table 5 (cont): If I can't find a job in teaching. I will try to find employment in/as:Response Frequency
A =ElementaryB =Secondary/Other
Business-Related Occupations:
sales, marketing (retail, advertising, insurance, real estate)
management, personnel, recruiting .
clerical, secretarial .
"something in business" .
finance, banking .
other (accounting, corporate training, customer service,hotels/casinos, travel agency, tourism)
Communication and the Arts:
writing, editing, publishing, research
visual or craft arts (photography, illustration, graphics, sewing,interior design, model-making) .
performing aris, entertainment (acting, theater production)
translation, interpreting
public relations
other (public speaking, radio/television, martial arts)
Health- and Science-Related Occupations:
mental health, counseling, psychology
therapy, rehabilitation (speech therapy, hospital recreation,occupational/physical therapy, working with disabled)
fitness club, athletic training
lab technology and research
nursing, medical/dental assistance, nursing home .
other health-related (public health, healthcare provider,medical administration, paramedic, pharmaceutics) .
other science-related (taxidermy, wildlife, zoology,horticulture, geoscience, meteorology, astronomy) .
A B Total
86 57 143
40 33 73
41 17 58
22 32 54
27 23 50
42 24 42
15 64 79
13 18 31
12 16 28
5 18 23
8 11 19
5 16 21
79 36 115
25 23 48
4 30 34
1 20 21
4 7 11
8 15 23
8 14 21
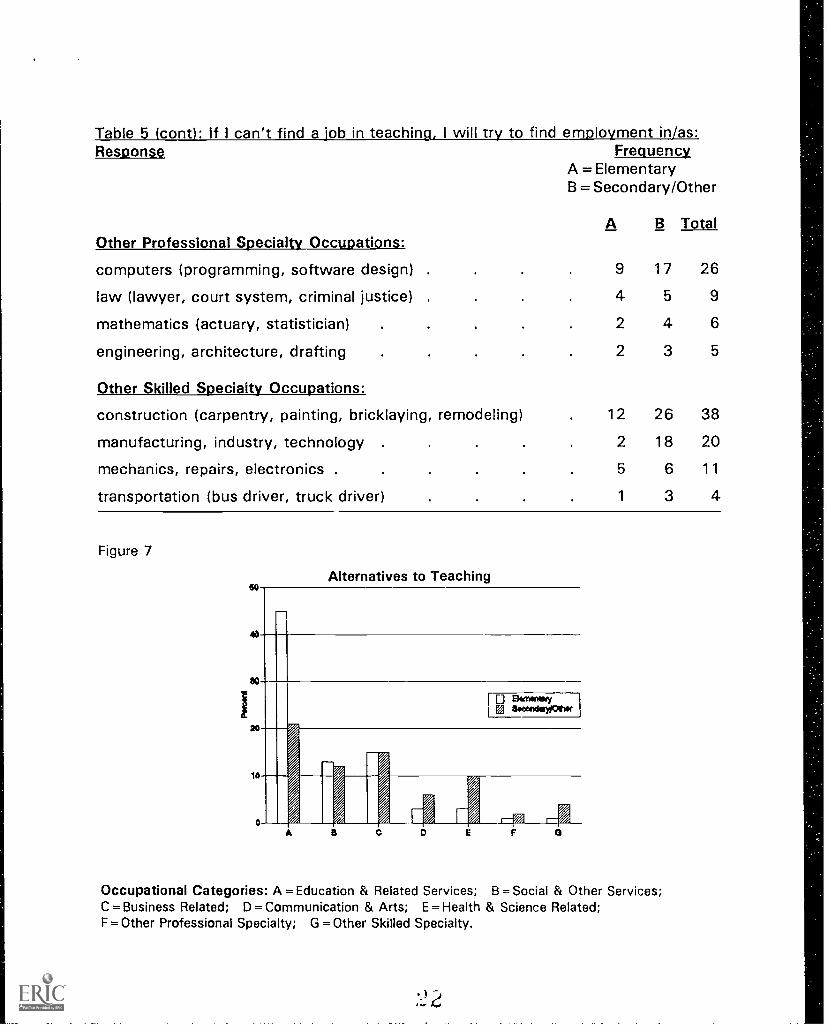
Table 5 (cont): If I can't find a job in teaching. I will try to find employment in/as:Response Frequency
A =ElementaryB =Secondary/Other
Other Professional Specialty Occupations:
computers (programming, software design)
law (lawyer, court system, criminal justice)
mathematics (actuary, statistician)
engineering, architecture, drafting
Other Skilled Specialty Occupations:
construction (carpentry, painting, bricklaying, remodeling)
manufacturing, industry, technology .
mechanics, repairs, electronics .
transportation (bus driver, truck driver)
A B Total
9 17 26
4 5 9
2 4 6
2 3 5
12 26 38
2 18 20
5 6 11
1 3 4
Figure 7
Alternatives to Teaching
10
A
o Elamenumytai siocnalocriff
Occupational Categories: A =Education & Related Services; B = Social & Other Services;C = Business Related; D =Communication & Arts; E =Health & Science Related;F =Other Professional Specialty; G =Other Skilled Specialty.
Perceptions of Preservice Teachers, page 20
Of the less than 2% of preservice teachers listing alternative careers falling under"Other Professional Specialty Occupations," more than half list computer-related fields."Secondary/Other" preservice teachers make up the greater percentage in this category over"Elementary" preservice teachers. Careers considered as "Other Skilled SpecialtyOccupations" are recorded by less than 3% of those surveyed. Again, the "Secondary/Other"groun represents the greater percentage, 73%, of these responses. Figure 7 illustrates acomparison of elementary and secondary preservice teachers' selections of alternativeocc ipations within the major categories discussed above.
Occasionally, respondents express a willingness to pursue "anything" in lieu ofteaching; close to 6% of those surveyed indicate such. Five percent (5%) communicate adesire to pursue a graduate degree or further their education as opposed to pursuing analternative career. Others may not have indicated a specific desire to return to school, yet listcareers for which further education would most likely be required (i.e. lawyer).
Comments of Respondents
Preservice teachers supplying comments offer a variety of additional observationsrelated to the survey. The majority of comments can be categorized into the following areas:perceptions of the job market; perceptions of key factors in securing a teaching position; andsuggestions for improving preservice teachers' experiences in the field of education andunderstanding of the job market.
Respondents most frequently express concern over finding a job upon graduadon oracknowledge a current surplus of teachers that makes the job market particularly challenging.The following examples represent typical responses: "I am most worried about finding anyteaching job, whether it be a public or private school. I'll take whatever I can get as long asI can teach," and, "I hope the job market opens up so I can get a job!" Others state theiruncertainty about the -tatus of the market for teaching positions. "I haven't a clue about thejob market," and, "I'm not sure my perception of the job market is accurate," arerepresentative examples. Several respondents opine that "older" teachers should retire,making jobs available for new graduates; an equal number voice their understanding that manyteachers would soon retire, creating a need for teachers to fill those positions.
In addition, preservice teachers offer their ideas as to what makes them mostmarketable in the search for a teaching job. Factors below are listed in order of frequency,from greatest to least:
1) Certification in a particular field: special education, foreign language, science,math
2) Persistence, determination, a positive attitude3) Willingness to relocate4) Excellent grade&5) Male (especially in elementary)6) More than one certification7) Willingness to teach in rural or urban areas8) Age or life experiences9) Ability to coach10) Further education11) Experience traveling abroad
Perceptions of Preservice Teachers, page 21
Finally, respondents suggest changes that might help to increase their chances atsecuring a teaching job or expand their understandings of the job market. Representativeexamples are listed below with frequencies included in parentheses if more than one studentgave a similar response.
"The education department needs more teaching and practical experience forsecondary education students. I am a junior and have had only one teachingexperience." (3)
"There should be a strict GPA or requirement for educators in college!" (2)
"I find it ridiculous, especially for students planning to work in private schools, thateducation majors can't minor or concentrate in art or music."
"Upcoming teachers should be exposed to technological advances i.e. computersso that they will have a background in tools for the classroom."
"We should be prepared earlier for the job search (junior year or first semester senioryear). We are not notified that we should be beginning our job search process until webegin student teaching. This is the semester when we have no time to adequatelyundertake this process."
"Please have more of the conferences and job fairs."
"Would like to see a newsletter/information of teaching jobs relevant to my majornationwide Internet somehow with the want ads."
"Get information on other states' requirements for certification for us."
"I think more emphasis should be placed on jobs other than teaching that we canpursue with an education degree." (3)
"After four years of school I wish I had been exposed to more majors and theirresulting jlbs. I might have chosen differently. Within my major I wish I had had morehands-on sooner; by the time you do it's almost too late to switch."
"Please cons!der surveying recent graduates about where they found jobs, if those jobsare in their chosen fields, their salary, length of time spent looking for a job, etc. It'snot only useful information for us but for potential students shopping for a program."
: '4
Perceptions of Preservice Teachers, page 22
Conclusions
As with many research reports, this study uncovers more questions than answers.Each observation of the data leads to more areas deserving additional research.
Perceptions of the Job Market
The preservice teachers surveyed seem to recognize that the job market is competitive,in some case extremely competitive. Their perceptions are similar to the Mid-Atlantic regionschool employers who were surveyed at approximately the same time (MAASCUS, 1995).However, the majority of preservice teachers view their chances of getting a job optimistically.This optimism is especially evident when asked about their chances for employment in 2 to3 years. Few respondents view their chances for full-time employment as poor despite theirown recognition of a competitive job market. It would be interesting to follow some of thesepreservice teachers in their job searches to see if this optimism dims as they compete in themarket and to see if they do secure full-time jobs in 2 to 3 years.
The preservice teachers also indicate a willingness, on the whole, to serve as substituteteachers. Most, however, will not substitute beyond a three year period. Again, it would beinteresting to see if these preservice teachers substitute longer than three years or if they seekother professions if substituting does not lead to full-time employment.
Many preservice teachers are willing to teach in a private school. This could be inreaction to the competitive market or for other reasons. The question to ask here is whetherthe lower salaries in most private schools (compared to public schools) will cause those whoteach there to seek public school positions or jobs outside of education.
The survey also shows a significant number of preservice teachers willing to relocate.Whether these teachers actually relocate for employment remains to be seen. Relocation canbecome a political issue as well with legislators questioning the purpose of educating teachersat state supported colleges and universities only to have them leave the state and become taxpayers elsewhere. A topic which this survey does not address is the willingness of preserviceteachers to teach at urban schools. In some ways, this question is similar to the relocationquestion, although other studies address the complexities involved with teaching in an urban,multicultural environment.
These research studies stress the importance of training teachers to work in an urbanenvironment. Relocation, on the other hand, is more a matter of willingness to do so ratherthan spdcific preparation. The respondents in this survey may view their chances of findinga full-time job as good in 2 to 3 years because they are willing to relocate. Willingness torelocate in and of itself, however, does not guarantee employment although those willing torelocate do provide themselves more vacancies to consider.
While school personnel representatives may wonder why so many people are seekingemployment in certification areas of con: iderable teacher surplus, in this survey the majorityof preservice teachers choose their certification areas with a perception of the job market thatis similar to the perception of employers. These preservice teachers, however, may not berealistic about their chances for employment as the majority rate their chances of finding afull-time job in 2 to 3 years as good despite a competitive market. While this report does not
Perceptions of Preservice Teachers, page 23
explore how long teachers, on average, search for a full-time job, common sense dictates thatwith a competitive job market, as shown by the MAASCUS survey in Table 2, and withpreservice teachers recognizing such, more preservice teachers would have rated theirchances for finding full-time teaching jobs as poor.
Why Teaching
Many of the reasons for choosing to teach given most frequently by those surveyedare consistent with the reasons reported in the literature. The top three responses workingwith young people, a love of children, and desire to make a difference closely match threeof the first four reasons reported by Myers and Neely (1990). The most frequently selectedreasons stated by Zimpher (1989) and King (1993) are also among the top ten responses ofthe preservice teachers in this survey. According to the majority of responses, those enteringthe field of education seem to be intrinsically motivated to teach. Reasons such as a love ofchildren, desire to make a difference, enjoyment of teaching, interest in helping others, andopportunity to better society suggest this.
The fact that less than 3% of preservice teachers list income, benefits and job securityas reasons for entering the field of education supports the findings of Zimpher (1989)indicating that education majors are generally less concerned about these areas than theirpeers. These reasons also reflect external rewards as motivations for teaching, which arecited much less frequently by those surveyed.
Some individuals recognize that their natural abilities lend themselves well to teaching.Responses such as, "My abilities are well-suited to teaching," and, "Teaching is my calling;I've always wanted to teach," reflect this. It would be interesting to follow the careers ofthose who list such reasons and see if these teachers are more successful in their field asSerow (1994) suggests.
Perhaps this focus on wanting to be a teacher contributes to the respondents' overalloptimism toward finding a full-time job either immediately or 2 to 3 years later. Perhaps theintrinsic motivation to teach and desire to help others are related to this optimism. If theserespondents view teaching aF, a "noble profession" which requires self-sacrifice to serveothers, maybe they feel that they ought to be rewarded with a job. Could an unconsciousthought be: "I want to teach; I want to make a difference; therefore it is right that I get ajob"? The data do not address this speculation, but it is worth considering.
Alternatives to Teaching
When comparing general categories of alternatives given by preservice teachers,occupations other than teaching that fall within the category of "Educ ation and RelatedServices" are listed most frequently. The desire to remain within the field of education or aclosely related field might be expected of those pursuing a teaching career. However, asnoted earlier, this does not seem to hold equally true for elementary and secondary preserviceteachers. Forty-seven percent (47%) of responses given by those classified as "Elementary"fall within this category compared to only 25% of career alternatives listed by those classifiedas "Secondary/Other."
Perceptions of Preservice Teachers, page 24
Similar to the observances of others, elementary preservice teachers often select careeralternatives that still provide them with the opportunity to work with children; greater thanhalf of their responses reflect this desire, including such occupational areas related toeducation as preschool, child care, tutoring, substitute teaching, "any area working withchildren," youth recreation programs, counseling, and speech therapy. In contrast, responsesgiven by secondary preservice teachers are more evenly distributed among various categories.Either elementary preservice teachers are focused on employment in a helping profession orthey may not understand how their skills may be applied to other areas of work. It may bea combination of the two.
Again consistent with the literature and as expected, secondary preservice teachersoften select career alternatives falling within the realm of their academic field. This wasevident while recording secondary preservice teachers' responses, although their responsesare not specifically subdivided by major on the recording instrument. For instance, Englishmajors often list careers such as writing, editing or public speaking; various science majorsselect lab technology and research, zoology, meteorology; math -lajors give responses likeactuary/statistician or positions related to computers; health and physical education majorsmight list coaching, therapy, or athletic training. Thus, cumulatively, responses for secondarypreservice teachers occur more frequently in occupational categories other than "Educationand Related Services."
On occasion, respondents, when listing an occupation, would indicate their alternativeas a return to a former job. It would be interesting to ask how many responses reflectprevious occupations, then compare the percentage of elementary versus secondarypreservice teachers specifying such.
Comments of Respondents
The comments of many preservice teachers indicate an awareness of the challengingjob market. For many, a sense of frustration or desperation accompanies this. For some, theacknowledgement of a current teacher surplus is followed by a statement of determinationto obtain a teaching position, nevertheless. A fascinating study would be to examine ifdetermination and a positive attitude have any effect on job acquisition, especially sinceseveral respondents feel that this is a factor in finding a job.
It is particularly interesting to note what preservice teachers see as the keys to findinga teaching job. It appears that many are accurate in their perception of what makes themmarketable, however, "ability to teach" or "competence in teaching" is not directly stated.They do list "excellent grades", but do not cite an ability to apply their skills in the classroomas a marketable reason. This may be a good question to ask preservice teachers on futuresurveys. The results could then be compared to the factors that make teacher candidatesmore marketable as identified by employers.
Perceptions of Preservice Teachers, page 25
References
Association for School, College and University Staffing (1995). Teacher Supply andDemand in the United States, 1994 Report. Evanston, IL.
Cohen, M., B. Klink, and J. Grana (1990). Teacher Retention: A Longitudinal Comparisonof Those Who Teach and Those Who Don't. Paper presented at the annual meeting of theAmerican Educational Research Association, Boston, MA.
Feistritzer, C.E. (1993). "A National Overview of Alternative Teacher Certification,"Education and Urban Society, 26(1), 18-28.
Gilbert, S.L. (1995), "Perspectives of Rural Teachers Toward Teaching in Urban Schools,"Urban Education, 30(3), 290-305.
King, S.H. (1993). "Why Did We Choose Teaching Careers and What Will Enable Us toStay?: Insights from One Cohort of the African American Teaching Pool," Journal ofNegro Education, 62(4), 475-491.
Mid-Atlantic Association for School, College and University Staffing (1995). TeacherSupply and Demand, A 1995 MAASCUS Research Report. Slippery Rock, PA.
Myers, C.B. and A.M. Neely (1990). Professional Knowledge and Perceptions of BeginningTeacher Education Students: Institutional and Group Comparisons. Paper presented at theannual meeting of the American Educational Research Association, Boston, MA.
Serow, R. (1994). "Called to Teach: A Study of Highly Motivated Pre-Service Teachers,"The Journal of Research and Development in Education, 27(2), 65-71.
Schaerer, J.W. and K.E. Hansing (1994). Teacher and Administrator Supply and Demandfor the Southeast. Southeastern Association of School, College and University Staffing.Dalton, GA.
Stevens, C.J. and M. Dial (1993). "A Qualitative Study of Alternatively CertifiedTeachers," Education and Urban Society, 26(1), 63-77.
Zimpher, N. (1989). "The RATE Project: A Profile of Teacher Education Students," Journalof Teacher Education, 40(6), 27-30.
Perceptions of Preservice Teachers, page 26
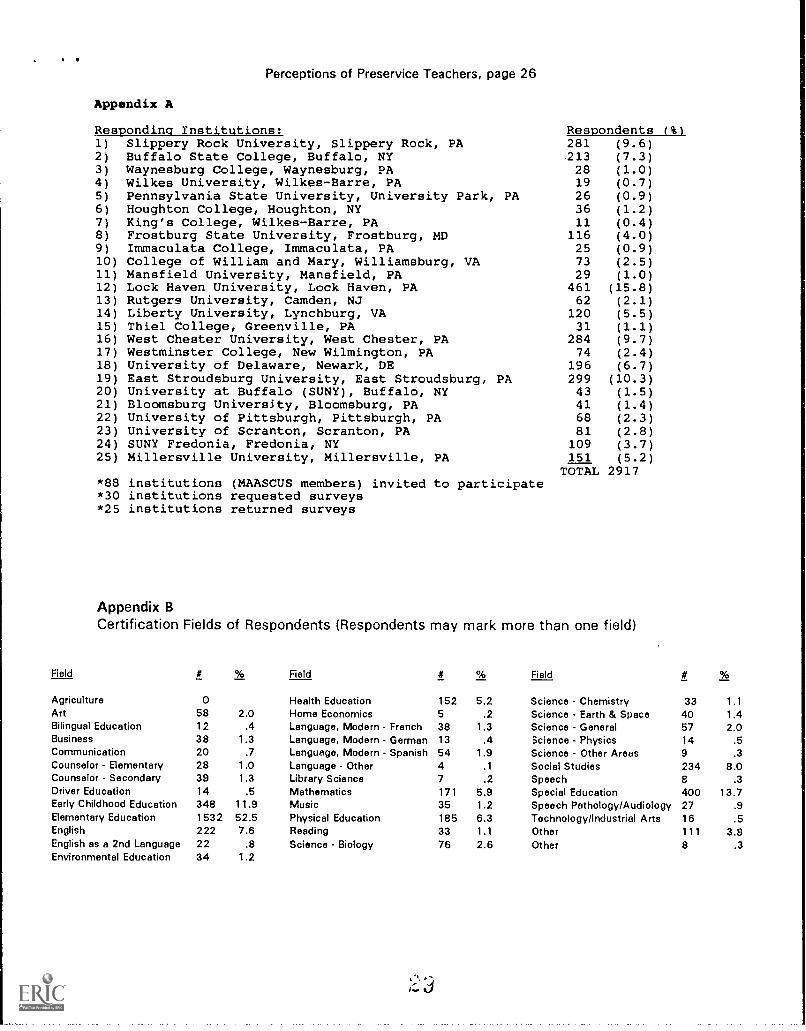
Appendix A
Responding Institutions:1)
2)3)4)5)
6)
7)8)9)10)11)12)13)14)15)16)17)18)19)20)21)22)23)24)25)
Respondents (%)Slippery Rock University, Slippery Rock, PABuffalo State College, Buffalo, NYWaynesburg College, Waynesburg, PAWilkes University, Wilkes-Barre, PAPennsylvania State University, University Park, PA
281213281926
(9.6)(7.3)(1.0)(0.7)(0.9)
Houghton College, Houghton, NY 36 (1.2)King's College, Wilkes-Barre, PA 11 (0.4)Frostburg State University, Frostburg, MD 116 (4.0)Immaculata College, Immaculata, PA 25 (0.9)College of William and Mary, Williamsburg, VA 73 (2.5)Mansfield University, Mansfield, PA 29 (1.0)Lock Haven University, Lock Haven, PA 461 (15.8)Rutgers University, Camden, NJ 62 (2.1)Liberty University, Lynchburg, VA 120 (5.5)Thiel College, Greenville, PA 31 (1.1)West Chester University, West Chester, PA 284 (9.7)Westminster College, New Wilmington, PA 74 (2.4)University of Delaware, Newark, DE 196 (6.7)East Stroudsburg University, East Stroudsburg, PA 299 (10.3)University at Buffalo (SUNY), Buffalo, NY 43 (1.5)Bloomsburg University, Bloomsburg, PA 41 (1.4)University of Pittsburgh, Pittsburgh, PA 68 (2.3)University of Scranton, Scranton, PA 81 (2.8)SUNY Fredonia, Fredonia, NY 109 (3.7)Millersville University, Millersville, PA 151 (5.2)
TOTAL 2917*88 institutions (MAASCUS members) invited to participate*30 institutions requested surveys*25 institutions returned surveys
Appendix BCertification Fields of Respondents (Respondents may mark more than one field)
Field 0/0 Field Field
Agriculture 0 Health Education 152 5.2 Science Chemistry 33 1.1Art 58 2.0 Home Economics 5 .2 Science - Earth & Space 40 1.4Bilingual Education 12 .4 Language, Modern - French 38 1.3 Science - General 57 2.0Business 38 1.3 Language, Modern - German 13 .4 Science - Physics 14 .5Communication 20 .7 Language, Modern - Spanish 54 1.9 Science - Other Areas 9 .3Counselor - Elementary 28 1.0 Language - Other 4 .1 Social Studies 234 8.0Counselor - Secondary 39 1.3 Library Science 7 .2 Speech 8 .3Driver Education 14 .5 Mathematics 171 5.9 Special Education 400 13.7Early Childhood Education 348 11.9 Music 35 1.2 Speech Pathology/Audiology 27 .9Elementary Education 1532 52.5 Physical Education 185 6.3 Technology/Industrial Arts 16 .5English 222 7.6 Reading 33 1.1 Other 111 3.8English as a 2nd Language 22 .8 Science - Biology 76 2.6 Other 8 .3Environmental Education 34 1.2
Perceptions of Preservice Teachers, page 27
Appendix C
A survey of education majors at Name of College/University.Please take a few minutes to complete the questions below. Your answers and comments will not be individuallyidentified. Circle the appropriate answer.
A. Year in school:1) freshman2) sophomore3) junior4) senior5) post bachelor6) graduate student
D. Race:
B. Age:7) 17-188) 19-209) 21-2210) 23-2411) 25-3012) 31-3513) 36-4014) 41-4515) 45 & older
18) American Indian/Native American/Alaska Native19) African American/Black (Non-Hispanic/Latino)20) White/Caucasian (Non-Hispanic/Latino)21) Mexican American/Chicano22) Asian/Pacific American23) Puerto Rican24) Other Hispanic/Latino25) Other
E. From the list below, I am seeking certification(s) in ,
C. Gender:16) female17) male
(If seeking more than one certification, please list in order of importance to you.)
26) Agriculture27) Art28) Bilingual Education29) Business30) Communication31) Counselor - Elementary32) Counselor - Secondary33) Driver Education34) Early Childhood Education35) Elementary Education36) English37) English as a Second Language38) Environmental Education39) Health Education40) Home Economics41) Language, Modern - French42) Language, Modern - German43) Language, Modern - Spanish44) Language Other (list):
45) Library Science46) Mathematics47) Music48) Physical Education49) Reading50) Science - Biology51) Science - Chemistry52) Science Earth & Space53) Science - General54) Science - Physii:s55) Science Other Areas56) Social Studies57) Speech58) Special Education59) Speech Pathology/Audiology60) Technology/Industrial Arts61) Other (list):62) Other (list):
Perceptions of Preservice Teachers, page 28
F. In my certification area(s), the job market has:63) a considerable shortage of teachers64) some shortage of teachers65) a balance of teachers and openings66) some surplus of teachers67) a considerable surplus of teachers
G. My chances for finding a full-time job in my certification area(s) once I graduate are:68) good69) fair70) poor
H. Even if I don't get a job in my certification area(s) right away, my chances of finding a full-timejob in 2 or 3 years are:
71) good72) fair73) poor
I. I would be willing to be a substitute teacher for:74) 1 year75) 2-3 years76) 4 or more years77) I may prefer to be a substitute teacher rather than a full-time teacher78) I'm not interested in being a substitute teacher
J. I would be willing to be a teacher in a private school:79) 1 year80) 2-3 years81) 4 or more years82) I may prefer to be a teacher in a private school rather than a teacher in a public school83) I am not interested in being a teacher in a private school
K. The location where I am willing to seek teaching employment is:84) a driving/commuting distance from my home85) in my state86) in the surrounding states87) in the eastern United States88) unrestricted, throughout the United States89) unrestricted, throughout the world
L. My teaching salary will be:90) my or my family's only source of income91) my or my family's major source of income92) combined with another family member's income93) secondary to another family member's income
M. If I can't find a job in teaching, I will try to find employment in:
N. I chose education for a field of study career because:
0. Please write any additional comments you may have:
Perceptions of Preservice Teachers, page 29
Appendix D
Method of Recording Comments from Questions M, N, 0: See Survey, Appendix CQuestion M: If I can't find a job in teaching, I will try to find employment in/as:
Originally, responses to Question M were recorded in list form as read. Since respondentswere not limited to a single answer, multiple responses were recorded if given. As patternsbecame evident, answers reflecting similar areas of employment were grouped. Following,tallies were recorded for these sets, and unique responses added to the list. In some cases,respondents' answers were very general (i.e. "sales") while in other cases, more specificoccupations were given (i.e. "insurance"). For these instances, the general area of occupationwas recorded followed by the most frequently listed examples of specific occupations [i.e."Sales, marketing (retail, advertising, insurance, real estate)"). Furthermore, several generalstatements (i.e. "any area working with children") were formed reflecting the main idea behindsimilar individual replies. After all survey responses had been recorded, categories of relatedemployment areas were created based upon the particular responses given for this surveywith reference to the Occupational Outlook Handbook, 1994-1995 Edition, developed by theU.S. Department of Labor Bureau of Labor Statistics.
Question N: I chose education for a field of study / career because:
As with Question M, single or multiple responses to Question N were initially recorded in listform as read. Next, comparable responses were grouped and general statements were formedto reflect the main idea behind groups of individual reasons for selecting education for a fieldof study. Henceforth, tallies were recorded by these statements for remaining surveys.Considering all replies from participating colleges and universities, the most frequently givenanswers were listed on the recording instrument while those responses given less often weregrouped under the title "Other." Unique examples of these responses were recorded on theforms sent to each college or university.
Question 0: Please write any additional comments you may have:
If an additional comment was given, each was quoted in list form as read and provided toindividual colleges and universities. For general purposes, additional comments have beenreviewed for frequency of similar responses and further insight into the avenues explored inthis report. The results of additional comments are summarized and conclusions presented.
Note: In some of the discussion sections, percentages are given instead of frequencies in orderto more clearly report results and discuss conclusions. The majority of percentages areobtained by comparing frequencies of a particular response(s) to the number of preserviceteachers surveyed (Elementary, n = 1678, Secondary/Other, n = 1239, or the Total, n = 2917).Because many students elected not to write in answers for Questions M, N and 0,percentages aopear lower than if all students had responded to these questions.