Embed Size (px)
Citation preview
DOCUMENT RESUME
ED 397 394 CS 012 535
AUTHOR Macdonald-Ross, Michael; Scott, Bernard
TITLE Results of the Survey of OU Students' Reading Skills.Text and Readers Programme Technical Report No. 3.
INSTITUTION Open Univ., Walton, Bletchley, Bucks (England). Inst.of Educational Technology.
PUB DATE 95
NOTE 23p.; A separate two-page summary has beenappended.
PUB TYPE Reports Research/Technical (143)
EDRS PRICE MF01/PC01 Plus Postage.DESCRIPTORS Cloze Procedure; College Freshmen; Higher Education;
Longitudinal Studies; *Reading Achievement; ReadingResearch; *Reading Skills
IDENTIFIERS *Academic Discourse; *Open University (GreatBritain)
ABSTRACTA study investigated the reading skills of entering
students at the Open University. Just over 2,000 of the 3,000students (representing 107. of all students taking courses at thefoundation level) completed questionnaires that were mailed to them.Subjects completed 3 cloze tests, graded in difficulty, and avocabulary test. Results indicated that (1) most students showed atleast partial comprehension on the 2 simpler cloze tests; (2) 957. of
students showed some degree of inadequacy in their comprehension ofthe cloze passage that represented fairly typical academic prose; (3)
to be comfortable with prose in the most difficult cloze test,students would need to score about 707. or more on the vocabularytest--most scored below the 707. level; and (4) arts students had thehighest scores, and technology students the lowest (differences wereslight but statistically significant). Future research will followthe students through their careers at the Open University. (Contains21 references, and 8 tables and 12 figures of data.) (RS)
****)%******************************************************************
Reproductions supplied by EDRS are the best that can be madefrom the original document.
***************************ic*****************************************
*
Text & Readers Progran2meTechnical Report #3
PERMISSION TO REPRODUCE ANDDISSEMINATE THIS MATERIAL
HAS BEEN GRANTED BY
khaLdo-oic\-
TO THE EDUCATIONAL RESOURCESINFORMATION CENTER (ERIC)
U S DEPARTMENT OF EDUCATIONO5C0 01 EduLal Orld RoseatCn Ind Impr000men1
EDUCATIONAL RESOURCES INFORMATIONCENTER 'ERIC)
/This document has bee.-1 reproduced asreceived from the person or organizationonginating it
0 Minor changes have been made toimprove reproduction quality
Points of view or opinions stated in tNsdocument do not necessarily representofficial OERI position or policy
Results of the survey ofOU students' reading skills
Michael Macdonald-RossBernard Scott
Institute of Educational TechnologyThe Open UniversityMilton Keynes MK7 6AA
BEST COPY AVAILABLE2
Results of the survey ofOU students' reading skills
Abstract
As explained in our previous report (Scott and Macdonald-Ross 1995), we used a postalsurvey to test the reading skills of a sample of students entering the Open University atfoundation level. The sample was structured to include approximately equal numbersfrom the five foundation courses (Arts. Social Sciences, Mathematics, Science, Technology)and from four levels of 'educational qualifications on entry'.The test materials were sent out to 3000 students; just over 2000 completed forms werereturned. The data has now been collated and analysed. Results suggest that manyentering students may have some difficulty comprehending academic texts. The resultsalso show significant differences between students grouped by faculty and by level ofeducational qualification.The progress of the cohort of students sampled is being monitored throughout thefoundation year.
Introduction
During the first 25 years of the Open University's existence, no assessment of enteringstudents' basic skills was carried out. In fact, almost no psychometric data exists for anyof the ou's student population. One exception is a study of younger ou students (Woodleyand McIntosh 1980) and we refer to some of that data later in this report. Social andpersonal data about students and courses is gathered routinely by the ou application formand by IET's Student Research Centre.Each year many students withdraw from or fail their courses (though in general fewstudents fail if they survive to take the exam). Surveys of students' reported reasons forwithdrawal have been carried out (Woodley and Parlett 1983, Woodley D94). Rarely dostudents say they found courses too difficult, or the prose too difficult t ) read. Mostfrequently. they cite workload or domestic problems. Without objective data, which thepresent work starts to provide for the first time, any assessment of the importance of goodbasic skills levels (as a factor in student success and course retention rates) could only bespeculative.As a first step in gathering relevant data, we surveyed the reading skills of a large sampleof students entering the Ou at foundation level and are monitoring their progress throughthe first year of their studies with the Oti.The tests we used have been described in detail in Scott and Macdonald-Ross 1995. In thisreport, we describe the structure of the sample and analyse the data so far gathered anddiscuss the implications.
Michael Macdonald-Ross, Reader in Textual Communication.Bernard Scott. Research Fellow.
1
The Reading Tests
The tests consisted of three 'doze' passages and a vocabulary test (details in Scott and
Macdonald-Ross 1995). In a typical doze task, every fifth or sixth word is deleted from a
passage and the subject has to insert what he or she considers to be the most appropriate
word. Cloze is particularly suitable for a postal survey since it is relatively robust with respect
to time allowed for completion, as long is this is above a sensible minimum. This was one
good reason to allow students tocomplete the tests in their own time; we werealso influenced
by our knowledge of the general probity and reliability of OU students.
In doze tests of this kind, scores of about 60% or above show the respondent can read and
work on the passage satisfactorily, without assistance. Scores between 40% and 60% show
partial comprehension, or the ability to read and work on the passage wider supervision.
Scores below about 40% show inadequate comprehension (these levels based mainly on
work discussed in Bormuth 1967, 1968). The tnree passages were chosen to be at three
different levels of difficulty. Figure 9 shows the differences between the tests as shown by the
Flesch Reading Ease (REs) scale, a commonly used measure of text readability. RES scores
are known to be good predictors of textcomprehensibility (see section on readabilitybelow).
Passage 1 is part of a basic skills screening test (ALBSU 1993), designed to identify readers
who trwe trouble with basic functional literacy. Passage 2, also from an ALBSU source, is
a more difficult passage, roughly at the same level ofdifficulty as editorials in middlebrow
popular newspapers. Passage 3 was chosen as an example of fairly typical academic text. It
is an extract from a book review in the Times Higher Education Supplement (Turner 1994).
The vocabulary test was included as a useful, quick-to-do additional task. Vocabulary
scores are known to correlate highly with more general psychometric measures of verbal
abilities. The Woodley and McIntosh study (1980) used a vocabulary scale and showed it
to be a good predictor of student success.
Readability: some general points
Readability measures of the type we use are indices that predict; they are not meant to
explain how students learn, or to teach authors how to write. What they do and do well
is to predict the difficulty of prose, especially if there is some information about the reading
skills of the readers. There are readability formulae designed for every type of prose: all ages,
all levels of difficulty, practically every major world language, and so on. There are few
metrics in the whole of the social sciences which have been as extensively validated as
readability measures such as the Dale-Chall and Flesch RES: their effectiveness and technical
reliability have been well demonstrated.Most formul& enshrine _a balance between ease of application and coverage of linguistic
variables. Thus, good predictions are got by 2-variable formulae where one variable is an
index of semantic complexity (usually a direct or indirect measure of the vocabulary
demands of the text), and the other variable is an index of syntactic complexity (usually
sentence length). These two indices combined are highly predictive of prose difficulty as
experienced by readers. "The good news is that two language variables, and simple ones at
that, account for so much of the variance in the prediction of readable writing" (Klare 1984).
More complex formulm developed for special purposes such as linguistic research have their
uses, but add little to the accuracy of prediction.
Because of the extent of the literature on readability, it is not a simple matter to give an
overview of the field. There are certainly hundreds of studies on the effect of readability on
ariow; age groups, and of its effect under various conditions ofmotivation, prior knowledge
of subject-matter, and its relation to the reading skills ofsubjects. The main resources to gain
2 4
access to this literature are the reviews by George Klare (1963, 1974 and 1984). The topic wasalso addressed in a review of research on language by Macdonald-Ross.(1979).A few examples of the research on readability may be helpful: Mare and Smart (1973) founda close relationship between readability level of correspondence course material and theprobability tha t correspondence students would persevere and complete their courses.Murphy (1947a.b) and Swanson (1948) found that readership of newspapers goes up withimproved readability in split-run studies of newspapers. Sticht and colleagues showed thatreadability had a significant effect on the use of military manuals (Kern, Sticht & Fox 1970).and Johnson et al (1972) showed the effect of readability on discrepancies in followingmilitary procedures. These results suggest that readability measures are as applicable toadults as to younger age groups. Also, the two best-known formula, the Flesch ReadingEase Score and the Dale-Chall formula, were actually developed for adult mateiials andvalidated against standard criteria for adult readers.
Work on readability in the OU during the 1970s
A certain amount of work was done in the OU in the 1970s, but there were two obstacles toprogress. The first was that all readability measures had to be applied by hand, which isobviously laborious, especially considering how much prose the OU produces each year.Nevertheless, in IET's Textual Cominunication Research Group, Eleanor Smith scored allthe four ori6nal foundation courses. This work revealed large variations in the level ofdifficulty that students had to contend with. Now, readability formula are available on (forexample) the Microsoft Word application, and the textual components of the more recentcourses are available on the same software. Since automated formula do not give quite thesame results as the original hand formula, we have done some work to estimate the effectof this discrepancy.
Our hypothesis
We expect that the poorer readers will preferentially drop out or fail courses. This will bemost likely to occur in courses which are the least readable, and most heavily overloaded,so that students who are weak readers will have difficulty in completing their study of coursematerial within the time available to them.The extent of the gap between reading skills of students and the readability of coursematerials will be identified. The expectation is that large mismatches between reader and textwill have significant consequences for the student. Lastly, we can identify the range ofreadability scores for different authors and subjects, allowing editorial and other skills to bebrought to bear on the most difficult passages.The practical potential for the results of this work to be used for the benefit of the Universityand its students is considerable, especially at a time when we need to find ways ofdemonstrating the quality of our teaching systems.
Structure of the sample
Our reading tests were sent out to 3000 entering students. They represent approximately10% of all students taking courses at foundation level. The sample was structured to ensurerepresentative numbers came from each of the five foundation courses (Arts. SocialSciences, Mathematics, Science, Technology) and from each of four levels of prior educationalqualifications: low (less than 0 Level), lowish (0 Level or single A level). mediwn (A Levelin two or more subjects) and high (higher education).See Table 1, page 12.
Procedure
The full text of the survey instrument is shown in the Appendix of our earlier report (Scottand Macdonald-Ross 1995). As well as the reading tests proper, there is a letter ofintroduction, instructions on how to do doze and a short doze passage for practice, withcorrect answers supplied.A sample of 3000 students, structured as above, was drawn from the OU's student databaseand the reading tests were sent out following the standard procedures of the Institute'sStudent Survey Office. An initial mailing at the end of September 1994 was followed up fourweeks later by a reminder postcard to non-responders. Four weeks after that, all outstandingnon-responders were sent a duplicate copy of the full survey instrument.As completed tests arrived back they were date-stamped, then processed for scoring andanalysis. The doze passages were hand marked against a list of correct answers. Only wordsidentical to deleted items were scored as correct. This simple scoring procedure has beenshown to be as effective as more sophisticated procedures where synonyms are accepted ascorrect (Bormuth 1975).The vocabulary tests were all individually checked for procedural errors and writtenresponses assessed for correctness. The test presents students with a list of forty wordsordered by frequency of occurrence. Students were asked to work through the list of wordsin the order presented and tick those they felt they understood. For the last five words theyhad ticked, they were asked to supply some form of definition to show they understood itsmeaning. If a required written definition was missing or incorrect, the count of words tickedwas reduced by one mark.All test scores were entered into a computer data base for analysis.
Results
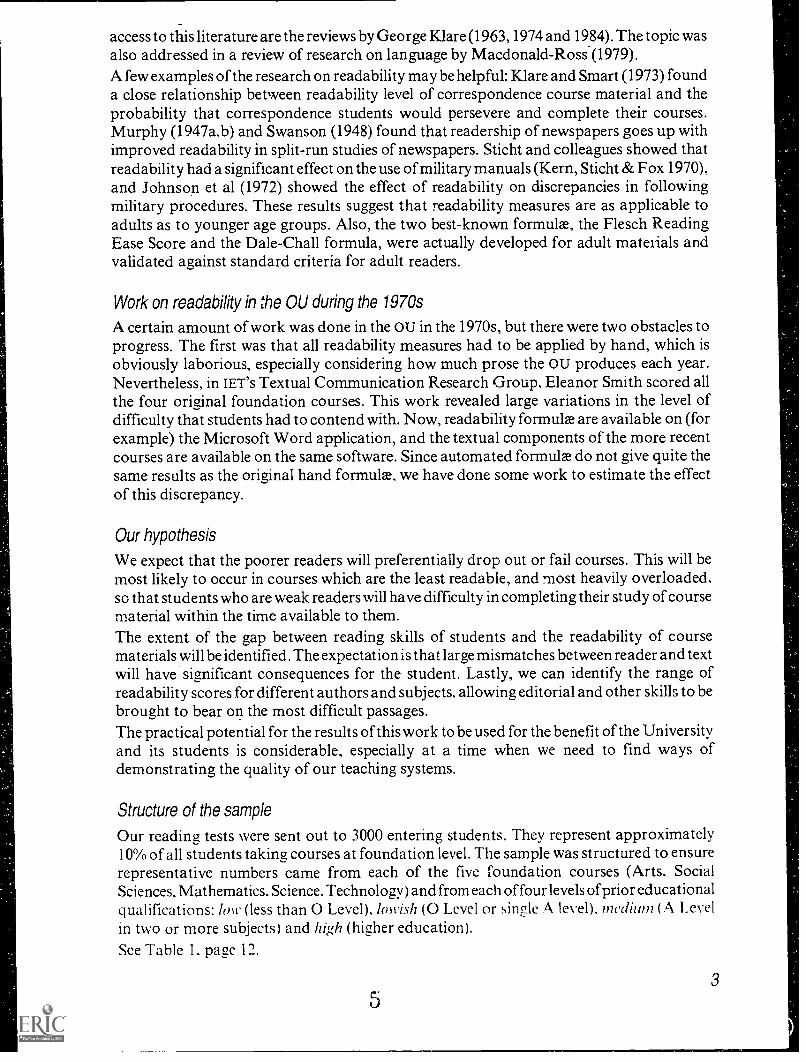
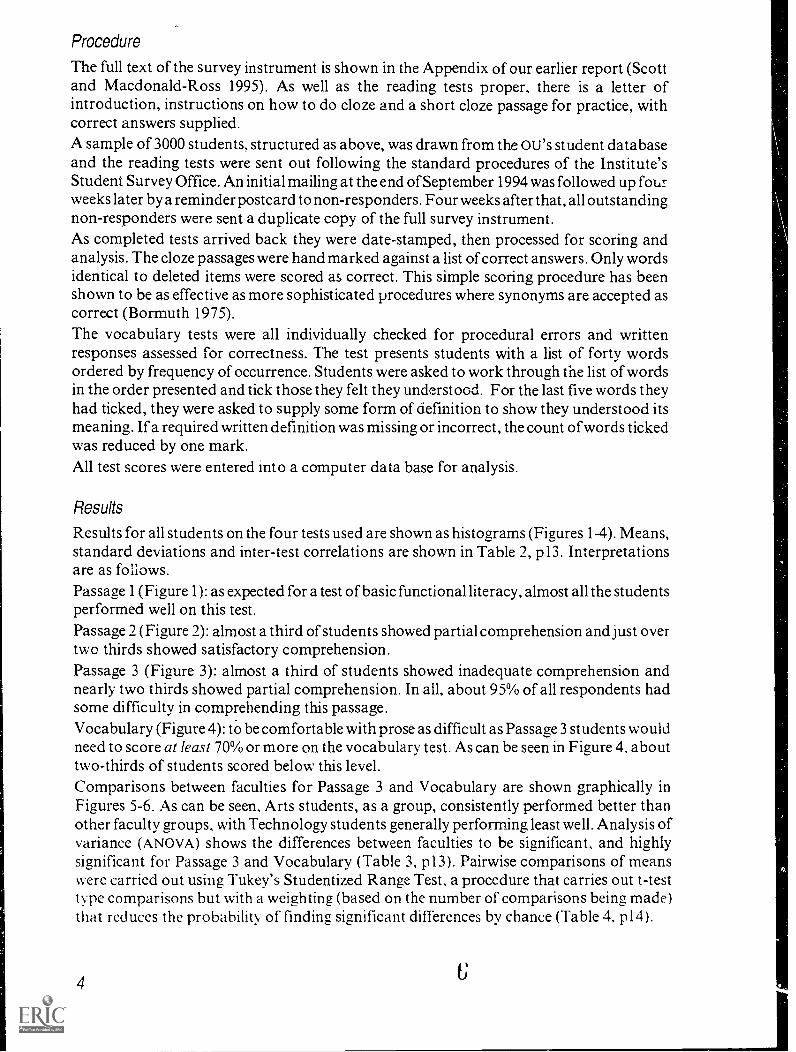
Results for all students on the four tests used are shown as histograms (Figures 1-4). Means,standard deviations and inter-test correlations are shown in Table 2, p13. Interpretationsare as follows.Passage 1 (Figure 1): as expected for a test of basic functional literacy, almost all the studentsperformed well on this test.Passage 2 (Figure 2): almost a third of students showed partial comprehension and just overtwo thirds showed satisfactory comprehension.Passage 3 (Figure 3): almost a third of students showed inadequate comprehension andnearly two thirds showed partial comprehension. In all, about 95% of all respondents hadsome difficulty in comprehending this passage.Vocabulary (Figure 4): to- be comfortable with prose as difficult as Passage 3 students wouldneed to score at least 70% or more on the vocabulary test. As can be seen in Figure 4, abouttwo-thirds of students scored below this level.Comparisons between faculties for Passage 3 and Vocabulary are shown graphically inFigures 5-6. As can be seen, Arts students, as a group, consistently performed better thanother faculty groups, with Technology students generally performing least well. Analysis ofvariance (ANOVA) shows the differences between faculties to be significant, and highlysignificant for Passage 3 and Vocabulary (Table 3, p13). Pairwise comparisons of meanswere carried out using Tukey's Studentized Range Test, a procedure that carries out t-testt ype comparisons but with a weighting (based on the number of comparisons being made)that reduces the probability of finding significant differences by chance (Table 4, p14).
4
Figure 1
Figure 2
Figure 3
400
300(t)(I)ti- 200ba)L.
100
0
0
300 -
250 -
200 -toz'-es. 150
(I)
Is 100*50
0
150
Passage 1: All Students
60%
- 7
5 10 15 20 25 30 35
Scores
Passage 2: All Students
40% 60%
-=4-
--
7'
--
__
0 5 10 15 20 25 30 35
Scores
Passage 3: All Students
s,-F
0 Iiii-mar
40% 60%
1
y_
0 10 20 30 40 50
Scores
'1
Figure 4
Figure 5
Figure 6
6
200
150
50
70
60
50
.(1) 40
(13 301e.(-) 20
10
Vocabulary: All Students
5 10
70%
.1-
15 20 25
Scores
Passage 3 by Faculty
30 35 40
01 Arts
E2 Soc. Scionce
0 Maths
Scionce
T echnology
60
50
cl)a)
40
se5i 30
NO 20QN
10
0-20% 21-40% 41-60% 61-80% 81-100%
% scores
Vocabulaiy by Faculty
Arts
M Soc. Sciences
0 Maths.
Science
El I Technology
Y1X 41.
0-20 21-40 41-60 61-80 81-100
% score
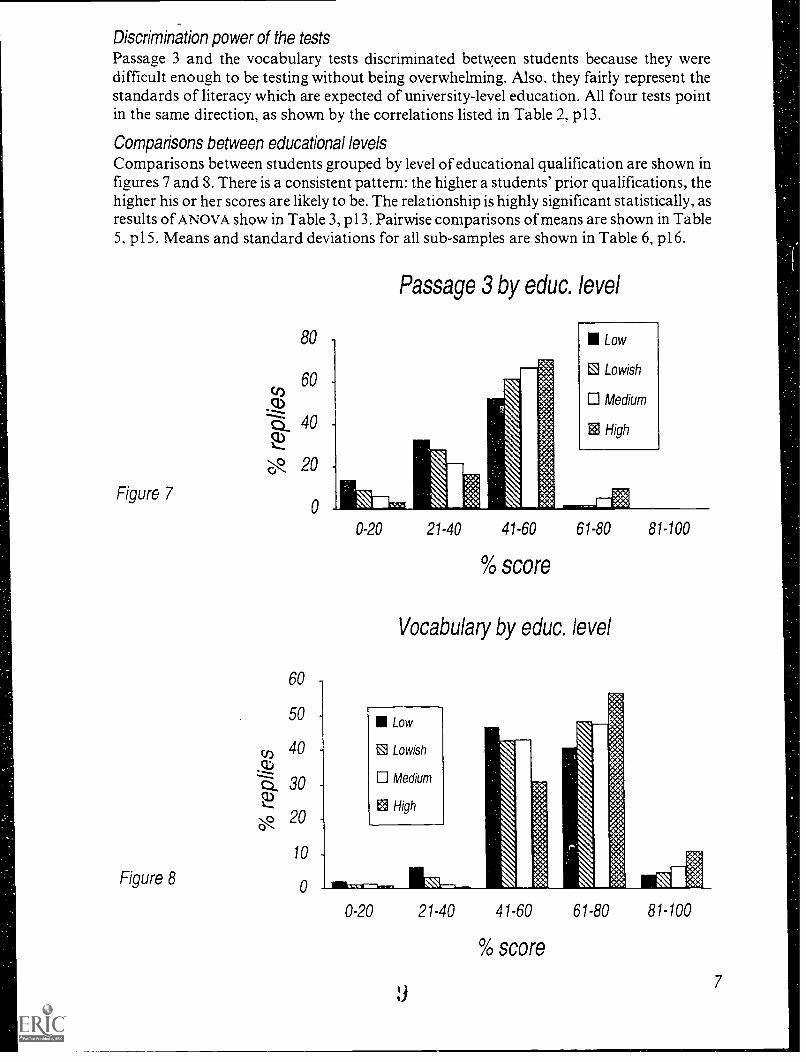
Discrimination power of the testsPassage 3 and the vocabulary tests discriminated between students because they weredifficult enough to be testing without being overwhehning. Also, they fairly represent thestandards of literacy which are expected of university-level education. All four tests pointin the same direction, as shown by the correlations listed in Table 2, p13.
Comparisons between educational levelsComparisons between students grouped by level of educational qualification are shown infigures 7 and S. There is a consistent pattern: the higher a students' prior qualifications, thehigher his or her scores are likely to be. The relationship is highly significant statistically, asresults ofANOVA show in Table 3, p13. Pairwise comparisons of means are shown in Table5, p15. Means and standard deviations for all sub-samples are shown in Table 6, p16.
Figure 7
Figure 8
Passage 3 by educ. level
Low
E3 Lowish
0 Medium
High
60
50 -
(f) 40 -
(1)
e, 20 -
10
0
0-20 21-40 41-60 61-80 81-100
% score
Vocabulary by educ. level
Low
E3 Lowish
O Medium
:SE High
ourZ.:*)
!41
0-20 21-40 41-60 61-80
9
% score
81-100
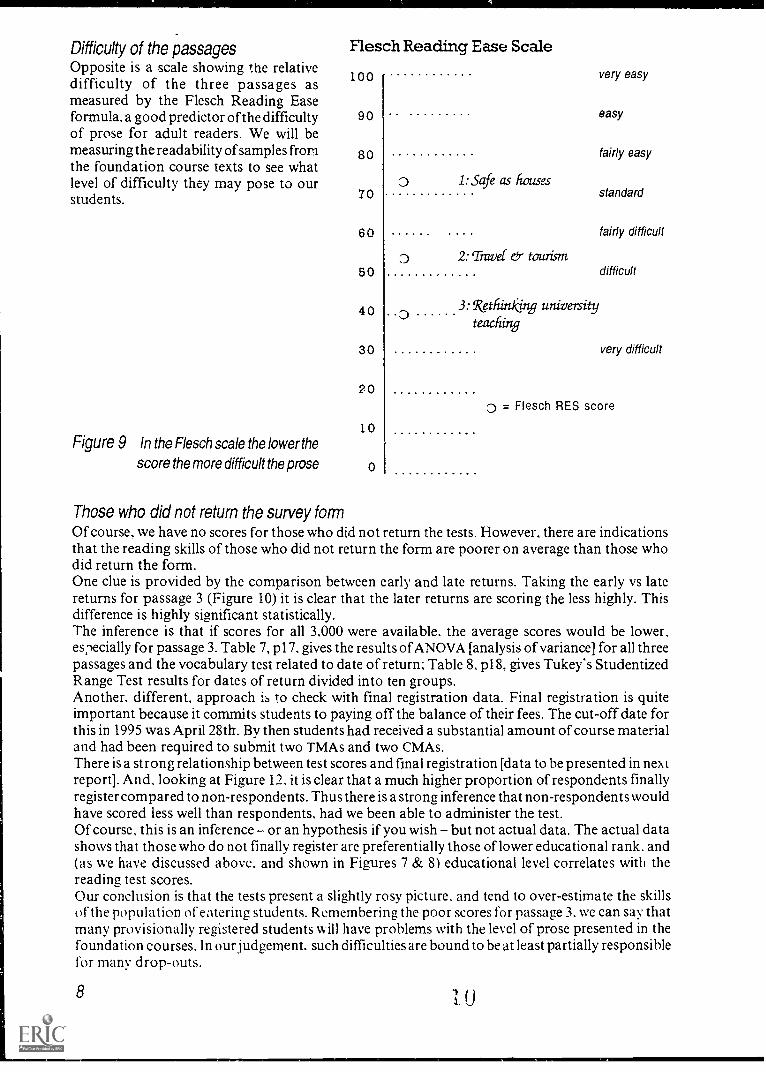
Difficulty of the passagesOpposite is a scale showing the relativedifficulty of the three passages asmeasured by the Flesch Reading Easeformula, a good predictor of the difficultyof prose for adult readers. We will bemeasuring the readability of samples fromthe foundation course texts to see whatlevel of difficulty they may pose to ourstudents.
Figure 9 In the Flesch scale the lower the
score the more difficult the prose
Flesch Reading Ease Scale
100
90
80
70
60
50
40
30
20
10
0
0 1:Safe as houses
2: Travel- & tourism
0
very easy
easy
fairly easy
standard
fairly difficult
difficult
3: gethinking universityteaching
very difficult
0 = Flesch RES score
Those who did not return the survey formOf course, we have no scores for those who did not return the tests. However, there are indicationsthat the reading skills of those who did not return the form are poorer on average than those whodid return the form.One clue is provided by the comparison between early and late returns. Taking the early vs latereturns for passage 3 (Figure 10) it is clear that the later returns are scoring the less highly. Thisdifference is highly significant statistically.The inference is that if scores for all 3,000 were available, the average scores would be lower.es.lecially for passage 3. Table 7, p17, gives the results of ANOVA [analysis of variance] for all threepassages and the vocabulary test related to date of return; Table 8, p18. gives Tukey's StudentizedRange Test results for dates of return divided into ten groups.Another, different, approach is to check with final registration data. Final registration is quiteimportant because it commits students to paying off the balance of their fees. The cut-off date forthis in 1995 was April 28th. By then students had received a substantial amount of course materialand had been required to submit two TMAs and two CMAs.There is a strong relationship between test scores and final registration [data to be presented in nextreport]. And, looking at Figure 12, it is clear that a much higher proportion of respondents finallyreeister compared to non-respondents. Thus there is a strong inference that non-respondents wouldhave scored less well than respondents. had we been able to administer the test.Of course. this is an inference or an hypothesis if you wish but not actual data. The actual datashows that those who do not finally register are preferentially those of lower educational rank. and(as we have discussed above, and shown in Figures 7 & 8) educational level correlates with thereadinz test scores.Our conclusion is that the tests present a slightly rosy picture, and tend to over-estimate the skillsof the population of entering students. Remembering the poor scores for passage 3. we can say thatmany provisionally registered students will have problems with the level of prose presented in thefoundation courses. In our judgement, such difficulties are bound to be at least partially responsiblefor many drop-outs.
8
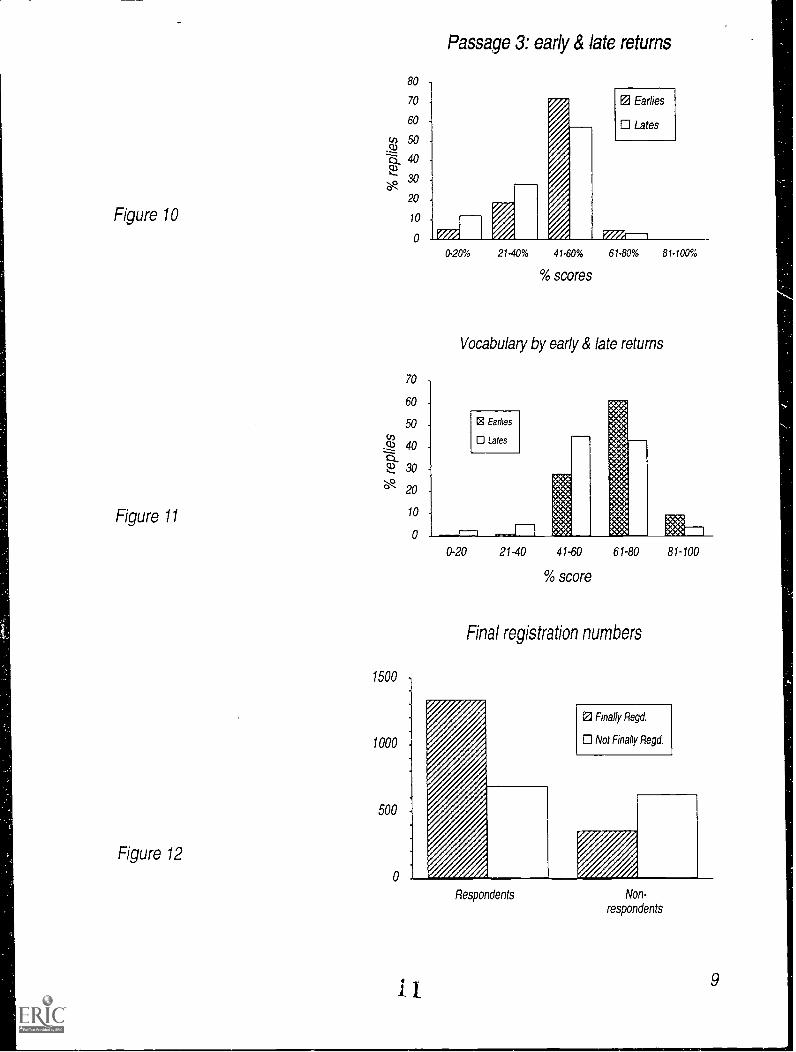
Figure 10
Figure 11
Figure 12
80
70
60
cn 50.ct)
13, 40cv._
30e20
10
o
70
60
50cnQ) 40
L,...".11 30
?".) 20
1500
1000
500
10
0
Passage 3: early & late returns
0-20% 21-40% 41-60% 61-80% 81-100%
% scores
Vocabulary by early & late returns
21 Eathes
0 lates
0-20 21-40 41-60 61-80 81-100
% score
Final registration numbers
ta Finally Regd.
0 Not Finally Regd.
Respondents
<
/Non-
respondents
9
Summary and discussion
1. At the basic level assessed by Passage 1, all our respondents are literate.2. However, most (95%) of our respondents have some limitations in the extent to which they
can read academic prose as indexed by our Passage 3. The lowest quartile of these studentsare bound to experience prolonged difficulty in reading our course texts at the requiredspeed and with the necessary comprehension to perform well on the course. To put itanother way, most entering students enrolled for OU foundation courses have readingskills which are not at the appropriate level for working with academic prose, and manyare seriously deficient.
3. Lest it be thought that our data over-estimates the problem, we have shown some goodreasons for thinking that the reading skills of the non-respondents may be even morelimited.
4. There are significant differences when the data are analysed by faculty.5. A significant relationship emerges when the data are analysed by educational level. The
lower the educational level, the lower the mean test scores. This is important in view of theUniversity's efforts to make itself more open than hitherto. Policy makers will realise thattheir worthy intention runs against the tenor of our data, and risks an increasingproportion of drop-outs, with all the hidden frustration and visible waste of resources thatthis entails. There are various actions that might be proposed to reduce this tension.
6. Having established that many students enrolled as of October 1994 are at risk of failingor dropping out, our task now is to monitor the progress of those who remain from oursample. Courses began their teaching in February 1995 and will finish, with exams, inOctober 1995. Steps along the way include the submission of tutor-marked and computer-marked assignments (TmAs and cmAs), final registration and attendance at summerschool.In our next report we will present data from final registration figures to show that studentsscoring poorly in our tests are more likely to drop out than stud .., its scoring well.
7. Our other major task is to assess the readability and workload levels of a range of OUcourse This is a tractable problem once course materials are in a suitable electronicformat to allow us to use automated procedures.
8. A range of fur ther research studies are being considered and proposals are being prepared.These include surveys of other students on other courses. As well as surveys of readingskills, readability and workload, there is also a need for more fine-grained studies of howOU students interact with OU text-based course materials in print and on screen. The latteris increasingly important as resource-based learning using CD-ROMS is introduced intonew courses.
10 1 4,9
References
ALBSU Assessing reading and maths: a screening test. Adult Literacy and Basic Skills Unit,Kingsbourne House, 229/231 High Holborn, London WC1V 7DA.
Bormuth JR Comparable cloze and multiple-choice comprehension test scores. Journal of Reading10, 291-299, 1967.
Bormuth JR Close test readability: criterion scores. Journal of Educational Measurement 5, 189-196.Bormuth JR The doze procedure: literacy in the classroom in Page WD (ed) Help for the reading
teacher. Washington DC: National Institute of Education 1975.Kern RP, Sticht TG and Fox LO Readability, reading ability and readership. (Professional Paper 17-
20) Alexandria VA: Human Resources Research Organisation 1970.Johnson KH, Relova RP Jr and Stafford JP An analysis of the relationship between readability of
Air Force procedural manuals and discrepancies involving non-compliance with the procedures.(Document AD 750 917, National Technical Information Service) Air Force Institute ofTechnology, Air University 1972.
Klare GR The measurement of readability. Ames: Iowa State University Press 1963.Klare GR Assessing readability. Reading Research Quarterly 10, 62-102, 1974-75.Klare G Readability in Pearson PD (ed) Handbook of Reading Research. New York: Longman
1984.
Klare GR and Smart K Analysis of the readability level of selected United States Armed ForcesInstitute printed instructional materials. Journal of Educational Research 67, 176, 1973.
Macdonald-Ross M Language in texts in Lee S Shulman (ed) Review of Research in Education 6,229-275. Itasca IL: Peacock 1979.
Murphy DR Test proves short words and sentences get best readership. Printer's Ink 2/8, 61-64, 1947.Murphy DR How plain talk increases re,:_dership 45 per cent to 66 per cent. Printer's Ink 220, 35-37,
1947.
Scott B and Macdonald-Ross M A postal survey of 0 U students' readi% ' ;ills. Technical report #2,Text & Readers Programme, IET, The Open Uni-:ersity, Milton Keynes MK7 6AA. 1995.
Swanson CE Readability and readership: a controlled experiment. Journalism Quarterly 25 , 339-343,1948.
Taylor WL Cloze procedure: a new tool for measuring readability. Journalism Quarterly 30, 415-433,1953.
Turner D The importance ofreflective classes. Times Higher Education Supplement. London: TimesNewspapers Ltd April 29th 1994.
Vaughan J Assessing reading: using doze procedure to assess reading skills. Adult Literacy and BasicSkills Unit, 229/231 High Holborn, London WC1V 7DA. 1995.
Woodley A Dr op-out: understandable, predictable or merely inevitable? in Thorpe M and GrugeonD (eds) Open Learning in the Mainstream. Longman 1994.
Woodley A and McIntosh N The door stood open. Lewes: Falmer Press 1980.Woodley A and Parlett M Student drop-out. Teaching at a Distance 24. 2-23, 1983.
13 11
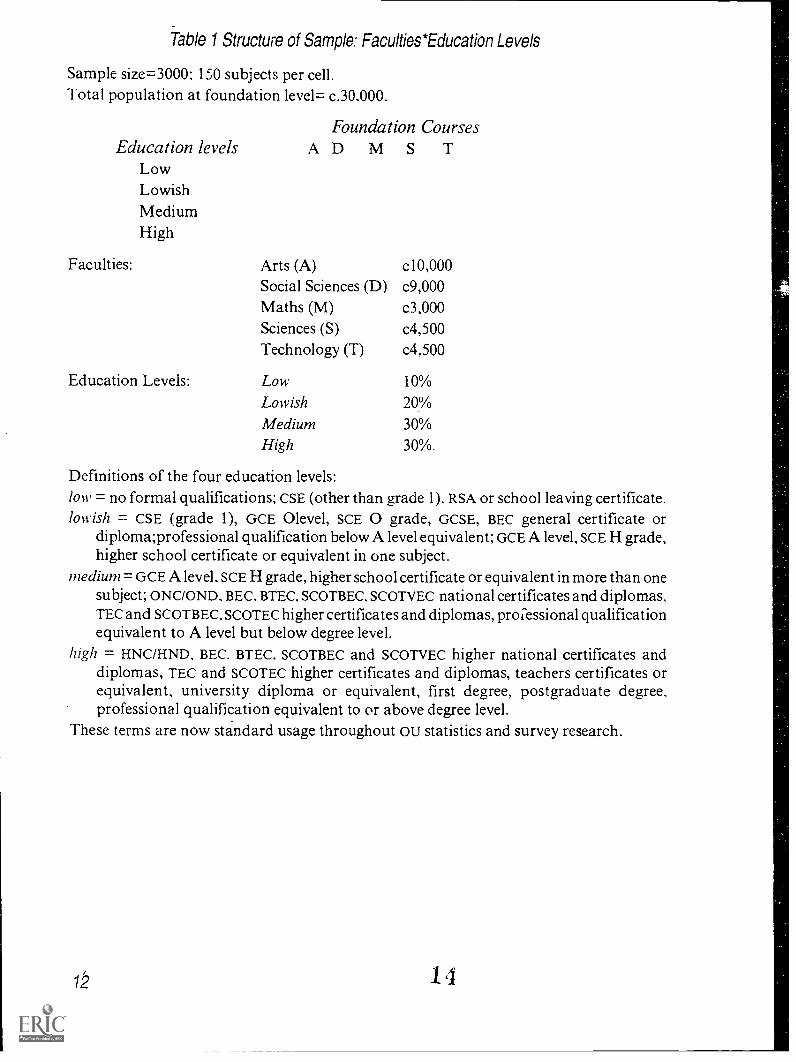
Table 1 Structure of Sample: Faculties*Education Levels
Sample size=3000; 150 subjects per cell.Total population at foundation level= c.30,000.
Foundation CoursesEducat ion levels AD M S T
LowLowishMediumHigh
Faculties:
Education Levels:
Arts (A) c10,000Social Sciences (D) c9,000Maths (M) c3,000Sciences (5) c4,500Technology (T) c4,500
Low 10%
Lowish 20%Medium 30%High 30%.
Definitions of the four education levels:/ow = no formal qualifications; CSE (other than grade 1). RSA or school leaving certificate.lowish = CSE (grade 1), GCE Olevel, SCE 0 grade, GCSE, BEC general certificate or
diploma;professional qualification below A level equivalent;GCE A level, SCE H grade,higher school certificate or equivalent in one subject.
medium= GCEA level, SCE H grade, higher school certificate or equivalent in more than onesubject; ONC/OND, BEC, BTEC, SCOTBEC, SCOTVEC national certificates and diplomas.TEC and SCOTBEC, SCOTEC higher certificates and diplomas, proi-essional qualificationequivalent to A level but below degree level.
high = HNC/HND. BEC. STEC, SCOTBEC and SCOTVEC higher national certificates anddiplomas, TEC and SCOTEC higher certificates and diplomas, teachers certificates orequivalent, university diploma or equivalent, first degree, postgraduate degree,professional qualification equivalent to or above degree level.
These terms are now standard usage throughout OU statistics and survey research.
14
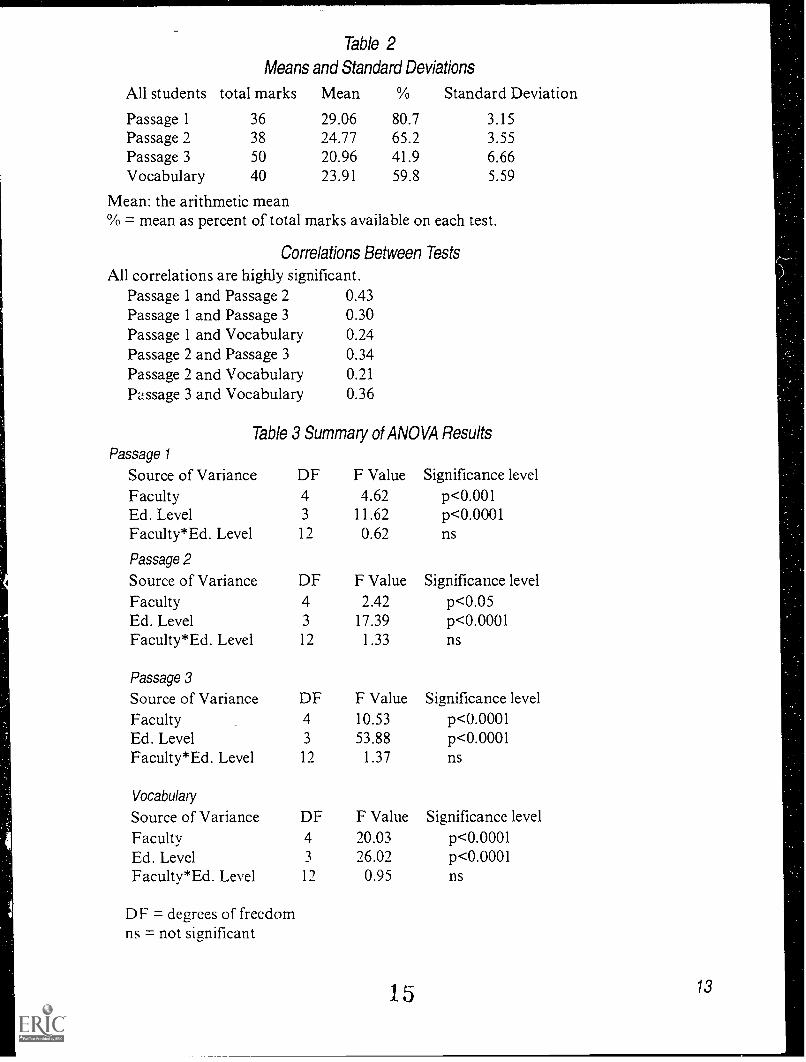
Table 2
Means and Standard Deviations
All students total marks Mean % Standard Deviation
Passage 1 36 29.06 80.7 3.15Passage 2 38 24.77 65.2 3.55Passage 3 50 20.96 41.9 6.66Vocabulary 40 23.91 59.8 5.59
Mean: the arithmetic mean'3.10 = mean as percent of total marks available on each test.
AllCorrelations Between Tests
correlations are highly significant.Passage 1 and Passage 2 0.43Passage 1 and Passage 3 0.30Passage 1 and Vocabulary 0.24Passage 2 and Passage 3 0.34Passage 2 and Vocabulary 0.21Passage 3 and Vocabulary 0.36
Table 3 Summary of ANOVA ResultsPassage 1
Source of VarianceFacultyEd. LevelFaculty*Ed. Level
Passage 2
DF43
12
F Value4.62
11.620.62
Significance levelp<0.001p<0.0001ns
Source of Variance DF F Value Significance levelFaculty 4 2.42 p<0.05Ed. Level 3 17.39 p<0.0001Faculty*Ed. Level 12 1.33 ns
Passage 3
Source of Variance DF F Value Significance levelFaculty 4 10.53 p<0.0001Ed. Level 3 53.88 p<0.0001Faculty*Ed. Level 1.37 ns
Vocabulaty
Source of Variance DF F Value Significance levelFaculty 4 20.03 p<0.0001Ed. Level 3 26.02 p<0.0001Faculty*Ed. Level 0.95 ns
= degrees of freedomns = not significant
15 13
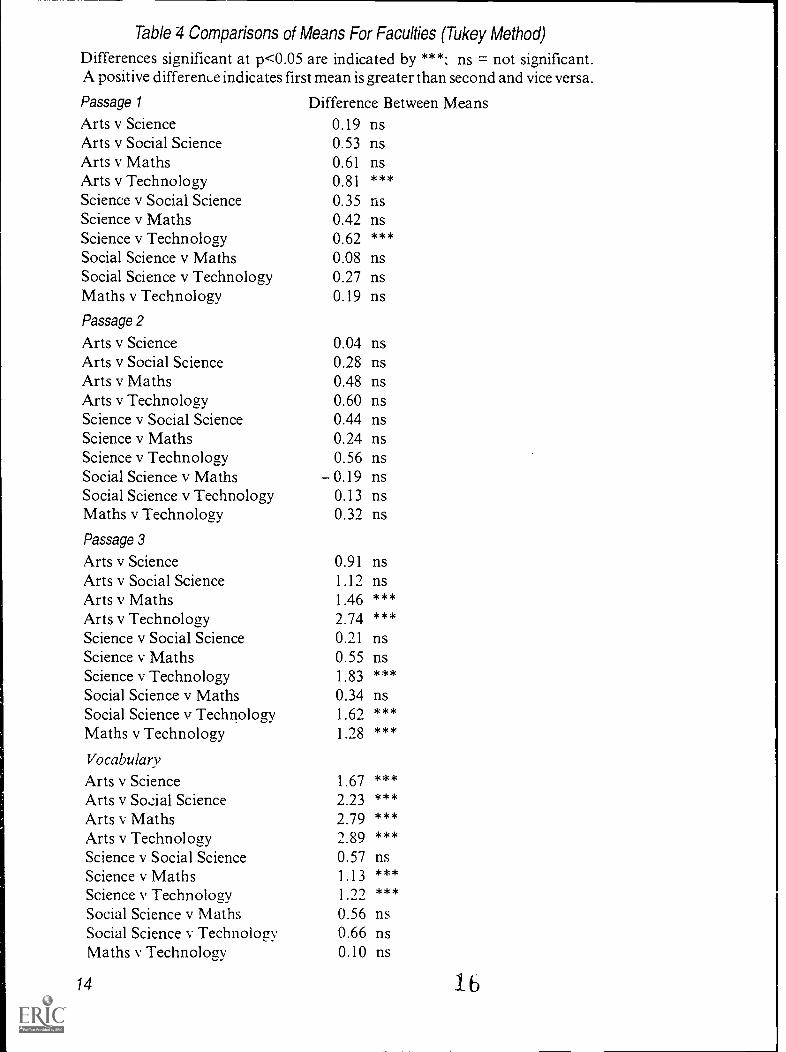
Table 4 Comparisons of Means For Faculties (Tukey Method)
Differences significant at p<0.05 are indicated by "4'; ns = not significant.A positive differenue indicates first mean is greater than second and vice versa.
Passage 1 Difference Between MeansArts v Science 0.19 nsArts v Social Science 0.53 nsArts v Maths 0.61 nsArts v Technology 0.81 ***Science v Social Science 0.35 nsScience v Maths 0.42 nsScience v Technology 0.62 ***Social Science v Maths 0.08 nsSocial Science v Technoloay 0.27 nsMaths v Technology 0.19 nsPassage 2
Arts v Science 0.04 nsArts v Social Science 0.28 nsArts v Maths 0.48 nsArts v Technology 0.60 nsScience v Social Science 0.44 nsScience v Maths 0.24 nsScience v Technology 0.56 nsSocial Science v Maths 0.19 nsSocial Science v Technology 0.13 nsMaths v Technology 0.32 ns
Passage 3
Arts v Science 0.91 nsArts v Social Science 1.12 nsArts v Maths 1.46 ***Arts v Technology 2.74 ***Science v Social Science 0.21 nsScience v Maths 0.55 nsScience v Technology 1.83 ***Social Science v Maths 0.34 nsSocial Science v Technology 1.62 ***Maths v Technoloay 1.28 ***
Vocabulary
Arts v Science 1.67Arts v Sosial Science 2.23Arts v Maths 2.79Arts v Technoloay 2.89Science v Social Science 0.57Science v Maths 1.13Science v Technoloay 1.22
Social Science v Maths 0.56Social Science v Technology 0.66Maths v Technology 0.10
************
ns******
nsnsns
14 16
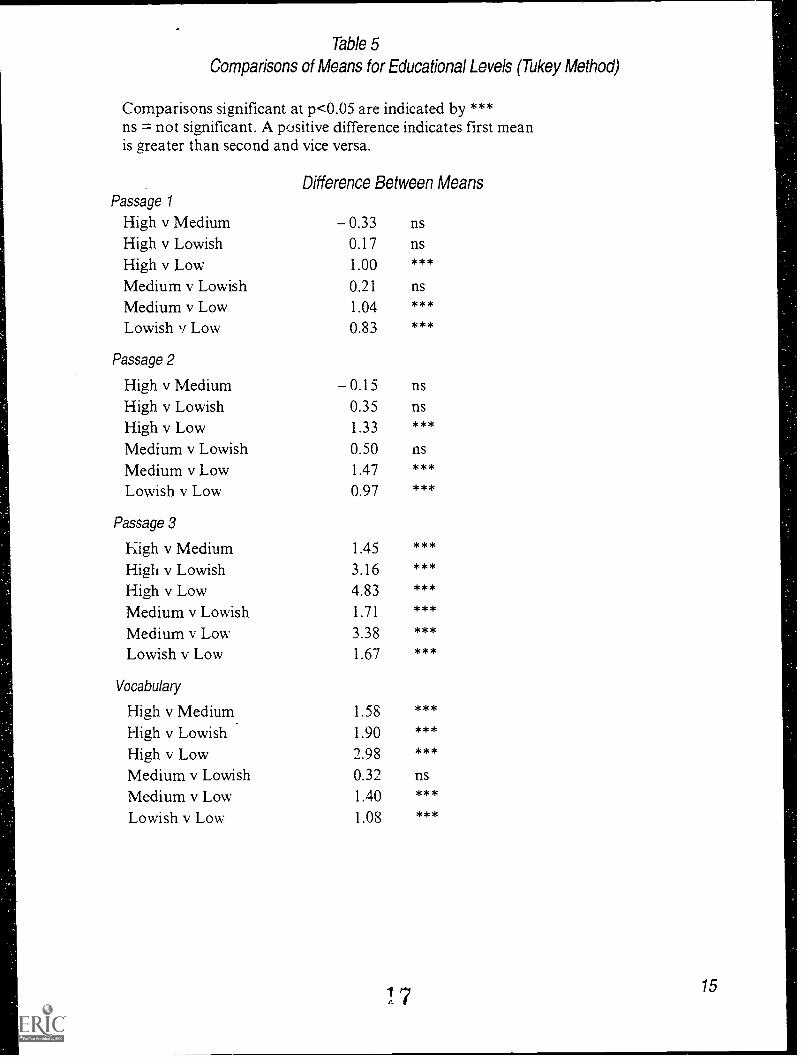
Table 5
Comparisons of Means for Educational Levels (Tukey Method)
Comparisons significant at p<0.05 are indicated by ***ns = not significant. A positive difference indicates first meanis greater than second and vice versa.
Passage 1Difference Between Means
High v Medium 0.33 ns
High v Lowish 0.17 ns
High v Low 1.00 ***
Medium v Lowish 0.21 nsMedium v Low 1.04 ***
Lowish v Low 0.83 ***
Passage 2
High v Medium 0.15 ns
High v Lowish 0.35 ns
High v Low 1.33 ***
Medium v Lowish 0.50 ns
Medium v Low 1.47 ***
Lowish v Low 0.97 ***
Passage 3
High v Medium 1.45 ***
High v Lowish 3.16 ***
High v Low 4.83 ***
Medium v Lowish 1.71 ***
Medium v Low 3.38 ***
Lowish v Low 1.67 ***
Vocabulary
High v Medium. 1.58 ***
High v Lowish 1.90 ***
High v Low 2.98 ***
Medium v Lowish 0.32 ns
Medium v Low 1.40 ***
Lowish v Low 1.08 ***
1 715
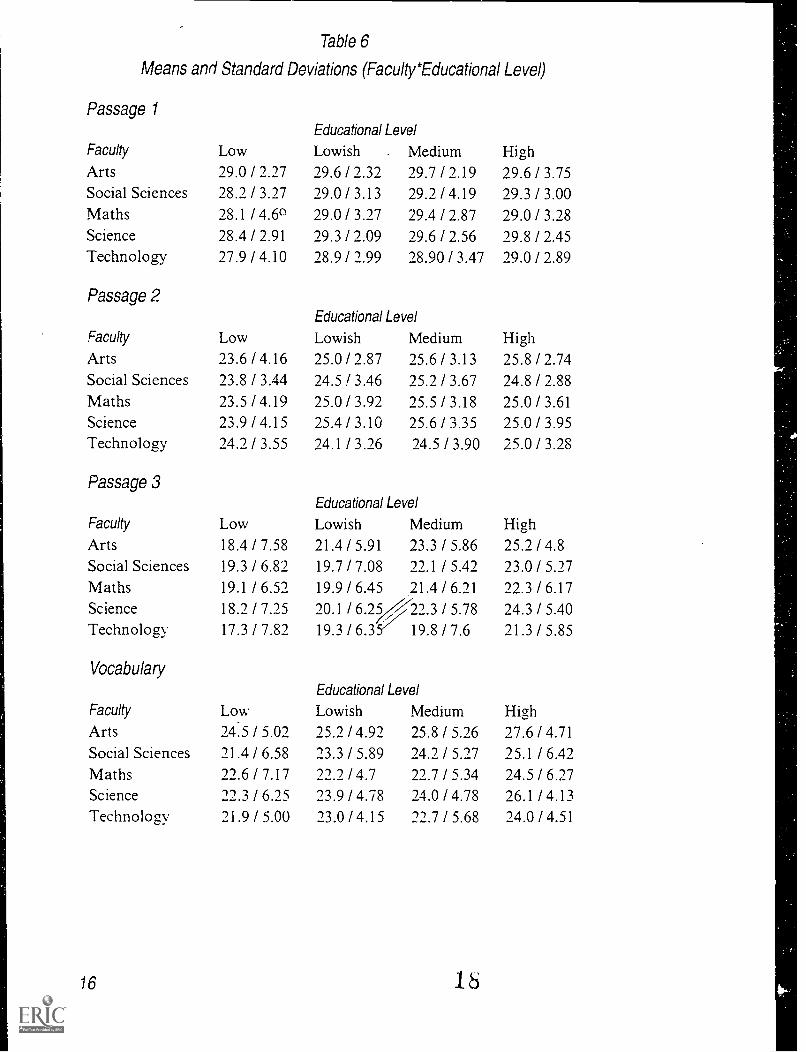
Table 6
Means and Standard Deviations (Faculty*Educational Level)
Passage 1
Faculty LowEducational Level
Lowish . Medium HighArts 29.0 / 2.27 29.6 / 2.32 29.7 / 2.19 29.6 / 3.75Social Sciences 78.2 / 3.27 29.0 / 3.13 29.2 / 4.19 29.3 / 3.00Maths 28.1 / 4.6° 79.0 / 3.27 29.4 / 2.87 29.0 / 3.28Science 28.4 / 2.91 29.3 / 2.09 29.6 / 2.56 29.8 / 2.45Technology 27.9 / 4.10 28.9 / 2.99 28.90 / 3.47 29.0 / 2.89
Passage 2Educational Level
Faculty Low Lowish Medium HighArts 23.6 / 4.16 25.0 / 2.87 25.6 / 3.13 25.8 / 2.74Social Sciences 23.8 / 3.44 24.5 ! 3.46 25.2 / 3.67 24.8 / 2.88Maths 23.5 / 4.19 25.0 / 3.92 25.5 / 3.18 25.0 / 3.61
Science 23.9 / 4.15 25.4 / 3.10 25.6 / 3.35 25.0 / 3.95Technology 24.2 / 3.55 24.1 / 3.26 24.5 / 3.90 25.0 / 3.28
Passage 3Educational Level
Faculty Low Lowish Medium HighArts 18.4 / 7.58 21.4 / 5.91 23.3 / 5.86 25.2 / 4.8Social Sciences 19.3 / 6.82 19.7 / 7.08 72.1 / 5.42 23.0 / 5.27Maths 19.1 / 6.52 19.9 / 6.45 21.4 / 6.21 22.3 / 6.17Science 18.2 / 7.25 20.1 / 6.25 Z22.3 / 5.78 24.3 / 5.40Technology 17.3 / 7.82 19.3 / 6.3 19.8 / 7.6 21.3 / 5.85
VocabularyEducational Level
Faculty Low Lowish Medium HighArts 24.5 / 5.02 25.2 / 4.92 25.8 / 5.26 27.6 / 4.71
Social Sciences 21.4 / 6.58 23.3 / 5.89 24.2 / 5.27 25.1 / 6.42Maths 22.6 / 7.17 21.7 / 4.7 27.7 / 5.34 24.5 / 6.27Science 12.3 / 6.25 23.9 / 4.78 24.0 / 4.78 26.1 / 4.13Technology 21.9 / 5.00 23.0 / 4.15 22.7 / 5.68 24.0 / 4.51
16 18
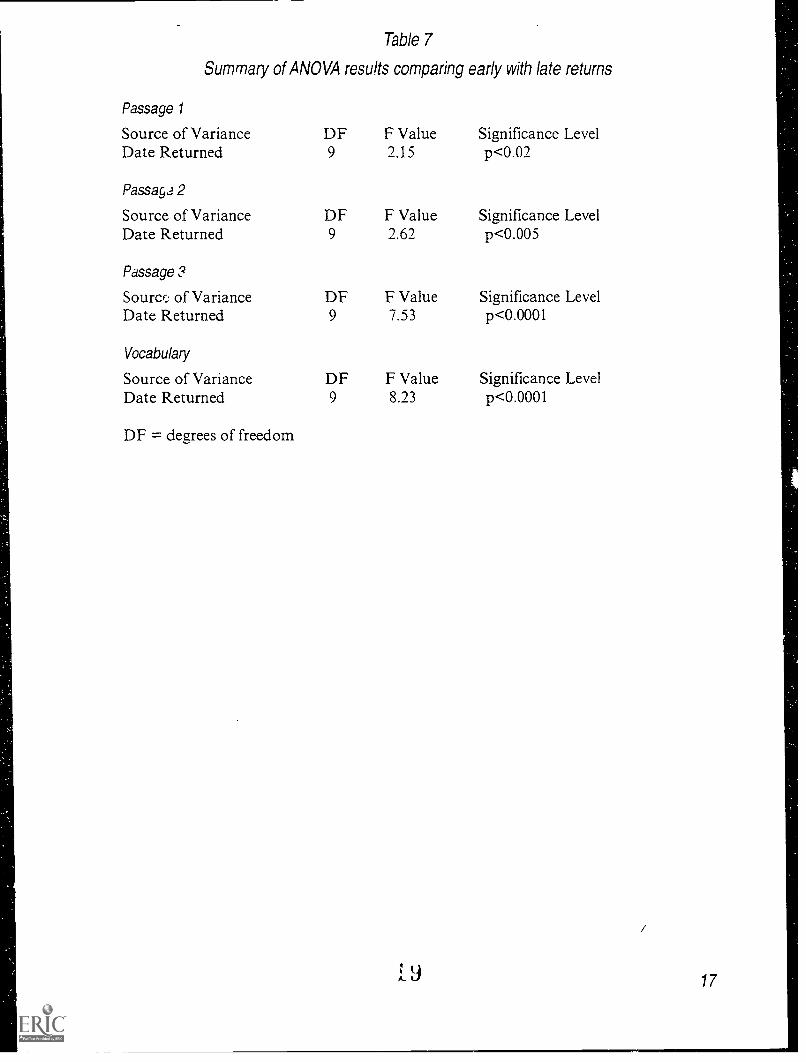
Table 7
Summary of ANOVA results comparing early with late returns
Passage 1
Source of VarianceDate Returned
Passag3 2
DF9
F Value2.15
Significance Levelp<0.02
Source of Variance DF F Value Significance LevelDate Returned 9 2.61 p<0.005
Passage 3
Sourer.: of Variance DF F Value Significance LevelDate Returned 9 7.53 p<0.0001
Vocabulary
Source of Variance DF F Value Significance LevelDate Returned 9 8.23 p<0.0001
DF = degrees of freedom
917
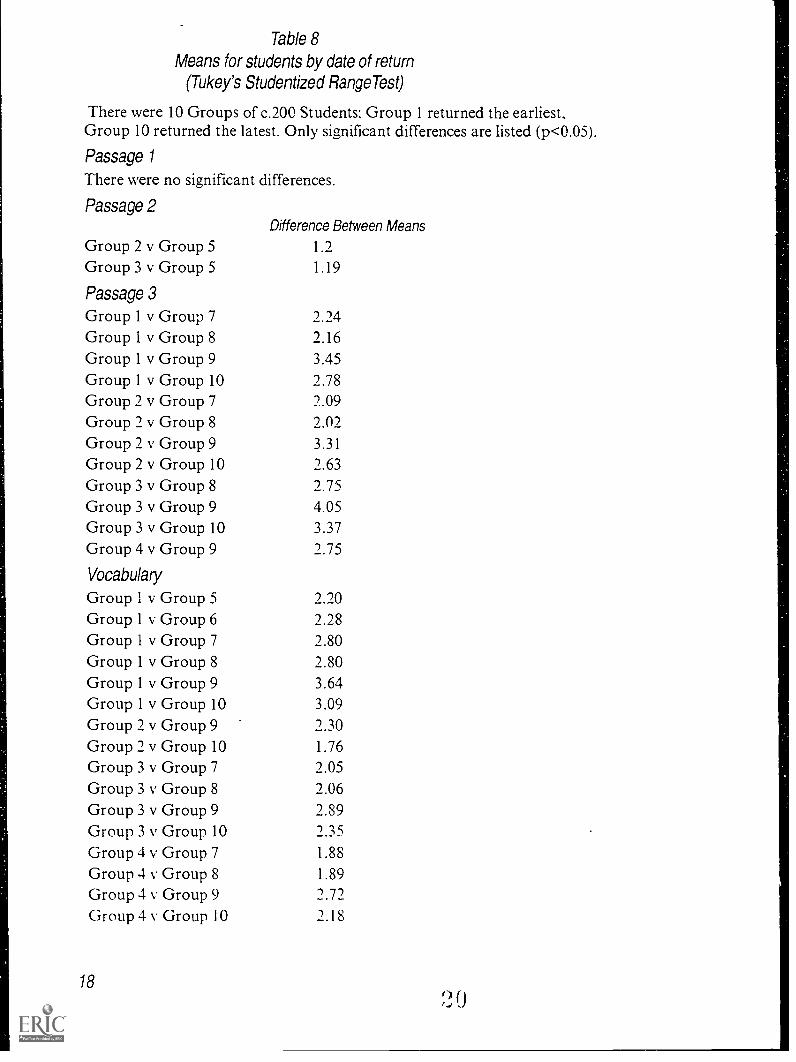
Table 8
Means for students by date of return(Tukey's Studentized RangeTest)
There were 10 Groups of c.200 Students; Group 1 returned the earliest.Group 10 returned the latest. Only significant differences are listed (p<0.05).
Passage 1
There were no significant differences.
Passage 2
Group 2 v Group 5Group 3 v Group 5
Passage 3
Difference Between Means
1./1.19
Group 1 v Group 7 /.14Group 1 v Group 8 2.16Group 1 v Group 9 3.45Group 1 v Group 10 2.78Group 2 v Group 7 2.09Group 2 v Group 8 /.0/Group 2 v Group 9 3.31
Group 2 v Group 10 2.63Group 3 v Group 8 /.75Group 3 v Group 9 4.05Group 3 v Group 10 3.37Group 4 v Group 9 2.75
Vocabulary
Group 1 v Group 5 /./0Group 1 v Group 6 2.28Group 1 v Group 7 2.80Group 1 v Group 8 2.80
Group 1 v Group 9 3.64Group 1 v Group 10 3.09Group 2 v Group 9 1.30Group 2 v Group 10 1.76
Group 3 v Group 7 2.05Group 3 v Group 8 2.06Group 3 v Group 9 2.89Group 3 v Group 10Group 4 v Group 7 1.88
Group 4 v Group 8 1.89
Group 4 v Group 9 2.72
Group 4 v Group 10 2.18
18
2 0
Text & Readers ProgrammePublications
Technical Reports1: The revolution in print technology2: A postal survey of OU students reading skills3: Results of the survey of OU students' readin.g skills4: OU students' reading skills and final registration
News" lash1: OU students' reading skills
21
News from IET Text & Readers Programme
OU Students' Reading Skillsresults of a survey 01 1995 entrants
Michael MacdonaldRoss & Bernard Scott
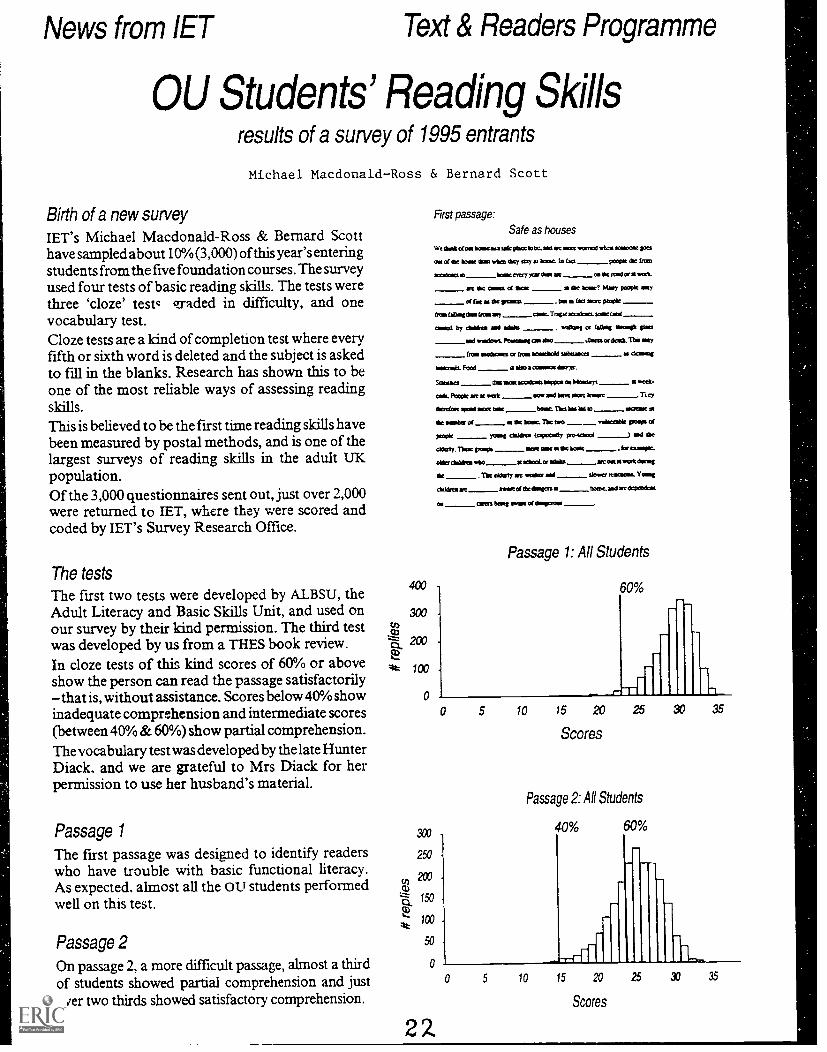
Birth of a new surveyIET's Michael Macdonald-Ross & Bernard Scotthave sampled about l 0% (3,000) of this year's enteringstudents from the five foundation courses. The surveyused four tests of basic reading skills. The tests werethree 'doze' testc uaded in difficulty, and onevocabulary test.Cloze tests are a kind of completion test where everyfifth or sixth word is deleted and the subject is askedto fill in the blanks. Research has shown this to beone of the most reliable ways of assessing readingskills.This is believed to be the first time reading skills havebeen measured by postal methods, and is one of thelargest surveys of reading skills in the adult UKpopulation.Of the 3,000 questionnaires sent out, just over 2,000were returned to IET, where they were scored andcoded by IET's Survey Research Office.
The testsThe first two tests were developed by ALBSU, theAdult Literacy and Basic Skills Unit, and used onour survey by their kind permission. The third testwas developed by us from a THES book review.In doze tests of this kind scores of 60% or aboveshow the person can read the passage satisfactorily
that is, without assistance. Scores below 40% showinadequate comprehension and intermediate scores(between 40% & 60%) show partial comprehension.The vocabulary test was developed by the late HunterDiack, and we are grateful to Mrs Diack for herpermission to use her husband's material.
Passage 1
The first passage was desigied to identify readerswho have trouble with basic functional literacy.As expected. almost all the OU students performedwell on this test.
Passage2On passage 2, a more difficult passage, almost a thirdof students showed partial comprehension and justover two thirds showed satisfactory comprehension.
Fhlpassive:Safe as houses
Wc Oak dor boocioa sac pace o mod we mac woad *tot soma= aota
oat of Mc awe 0110 Ho dry stay a loot La Cad people dc frcoa
MaCM0 WaMayaadOOM co ac radar al oat_
am ad mad of Om sa dic awe Mary go* mai
eat a de drama Oa al tact moo people
Cm ado( don &may caw, Trapcadadows.acac falai
meal ba dads sad Was . vakati or Isaac am. Sim
satras. Parma( am sae dam ordeal. TOO stay
fcca machcaos a boo loadcold sebum= a darnmamma. Foal alio acorns forxr.
Souses dat WIC =dors loppototMoolar a *cet-
era Rode ae a oat saw and Iwo sore lawn Thry
aadae rale wet ow tar- not Itoa roomsdr sear of at at kat. Ta ralacotic pow, of
mak rain daldroi (adocally pre-school _---) ad Id
dada,. Tim poapa awe owe ad lost kr cum*.
adardados add aloat. or waits arc coca oat dams
ac . Tho Warty arc molar nod slaw mama. Yam(
(*Wax aratafcbcdogen team asclarcdepeadoa
co oral bag wale a dooms
Passage 1: All Students
400
300
200
100
60%
5 10 15 20 25 X 35
Scores
Passage 2: All Students
30040% 60%
250
u, 290
Z.150
100
50
0
22.
0 5 10 15 29 25 30 35
Scores
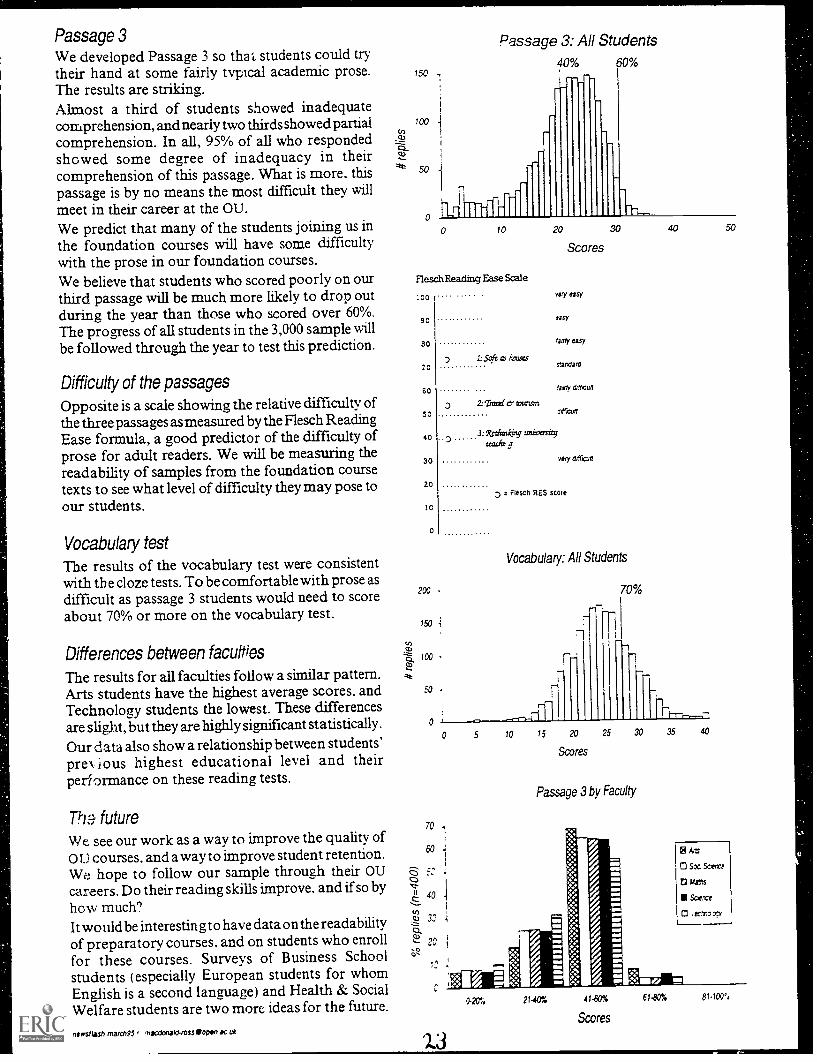
Passage 3We developed Passage 3 so that students could trytheir hand at some fairly typical academic prose.The results are striking.Almost a third of students showed inadequatecomprehension, and nearly two thirds showed partialcomprehension. In all, 95% of all who respondedshowed some degree of inadequacy in theircomprehension of this passage. What is more, thispassage is by no means the most difficult they willmeet in their career at the OU.We predict that many of the students joining us inthe foundation courses will have some difficultywith the prose in our foundation courses.We believe that students who scored poorly on ourthird passage will be much more likely to drop outduring the year than those who scored over 60%.The progress of all students in the 3,000 sample willbe followed through the year to test this prediction.
Difficulty of the passagesOpposite is a scale showing the relative difficulty ofthe three passages as measured by the Flesch ReadingEase formula, a good predictor of the difficulty ofprose for adult readers. We will be measuring thereadability of samples from the foundation coursetexts to see what level of difficulty they may pose toour students.
Vocabulary testThe results of the vocabulary test were consistentwith the doze tests. To be comfortable with prose asdifficult as passage 3 students would need to scoreabout 70% or more on the vocabulary test.
Differences between facultiesThe results for all faculties follow a similar pattern.Arts students have the highest average scores, andTechnolorzy students the lowest. These differencesare sliglt, but they are highly significant statistically.
Our data also show a relationship between students'pre\ ious highest educational level and theirperformance on these reading tests.
Pia futureWe, see our work as a way to improve the quality of0 I.) courses, and a way to improve student retention.We hope to follow our sample throuth their OUcareers. Do their reading skills improve, and if so byhow much?It would be interesting to have data on the readabilityof preparatory courses. and on students who enrollfor these courses. Surveys of Business Schoolstudents ( especially European students for whomEnglish is a second language) and Health & SocialWelfare students are two more ideas for the future.
nrsilash matc995 maccicoalci.rosseopon uk
150 ,
Passage 3: All Students40% 60%
10 20 30 ao so
Scores
Flesch Reading Ease Scale
very easy
90 OJSY
30 fartly easy
1:Scrie as ',curs20 vandal
SO 'arty cecul
2:Truziel C ivtatsm
SO se,cter
40 . D3:Rofraskthg university
taw&
30
20
10
0
200
very citricart
Fiesch RES score
Vocabulary: All Students
70%
0 5 10 15 20 25 30 35 40
Scores
Passage 3 by Faculty
0-20% 2140: 41-8cm
Scores
61-80% 81100'.
![CLOZE TEST Go with Frequently Used Words …prepadda.com/.../English-Cloze-Test[].pdf · MOCKTIME.COM ONLINE TEST SERIES CORRESPONDENCE COURSE CLOZE TEST INTRODUCTION A Cloze reading](https://img.pdfslide.net/doc/110x75/5aa8d9367f8b9a90188c1254/cloze-test-go-with-frequently-used-words-pdfmocktimecom-online-test-series.jpg)