Embed Size (px)
Citation preview

-ED 283 759
AUTHORTITLE
INSTITUTIONREPORT NOPUB-DATENOTEAVAILABLE. FROM
PUB TYPE
EDRS PRICEDESCRIPTORS
DOCUMENT RESUME
SO 018 249
Brown, Lester R.; Jacobson, Jodi L.The Future of Urbanization: Facing the Ecological andEconomic Constraints. Worldwatch Paper 77.Worldwatch Inst., Washington, D.C.ISBN-0-916468-78-XMay 8762p.Worldwatch Institute 1776 Massachusetts Avenue,Washington, DC 20036 $4.00).Reports - Evaluative easibility (142)
MF01 Plus Postage. PC Not Available from EDRS.Damography; Depleted Resources; Developing Nations;*Ecological Factors; *Economic Factors; EnergyManagement; Foreign Countries; Higher Education;*Human Geography; Land Settlement; MigrationPatterns; *Population Trends; Eesidential Patternn;Resources; Urban Areas; Urban Demography; *UrbanEnvironment; *Urban Problems
ABSTRACTAaide.from the growth of world population itself,
urbanization is the dominant demographic trend of the late twentieth:centuryr. the number of people' living in Cities increased from Six
.'hundre&million- in 1950 to-_over tWo,billion .in 1986. If this Ixowthcontinuesiilnabated,'more- than hilf'of humanity will reside in urban'aree*:Ohortik-after- the...turn of-the.century..Resultant-sijks of urban
,stress:Jlos.apparent around_the-.world_call into'..question the. continuingexpansion. of cit,ies. Land .and water scarcity, inefficientenergy_Use-.and 'waste disposal, and -the re-sultant,problems of
.-pollution,a11,-contribute to the escalating ecological'and economic-_costs of'SupportiAgmodern'cities.ACcelerate&-urbanization in theThird-World has zpurred.the.conCentrationofPolitical power withincities, .leading-:to policies,that- favor:urban over rural areas. Now,-mountint-witernal.debts-ars forcing Third World governments to.scale.back urban Subsidies just.as the demand-for services multiplies.Today's urban areas, larger and more numerous than ever, haveoutgrown the ,capacity of natural' and social systems .to support them.One way of reaching a nation's optimum rural-urban balance would befor a market economy to play a moreprominent role in economicdevelopment. Chapters include: "The Growth and Role of Cities";"Urban Energy Needt"; "Feeding Cities"; "Nutrient Recycling";"Ecology and Economics of City Size"; and "Seeking a Rural-UrbanBalance." (EZ)
**** .**********Reproductions supplied by EDRS are the best that can be made
from the original document.*****************************************************************

rs,j,t:=Lt
_:u.o:DroArrrima cc rouciTiowice at Edueotional Hemmen and Immurement,
TONAL RESOURCES INFORMATIONCENTER (ERIC)
document has been reproduced asreceived from the person or organisationoriginating ILMinor changes nava been mad* to Improve
roductIon QulIlly
Points of viewer opin:ons listed In thIldocu .menu do not nacsmarily represent officialOERI position or policy ===s,=,,v =,
_*frikViskolq
PERMISSIdN-TO,RERROPUOA,THISMATEflIALIN MICROFiCHE .7:04YHAS SEEN GRANTED BY'
TO,THE EDUO:TIONAL RESOURCESINFORMATION CENTER (ERIC):
_

Worldwatch Institute is an independent, nonprofit research organiza-tion created to analyze and to focus attention on global problems.Directed by Lester R. Brown, Worldwatch is funded by private foun-dations and United Nations organizations. Worldwatch papers arewritten for a worldwide audience of decision makers, scholars, andthe general public.

The Future of Urbanization:Facing the Ecological and
Economic ConstraintsLester R. Brown
and Jodi L. Jacobson
Worldwatch Paper 77May 1987

Finandal support for this paper was provided by the United NationsFund for Population Activities. Sections of this paper may be repro-duced in magazines and newspapers with acknowledgment toWorldwatch Institute._
The views expressed in this paper are those of tho aothors mid donot necessarily represent those of Worldwatch Institute and its direc-tors, officers, or staff, or of funding organizations.
oCopyright Worldwatch Institute, 1987Library of Congress Catalog Card Number 87-50
ISBN 0-916468-78-X
Pdnted on recycled paper

Table of Contents
ntrodaction 5
'The Growth a.t9,1' 6
Urban Energy Nt 1= 13
..FeedingCfties= 23
-Nutrient Recyclidig 29
Ecology and Economics of City Size 35
.Seeking a Rural-Urban Balance= = 45
-otes= 51
side from the gowth of world population itself, urbanizahonis the dominant demographic trend of the late twentieth cen-
The number of people living in dries increased from 600on in 1950 to over 2 billion in 1986. If this growth con-
tinues unabated, more than half of humanity will r.2side in urban areasshortly after the turn of the century.'
Historically, world population has been overwhelmingly mral. Thenumber and size of urban settlements increased sporadically over thepast several millenia. But the widespread urbaniation now elidentaround the globe is lar ely a twentieth-century phenomenon: As re-cently as 1900, fewer than 14 percent of the world's people lived in
_ cities.2
Technological change arid the avaability of vast energy supplies dove-tailed in e nineteenth century to foster the development of lamodern cities. In 1800, on the eve of the Industrial Revolution brexample, about one-fourth of the British lived kt cities; by 1900, two-third§ of the population was urban. Coal, replacing firewood as thedominant energy source in Europe, fueled this urban growth. It waslater supplanted by oil, which has 'supported the massive urlxiniationof the late twentieth century, pmvidiig fuel for transportation and theconsolidation of industrial processes.
Petroleum has also enabled cities to lengthen their supply thies anddraw basic resourzes, suet as food arid raw materials, from distantpoints. Cheap oil and economic policies encouragmg rapid indus-triakation to ether led to a phenomenal surge in urban gowth that isstill rippling through developing countries.
The authors gratefully acknowledge the comments provided by Peter WG. Newman,Judith Kunofsky, Larry Orman, ffertrand Renaud Kenneth Newcombe, Jyofi Singh,and James Chui on early drafts of this paper. Many thanks to Susan Norris for prodUc-Hon assistance and an unfailing smile.

6
The evolution of urban settlements, placed in the context of humanhistory, has long been considered a benchmark of social and economicsuccess. But signs of urban sttess now apparent around the world callinto question the continuing expansion of cities. City dwellers--currently some 43 percent of the world's population-ommand a dis-proportionate share of society's fiscal and natural resources and create a-.1isproportionate share of its wastes. Land and water scarcity, Mefficientenergy use and waste disposal, and the resultimt problems of pollutionall contribute to the escalating ecological and economic costs of sup-portLng modem cifies.4
Accelerated urbanization in the Third World has spurred the con-centration of political power within cities, leading to policies that favorurban over rural areas. Overvalued exchange rateS that reduce thecost of imports, and preferential urban subsidies often make food andother basic goods cheaper in the city, discouraging agricultural invest-ment and attracting people to urban areas. Now, mounting externmdebts are forcing Third World governments to scale back utban sub-sidies just as the demand for services multiplies.
The rapid economic Evowth and abundant resources that contributed tothe rise of cities in an earlier era can no longer be taken for granted:Urban areas, larger and more numerous than ever, have outgrown the
acity of natural and social systems to su port them. A. a result,ay's cities may be inhibiting, rather than aiding, efforts to raise living
standards in an equitable fashion.
The Growth and Role of Cities
Cities are a relatively recent phenomenon, lagging by several millenniathe emergence of agriculture some 12,000 years ago. Agficultural sur-pluses, expanding populations, and the sense of common interestsamong peoples of a reon fostered the initial growth of urban areas.The first kriown dues evolved 5,000 years ago on the Nile, Tigris, andEuphrates rivers when traditionally nomadic peoples began to Cultivatecro s. Food surpluses resulting from successive agricultural advances,such as the harnessing of draft animals and the development of irri-gation, enabled farmers to support nascent villages and towns.

Jrban areas, larger and more numerousthan ever, have outgrown the capacity of
natural and social systems to supportthem."
Diversification of trade and the production of a wider array of goodsencouraged the continued development of human settlements. Pre-industrial cities, such as second-century Rome and Chang'an (Xian),imperial capital of the Chinese Tang dynasty, arose on nearly everycontinent A.dvances in science and the arts seem to have depended onthe dynamics of a "human implosion" as the population density ofancient cities speeded the exchange of ideas ancl innovations. Urbanhistorian Lewis Mumford has noted that the maturation of cities inGreece, for example, culminated in a coHective life more highly en-ergized, more heightened in its capacity for esthetic expression andrational evaluation than ever before.5
C,
Despite the importance of cities in past social and economic develop-, ment, their history only foreshadoived the dominant role cities nowplay. Contemporary urban areas are integral centers of productionand communications in a highly interdependent global network. Butparticularly in the Third World, where Urban growth is most rapid,the economic gains normally attributed to cities are being offset byincreasingly inefficient use of human and natural resources as a resultof uncontrolled urban expansion.
Urbanization has three demographic components: migration, naturalincrease (the excess of births over deaths), and reelassification ofrapidly developing rural areas to cities. Mig-ration is most importantin the early stages of urbanization. as in Africa today, while naturalincrease now dominates city growth in parts of Asia and throughoutLatin America. At the current growth rate of 2.5percent yearlyhalf
-.'again as fast as world populationthe number of people Hying incities throughout the world will double in the next 28 years. Nearly
; nine-tenths of this expansion will occur in the Third World, where theannual urban growth rate is 3.5 percentmore than triple that of theindustrial world.6
Latin America, with 65 percent of its people in urban areas, is the siteof some of the world s largest cities: Mexico City and SR) Paulocontain 18 million and 14 million ioeople, respectively. By the turn ofthe century, over three-fourths of Latin America's 563 million peopleare expected to inhabit cities. (See Table 1.)7

Table 1: Urban Share of Total Population, 1950 and 1986,with Projections to 2000
8 1950 1986 2000
(percent)
North America &I 74 78Europe 56 73 79Soviet Union 39 71 74East Asia 43 70 79
Latin America 41 65 77Oceania 61 65 73China 12 32 40Africa 15 30 42South Asia 15 24 35
World 29 43 48
Sources: For 1986 data, Fo ulation Reference Bureau, 1986 World Population Data Sheet(Washington, D. .: 1986); for 1950 and 2000, Carl Haub, Population Refer-ence Burbau, Washington, D.C., personal communicabon, August 28, 1986;
In Africa, the least urbanized continent, urban population is growing5 percent yearly as millions of Afticans fleeing environmental deg-radation and rural poverty migrate to cities. Today 175 million Afri-cans live in citie 30 percent of the continent's total. If current o-jections materialize, this number will reach 368 million in 200tenfold increase since 1950.8
Most East Asian countriesJapan, Taiwan, North and South Korea--have predominantly urban advanced economies. taiina, now in theearly stages of industrialization, is the exception to this pattern.Scarcely 32 percent of its population lives in cities. This divergence is

:
due in part to the strict regulations on internal migration that pre-yailed prior to 1978, and in part to growing rural prosperity as gov-ernrnent policies stimulate agricultUral development. Urbanizationrates in China have stepped up recently, however, as the governmentencoUrages the development of towns and small cities to reduce ruralpopulation pressures.
South Asia presents a mixed picture of urban development. Althoughcity dwellers make up a relatively small share of total population inmost countries of the region, urbanization seems to be accelerating.India is predominantly fural, with only 24 percent of its 765 millionpeople in cities. Indian cities, however, grow by 600,000 people eachmonth: Large cities such as Bombay, Calcutta, Delhi, and Midrascontinue to expand, and rural migration to smaller metropolitan areasis rising. The urban share of population in countries such as In-donesia, the Philippines, Thailand, and Vietnamranging from 18 to39 percentis also increasing rapidly."
Cities of more than 5 million can now be found on every continent.Urban projections for the year 2000 indicate that three out of the fivecities with populations of 15 million or more will be kt the ThirdWorldMexico City, Sao Paulo, and Calcutta. Asia will contain 15 ofthe world's 35 largest cities. In Africa, only Cairo is now in the 5
r million category, but by the end of the centu_- the continent isprojected to-have at least eight such centers. 11
Recent urbanization trends in the Third World are unparalleled his-torically. Between 1800 and 1910, Greater London's population grewalmost sevenfold, from 1.1 million to 7.3 million, an increase nowachieved within a generation in many Third World cities. Similarly,Paris took more than a century to expand from 547,000 to about 3million, a growth matched by some Third Wc :Id cities just sinceWorld War 11. Moreover, the population bases to which toclays highurban growth rates are adding are often dramatically larger thanthose in the past.12
Most governments in the Third World indirectly encouraged the rise oflarge cities through a combination of investment and fiscal policies thattriggered rapid economic growth in the fifties and sixties. Accelerated
11.

industrialization based on capital-intensive industries and importedtechnologies was promoted to forge links between domestic andinternational economies. Such policies had a major impact (.3n popu-lation distribution, influencing people's employment and residenceoptions. Over the past decade, however, fluctuating energy prices,soft commodity markets, and burdensome external debts have takentheir toll on Third World economies. Few countries now have thecapital to provide services for or invest in growing urban areas.
As a result of investment and migration patterns, one city, usually thecapital, often dominates a country, controlling urban trade with bothrural and international markets. The large population in prindpalThird World cities reinforces their concentrated wealth, power, andstatus. As the U.N. Fund for Population Activities notes,Manila and.Bangkok have more in common with Tokyo and Washington thanwith their rural hinterlands."
Rapid urbanization is not surprising given that so much nationalwealth in otherwise poor Third 1Vorld countries is tied up in one or afew cities. In 1983, an estimated 44 percent of Mexico's gross domesticproduct, 52 percent of its industrial product, and 54 percent of itsservices were concentrated within metropolitan Mexico Cityhomeof 22 percent of the countrys population. Similarly, more than 60percent of Philippine manufacturing establishments in 1979 werelocated in Greater IVIanila."
The polarization of rural and urban economies in developing coun-tries has two negative side effects. First the demand for serviceswithin the largest cities is so great that few resources are available forinvestment in other regions. Large cities pk-rwide greater economies of
. scale for certain high technology and expolt induStries. But Mdustrialinvestments comprise only a small part of an integrated developmentstrategy. Moreover, once metropolitan areas reach a population of 2or 3 Million, they offer no unique advantages to small- and medium-sized enterprises. And the coits of rapidly _growing urban areas canquickly outweigh the benefits. Wall Street Tournal reporter JonathanKande observes that "the cost of supporting Mexico City may beexceeding its contribution in goods and services; the nation's eco-

arila and Bangkok have more incommon with Tokyo and Washington than
with their rural hinterlands."
nomic locomotive is becoming a financial drain.- Second, because thesuccess of the principal city becomes so critical to the national econ-omy, the rest of the country is highly vulnerable to economic shocksor natural disasters that may affeCt it.'
Population grrowth in Third World cities is oiitpacing city and nationalbudgets and straining urban institutions. The result is a profusion ofsprawling, unplanned cities in which access to adequate housintransportation, water supplies, and education is severely limiteThis pattern of uncontrolled growth reduces urban productivity andefficiency, affecfing not only urban areas but entire national econ-omies.
The sharp income stratifications characteristic of Third World urbanpopulafions result in part from too many people chasing too few jobs.In metropolitan Manila, 16 percent of the labor force is unemployedand 43 percent is underemployed. The government's own programfor economic development, including an industrial policy which em-phasized capital-intensive rather than labor-intensive industries, hasshut many out of the job market.'
Constant ina-eases in urban populations also tax city services to thelimit. In Alexandria, Egypt, a sewage system built earlier this centuryfor 1 million people now serves 4 million. Lack of investment capitalto upgrade waste treatment and drainage systems has left parts of thecity awash in raw sewage. Most people in large African citiesLagos,Nairobi, Kinshasa, Addis Abaha, and Lusaka, among otherslack
iped water and sanitation. A 1979 survey found that 75 percent ofamilies in Lagos lived in single-room dwellings. Seventy-eight per-
cent of the households shared kitchen facilities with another family,while only 13 percent had running water. If the urban growth forecastfor Africa is realized, living standards will undoubtedly deterioratefurther.17
Low incomes, high land costs, and a dearth of affordable financingleave a growing number of families unable to buy or rent homes-l-even ones subsidized by the government. In Lima and La Paz, thetin-and-tarpaper shacks of the urban poor are found in the shadow oftalL modern office buildings. Mexico City has gained notonety for the
ii

lar e number of people living in makeshift burrows in a hillsidegar age dump. Scenes like these are repeated in shantytowns andillegal settlements ringing cities throughout the Third World.
Growing subsidies combine with weak tax codes to limit the invest-ment capability of national and munidpal governments. The Phil-ippine government estimates that at least two-thirds of all new hous-ing being constructed in Manila, where 60 percent of the householdsfive beloW the poverty line, is "illegal and uncontrolled.- In Bombaat least one-third of the population lives in slums. Although 15, 000dwellings are built there each year by both public and private inves-tors, the government esfimates that more than four hines that num-ber would have to be built simply to meet current needs. Is
Excessive urbanization is evident in the increasingly disparate stan-dards of living within dries, and between urban and rural dwellers.World Bank economist Andrew Hamer, reviewing the impact of ur-ban economic concentration on Brazil's development, found that M1975 Sao Paulo had less than 10 percent of the countly's populationbut accounted for 44 percent of the electricity consumption, 39 per-cent of the telephoneS, and well over half the industrial output -andemployment. He concluded that -S5o Paulo has been the beneficiaryof preferential public sector treatment for most of the last century[while] large segments of the population and even larger segments ofthe national territory were subject to 'benign neglect.'19
It is not uncommon for developing countries to allocate only 20 per-cent of their budgets to the rural sector, even with 70 13ercent of theirpopulations in rural areas. Yet, in many countries of the Third World,the majority of the population still de_pends on agriculture for theirlivelihood and will continue to do so for several decades."
Migrants leave rural areas for a complex array of reasons. High ratesof rural population growth and landlessness have foreclosed agrarianfutures Tor many. Some subsistence farmers migrate to cifies on aseasonal basis, looking for supplemental employment. But moremove permanently in hopes of improving their income propects.
"Oil made massive urbanization possible."
Few Third World governments have adopted national developmentpolicies that balance urban and rural priorities. Michael Lipton, ananalyst of rural-urban relationships in developing countries, graphic-ally describes the conflicts that arise: "The most important class con-flict in the poor countries of the world today is not between labor and[those who control] capital, nor is it between foreign and nationalinterests. It is between the rural classes and the urban classes. Therural sector contains most of the poverty and most of the low-costsources of potential advance. But the urban sector contains most ofthe articulateness and power. As a result, the urban classes havebeen able to win most 6f the rounds of the struggle with the countryside; but in doing so they have made the develOpment process need-lessly slow and unfair." This strong urban bias in the provision ofservices, such as education, health, electricity, and water, increasessocial inequities: It deprives rural individuals of opportunities andsocieties of sorely needed talent.'
Urban Energy Needs
Urbanization over the last two centuries has been closely tied to theuse of fossil fuels. Coal, used to run the steam engines that poweredboth factories and rail transport, gave rise to industrial society and thefirst industrial cities. It dominated the fossil fuel age until a fewdecades ago, but oil made massive urbanization possible. As worldpetroleum production turned sharply upward after midcentury, thenational eruct international transportation systems on which citiesdepend grew by leaps and bounds.
The amount of energy needed to support each urban dweller aroundthe globe is increasing. Both the size and shape of cities are con-tributing to this trend.in some industrial countries, urbanation hasslowed, but others, such as the United States, are still undergoingextensive suburbanization. And in the Third World, where ur-banization is proceeding rapidly, energy consumption is on the riseas well.
Whereas rural communities rely primarily on local supplies of food,water, and to a lesser degree, fuel, cities must import these corn-
15
13

14
modifies, often over long distances. Likewise, rural areas can absorbtheir wastes locally at relatively small energy costs, but cities need farmore energy to collect garbage and treat sewage.
Urban energy budgets increase as cities expand their boundaries,pushing bad( the countryside and lengthening supply lines. Theamount of energy needed for households, industry, and transporta-tion is closely related to the structure of urban social and economicactivity. The efficiency with which energy is used depends less on thesize of urban population than on choices regarding land use andtransportation. Considerably hiper levels of energy are requiredwhere settlement patterns are hi hly dispersed than where peoplelive in close proximity to jobs and markets.
Taken together, the many intimately related yet often uncoordinateddecisions made by urban residents and local and national govern-ments shape urban form. Is the city compact or sprawling? Are mostof its needs met within a defined region or must resources be im-ported over long distances? How are wastes handled? The way thesequestions are answered influences how dependent a city is on exter-nal energy resources.
Poor planning leads to inefficient energy use. Suburbs invade thecountryside and perpetuate the need &1- automobiles. Traffic con-gestion leads to reduced vehicle efficiency and health-threateningpollution levels.
Cities built of concrete, stone, and asphalt absorb and retain solarenergy, raising energy consumption in summer by creating the needfor air conditioning. A study of 12 U.S. cities showed that whileheating was required on 8 percent fewer days in city centers than inoutlying areas, air conditioninga more energy-intensive proces&was needed on 12 percent more days, more than offsetting any gainsfrom energy savings on heat.n
The amount of energy it takes to satisfy food needs also increases inurban settings. Not only are supply lines longer for cities, frequentlyextending across national borders, but food -shipped long distancesneeds mare processing and packaging. Fresh fruits, vegetables, and

livestock products often require refrigerated transport. Of the totalenerg.y expended in the food system of the United States, roughlyone-third is used in the production of food; one-third in transporting,processing, and distributing it; and one-third in preparing it.L3
As with food, water needs of large cities often exceed nearby sup-plies, fordng municipalities to pump and convey water over greatdistances. Local surface water supplies, frequently polluted by urbanwastes, require physical and chemical purification, another energy-consuming process.
Most cities can realize dramatic savings in transport ener useoneof the largest urban energy expenditures- -by reducing their relianceon automobiles. Studies of the major petToleum-consuMing sectors inthe United States, for example, have shown that compared to res-idential and industrial users, savings in oil consumption in the trans-port sector have been negligible. (See Table 2.) Fuel-switching andconservation have been important confributors to lowering oil con-sumption in all but the auto-dominated transport sector.
No single technology has had greater impact on urban form in the lastseveral decades than the internal combuStion engine. The first indus-trial cities, clustered around rail and trolley lines, were limited in size
Table 2: Average Annual Growth of Petroleum Use in the UnitedStates by Sector, 1965-85
AverageResident/ In- Electrical Transpor- Growth in
Commercial dustrial Generation tation Petroleum Use
(percent)1965-73 3.1 9.9 19.4 4.8 5.11973-79 3.0 2.5 6.8 1.8 1.11979-85 4.8 5.3 14.0 0.2 3.1
Source: Monthly Energy Review, U.S. Department of Energy, various issues.

and form by these modes of transportation But the proliferation ofautomobiles earlier in this century eclipsed mass transit. Automobilesencourage the growth of suburbs, and give city dwellers an insatiableappetite for fosSil fuels. In addition, the urban sprawl characterislic ofauto-based societies has forestalled efficiency gains in other areas,such as district heati_ng and some forms of renewable energy thatrequire relatively high levels of population density to be econornical.
Automobile-dependent societies lilce the United Stateswhere indi-vidual mobility through private transport is considered an inalienablerightonsurne far more energy moving people and goods thanthose relying more heavily on other modes of transportation. Whenlarge and growing populations spread out in widening circles, roadnetworks must expaud. Commuting distances lengthen and morefuel is required for urban and suburban transportation.
More intensive land use shortens the average distances that urbandwellers travel and strengthens urban transit systems. Public transitbecomes more viable when there are more people per stop; as thenumber of passengers per kilometer rises, the amount of energy usedto move ea-di pasSenger falls.
Australian scientists Peter Newman and Jeffrey Kenworthy haveshown that the amount of energy devoted to transport depends on"activity intensity"a measure of city land use based on the con-centration of residents and jobs per hectare in a metropolitan area. Ina global sample of 31 cities, including 10 in the United States, 12 inEurope, 5 in Australia, and 3 in Asia, Newman and Kenworthy foundthat average per capita gasoline consumption in the U.S. cities wasnearly twice as high as in the Australian ones, over four times theEuropean ones, and over ten times more than the Asian eilies ofTokyo, Singapore, and Hong Kong. (See Table 3.)24
In each case, intensive land use correlated with substantial savings intransport energy. The difference between U.S. cities and those inother regions lies in the distances covered and the degree of relianceon automobiles. For example, in Los Angeles, Denver, Detroit, andHouston, the share of population driving to work ranges from 88percent to 94 percent. In contrast, only 40 percent of urban residents

Table 3: Urban Gasoline Consumption Per Capita, United S atesand Other Countries
Urban Areas
U.S. CitiesTorontoAustralian CitiesEuropean CitiesAsian Cities
Consumption Relationship of Consumption inPer Ca ita U.S. Cities to Other Cities
(gallons)4162482189740
(ratio)
1.01.71.94.3
10.4
Source: Peter W. G. Newman and Jeffrey R. Kenworthy, Gasoline Consumption andCities: A Comparison of U.S. Cities with a Global Survey and Some Im-plications," (draft submitted for publication), Murdoch University, Murdoch,Australia, December 198f).
in Europe drive to work. Thirty-seven pi ercent use public transit andthe remainder walk or ride bicycles. Only 15 percent of the popu-lation in industrialized Asian cities such as Tokyo commute to workby car.25
The distances urban Europeans travel to work and on daily errandsare 50 percent shorter on average than similar trips in North Ameri-can and Austrahan cities, which have more extensively suburbanizedsince World War II. Newman and Kenworthy found in these interna-tional urban comparisons that land-use patterns are more importantfor energy consumption than income levels, gasoline prices, or thesize of cars.'
The link between land-use intensity and gasoline consumption is alsoevident in a comparison of ten major U. S cities. (See Table 4.) Res-idents of Houston and Phoenixthe metropolitan areas with thelowest activity intensifies consume nearly twice as much gasolineper capita as do residents of New York, a metropolitan area withdouble the number of people and jobs per hectare.
17

18
Table 4: Gasoline Consumption Per Capita in Selected U.S. Cities,1980
GasolineUse PerCapita
Share of PopulationCommuting to Work
by AutoActivi
Intensi(gallons) (percent)
Houston 546 94 14Phoenix 512 95 13Detroit 482 93 20Denver 462 88 20Los Angeles 428 88 29
San Francisco 424 78 23Washington 374 81 21Boston 374 74 20Chicago 353 76 26New York 323 64 31
Average 416 83 22
'Activity intensity is a measurea metropolitan area.
Source: Peter W. G. Newman and Jeffrey It Kenworthy, -Gasoline Consumption andCities: A Cornpanson of U.S. Cities with a Global Survey and Some Im-plications- (draft submitted for publication), Murdoch Universi`y, Murdoch,Australia, December 1986.
number of residents plus jobs per hectare in
Inner-city residents of New York use only one-third the gasoline ofresidents living in the outer regions of the tri-state metropolitan areaof New York, New Jersey, and Connecticut. And Manhattan res-idents use on average only 88 gallons of gasoline per capita each year,a consumption level close to that in European cifies. By contrast, eachof the 240,000 suburban residents of Denver's metropolitan area con-sumes some 1,000 gallons of asoline per yearmore than 11 timesthat of Manhattan residents.2
20

As a rule of thumb, urban planners mustset aside one-quarter to one-third of a city s
land to accommodate autos."
Once a city becomes dependent on automobiles, inefficient land-usepatterns and automobile reliance tend to become self-reinforcing,making the transition to mass transportation more difficult. Un-fortunately, Third World citieswhere transportation needs are mul-ti lying rapidlyare now repeafing the mban development patternsof industrial countries.
Sao Paulo provides a dramatic example of urban sprawl in a develop-ing country. hi 1930, Sao Paulo's population of 1 million coveredapproximately 150 square kilometers. The city with a population of4 millionhad spread to 750 square kilometers in 1962, a fivertAdincrease in area. By 1980, less than two decades later, Sao Paulo'sdimensions had nearly doubled againt. reaching 1,400 square kilo-meters and a population of 12 million.'
Poor land-use controls and weak public transit systems have greatlyincreased auto use at the expense or energy efficiency. But aside fromfuel costs, cifier-: reliant on automobiles face substantial hidden costsas well. As a rule of thumb, urban planners must set aside one-quarter to one-third of a city's land to accommodate autosan ex-travagant use of an increasingly scarce resource. Road maintenancerequires constant infusions of money, while traffic congestion re-duces commercial and industrial productivi 29
Land-use patterns, population size, and level of development deter-mine both the quantity and nature of urban fuel needs for otherpurposes, such as domestic and industrial activity. Typically, durinthe process of development reliance shifts from firewood to fossifuels. As petroleum output expanded after midcentury, for examrle,kerosene -began to replace wood as a cooking fuel in Third Worldcities. It was convenient and, for many urban dwellers, cheaper thanfirewood. The oil price surge of the seventies reversed this trend,catching many countries unprepared for the dral-ianc growth in ur-ban firewood demand.
Rising fuel plices and a scarcity of foreign exchange to import oil forkerosene have forced residents in hundreds of Third World cities toturn to the surrounding countryside for cooking fuel. As a result,forests are being devastated in ever-widening circles around cities,
9 1

particularly n the Indian subcontinent and Africa. No forests remainwithin 70 kilometers of Niamey, Mger, or of Ouagadougou, BurkinaFaso.3°
One country now carefully measuring the loss of tree cover is India,where satel ite images have been used to monitor deforestation. Onestudy reports that the areas of closed forest within a 100-kilometerradius of nine of India's principal cities fell sharply between themid-seventies and early eighties. (See Table 5.) In well under a de-cade, the loss of forested area ranged from a comparatively modest15-percent decline around Coimbatore to a staggering 60-percent de-cline around Delhi.
Unfortunately for low-income urban dwellers, this depletion of fuel-wood supplies has boosted prices. Data for 41 Indian cities, includfrithe nine referred to above, show a 42-percent rise in real fuelwoo
Table 5: Changes in Closed Forest Cover around Major Cities inIndia, 1972-75 to 1980-82
City 1972-75
(square
BangaloreBombayCalcuttaCoimbatoreDelhiHyderabadJaipurMadrasNagpur
Change(percent)
3,853 2,762 285,649 3,672 35
55 41 255,525 4,700 15
254 101 6040 26 35
1,534 786 49918 568 38
3,116 2,051 -734
Source: B. 8014/ander, et al., Deforestation and Fuelwood Use in Urban Centres (Hyderabad,India: Centre for Fnegy Environment, and Technology, and National RemoteSensing Agency, 198
j22

prices from 1977 to 1984. Even though food prices- in India haveremained remarkably stable, nsing firewood prices directly affect thefood consumpfion patterns of the urban poor, who are forced tospend more of their small incomes on cooking fuel. (See Table 6.)Even if India can produce enough food to feed its people by the endof the century, urban residents may lack the fuel to prepare it.
As forests recede from fuelwood-dependent Third World cities, thecost of hauling wood rises. Eventually it becomes more profitable toconvert the wood into charcoal, a more concentrated form of enerbefore transporting it. This conserves transport fuel, but charcoaltypically has less than half of the energy contained in the wood used
manufacture. Not surprisingly, as urban fuel markets reachfarther afield for wood supplies, village residents also suffer fromdepleted supplies and rising costs.3'
If firewood harvesiin was pror erly managed and evenly distributedthroughout a country s forests, this renewable resource could sustainfar larger harvests. But because the demand is often heavily con-centrated around cities, nearby forests are decimated while moredistant ones are left untouched. As urban firewood demand con-tinues to climb, the inability to manage national forest resources forthe maximum sustainable yield could prove to be economically costly
Table 6: India: Index of Real Prices for Food and Fuelwood in 41Urban Centers, 1960-84
1960 19- 1980 1984
Food
Fuelwood
100
100
106
116
102
140
102
165
Source: B. Bowonder t al., Deforestation and Fuelwood Use in Urban Centres (Hyderabad,India: Centre for Energy Environment, and Technology, and National RemoteSensing Agency, 19

22
and ecologically disastrous. The future availability of firewood hingeson better management of existing forests and a far greater tree-planting effort than is now in prospect.
Since the oil price hikes of the early seventies, some cities haveincreased the Share of their energy budgets obtained from renewablesources, including wood and agricultural waste, hydroelectncitygarbage-tue:ed electrical generation, solar collectors, wind turbines,and geothermal energy. As the transition from oil to renewable en-ergy sources gains momentum in the years ahead, it will slow theur anization process, perhaps even reversing it in some cases.
This effect can be seen in the contrasting prices of kerosene andfirewood, the Third World's principal cooking fuels, in rural andurban areas. Kerosene prices are typically cheaper M the city andhigher in the countryside because of higher distribution costs in ruralareas. Firewood prices, by contrast, are typically lower in rural areasand much higher in the cifies. As the shift to firewood and otherrenewable energy resources proceeds, the economic advantages ofliving in the countryside will become more obvious.
The cities now relying on renewable energy are as diverse as thesources they are drawing on: Nearly 40 percent of the homes in Perth,Australia rely on wood for heating, and about 26 percent of the cityresidents use solar energy to heat water. Reykjavik, Iceland, has ionused geothermal energy for most of its space heafing, while Phi -ippine cities such as Manila derive a growing share of electricity fromgeothermally powered generating plants. San Francisco is obtaining agrowing share of its electricity from nearby geothermal fields andwind farms. In Klamath Falls., Oregon, a city Of 42,000 people, morethan 500 homes, a hospital, nursing home, and dairy creamery areheated geotherrnally. A new extension will serve 14 governmentbuildings and several blocks of residences at half the cost Of oil heat.32
Other cities have increased the efficiency of traditional sources ofenergy. District heating through cogenerationan extremely efficientmethod widely used in the early part of this centurytaps the wasteheat produced in electric power generation. District heating permitsmajor wins in energy efficiency where urban populations are suf-

fidently concentrated. Today, European cities lead in the use of wasteheat. In an effort to conserve energy and reduce air pollution, Stutt-
art, West Germany, pipes heated water from power plants throughe city to homes and stores. Tapiola, Finland, has reCaptured waste
heat since 1953. Enough heat is generated by U.S. power plants toheat all the homes and commercial buildings in urban areas. But thispotential resource remains largely untapped Ln the United States dueto urban spraw1.33
A few cities, such as Davis, California, have adopted integrated en-ergy planning to reduce waste in all sectors of the urban economy. Asurvey done in the early seventies indicated that automobiles ac-counted for roughly half of all energy consumed within the citywhile heating and coolhig accounted for an additional 25 percent.Now, updated building codes combined with ordinances to en-courage solar energy deVelopment have reduced the amount of en-ergy needed for internal temperature control. And a low-cost, con-venient public transit system has markedly reduced automobile use.34
By far the largest share of the world's urban population lives in citieswhere energy consumption is rishig, whether from sheer populationgrowth or poor planning and urban sprawl. Urban planners, by as-suming ever greater automobile use, build cities that make it inevi-table. In many countries, forms of energy favored by industry orgovernmentincludLng nuclear power and oil explorationcontinueto receive subsidies that bias energy development away from renewa-ble sources. But as oil costs rise in the nineties, cities that haveencouraged more intensive land use and developed vibrant urbancenters and subcenters linked by mass transit will be the most eco-nomically successful. Such cities will be able to rely to the greatestdegree possible on local, renewable sources of energy to meet theirneeds.
Feeding Cities
When the shift from hunting and gathering to farming be an, worldpopulation probably did not exceed 15 rrullion , no more t an live inGreater Lorpion or Mexico City today. The first cities were fed with

surpluses of wheat and barley produced in the immediately sur-rounding counnyside, since the lack of efficient transportation pre-vented Fong-distance movement of food. Residents Of early Greekcities were aware of their dependence on agricultural bounty andsought to limit city size by design. Lewis Mumford describes thetowns of Greece as -both small and relatively self-contained, largelydependent on their local countryside for food and building materi-als.''35
During the Industrial Revolution this ancient pattern was alteredwhen Great Britain began to export industrial products in exchangefor food and raw materials. The practice spread, and soon much ofEurope followed this trade pattern, On the eve of World War IL Asia,Africa, and Latin America, as well as North America, were all netgrain exporters. Rural areas of these regions were producing g:rain toexchange for the manufactured products of European cities. Ciries inthe industyial countries were tapping not only the food surplus oftheir own countryside, but that of industrial lands as well.
These distant sources of food for cities grew in importance afterWorld War H, as agricultural advances in North America created ahuge exportable surplus of gralii. Between 1950 and 1980, the con-tinent's grain shipments increased from 2.3 million to 131 million tons.(See Table 7.) Since midcentury, the grovdng food surplus of NorthAmerica has underwritten much of the world's urban growth. Closeto half of North America's grain exports are consumed in African andAsian cities half a world away.
Recently, Western Europefor over two centuries the dominantfood-importing regionhas become a net exporter. This shift is attri-butable to agrieultural support prices well above world market levels,advancing agricultural technology, and near-stationary populationsizes. Like cities in North America, those in Western Europe can nowbe supplied entirely with grain produced in the surrounding country-side. In good crop years, such as 1985, Latin America can alSo feed itscities.
Although Asia is now the leading grain importer, India and China,the two countries that dominate the region demographically, have

Table 7: The Changing Pattern of World Grain Trade, 1950-862
Region 1950 1960 1970 1980 19862
(million metric tons)
North America +23 + 39 + 56 + 131 + 102Latin America + 1 0 + 4 10 4Western Europe 22 25 30 16 + 14E. Eur. and Soviet Union 0 0 0 46 37Africa 0 2 5 15 22Asia 6 17 37 63 73Australia and New Zealand + 3 + 6 + 12 + 20 + 20
'Plus sign indicates net exports; minus sign, net imports.2Preliminary.
Sources: U.N. Food and Agriculture Organization, Production Yearbook(Rome: vadousyears); U.S. Department of Agriculture, Foreign Agriculture Circular, variousissues.
recently achieved food self-sufficiency at least temporarily and arethus providing food for their own cities. Both could conceivably con-tinue to do so if they move to conserve their soil and water resourcesand encourage more widespread gains in agricultural productivity. 36
Thus three major geographic re$ionG-- Asia, Africa, and EasternEurope and the Soviet Union still depend on grain from abroad.Major cities in these areas, such as Lening-rad, Moscow, Cairo, Lagos,Dacca, Hong Kong, and Tokyo, depend heavily on grain produced inNorth America. And the Soviet Union is Argentina's main exportmarket. In Africa, formerly a grain exporter, some of the world'sfastest-growing cities are being fed largely with imported grain.
Political instability has increased in regions where the food demandsof growing urban populations outstrip domestic agricultural produc-tion. In Africa and elgewhere, food-pnce and wage policies have beenkey factors in the process of urbanization. Many governments heavilysubsidized food staples and other goods either to encourage urban

26
development or to placate politically powerful urban residents. Now,these same governments are caught between the constraints of bal-looning budget deficits, soaring foreign debts, and the demands ofurban residents accustomed to low-cost goods.
In Zambia, food policies were used in the fifties to encourage growthin the copper-mining industry. Maize prices for European farmerswere set at three times the level of those for native farmers, immedi-ately changing income prospects for the two groups. Discouragedfrom farming by low prices, large numbers of native farmers soughtwork in mining towns, where consumer food prices were heavilysubsidized.37
In the seventies, copper prices and government revenues fell dra-matically; neither has recovered. Population growth is overwhelmina diminishing job market in urban areas and increasing the number oZambians dependent on subsidized urban food supplies. A bud ecrisis forced Cuts in the maize subsidy, sparking riots in Decem er1986. Although Zambian President Kenneth Kaunda restored thesubsidies, he noted that they would divert money that Zambiashould spend on development of public services."38
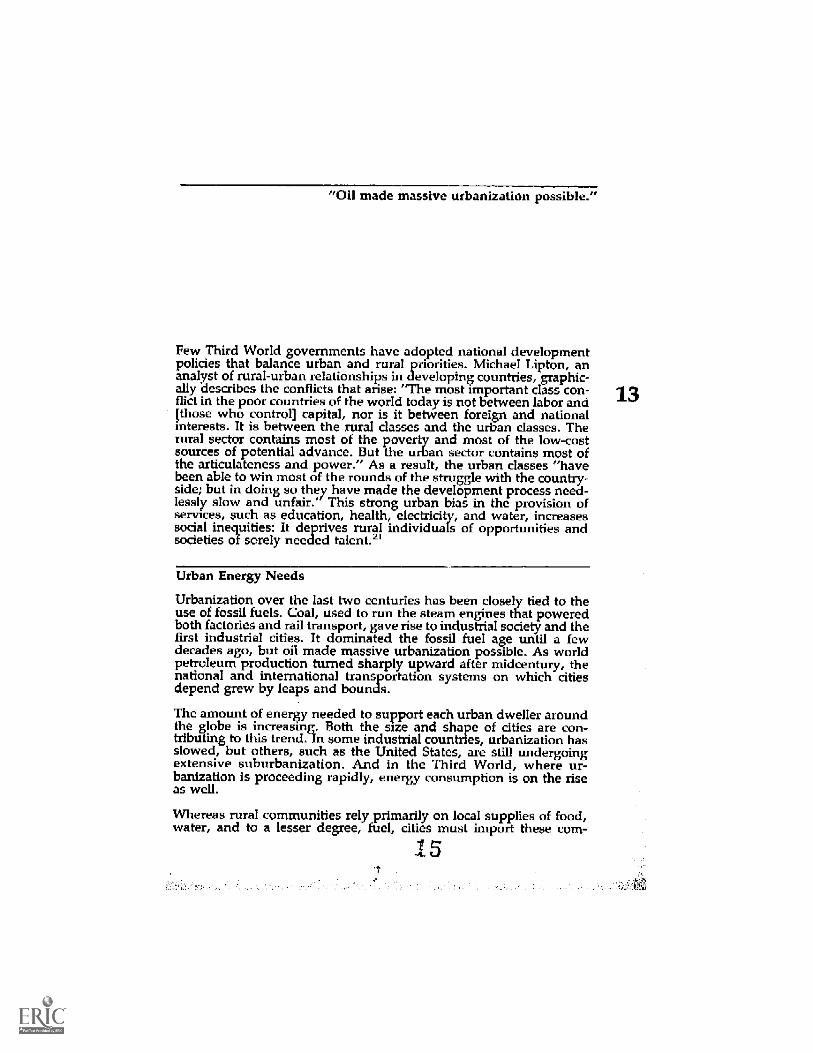
Egypot, once a food exporter, now meets 60 percent of its daily foodneeds with imports bound primarily for urban markets, The govern-ment which has barely recovered from the last spate of bread riots, ispolitically unable to reduce its $2 billion food subsidy but econorrd-cally unable to sustain it. This precarious situation is increasinglycommon: Between 1981 and 1986, more than a dozen food-relatedfiots and demonstrations have occurred in urban areas throughoutthe world. (See Table
Food-price policies directly affect rural-urban relationships by pro-viding unrealistically cheap food for city dwellers and discouraging
rivate investments in food production and hence rural employmentuch policies hold down producer prices as wen as rural- incomes,
thereby transferring net income to urban residents. Due to low do-mestic agricultural prices, the food surplus produced in the country-side may dwindle or disappear. The resuldng distortion in the devel-opment process helps ekplain both the increasing reliance onimported food and the attraction tides hold for the rural unemployed.
2
Table 8: Food-Related Riots and Demonstrations, 1981-86
Coun Date erin EventBolivia
Brazil
DominicanRepublic
EgyptHaitiJamaicaMorocco
Philippines
Sierra Leone
SudanTunisia
Zambia
July 1983
Summer 1983Spring 1984anuary 1985
May 1984May, June 1984January 1985January 1984
January 1984
Spring 1981
March 1985December 1983
December 1986
Drought-induced food short-agesFood shortages in northeastFood price increasesSharply increased prices forbasic foodstuffsIncreased bread pricesFood shortagesFood price increasesCuts in government foodsubsidiesFifty percent increase in foodpricesScarcity of rice and increasedretail food pricesFood price increasesSharply increased prices forwheat and wheat productsCuts in government foodsubsidies
Sources: U.S. Department of Agricultur , Outlook and Situation Reports, Washington,D.C.; various news articles.
Subsidies protect low income urban groups from fluctuating foodprices, but for countries with growing populations, they carry pi rohib-itive costs. Several factors limit the potential success of subsidies. Tomeet standards of equity and efficiency, subsidies must directly bene-

28
fit a target group. In many countries, however, food subsidies areavailable to the population at large at high fiscal cost.
To forestall impending food shortages, governments spend scarceforeign exchange that would be better allocated to the purchase offertilizer or irrigation pumps. Were such investments made, theywould expand food output and the national product while creatingemployment. As the food riots in Zambia and other countries illus-trate, the growing disparities between urban expectations and gov-ernment revenues may lead to increasing social disorder.
Widespread food security has been achieved in those countries, suchas China, where urban and rural priorities are in balance. The mosteffective urban food self-sufficiency efforts are those where city gov-ernments orchestrate land use, nutrient recycling, and marketing, asin Shanghai. Increased local production of periiliable vegetableS fa-cilitates the recycling of nutrients from waste and yields fresh pro-duce at attractive prices, while shorter supply fines reduce de-pendency on energy-intensive transportation.
As China worked toward national self-sufficiency in cereals, some ofits major cities have been seeking self-sufficiency in the production of
erishables, 'particularly fresh vegetables. To reach this goal, Shang-ai, a city of 11 million, extended its boundaries into the surrounding
countryside, increasing the city area to some 6,00 square kilometers.This shift of nearby land to city management greatly facilitates therecycling of nutrients in human wastes. As of 1986, Shanghai wassel -sufficient in vegetables and produced most of its grain ancl a goodpart of its pork and poultry. Vegetables consumed in Shanghai andmany other Chinese cities typically travel less than 10 kilometers fromthe fields in which they are produced, often reaching the marketwithin hours of being harvested.4°
Hong Kong, a city of 5 million occupying an area of just over 1,000square kilometers, has a highly sophisticated urban agriculture whichgrows 45 percent of its fresh vegetables. Fifteen percent of its porkneeds are satisfied by pigs fed with indigenous food wastes, includ-ing some 130,000 tons per year from restaurants and food-processinplants. Relying on importecl feed, the city also produces 60 percent o

-Each day thousands of tons of basic plantnutrientsnitrogen, phosphorus, and
potassium move from countryside to cityin the flow of food that sustains urban
populations."
its live poultry supply. Some 31 percent of Hong Kong's agriculturalland produces vegetables. Fish ponds, occupyin$ 18 percent of theagficultural land, are commonly fertilized with pig and poultry ma-nure and yield 25 to 74 tons of fish er hectare, depending on theparticular species and practice used.4
In the industrial West, European cities have traditionally emphasizedurban community gardens. Following the oil price increases of theseventies, many American cities also launched urban gardening proj-ects, offering undeveloped land to inner-city residents. State gov-ernments, particularly in the Northeast, have organized farmers'markets in cities, producing a direct link between Focal farmers andconsumers. Popular with urban dwellers, they are a valuable adjunctto the more traditional roadside stands in heavily populated areas.42
Nutrient Recycling
Each day thousands of tons of basic plant nutrientsnitrogen, phos-horus, and potassiummove from countryside to city in the flow ofood that sustains urban populations. In turn, human organic
wastessocietys most ubiquitous disposable materialsare created.Worldwide, over two-thirds of the nutrients present in human wastesare released to the environment as unreclaimed sewage, often pol-luting bays, rivers, and lakes. As the energy costs of manufactufingfertilizer rise, the viability of agricultureand, by extension, citiesmay hinge on how successfully urban areas can recycle this immensevolume of nutrients. Closing nutrient cycles is thus one of the build-ing blocks of ecologically sustainable cities.43
The collection of human wastes (known as night soil) for use asfertilizer is a long-standing tradition in some countries, parficularly inAsia. Door-to-door handcarts and special vacuum trucks are used tocollect night soil in many of the older neighborhoods of Seoul, SouthKorea, for recycling to the city's green belt. The World Bank estimatesthat one-third of China's fertilizer requirements have been providedby night soil, maintaining soil fertihty for centuries.44
29

30
European cities equipped with waterborne sewage systems beganfertilizing crops with human wastes in the late 1800s to minimizewater pollution and to recycle nutrients. By 1875, nearly 50 sewagefarms existed in Britain, some serving major cities such as Londonand Manchester. These early attempts at nutrient recycling failed forseveral reasons. The volume of wastes from growing cities soonoverwhelmed the capacity of the sewage farms. As cities grew, sitesto apply the sewage became ever more distant from the nutrientsources. And untreated human wastes were recognized as a majorsource of health problems. Strong taboos developed and the practicewas halted, resulting in an open-ended nutrient flow.°
Recently, attitudes toward nutrient recycling have come full circle.Higher fertilizer prices, a better understan ing of natural resourceand ecological constraints, and improved waste management tech-nolog-ies have renewed interest in nutrient recycling in industrial anddeveloping countries alike. Such efforts protect scarce urban re-sources: Municipalities that recycle organic wastes can simul-taneously save money, land, and fresh water for other uses. Re-cycling treated sewage onto farms surrounding cities also enhancesurban food self-sufficiency, as indicated earlier. At least six Chinesecities produce within their boundaries more than 85 percent of theirvegetable supplies, in part by reclaiming nutrients from huwastes and garbage.°
Efforts to devise a comprehensive recycling strategy depend on wastecomposition, collection, and treatment, and on the disposable wastesthat result. Different sewage treatment methods yield- different erid-products, though they all mimic or enhance natural biological wastedegradation. -Wet" or waterborne sewage systems yield raw ortreated solids and wastewater effluents for recycling. -Dry" sani-tation systems, predominant in developing regions, rely on night soilas the primary recyclable material.
Two waterborne sewage treatment methods are now used. In thefirst, air, sunlight, and microbial organisms break down wastes, settlesolids, and kilfpathogens in a series of wastewater ponds or lagoons.Because they afe inexpensive and land-intensive, lagoons are used
32

primarily in smal: urban areas and throughout developing countries.About one-fourth of the municipalities in the United States usewastewater lagoons.'
The second type of wastewater treatment uses energy and technologyto replicate natural processes. Processing plants receive large vo -umes of sewage (domestic wastes often mixed with indush-iai wastesand stormwater), which under o a variety of physical, biological, and
emical cleansing treatments This method produces sludgea sub-stance oi mud-like consistency composed mainl_y of biodegradableorganic materialand purified wastewater effluent.
Crop irrigation with wastewater treated in lagoons is practicedworldwide. The effluent is rich in nitrogen, phosphorus, and othernuhients, and represents a valuable water resource, particularly inarid regions. In the Mexican state of Hidalgo, effluents from MexicoCity are recycled onto 50,000 hectares of cropland in the world'slargest wastewater irrigation scheme. Falling Water tables and risingenergy costs for groundwater pumpin are likely to make this prac-tice even more attractive in the future.
Sewage-fed aquaculture is another way to enhance food productionusing wastewater ponds. Here, wastewater purification is comple-mented by cultivating fish on the nutrients and biomass hi the la-goons. China, India, Thailand, and Vietnam are leaders in waste-water aquaculture. Fish ponds in Calcutta provide 20 tons of fish perday to city markets.49
More than 15,000 sewage treatment plants in the United Stateshandled nearly 98 billion Eters of wastewater daily in 1985, generatingan annual total of 7 I allion tons of wastewater sludge (dry weight).The U.S. Environmental Protection Agency (EPA) eitimated the nu-ttient content of this waste at some 10 percent of that supplied toAmerican farmers by chemical fertilizers, worth therefore over $1billion per year.5°
Sludge is not usually a complete fertilizer substitute because of vari-ations in nutrient content. Nevertheless, it can provide significantquantities of nitrogen and phosphorus, while offering other ag-

32
ricultural benefits. Sludge is a soil-builder. It adds organic bulk, im-proves soil aeration and-water retention, combats erosion, and, as aresult, boosts crop yields. Added to soil or used as incremental fertil-izer, sludge can significantly reduce a farmer's commerciai fertilizerbill.
Land application of treated sewage sludge has grown markedly overthe past two decades. Approximately 42 percent of sludge generatedin the United States is applied to land; the rest goes to landfills orincinerators, or is composted. (See Table 9.) Western Europe pro-duces over 6.8 million dry tons of sludge each year, a figure that isexpected to fise 5 percent annually as more stringent water pollutioncontrols go_into effect. Approximately 40 percent of the sludge pro-duced in Western Europe is now used in a :culture.
collecting and treating waterborne sewage wastes is one of thelargest items in municipal budgets. And sludge processing and dis-posal accounts for up to 50 percent or more of typical plant operatincosts. Recycling can reduce these costs. Wyoming, Nlichigan, site othat state s largest land application prog,ram, discovered that whileincinerating sludge cost 13it per pound, land application cost only 60per pound. Over 3,000 hectares of local farmland are now fertilizedwith sludge. In Muskegon, Michigan, where 38 billion liters ofwastewater fertilize cropland producing 450,000 bushels of corn eachyear, corn sales help defray the cost of the treatment facili 51
Land application is not only cheaper than most other options, itreduces hidden energy costs that traditional waste disposal methodscarry. A great deal of energy is needed to incinerate sludge, a low-carbon material. An EPA survey estimated that 189 liters of fu-,1 areconsumed to burn 1 ton of dry sludge; at current annual raLs ofsludge incineration in the United States (about 1.7 million tons) theenergy cost is roughly 322 million liters of fuel. In addition, about 64million liters of oil is needed each year to manufacture for farm usethe equivalent amount of nitrogen lost through incineration alone.52
The chemical and biological makeup of sludge must be carefullymonitored to protect the food chain from potentially harmful ele-

Table 9: Sludge Production and Disposal in Selected IndustrialCountries, 1983
CounAnnualSludge
PmductionFarmLand
Method of DisLand-FilP
Indner- Oceanation Durn in
Unspec-Med' Total
thottsand tilos) (percent)United States 6,200 42 15 27 4 12 100West Germany 2,200 39 49 8 225-- 2 100Italy 1,200 20 55 0 1004
4 29United Kingdom 1,200 41 26 0 100France 840 30 50 20 0 o 100Netherlands 230 60 27 2 11 0 100Sweden 210
10 100'Includes small amounts for land reclamation and toret application.'Mostly sludge retained in lagoon
Sources: A. M. Bruce and R. D. Davis, "Britain Uses Half Its Fertilizer As Sludge'BiaCycle, March 1984; U.S. data from Robert K. Bastian, U.S. EnvironmentalProtection Agency, Washington, D.C., pdvate communication, September1986.
ments. For example, a high concentration of metals, particularly cad-mium, is characteristic ofSludges from heavily industrialized cities. Inthe United States, the EPA regulates wastewater treatment and vari-ous aspects of sludge application on land. Some sludges cannot beapplied to cropland, but may be used on grazing land. Others mayonly be used in forests or in ecologically disturbed areas, such asstripmined land.
Composting sludge to produce a humus-ILke substance that is anexcellent soil amendment is also kacreasingly popular. Although thenutrient value of composted sludge is reduCed after processing, otherbenefits, such as the elimination of pathogens and reduced watercontent, make this method of recycling more attractive in some situa-tions. More significantly, compost enhances the ability of crops todraw on both natural and synthetic nutrients. Wheat yields in Indiaincreased from 28 to 4-4 percent with each 5 tons of compost addedper hectare.53
4
A propriate technologies and practices for minimizing sewage-re ated health risks have been wi ely adopted in industrial counthes,but they have not been fully exploited in developing countries, lo-stalling Western-style sanitation is a luxury few Third World cities canafford. Approximately 40 percent of India's 100 million urban house-holds use dry buckets or latrines from which excreta is collected for
disposal; only 20 percent are served by waterborne systems and the
rest have virtually no sanitation.54
The lack of adequate organic waste collection and treatment in manyThird World cities results in serious health and environmental prob-lems. Raw night soil provides a microscopic blueprint of the entericdiseases prevalent in a community. Pathogens present in humanwastes include hookworm, tapeworm, and the bacteria that cause
phoid and cholera. Unlike treated wastewater, sludge, or compost,t e use of inadequately treated night soil in agriculture ensures the
spread of these pathogens."
U.S. Department of Agriculture scientists have devised a low-cost
composting method capable of killing virtually all pathogens presentin night soil. The technique relies on the same principles as those
employed in sludge composting but uses less energy, is loopintensive, and results in a product with a higher nutrient content.Adapting such low-technology solutions to night soil managementprovide§ an affordable alternative to financially strapped mu.nicipalities.56
Although human organic wastes are the single largest source of nu-trients from cities, many urban organic materials household foodwastes and the by-products of food processing plantscan be recy.
cled. Composting projects are now taking advantage of everytiungfrom brewery and yard wastes to apple pomace, animal manure,paper sludge, and wood chips.
Nutrient recycling is likely to increase in popularity as urban land,
water, and energy resources become scarcer and as waste manage-ment strategies improve. Recycling sludge through land application
and Composting wherever waterborne sanitation exists is cheaper and
more environmentally sound than any other disposal option. As part

"Aquifer5 nnzid wetlands, agricultural andopen spaces, are all as essential to a ci
ival as transport networks.
of a broad public health strategy, nutrilient recycling can help ThirdWorld cities reach the goals of bettet 1-r±-lealth and sanitation, higherfood self-sufficiency, arui reduced envirm-onmental pollution.
35Ecology and Economics of Ci
Cities require concentrations of food, 1,later, and fuel on a scale notfound in nature. Just as nature caaro-ot concentrate the resourcesneeded to support urban life, neither ce..-7an it disperse the waste pro-duced in cities. The waste output of e--=ven a small city can quicklyovertax the absorptive capacity of locaLl terrestrial and aquatic eco-systems.
The average urban resident in the unitealed States uses approximately568 liters of water, 1.5 kilograms of foamwd, and 7.1 kilograms of fossilfuels per day, generating roughly 454 librters of sewage, 1.5 kilogramsof refuse, and .6 kilograms of air polltmitants over the same period.New Yorkers alone annually produce enuough garbage to cover all 340hectares of Central Park to a depth of 4 rneters.57
Not surprisingly, urban dwellers are facrmtore energy-dependent thantheir rural counterparts; suburbanites ven more so. Moving largequantities of food, water, and fuel into large dties and moving gar-bage and sewage out are both logOildcally complex and energy-intensive . The larger and more sprawlinvg the city, the more comp exand costly its support systems become. Nutrient-rich human wastesthat are an asset in a rural setting can bec>corne an economic liability inan urban environment. Indeed, the colleaction and treatment of sew-age is a leading claimant on urban tax revenues, even when it isprocessed and old as fertilizer.
Ener -inefficient buildings and traiisxrt, and wasteful refuse dis-posa practicesall combine to raise the fical and environmental costsof urban life. Cities are, in effect, larpr t than their municipal bound-aries might intply: As urban matenal mleeds multiply through theeffects of sprawl and mismanagement, they eventually exceed thecapadty of the surrounding couritryside=, exerting pressure on moredistant ecosystems to supply resourceg. Aquifers and wetlands, ag-

ricultural and open spaces are all as essential to a city s survival astransport networks, but are rarely ever the subject of urban planners'concerns.
Water, at once the most vital and the most abused urban resource,best illustrates the precarious relationship that now exists betweencities and natural systems. The competition between cities and theother major water consumersagriculture and industryis risingjust as the quantity and quality of available water is declining rapidly.
Many cities are now searching farther and farther afield to augmentsupplies from overextended or contaminated aquifers. About three-quarters of all U.S. cities rely to some degree on groundwater. Yetonly 3 of the 35 largest- -San Antonio, Ivliami, anid Memphis canmeet their needs solely from local supplies.'
Water-short cities in arid regions are in stiff competition with ag-ricultural interests. Fast-growing Denver suburbs, for example, havepurchased water rights on over 19 percent of the 129,000 hectares ofirrigated farmland in the Arkansas Rivc.r Valley. Los Asigeles drawswater from several hundred miles away. Much of it comes fromnorthern Cahfornia, pumped over the Tehacha i Mountains some610 meters above sea level into the Los Angeles asin.'
Transporting water can involve enormous energy costs. Mexico City'selevated site means water must be lifted from progressively lowercatchments. In 1982, Mexico City began pumping water from Cut-zamala, a site 100 kilometers away and 1,000 meters lower than thecity. British geographer Ian Douglas reports that augmentation ofthe M-xico City upply in the 1990s will be from Tecolutla, which issome 200 kilometers away and 2000 meters lower.- Pumping waterthis far will require some 125 trillion Idlojoules of electrical energyannuailiy, the output of six 1,000-megawatt power plants. Construc-tion of these plants would cost at !east $6 billion, an amount roughlyequal to half the annual interest payments on Mexico's external debt.The city is thus faced with three rising cost curves in waterp ocurerne-Aincreasing distance of water transport increasingheight of wat.?r lift and, over the long-term, rising energy prices.Escalating water costs, stringent rationing, or both are likely to pre-

n Peking, a on of water costs less than apopsicle."
vent Mexico City from reaching the population of 30 million nowprojected by the Iinited Nations.60
In many Third World cities residents receive water that has under-gone little or no putification. As Indian economist V. Nath points out,The cost of providing adequate water . . . k the large cities is ex-tremely high and that of providing safe water can be astronomical."Water containing dangerous levels of toxic wastes, and the viruses,protozoa, and bacteria that cause disease is routinely used for cook-ing, drinking, and washing. In Jakarta, for example, less than 25percent of the population's needs can be met by the current supplys stem. Sewage Contamination and saltwater intrusion have ren-
ered many wells useless. In Manila, a city of approximately 9 millionpeople, a scant 11 percent of the population is served by sewers. Roadgutters, open ditches, and canals serve as conduits for the raw sew-age that regularly contaminates water supplies. 61
Cities are notorious for their waste and misuse of water. Aging watermains leak profusely. Until recently, few cities were replaCing theseantiquated pipes. Now, as the cost of obtaining new water suppliesskyrockets, conservation is becoming more attractive. London, forexample, plans to spend $320 million to re lace water mains orig-inally installed during the reign of Queen Victoria some 125 years
Few incentives exist to conserve water or protect it from pollution.Toxic heavy metals and organic chemicals now threaten to taint urbanwater supplies in much the same way that waterborne diseases didduring the Industrial Revolution a century or more ago. Neurologicaldamage and rnutagenic birth defects may increase as more and moretoxic wastes are assimilated and concenhated in urban environments.
Urban residents are accustomed to paying little for water, while fineslevied against industries for dumping toxic wastes in public watersupplies are traditionally light or go unenforced. In Peking, a ton ofwater costs less than a popsicle. Rationing went into effect inmid-1986 but shortages continue to plague the city. One observercalls Peking's water crisis "an inexorably mounting ecological disasterthat threatens the well-being of 9.5 million people." 63
37

Water supplies re not the only emerging constraint on urbangrowth.As noted cearlier, for many Third Woad cities the rising priceof oil, and hence -.inf kerosene, since 1973 has put pressure on indig-enous fuehvood esourres. Research on fuelwoOd prices in Indiadernonslrates a ri.-narkably close relationship between city size andfirewood costs. (S.ee Table 10.)
Table 10:lndia Fx_melwood Prices in Major Cities by Size, 19134
Rupees perMetric Tun
Po ulation of City_thanton
Between 1 Millionand 5 Million
More than5 Million
Less than 350 BilaghatErjeeling
350-400 Sinagarikmagalur
A_ansol400-500 Jft_xnshedpur
BE-tavnagar500-700 BIL-Aopal Hyderabad
IrzLclore AhmedabadSarnbalpur Bangalore
NagapurCoimbatore Jaipur/vadurai MadrasA.Jeppey Kanpur
Above 7® Gwalior BombayAjmer CalcuttaVtranasi DelhiW.spwrah
B. wonder, al. Deforestation and Fuelwood Use in Urban Centres (Hyderabad,lndir,Centre (a-m- Energy , Environment, and Technology, and National RemoteSensing Agericy.0%. 19
4 0

In some smaller cities that are relatively close to forested areas, suchas Darjeeling, fuelwood cost less than 350 rupees per ton in 1984. Ascity size increased, so did firewood prices. In the seven cities withpopulations between 1 million and 5 million, prices ranged from 500to 700 rupees per ton. For the three cities with more than 5 millionresidents, fuelwood cost more than 700 rupees per ton, at least twiceas much as in smaller cities. Some small cities also had expensivefuelwood, usually because they were in areas with little remainingforest cover. Thus small cities in India do not necessarily have lowfuelwood prices, but all large cities have high prices.
Of all the investments needed to sustain cities, the shortfall is per-haps greatest in the treatment and disposal of human and industrialwastes. The number and concentration of urban pollutants toxic tohumans and disruptive of other natural systems nse each year. Un-checked, these wastes pollute the air above cities, enter water andsoil, and via many pathways, contribute to poor health. Urban pol-lutants inevitably transcend city limits; in time, they become theprimary contributors to acid rain and the accumulation of carbondioxide and other greenhouse gases that are changing the earth'schemistry
Nitrogen and sulfur oxides, ozone, carbon compounds, and sus-ended particulates such as lead, arsenic, and cadmium foul city air.eports on the adverse consequences of air pollution in Third Worldcities with few or no pollution controls are legion. World Bank re-
searcher Vinod Thomas found that automotive traffic is the largestsingle source of pollution in Sao Paulo, while industrial processes andpower plants were the principal sources of particulates and sulfurdioxide. The more than 8,000 tons of pollutants poured into the airabove Sao Paulo daily have been linked to increased mortality arnoninfants and those over 65 years old. And an estimated 60 percentCalcutta's residents are believed to suffer from respiratory diseasesrelated to air pollution.'
Automobilesthe predominant mode of transportation in many cit-ies todaycontribute most heavily to photochemical smog and car-bon monoxide pollution. (See Table 11.) Auto particulates represent
39

40
Table _Sources of Major Air Pollutants in the United Sta es 1983
Percentage of Emissionsfrom Each Source b- Pollutant'
Carbon SulfurMonoxide Dioxide
SuspendedParticu-
latesHydro- Nitrogencarbons Dioxide
Percentageof all
Emissions
Road vehicles 61 2 16 30 36 41
Electricutilities 67 7 32 16
Industrial pro-cesses 7 15 33 38 3 13
Solid wastedisposal 3 6 3 2
Miscellaneous 29 15 38 29 28 27
Total2 100 99 100
'Figures include both metropolitan and nonmetropolitan areas,2Percentagei, may not add to 100 due to rounding.
Source: U.S. Bureau of Census, Statistical Abstracts of the United States 1986 (Washing-ton, D.C.: Government Printing Office, 1986),
only a small proportion of total urban pollution; but because they areemitted at street level and are most easily inhaled, auto particulatesare among the most insidious, contributing to respirator* ailments,and lead poisoning in children- "Releasing a canister of poison gas ona sidewalk is a criminal act," writes Anne Whiston Spirn of theUniversity of Pennsylvania, "yet those who destroy the emissioncontrol devices on their cars, who burn leaded gasoline, who leavetheir cars running when parked at the curb are engaged in activitiesno less irresponsible."65
In the United States, federal air quality standards and emission con-trol laws have dec.eased the level of pollutants in most urban areas.But persistent au.romobile dependence has kept the levels of some

pollutants dangerously high. Despite standards set by the Clean AirAct, many cities are still exceeding standards allowed for severalpollutants. Ozone levels in New York, Houston, and Chica o re -s-tered at least twice the maximum allowable level in mid-198 n tosAngeles, the level was three times the maximum.'
Urban pollution problems are multiplying rapidly in many ThirdWorld cities where automobile ownerShip symbolizes economic suc-cess. Chinese cities, with their traditional reliance on bicycles andbuses for individual mobility, are perhaps the most efficient in theirconsumption of transport energy. Unfortunately, as Chinese livingstandards rise, autos afe replacing these modes of transport, reducingenergy efficiency and raising pollution levels.
Whil2 dwindlthg water and fuel supplies combine with mountingpollution levels to raise the ecological costs of urban life, fiscal costsare rising As well. Laying the foundations of a comprehensive trans-portation system is essential to an efficient, sustainable city, wheregoods can compete in world markets. A well-planned transport net-work raises urban productivity by facilitatin$ the flow of people and
oods throughout the city. Higher levels of mcome equity and socialevelopment can be achieved when transportation ?provides all eco-
nomic groups with access to jobs and services. Yet develoiping coun-tries, following the urban settlement patterns of their industrializedcounterparts, face severe transport problems.
The demand for transportation in Third World cities is often met withinappropriate remedies that tax city budgets and indirectly encouragemore widespread reliance on automobiles. Motivated by the desire tomodernize rapidly, most cities in the Third World have invested inpolitically attractive but extremely costly modes of transportation thatServe only a small fraction of their populations.
Expensive underground rail transit systems and elevated roadwayshave taken precedence over improvernents on existing roads andestablishment of low-cost bus operations. Costs have risen dramati-cally as a result: The World Bank notes that municipal governmentscommonly spend between 15 and 25 percent of their annual budgets
41

42
on transport-related investments sometimes much more. Due tohigh capital and operation costs, high-technology mass transit sys-tem often require continued financial support from government rev-enues. Each kilometer of a rail subway May cost as much as $100million, for example. These transportation projects contribute heavilyto urban subsidy burdens.'
Calcutta's new subway s stem Is a good example of this phenom-enon. Between 1972 and 1978, transport investments in Calcuttareached $50 million annuallyabout 48 percent of the citr s totalplanned investment for all purposes. These costs rose further in theearly eighties as the city moved to complete a five-mile-long stretch ofsubway line between south and central Calcutta. The $650 millionspent to date is six times the amount initially projected; more recentestimates suggest that finishing the project will cost nearly ten timesthe original estimate, or $1 billion. Moreover, government subsidiesof at least $1 million each year will be needed to operate the system.Despite the heavy investments and subsidies, the urban poor--the
sinEle largest demographic groupcannot afford to ride thesubway.
A wide gap already exists between the fiscal and ecological costs ofsupporting urban development in its present context and the re-sources required to sustain it. Now, industnal and developing coun-tries alike need a new ethic of urban developmentone that em-braces the concept of the city as an ecosystem in which populationsize and urban form are matched to available resources. The questionpolicymakers face is how large cities should be in a world that de-pends primarily on renewable resources. The subsidies that distortthe relationship between cities and natural systems and promotewaste should be replaced by a set of policies based on more intensiveland use in urban centers with a heavy emphasis on mass transit,conservation of resources, and energy efficiency.
A broader analytical framework is needed to guide planners andpolicyrnakers in assessing urban investments: nainely, a broad socialcost-benefit analysis, integrating principles of ecological and eco-
4 4
"MunicIpal investments should beundertaken on y with the understandingthat they be financially self-sustaining.
nomic sustainabiity, and the prindple of finandal viability. The bene-fits of any urban project should outweigh the social co.3ts. And mu-nicipal investments should be undertaken only with theunderstanding that they be financially self-sustaining. Wherever pos-sible, the private sector should be encouraged to provide services, apolicy that will heighten efficiency. User taxes can be enforced toreduce waste by maximizing the cost of pollution to individuals andindustries.
For example, water supplies can be secured and protected throughhigher prices and land Conservation. In New York,- where 95 percentof residential units do not have water meters, the average familycurrently pays less than $100 per year for virtually limitless suppliesof highquality water. Between 1980 and 1985, New York City experi-enced two prolonged droughts in which demand far exceeded sup-plies. Nevertheless, the city recently shelved a $6.2 billion plan toincrease supplies by skimming water from the Hudson River. In-stead, in order to balance NeW York's water equation, city officialshave decided to reduce demand by installing residential water me-ters, charging higher prices, and encouraging conservation.69
Establishing green belts within and around urban areas safeguardsand increases local water supplies. Land-use controls and the preser-vation of wetlands and open space can greatly enhance groundwaterrecharge and help with the management and recycling of wastewater.A green belt strategy aimed at permanent protection of open landswithin and between cities can also mitigat6 pollution problems andLncrease urban self-sufficiency in agriculture. Trees and soil absorbman airborne wastes; large expanges of open lands enhance urbanair ow.
In Stuttgart, West Germany, a combiriation of green belts and indus-trial zoning ordinances have greatly reduced t e effect of persistentinversions and weak air flowS on pollution levels over the past 30
ears. In the United States, Oregon has adopted a statewide greenIt strategy. Cities there are required to ma 20-year growth bound-
aries marking open space for preservation.
45

Creafins denser, more efficient cities depends on curbing automobileuse. This trend is already under way in many cities, most notably inEurope. Some 2,000 years after Julius Caesar banned human-bornelitters from downtown Rome to ease congestion, cars and trucks are44 now prohibited from entering the city center during rush hour. Ac-cording to one Roman official, "The message to motorists is to usepublic transportation to get to work.- Stockholm, Rotterdam, Bo-logna, and Vienna have all banned traffic from variouG parts of thecentral city; indeed, .irtually all European dties have some restric-tions on auto use in force. And in Hong Kong and Singapore, as wellas in Korean cities, taxes and financial disincentives diScourage theuse of private vehicles. The Dutch have taken the most dramatic stepsin this area; they have built their streets to discourage auto use andencourage walking and biking."
Public transport can markedly reduce both pollutants and urban en-ergy costs. Bus service in Third World cities, often the only means oftransportation affordable to the urban poor, routinely falls short ofdemand. The importance of buses cannot be overestimated: TheWorld Bank estimates that in 1980, 600 million hips per day weremade on buses in cities of the Third World, a figurn that is expected todouble by 2000! "
Mass transit need not be a costly undertaking. Encouraging com-petition among private companies to provide bus service frees upscarce municipal dollars and increases the choices available to com-muters. While autos rarely carry more than two_people, one bus maycarry up to 80 passengers. Yet a bus takes up the space of only twoprivate cars on the road. Simultaneously reducing the number ofprivate vehicles and setting up special bus lanes allows other traffic tomove faster, and increases urban efficiency.'
That urban areas have outgrown and overstressed their natural sup-port systems is increasingly clear. American poet and agriculturalreformer Wendell Berry has noted that -like farmers, city dwellershave agricultural responsibilities; to use no more than necessary; towaste nothing; to return organic residues to the soil." His aphonsticcomment applies to the broader relationship between cities and natu-ral systems. Cities are themselves ecosystems requiring internal bal-ance."
4 6

Seeking a Rural-Ugban BalanceThe formation and growth of cities is an integral part of the economicand social development of nations. The development of early citieswas closely associated with the emergence of civilizafion itself. Over 45the last two centuries, urban growth has enabled countries to capital-ize on the economies of scale inherent in industrial processes, such asmanufacturing, leading to the improvements Ln living standards as-sociated with moderniiation.
Official U.N. projections show urbanizafion continuing for decadesinto the future. But as world oil production declines, and the costs ofsupplying the needs of large cities mount quesfions arise over whatrate of urbanization best serves national needs. Some national gov-ernments are now beginning to reassess the policies that are critical toachieving a better diStribution of resources between urban and ruralareas.
The optimal balance between countryside and city varies, of course,from country to country and within a country over time. For example,the opEmum size of cities will be reduced as the age of oil slowlyfades and the age of renewable energy begins to unfold. Oil is aconcentrated resource, easily transported in the huge quantities thatlarge cities requfre. In contrast, renewable energy sources, whetherfirewood, solar collectors, or small-scale hydro, are more geo-graphically diffuse. Both the ecology and economics of these energysources suggest that the future wilrfavor smaller cities and those w olive in rural areas.
As the energy transition proceeds, the ability of highly oil-dependentcities, such as Houston and Los Angeles, to conipete in the worldmarket will be seriously disadvantaged by high living costs andhence, high wages. The cities that move vigorously to improve theirefficiency of resource useenergy, water, land, arid materialswillstrengthen their competitive position. Those that ignore these issueswill eventually pay with depressed economic activity and un-employment.
The growth in the world's urban po ulation from 600 million in 1950to 2 billion in 1986 is without prece _ent. Because urban expansion in
4 7

the more advanced industrial societies has come to a virtual halt overthe last decade or so, urbanization is now concentrated in the ThirdWorld. Part of this urban growth is a response to the needs of indus-tnalization, the pull of urban job opporturdties. But much of theurban growth now occun-ing in the Third World is the result of failedeconomic and population policies, a process driven more by ruralpoverry than urban prosperity. Such policies have needlessly dis-torted the development process in many developing countries.
The official exchange rate that governs the terms of trade between acountry and the outside world, and the food Fence policy that governsurban-rural terms of trade are the principal means of favoring cities.All too often, official exchange rates are set to promote the importsand consumer goods bound for urban markets, sometimes brin "nthe price of imported food for urban consumers below that of foopioduced domestically. Policies that keep food pnces low discourageinvestment in agnculture, eventually creating national food deficits.Moreover, the effects of these two policies on rural areas are com-pounded by the lack of investment in human capital; per capita in-Vestments in urban social services such as education and health careare often several times as great as those in rural areas.
Mounting external debts, rising unemployment, and proliferatingsquatter settlements are among the more visible man" estations ourban-biased development strategies, These effects are nowheremore evident that in Africa, where both per capita grain productionand income have been falling for many years.
One way of reaching a nation's optimum rural-urban balance wouldbe to let the market play a more prominent role in economic devel-opment. A rate of urbanization determined largely by market forcesWould almost certainly be more sustainable than that influencedheavily by subsidies. Removing urban bias from economic policyadjusting exchange rates to reduce the attractiveness of irnportedconsumer goods and food, and adopting food price policies to en-courage investment in the countrysidewould be a healthy first stepin this direction.
48

-Much of the urban growth now occurringin the Third World is the result of failed
economic and population policies.-
Such a policy shift is not an argument for abandoning all governmentsubsidies, such as those for food, but rather for targeting subsidies toaid the neediest people regardless of where they live. Targeted foodsubsidies are more cost-effective and produce fewer disincentives todomestic agriculture than blanket subsidies. In the early seventies,the Sri Lankan government discovered that for every extTa calorieconsumed by the malnourished population under its subsidy pro-gram, 13 calories were reaching nondeficit groups. Changing to atargeted food stam_p program in 1980 reduced outlays on food distri-bution from 14 to 5 per:ent of total government expendihrres withintwo years. Tailoring food subsidies to specific populations allowsgovernments to reduce the overall subsidy burden and the attractionto rural migrants of artificially low food prices in the cities7 5
The urban bias evident in the economic policies of so many ThfrdWorld countries wastes both human talent and natural resources. Thesecond major adjustment required to reduce urban bias is the transfer ofinveshnent in social services to the countryside. A more equitabledishibufion of education and basic health care services throughoutthe society would help cultivate the most abundant resource thatmany developing societies havetheir people.
Population policies, environmental condifions, and landownershippatterns also directly affect urbanization rates. Countries with ineffec=tive or nonexistent family planning programs are invariably facedwith rural populations under greater pressures to migrate to cities.Where the rural environment is deteriorating as a result of deforesta-tion, sod erosion, and deserfification, cities are likely to be besie edby ecological refirgees. Ai-id where landownership is concentrated ma few hands, as in Latin America, landlessness also drives ruralpeople into the cities.
Apart from the optimal nual-urban balance, the question of howurban population is distributed among cities also looms large incountries where a primary city dominates economic and political life.Secondary cities can serve the goals of economic development byacting as conduits for more geographically dispersed investment.
4 9

Small urban centers not only provide an alternative outlet for mi-ants, but also offer local access to agricultural processing industries,
arm inputs, and markets. These economic benefits are enhanced48 when accompanied by decentralized public services, such as field
offices of national ministries or regional-and provincial administrativeoffices that can increase rural access to needed services and infor-mation.
A few counhies have adopted national development strategies aimedat balancing urban and rural needs agaLnst available resources. SouthKorea is one such country. A mix of land-use and industnal locationpolicies was put in place in the seventies to reduce the countTy'sreliance on Seoul, the principal city. At the same time, the Koreangovernment initiated the New Village Movement, a program gearedto raise rural incomes and discourage migration from rural areas.More than 450 rural industries have Since been established, a majorfactor in narrowing the income gap between rural and urban house-holds.'
China offers another example of a country that has managed to regu-late the growth of cities, by restricting rmgration and investing heav-ily in the countryside. As a result of thesovernmenes strong supportfor agriculture, incomes of many rural Utinese are higher than thoseof their urban counterparts. Few Third World governments em-phasize agriculture as strongly as China's does, however.
Pressures from international lendirig institutions to eliminate urbanbiases in Third World economic policies are mounting, largely be-cause these biases are partly responsible for the soaring external debtof many countries. All too much of the urbanization in the ThirdWorld over the past generation has been artificial, supported either atthe expense of rural populations or through foreign assistance. Ineither case it is becoming increasingly more difficult to sustain.Whether vast cities with tens of millions of peopleMexico City orCalcutta in the year 2000, for examplecan, or indeed should besustained is questionable, particularly if doing so requires heavy sub-sidies from the countryside.
50

Out of the current reexamination of undervalued exchange rates andfood price polides by the International Monetary Fund and WorldBank may come much more enlightened national economic develop-ment sia-ategiesones that will serve all the people, not merely theurban elite. The adoption of policies to arrest the growth in externaldebt and the transition to renewable sources of energy seem certain toslow urban growth. It is even conceivable that in some instancesurbanization will be reversed.
51
Notes
I. Number of people living in cities in 1950 from Bertrand Renaud, NationalUrbanization POlicies in Debeloping Countries, Staff Working Paper No. 347(Washington, D.C.: World Bank, 1981); number in 1986 from Po ulationReference Bureau, 1986 World Population Data Sheet (Washington, D. 1986).
2. Renaud, National Urbanization Policies.
3. Andrew Lees, Cities Perceived: Urban Society in European a id AmericanThought, 7820-1940 (New York: Columbia University Press, 1985).
4. Rafael M. Salas, The State of World Population 1986 (New York: UnitedNations Fund for Population Activities (UNFPA), 1986).
5. For a discussion of the historical evolution of cities throughout the world,see Lewis Mumford, The City in History (Orlando, Ha.: Harcourt, Brace,Jovanovich, 1961).
6. Salas, The State of World Population 1986. The definition of an urban areadiffers from cou: ry to country and by region. What is considered a city inrelatively unurbanized Africa may not be considered a city in Asia. For thepurposes of definition, minimurn city size may van/ from 10,000 to over20,000 people. Global and regional percentages use_ throughout this paperare United Nations averages based on individual country censuses.
7. Ricardo Jon.:Jn, -Populafion and the Planning of Large Cities in LatinAmerica/' paper presented at the International Conference on Populationand the Urban Future sponsored by UNFPA, Barcelona, S ain, May 19-22,1986; population projection for Latm America in the year 000 from Popu-lotion Reference gureau, 1986 World Population Data Sheet.
8. Aderanti Adepoju, "Po ulation and the Planning of Large Cities in Af-rica,- paper presented at IJNFPA Conference.
9. Aprodido A. Laquian, Popiulation and the Planning of Large Cities inAsia, paper presented at UNFPA conference.
10. Ibid.; monthly additions to population of Indian cities from World Bank,Urban Transport: A World Bank Policy Study (Washington, D.C.: 1986).
11. Solos, The State of World Population 1986.
12. Lees, Cities Perceived.
51

13. Salas, The State of World Population 1986.
14. Jorge E. Hardoy and David Satterthwaite, "Third World Cities and theEnvironment of Pove Geoforum, Vol. 15, No. 3, 1984.
15. For a discussion of economies of scale and city size, see Dermis A.Rondinelli, "Metropolitan Growth and Secondary Cities Development Pol-icy.- Habitat International, Vol. 10, No. 1/2, 1986; Jonathan Kandell Nation inJeopardy: Mexico otys Growth Once Fostered, Turns into Economic Bur-den," Wall Street Journal, October 4, 1985.
16. United Nations Department of International Economic and Social Affairs(DIESA), Population Growth and Policies in Mega-Cities: Metro Manila, t'opu-lation Policy Paper No. 5 (New York: 1986).
17. Jeffrey Bartholet, "Mediterranean's 'Pearl' Now Awash in Raw SewaWashington Post, August 21, 1986; survey on Affican households from Ade-poju, "Large Cities in Africa."
1S. DIESA, Population Growth and Policies in Mega-Cities: Metro Manila; DIESA,Population Growth and Policies in Mega-Cities.- Bombay, Population Policy PaperNo. 6 (New York: 1986).
19. Andrew Hamer, Brazilian Industrialization and Economic Concenfrativz inSew Paulo; A Survey (Washington, D.C.: World Bank, 1982).
20. Michael P. Todaro and Jerry Siilkind, City Bias and Rural Neglect: TheDilemma of Urban Development (New York: Population Council, 1981).
21. Michael Lipton, "Urban Bias and Food Policy in Poor Countries," FoodPolicy, November 1975.
22. Anne Whiston Spirn, The Gran te Garden: Urban Nature and Human Design(New York: Basic Books, 1984).
23. David Pimentel, Handbook of Energy Utilization in Agriculture (Boca Raton,Fla.: CRC Press, 1980).
24. Peter W.G. Newman and Jeffrey R. Kenworthy, "Gasoline Consumptionand Cities: A Comparison of U.S. Cities with a Global Survey and Someimplications" (draft submitted for publication), Murdoch University, Mur-doch, Western Austialia, December 1986 ; additional informationon land use,
transportation, and energy use can be found in Peter W.G. Newman andTrevor 5. Hogan, "Urban Density and Transport: A Simple Model Based onThree City Types," Transport Research Papers, Department of Emiron-mental Science, Murdoch University, Murdoch, Western Australia, January1987; Jeffrey R. Kenworthy, -Transport Energy Conservation through UrbanPlanning and Lifestyle Changes: Some Fundamental Choices for Perth,"background paper for development of a state conservation strategy for West-ern Australia, no date.
Z. Newman and Kenworthy, -Gasoline Consumption and Cities!'
26. Ibid.
27. Ibid.
28. World Bank, Urban Transport.
29. David Mortis, Self-Reliant Cities: Energy and the Transformation of UrbanAmerica ashington, D.C.: Institute for Local Self-Reliance, 1982).
30. Data on forest loss from Sandra Poste', "Protecting Forests,- in Lester R.Brown et al., State of the World 1984 (New York: W.W. Norton & Co., 1984).
31. The energy efficiency of charcoal-making is roughly twice the yield byweight from the wood burned. Energy efficiency ranges from 20 to 50 per-cent, depending on the type of charcoal production method used, whetherwith earthen mounds or steel kilns. See Gerald Foley, Charcoal Making inDeveloping Countries (Washington, D.C.: EarthscanAntemational Institute forEnvironment and Development, 1986).
32. Information on district heating in European cities from Spim, The GraniteGarden; information on U.S. cities from brerman E. Koenig, "The Scientificand Technological Context of Today's Urban Problems," from "aitical Urban Issues in the 1980s: Problems and Responses," a discussion seiies spon-sored by Urban Affairs Programs, Michigan State University, East Lansing,Mich., May 1984.
33. Data for Perth from Peter W.G. Newman, 'Domestic Energy Use inAustralian Cities," Urban Ecology, No. 7, 1982 data for renewable energy inSan Francisco, Reykjavik, and Maxilla, from Christopher Flavin and CynthiaPollock, "Harnessing Renewable Energy," in Lester R. Brown et al., State ofthe World 1985 (New York: W.W. Norton & Co., 1985); information on Kla-math Falls, Ore., from Morris, Self-Reliant Cities; Klamath Falls populationfrom Klamath Falls Chamber of Commerce, piivate communication, April 2,1987.

34. Spirn, The Granite Garden.
35. Mumford, The City in History.
4 36. Food self-suffidency in India and China derived by Worldwatch fromUnited States Department of Agriculture (USDA), Foreign Agriculture Ser-vice (FAS), Foreign Agriculture CircularGrain Reference Tables For IndividualCountries (Washington,D.C.: various years); USDA, FAS, Foreign AgricultureCircularRice Reference Tables for Individual Countries (Washington, D.C.: vari-ous years).
37. A detailed discussion of different kinds of subsidies and their variousramifications can be found in Grant Scobie, "Food Consumption Policies,"(background paper prepared for World Bank, World Development Report 1986),Ruakura Agncultural Research Center, Hamilton, New Zealand, August,1985.
38. "Food Riots in Zambia; Borders Are Closed," New York Times, December10, 1986; "Zambia Halts Food Increases After Rioting and 11 Deaths," NewYork Times, December 12, 1986.
39. Christopher S. Wren, -Cairo Seems to Lose a Chance to Prosper in aTime of Peace," New York Times, August 23, 1986; and John Kifner, "TheEgyptian Economy Has No Place To Turn," New York Times, July 6, 1986.
40. Yue-Man Yeung, "Urban Agriculture in Asia," The Food Energy NexusProgramme of the United Nations University, Tokyo, September,
41. Thlid.
42. John Spitler, "Many Hard-Pressed U.S. Farmers Sell Produce Directly toPublic," Christian Science Monitor, November 12, 1986.
43. Nutrients present in human wastes that are lost through disposal is aWorldwatch Institute estimate based on figures from A.M. Bruce and R.D.Davis, "Britain Uses Half its Fertilizer As Sludge," BioCycle, March 1984;Robert K. Bastian and Jay Benforado, "Waste Treatment: Doing What ComesNaturally," Technology Review, February/March 1983; Hillel I. Shuval et al.,Wastewater Irrigation in Developing Countries: Health Effects and Technical Solu-tions (Washington, D.C.: United Nations Development Program and WorldBank, 1986); ti.S. Environmental Protection Agency .(EPA), EnvironmentalR_egulations and Technolo . Use and Disposal of A/fun:opal Wastewater SludgeWashington, D.C.: 19 ).

44. Seoul's night soil collection system described in DIESA, Population Growthand Policies in Mega-Cities: Seoul (New York: 1986); China's use of night soil inHi llel I. Shuval et al., Appropriate Technology for Water Supply and Sanitation:Night-soil Composting (Washington, D.C.: World Bank, 1981).
45. The First Royal Commission in England set a precedent with guidelinesand su&gestions for the land application of sewage wastes in 1865. A detaileddiscussion of the history of nutrient recycling in European cifies can be foundin Shuval et al., Wastewater Irrigation in Developing Countries.
46. Yeung, "Urban Agriculture in Asia.-
49. EPA, Primer for Wastewater Treatment (Washington, D.C.: 1984).
48. Shuval et aL, Wastewater Irrigation in Developing Countries.
49. An excellent discussion of wastewater aquaculture practice in a numberof countries can be found in Peter Edwards, Aquaculture: A Component of LowCost Sanitation Technology (Washington, D.C.: United Nations DevelopmentProgram and World Baiik, 1985).
50. Robert K. Bastian, EPA, Washington, D.C. Tvate communication, Sep-tember 1986.
51. Judy Licht and Jeff Johnson, -Sludge is an Awful Thing to Waste," Sierra,March/April 1986; Dawn Schauer, -Saving Money While Land Applying,"BioCycle, November/December 1986.
52. John M. Walker, "Using Municipal Sewage Sludge on Land MakesSense," Compost Science/Land Utilization, September/October 1979.
53. S.C. Talashilkar and O.P. Vimal, -From Nutrient-Poor Compost to HighGrade Fertilizer,- Biocycle, March 1984.
54. Martin Strauss, -About Wastewater and Excreta Use in India" (draft),World Health Organization International Reference Centre for Wastes Dis-posal, Duebendorf, Switzerland, June 1986.
55. See Richard G. Feacham et al., Health Aspects of Excreta and SullageManagementA State of the Art Review (Washington, D.C.: World Bank, 198Shuval et al., Wastewater Irrigation in Developing Countries; Shuval et al, Night-soil Composting; and World Health Organization, The Risk to Health of Microbesin Sewage Sludge Applied to Land (Copenhagen: 1981).

56. Beltsville Aerated Rapid Com -osting System designed by USDA scien-tists, discussed in Shuval et al., 'ght-soil Composting.
57. Spirn, The Granite Garden.
58. Information on groundwater from Spirn, The Granite Garden.
59, Denver suburbs water purchases from Thomas J. Knudson, Citiesof West Buy Up Farm Water Rights,- New York Tbnes, February 10 1987;Catherine Caufield, "The California Approach to Plumbing," New Scientist,February 21, 1985.
60. Ian Douglas, The Urban Environment (Baltimore, Md.. Edward ArnoldPublishers, 1983).
61. V. Nath, "Urbanisation in India: Review and Prospects,- Economic andPolitical Weekly, Vol. 21, No. 8, February 22, 1986; water supply problems inJakarta reported in Gunnar Lindh, Water and the City (Paris:lJnited NationsEducational, Scientific and Cultural Organization, 1983); Manila sewage sys-tem information from DIES& Population Growth and Policies in Mega-Cities:Metro Manila.
62. Fred Pearce, "Ring of water will end London's bursts,- New Scientist,January 29, 1987.
63. Michael Browning "For a town that's going dry, Peking treats watercheaply,- Miami Herald, July 15, 1986.
64. Vinod Thomas, -Evaluating Pollution Control: The Case of Sao Paulo,Brazil," Journal of Development Economics, Vol. 19, 1985 figures on respiratorydiseases in Calcutta from Hardoy and Satterthwaite, "Third World Cifies andthe Environment of Poverty.-
65. Spirn, The Granite Garden.
66. Robert O. Boorstin, "Clean Air Deadline Nears, And City Ponders ItsChoices," New York Times, October 26, 1986.
67. World Bank, Urban Transport.
68. %id.; and Steven R. Weisman, "What Works inNew York Times, March 21, 1987.
A Subway,"

69. Kenneth D. Frederick, "Watering the Big Apple," Resources (Resourcesfor the Future, Washington, D.C.), Winter 1986; Joyce Purnick, "Water Me-ters Due in All City Houses,- New York Times, November 13, 1986.
70. Spirn, The Granite Garden; for further discussion of green belt and land 57preservation strategies, see Judith Kunofsky and Larry GOrman, "Greenbeltsand the We ll-Planried City," Sierra, November/December 1985.
n. Rome's new auto restrictions reported in John Taghabue, "Cars FaceRush Hour Ban in Central Rome,- New York Times, February 22 1987; auto-mobile restrictions for other European cities from Spirn, The Granite Garden;for Hong Kong and Singapore, see World Bank, Urban Transport.
72. World Bank, Urban Transport.
73. Ibid.
74. Wendell Berry, private communication, April 15, 1987; see also WendellBe , The Unsettling of America: Culture and Agriculture (New York: Avon,19
75. Scobie, "Food Consumption Policies."
76. DIESA, Population Growth and Policies in ega-Cities: Seoul.

Lester R. Brown is President and Senior Researcher with WorldwatchInstitute and Project Director of the Institutes annual State of theWorld reports. Formerly Administrator of the Wf`qrnational A -ricultural Development Service of the U.S. DepaWiThltit of Agricu -ture, he is author of several books including Wo: A v11, ithout Borders,By Bread Alone, The Twen -Ninth Day, and Building a Sustainable So-ciety.
odi L. Jacobson is a Researcher with Worldwatch Institute and coau-thor of State of the World 1987. She is a graduate of the University ofWisconsin-Madison, where she studied economics and environ-mental sdences.

No. ofCopier
THE WORLDWATCH PAPER SERIES
1, The Other Energy Crisis: Firewood by Erik Eekholm.3. Women in Politics: A Global Review by Kathleen Newland.5. Twenty-two Dimensions of the Population Problem
by Lester R. Brown, Patricia L McGrath. and Bruce Stokes.7. The Unfinished Assignment: Equal Education for Women
by Patricia L McGrath.9. The Two Faces of Malnutrition by Erik Eckholrn and Frank Record.
10. Health: The Family Planning Factor by Erik Eekholm and KathleenNewland.
13 Spreading DesertsThe Hand of Man by Erik Eckholm and Lester R.Brown,
15. Energy fOr Development: Third World Options by Denis Hayes.16. Women and Population Growth: Choice Beyond Childbearing by
Kathleen Newland.18. Cutting Tobacco's Toll by Erik Eckholm.21. Soft Technologies, Hard Choices by Colin Norman.22. Disappearing Species: The Social Challenge by Erik Eckholm.25. Worker PanicipationProductivity and the Quality of Work Life
by Bruce Stokes.27. Pollution: The Neglected Dimensions by Denis Hayes.28. Global Employment and Economic Justice: The Policy Challenge
by Kathleen Newland.29. Resource Trends and Population Policy: A Time for Reassessment
by Lester R. Brown.30, The Dispossessed of the Earth: Land Reform and Sustainable
Development by Erik Eckholm.31. Knowledge and Power: The Global Research and Development
Budget by Colin Norman.32. The Future of the Automobile in an Oil-Short World by Lester R.
Brown, Christopher Flavin, and Colin Norman.33. International Migration: The Search for Work
by Kathleen Newland.34. Inflation: The Rising Cost of Living on a Small Planet
by Robert Fuller.35. Food or Fuel: New Competition for the World'a Cropland
by Lester R. Brown.36. The Future of Synthetic Materials: The Petroleum Connection
by Christopher Flavin.37. Wornen, Men, and The Division of Labor by Kathleen Newland.38. City Limits: Emerging Constraints on Urban Growth by Kathleen
Newland.39. Microelectronics at Work: Productivity and Jobs in the World
Economy by Colin Norman.40. Energy and Architecture: The Solar and Conservation Potential
by Christopher Flavin.41. Men and Family Planning by Bruce Stokes.42. Wood: An Ancient Fuel with a New Future by Nigel Smith.43 Refugees: The New International Politics of Displacement
by Kathleen Newland.44. Rivers of Energy: The Hydropower Potential by Daniel Deudney.45 Wind Power: A Turning Point by Christopher Flavin.46. Global Housing Prospects: The Resource Constraints
by Bruce Stokes.47. Infant Mortality and the Health of Societies by Kathleen Newland.48. Six Steps to a Sustainable Society by Lester R. Brown and Pamela
Shaw.
'Worldwateh Papers 2, 4, 6, 8, 11, 12, 14,17F19, 20, 23, 24, and 26 are out of print.
0

49. Productivity: The New Economic Context by Kathleen Newland.50. Space: The High Frontier in Perspective by Daniel Deudney.51. U.S. and Soviet Agriculture: The Shifting Balance of Power
by Lester R. Brown.52. Electricity from Sunlight The Future of Photovoltalcs
by Christopher Flavin.53. Population Policies for a New Economic Era by Lester R. Brown.M. Promoting Population Stabilization by Judith Jacobsen.55. Whole Earth Security: A Geopolitics of Peace by Daniel Deudney.56. Materials Recycling: The Virtue of Necessity by William U. Chandler.57. Nuclear Power: The Market Test by Christopher Flavin.58 Air Pollution, Acid Rain, and the Future of Forests by Sandra Postal.59. Improving World Heafth: A Least Cost Strategy William U. Chandler60. Soil Erosion: Quiet Crisis In the World Economy by Lester Brown and
Edward Wolf.61. Electricitys Future: The Shift to Efficiency and Small-Scale Power
by Christopher Flavin.62. Water: Rethinking Management in an Age of Scarcity by Sandra Postal.63. Energy Productivity: Key to Environmental Protection and Economic
Progress by William U. Chandler,64. Investing in Children by William U. Chandler.65. Reversing Africa's Decline by LaMar Brown arid Edward Wolf.66. World Oil: Coping With the Dangers of Success by C. Flavin.67. Conserving Water: The Untapped AfternatIve by Sandra Postel68. Banishing Tobacco by William U. Chandler69. Decommissioning: Nucleer Poweea Missing Link by Cynthia Pollock70. Electricity For A Developing World by Christopher Flavin71. Altering the EartiCs Chemistry: Assessing the Risks by Sandra Postel72. The Changing Role of the Market in National Economies by William
U. Chandler.73. Beyond the Green Revolution: New Approaches for Third World
Agriculture by Edwanl O Wolf.74. Our Demographically Divided World by Lester R. Brown and Jodi L.
Jacobson75. Reassessing Nuclear Power: The Fallout From Chemobyl by
Christopher Flavin76. Mining Urban Wastes: The Potential for Recycling by Cynthia Pollock77. The Future of Urbanization: Facing the Ecological and Economic
Constraints by Lester R. Brown and Jodi L. JacobsonTotal Copies
Bulk Copies (any combination of titles)2-5: $3.00 each era): $2.00 each 21 or mole: $1.00 each
Calendar Year Subscription (1987 subscription begins wth Paper 75)U.S. 25.
Make check payable to Worldwatch Institute1776 Massachusetts Avenue NW, Washington, D.C. 20036 USA
Enclosed is my check for U.S. $
name
address
zipicountry

four dollars
Worldwatch Institute1776 Massachusetts Avenue, N.Washington, D.C. 20036 USA


![DOCUMENT RESUME - ERICDOCUMENT RESUME SE 038 117 StoeverrkEdward C., Jr. Spreading Sea Floors and Fractured Ridges. Crustal ' Evaluation Education Project. Teacher's Guide [and]](https://img.pdfslide.net/doc/110x75/5f0c608a7e708231d4351954/document-resume-eric-document-resume-se-038-117-stoeverrkedward-c-jr-spreading.jpg)