Embed Size (px)
Citation preview

ED 400 179
AUTHORTITLE
INSTITUTION
SPONS AGENCY
PUB DATENOTEAVAILABLE FROM
PUB TYPE
DOCUMENT RESUME
SE 059 004
Walenta, Brian T., Ed.TTIP Texas Teacher Internship Program: 1996Curriculum Implementation Plans.Texas Alliance for Science, Technology, andMathematics Education, College Station.Texas A and M Univ., College Station.; Texas StateDept. of Parks and Wildlife, Austin.96406p.
Texas Alliance for Science, Technology andMathematics Education, Texas A&M University, EDCI,College of Education, College Station, TX77843-4232.Guides Classroom Use Teaching Guides (ForTeacher) (052)
EDRS PRICE MFO1 /PC17 Plus Postage.
DESCRIPTORS Curriculum Development; Elementary SecondaryEducation; *Internship Programs; *MathematicsTeachers; Mentors; *Partnerships in Education;*Science Teachers; *Teacher Education
IDENTIFIERS Texas
ABSTRACTIn 1989, the Texas Alliance for Science, Technology,
and Mathematics Education began placing teachers at industry sites aspart of its Texas Teacher Internship Program (TTIP). TTIP is acompetitive program for science, technology, and mathematics teacherswho serve as summer interns at industry and university sites in orderto experience real-world applications of the subjects they teach. In1996, a total of 12 teachers interned at seven sites and wererequired to develop a curriculum implementation plan (CIP) whichillustrated how they would translate the summer experience into thesubsequent year's classroom curricula. This document is a compilationof the curriculum implementation plans developed by the teachers.Topics include measurement errors, physical science/environmentalscience, composite science, biology, chemistry, ecology, technology,astronomy, geology, life science, mathematics, and endocrinology.(JRH)
******************** *****, ****************************************
Reproductions supplied by EDRS are the best that can be made* from the original document.******************i.AAA*************************************************
TTIPTexas Teacher
Internship ProgramTexas A&M University
Brian T Walenta, Editor
1996CURRICULUM
IMPLEMENTATIONPLANS
PERMISSION TO REPRODUCE ANDDISSEMINATE THIS MATERIAL
HAS BE ANTE BY
TO THE EDUCATIONAL RESOURCESINFORMATION CENTER (ERIC)
BEST COPY AVAILABLE
U.S. DEPARTEtENT OF EDUCATIONOffice of Educational Research and improvementEDUCATIONAL RESOURCES INFORMATION
CENTER (ERIC)
This document has been reproduced asreceived Irom the person or organization
ginating itMinor changes nave been made to improvereproduction Quality
o Points of view or opinions stated in this docu.ment do not necessarily represent official
'
OE RI position or policy
Texas Alliance low Science, Technology &Maliemailcs Education1 fit. 'WWI.. WW.W.411 W Gni Wa...617,- MMW.
2

About the Alliance
The Texas Alliance for Science, Technology and Mathematics Education is a statewide, nonprofit organization whose
membership includes representatives from K-12 schools, colleges anduniversities, businesses and industry, professional and
civic organizations, and government agencies. By fostering partnerships between schools and the private sector, the Texas
Alliance works to:
improve student literacy and competency in science, mathematics and technology education; and
assist teachers in developing curricula with emphasis on "real world" applications and problem-solving skills.
For membership and educational program information, contact:
Texas Alliance for Science, Technology & Mathematics EducationTexas A&M University
EDCI, College of EducationCollege Station, Texas 77843-4232
PH: 409/845-0825 FAX: 409/845-9663
Dr. Robert K. James, DirectorMaureen Stewart, Development Coordinator
Brian Walenta, TTIP and Symposium CoordinatorDwight Bohlmeyer, BTEP Coordinator
Jeannine Kantz, BTEP CoordinatorCraig Wilson, First STEP Coordinator
Debbie Jensen, TENET ProjectKristin Hamm, SALISH ProjectKay Labuda, SALISH Project
The Texas Teacher Internship Program is a project of the Texas Alliance for Science, Technology
and Mathematics Education, under the direction of Dr. Robert K. James, EDCI, College of Educa-
tion, Texas A&M University, College Station, TX 77843-4232.
Funding for the project is provided by the participating industries. Publication of the curriculum
plans for 1996 was provided by Texas Utilities Electric located in Dallas, Texas.
3

TTIP Program MissionIn 1989, the Texas Alliance for Science, Technology and Mathematics Education began placing teachersat industry sites as part of its now-successful program, the Texas TeacherInternship Program CIIIPformerly Teacher-In-Industry). In the seven years of the program, the numbers of both teacherparticipants and internship sponsors have increased steadily. Since its inception, over 150 teachers haveinterned at 45 company, university and government agency sites. With each teacher affecting an averageof 150 students per year, over 72,000 Texas students have been directly impacted by TTIP to date.
TTIP is a competitive program for science, technology and mathematics teachers who serve as summerinterns at industry and university sites in order to experience "real world" applications of the subjects theyteach. Teacher interns are mentored by a scientist or engineer, and work on a project(s) for an 8 weekinternship period.
The objectives of the program are to:
Provide teachers with relevant, timely information about science, technology and mathematicsapplications so they can better prepare students for the future.
Establish interactive partnerships between industry and teacherssharing resources andcurriculum improvements, and strengthening state and community networks throughout theeducational system.
Increase teachers' awareness of industry expectations and career opportunities to better informand motivate students regarding careers in science, technology, and mathematics.
In 1996, a total of 12 teachers interned at seven sites. Each teacher was required to develop a curriculumimplementation plan (CIP) which was to illustrate how they would translate the summer experience intothe subsequent year's classroom curricula. The Alliance staff provided teachers with suggestions fordeveloping the CIPs during site visits.
We are pleased with the success of the 1996 program and hope that you find the CIPs helpful in planningnew activities for your students.
For more information on the Texas Teacher Internship Program, please write or call:
Brian T. Walenta, IMP Coordinatoror
Robert K. James, Directorao Texas Alliance
EDCI, College of EducationTexas A&M University
College Station, TX 77843-4232PH: 409/845-0825 FAX: 409/845-9663
I'

AcknowledgementsThe Texas Alliance for Science, Technology and Mathematics Education would like to thank theprogram's supporters for providing the opportunity for teachers to experience "real-world" applicationsof their teaching fields. Many thanks to the industry coordinators and mentors involved with the 1996Texas Teacher Internship Program.
Exxon Chemical, BaytownDoug DeasonDr. Brigitte Laki
Fina Research & DevelopmentTechnical Center, Deer Park
Dr. Jose SosaLu Ann Kelly
Texas A & M University, CollegeStation
Biochemistry DepartmentDr. Bruce McDonaldDr. Ed Funkhouser
Center for ChemicalCharacterization and AnalysisDr. E.A. Schweikert
Texas Parks and Wildlife Department,Austin
Bob MurphyNancy HerronSteven HallKathryn HamptonScotty Oliver
Texas Utilities Electric, DallasOrlan Ihms
University of Texas MedicalBranch, Galveston
Dr. Peter BowmanDr. Todd MillerDr. William BufordDr. Chandra Yallampalli
University of Texas SouthwestMedical Center, Dallas
Dr. Skip Gamer

I
wommils dm*, r*Aar
ttarr--- I I
FIN:. OIL l'iND i.N.HEMIC,711. COMPANY
RECH J1] TECHNOLOGY CENTER
I
1.112001141.11.1111....Norrid
I
I
4sk 5
ptk.41v
.
/
'131 l`r1-)Y S

TABLE OF CONTENTSCURRICULUM IMPLEMENTATION PLANS
Ann T. Kelley
Linda Rhoden
Exxon Chemical, Baytown 1
Fina Research & Development 31Technical Center, Deer Park
Norene Rose Flaherty - Texas Utilities Electric, Dallas 77
Nancy McGreger
Jennifer Willis
Dorothy Chavez
Alan Cherepon
Vickie Smith
Dina Armstrong
Kenneth Baratko
Frances Beeson
Heather Lentz
Texas A&M University 111Biochemical Department,College Station
Texas A&M University 131Center for ChemicalCharacterization and Analysis,College Station
Texas Parks & Wildlife, Austin 183
Texas Parks & Wildlife, Austin 217
Texas PArks & Wildlife, Austin 267
University of Texas Medical 303Branch Public Health, Galveston
University of Texas Medical 353Branch, Galveston
University of Texas Medical 355Branch, Galveston
University of Texas Southwest 395Medical Center STARS Program,Dallas
APPENDICES
1996 Evaluation Information
Intern Information

Ann T. KelleyComposite Science, Chemistry
Stephen F. Austin High School, Houston ISD
Exxon Chemical, BaytownDr. Brigitte Laki, Mentor
BEST COPY AVAILABLE8

KELLEY 1
CURRICULUM IMPLEMENTATION PLAN
MEASUREMENT ERRORS
NAME: Ann T. Kelley
INTERNSHIP: Exxon Chemical Americas, Baytown, Texas
SCHOOL: Stephen F. Austin Senior H.S., Houston, TX
PRIMARYSUBJECT: ESL Physical Science, Grades 9 through 12
ACTIVITIES: (1) "THE LENGTH OF A PESTLE: A Class Exercisein Measurement and Statistical Analysis"
(2) "A SIMPLE BUT EFFECTIVE DEMONSTRATION FORILLUSTRATING SIGNIFICANT FIGURE RULES WHENMAKING MEASUREMENTS AND DOING CALCULATIONS"
(3) "MORE ON THE QUESTION OF SIGNIFICANTFIGURES"
(4) "MEASURING WITH A PURPOSE: InvolvingStudents in the Learning Process"
(5) "A SIMPLE LABORATORY EXPERIMENT USINGPOPCORN TO ILLUSTRATE MEASUREMENT ERRORS"
(6) "INTRODUCTORY LABORATORY EXERCISES"
(7) "A PAPER VERNIER SCALE FOR VARIOUSLABORATORY EQUIPMENT"
(8) "TEACHING DILUTIONS"
(9) "SIGNIFICANT FIGURES"
OBJECTIVES: To provide chemistry teachers with interestingactivities for teaching correct measuringtechniques, and to impress on chemistry studentsan awareness of the importance of minimizingmeasurement errors
9

KELLEY 2
If the amount of something is not known (onlythat SOME is present) it is hard to judge thesignificance of the result.
Even where a qualitative answer is required,quantitative methodt are used to obtain it.
Errors that occur in quantitative studies areextremely important. NO QUANTITATIVE RESULTSARE OF ANY VALUE UNLESS THEY ARE ACCOMPANIEDBY SOME ESTIMATE OF THE ERRORS INHERENT IN THEM.
A knowledge of experimental errors is crucial tothe proper interpretation of the results. Thisinvolves a comparison of the experimental valuewith an assumed or reference value.
Problems arise in the comparison of two (or more)
sets of results.
In order to minimize errors, one must ask thefollowing questions:
Are the two average values significantlydifferent, or are they indistinguishablewithin the limits of experimental error?
Is one method significantly less error-pronethan the other?
Which of the mean values is actually closerto the truth?
Many analyses are based on graphical methods.Instead of making repeated measurements on thesame sample, a series of measurements on a smallgroup of standards which have known concentrationscovering a considerable range can be made. Inthis way a calibration curve can be set up thatcan be used to estimate the concentrations of testsamples studied by the same procedure.
NOTE: In practice, however, all the measurementssubject to error.
10

KELLEY 3
RESOURCES: 1. Miller, J.C.; Miller, J.N. STATISTICS FORANALYTICAL CHEMISTRY, 2nd ed., John Wiley andSons: New York, 1988.
2. O'Reilly, J.E. J. CHEM. EDUC. 1986, 63, 894-896.
3. Lang, P. J. CHEM. EDUC. 1983, 60, 980.
4. Zipp, A.P., J. CHEM. EDUC. 1992, 69, 291.
5. Suder, R., J. CHEM. EDUC, 1989, 66, 437.
6. Clase, H.J., J. CHEM. EDUC. 1993, 70, 133.
7. Metz, P.A.; Pribyl, J.R., J. CHEM. EDUC.1995, 72, 130-132.
8. Kirksey, H.G.; Krause, P., J. CHEM. EDUC.1992, 69, 497-498.
9. Guymon, E.P.; James, H.J.; Seager, S.L., J.CHEM. EDUC. 1986, 63, 786-787.
10. Kimbrough, D.R.; Meglen, R.R., J. CHEM.EDUC. 1994, 71, 519-520.
11. Guare, C.J., J. CHEM. EDUC. 1991, 68, 649-652.
12. Rollinson, S.W., J. CHEM. EDUC. 1988, 65,159-160.
13. Lark, B.S., J. CHEM. EDUC. 1996, 73, 177.
14. McElroy, L.J., J. CHEM. EDUC. 1996, 73,765-766.
15. Abel, K.B.; Hemmerlin, W.M., J. CHEM. EDUC.1990, 67, 213.

KELLEY 4
TERMINOLOGY
GROSS ERRORS: these are so serious that there is no real alternative toabandoning the experiment and making a fresh start.Examples: bad reagent; contamination; instrument breakdown.
RANDOM ERRORS: individual results fall on both sides of the average value.Consequence: these affect the PRECISION, or REPRODUCIBILITY of anexperiment.
SYSTEMATIC ERRORS: all results are in error in the same senseConsequence: these affect the ACCURACY of an experiment.
REPRODUCIBILITY: 'between-run' precision (different conditions, differentreagents, different times).
REPEATABILITY: `within-run' precision (same equipment, same reagents, samecircumstances; done in a short time span).
Note: WEIGHING PROCEDURES are normally associated with very smallRANDOM errors (when using a 'four-place' balance, but withappreciable SYSTEMATIC errors (moisture on vessel surfaces;failure to cool heated vessels to the temperature of the balance;damaged weights; buoyancy effect of the atmosphere).
VOLUMETRIC procedures incorporate several sources ofSYSTEMATIC error: drainage (pipettes and burettes); calibration(volumetric equipment is usually calibrated at 20 degrees Celsius,but laboratory temperatures may vary); Indicator errors' (someindicators change colors over a pH range); 'last -drop' errors (it isnot known how much of the last drop added in a titration is actuallyneeded to reach the end point).
Table 1.2 Summary of definitions
Types of errorRandom Systematic
Affect precision
Within-run precision is repeatability
Between-run precision is reproducibility
Also known as indeterminate errors
Affect accuracy
Proximity to the truth
Also known as determinate errors

KELLEY 5
COLLABORATIVE TRIALS: in many such trials involving different laboratories,results of experiments conducted under meticulous conditions, using theexperimental procedures and the same types of instrument, the variation inthe results often greatly exceeds that which could be reasonable expectedfrom random errors.Consequence: many studies of the methodology of collaborative trials, andof the statistical evaluation of their results.
CHEMOMETRICS: the application of mathematical methods to the solution ofchemical problems of all types.
Correctresult
a
1 I 1 it..
b
1 I I 1 is
C
et sal 1 I
d
..149.70 10.00 10.30
Titrant volume , m
Fig. 1.1 Accuracy and precision graphical representation of the data in Table 1.1. In (a)the data are precise but inaccurate, in (b) accurate but imprecise, in (c) inaccurate and
imprecise, and in (d) accurate and precise.
BEST COPY AVAILABLE
13

The Length of a PestleA Class Exercise in Measurement and Statistical Analysis
James E. O'ReillyUniversity of Kentucky, Lexington, KY 40506
At any number of points in chemistry and science curricu-la, students come into formal contact with the principles ofmeasurements and the statistical analysis of data. In begin-ning courses, this may entail discussion of significant figuresand calculating an average value and its associated standarddeviation. Later on, the propagation of error and varioustechniques of hypothesis testing may be covered.
Unfortunately, far too many students seem to get throughchemistry courses without acquiring a basic understandingand appreciation of the concepts of measurement science-just what a measured number means, and how good it is.Statistics seems to be a set of theoretical constructs that hasno relation to what one does in the laboratory. Where havewe erred?
Very few class or laboratory exercises have been describedin THIS JOURNAL in which measurement error was the focus(1-4). It is the purpose of this report to outline an extremelysimple class exercise-measuring the length of an object-asa concrete paradigm of the entire process of making chemi-cal measurements and treating data therefrom. This exer-cise strives for relevance by giving every student a stake inthe data. It is much more interesting to collect and analyzeone's own data. The measurements are so simple that stu-dents do not get lost in what is being done; yet there areenough subtleties to intrigue even the most advanced stu-dents, if appropriately presented. A number of very basicand some very subtle points can be illustrated in a concretemanner and, presumably, driven home with a degree of final-ity. The creative instructor can adapt this exercise to fit thelevel of the students involved and the statistical topics dis-cussed in a particular course.
ProcedureThe equipment to conduct the exercise was provided in a
common area: a standard agate pestle about 6 cm in length,an ordinary wooden meter stick, a finely scribed 15-cm stain-less-steel ruler, and a stainless-steel vernier caliper. Onlyone of each was provided, so all students used exactly thesame equipment. In order to standardize the measurementprotocol, students were instructed to measure the length ofthe pestle once with the Meter stick, then with the Ruler,and finally with the Caliper; this procedure was to be repeat-ed for the required number of replicates, 10 in our case.Students were told that, if they discovered an error in anearlier measurement during the process, not to change thevalue or replace it with an additional measurement. Therewas a valuable point to even grossly erroneous measure-ments in this exercise. (Care was taken not to embarrassthese students later.) Thus, each student performed exactly30 measurements in the sequence M R M - R...
Each student was provided a columnar data sheet onwhich to record results. Columns were headed Meter, Ruler,and Caliper left to right; and replicates were listed verticallyto reinforce the order of the experiments. In an effort tominimize human bias, students were asked to do their best to"forget" earlier results, and data sheets were 'returned im-mediately to the instructor.
The data were compiled by the instructor and enteredonto a microcomputer using a data-base-management and a
KELLEY 6
Length of an Agate Pestle (cfn)a
Replicate NumberInstrument Analyst 1 2 3 4 5 6
Meter Stick 1 6.0 5.95 6.0 5.90 6.0 6.0
2 6.0 6.0 6.0 6.0 6.0 8.0
3 5.7 5.7 5.6 5.7 5.7 5.7
4 5.95 6.00 6.00 6.05 6.00 5.99
5 5.9 6 6 6.1 6.1 6.2
6 6.0 5.9 6.0 6.1 6.0 6.0
7 6.0 6.1 6.0 5.9 6.0 5.9
Steel Ruler 1 5.9 5.95 5.95 5.95 5.90 5.95
2 6.98 6.95 6.00 6.05 6.03 6.01
3 5.7 5.7 5.7 5.8 5.7 5.7
4 6.00 5.95 5.99 5.98 6.01 6.02
5 6 6 6.1 6.1 6.1 6.05
6 6.1 6.0 6.0 6.0 6.0 6.0
7 5.9 5.9 6.1 6.0 5.9 5.9
Vernier Caliper 1 6.02 6.03 6.02 6.03 6.03 6.02
2 6.02 6.02 6.02 6.02 6.02 6.02
3 6.3 6.3 6.2 6.2 6.2 6.2
4 6.02 6.02 6.01 6.03 6.00 6.00
5 6.01 6.02 6.02 6.02 6.02 6.02
6 6.3 6.2 6.2 6.3 6.02 6.03
7 6.020 6.02 6.02 6.02 6.02 6.02
The values are a sato:tad stesset of 160 data taken by 16 analysts. 10 replicates NA
statistics program to facilitate data treatment. Each St:idealwas provided a printout of the class results, along withnotation of which numbered analyst he was. The studentswere asked to perform certain calculations and statisticaltests as topics were discussed (mean, pooled variance, F- and
t-tests analysis of variance). Printouts were revised and
redistributed so students could check their results.A subset of results from one class, a beginning graduatt
level class in "advanced analytical chemistry", is presentedin the table, exactly as transcribed from students' datasheets.
Significant Figures and Measurement ErrorEven a casual inspection of the data reveals one distress-
ing point: Even with chemistry graduate students, the con-cept of significant figures is not universally understood i°the point of routine and automatic application to a setd
measurements. Consider Analyst 5, for example. It seenslapparent he had decided the length measured by the mete
stick could be reported each time to no better than 0.1 co.the steel ruler to 0.05 cm, the caliper to 0.01 cm. Certaiell.reasonable. However, the point that reporting a "6" asmeasured quantity is not the same as reporting a "6.('" bad
not been effectively mastered.Exactly how finely measurements could be made was /
point of some class discussion. The majority of one partial:,Jar class, for example, initially felt that measurements v0the meter stick and the ruler could be made to only 0.05 coThis was evident on classifying the data and plotting 0histogram: a marked bimodal distribution with maxima°6.00 and 6.05 cm.
A BEST COPY AVAiLita

Some thought went into selection of the pestle as themeasurement object. It was a single object. thus there was nonatural variation among units such as the weights of a series
of pennies. Given the precision of the measurements, there
was also no natural variation in the length as is encountered,or example, in the diameter of an ordinary marble (1). Thetors encountered in this exercise all can be ascribed to thewawa, imprecision of the measurement tools themselves
and the analysts' use of the devices. The meter stick, formaple. happened to have an additional millimeter or so ofwood beyond the zero mark, thus complicating measure-
meats.On the other hand, the pestle was perhaps fortuitously
chosen. One end was rounded, and it was tapered: thus thelength could not be properly measured by simply laying itSat on the ruler or meter stick. The end of the steel ruler wasflush with its zero mark, and the pestle was flat on one end(most pestles are rounded on both ends). Thus the morecreati,.. quickly saw they could stand the pestle on a flatbench top or table, put the ruler behind it, and measure thelength fairly precisely by sightidg across the top of the pes-tle, much as a buret is read.
The point of analogy in all this is that in an analyticalchemical measurement there are also often several tools(methods) applicable to the problem at hand. Some arebetter than others. Each needs to be used properly, and hasits own set of inherent limitations. Any method. no matterhow simple it may seem, can be creatively applied in a par-
; titular situation.
° Spurious Data and Rejection of Results
Even for a process as straightforward as measuring thei length of an object, about 4% of the total data reported (164students by 10 replicates each) was clearly spurious. Most oft. these arose from transcription errors or misreading of the±.these
calip.r, a not-uncommon difficulty (5). See, for ex-L ample, Analyst 2 using the Ruler, Analysts 3 and 6 using the: Caliper. If the more or less typical practice of doing only...three replicates on an unknown were to have been followed,: the freouency of spurious results rose to about 6%.?-. Whi'.i in this instance students generally became aware ofi,-1.''wrong values quickly and would not have reported them ifrum constrained to do so, this is clearly not the case in mostchemical measurements. Without proper attention to thedetails of the entire measurement process, and careful dataanalysis, "erroneous" results are seldom apparent. More-over, the clearly spurious results in our class exercise areobvious primarily because there were three 16 X 10 grids of'values of the same measured quantity. Seldom, in real life,does an analyst have such a cornucopia of data. This is a veryimportant point for students who may soon be required tojudge :.le reliability of data and make decisions based on
1 data supplied by others, as in the case of a laboratory super-L visor. If nothing else, this class exercise should serve to instillLa proper suspicion of anyone's data, including one's own.
Appropriate statistical tests (Q-test, 3o criteria, etc.) can(be used to reject spurious data individually, or all the resultsfrom a particular analyst by comparing analyst means. For
i
be
example. the caliper measurements of Analysts 3 and 6 couldrejected with high confidence when all 160 data are con-
Mdered. Moreover, the measurement process here is so.nreightforward that most of the spurious results can becerre..ted" with a fairly high degree of confidence. For ex-
ample, reported values of 6.3 and 6.2 cm clearly arise from'misreading of the vernier and are really supposed to be 6.03and 6.02 cm. With reasonable confidence, therefore, thesedata can be corrected and a symmetrical grid (no emptytills) of data preserved to facilitate later statistical calcula-tions and testing. It is important to stress. however, that inthe vast majority of all chemical measurements such "cor-!eetion" is notIrsajble nor permissible: The data are there
ST COPY AVAILABLE 1
KELLEY 7
and are assumed to be correct unless rejectable by some validstatistical process. It is seldom possible to figure out whatwent wrong once results have left the hands of the originalanalyst.
Precision and AccuracyEach student can calculate his or her own mean and stan-
dard deviation for each of the three tools, and compare theseto the appropriate class values using t- and F-test proce-dures. Class mean and median values. pooled standard devi-ations, etc., can be calculated using all the data and, afterrejecting or "correcting" outliers, compared. Does one toolyield significantly more precise or accurate results? Mostbeginning students would assume the mean of the vernier-caliper measurements, which is much more precise (in ourcase, so = ±0.006 cm with outliers rejected), automaticallyimplies the highest degree of accuracy. This is a good time topoint out that, barring suitable calibration, the average fromthe vernier caliper may well be no closer to the "true value"of the length than that using the meter stick.
Provided with a complete listing of all students' standarddeviations, for example, it can now be made very clear andconcrete how a pooled standard deviation is a better approx-imator of the true variation to be expected for the measure-ment method. Standard deviations with the steel ruler, forexample, ranged from *0.015 to ±0.075 cm, a differencefactor of 5. The class pooled standard deviation was ±0.040cm. What is the "best" estimate to be expected for thetypical person performing this measurement? Additionally,the coarseness of the scale readability of the caliper (0.01cm) was larger than the repeatability of some students' mea-surements, leading to an erroneous precision estimate. Anaverage of 6.02 ± 0.00 cm cannot indicate a total absence oferror, and complicates later statistical evaluation. A mea-sured value without some estimate of its uncertainty ismeaningless.
It is embarrassing for any scientist to be confronted withevidence of personal bias or "operator error" in a measure-ment. Consider the meter-stick results for Analysts 2 and 3.One consistently measured 6.0 cm, the other 5.7 cm: for 10replicates each, 6.0 ± 0.0 and 5.69 ± 0.03 cm. Clearly asystematic difference exists. Additionally, as discussion andthe statistics indicated that the meter stick could reallyestimate the length to no better than perhaps 0.05 cm perreading, both standard deviations are suspect.
Advanced ConceptsDepending on the class goals, various advanced statistical
concepts can be discussed. For example, we performed vari-ous ANOVA calculations on the data. It was very interesting,and quite sobering, to see the degree of analyst-to-analystvariation in a task as simple as length measurement: Withthe meter stick and steel ruler, the calculated F-ratios wereabout 40 for, in our case. 144 and 15 degrees of freedomavanishingly small probability that there were not significantsystematic differences among analysts. It should be pointedout that, for proper hypothesis testing, the order of themeasurements should have been randomized. In this exer-cise, they were not. Another interesting result was that thevariances in length using the vernier caliper were so smallthat calculator (6) and computer round-off errors wouldoften produce a spurious F-value.
Students can be asked to use x -square procedures to see ifthe readings follow a Gaussian distribution (no), or exhibit anumber bias in the terminal digit (yes) (4,7,8), or to applythe Youden sum-rank test. the Dixon test, or some othersophisticated test to reject outliers.
Student ResponseOverall student response to this exercise was quite posi-
tive. The data were "real", not just some numbers in a

textbook prol.lem, and taking the data required only about15 min per student. Students particularly liked having oneset of data on which to apply many statistical processes. Themajor complaint was that, with the large number of dataavailable, the calculations sometimes became quite tedious.The exercise is best suited to a small group of students; in alarger class, it would be best to divide the students intogroups, decrease the number of replicate measurements,and/or take a subset of the results for discussion.
CAI Lab on Measurement and Error for HighSchool Chemistry
Patrick LangBristol Central High School
Bristol, CT 06010
In the lab, students gather the data needed to find volumeand density of a wooden block along with the volume anddensity of the water that fills a beaker. A meter stick is usedto measure the block's length, width, and thickness. Since theblock is not a perfect rectangular solid, each of the three di-mensions is measured in more than one place on the block. Anaverage is then calculated for each dimension. A vernier cal-iper is used to measure the inside diameter and height of theempty beaker. Again, both the diameter and height are mea-sured in more than one place on the beaker and an average foreach is calculated. Also the mass of the empty beaker, the massof the beaker full of water, and the mass of the block are de-termined on a balance.
Students type their lab data for the block into the computerprogram. The program displays and explains each calculationwith the students' data as it shows how to calculate the volumeand density of the wooden block, keeping track of the uncer-tainty. Then, as an assignment, the student must calculate thevolume and density of the water contained in the beaker, alsokeeping track of the uncertainty. Instantaneous printout ofthe calculations upon input of the data allows a maximum of20 high school students working in pairs to take all the mea-surements and see all the calculations on their block mea-surements in one 42-min lab period.
Deviations in the measurement result from the irregularitiesin the block, which is rough-cut from a two-by-four, and be-cause the measurement is precise only to two decimal places.In order to adjust for the deviation, the length, width, andthickness are each measured in four different places on theblock. If measured properly, rarely are two measurements ofthe same dimension equal. The four lengths, four widths, and ,four thicknesses are entered into the computer which thendisplays for each dimension the calculation of the mean, theabsolute deviation from the mean, and the mean deviation.Also displayed are the calculations for maximum, minimum,mean, and deviation from the mean of volume and density.
KELLEY 8
Uterature Cited
(1) Cunningham. C. C.: Brown. G. R.: St. Pierre. L E. J. Chem. Educ. 1981,58, 609.(2) Larsen. L L Wagner. .1. J. J. Chem. Educ. 1975, 52, 215.
--- (3) Lang. P. J. Chem. Educ. 1983. 60. 980.(4) Nelson. L S.J. Chem. Edam. 1956. 33. 126.(51 Harris. W. E.: KratochviL B. J. Chem. Educ. 1981. 58. 49.(6) Huff. R. G.: Carter. K. N. J. Chem. Edue. 1981,58.49.(71 Harris. W. E. Amer. Lob. 1978. 10(1). 31: Talarsto 1978 25.325.(8) Lsitiaen. H. A.; Marna.W. E. "Chemical Analysis". 2nd ed.: McGraw-Hill: Ner
1975; p 646.
S. Chem (,3 (10),
,
The magnitude of the length, width, thickness, volume, anddensity is the mean value for each. The uncertainty in eachvalue is expressed as + or the mean deviation and can beobserved to increase as calculations are done. This magnifi-cation that occurs as successive calculations are carried outleads to a discussion of the rules for significant figures to beused during the rest of the course.
The diameter and height of a 250-ml beaker are measuredfour times each. Then the mass of the beaker both empty andfull of water is determined. As an assignment, the studentmust do the same calculations for the water as the computerdid for tne block.
This lab has been used as the introductory lab for the past11 years in a high school chemistry course. For the past threeyears the lab has utilized the computer to help the studentsperform the calculations. In the past the students did notfinish the calculations in one lab period, and in many cases,experienced difficulty. Only one or two students could receiveindividual help from the teacher as they did their calculations.Since the CAI was introduced, there has been an improvementin the write-up of labs as well as the performance on the firsttest on measurement and error.
The program is written in BASIC for a 16K TRS-80 but canbe easily adapted for use on any microcomputer program-mable in BASIC language. Copies of the program listing,sample data, sample execution, and the lab procedure areavailable from the author for a $5.00 postage and handling fee.If a cassette tape to run on a TRS-80 is desired instead of thelisting, send $10.00. Please make the check payable to theauthor.
980 Journal of Chemical Education
16

KELLEY 9
A Simple but Effective Demonstration for Illustrating Significant FigureRules When Making Measurements and Doing Calculations
Arden P. ZIppSUNY- Cortland, Cortland, NY 13045
Beginning students in chemistry frequently have diffi-culty with the mathematical aspects of the subject. Theseinclude (but are not limited to) recognizing the errors in-herent in experimental measurements (1) and makingproper use of significant figures (2). Students can be sur-prised and confused when different arithmetical opera-tions are performed on experimental data, because therules .:mange when changing from addition or subtractionto multiplication or division. The following is a simple wayto illustrate several aspects of these rules.
Making MeasurementsTake three containers that can be read to different de-
grees of precision, e.g., an 800-mL beaker (±20 mL) a 250 -mL graduated cylinder (±1. mL), and a 10-mL graduatedcylinder (±0.02 mL). Fill each about half full with water.Have two (or more) students measure and record the vol-ume in each cylinder independently. Have them describehow they obtained their values, including the number ofdecimal places each value should have, i.e., how they fixedthe level of uncertainty in each measurement. Note howthe difference in marking precision influences the uncer-tainty; that is, the person making the measurement deter-mines to what precision the measurement can be madeand, thus, fixes the uncertainty (which is always in the lastdecimal place of the measurement).
Demonstrate how to calculate the mean value in eachcylinder from the measured values and explain that theuncertainty in it would be the absolute difference betweenthe mean and the measured values. Comment on the rea-sons for making several measurements rather than one ortwo and demonstrate by having several people measurethe volume in one of the cylinders and compute the mean.(The concept of standard deviation may be introduced atthis time if desired.)
Subtraction of MeasurementsPour some water out of the larger cylinder and have two
students record the volume of water left, noting that theuncertainty in this reading is the same as that in the orig-inal volume reading using this cylinder. By subtracting,determine the volume of water poured out. Show (by usingthe percentage uncertainties or the maximum-minimummethod) that the uncertainty in the final volume doubles.That is. manipulation of measurements always increasesthe degree of uncertainty in the result.
Addition of Measurements
Add the measurements of the water in the 250-mL andthe 10-mL cylinders, illustrating the limitations of addinguncertainties in different decimal places.
Pour the water in the 10-mL cylinder into the 250-mLcylinder. Record the total, including its uncertainty. Com-pare the measured value with the calculated one. Ask stu-dents which one is "right". Pour the water from the 250-mLcylinder into the 800-mL beaker. Ask students to deter-mine the volume and the uncertainty again. Emphasizethe fact that the precision with which the final volume canbe established is limited by the uncertainty in reading thelevel of the water in the 800-mL beaker (20 mL). The moreprecise values obtained for the volumes in the two gradua-ted cylinders (1 mL for the 250-mL cylinder and 0.02 mLfor the 10-mL cylinder) are of little use in fixing the uncer-tainty of the totaL These various examples should estab-lish the rule for addition and subtraction; i.e., the final an-swer may contain no more decimals than are present in thenumber with the fewest decimals.
Possible Extensions
The rules for using significant figures during multiplica-tion or division also may be introduced with this simpledemonstration. The rules for division can be illustrated bycalculating the ratio of any two of the original volumesalong with the uncertainty in this ratio (using either thepercentage uncertainties or the maximum-minimum pro-cedure). This calculation should fix the rule in students'minds the rule that the number of places in a quotient (orproduct) can be no greater than that in the number withthe fewest.
Alternatively, the volume of water in the 250-mL cylin-der can be calculated from the diameter of the cylinder andthe height of the water in it. If the precision of one of thesemeasurements (e.g., the height) is varied while the other iskept constant, the number of significant figures thatshould be kept in the result can be compared. Finally, thevolume determined in this manner (and its uncertainty)can be compared with the volume measured originallyalong with its uncertainty.
Literature Cited1. Ruder. R. J. Chem. Eelue.1989. 66. 437.
2. Abel. K. 13.; Hemmerlin. W. M. J. Chem. Educe 1990. 67.213.
17Volume 69 Number 4 April 1992 291

>
r Meter Sticks in the Demonstration of ErrorMeasurements
PRobert Suder} Main Science Academy at LBJ High School
7309 Lazy Creek LanePath TX 78724
At the beginning of the school year, general chemistrystudents are taught that the number of significant figuresand the error involved in a measurement are dependent onthe measuring device. This can be demonstrated in severalways. One method is to have the students measure the masselan object using three different balances, a triple-beam, acentigram, and an analytical balance. These balances haveerrors of *0.1 g, *0.01 g, and *0.0001 g, respectively. Thisexercise not only familiarizes the students with the use of the
1 balances, but also demonstrates that there will always be anerror involved in every measurement. The use of a better
f measuring device will reduce but not eliminate the error. Inaddition, the better the measuring device, the more signifi-
t cant figures obtained.However, a more satisfactory method of showing the error
rInvolved in measurement is by using the three meter sticksshown in the figure. Meter stick a has all the numbers paint-
t ed over so that only meters can be read. Meter sticks b and c;! are Punted in such a way as to divide them into tenths
(decimeters) and hundreths (centimeters). I prepare the me-t ter sticks by simply making either a 1-cm or a. 1-dm mask
and then spray with alternating black and white paint.I begin the demonstration by drawing two lines on the
.; blackboard about 5 cm long and 80 cm apart, and then havethe students measure the distance between the lines using
.e the three meter sticks. Meter stick a permits only one signifi--.: elln t figure, the tenths of a meter, which is the estimated
Clirt. Than they repeat the measurement using meter stickh This permits two significant figures, in which case thetenths are exact and the hundreths are estimated. Finally,using meter stick c, the tenths and hundreths are measuredelattlY and the thousandths are estimated. This exerciseearly shows the students that the number of significant
"lures obtained in a measurement is only dependent on themeasuring device. To reinforce this concept, I draw two lines°115he blackboard about 8 cm apart, and I have the studentsestimate the distance in centimeters between them usingmeter stick c. This will result in two-significant-figure accu-intcY. Then I have them convert their result to meters. For
example, 8.3 cm = 0.083 m. Next I ask how many significantfigures are in the value 0.083 in. Invariably they will answerthree. I then point out that the number of significant figurescannot change because the measuring device has notchanged. This allows me to explain the two uses of the zero;to locate the decimal place, in which it is not significant, or asa measured value, in which case it is significant.
The meter sticks can also be used to illustrate the differ-ence between random and systematic errors. Again I drawtwo lines on the blackboard about 70 cm apart. Then I havethe students estimate the distance using meter stick b. Iwrite their estimations on the blackboard, compute the aver-age, and then measure the distance using meter stick c,which is assumed to be the correct value. I next show that theaverage value is very close to the correct value, and also thatthere are as many estimations above the correct value asbelow it. This is defined as random error, or error arisingfrom determining the estimated value of a measurement,and it cannot be eliminated. Finally, I use meter stick d,which has the left end cut short, to measure the distance-between the same lines. This results in measurements thatare consistently too large. I explain this in terms of systemat-ic error, or error caused by a faulty procedure or measuringdevice. Systematic error can be eliminated by using one ofthe other meter sticks.
The use of these four modified meter sticks has made itmuch easier for my students to grasp the concept of errorsinvolved in measurements.
b
C
d
II= =II. Mt ENS
11111111111111111111111111111111111111111111111111
INI =II MIMI IOW
Four meter sticks prepared to show how precision of the measuring device
affects significant figure's and how random and systematic errors mar.
18
T, chew, EcILA., C.c, (5), I cl syci p

KELLEY 11
More on the Question of Significant Figures
Howard J. ClaseMemorial University, St. John's, Nfld., Canada, Al B 3X7
Arden P. Zipp's watery practical demonstration of the-rationale behind the significant figure rules for calcula-tions (1) reminded me of a dryer method I have used, whichhas generated favorable feedback from students in an in-troductory chemistry course. This method introduces aSew. digit into calculations, the "?", pronounced *un-known". It is used to distinguish conventional zeros, whichare merely place markers, from those that are true mea-aired or mathematically exact zeros.
After discussing the difference between the exact num-bers of mathematics and the limited precision of measuredrakes I suggest that we indicate any unknown digits withdowns" instead of zeros. For example, using a 500-mLgraduated beaker to measure a volume of water we mightwine up with 330 mL to the nearest 10 mL. This would beititten as 33? mL to indicate the nonaignificance of thehot place.
In calculations the arithmetical rule for dealing with thispew digit is the same irrespective of the actual operation:the-result of addition to, subtraction from, multiplication111 or division by ? is always ?. This point is readilygragPed. Apart from this. the normal rules of arithmeticSP* Here are a couple of examples:Addition: 1.340??
0.0008?
0.78523+
Answer: 2,126?? i.e., 2.126
MulIplIcation: 234??
24?x991??
9367?
468??
Answer: 56????? i.e., 5.6 x 10⁸
Note:. Where a sum involving a ? is clearly greater than10 I have carried the 10 in the addition.
Since very few calculators have a "r button, calculationsinvolving the unknown digit have to be done the long way.You should find that this works with any long method ofmultiplication or division and gives the same result as theapplication of the significant figure rules. While themethod could be developed further with 'rounding off'rules etc., I do not think there is much point; I am not pro-posing it for general use, but as a method for conveying tostudents with no knowledge of statistics an understandingof what is behind the significant figure rules used with cal-culators. Students who realize that the rules are not arbi-trary should find it easier to remember and apply them.Get your class to try one or two for themselves, and per-haps you, too, will have someone come up to you after theclass and say, "Sir! That's the first time I ever understoodwhat significant figures are about."
Literature Cited1. Zipp, A P. J. Chem. Educ. 1992. 69. 291.
19
Volume 70 Number 2 February 1993 133
BEST COPY AVAILABLE

Measuring with a Purpose
Involving Students in the Learning Process
Patricia A. MetzTexas Tech University, Lubbock, TX 79409
Jeffrey R. PribylChemistry and Geology Department, Mankato State University, Mankato, MN 56002
Science relies heavily on observations, and many of thoseobservations are quantitative in nature; therefore, it is im-portant for students to have a working knowledge of meas-urement. The first class periods of many beginning chem-istry courses, both high school and college, deal with thisconcept. Many teachers and textbooks (1-5) take a rule-based, algorithmic approach to the topic. As a result stu-dents sometimes develop a poor first impression of chemis-try from this boring, rote memorization lesson. We preferto engage our students in a learning activity that leadsthem to understand the need for and application of rules inmeasurement (6-7). Such an approach is based upon theconstructivist theory of learning(8) that states that knowl-edge is constructed in the mind of the learner, not trans-ferred intact from the instructor. This paper discusses alearning activity we have used effectively with our stu-dents to teach measurements and related introductorytopics.
Getting Started
The activity centers on a metal brick or suitable substi-tute (any solid, rectangular object). As students arrive forclass each one is called up to the front of the room, handeda ruler, and asked to measure the longest edge of the metalbrick. The type of ruler. English or metric, does not matteras long as an assortment is used and several students useeach ruler. In addition to a commercial yardstick and me-ter stick, use several homemade rulers. (We made threemeter sticks and two yardsticks out of wood strips. Eachwas appropriately labeled "1 m" or "1 yard." One meterstick was divided into 10-cm units, another into 1-cmunits, and the third had no divisions. One yardstick wasdivided into 1-in. units and the other had no divisions.) Re-cord all measurements and the type of ruler used on asheet of paper. Once the class has assembled, explain whathas been happening and write the students' measure-ments on the board. e.g.,
20.4 20.34 cm 20 cm 2/3 ti 8 1/16 in.
20.33 cm 20.4 cm 1/4 m 0.25 yd 8 1/32 in.
20.35 cm 23.5 8
203.5 mm 0.2 m 8.03 in.
Ask the students to examine the data and comment. Thisparticular set of data triggered comments about missingunits, metric versus English measurements, the number ofdigits, and range of values. Use the students' observationsas the starting point for discussions of numbers versusmeasurements. the similarity of numbers for metric meas-urements (203.5 mm, 20.4 cm, 0.2 m ) but not Englishmeasurements (81/16 in., 13 ft, 0.25 yd), why the metric andnot the English system is used in science, and precision ofthe ruler.
130 Journal of Chemical Education20
KELLEY 12
Significant FiguresPrecision is discussed last and is used to introduce sig-
nificant figures. Because our concern with significant fig-ures is linked to measured values, we base our teaching ofsignificant figures on actual measurements and not agiven set of rules.
Point out all the measurements made with the sameruler or scale, e.g.,
20.4 cm20.33 cm20.35 cm203.5 mm 20
20.34 cm20.4 cm
20
Discuss (1) whether the measurements are possible withthe scale used, (2) how to read a scale properly includingone estimated figure, (3) the precision of the scale, and (4)which figures are certain in the number and which are un-certain. To avoid unnecessary confusion with this introduc-tory chemistry topic, we only use scales divided into unitsof 10 and never those divided into units of 2 or 5.
When Zeros are SignificantAfter students understand the concepts of measurement
precision and significant figures. discuss when zeros aresignificant, but do this in the context of a measurementscale. When students have concrete examples of measuredvalues that contain a zero, they are better able to grasp theidea of when zeros are significant (9). We use examplessuch as
11 1 1 1 1 1 1 1 I
100
100
,108.5
111 1 11111110.19
110
108.0 II 0.1011111111 (11110
0.0911111111111
A zero to the left of the decimal point or a trailing zeroare always problems for students. Many textbooks tell stu-dents to write the number in scientific notation (1-5). Thisis a reasonable approach to the problem, but most studentsat this stage of their learning do not fully understand sci-entific notation. An alternative is to have students writethe number as a fraction. For example 0.10 is written
10.100 and has two significant figures. One would not write010,100 because the leading zero has no meaning. Likewise1/200 is incorrect because it indicated an amount one-tenththe actual size.
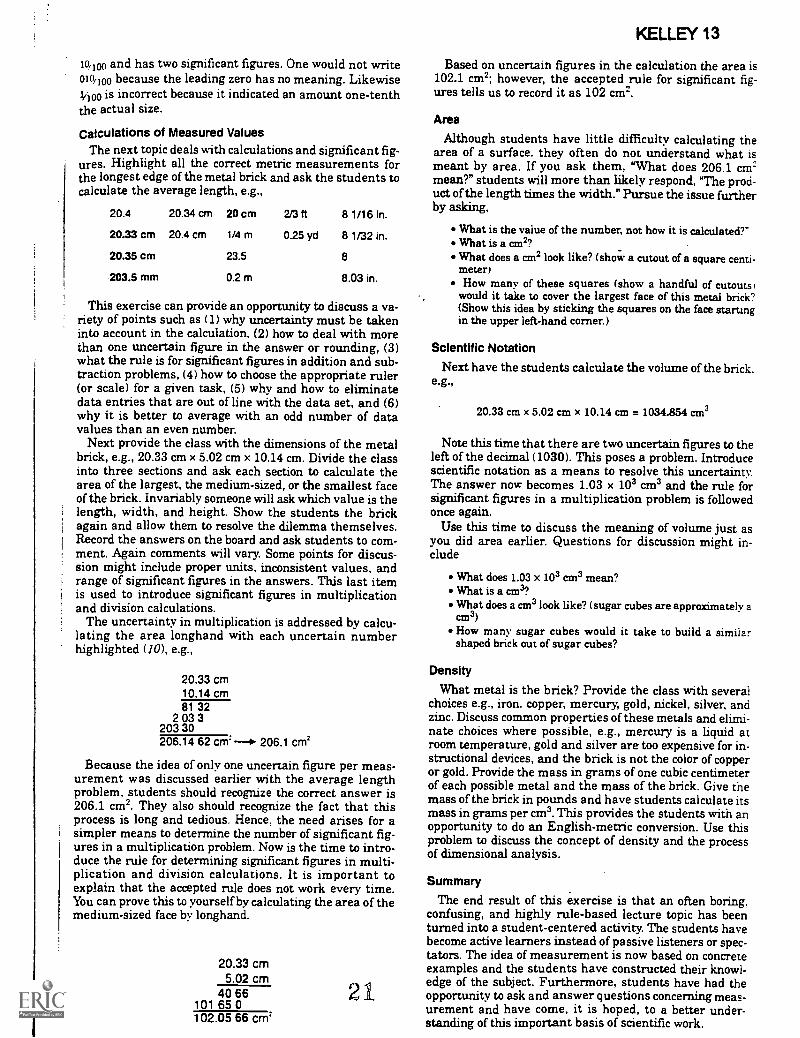
Calculations of Measured ValuesThe next topic deals with calculations and significant fig-
ures. Highlight all the correct metric measurements forthe longest edge of the metal brick and ask the students tocalculate the average length, e.g.,
20.4 20.34 cm 20 cm 2/3f 8 1/16 in.
20.33 cm 20.4 cm 1/4 m 0.25 yd 8 1/32 in.
20.35 cm 23.5 8
203.5 mm 0.2 m 8.03 in.
This exercise can provide an opportunity to discuss a va-riety of points such as (1) why uncertainty must be takeninto account in the calculation, (2) how to deal with morethan one uncertain figure in the answer or rounding, (3)what the rule is for significant figures in addition and sub-traction problems, (4) how to choose the appropriate ruler(or scale) for a given task, (5) why and how to eliminatedata entries that are out of line with the data set, and (6)why it is better to average with an odd number of datavalues than an even number.
Next provide the class with the dimensions of the metalbrick, e.g., 20.33 cm x 5.02 cm x 10.14 cm. Divide the classinto three sections and ask each section to calculate thearea of the largest, the medium-sized, or the smallest faceof the brick. Invariably someone will ask which value is thelength, width, and height. Show the students the brickagain and allow them to resolve the dilemma themselves.Record the answers on the board and ask students to com-ment. Again comments will vary. Some points for discus-sion might include proper units, inconsistent values, andrange of significant figures in the answers. This last itemis used to introduce significant figures in multiplicationand division calculations.
The uncertainty in multiplication is addressed by calcu-lating the area longhand with each uncertain numberhighlighted (10), e.g.,
20.33 cm10.14 cm81 32
2 03 3203 30206.14 62 cm* --o 206.1 cm'
Because the idea of only one uncertain figure per meas-urement was discussed earlier with the average lengthproblem, students should recognize the correct answer is206.1 cm2. They also should recognize the fact that thisprocess is long and tedious. Hence. the need arises for asimpler means to determine the number of significant fig-ures in a multiplication problem. Now is the time to intro-duce the rule for determining significant figures in multi-plication and division calculations. It is important toexplain that the accepted rule does not work every time.You can prove this to yourself by calculating the area of themedium-sized face by longhand.
20.33 cm5.02 cm
40 66101 65 0102.05 66 cm`
21
KELLEY 13
Based on uncertain figures in the calculation the area is102.1 cm2; however, the accepted rule for significant fig-ures tells us to record it as 102 cm2.
Area
Although students have little difficulty calculating thearea of a surface. they often do not understand what ismeant by area. If you ask them, "What does 206.1 chi.2mean?" students will more than likely respond, "The prod-uct of the length times the width." Pursue the issue furtherby asking,
What is the value of the number, not how it is calculated?"What is a cm2?What does a cm2 look like? (show a cutout of a square centi-meter)How many of these squares (show a handful of cutouts?
would it take to cover the largest face of this metal brick?(Show this idea by sticking the squares on the face startingin the upper left-hand corner.)
Scientific Notation
Next have the students calculate the volume of the brick.e.g.,
20.33 cm x 5.02 cm x 10.14 cm = 1034.854 cm3
Note this time that there are two uncertain figures to theleft of the decimal (1030). This poses a problem. Introducescientific notation as a means to resolve this uncertainty.The answer now becomes 1.03 x 103 cm3 and the rule forsignificant figures in a multiplication problem is followedonce again.
Use this time to discuss the meaning of volume just asyou did area earlier. Questions for discussion might in-clude
What does 1.03 x 103 cm3 mean?What is a cm3?What does a cm3 look like? (sugar cubes are approximately acm3)How many sugar cubes would it take to build a similarshaped brick out of sugar cubes?
Density
What metal is the brick? Provide the class with severalchoices e.g., iron, copper, mercury, gold, nickel, silver, andzinc. Discuss common properties of these metals and elimi-nate choices where possible, e.g., mercury is a liquid atroom temperature, gold and silver are too expensive for in-structional devices, and the brick is not the color of copperor gold. Provide the mass in grams of one cubic centimeterof each possible metal and the mass of the brick. Give themass of the brick in pounds and have students calculate itsmass in grams per cm3. This provides the students with anopportunity to do an English-metric conversion. Use thisproblem to discuss the concept of density and the processof dimensional analysis.
Summary
The end result of this exercise is that an often boring.confusing, and highly rule-based lecture topic has beenturned into a student-centered activity. The students havebecome active learners instead of passive listeners or spec-tators. The idea of measurement is now based on concreteexamples and the students have constructed their knowl-edge of the subject. Furthermore, students have had theopportunity to ask and answer questions concerning meas-urement and have come, it is hoped, to a better under-standing of this important basis of scientific work.

AcknowledgmentThe authors would like to thank Claire Baker and
Dudley Herron for initiating this instructional strategy.
Literature Cited1. Chang. R. Chemistry. 5th ed.: McGraw -Hill: New York. 1994.2. Ebbing. D. D. General Chenustry, 4th ed.: Houghton Mifflin: Boston. 1993.3. Herron. J. D.: Frank_ D. V.: Sergi,* J. L.: Sarquis, A. M-: Schrader. C. L: Kukla., D.
A. Heath Chemistry. 2nd ed.: Heath: Lexington. MA. 1993.
KELLEY 14
4. Holtzclaw, H. F.: Robinson. W. R.: Odom. J. D. General Chemistry, 9th ed.; Heath:Lexington. MA. 1991.
S. Smoot.. R. C.: Smith. R. G.; Price, J. Merrill Modern Chemistry. 9th ed.; Mscmil.lan/McGraw-Hilk Lake Forest. IL, 1993.
6. Guymon. E. P.; James. H. G.: Seeger. S. L J. Chem. Educ. 1988,63,786-787.
---7. Kirksey. H. G. J. Chem. Educ. 1992,69,497-498.8. Bodner. G. M. J. Chem. Educ. 1988.63,873-878.
9. Zipp, A. P. J. Chem. Educ. 1992,69.291.
10. Clue. H. J. J. Chem. Educ. 1999.70, 133.
e_heen 72- a), 1./ 9 _5- , , 132-
Ac-t-' visty )
Significant Figures
Often beginning chemistry students have a hard time understanding significant figures. With calculators showing up
to 10 digits, students perpetually report too many significantfigures. Presented is a very simple demonstration that can be
used in class or lab to show how many significant figures to report when using addition or subtraction.The demonstration requires a 500-mL beaker with graduations of 50 mL and a 100 -mL graduated cylinder with
graduations of 1.0 mL. Fill the beaker with about 270 mL water and the cylinder with about 65 mL. Have several studentsdetermine the volume of water in each as accurately as possible and write the answers of each on the board. The beaker can
be read to within 10 mL and the cylinder to 0.1 mi.,. Have the class add up the two numbers on the board. A calculator mayshow the answer to be 337.3 mL. Obviously, this number is being reported more accurately than warranted.
To show why that answer has too many significant figures, pour the water from the cylinder into the beaker. You will
have just "added" the two numbers together. Now have the same students determine the new volume of water in the beaker
as accurately as possible. The accuracy will only be within 10 nL, not 0.1 mL.
. Kenton B. AbelWilliam M. Hemmer*,
Pacific Unto CollageAngwin. CA 94508
BEST COPY AVAILABLE
22
Volume 67 Number 3 March 1990 213

KELLEY 15
A Simple Laboratory Experiment Using Popcorn To Illustrate
Measurement ErrorsDods R. Klmbroughl and Robert R. Meg lenCampus Box 194, P. 0. Box 173364, University of Colorado at Denver, Denver, CO 80217
The concepts of accuracy and precision, uncertainty andsignificant figures are discussed in the first chapter ofmost general chemistry texts and recently were discussedin an article in this Journal (1). From their texts, studentsgenerally learn a "rule of thumb" method of determine theappropriate number of significant figures (2) for the nu-merical answer to a problem, but most students have lostthe reasoning behind this method and focus only on therule itself. Amore rigorous treatment of error analysis gen-erally is not introduced until analytical chemistry or physi-cal chemistry laboratory; however, a large majority of gen-eral chemistry students (biology majors, pre-medstudents) never reach these upper division chemistrycourses and seldom see any practical application of signifi-cant figures.
The use of significant figures rarely is treated any differ-ently in the laboratory portion of the course. Introductoryscience students have difficulty linking the lecture con-cepts of accuracy and precision with the physical measure-ments they make in the laboratory. Students are familiarwith the concept of experimental error because their re-sults often do not match the "expected" or "correct" valuesdictated by the lab manual or last years' results, but theydo not recognize that error is inherent in any measure-ment.
The following is an experiment used at the University ofColorado at Denver in the first-semester general chemis-try laboratory. Popping corn is used to illustrate the scien-tific method (3, 4) and to illustrate measurement errors.The experiment focuses on the difference between accu-racy and precision and demonstrates the necessity for mul-tiple measurements of an experimental variable. It pro-vides the students an opportunity to understand better theconcept of significant figures through practical experience,and it helps them to learn some elementary statistics.
ExperimentalThe students are provided with a description of the the-
ory behind the experiment including a brief discussion ofthe nature of measurement errors and definitions of accu-racy, precision, random indeterminate, and determinateerrors. Each student is directed to weigh (to 0.001 g) 10-15generic brand and a similar number of gourmet brand pop-corn kernels and to identify each so its weight after pop-ping can be compared with that before popping. Each ker-nel is popped by heating it in a 125-mL Erlenmeyer flask,using a pair of tongs to hold the flask over a Bunsen burnerflame. The popped kernel is dumped quickly from theflask, reweighed, and the process is repeated until at least10 of the kernels have been popped successfully. (Note thatfor our purposes, "popped" means any kernel that has ex-ploded and released its water contents as steam, regard-less of its appearance.)
Each student prepares a table comparing individualmasses and their deviations to the average masses for eachbrand, popped and unpopped. Each mass deviates slightly
'Author to whom correspondence should be addressed.23
from the calculated average, and the students computethat deviation (by subtracting the individual mass fromthe average) as well as the square of the deviation for eachtabulated value. They calculate the standard deviation (anand a..1) for each set of 10 values. The students use thecomputed averages and standard deviations to draw con-clusions regarding the differences between popped and un-popped average masses, between generic and gourmetbrand average masses, mass losses on popping, and anystandard deviation differences between the brands. (Ad-vanced students are encouraged to test the statistical sig-nificance ft-test and F-test] between their generic andgourmet averages and the significance of their results rela-tive to the pooled results of the whole class.)
MaterialsTwo brands of unpopped popcorn generic and gourmetbrands)100-125 mL Erlenmeyer flaskBunsen burnerburner strikerburner wire gauzechemical tongs
Caution: Normal laboratory safety procedures should befollowed including wearing safety goggles and cautionsregarding the use of open flames in the laboratory. Inaddition, the students are instructed NOT to eat the popcornat any time during or after the experiment.
ResultsA typical student data sheet, containing only the results
for the generic brand popcorn, is shown in Table 1. Thestudents complete a similar table for the gourmet brandpopcorn. While we do not require general chemistry stu-dents to perform the statistical tests for significance of dif-ferences, it is interesting to note that the typical studentresult shows that the average popped and unpoppedmasses are significantly different for both popcorn brands.However, the large variances for only 10 observations doesnot permit one to conclude that the differences betweenthe brands is statistically significant. The importance ofmaking many measurements to improve the strength ofinferences can be made by examining the pooled resultsfrom an entire class of 27 students (Table 2). These results(N = 270) show that the popped and unpopped masses dif-fer for both brands and are statistically significant (99.9%)and that the gourmet brand kernels have statistically sig-nificant (99.9%) smaller masses than the generic brand(both popped and unpopped masses). This result may bepresented to the students in a follow-up to the experimentwhen results are discussed and interpreted.
DiscussionMost general chemistry texts provide a section on meas-
urement errors that includes formulas for computing thestandard deviation. In addition, most student calculatorscontain the statistical functions necessary for computingmeans and standard deviations. However, in this experi-ment we provide our students with sample calculations

Table 1. Student Data Sheet for Unpopped and PoppedGeneric Brand Popcorn
UnpoppedMass (g)
Dev. from Squared Pop -ped Dev. fromAve. (g) Dev. (g)2 Mass (g) Ave. (g)
0.122
0.186
0.139
0.142
0.181
0.089
0.182
0.199
0.147
0.141
0.0308
0.0332
0.0138
0.0108
0.0282
0.0638
0.0292
0.0462
0.0058
0.0118
0.00094864
0.00110224
0.00019044
0.00011664
0.00079524
0.00407044
0.00085264
0.00213444
0.00003364
0.00013924
0.113
0.168
0.124
0.117
0.163
0.081
0.166
0.183
0.132
0.126
0.0243
0.0307
0.0133
0.0203
0.0257
0.0563
0.0287
0.0457
0.0053
0.0113
Squared Loss onDev. (g)2 Popping
(9)
0.00059049 0.009
0.00094249 0.018
0.00017689 0.015
0.00041209 0.025
0.00066049 0.018
0.00316969 0.008
0.00082369 0.016
0.00208849 0.016
0.00002809 0.015
0.00012769 0.015
Average 0.1528
Standard Deviation (n = 10)
Exptl. Std. Dev., (df = n -1= 9)
0.00103836 0.1373
0.032 0.030
0.034 0.032
0.00090201 0.0155
Table 2. Pooled Results from 27 Student Experiments Statistical ComparisonsAmong Means (Total Number of Observations 270)
Comparison of popped and unpopped means for both brands
Mean in Std. Dev. Std. Error Difference Std.Dev. t-Value df(9) (9) (g) Mean.(g) in (g) = 269 Probability
Gourmet unpop
Gourmet popped
Genenc unpop
Generic popped
0.1358
0.1201
0.1454
0.1290
0.018
0.019
0.032
0.030
0.001
0.001
0.002
0.002
0.0157 .010 26.43 0.000
0.0164 .009 30.20 0.000
Comparison of between brands (popped and unpopped)
Gourmet unpop
Generic unpop
Gourmet popped
Generic popped
0.1358 0.018 0.001 -0.0096
0.1454 0.032 0.002
0.1201 0.019 0.001 -0.0089
0.1290 0.030 0.002
.036 -4.43 0.000
0.35 -4.21 0.000
'Probability that a difference of this magnitude could be due to sheer chance.
and ask them to perform a more laborious detailed compu-tation for at least one data set to focus their attention onhow individual deviations contribute to the concept of thestandard deviation. The difference between standard de-viation, on. and the experimental or sample standard de-
520 inumal of nhiamiral Frit inatinn
viation, (Tn.', is discussed in thehandout with regard to the fact thatonly 10 data points are taken in thisexperiment.
In addition, for lab experiments co-ordinated with computer training,students can enter their data into aspreadsheet program to prepare thetables, perform the calculations, andpool the results with other studentsin the laboratory. The graphical func-tions that accompany most spread-sheet programs will permit each stu-dent to prepare a plot of thefrequency distributions associatedwith multiple measurements. Thedata from the entire laboratory sec-tion can be compiled, and the stu-dents can compare the variance ob-tained from 10 measurements to themuch smaller variance obtainedfrom 250 to 300 measurements.
ConclusionsWe believe that this experiment is
a versatile exercise, because it can beperformed at several different levelsof experimental and computationalsophistication. In addition, the ex-
.periment provides a method to intro-duce the concept of investigator col-laboration by allowing several stu-dents to pool their results (particu-larly using the spreadsheet optionoutlined above) and to observe howexperimental confidence levels maybe improved through replication andincreased numbers of observations.This also is a convenient introduc-tory experiment from a practicalstandpoint. It requires that the stu-dents use only a balance and a Bun-sen burner. They gain experience inrecording data in tabular form alongwith an early introduction to experi-mental uncertainty and error analy-sis. After performing this experi-ment, the students make aninference from a measured quantity(kernel weight) and an observed phe-nomenon (kernel popping). Studentsalso develop some understanding ofthe application of science to checkthe validity of commercial claims.
Literature Cited1. Guars. C. J. J. Chem. Educ. 1991. 68. 649-652.2. Zipp, A. P. J. Chem. Educ 1992.69. 291.3. Vieaterberg, J.; Whiting, .1. The Mathemaucs Teacher 1992, 85, 306-308.4. Sauk. F. J. Chem. Educe 1991. 68, 415-416.
24

KELLEY 17
Error, Precision, and UncertaintyCharles J. Guare
AOP OfficeUnion CollegeSchenectady, NY 12308
This paper was prepared in response to requests fromseveral chemistry instructors for information following myletter, "Duplicating the Confusion," in Chemical & Engi-neering News, January 22, 1990. Its objective is to provideanswers to questions that frequently arise about experimen-tal error, precision, and uncertainty in introductory chemis-try courses, and to keep the answers consistent with accept-ed definitions.
In the literature and textbooks the arithmetic of scienceand engineering is rarely presented as a neat, self-consistentpackage. One may read that precision is a measure of error(1, 2) or that error and uncertainty are the same thing (3).Authors may state that significant digits are related to errorbut that a number with more significant digits to the right ofthe decimal point is a more precise number (not necessarily amore correct number), thereby showing that significant dig-its are related to precision and not to error. The student maybe told that "error propagation" is conducted according toone rule for addition and subtraction, a different rule formultiplication and division, still another for logarithms, andmore rules for other functions. Strangely, a student may findthat the definitions and rules for doing the arithmetic need-ed to handle the experimental data generated in a laboratorycourse may not be the same in the laboratory text and in therecitation text.
If students in introductory engineering and scienceCourses are confused about the arithmetic procedures forhandling their data and results, there is adequate reason.
Definitions
Following are the definitions on which this paper is based.
Accuracy: a measure of the closeness of an experimental value tothe true value (4, p 612).
8rron a measure of the departure of an experimental value fromthe true value (5, 6. pp 15-16).
Precision: a measure of the reproducibility of a set of results fromreplicate runs. "It [precision/ does not matter how close the aver-age of these runs is to the true value; thus. precision and accuracyare defined independently of each other" (4, p 612).
Significant digits: in a number, all the digits that are certain plusthe first uncertain digit. All digits to the right of the first uncer-tain digit are dropped; e.g., 12.0 ±1.0 is no more informative than12 *1 (4, p 609; 6. p 22).
Uncertain digit: any digit that can vary by at least plus or minus 1(4. P 609; 6, p 22: 7. p 7).
BEST COPY AVAILABLE
Uncertainty: the range a data value may have because of the needto estimate (interpolate) the last digit being read from an instru-ment scale; the range a calculated result may have because of theuncertainty in the data or results from which it is calculated. Thus7.82 ±0.02 has an uncertainty of 2 in the hundredths position.Hundredths is the first uncertain digit.
We may distinguish among error, precision, and uncer-tainty as shown in Figure 1. The abscissa values A and Drepresent two individual measurements of some quantity, Bis the mean of a large number of measurements of the samequantity, and C is the true value of the quantity. The uncer-tainty in A and D is shown by the band about each, assignedby the experimenter at the time of reading the measuredvalue. A C and C D are the errors for A and D. Theprecision for the two measurements, taken as the averageabsolute deviation from the mean of A and D, is (A D)/2. B
C is the bias. B will be unknown to any experimenter whohas made only a few measurements and C may be unknownto everyone.
Students' Questions
Are Uncertainty and Precision the Same?No. Uncertainty in data is estimated by the experimenter
at the time of taking a reading and is influenced by, amongother things, the closeness and coarseness of the graduationmarks on the instrument scale, the visual acuity of the ob-server, and the fluctuation of the instrument pointer posi-
A BCD
Figure 1. Distinction among error. precision. and uncertainty. The abscissavalues are: A and 0 = two individual measured values and their bands ofuncertainty: B = the mean of a large number of measurements: C = the truevalue. The errors in the two measured values are given by the distances A - Cand C 0 The precision of the two measurements. using the averageabsolute deviation from the mean, is 0.5 (0 minus A). B C Is the bias.
Volume 68 Number 8 August 1991 .849

tion because of mechanical or electronic instability in the
instrument.Precision, on the other hand, is represented by a calculat-
ed index such as the average absolute deviation from themean or by the standard deviation for a series of measure-
ments. Nevertheless, uncertainty hints at precision. A num-ber like 27.83 ±0.01, with four significant digits and uncer-tain at hundredths, is not as precisely expressed as the samenumber read from a better instrument and expressed as27.834 ± 0.001, with five significant digits and uncertain atthousandths. This is so whether 27.834 is the true value ornot. Significant digits are controlled by uncertainty and arerelated to precision, not to error.
The uncertainty, ±0.01, does not imply that a duplicatemeasurement is expected to fall within the range 27.82-27.84
nor that 27.83 lies within 0.01 units of the true value. Uncer-
tainty is not a direct estimate of precision or error. It is anestimate of how well the number could be read when it was
read.
How Does Uncertainty Differ from Error?
Consider the case of a student using a 100 -mL graduatedcylinder that has a manufacturer's tolerance of 3%.
The student fills the cylinder to about the 90-mL markand estimates the meniscus to be at 90.5 ±0.5 raL. This ±0.5
mL is often recorded as the estimated error in the reading,and, if this volume is added to another, say 40.5 ±0.5 mL,assuming no change in volume on mixing, the estimatedmaximum possible error in the total volume of 131 mL isdeclared to be 0.5 + 0.5 or 1. mL.
This approach is obviously incorrect. There is no reason to
assume that, because the meniscus position can be read to
±0.5 mL, then the graduation marks on the cylinder mustalso lie within ±0.5 mL of the true position.
The student is estimating that, under the conditions pre-vailing at the time of the measurement, the meniscus wasbetween the 90- and 91-mL marks regardless of how correctthose marks are. The student is neither estimating how well
he or she can duplicate pouring 90 mL of liquid (experimen-tal precision) nor how far the volume is from being correct(experimental error).
The maximum possible error in the readings comes from
the manufacturer's data. If the tolerance on the glassware is3%, the maximum possible errors are 0.03 x 90.5 = 2.7 mL,0.03 x 40.5 = 1.2 mL, and, for the total, 2.7 + 1.2 = 3.9 mL.
There is another reason why the band of uncertaintyabout an individual value cannot be considered error. If we
make two measurements of some quantity, experience shows
that the two measurements might well not be identical, andthere will be an uncertainty associated with each. If the first
one is 105 with an uncertainty of ±1 and the uncertainty is
taken to be error, we conclude that 105 lies within one unit ofbeing true. If the second one is 95 ±1 and the ±1 is againconsidered error, we are faced with the dilemma of claimingboth 95 and 105 are within one unit of the same true value.We may reasonably say that each number, true or not, lieswithin one unit of the values read from the instrument, butwe may not reasonably say that two numbers that differ by
10 both lie within one unit of the same true value.This argument agrees with the definitions of accuracy,
error, and uncertainty in definitions above and with Barford
(6, p 16) who writes:error = x X
where x = the measured valueX 1= the true value
but it conflicts with J. R. Taylor (3, p 15) who says:
measured value of x ± dx
wherexbri, = best estimate for x,
dx = uncertainty or error in the measurement
850 Journal of Chemical Education 2R
confusing uncertainty with error and leading to the chleranu
above with being 95 pr 105 and dx = 1.Confusion of error with uncertainty is frequently present
in texts, and the student is taught "rules for propagation oferror" when what is being propagated is uncertainties thathave nothing to do with error.
What Is Needed To Be Able To Assess Error?
Barford (6), J. R. Taylor (3), J. K. Taylor (8), and Marion
and Davidson (9) all agree that a legitimate statement about
error can be made only after any combination of experiment.erequipmentprocedure has been thoroughly checked out,
comparisons with standards have been made, and a largenumber of measurements have been completed. Even then,
some authors contend it is never possible to know the truevalue of a measured quantity. That is, if a large number ofmeasurements have produced a well-defined distributioncurve with a good estimate of the mean,.taking the mean tobe the true value still involves an assumption.
.J. K. Taylor (8, p 7) says, "In a stable measurement pro.cess, a large number of individual values will tend to con.verge toward a limiting mean, which may or may not be the
true value." Marion and Davidson (9, p 18) say, "When we
measure some physical quantity, we do not know (nor can weknow) the true value of the quantity. Therefore, we cannever know the error in the result"
This last seems overly severe. If several experimenters
using different equipment and different procedures careful.ly measure a quantity numerous times to define the datadistribution curve in each case, andif the distribution curves
all have the same mean, we probably do have the true value.
This may not happen very often, but we may certainly beadequately accurate for practical purposes as shown by theeconomic viability of the chemical industry and the routinedispensing of desired doses of numerous medications. Nev-ertheless, getting to a position in which one can provide a
legitimate error estimate takes much effort and time. That is
why we have referee laboratories and why universal con-stants change over the years.
J. K. Taylor (8, Chapters 9 and 10) provides a qualitycontrol expert's view of the extensive work necessary to
assess errors. His discussion is strongly supported by Rubin-
son (10, Chapter 4) who uses the results of two chemical
analyses to show the kinds of difficulties that can arise and
produce incorrect data. This material clearly confirms that
an error estimate is not something the experimenter pops upwith each time he or she takes a reading, and our studentsshould not be misled into thinking they are estimating error
every time they assign an uncertainty.
Why Not Eliminate Error by Calibrating?
Calibration is a big step in the right direction, but it does
not guarantee identification of the true value for any point
on a calibration curve, and it is highly unlikely that all points
on a calibration curve represent true values. J. K. Taylor (8,
p 103, p 106) says, "Ideally, the calibration process is under-
taken to eliminate deviations in the accuracy of measure-
ments or instruments. However, this cannot be glibly assu-med," and, "Thus, biased measurement data can resultwhen using unbiased methodology because of calibration
bias."In a manner of speaking, the manufacturer's information
used to estimate the maximum possible error in the graduat-
ed cylinder example above provides some calibration. The
manufacturer has done extensive quality control work and
knows that his or her graduated cylinders will measurevolume that is within 3% of being correct. We can think of acalibration curve, really a calibration "band", that has awidth of ±3% and relates the actual readings to the range of
"true" values possible. Much instrumentation will do betterthan the 3% figure, but it is still unlikely that calibration Will
produce exact corrections to each scale value. The "calibre-

peacurve" always turns out to be a "calibration band" (8,
I Chapter 10).To illustrate, take a case in which a point on an instrument
sole is being calibrated against a standard that has a valueof 100. If the experimenter makes numerous measurementsof the standard, his or her readings will cover a range ofvalues. Assume they are normally distributed with no biaspresent.
Uwe plot the experimental data in three dimensions suchthat the x axis represents the standard values, the y-axisrepresents the values read from the calibration experiment,and the z axis represents the relative number of times eachexperimental value was observed above the value of 100 onthe x axis, we get a little normal distribution curve in the y-zplane. If there is no bias, the mean on the y axis is 100, and
the standard deviation has some value, s. In practice, thisdistribution curve would exist but would probably be un-Imown because few people do all the work necessary to de-fine it.
If we have not defined this distribution curve but weproceed to make a calibration measurement, what is theprobe uility that the measurement will fall within the rangeof the mean ±ls? The probability is about 0.68 becauseabout 68% of all data in a normal distribution curve fallwithin that range (11, p 382-383). If we calibrate at fivepoints, the probability that all five will lie within one stan-dard deviation of the true value is 0.68 raised to the fifthpower, or about 15%. It is very difficult to eliminate all errorby calibration even taking as "correct" anything within acalibration band as wide as ±ls.
Why t'.)es Averaging Improve Accuracy?Averaging always improves precision; it may or may not
improve accuracy.Previous discussion shows it is difficult to get the true
value in experimental measurements, so it is probable thatexperimental data and results have a bias of some magni-tude. In these cases, the mean of even a well-defined distri-bution curve is not the true value. This is the reason thatprecision, as measured by average absolution deviation fromthe mean or by standard deviation, is not generally a mea-sure of error. These indexes of precision measure the devi-ation ,g the replicated data from the mean of that data, notnecessarily from the true value.
Let us start out with a distribution curve that results froma large number of individual measurements and has a stan-dard deviation of s. Suppose we now start making measure-ments by running quadruplicates and averaging the four. Itturns out an average of four comes from a new distributioncurve that has the same mean as the original, but its stan-dard deviation, s(4), is only half the value of s. s(4) is calledthe standard deviation of the mean. In general, s(n) is s /n "2(s(n) = s/n") (11, p 39).
Because this act of averaging has created a value takenfrom a new distribution curve of smaller standard deviation,the new curve represents a more precise distribution that iscontracted about the mean of the old curve. But if the meanis not the true value because of a bias, an average of four isnot more likely to be the true value; it is just more likely to bethe biased mean. The result is an increase in precision butnot in accuracy.
This conclusion depends upon how large the bias is. If it isvery small relative to the standard deviation, initial im-provement in precision will improve the probability of get-ting a correct measurement; but if precision continues toImprove, the chance that a measurement will hit the truevalue always decreases. If the bias is as large as one standarddeviation, any decrease in the standard deviation immedi-ately reduces the probability that a measurement will pro-duce the true value. This is shown in Figure 2, wherein theupper curve represents the frequency distribution of n indi-
(.1
KELLEY 19
Figure 2. Effects of averaging on precision and accuracy. The upper curverepresents the frequency distribution of n measured values of some quantity.The lower. more precise curve represents the frequency distribution of n/4averages of quadruplicates. The center vertical line is the mean of eitherdistribution. The true value is the right vertical line. Note the iow chance ofgetting the true value with a measurement from the more precise case.
vidual measurements and the lower curve represents themore precise distribution of n/4 averages of four measure-ments. The center vertical line is the mean of either distribu-tion, and the right vertical line is the true value. Note thereduced chance of getting the true value in the more precisecase. The same reasoningholds for better precision achievedin other ways, such as by more precise equipment but stillwith a biased procedure or calibration.
The belief that averaging always improves accuracy orthat better precision means better accuracy clearly is notcorrect.
Do I Have To Learn a New Rule for Error Propagation forEach Arithmetic Operation?
In introductory laboratory courses, the student usuallymakes only two or three measurements, often uses uncali-brated equipment and unfamiliar procedures, and has noidea what the true value is. Under these conditions, it is notpossible to estimate error. You are estimating and propagat-ing uncertainty, not error.
You do not have to learn a separate rule for propagatinguncertainty for each arithmetic operation. There is a simple,straightforward concept for handling uncertainties and sig-nificant digits in calculations. It eliminates the need to learna variety of rules. It consists oftaking the numbers to meanwhat they say and calculating the maximum, best estimate,and the minimum values possible. The uncertainty and sig-nificant digits in the answer then fall out naturally. Ele-ments of the procedure may be found in Marion and David-son (9, p 23) and in Petrucci p 9).
Example 1. What is the sum of 17.2 ± 0.2 and 12.5 ± 0.1?MAXIMUM SUM 17.4 + 12.6 = 30.0BEST ESTIMATE SUM = 17.2 + 12.5 = 29.7
MINIMUM SUM = 17.0 + 12.4 = 29.4UNCERTAINTY IN SUM = (30.0 - 29.4)/2 = 0.3SUM = 29.7 ± 0.3
Example 2. What is the difference between the two numbers ofExample 1?
MAXIMUM DIFFERENCE = 17.4 - 12.4 = 5.0
BEST ESTIMATE DIFFERENCE = 17.2 - 12.5 = 4.7
MINIMUM DIFFERENCE = 17.0 - 12.6 = 4.4
UNCERTAINTY IN DIFFERENCE = (5.0 - 4.41/2 = 0.3
DIFFERENCE = 4.7 ± 0.3
Example 3. If A = 1.19 ± 0.01 and B = 0.286 ± 0.002. what is their
product? (For multiplication and division, keep the answer one digit
longer than the longest factor.)MAXIMUM PRODUCT = 1.20 x 0.288 = 0.3456
BEST ESTIMATE PRODUCT = 1.19 x 0.286 = 0.3403
MINIMUM PRODUCT = 1.18 x 0.284 = 0.3351
(A0V3A4:-AcB1.3L35E1)/2
4 UNCERTAINTYPRODUCT = Q.340
ILABLE

Example 4. What is the quotient of A/B from Example 3?MAXIMUM QUOTIENT d 1.20/0.284 Za 4.225BEST ESTIMATE QUOTIENT = 1.19/0.286 o 4.160MINIMUM QUOTIENT = 1.18/0.288 = 4.097UNCERTAINTY IN QUOTIENT = (4.225 - 4.097)/2 =, 0.064QUOTIENT = 4.16 * 0.06
Example 5. What is the log of 86 * 6?MAXIMUM LOG = log 92 = 1.963BEST ESTIMATE LOG s= log 86 1.934MINIMUM LOG = log 80 =. 1.903UNCERTAINTY IN LOG = (1.963 - 1.903)/2 0.030LOG = 1.93 t 0.03
Example 6. What is the sine of 30 * 2 degrees?MAXIMUM SINE =, sin 32 = 0.5299BEST ESTIMATE SINE ani sin 30 = 0.5000MINIMUM SINE i= sin 28 = 0.4694UNCERTAINTY IN SINE = (0.5299 - 0.4694)/2 = 0.03025SINE = 0.50 0.03
KELLEY 20
-1
This procedure works for all cases above and can be el. rtended to numbers raised to a power and others. Separaterules for each case are not needed.
Literature CltedI. Stieg. S..1. Chem. Educ.19117.64, 471.2. Schwartz. L. J. Chem. Ethic. 1987, 64.471.1. Taylor. J. R. An Introduction to Error Analysis: Wder New York. 1982.4. WS, C. W.J4 Beachley. Jr.. 0. T. Chemistry in the Laboratory; Saunders: Prideuti.
Ai.. 1987.5. Stain. J.. Ed. '77te Random Howe Dictionary of the English Language; Random
House New York. 1966.6. Barked. N. C. Experimental Measurements: Precision. Error and Truth; Wiley; Nee
York. 1985.7. Petrucci. R. H. General Chemistry. 4th ed.: Macmillan New York. 1985.IL Tame', J. K. Quality Assurance of Chemical MtOiltreatt11411 University Science Mg
Valley. CA. 1982.9. Maxim, J. B.; Davidson. B. C. Mathematical Preparation for General Physia;
Saunders Philadelphia. 1977-10. Rubinson. K. A. Chemical Analysis; Little. Brown: Boston. 1987.11. Dixon. W. J.; Mammy. Jr. F. J. Introduction to Statistical Analysis. god ed.; McGee,.
Hill: New York. 1957.
28
Ghe.444. c, ()) 1991, p, GS-2.

KELLEY 21
4- Teaching Significant Figures Using a Learning Cycle
E. Park Guymon, Helen J. James,1 and Spencer L. Seager
Weber State College, Ogden, UT 84408
"Whatever became of significant figures?" 2 How often doinstructors echo this comment as they grade problem sets orlab reports? Can we teach the use of significant figures in away that will be retained better by our students?
The rules for using significant figures are usually found inthe first chapter (or possibly the appendix) of most text-books and seem to be forgotten quickly by everyone as soon
as their discussion in class is finished. The importance ofcorrectly recording measurements is often emphaSized inclass, but few students seem to recognize that this ideashould be applied to data collected in the laboratory. Anoth-er frustration occurs because students misinterpret therules, possibly because the rules are not clearly stated interms the students understand. This problem is indicated byrecent articles that are concerned with the wording used tostate the rules governing the significance of zeros in a val-
ue.3-4We have developed an exercise called "R and R" (rectan-
gles and rulers) which helps our students establish the rulesfor themselves. This exercise involves the students in mak-ing measurements which helps them relate the use of signifi-cant figures to laboratory experiences. We have used R andR in both classroom and laboratory settings depending uponthe course being taught.
R and R is written as a learning cycle, a type of activitydeveloped to help students' reasoning and to give them con-crete experiences with a new concept.' A learning cycle con-sists of three phases: exploration, invention, and application.During exploration students are encouraged to learnthrough their own concrete experiences. In the second phase,students are asked to invent part or all of a concept forthemselves. This procedure gives students confidence asthey gain familiarity with the invented concept. During ap-plication the students are required to use the concept in asituation which gives them more understanding. Details ofour experiences with the R and R learning cycle are givenbelow.
ExplorationThe students work in pairs which encourages them to
discuss results and prod each other to achieve better results.Each team receives a packet of material containing fourdifferent colored rectangles and a ruler calibrated in centi-meters. We made the rectangles and rulers from plasticindex cards. They are sturdy and come in various colors. Weused a paper cutter to make the rectangles of a given color asnearly as possible identical in size to all others of that color.The rectangles had the following dimensions: 12.0 x 10.5 cm,20.0 X 2.5 cm, 13.5 X 0.7 cm. and 3.0 X 2.5 cm. The teams areasked to determine the length, width, perimeter, and area ofeach rectangle. After completing this task the students arerequired to repeat the measurements, but with a ruler cali-brated in tenths of a centimeter. The results for a team areshown in Table 1. During this exploration many studentsshow lots of concern about estimating values with the rulers
BEST COPY AVAILABLE1 Author to whom inquiries should be directed.2 Anderlik. B. J. Chem. Educ. 1980. 57, 591.3 Treptow, R. S. J. Chem. Educ. 1980, 57, 646.4 Ward. C. R. J. Chem. Educ. 1981, 58, 616.5 Karplus. R. "Science Curriculum Improvement Study''; University
of California: Berkeley, CA, 1974,
29
Table 1. Typical Student Data
Rectangle Length (cm) Width (cm) Perimeter (cm) Area 1:-Tn)
Ruler Calibrated to a Centimeter
Black 12 10.5 45 126
Red 20.4 2.6 46 53.04
Green 3.2 2.6 11.6 8.32
Orange 0.7 13.4 28.2 9.38
Ruler Calibrated to Tenths of a Centimeter
Black 12 10.4 44.8 124.8
Red 20.2 2.42 45.24 48.884
Green 3.18 2.55 11.46 8.109
Orange 0.68 13.22 27.8 8.989s
that they are using. But few show the same concern when
they use the measured values in calculations. Also, noticethat the data in Table 1 indicate that the team estimatedreadings to tenths of a centimeter, except when the me*sured value was perceived to be a whole number (the length
of the black rectangle was recorded as 12 instead o- 12.0When these rectangles are cut, it is important to cut ocarefully enough to allow for this type of student result.
InventionA primary goal of the invention phase is to involve
students and instructor in a discussion that encouragesstudents to be active learners. We begin this phase by haeach team list its results on a blackboard. Table 2 sh
some typical results for the black rectangle. Usually. dis
sions (and sometimes arguments) begin among the storied
as soon as the first results are listed. We try to ce: zer the
inital discussion around the question. "Are the record
measurements consistent?" Within a few minutes the saedents agree that the length of the black rectangle shouldrecorded as 12.0 cm or 12.00 cm depending upon the rule
used. They begin to recognize that for an experimental me-surement the last recorded digit is an estimate that wi
include a reading error.Next, we lead the discussion to consider whether the
culated perimeter and area' values are consistent with the
correctly recorded lengths. Students often consider results
Table 2. Typical Data for the Black Rectangle
Team # Length (cm) Width (cm) Perimeter (cm) Area 0:015
Ruler Calibrated to a Centimeter
12 10.5
2 12.0 10.4
3 12 10.6
4 12 10.5
4544.845.245.0
126
124.8
:26.0
Ruler Calibrated to Tenths of a Centimeter
12 10.4 44.8 124.8
2 12.00 10.52 45.04 126.24
3 12.0 10.5 45 126
4 12.0 10.48 44.96 125.16

such as those of team number two to he correct. Two exer-
cisesusually enlighten them. First, we ask them to deter-
mine the perimeter by using the length measured with thefirst ruler and the width measured with the second. ForTeam 2 this would be
12.0 ':n112.0 . :n10.52 cm
45.04 cmAlmost without exception the students agree on a value of45.0 cm as the correct one. They explain that since only thelast digit can be an estimate. the 4 must be dropped or theit two digits will both contain estimates. The students areasked to use these ideas and write a rule for the use ofsignificant figures in addition and/or subtraction opera-tions. In the second exercise we ask the students to calculateareas tr.::ng a constant length. but a width that has values ofplus or minus 0.1 cm from the recorded value. Again, Team 2would find
Recorded width + 0.1: 12.0 cm x 10.5 cm = 126.0 cm2
Recorded values: 12.0 cm x 10.4 cm = 124.8 cm2Recorded width - 0.1: 12.0 cm x 10.3 cm = 123.6 cm2
The students see that the results vary in the last two digits.They conclude that since only the last digit can contain anyestimate, the results must be rounded, and the correct valueshould be written as 125 cm2. After doing several examplesthe stud,.nts begin counting significant figures correctly andactually derive their own rules for multiplication and/ordivision. In order to clarify the zero problem we ask them torecord the length and width in meters and to calculate thearea
i 0.120 rn x 0.104 rn = 0.01248 m2
1By comparison to the earlier result (124.8 cm2) which wasrounded to 3 significant figures. students see that the zero to
1
the right of the decimal in the answer cannot be significant,tad, in fact, the result must be rounded to 0.0125 m2. Theseconcrete experiences help them recognize the usefulness ofthe rules and also help them state the rules in their ownwords.A .
Application
"The application phase varies depending upon the settingm which we use R and R. In a classroom, students are askedto calculate the volume of a single rectangle. Since it isdifficult to measure the thickness of a single rectangle, thestudents form a stack and determine the average thickness.
',This approach brings up the relationship between signifi-cant figures and counting numbers. In a laboratory setting,the students must determine the readability limits of suchequipment as graduated cylinders and burets. We also askthem to decide on the maximum number of significant fig-uses they can obtain for measurements made with thesedevices.
.Falltparison of R and R versus Tradltortal ApproachDuring the 1984-85 academic year tests were given to 37
!teshmen chemistry students at the beginning of the quarterbefore they did the R and R activity as a 3-hour laboratory
Table 3. Pre- and Post-Test Results
Measurement Task Calculation Task
Score Pre-test Post-test Pre-test Post-test
R and R Students
0 2 (5.4%) 1 (2.7%) 0 (0.0%) 0 (0.0%)
1 16 (43.2%) 2 (5.4%) 32 (86.5%) 24 (64.9%)
2 2 (5.4%) 2 (5.4%) 3 (8.1%) 1 (2.7%)
3 17 (48.0%) 32 (86.5%) 2 (5.4%) 12 (32.4%)
Traditional Students
0 9 (9.7%) 3 (3.2%) 7 (7.5%) 1 (1.1%)
1 11 (11.8%) 16 (17.2%) 53 (57.0%) 53 (57.0%)
2 4 (4.3%) 1 (1.1%) 6 (6.5%) 3 (3.2%)
3 69 (74.2%) 73 (78.5%) 27 (29.0%) 36 (38.7%)
experiment, and at the end of the quarter. These studentsreceived no other formal instruction dealing with significantfigures. The same end-of-quarter test was given to 97 stu-dents who received significant figure instruction in a tradi-tional lecture setting. Circumstances prevented us from giv-
ing this group the pre-test before they received significantfigure instruction in class. Two test questions dealt withsignificant figures. One question was a measurement taskthat required the students to record a measured quantityusing the correct number of significant figures. The secondquestion required students to do a calculation and expressthe result using the correct number of significant figures.The questions were worked out on the test paper and weregraded on a 0-3 basis as follows: 0 = no attempt made tosolve problem, 1 = question done incorrectly, 2 = correctnumber of significant figures used but incorrect results ob-tained, 3 = correct number of significant figures and correctresult obtained. The results of the test are given in Table 3.
Both groups handled the measurement task quite well in
the post-test. The R and R group did a little better with91.9% scoring 2 or 3 compared to 79.6% of the traditionalstudents. Neither group did as well on the calculation task.but the traditional students did a little better than the R and
R group. Of the traditional students, 41.9% scored 2 or 3.compared to 35.1% of the R and R group.
ConclusionsThe correct use of significant figures can be taught. but we
prefer to have students establish the rules rather than mem-orize them. In our experience, students who do this are morewilling to accept the responsibility for using them correctly.In addition, the gentle reminder "remember R and R" isoften all that is needed to answer student questions aboutsignificant figures. The data collected in the pre- and post-tests indicate that R and R is at least as effective as thetraditional approach to teaching significant figures. Try Rand R for yourself, or develop your own concrete experiencesthat allow students to discover significant figures for them-selves. You will like the results.
A sample of the materials we use can be obtained for 51.50.
Send requests and make checks payable to the ChemistryDepartment, Weber State College.
30 E EST COPY MIA LE
Volume 63 Number 9 September 1986 787

Significant Figures: A Classroom Demonstration
Submitted by:
H. Graden KirkseyMemphis State UniversityMemphis, TN 38152
Checked by:
Paul KrauseUniversity of Central ArkansasConway, AR 72032
Information about a measured property of matter is com-municated by the magnitude of the numerical measure-ment, the unit for the physical quantity employed to recordthe measured property, and the number of significant fig-
ures recorded in the numerical measurement. Studentseasily comprehend the significance of the first of these,often omit or neglect to record the second as a part of theirmeasurement, and, along with some textbook authors, ei-ther carelessly regard or ignorantly disregard the third.The purpose of this classroom demonstration is to showstudents the function and importance of significant figuresin a measurement.
Materials NeededThe items needed to perform this demonstration are
Two uncalibrated 1.000-m long sticksTwo 1.000-m long decimeter sticksTwo 1.000-m long centimeter sticksTwo straight rods t wood or metal) that differ in length by 1cm; e.g., 0.32 m and 0.33 m.
Optional items are
Two uncalibrated 1.000-yd long sticksTwo 30-cm purchased rulers marked at each mmTwo glass rods that differ in length by 0.5 mm; e.g., 27.23 cmand 27.28 cm in lengthTwo magnifying glasses
Six wooden sticks 1.000 m in length and two woodensticks 1.000 yd in length must be prepared in-house. Cali-bration marks one decimeter apart on two of these metersticks and one centimeter apart on two others can bedrawn with a pencil.
The two glass rods of near equal lengths are prepared bycutting two rods of equal length (about 27 cm) and fire pol-ishing the ends. If one is not about 0.5 mm longer than theother, then shorten one rod by heating one end and gentlypressing it on a hard, flat surface. If each glass rod iswrapped with tape of a different color, they are easily iden-tified and do not become a hazard if broken.
The Classroom DemonstrationA teacher, who is holding in each hand one metal or
wooden rod, poses to the class, "Are the lengths of theserods identical?" Students accept the notion that no tworods are likely to have exactly the same length. Theteacher then moves to the more important question, "Howmany significant figures must be in the measurements ofthe lengths of these two rods in order to know that theirlengths are different?"
BEST COPY AVAILABLE
KELLEY 23
Two students selected by the teacher are each given oneof the two rods. Each student is to use an unmarked meterstick to measure the length of his or her rod and record theresult on the chalkboard. The students can make theirmeasurements only by estimating the rod's length to thenearest tenth of a meter. This has been a learning experi-ence for many students in both estimating length and un-derstanding the uncertainty that exists as a part of everymeasurement.
The lengths of these two rods cannot be distinguished bymeasurements having only one significant figure. Anothermeasuring instrument must be employed to distinguishbetween them. The teacher can then proceed with the dem-onstration by first selecting students to measure the rods'lengths by use of a decimeter-marked meter stick (two sig-nificant figures) and finally by using a centimeter-markedmeter stick (three significant figures). Only when thelengths are measured to three significant figures can thetwo rods be distinguished.
Some students usually suggest that it would be easier todetermine if the lengths of the rods differ by avoiding mea-surement altogether. By standing the two rods on a tabletop, a person could easily identify the taller rod. Sure, butthis is a measurement. It is the comparison of the length ofone rod with the length of the other rod rather than withthe length of another arbitrary standard. All measure-ments are a comparison of a physical property of one objectwith that of a standard, which will always yield a measure-ment having an uncertainty and a unit. Only counting, aone-to-one correspondence between items and integers,could yield a numerical result without an uncertainty anda unit of a physical quantity.
Upon standing the rods side-by-side on a tabletop, one ofthe rods is perceptibly longer than the other. This demon-stration shows the students how much the lengths of tworods may differ and yet require a measurement of threesignificant figures in order to distinguish between them.Would standing the rods side-by-side be an acceptable wayto determine the longer if one rod were in Memphis andthe other in New Orleans?
Options To ConsiderThe teacher may alter or extend this demonstration.
First, after the students have measured the lengths of thewooden or metal rods to one significant figure. ask them torepeat their measurement by use of an unmarked yard-stick. The class should observe that a measurement ofonlyone significant figure is all that can be obtained by use ofeither of these instruments. but the unit employed to re-cord the measurements will certainly be different. Thedemonstration may be stopped at this point if the singlepurpose is to show that the system of units employed todescribe a measurement does not improve the accuracy ofa measurement.
A second option is open to teachers who feel that theirstudents need a bigger challenge. The teacher can showthe class two new rods side-by-side that have lengths soclose that the class cannot distinguish the longer. Theteacher can ask the class, "Could a measurement havingfour significant figures distinguish between the lengths ofthese two rods?"
Volume 69 Number 6 June 1992 497

Select two students to measure the lengths of the glassrods by use of purchased meter sticks with calibrationmarks at each millimeter of length. The students can swapmeter sticks and/or rods and measure the lengths again.Almost all students need to be instructed about parallaxerrors during this demonstration. If the zero point of themetric rule is not at the ruler's end, or if the end is worn,the students should be reminded that they should not mea-sure a length beginning at the extreme end of the ruler.Students able to measure lengths to four significant fig-ures can show that the two rods do have different lengths.
498 Journal of Chemical Education
KELLEY 24
During these demonstrations students observe that tworods that are obviously different in length are the samelength to one and even two significant figures, but two rodsthat appear side-by-side to be the same length can beshown to have different lengths if measurements of theirlengths are made correctly to four significant figures. Theteacher has several opportunities to teach importantknowledge about significant figures, units, measurements,and the uncertainty of measurements during this series ofdemonstrations.
32

Introductory Laboratory Exercises
som Wells Ro Hinson
s. Lancaster Community College, Clifton Forge, VA 24422
A perennial problem with General Chemistry courses isbow to handle labs during the drop-add period, when class
loge are fluctuating. I wish to describe the exercises we use
be the first two weeks of General Chemistry that minimize
theproblem. As these procedures do not require the use of
individual equipment, student lab drawers are not assigned
j eau( the third week, when enrollment has stabilized. High"loot chemistry teachers might also want to consider thesegurcises since they require minimal equipment and are eas-
t ayadapt,d to suit the instructor.This introductory lab consists of several procedures. Some
ere performed as demonstrations. Others are performed bycoups of two students. In two cases, the exercise requires
data contributed by every class member. The nature of theprocedures also make them serve as an "ice-breaker", intro-deeing the students (and instructor) to one another.
I usually have a computer in the lab on which the data canbe "instantly" reduced and plotted. At the conclusion of theexperiments, each student must presenthis or her data anal-ysis in a brief lab report.
Learning -..ThjectIves
These exercises can be used to fulfill several educationalobjectives commonly found at the beginning of generalchemistry. The student will be able to
me the triple beam and analytical balances.me metric system units of mass, length, and temperature.graph linear relationships and reduce simple nonlinear relation.
ships to linear ones.determine the slope and intercept of a linear graph and extrapo-
late to extreme or impossible experimental conditions,use significant digits properly,tmderstand the relationship between significant digits and the
precision of laboratory measurements, andme computer spreadsheet programs to reduce data and perform
linear regression.
Additionally, these exercises provide material for a review ofalgebra and help students acquire confidence with the met-
system and the chemistry laboratory.
linear Graphs
We start with a selection of simple experiments that pro-duce linear graphs. Using either a physician's scale or abathroom scale. the mass of a student is measured in kilo-grams while holding 2, 3, 5, 7, and 10 copies of the chemistrytextbook. (Choose a volunteer with strong arms, as 10 text-books may weigh 50 pounds!) Plotting the mass against thecumber of textbooks produces a linear graph. The mass ofthe textbook can be found from the slope of the line, whilethe Intercept reveals the mass of the volunteer.
The next experiment gives an estimate for the value ofabsolute zero. A hollow metal sphere filled with air is con-nected to a pressure gauge (Fig. 1).1 A minimum of fourPressure rt.adings are taken at temperatures ranging from 01°1°3 °C. the resulting linear graph of temperature againstPrra.._,.. ore is extrapolated to zero pressure and an estimate for"lute zero is made.
The last "linear" experiment requires taking the tempera-14re of several water baths with both Fahrenheit and Celsiusinermometers. (Ice/salt, ice, cold water, room-temperatureeater, hot water, and boiling water make a convenient range
BEST COPY AVAILABLE22
KELLEY 25
30 mLsyringe
Flgure 1. Pressurevolume apparatus.
. woodenHandle
PressureGauge
Hollow Metal SphereIn Temperature Bath
Figure 2. Absolute zero apparatus.
PressureGauge
of temperatures.) A graphical comparison of the tempera-ture scales is made, and the experimental equation is com-pared to the exact relationship between the temperaturescales.
Nonlinear GraphsWe do two experiments that result in nonlinear graphs.
First we do a P-V plot with data taken from a 30-mL syringeconnected to a pressure gauge (Fig. 2).2 The students are ledto discover that a plot of P against 1/V (or V against 1/P) islinear.
Second, the mass of a series of rubber stoppers (six to eightstoppers ranging in size from 00 to 8) is compared to theaverage of the top and bottom diameters.3 Of course, thestoppers must all be made of the same rubber! A plot of massagainst diameter gives a parabolic curve and the students areled to discover that mass vs. the square of the diameter is alinear relationship.
Absolute Zero Unit. Educational Materials and Equipment Compa-ny, 46 Lafayette Ave., New Rochelle, NY 10801. Available throughSargent-Welch (cat. no. 1602) or Frey Scientific (cat, no. 7536).
2 Boyle's Law Unit. Educational Materials and Equipment Company.Available through Sargent-Welch (cat. no. 10770) or Frey Scientific
(cat. no. 7536).3 Abraham, M. R.: Pavelich. M. J. Inquiries into Chemistry: Wave-
land: Prospect Heights. IL 1979: p 16. This text is a good source forother "guided Inquiry" experiments.
Volume 65 Number 2 February 1988 159

"Scatter" GraphEach student must contribute his/her height in centime-
ters and mass in kilograms to a class chart. The instructor
and lab assistant also participate. A plot of height against
weight usually gives widely scattered points around a trend
toward taller people weighing more than shorter people. All
height and weight data are, of course, anonymous. This,
along with the metric units, has prevented complaints of
embarassment! We also discuss whether other variables,
such as age, should be considered.
Precision of Measurement
A final exercise is performed to give the class a feel for the
precision of laboratory balances. Four objects (a sheet of
filter paper, a ball-point pen, a 100-mL beaker, and a rubber
stopper) are weighed on both the triple-beam and analytical
160 Journal of Chemical Education
34
KELLEY 26
balances. Then all four objects are placed on the pan of
balance and weighed. Everyone in the class uses the idemicji
objects and balances. The class data are pooled and seveN
comparisons are made: The calculated sum of the four*jects is compared with themeasured sum. The average sum
of each object and the average deviation for each is calculi*.
ed. The precision of the triple-beam and analytical balanat
are compared.
SummaryThe use of several short introductory experiments be
allowed us to present meaningful experiences to our gene?*
chemistry students without having to assign lab drawers 1
the first two weeks of the term. These exercises introdam
the students to the metric system, balances, significant dit,
its, graphing, and computerized data analysis.

KELLEY 27
A Paper Vernier Scale for Various Laboratory Equipment .
B. S. LarkGuru Nanak Dev University, Amritsar-143 005, India
Working in the chemistry laboratory and observing thestudents carry out a variety of experiments on simplegraduated pieces of equipment like a buret or cylinder, Isaw the general difficulty students encounter in readingthe level correctly, especially when it lies anywhere be-tween the two graduation marks. The students are cus-tomarily told to ignore the contributions that are less thanhalf the minimum graduation interval andif the intervalis half or more than halfto take a full unit contribution.
Students often reject this idea, nor do I like to stress theconventional process. Often I advise them to guess thefraction of the interval: This is better than ignoring it to-tally or considering it as a full unit contribution. However,this always pricks my sense of precision. So I recommendconstruction of a convenient vernier scale (see figure, parta) made of chart paper. This simple tool can easily improvethe readability of the scale by 10 times and, with extracare, by 20 times or more.
ConstructionAn ordinary 50-mL buret is divided into 50 1-mL divi-
sions, and each 1-mL interval is further divided into 10parts to read up to 0.1 mL. To construct a vernier scale forsuch a buret, take a piece of clean, white, thick, chart pa-per that is tough enough to stand erect and place its onesharply cut edge vertically against the scale of the buret.Then with a very sharp pencil, mark two points on the edgeof the paper to correspond to the nine small scale divisionson the buret.
On another piece of paper a straight line is drawn, andline segment AB equal to the measured length is marked.(If a divider is available, measuring the distance betweennine scale divisions and marking on a line can be achievedeasily). Then starting from the point A, a straight line atan acute angle (preferably between 40 to 60°) is drawn.Either with a divider/compass or pen and scale, 10 inter-vals up to point C are marked (each interval may be 0.5 cm
(a)Construction of the vernier and its use with a buret.
in length). Points B and C are joined; using a very sharp2H pencil, lines parallel to BC are drawn to divide AB into10 parts (figure, part b).
Now the scale is ready. Either on the same paper or aseparate, thick, white, chart paper, the scale is transferredand may even be extended on either side. Then a slit So iscut adjoining the scale (figure, part a). Two more, Si andS2, 2-mm-wide and 5-cm long slits are cut on the paperwith the help of a sharp blade and scale. Slits Si and S2 areused to slip the vernier scale on the buretas shown (figure,part c).
Use
Use of the vernier is very simple. Through Si and S2, itis slid on the buret or the apparatus for which it is made.The level and zero of the vernier scale are made to align bysliding the vernier-scale card gently. Then the lines on theburet scale and the vernier scale that align are noted, andthe reading is taken as usual. A hand lens may be used tofacilitate the judgment of matching the lines.
Application
Various pieces of equipment to which this vernier scalecan be fixed are
buretgraduated cylinderthermometerdilatometergraduated stem of a stalagmometersurface tension by capillary-rise method
Extension of the Scale
Precision can be extended to 0.05 (or even more undersuitable conditions) by dividing a line segment equal to 19intervals into 20 equal parts.
(b)
35
(c)

KELLEY 28
Teaching Dilutions
Lloyd J. McElroyThe Pennsylvania State University Beaver Campus
Monaca, PA 15061
Many branches of sciences use dilutions for laboratoryprotocols. Dilution applications range from diluting stand-ardized stock solutions of various chemicals to proceduresused for counting procaryotic and eucaryotic cells and vi-
rus plaques. Despite-the requirements for a workingknowledge of dilutions, the concepts appear to be difficultfor many students to grasp. However, graphic presenta-tions help students to visualize the dilution process whenpresented along with mathematical relationships. The fol-lowing graphic examples have proven successful in my
classes.
Basic ConceptsThe substance used for diluting is called the "diluent".
Usually, this is water, but it can be any other solvent. Thematerial to be diluted may be another liquid, a solid, sus-pended particles, or cells. Because this material occupies acertain volume itself, the total volume consists of the di-luted material and the diluent. It often is convenient torefer to these volumes as parts. For example, 1 mL of asubstance diluted with 9 mL of water is one part in nineparts of diluent. "Parts" can be milliliters, gallons, or buck-ets, etc. Figures one through four emphasize the basic con-cept that the product (amount/volume )(volume) before di-lution equal the product (amount/volume )(volume) afterdilution. If any three quantities are known, the fourth canbe calculated easily. Therefore, in Figure 1:
Before Dilution
(10 cells/1 mLX 1 mL)
Mt V1Or
After Dilution
(1 ce11/1 mL)(10 mL)
M2 V2
1 mL transfered10 cells IL/
10 cells/mL
9 mL ofdiluentin bottle
each square=1 mL
after
dispersal
I*6.
each mLcontains1 cell or 1/10 of theoriginal sample
Figure 1. A one to 10 dilution with 9 mL of diluent.
Thus, one part containing 10 cells ormolecules, etc. weredispersed evenly, after appropriate mixing, in nine parts ofdiluent. Each part or milliliter in the resulting total vol-ume now contains only one cell or 1/10th of what westarted with; hence, we have a 1:10 dilution. In addition,any fraction or multiple of the one part in nine parts alsois a 1:10 dilution. For example: 0.1 part in 0.9 parts, 0.01part in 0.09 parts, 0.5 parts in 4.5 parts, 2.0 parts in 18parts. All are 1:10 dilutions.
Application of this concept to Figures 2 and 3 gives thefollowing relationships.
Before Dilution After Dilution
Figure 2 (10 cells/1 mL) (2 mL) = (1 cell/1 mL) (20 mL)a 1:10 dilution
Figure 3 (10 cells/1 mL)(1 mL) = 2 cellsil mLX5 mL)( a 1:5 dilution
Serial DilutionsSome applications such as chemical gradients for pro-
ducing standard concentration curves or diluting cell sus-
2 mL transfered20 cells
10cells/mL
diluentoccupies18 squaresor 18 mt.
each square=1 mL
1 cell/mlafterdispersalor 1/10of theoriginalsample
Figure 2. A 1-to-10 dilution with 18 mL of diluent.
1 mL. transtered10 cells
10 cells/mt.
4 4l ofdiluent/tube
111alterdisoersal
fir
2 cells/mL or1/5of theoriginalsample
Figure 3. A 1-to-5 dilution.
36 Volume 73 Number 8 August 1996 765

STEP 1transfer
1 mL
107cells/mL
1:100dilution
99 mL ofdiluent
STEP 2transfer
STEP 3transfer
1 mL 1 mL
11111111 I
1:10.000
dilution
99 mL ofdiluent
STEP 4 STEP s
Tt 0.1 mLiransfe transf r
10.1 mL
1
I I Ar1
1:1,000.000
dilution
99 mL ofdiluent
Figure 4. A serial dilution used with a standard cell count procedure.
pensions for bacterial plate counts, require dilutions to bedone over a series of steps or serial dilutions. This providesincrements or a gradient of the original sample. In Figure4. each bottle represents a 1:100 dilution (one part distrib-uted in 99 parts of additional diluent). However, in a serialdilution, each subsequent dilution becomes a multiple ofeach of the preceding individual dilutions. Therefore, ourbottles, while each being a 1:100 dilution by themselves,collectively will be a 1:100, 1:10,000, and 1:1,000,000, re-spectively, (i.e., 100 x 100 x 100). If we were using this tech-nique to count bacterial cells and our original sample con-tained 10 million cells/mL, then our first bottle wouldcontain 1/100th of the original sample or 100,000 cells/mL.The second bottle would contain 1/10,000th or 1000cells/mL, and the third would hold 1/1,000,000th or 10cells/mL. The increments in this serial dilution are 100 -fold in each step. In some instances, these steps may be toolarge, and intermediate dilutions providing smaller incre-ments are desirable. For example, the standard platecount technique-used for counting bacteria in water sam-ples and other media-allows counting only those Petridishes containing 30 to 300 colonies. This could be accom-plished by doing intermediate 1:10 dilutions. For instance,remove 1 mL from each of the dilution bottles and place it
766 Journal of Chemical Education
KELLEY 29
10 cells in 1 mL
One tenth milliliter removed
contains one cell
Figure 5. Another method of doing a 1-to-10 dilution.
in an additional 9 mL of diluent. Thiswould give us gradient steps of 1:1000,1:100,000, and 1:10,000,000, respectively.However, an easier way would be simplyto remove 1/10th as much from each dilu-tion bottle or 0.1 mL and transfer this toour Petri dishes. This, in effect, is thesame as doing a 1:10 dilution (See Fig. 5).The final diluti9ns i4 our Petri dishpsthen become 10- , 10 , 10-4, 10-5, 10and 10-7, respectively, as shown at thebottom of Figure 4. The number of cells in
our original sample is determined by multiplying the colo-nies that appear on the Petri dish times the dilution to getcells per milliliter. The table shows the relationships be-tween the dilution factor and cell counts.
Dilutions and Relation to Cell Counts
Dilution Colonies Expected Cells/mL in Undiluted Sample
1.400 100.000 10,000.0001:1,000 10,000 10.000.0001:10,000 1.000 10,000.0001:100.000 100 10.000.0001:1.000,000 10 10.000.0001:10.000.000 1 10.000.000
Colonies x dilutions cellsonL in original sample.
Conclusion
The graphic presentationsthe only true way to graspthese conceptshave helped my students visualize what ishappening during the dilution process. instead of justlearning formulas by rote through numerous dilution prob-lems. Innovative laboratory applications will transfer dilu-tion theories into practice.
37BEST COPY AVAILABLE

a
I .
.1*M11,esSO111311111M..---
4.01
p
. a Vt.z
at 12,,,J ...8saleaki f'471kK,1 II-°4-wraimosmallmoaa
r
1
FIND ()IL AP CC PAN rP.ESE kiz.c=-1 ri TECHOLOGY CENTER
r(T " ',/ A r

TTIPCurriculum Implementation Abstract
Name: Linda Rhoden
Internship: Fina Oil and Chemical
School: J.Frank Dobie High School
Primary Subject: Physical Science / Environmental Science
Activities: I. Periodic Table"Who Am I?"puzzleReviewing Properties of Elements / Mixed Sixes, Elementary My DearWatson
H. Monomers and PolymersNaming HydrocarbonsConstructing a Nylon Polymer MoleculePaper Clip Model
M. Recycling"Paper or Plastic?"Recycling Codes and ExamplesPlastic Bag Information Clearing HousePuzzles: Plastic Crossword / Petroleum Scramble
Petrochemical Word Find
IV. Use Your Mind or Lose Your MoneyGame RulesCurrency SheetsNet Profit Sheet
V. Film Line Case StudyWrap It Up Case StudyQuestion Sheet
VI. Control Charting"Are You Out Of Control?"Data TablesGraph SheetsGraphed Data

Summary: These lessons will provide the student with a basic chemical backgroundenabling them to identify patterns within the periodic table, and name andidentify hydrocarbons.
The structure of hydrocarbons will be expanded and applied to theformation of the various types of plastics. This information in turn will beapplied to the recyclability of different plastics.
Critical thinking and problem solving skills inherent to the scientificmethod will be applied to everyday workplace situation .
Resources: Dr. Jose SosaDr. Mark KuchenmeisterLuann KellyGreg KaaseFina Research and Technology CenterHwy 134 @ Miller CutoffDeer Park. Tx
Continuous Improvement of QualityAssociates in Process ImprovementAustin, Tx
Fundamentals of ChemistryThird EditionJames E. BradyJohn R. HalumJohn Wiley and Sons, Inc.
Prentice-Hall Physical Science1988 Prentice -Hall , Inc.
Laidlaw Physical ScienceLaidlaw Publishing, Inc.
The Plastic Bag Information Clearinghouse1817 E. Carson St.Pittsburgh. Pa 15203
40
31

Periodic Table ActivitiesTeacher Notes
Objective: Students will use basic periodic table information to identify patterns in thearrangement of the elements, and use this information to predict and make inferencesregarding the chemical and physical properties of certain elements and families.
Materials: 1. Periodic Table Background Information Sheet2. Puzzle ; Who Am I ?3. Reviewing Properties of Elements on the Periodic Table / Mixed Sixes -
Elementary , My Dear Watson
41,2 t"-

Periodic Table Background Information
By the middle of the nineteenth century, many of the quantitative laws of chemistry hadbeen discovered, which allowed scientists to gather a wealth of empirical facts about thechemical and physical properties of the elements. To make sense of it all, and to use theinformation effectively, the information needed to be organized. In this way, importantsimilarities, differences, and trends can be seen. Finding these relationships can help understandwhy certain elements are metals and others are nonmetals, and why certain elements often form
ionic compounds while others seldom do..Numerous attempts were made to discover relationships among the chemical and physical
properties of the elements. A number of different sequences of elements were tried in search of
some sort of order or pattern. A few of these arrangements came close, in some respects, to ourpresent table, but were in some way flawed, or perhaps presented to the scientific community in
a manner that did not lead to their acceptance.The current periodic table is based primarily on the efforts of a Russian chemist, Dmitri
Ivanovich Mendeleev (1834-1907), and a German physicist, Julius Lothar Mayer (1830-1895).
Working independently, these scientists developed similar periodic tables only a few months
apart in 1869. Because he had the good fortune to publish first, Mendeleev is usually givencredit for the periodic table in which he arranged the elements in order of increasing atomic
weight. He found that similar chemical properties occurred over and over again at regular
intervals.The table that Mendeleev developed is in many ways similar to the one we use today,
however, in our modern periodic table the elements are arranged in horizontal rows called
periods, in order of their increasing atomic number. The fact that it is the atomic number thenumber of protons in the nucleus of and atom- that determines the order of elements in the tablehas very important implications with regard to the relationship between the number of electrons
in an atom and the atom's chemical properties.Elements in the vertical columns known as groups bear similarities to each other and so are
frequently referred to as families. Elements are classified as metals, nonmetals. or metalloids
according to such properties as ability to gain or lose valence electron, electrical conductivity
and luster.Family I-A elements ( Alkali metals) are very chemically active metals, that tend to become
positive ions when they give away their one valence electron. Elements in Family VII-A(Halogens) are very chemically active nonmetals, that tend to become negative ions when they
attract the one additional valence electron necessary to complete their outermost energy level.Elements in Families I-VIII B are metallic in nature , but because the number of electrons that
they can give away varies, these are called the transition metals. Elements in Family VIII -A
(Noble gases) have a very limited degree of chemical activity, due to their complete outermost
energy level.The periodic table is an important tool to chemists and chemistry students, because it allows
us to study systematically the way properties vary with an element's position within the tableand, it turn, makes the similarities and differences among the elements easier to understand and
remember.
42
3(o

Periodic Table Background Information
Practice Exercise 1. Representative elements are K, Cr, Pr, Ar, Al. Family
2. A halogen is Na, Fe, 0, Cl, Cu.
3. An alkali metal is Zn, Ag, Br, Ca, Li.
43
37

as.Pam _ s
Chapter 5 Using Science Skills: Making 4/ferences-
Who Am I?The following chart contains clues about the identities of some of the elements in the periodic
table.
1. Read each description and then identify the area of the periodic table in which theelement would most likely be found.
2. Fill in the appropriate space in the chart using the name of the family or generalcategory of elements.
3. In the next column, write the symbol for the possible identity of the element beingdescribed.
Description Area Bement1. I have very good ability to conduct electricity. I am never foundalone in nature. When I combine with other elements. I usually give -up my one valence electron. I am the only element in my group witha one-letter symbol.
2. I do not conduct electricity and am usually found in the gaseousstate. I do not bond well with other elements. I can be found insome bulbs used in signs.
3. 1 am a gas. but I combine very easily with many other elements. Iusually form ionic bonds. I frequently form a -1 ion in those ionicbonds. I am the lightest element in my group.
4. I am a very tough. durable element. I can give up two electrons.but I sometimes give up more than two when bonding. I am themain element found in steel.
5. I am never found alone or unbonded in nature. I most commonlyform a +2 ion when bonding. I have the second highest number ofprotons in my family.
6. In my family the elements are all metals except for me. I havethree valence electrons.
7. Although I am in a family of nonmetals. I am found as a solid. If I
combine with calcium, two atoms of me but only one atom of cal-cium are required.
8. I usually form covalent bonds. I have five valence electrons. I
have the highest atomic mass in my group.
9. In my family there are nonmetals, metalloids, and metals. I havethe same number of protons as the .surn-of the protons in the twoelements directly above me in the periodic table.
10. Elements in my family usually form covalent bonds. We havetwo fewer valence electrons than noble gases. I am almost twice asheavy as the lightest element in my group.
3a? 44

The six scrambled words in Column 1 fit tint &firth:inn, ordescription given in Column 2 UnscramErre, the, wad aint writethem in Column 3 Then unscramble the circled' 1e3tters in Columna to. find the group containing the. most active. nonmetals.
Column 1 Coiumn.2. Column 3,
,
. .
0 A C An demerit in coal
:
! L I H M
1
E U. A notga.gps.. ' 0
.. X E O. N An.elemarrr nested for burning.
E- I D I N A-halogen..
.
.
F CI R Ammtait,
If I
!
I
Co, U.I
NtI
S,
0 Enepioderwhen dropped'into water.
, I .
Themost active nonmetals are the-
ELEMENTARY, MY D. A ED WATSONFin each clue that you discover,. write: the missing element in theblanks ta.the right. Then to discover tfr missing; word that thechemist said, you must transfer the correct letters ta. the- munbered
1. It is the element in Period 5 ofGrouTVIIA.
2. 'Its atomic_number is 90.
$-.. Its averegeatomic mass is 150..4..
4. It is the lightest metalloid.
5. It is the fourth member of theactinidiEseris&
What did the chemist say to,the first custonnarof the-dee 'Open fur
3
ff. 7
r
T V 1 41 5. 6 7

Monomer / Polymer
Teacher Notes
The term monomer is derived from Mono- one and mer- unit, so one paper clipcan be used to represent a monomer, two paper clips connected a dimer, three clipsconnected a trimer, etc. Joining many clips together in a long chain then represents apolymer .
Polymers vary in the number of monomers required to achieve the desiredproperties for that particular substance. For instance, nylon requires only 50 to 60 adipicacid and hexamethylenediamine monomers to obtain the properties of nylon whichenable it to be drawn into fibers, if more than 100 monomers are connected, the polymerbecomes too viscous to be drawn into fibers. Conversely a minimum of 30,000 ethylenemonomers must be linked into a chain in order for any polyethelyene properties to be
exhibited.To demonstrate the differences among the various types of polymers, chains of
paper clips can be linked together. An additional clip can be attached forming a bridgebetween two of the already existing chains to represent crosslinks. Forming several longchains of paper clips will demonstrate how polymer chains interact. Much like a bowl ofspaghetti, chains are entangled, but are still capable of being individually separated.Crosslinks however, prevent the individual chains from moving independently of eachother.
Silly putty, superballs, golf balls, rubber bands, balloons, punch balls, etc. can beused as examples.
46
40

Monomers / Polymers
Molecules of organic compounds of carbon nearly always have chains of two or morecarbon atoms or rings of three or more. These chains and rings serve as the framework to whichother nonmetal atoms, especially hydrogen but also oxygen, nitrogen, sulfur or any of the halogens,are covalently attached. There are also organometallic compounds in which metal atoms areattached by electron pair bonds.
Virtually all plastics, synthetic and natural fibers, dyes and drugs, insecticides andherbicides, ingredients in perfumes and flavoring agents, and all petroleum products are organiccompounds. The naming of the basic organic compounds composed of carbon and hydrogen atomsonly is based on a relatively simple system of prefixes which indicate the number of carbon atomspresent in the compound, and a formula which then uses the number of carbon atoms, to determinethe number of hydrogen atoms and the type of covalent bond present.
Prefixes ( # of Carbon atoms) Suffixes
Meth- 1 -ane saturated , single bondsCn H2n +2
Eth- 2 -ene unsaturated, at least onedouble bond
Pro- 3
-yneCn H2n-2
unsaturated, at least one triple bondBut 4 Cno H2n
Pent- 5
Hex- 6
Hept- 7
Oct- 8
Non- 9
Dec- 10
For example: Methane Meth- I carbon, -ane CnH2n+2 = CH4C H(2x I +2)
Pentene Pent- 5 carbons, -ene = C51-18C5H(2x5-2)
Heptyne Hept- 7 carbons, -yne CH2n = C7H I 4
C7H(2x7)
47Lit

Name Class Date
Chapter 10Using Science Skills: Applying definitions
Naming Hydrocarbons
Hydrocarbons are compounds made up of carbon and hydrogen. Hydrocarbons called the alkanes
are the simplest hydrocarbons. These compounds are named by using a prefix that tells the number
of carbon atoms they contain and the root "ane."Using the table below, name each of the alkanes that are shown.
H H H H
HCCCCHI I
H H H H
PrefixNumber of
Carbon Atoms
meth- 1
eth- 2
prop- 3
but- 4
pent- 5
hex- 6
hept- 7
oct- 8
non- 9
dec- 10
H
HCHH
H H HI I IHCCCHI I I
H H H
1. 2 3
H H H H H H H H
I IHCCH HCCCCCCHI I
H H H H H H H H
45
H H H H H H H H H H H H H
1 1 1 1 1HCCCCCH HCCCCCCCCH1 1 1 1 1
1 1 1 1 1 1 1
H H H H H H H H H H H H H
6.7
48© 1988 Prentice-Hall, Inc. 2-
Physical Science 417

NameClass Date
Chapter 27Using Science Skills: Developing a model
Constructing a Nylon Polymer Molecule
The molecule in the diagram below is a monomer ofnylon. A monomer is a single unit of atoms
that is repeated over and over again to form a chained molecule called a polymer. In this activity,
you will construct a model of the nylon polymer. All you need to do this is paper, scissors, and a
stapler. Follow the steps listed below and have fun while making nylon.
1. Cut out the rectangular box along the lines indicated in the diagram below.
2. Cut three more rectangular boxes exactly like this one from another piece of
paper.3. Tape the four pieces (the original and three copies) end-to-end. You should have
one long, narrow strip of paper.4. Fold the paper accordion style (like a fan) at the adjoined ends. Make sure your
original is on top and the outline of the atoms is showing.
5. Staple the four folded sections together at each corner. Do not staple over the
outline of the atoms.6. Now cut along the outline of the atoms. Do this slowly and carefully.
7. Unfold your masterpiece. You now have a nylon polymer. Label each atom with
the appropriate symbol.
Cut along this line
1199 Physical Science
Cut along this line
1988 Prentice-Hall, Inc.

"Paper or Plastic?"
Teacher Notes
You may want to introduce this lesson with examples of each of the differenttypes of plastics on your desk, or you may want to give the properties of each type andthen ask students what kind of products might be made from these polymers.
Some examples: teflon tape, milk jugs, stick Crisco container, different brands ofyogurt containers, styrofoam cups, ice chests, Solo (type) cups, pudding and margarinecontainers, Ziploc bags, Saran wrap, Barbie dolls( hair, head, body), clear plastic glasses.
50
"Li

"Paper or Plastic ?"
How do you respond to this question at the grocery store? Which do you choose andwhy? Which choice is more earth friendly?
When a retailer offers its customers plastic bags, it is offering the customers anenvironmental shopping choice. Why? Because plastic bags are friendlier to the environmentthan paper bags.
Franklin Associates, Ltd. compared the environmental effects of producing, using,recycling and disposing of plastic vs. paper bags. The study results may be a surprise.
Plastic releases up to 94%fewer waterbome wastes
Plastic produces 70% feweratmospheric emissions
Plastic generates 80% lesssolid waste
Plastic consumes 40% lessenergy
10 20 30 40 50 60 70 80 90 100
Plastic bags are also more economical than paper bags, and consumers find them handy toreuse and convenient to recycle. Truly environmental shoppers choose plastic!
51

PET - Polyethylene Terephthalatebeverage bottles, apparel, upholstery, films and tapes, tirecord, conveyorbelts, adhesives, recreational items
HDPE - High Density Polyethyleneone gallon milk jugs, pipe and tubing oil cans, housewares(Tupperware), caps and lids
PVC - Polyvinyl Chlorideplumbing pipes, latex paints, flexible film, food wrap (Saran,Handiwrap), house siding, garbage bags, appliance parts
LDPE - Low Density Polyethylenegrocery bags, diaper covers, packaging film, toys
PP - Polypropylenebrushes, carpet, carpet backing, rope, strapping tape, toys, filmsheeting, plastic bottles, rigid packaging, appliance parts
PS - Polystyrenedrinking cups, food packaging, housewares, furniture, appliance parts,electrical components, electronic components, polishes, medical and dentalproducts
Othercream jars, Mott's apple sauce

ears:ag
ercen 4 ....,0,-,,,...?loa012tp,
...,,,,,,,..-- - 4
ping: 071
. ' avitTIPTRI.°'...'
-....4,..,....4;'i,`,.........1T.,,r..
!-z,.!.....70.47: tr.;; 1 .c..2
I.:7
;44'; 0...;': ' w.?.. t;,:.
....-.
. How doesyour shoppingstack up?
-With more choices
than ever in
product packaging
and recycling
it's easy tb getl in the'habil of
shopping environmentally.
ITSUR v
E Y
ChoosingProducts
with

30
2_ PLASTICS
ACROSS
1. A molecule, usually a large one, made of many identical atom groups joined end to end.
6. A plastic used in cooking utensils, with "no-stick" properties.
8. is used in making piano keys and photographic film.
9. A person who creates plastics in the lab.
10. Plastics are made from .
DOWN
2. A tough flexible plastic used in clothing.
3. Molecules in join together in a zigzag chain.
4. Teflon is resistant to nearly all , therefore it is used on containers for acids.
5. Some telephones are made of this polymer because it can be made to "set" in a hard rigid mass.
7. Transparent glasslike plastic. Also, a brand of paint.
2
7
54

Z 0- -4 D N- -1 > r o< to 0 74 rn co co c 74 N CO Cil > X H "o 0 Z >C) g PI :1 .71 Q 2 2 Q Q 8 e S>
n CO C15 D D > > > > DFl rl c: r pg ., :1 ,, ., 0 z r- ..1 ; O^ 52 %) 43 i g 8r -o > < < -i - rA 0 0 cn - < -rt -a -0 > Z O- -1 > rn Z tr1 0 Z 0 A 0 tm= spc m -4 .-.0cntn00>C(;22 82q>>0xq
5i P F 5: 52 P T !. 0 . -1 m r r tii , (-) 0 ...< -ri r 0 M 0 > ^r1 tA 0 Z- M 0 tr1 M X .<(5 Z -I r z w 0 cLI Z .n° r> II 6 Or q g gz m - r X > .--' 0 tTI > C- 7j r -i Z co - > 0 PC CI 0 tr1 r- r z m o 0 rii 0 N H > M (n 4 ...c r zz
[ ..,:l 4 m m .4-1 z -C r- cri Z trf -1 r > x -,0 V, > Z .-C CO "0 v X 0 r M H D r- H0Z 7rirnX-<-1107oZ-i x ro>r .7100C0c,0>rr
> -n O > 3 0 < o H A > > r co r m n r", 7C >
Ozocx>rA A< -0 r r to X 0 (I) 0 Ill 0- 0 .-I V, .-1 .< c).-
,v -I Cl to r Po -0 Z 70 "0 -< X D - -< 70 .-1 x 7:1 -n r X X -i - 0 r-< - > z 0 '51 X ..< 0 r r ti 0 -1 r Z 0 H r - tri < < 0 > to
r 0 to 0 0 rn r -1 tn r 7 : a o rn o - - -< 0 -1 r r M .. -1tA0>-1"v ''' '1" '" Z K K :: 2: 2: 2: 2: C: E: 5: R eq T4 M c; 1
r:1_, >00.-" prriz--('')
ri. . 7 . ,m .... _. .. 4 s 2 r r ,x x z c rn x c) r) x c ) r n - w z o x x c . - < a m r i i NM WZ0.-
En r > ...; :7; .4 11d 1 X 2 (1 3; 2 8 P q 0 5! P 4 E Z - H - rn rn X D X >0-irn 171(AtrIr 0000Z ZMN Xmro0> a C^) M r .< "0 ZZ MI r- 0 > r '6 7,
V, .. 0
> 0
r 0 -I
x 0 >
,:i 0
C..)1 r y 0 rri D< C7 a rn r 0 -0 A z< > r m > y 3 z 3 C)
0 >8 x P gi Fg 1
4Z ;-1 ri 0 70 Z Z- Xi r m H 70 .< .--. 0 -1 r X Z X < 0 V, rii r0 XI ..0 tri r) N 03
< ni 4 (.2 C_< T GO > C 0 Cl' Z -3 0 ,z/ m to r) < .71 m- > m 0 r rn -i 0 = v X a r) - 0rn tn -1
0 Cl'
'11 Z c/1 '-- , 01 I 77 "0 01 0 r rn -c x) K z < - x 01 CO X > .' -- 7U ^-1
- - I r - I p r , 0 - 0 -i Z ro En to tr1 tr1 I v1 > 01 tg Z 70 171 c 4 rn z
> > > c: E; :1 0x col cn
0r coA 4 ! i!
< < (AV)
dn0r1"rCCar0 0 r 7:1
oro. m 0
Ln 21 5 T tn
> 0 > tn pZrrgn
Z v v r trl 01 N3 0 X 0 01 y CA po Z
ro m r X 73 0 Z 0 ny 0 Z -1 r rn r 0 -1 0 > X -n ro y rr x N r ) - - 7 0 rn Z 0 .-I rn X 0 3 X 0 0 : 1 X r -1 rn rn x 0 - X Z C 0 z
>z r 0 - cnr (ACOX '07JOKI.WON>> cn 0 H Z Z (A -, m 74 4rrirr -xZr -1 Z -- 0 m 0 Z - r - 0 to -1 0 > -0 X - X 0 - X rn >
> t - - ^ r 1 0 > r 0 0 < -1 0 -< r > - 1 > A- - ] - i m 0 0 P o - c , -i r P o r0 Z - X 0 - 0 '1, 1:7 - r to < ro -1 > X 0 0 - tr1 0 Z Z 0 n .< n "V C
o o C7 rn 7c z r- N y o (") rn m -n z A Xo z O > "o > Z40-1c- mx>ccrntntlzmoorr>-irn44.< rn
- > r < v r > 0 .< ci) Z L71 X ><
co -c) Or r C -1 -ozzwon>rn 0-1.-100:173171 0,-10X0x 0Z r Z 0 - > Z Z 0 < 0 0 r 0

A
N
0
T
H
A
E
Q
Y N D I 0 T A E W RG H L I T H I G R AD Z I R EMY L
0N
D
E
N
S
Y S T A L X WGNHCC I MNNM T L ADL ES BMED I UMD
G S I L K YO A T R Z Y X WE S T
P
E
T
R P L A S C I ZERI A A Q G S T EY R EN
N I T T U
D Z E 0AS OLUT
A I R A F
H 1 X R
T H Y L EN E OB Z E C
M
A
D MEL DL I T Y
W E C OLDF LOWU I F GHOB OA DP FB SEPLE A R N B A
R POL YED P L INE F F L A
Y ES NO 1 S 0 P R
L SDDHGACCK A F
T 0 P 0
1 S A
Z I
A T lfl N E
T Y
I Y
O A
A
A
C
E R T Y
G HJ ISICIHO R NGO
U
K
G
0
G
G
T E E L T 0
A
O PER PNU 1 H L C AWHN S 1 T Y P W
H N G P C T PGI NHR G H Y H
O T I 0 N IJ M D
R D M O N OMP EONEN
E WA T E
T A C T I C A I
A T 0 N
X Z 1BT FL Y00 A K MOO
O R A E C A
0
Z X X
D
TH Y L ENI T 0
E
0W
R
B
0
H
0
L
0
G
O Y
T C
T 0
A DD I T I V
M
R O T C A E R P 0 R
V N Y
OS P ER ER T T C V
M A
ceprF
A N
O W D E N S I
NCI-I I N G I L
X TRUS ION10X IDA N TS
LM
O
L
0L N O G
DOM
D S A
O L Y PROP YLENADDITIVESAMORPHOUSANTIOXIDANTSASPHALTASPHALTENEATACTICATMOSPHEREBIMODALBOILING POINTCARBONCATALYSTCOLD FLOWCONDENSATIONCROSSLINKEDCRYSTALDEVOLATILIZATIONDISTILLATIONETHYLENEEXTRUSIONFIBERFILMFLUFFFRCGEL
GOGGLESGPCHEXANEHIGH DENSITYHIGH IMPACTINHIBITORSISOPROPYLISOTACTICLANDFILLLINEAR LOW DENSITYLITHOGRADEMEDIUM DENSITYMELTING POINTMETALLOCENESMINERAL OILMOLECULAR WEIGHTMONOMERMORPHOLOGYNAPTHAPARAFFINPELLETSPETPLASTICPLASTICIZER
POLLUTIONPOLYETHYLENETEREPHTHALATEPOLYMERPOLYPROPYLENEPOLYVINYLCHLORIDEPREPOLYMERIZEPROPYLENEPVCQUENCHINGREACTORRECYCLEREGRINDRUBBERSOLUBILITYSTEEL TOESSTYRENESYNDIOTACTICTOWER BOTTOMSVISCOSITYVULCANIZEWASTEWASTE WATERWAX

Use Your
- or -
Lose Your
M=11-..
An Exercise in Deductive Reasoningand Industrial Success
57

Use Your Mind or Lose Your Money
Objective: Students will use their critical thinking and problem solving skills to predictthe each number in a sequence. Cooperative learning And delegation skills will also bepracticed as students interact to determine which choices will enable them to make thebest use of their money.
Materials: I. Currency2. Net Profit Sheet3. Background and Rules Sheet
Teacher Notes
1. Make copies of currency , cut currency into individual pieces and put into groups of$10,000.00 each, place Group # on each packet of " operating capital."
2. Determine the number of groups desired per class ( 3-4 students per group is asuggested number), assign students to a numbered group , and give each group their"operating capital" packet.
3. Determine the number sequence ( or sequences, if you want the game to be trulychallenging for ALL class periods.) For example: 1,6,11,16...( adding 5 to eachprevious # ), or 36,49,64, 81 .... ( number multiplied by itself.)
4. Instruct each group to select a spokesperson to inform the CEO of the team'sdecisions concerning the appropriation of their funds, or to obtain a loan.

Use Your or Lose Your
The object of the game, as in most of life's games, is to outwit yourcompetitors and end up with the most money.
Your Company owns a large polypropylene plant, whose profits have been less thansatisfactory. The Board of Directors has determined that the technology presently used
must be updated or modified in order to increase profits, and thus keep the plantoperating.
A team of engineers believes it has developed technology ( represented by the correctnumber sequence) that will be successful and profitable. A problem in the sequencing,
however could prove disastrous.Your mission, should you decide to accept it, is to try to determine the correct sequence
of numbers which would then enable you to implement the new technology , thus keepingthe plant running and making you wildly rich.
Rules of the Game
1. Each group will be given $10,000 operating capital and the first number in thesequence.
2. The game will be composed of ten rounds. In each round you may allocate yourfunds in the following manner.
a.) For $1000.00 you can do Research and Development and obtain the nextnumber in the sequence.
b.) For $2000.00 you may run a Pilot Plant study, were you must predict the nextnumber in the sequence.
If your prediction is correct your profit is $10,000.00If your prediction is incorrect:
by 1 ---- A pump failure has occurred, costing you an additional $1000.00
by 2 Your raw materials were contaminated, and it will cost anadditional $3000.00 to purge the system
by 3 ---- An air leak oxidized your product, rendering it useless Sinceyou cannot sell the product, you have lost an additional $7000.00.
59

by more than 3 ---- The workers have gone on strike. New workers had tobe hired. The downtime cost plus the cost of training the new employees requires anadditional $15000.00.
c.) For $5000.00 you can do a full scale plant run, in which you must predict the next
correct number in the sequence.If your prediction is correct, your profit is $30,000.00If your prediction is incorrect, a runaway reaction has occurred. The entire
reactor overheats, and a total plant shut down costs you $60,000.00
The company with the greatest financial gain at the end of the first quarter( 35 min.)
will win the game and be given a BONUS !
**** In the event that you've been ill advised, and your capital is depleted, loans are
available from the CEO of your competitor company in increments of$10,000.00 at
10% interest.****

o
?.Thz,
g,.
,
41110111;*'
^cf
',;"
f<r'
*"
4'41%1"
-;
pin
t_
4tiptd!';;;
'st"..`

BEST COPY AVAILABLE

Net Profit Sheet Group Number
Prediction Actual # Prediction off by Profit Loss Loan + Interest Total
Wrap it Up
A Film Line Case Study
Teacher Notes
Objective: Utilizing comprehension and retention skills, students will demonstrate abilityto differentiate between factual information and personal interpretation ( inference.)
Materials: 1. Wrap it Up - A Film Line Case Study2. True / False Question sheet per student and per group
Procedure: 1. Pass out Case Study sheet to each student and allow approximately one totwo minutes to read the case study.
2. Take up Case Study sheet and distribute the True / Fault Question.
3. After students have answered all the questions individually, place thestudents into groups of three or four, and have them fill out another True/Fault Question sheet as a group.
****You may want to make a transparency of the answer sheet, and onceagain answer each question as a class. This will enable each group toexplain the reasoning they used to come to their conclusions.

Film Line : Case Study
The film line was in operation. The technician was checking thecontinuous pellet feed. Joe started the film on the roller. The film wastested for the presence of undesirable gels. Twenty gels were found on
the film . Test results were then reported back to the supervisor.
S?

1. Joe started the film line. T F
2. The technician was a man. T F
3. The technician's name is Joe. T F
4. Joe tested the film for undesirable gels . T F
5. The film contained gels. T F
6. The technician stopped the film line once thesample was obtained. T F
7. The film was made from a polymer. T F
8. Gels were found on the film at a ratio of 20 per foot. T F
9. The film was rejected because of the gels. T F
10. Joe reported the test results to the supervisor. T F
11. The story contains a series of events in which onlythree persons are referred to, Joe, the technicianand the supervisor.
66
6v

Are You Out Of Control?
Objective: Students will demonstrate the ability to graph data, determine average values,and use formulas to calculate Upper and Lower Control Limits. Students will interpretand evaluate data to determine the stability of a process.
Materials: 1. Background and Procedures sheet.2. Data tables3. Graph sheets

Are You Out of Control?
A control chart is a statistical tool used to distinguish between variations in a process due to commoncauses , those causes that are inherent in the process over time, affect everyone working in the process,
and affect all outcomes of the process, and variations due to special causes, those causes that are notpart of the process all the time or do not affect everyone, but arise because of special circumstances.
A process, which has only common causes affecting the outcomes, is called a stable process or onewhich is in a state of statistical control. A stable process implies only that the variation is predictablewithin bounds. A process, whose outcomes are affected by both common and special causes, is called an
unstable process. For an unstable process, the variation from one time period to the next isunpredictable. As special causes are identified and removed, the process becomes stable.
To determine a special cause (an out of control system), one of the following criteria must be met.
1. A single point is outside of either the UCL or LCL.2. A run of eight or more points in a row above or below the center line (mean).
3. Six consecutive points increasing ( trend up) or decreasing ( trend down).4. Two out of three consecutive points near (outer one third) a control limit.
Rom ok e.4.Y D fyoI
I. A strytie point cookie thecontrol &else.
5. Six eornonsUve pointstracreuleg (trend up) or6axessing (trend doe o).
2. A rundoes, (II) or mompoints in row Sim. (orbelow) she ottueane.
4. T000ut or duet eoeseordee points taco (outer one.third) a coned Ikon
The Maintenance Department in a large polypropylene film production plant began a quality
improvement program. Initial efforts focused on improving processes to increase production of a quality
product. After obtaining and analyzing data for one month , the three major problem areas targetedwere, stockouts, parts breaking, and performance failures.
The data listed on the following sheet was obtained during the next month.
Procedure: For each set of data1. Construct a line graph of the data2. Calculate the MR ( moving range) [ Formula given in table]3. Calculate X average ( the mean ) [ Sum of all the data divided by the number of data
points]
4. Calculate the MR average [ Sum of all the MR values divided by the number of MRvalues.]
5. Calculate the UCL ( Upper Control Limit) [ Formula given in table.]6. Calculate the LCL ( Lower Control Limit) [ Formula given in table.]
Conclusion:
1. Were any special cause situations present on your graph?2. Give two reasons why your graph did or did not have a special cause situation.
3. What is the name given to factors that affect the outcome of an experiment?
4. Are there any manipulated variables present?5. Why are days plotted on the x axis ?6. Why are the repairs/types of repairs plotted on the y axis?
268

Day # of repairs MR1 2102 204 63 220 164 223 35 200 236 120 807 230 1108 181 499 196 15
10 224 2811 230 612 105 12513 227 12214 198 2915 250 5216 275 2517 270 518 96 17419 218 12220 188 3021 205 1722 230 2523 180 5024 110 7025 210 100
X avg 200MR avg 53.4
UCL 342LCL 58
Day parts breaking MR1 102 18 83 11 74 8 35 14 66 8 67 21 138 16 59 12 410 18 611 10 812 8 213 36 2814 27 915 22 516 35 1317 40 518 5 3519 11 620 9 221 5 422 19 1423 20 1
24 9 11
25 8 1
X avg 16MR avg 8.4
UCL 38
69
to-3
Day1
2
stockouts57
MR
23 3 44 11 85 0 116 2 27 9 78 1 89 4 3
10 12 811 8 412 5 313 2 314 0 215 3 316 7 417 9 218 2 719 6 420 2 421 6 422 8 223 3 524 5 225 5 0
X avg 5MR avg 4.3
UCL 16LCL -6
Day1
2
performance failures23
MR
1
3 3 04 5 25 3 26 0 37 0 08 7 79 1 610 3 211 7 412 2 513 0 214 2 215 4 216 4 017 1 318 0 1
19 6 620 3 321 1 222 5 423 4 1
24 3 1
25 6 3X avg 3
MR avg 2.6

Day failures MR (absolute value of Day1-Day2, Day 2-Day 3, etc.)_performance1 22 3 .
3 3
4 5
5 3'6 0
7 08 79 1
10 3
11 7
12 213 0
14 215 4
16 4
17 1
18 0
19 6
20 3
21 1
22 5
23 424 3
25 6
X avgMR avg
UCL = Xavg + (2.66 x MRavg)LCL = Xavg (2.66 x MRavg)
70

performancefailures
IVA.a)

Day parts breaking MR (absolute value of Day1-Day2, Day 2-Day 3, etc.)1 10 -
2 18
3 11
4 8
5 14
6 8
7 21
8 16
9 12
10 18
11 10
12 8
13 3614 2715 22
16 35
17 40
18 5
19 11
20 9
21 5
22 19
23 20
24 9
25 8
X avgMR avg
UCL = Xavg + (2.66 x MRavg)LCL = Xavg - (2.66 x MRavg)

0 1
2
3
4
5
6
7
8
9
10
11
12
0. 13
14
15
16
17
18
19
20
21
22
23
24
25
O F1;
parts breaking N O O 01

Day stockouts MR (absolute value of Day1-Day2, Day 2-Day 3, etc.)1 5
2 73 34 11
5 06 27 9
8 1
9 4
10 1211 8
12 5
13 214 015 316 717 918 219 620 2
21 622 8
23 3
24 525 5
X avgMR avg
UCL = Xavg + (2.66 x MRavg)LCL = Xavg - (2.66 x MRavg)

1
2
3
4
5
6
7
8
9
10
11
12
14
15
16
17
18
19
20
21
22
23
24
25
Stockouts O iv 4. cn co 8 F.1
ID?

Day # of repairs MR (absolute value of Day1-Day2, Day 2-Day 3, etc.)1 2102 2043 2204 2235 2006 1207 2308 181
9 19610 22411 23012 10513 22714 19815 25016 27517 27018 96
19 21820 18821 20522 23023 180
24 110
25 210X avg
MR avgUCL = Xavg + (2.66 x MRavg)LCL = Xavg (2.66 x MRavg)

350
300
250
0 20
0_ a. C) 0
150
100
50 0
Rep
airs
vs
Day
s
80
NC
r)la
CD
tC
OCA
0r
Nc)
..
Day
s
11)
CD
N-
CO
CA
0 NN
NC
ONT
rN
NN
81

12 10
8 6 4 2 0
Per
form
ance
failu
re v
s da
ys
111
Cc)
Nt
CD
CD
N.
CO
0)0
ecv
Nt
111
CD
r-C
O
days
0C
7Icv
CI)
Cod 83

45 40 35 30
a)
25
a)
20a.
15 10 5
Part
s br
eaki
ng v
s da
ys
AA
I ka W
anI
I I
I I
I I
I I
I la
IIIM
IIIIM
EM
INuM
biss
Maz
darv
AiN
is
EM
IA
MM
1111
1PIII
MM
Imm
i
IIIIM
IMIII
MP
AIII
NV
IMIN
111
MIll
v..-
.1.
,wr
N M
'1'
1.0
CD
coa)
or-
N T T
1".
days
LO
CO
rC
O0
0N
LO
1.C
I;N
NC
VC
V

350
300
250
co 2
00
a. 0 t 150 10
0 50
Rep
airs
vs
Day
s
rim
=pu
nup
mpg
EN
NE
-mm
-ros
stas
ME
NIU
SIp
iala
ilE
zzaw
omon
aram
mas
susi
smos
sora
v11
111N
imm
Em
iNE
E
tuirt
yum
;
86
0N
Day
s
tf)C
DN
-C
O0
0 T
NC
'e)
:1'
NN
N N
NC
g
C3L
12-)
X A
9.(z
oo)
Le-L
- (5
8)

20 18 16 14 12
(s) Y 1
0O co
8 6 4 2 0C
V
88
Sto
ckou
ts v
s D
ays
CA
CO
coC
D0
0103
V'
Day
s
Ul 1
CO
030)
O
061.
-C
IO
)(av
g.65
)
LC
-L. (
o)C
I;C
M01
CV
CV
89

Norene Rose FlahertyScience
J.L. Long Middle School, Dallas ISD
Texas Utilities Electric, DallasOr lan Ihms, Mentor
Dallas USI GrantBetty Fisher, Coordinator
90BEST COPY MLA L

TTIPCURRICULUM IMPLEMENTATION PLAN
Abstract
NAME: Norene Flaherty
INTERNSHIP: TUElectricOrlan lhms, Mentor
SCHOOL: J. L. Long Middle School6116 Reiger, Dallas, Texas 75224214-841-5270
PRIMARY SUBJECT: Composite Science - Science I I
COMPONENTS:
SUMMARY:
Program Overview - Energy Production and Useof Non-Renewable Fossil Fuels and TheirEnvironmental Impact
COAL - Cycle of Lignite - Collecting Data From a VideoGrouping/Assigning Grades/TipsCOAL Surface Mining i n a SuitcaseCOAL Testing Fly Ash i n Concrete for StrengthACID RAIN - Industrial Cleaners and How They OperateACID RAIN - Simulating Electrostatic Precipitators
and Wet Scrubbers i n the ClassroomWILDLIFE - Counting Texas Bald Eagles
A global preparation based on Energy Production, Use,and Conservation of both Non-Renewable/Renewableresources reflecting responsible environmentalimpact by an energy company. Components areexcerpts from broader units that include readings,other labs/activities and supportive materials.Additional units covering Electricity, Heat Transfer,Wetlands, The New Environmentalists are underconstruction. Also, units on renewable energyare near completion. Available i n DISK and hardcopy.
MAIN RESEARCH Varied TU Employees and their areas of expertiseSOURCES: Edison Institute(See Itemized Resources from the Internetlist submitted) TUElectric Educational Materials
State of Texas Office of A i r QualityTexas Parks & WildlifeEnvironmental Protection Agency

THE CYCLE OF LIGNITESTUDENT ACTIVITY
There are many and varied uses for the video, The Cycle of Lignite withinthe curriculum. Following are some - you will probably think of manymore based upon your own unique teaching style.
MaterialsVideo - The Cycle of Lignite - 19 minutesStudent list of 60 questions divided into six segments that includehistory, pre-planning for environmental impact, mining and reclamation,using coal to generate electricity, finding uses for coal byproducts andimpact on the community.Teacher Strategies and keySurface Mining Suitcase LabGrading SheetTips/Strategies
Research - collecting data1. Lead into video by asking the question "Where Does Electricity Comefrom? Find out what students already know. Explain that they will seean example of a Texas company that produces electricity and also protectsthe environment as the process occurs.
Tell them that they will collect data that will assist in answering thequestion and make them more knowledgeable about Texas coal mining.
In a class of 30 students, give each student two questions. Makecertain they are given at random from different categories. They coulddraw two numbers out of a "Genius Hat". Their responsibility is to thenwatch the video and write down the answers to their questions. They willshare with the class. As they share, other students write down theiranswers and teacher can fill in more information and generate discussion.Students are told they may answer other questions as well but must beprepared to discuss those they are responsible for.
Post Video SuggestionsWhen all questions have been answered, follow with a Science/Arthomework lab in which students must use their "research" material to
92SI

draw the Cycle of Lignite. This can be a -multi-day assignment.
2. Divide students into teams and make them responsible for collectingdata in one of the six areas of the video - they then must choose a method
of exhibiting and reporting their data.
3. Teacher shows video but stops after each segment. Questions arediscussed as a lead in for simulation labs on cleaning air, water and land
available in other segments of the curriculum.
4. Divide students into teams and have them identify places and functions
as outlined in the "Suitcase". Have students use lab sheet as a guide.
5. Divide your students again and have them use productive thinking tofill a paper with the many, varied and unusual careers found in the mining
industry.
6. Divide your students into teams and using the resources above, ask
them to solve the following problem:
You have been selected as a team to open and manage a new coal
mine. Planning, as you have been told, is essential. Expand your ideas by
I. Developing a plan-Have them develop a graphic organizer2. Discuss as a team what you've planned3. Create a master list of materials you will need and4. Steps you will take5. Draw some conclusions about the challenges of modern
mining
7. Use the following posters from the National Energy Foundation for
more ideas and for display in the classroom.
From the Mine to My HomeCoalCoal Technology, The Future i s Now
8. Use as display the TU poster, Electricity From Lignite Coal
Cycle of Lignite Video and Surface Mining Suitcase provided by
Orlan lhms, TU Electric, Educational Services

THE CYCLE OF LIGNITEENERGY AND THE ENVIRONMENT
THE HISTORY OF COAL MINING IN TEXAS
1. This occurrence takes place in East Texas home tofarmland and lush pine
2. Each is a visible valuable
3. Beneath the land are invisible resources such asnatural gas and .
4. The most plentiful type of coal in Texas is ; it is soft andbest used for generating electricity.
5. The history of coal in Texas starts in 1926 when it was first mined inMalakoff.
6. Soon after, was found to be cheaper to burn asfuel for electricity so coal was no longer used.
7. The Sandow mine was opened in
8. The Sandow mine did two important things. It trained keyand developed new
9. Oil and gas prices rose sharply in
10. In Big Brown Mining and Power and Plant was opened.It was the first modern plant in the state of Texas.
11. Mining lignite temporarily disturbs the natural cycles ofand
94

THE FIRST RULE OF INTELLIGENT TINKERING I S TO SAVEALL THE PIECES, Aldo Leopold
PLANNING THE ENVIRONMENT
12. TU decided to try planning that would disturb the land least this
made good and sense.
13. In the year a new environmental program began.
14. What type of educational background did the new Director have?
15. What did the company do to protect the environment?
16. Could anyone predict what impact the mining of coal on thesurrounding area would do to air, land and water?
17. When did the company want to find the answer to the above question?
18. What was the first step in planning for protection of theenvironment?
19. The studies and actual work to find out was done by
20. Studies covered grasses, impact on trees and how quick animalsland.
21. Dr. Frank Horn from Texas A & M University studied grasses andlegumes and developed good winter ground cover to prevent soil erosion.He discovered that and
were the best answers to the problem. This was a tremendous advantageto farmers and ranchers.
95gcl

22. What was the major concern of the farmers and ranchers?
23. The reclaimed land is helping produce 2 to 3 times more _______per acre.
24. Mr. Casey can now put __ _head of cattle where once the land couldonly support . More grazing is available in the so hisfeeding bill is
25. Mr. Utley believes the reclaimed land is __% better thanwhen they first started mining.
MINING AND RECLAMATION
26. Putting land back the exactly the way it was isn't always theway. Scientific research has suggested better ways.
27. Ponds are built to monitor the quality of ______.
28. The ponds eventually are to provide watering sites forand
29. Two other important reclamation activities are establishingcorridors and trees.
30. In the last ten years over acres have been mined andreclaimed.
31. Over tons of lignite have been mined.
32. This is equal to barrels of oil.
33. Lignite has remained a more fuel for generatingelectricity.
34. In Martin Lake as in other mining operations in Texas, a hugh draglineremoves the top layer of earth called the

35.. The hugh dragline bucket scoops up to cubic feet at atime.
36. The cross pit spreader saves the company of dollars peryear.
37. Small haul trucks carry over tons of coal.
38. Coal is then transported to the plant by ____or ______.
39. The overburden is replaced and then the land isreplanted with grass and reforested.
40. The land is revegetated within __ __year; for the next ____ _
years the company maintains and monitors the land. Only then is themining cycle complete.
CHANGING COAL TO EFFICIENT ELECTRICITY
41. To burn lignite, first it must be and into thefurnaces.
42. The furnace heats a boiler creating
43. The steam turns Hugh turbine generators, producing
44. The steam is then cooled and condensed with circulatedfrom a reservoir/lake built by the company.
45. Electricity is sent to giant out intolines and then out to customers and businesses over one third of Texas.
46. Burning coal is not a clean process. Burning coal gives offand
47. To protect the air, filter out thefly ash.
48. On newer units, remove sulfur dioxide from the
combustion gases.
9 7

FINDING NEW AND BETTER USES OF COAL RESIDUE
49. Industry is finding new and better ways to use a part of the coalthat normally would contaminate the air. It is calledand is sold as andmaterials.
50. At Martin Lake, scrubber residue is processed into andused to manufacture wall board for the construction industry.
51. The generating process is not complete until theand are safe and productive.
A POSITIVE IMPACT ON COMMUNITY
52. The most important cycle remaining is the impact of Lignite on theof Texas.
53. The most obvious benefit is cheaper
54. In the first fifteen years the Lignite operation has saved customersover dollars.
55. Lignite facilities also benefit economies and helpgenerate important tourist dollars.
56. When mining first started out in Rusk County, East Texas there wassome initial
57. The mining facility provided jobs, ________becameinvolved in the community and paid over
in taxes.
58. For two counties and three school districts, the mining facility paidover which was a great impacton the economy.
98
87

59. The superintendent of Tatum Schools indicated that studentpopulations doubled when the mining facility was built and employees
arrived. The tax base increased . All new schoolbuildings (state of the art design) have been built andand have rapidly increased because of the backingof TU.
60. The and __.These cycles ofman and nature work side by side while TU Electric provides the energyneeded for all.
99
$8

KEY FOR CYCLE OF LIGNITE
THE HISTORY OF COAL MINING IN TEXAS
1. cattle, forests2. resource3. oil, natural gas and coal4. lignite, low heat5. 19266. natural gas
PLANNING THE ENVIRONMENT
7. 19538. personnel, develop new modern technology9. 1970's10. 197111. land, water and air
12. environmental business13. 197014. Biologist with extensive experience inconservation.15. develop a new set of technologies16. no17. before they became problems18. a committee of environmental experts fromvarious Texas universities were hired tosupervise the program19. graduate research students on fellowshipsgranted by TU20. naturally return21. coastal bermuda and crimsom clover22. worried about restoring the land to its originalvalue23. pounds of beef per acre than previously24. 3, 1, winter, less25. 100
CHANGING COAL TO EFFICIENT ENERGY
41. crushed and blown42. steam43. electricity
MINING AND RECLAMATION
26. best27. water28. domestic stock and wildlife29. wildlife and reforested30. 20,00031. 300,000,00032. 700,000,000,000 of oil33. economic34. overburden35. 10036. millions37. 13038. truck or train39. recontoured40. one, five
44. water 47. elec. precipitators45. transformers, transmission lines 48. scrubbers46. sulfur, ash
FINDING NEW AND BETTER USES OF COAL RESIDUE
49. fly ash, concrete additive, road bed materials 50. gypsum 51. air, water and land
A POSITIVE IMPACT ON THE COMMUNITY
52. people53. electricity54. 4,000,000,00055. local56. opposition
57. 1900, employees, 2 million dollars58. 9 million dollars59. 10-fold, test scores and achievement scores60. community, power and environment
100
89

MINING IN A SUITCASESTUDENT ACTIVITY
Scope &Sequence: I V Classify resources as renewable and non-renewable
I I I Evaluate positive and negative effects of man ondifferent environments
TEK: 13 Research historical data and determine pastpractices that have impacted current resourcedepletion.
Materials: Suitcases containing a I I of the elements demonstratingthe process of coal mining and reclamation.
3 Part guide to assist students i n observation andrecognition
Notebook paper for RecorderDictionaries
Teacher Preparation: Prepare historical readings to discuss withstudents the negative impact coal mining has had on people and theenvironment in the past. Highlight negatives.
Create groups and give each student i n the group a task. Giveeach Recorder a sheet of notebook paper and ask them to draw a linedown the middle. On the top have them write Negative on one side,Positive on the other. Tell the groups that the class will be having adiscussion about what coal mining was like in America prior todevelopment and application of modern safety and reclamation techniques.Their job is to recognize and write down during the discussion, anypositive or negative aspects of coal mining.
Ask the students, what do you know about coal mining?Discuss and measure their knowledge level correct any misconceptionsthey may have and begin to discuss and feed them the historicalinformation. Remind them to take their notes and encourage the groups tolisten and help the Recorder.
10.E
9/

When you feel the groups have enough information, remind thestudents of the Cycle of Lignite film they viewed. Now, based on memoryand the discussion of the film and their note sheets taken during the filmhave the groups write down any Negative or Positive aspects of how theymine coal today. By this time, they should have a pretty good idea of howthings have improved.
Make sure each group has a suitcase and a lab sheet. Ask whatthe suitcase represents. Tell the students it is called a Surface MineModel and there are three parts to it, the Pre-Mine Area, the Mining Areaand the Post-Mine Area. In each area are numbered flags. The studentsare to label the activity in each area by number.
As groups finish, ask them to answer the following questions:Although group discussion i s fine to come up with answers. each
student must have his own answer sheet for the Post Lab.
I. Give the names of at least three types of equipment used in coal mining.
2. Analyze the data from the positive and negative sheet and give a groupopinion as to whether you believe its okay to mine coal as long as the landis replaced in better condition than it was before the mining took place.Give three reasons why you believe your opinion is correct.
3. Tell why your group would or would not be workers in the coal mines of
long ago.
4. Define surface, geology and overburden. Use your dictionaries.
5. Name three different kinds of careers available duringPre/Mining/Mining/Post Mining that are connected to taking care of theenvironment.
102
9-2

MINING IN A SUITCASESTUDENT ACTIVITY LAB SHEET
PRE-MINING
ACTIVITY
A. DRILLING FOR GEOLOGY INFORMATION
B. CLEARING AND WALKWAY PREPARATION
ACTIVE MINE AREA
FLAG NUMBER
ACTIVITY FLAG NUMBER
A. DRAGLINE REMOVING OVERBURDEN
B. LOADING LIGNITE INTO HAULER
C. HAULROAD
ACTIVITY
A. SOIL LEVELING
B. PLANTING
C. RECLAIMED AREA
POST MINING AREA
103
FLAG NUMBER

COAL - STUDENT ACTIVITY 3LIGNITE & BOTTOM ASH & FLY ASH, OH MYlttttI
Scope & Sequence:
Materials:
Safety:
Evaluate positive and negative effects of manon different environments
Classify non-renewable resourcesIdentify common elements
Practice Math/Science TAAS skillsMeasuring/Weighing/Scientific Process
Samples of lignite coal, bottom ash and fly ashCement mixed SakreteWaterPaper cups and large spoons/scoopsPaper towel holders o r molds 1 xl xl 2Large cement blocks with openingsWeights (bricks/regular weights at least 5 lbs)Safety data on fly ash
Follow safety rules cement/fly ash - wear masksalong with eyewear, aprons - spray fly ash withmisting water bottle - discuss safety
Teacher Preparation: This i s an extended lab - set up a place i n classto store samples until they dry and are ready to test. Test outside. Make sureyou have plenty of newspapers spread on tables or floor before beginning lab.
Divide students into groups of four - designateresponsibilities (a safety monitor is suggested). Give each group portions ofcement mix, ash, water and molds/tubes. Have several balances at stations forstudent use.
Pre-Lab: Using the samples of coal and ash, ask students what it is. Ask, Doyou know what happens to coal after it is burned to create electricity? Explainthe element forms (gas) that become part of air as well as the solids left behindafter coal burning. Explain that coal residue (fly and bottom ash) is recycled.Ask students, Does anyone know what fly ash is used for? Explain that powercompanies supply fly ash to cement manufacturers extending/strengthening theproduct. Tell them they will be testing this idea to see if it is true; they willalso have an opportunity to develop a sample of their own.
Work with students to help them develop a grouphypothesis based on which cement sample would support the most weight. Help
them design a procedure for testing based upon the following information:
1049s
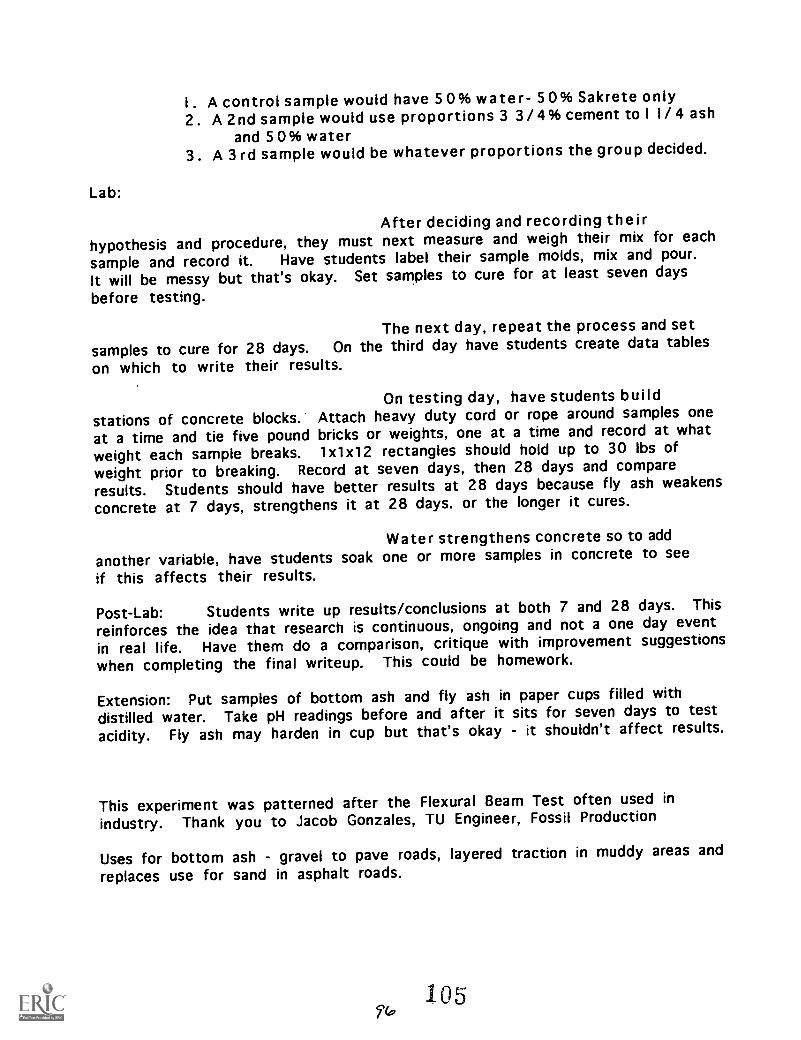
I. A control sample would have 50% water- 50% Sakrete only2. A 2nd sample would use proportions 3 3/4% cement to I I/ 4 ash
and 5 0% water3. A 3rd sample would be whatever proportions the group decided.
Lab:
After deciding and recording theirhypothesis and procedure, they must next measure and weigh their mix for each
sample and record it. Have students label their sample molds, mix and pour.
It will be messy but that's okay. Set samples to cure for at least seven days
before testing.
The next day, repeat the process and setsamples to cure for 28 days. On the third day have students create data tables
on which to write their results.
On testing day, have students buildstations of concrete blocks. Attach heavy duty cord or rope around samples one
at a time and tie five pound bricks or weights, one at a time and record at what
weight each sample breaks. 1 xlx12 rectangles should hold up to 30 lbs ofweight prior to breaking. Record at seven days, then 28 days and compare
results. Students should have better results at 28 days because fly ash weakensconcrete at 7 days, strengthens it at 28 days. or the longer it cures.
Water strengthens concrete so to addanother variable, have students soak one or more samples in concrete to seeif this affects their results.
Post-Lab: Students write up results/conclusions at both 7 and 28 days. This
reinforces the idea that research is continuous, ongoing and not a one day eventin real life. Have them do a comparison, critique with improvement suggestionswhen completing the final writeup. This could be homework.
Extension: Put samples of bottom ash and fly ash in paper cups filled withdistilled water. Take pH readings before and after it sits for seven days to testacidity. Fly ash may harden in cup but that's okay - it shouldn't affect results.
This experiment was patterned after the Flexural Beam Test often used inindustry. Thank you to Jacob Gonzales, TU Engineer, Fossil Production
Uses for bottom ash gravel to pave roads, layered traction in muddy areas andreplaces use for sand in asphalt roads.

STUDENT LAB SHEETLIGNITE, ASH OH MY!!!
Problem: Given cement, water and fly ash, can we make aproduct that can hold 30Ibs of weight?
Hypothesis:
Procedure:
Create your data table here
106
97

Results/Conclusion
I did/did not like this labbecause
If we could have
it would have been a better experimentbecause
Score: Teamwork Quality of work
I havelearned

STUDENT ACTIVITY 4 A CLEAN SWEEPIIttt
MINI LESSON - Match types of Industrial Cleaners to Operating Function
Scope & Sequence:
Materials:
Teacher Preparation:
Evaluate positive/negative effects of man ondifferent environments
Classify non-renewable resources
Envelope with pictures of four cleaners andSeparate discriptions of each cleaner - per groupGlue sticks/sissors/map colors/markers/rulersPens/pencils/3-4 sheets of colored unlined paper
Prepare one envelope per group containing cut uppictures of four cleaners and cut up descriptions ofeach along with sets of materials as listed above.
Pre-Lab: Show picture of cyclone cleaner - ask students what they think itisand what it does. Explain that it is a type of "air" cleaner used to eliminatepollutants in the air. Tell the students that there are several different kinds ofmachines used to clean air and that they work on different principles. It istheir job to discover the names of these machines and how they operate.
Lab: Have Materials Managers pick up their envelopes. The task i s tocreate a texbook out of the materials given that explains the different kinds ofcleaners. The book must include a title, authors names, matched cleaners anddescriptions and must be more than one page. Bonus points are given forincluding a Table of Contents and Glossary. Use Graphic Organizers.
Students should be able to match correctly and include the following: Theprinciple upon which each machine operates - static electricity, centrifugalforce, filters and washing. Post lab is an oral critique of finished products.
Extensions or Homework: Review Safety Data Sheet Number 1358 provided onfly ash. Explain this is provided on all residues/pollutants that contaminateair/water in industry.
Students investigate and list facts in data table form on elements contained infly ash. Variables include percentages, water solubility, appearance, odor,first aid procedures and handling.
Students graph element percentages. Decide what goes on x and y axis - title,form of graph, is there a key or legend? What will it look like?
Students research Pneumoconiosis.
Students develop safety posters illustrating the proper way to handle fly ashin the classroom. No dust - mix fine spray water mist to cut down on dust. Ordevelop posters illustrating how fly ash is used as a byproduct.
The above activity was developed C as a result of support and materials providedby Mr. Ed Cooley, TU Engineer.
S97.1 0 8

CLOTH TTP2
1111112111M121
COMPAIMINIII I. 2. AND .UNDER AA LOA&COMPARTIEMIT11 CLOMPOPP PI= MEDD MUMS
1211.1111.1 um= commous SAITONATIC
Cyclones - Centrifugal forceparticles are thrown againstthe walls of a cylinder - cancollect 95% of solid pollutantsused by cotton gins, rock crushers
Electrostatic Precipitatorsstatic electricity - particlesattracted to negativelycharged plates - 98 to 99%effective used instead ofbaghouses by power plants,steel and paper mills.
109
NW PLOW..
Baghouses - filter madeof cloth/paper/similarmaterial - can collect98% of particulatesused in steel mills,foundries
Wet scrubbers - cleangases/air by "washing"- used by coal burningpower plants, asphalt/concrete plants andother facilities thatemit sulfur dioxides,hydrogen sulfides andother gases.
wim-\
OM .0
A.
NAM
rRRe111112101122weans
HOPPERS

Scope & Sequence:
Materials:
Day I :
ACID RAINSTUDENT ACTIVITY 2 - LAKES ALIVE!!!!
Explain causes/effect of acid rainEvaluate positive/negative effects of man on
different environmentsTechnological advances and careers i n science
Balloons - Coat Hangers - Plastic Grocery BagsPepper/punch holes/rice krispiesTube holders for fluorescent bulbs - Hair dryer
Students will be creating their own electrostaticprecipitator while investigating static electricityand "Bernoulli's Principle".
Pre-Lab: Have students examine pictures of various technological cleanersused by industry to clean air. Discuss how industry is just one producer of airpollution. Ask what kinds of pollution are produced by industry. Explain thatindustry developed cleaners to limit/eliminate acid rain. Emphasize theelectrostatic precipitator and wet scrubber.
Question students to see i f they remember that the electrostaticprecipitator works on the principle of static electrical charges attractingparticles where they are removed.
Give each two/three students a balloon along with a small amount ofblack pepper. Have students inflate and tie their balloon. Tell them to rub theballoon on hair or classmate's back then hold the balloon over the pepper. What
happens to the pepper? Why? Have them record their observations. Find outlevels of knowledge by asking who knows what concept they have just explored?(Static electricity)
Lab: Tell students you want them to experiment to see i f they can createa mock electrostatic precipitator in the lab. They are to use a coat hanger, agrocery plastic bag and a fluorescent tube holder on their tables. Review theirpre-lab and ask what was present when they made static electricity with theballoon (movement, friction) and then give them some hints:
I . The bag must be attached to the coat hanger2. There must be some movement3. Electrostatic precipitators attract particles and bits of dust and lint
just like static electricity.
Students will try all sorts of odd things but eventually someonewill come up with the answer. The rest will copy and learn. (Attach the plasticbag to the coat hanger and then move them through the tube. The bag, movingthrough the tube, strips the negatively charged electrons from inside the tube
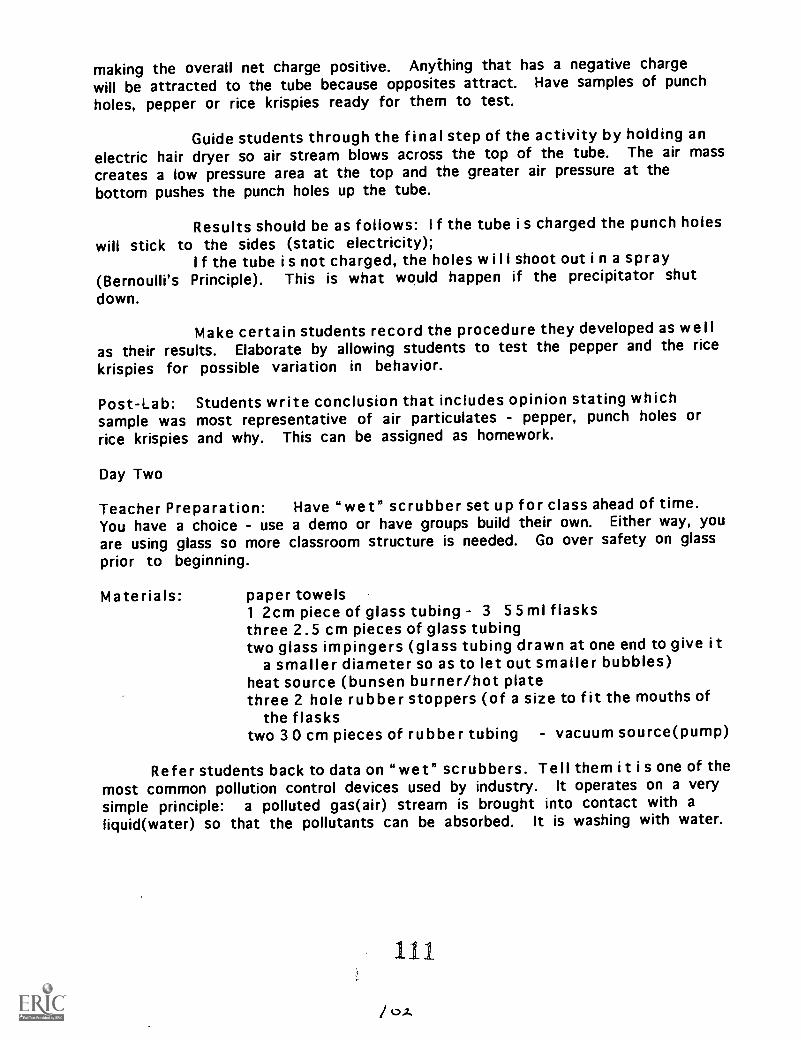
making the overall net charge positive. Anything that has a negative chargewill be attracted to the tube because opposites attract. Have samples of punchholes, pepper or rice krispies ready for them to test.
Guide students through the final step of the activity by holding anelectric hair dryer so air stream blows across the top of the tube. The air masscreates a low pressure area at the top and the greater air pressure at thebottom pushes the punch holes up the tube.
Results should be as follows: I f the tube i s charged the punch holeswill stick to the sides (static electricity);
I f the tube i s not charged, the holes will shoot out i n a spray(Bernoulli's Principle). This is what would happen if the precipitator shut
down.
Make certain students record the procedure they developed as wellas their results. Elaborate by allowing students to test the pepper and the ricekrispies for possible variation in behavior.
Post-Lab: Students write conclusion that includes opinion stating whichsample was most representative of air particulates - pepper, punch holes orrice krispies and why. This can be assigned as homework.
Day Two
Teacher Preparation: Have "wet" scrubber set up for class ahead of time.You have a choice - use a demo or have groups build their own. Either way, youare using glass so more classroom structure is needed. Go over safety on glassprior to beginning.
Materials: paper towels1 2cm piece of glass tubing 3 55ml flasksthree 2.5 cm pieces of glass tubingtwo glass impingers (glass tubing drawn at one end to give it
a smaller diameter so as to let out smaller bubbles)heat source (bunsen burner/hot platethree 2 hole rubber stoppers (of a size to fit the mouths of
the flaskstwo 30 cm pieces of rubber tubing - vacuum source(pump)
Refer students back to data on "wet" scrubbers. Tell them it is one of themost common pollution control devices used by industry. It operates on a verysimple principle: a polluted gas(air) stream is brought into contact with aliquid(water) so that the pollutants can be absorbed. It is washing with water.

ACID RAIN LAKES ALIVESTUDENT ACTIVITY SHEET
Post-LabAnswer the following questions:
I. Why does the water in the wet scrubber change color?
2. Why does the wet scrubber have an impinger (in other words,why is it important for small bubbles to be formed)?
3. What does the scubber filter out of the air? not filter out?
4. Suggest ways to dispose of the pollutants that are nowtrapped in the water.
After learning about industrial cleaners and simulating two ofthem in the lab, write an opinion as to whether or not youbelieve industrial cleaners are effective.
112
/ 0.3

Procedure:I . Check your apparatus to make sure a II the connections are made.Next, put a paper towel into a 5 5 m I flask and place above burner.
2. Make an airtight seal with the flask using a 2 hole stopper.Insert the 1 2 cm section of glass tubing through one of the holes.Tubing should reach to approximately 1.2 centimeters from thebottom of the flask.
3. Insert a 2.5 cm piece of glass tubing into the other hole of thestopper.
4. Connect a 30 cm piece of.rubber tubing to the 2.5 cm piece ofglass tubing making sure an a i r tight seal exists.
5. Fill a second 500 ml flask approximately 3/4 full of water.Using a second double hole stopper, put a 2.5 cm piece of glasstubing into one of the holes and insert the glass impinger into theother.
6. Construct a third flask like the second.
7. Connect the rubber tubing and heat the first flask COMBUSTION
CHAMBER until smoke appears.
8. Put a vacuum pump on the third flask to draw a stream of smokethrough the second flask WET SCRUBBER. 1 f smoke collects i n thesecond flask above the water, a second scrubber should be added.
9. After observation, answer the questions on your lab sheet.Long glass tubing
Beakerclamp
FlaskShort glass tubing
Rubber tubingPapertowel
To vacuum sourceRingstand
Bunsenburner
Wire gauze
Water
ImpingerImpinger
Adapted information from Office of Air Quality, State of TexasWET SCRUBBER - Addison-Wesley Publishing Co., Inc. All Rights Reserved
113/01

Scope & Sequence:
WILDLIFECOUNTING THE BIRDS
Careers i n SciencePositive/Negative effects of man on environmentClassify Resources a Renewable/Non Renewable
TEK: Collecting dataRelated graphing and math skills
Materials:
Pre-Lab:
Survey form and clip boardSupportive materials on bird behaviorSupportive materials on bald eagle behaviorLake Fairfield Eagle Brochures
Divide students into groups. Pass out Eagle brochures and let themexamine them. Ask, does anyone have a question about Bald Eagles? Ask, doesanyone have information they can share about Bald Eagles? Correct anymisconceptions talk abut endangered status and read over material that showshow a count has been taken at Lake Fairfield every year to make sure they werenot being disturbed.
Ask students to examine the data and see what stands out. Ask i fthey have any idea why there were almost twice as many Eagles at Lake Fairfieldin 1989. Then, have them make up a hypothesis as to numbers of birds theymight see.
Lab: Explain that they are going out to count urban birds around theschool area (or park, zoo) They will be given specific routes to take and timedfor a class period. Everything must be recorded. Go over the activity sheet.Tell them a time to meet with results.
Post Lab: Students i n their groups create/record their data - then come to aconsensus as to why or why not the birds were there to count. Students writeresults/conclusion giving opinion and how to strengthen lab activity.
Extension/Homework: Using the Texas Bald Eagle Survey, assign differentgraphing assignments based on information given.
Have students choose what they want to graph and how - assign a minimum often items to graph. Discuss graphs in class the following day looking at thevarious data and considering possible variables.

URBAN BIRD SURVEYSTUDENT LAB SHEET
PLEASE COMPLETE ALL SECTIONS OF THIS FORM.
GROUP OBSERVER NAME
Name of Recorder
No. of Observers Survey Date
State City Site #
Start Point: Stop Point:
Were you unable to complete the route for some reason?
Procedures: Start Time Total time of Survey
Survey method: Circle One Foot travel Road Vehicle Other
Roost Non Roost
Total birds counted No. of adults
No. of immatures
Address Phone #
1 e5
/07

Sum
mar
y of
bal
d ea
gle
obse
rvat
ions
dur
ing
the
1995
mid
-win
ter
surv
ey in
Tex
asI
II
I
Bal
d E
agle
s O
bser
ved
Gol
den
Eag
le O
bser
ved
Num
ber
Surv
eyN
umbe
r of
Stan
dard
ized
Sur
vey
Loc
atio
nsA
dult
Imm
atur
eU
nkow
nT
otal
Adu
ltIm
mat
ure
Unk
own
Tot
alC
ount
ies
Tim
e(m
in.)
Obs
erve
rs
Lak
e L
ivin
gsto
n(T
X-1
)5
11
70
00
03
600
9
Sam
Ray
burn
Res
ervo
ir(T
X-2
)5
80
130
00
04
600
54
Lak
e 0'
the
Pine
s (T
X-3
)23
100
330
00
01
180
19
Wri
ght P
atm
an R
eser
voir
(T
X-4
)11
20
130
00
02
390
3
Buf
falo
Lak
e N
WR
(T
X-5
)4
20
63
00
31
175
Lak
e M
ered
ith (
TX
-6)
164
020
10
01
336
06
Lak
e C
onro
e (T
X-7
)3
10
40
00
01
190
6
Lak
e W
arre
n (T
X-8
)0
10
10
00
01
165
2
Lak
e B
ucha
nan
(TX
-9)
36
09
00
00
312
012
Lak
e T
exom
a (T
X-1
0)23
70
300
00
01
180
11
Lak
e Fa
irfi
eld
(TX
-11)
414
018
00
00
112
011
Lag
una
Ata
scos
a N
WR
(T
X-1
2)0
00
00
00
01
601
Attw
ater
Pra
irie
Chi
cken
NW
R (
TX
-13)
00
00
00
00
160
Lak
e T
awak
oni (
TX
-14)
30
03
00
00
360
2
Lak
e Fo
rk (
TX
-15)
2423
552
00
00
218
050
Tol
edo
Ben
d R
eser
voir
(T
X-1
6)4
00
40
00
04
164
14
Lak
e W
hitn
ey (
TX
-17)
510
015
10
01
248
010
Gar
woo
d/E
agle
Lak
e R
ice
Prai
ries
(T
X-1
83
10
40
00
01
90-
1
Lak
e Pa
lest
ine
(TX
-19)
3912
051
00
00
454
09
Lak
e C
oope
r (T
X-2
0)1
50
60
00
02
60
Lak
e Pa
t May
se (
TX
-21)
86
014
00
00
190
Palo
Dur
o L
ake
(TX
-22)
00
00
00
00
00
GR
AN
D T
OT
AL
184
113
630
35
00
542
4864
230
* T
exas
sid
e of
lake
cou
nted
onl
y.
110
117

Review List of Materials
From the Internet
Louisiana State University - Michael Brown, Faces of Science, AfricanAmericans in the Sciences, Copyright 1995,www.lib.lsu.edu/lib/chem/display/easley.html
Electricity - #1 - 18 - Bill Nye, The Science Guy, Episode 2-04,Electricity, Why is it so warm in here?, July 8, 1996,//nyelabs.kcts.org/nyeverse/shows/e118.html
Electricity - #2 - 04 - Bill Nye, The Science guy, Episode 2-04, HEAT, I
think I just burned myself!! Heat conduction,//nyelabs.kcts.org/nyeverse/shows/e204.html
Electricity -Energy and Science Projects for Students Lemon Power,www.energy.ca.gov/energy...ojects/projects-html/lemon.html
Air Pollution - TNRCC, Office of Air Quality, Air Pollution Lesson Plansand Data, Measuring Physical and Chemical Properties of Matter,Comparing Precipitators and Wet Scrubbers in the Classroom, June 6,1996 - www.tnrcc.state.tx.us/ai...lessons/airpollutionlesson.html
Air Pollution - TNRCC, Particulate Information and Data, MonitoringParticulate Matter in Major Texas Cities, Comparing SuspendedParticulates and a Solution; Classifying Common AtmosphericGases/Particulates in the Classroom, June 6, 1996 -www.tnrcc. state.tx.us/ air /monops /lessons /partinfo.html
Wetlands USDA, Better Wetlands, How to Build a Song bird or BatHouse, July 3, 1996, www.ia.nrcs.usda.gov/enhance/bwpg12.html.
Alternative Energy - LEERIC, Parabolic Solar Collectors, July 8, 1996,www.leeric.Isu.edu/educa/lesson3.htm
Alternative Energy - Energy and Science Projects for Students,Experimenting with Water to Product Energy, Moving Water, MovingBlades, July 8, 1996, www.energy.ca.gov/energy.../projects-htm/waterenergy.html

Alternative Energy - Energy and Science Projects for Students, Measuringthe Wind, July 8, 1996, www.energy.ca.gov/energy.../projects-html/windmeasure.html
Alternative Energy Energy and Science Projects for Students, Solar HotDog Cooker, July 8, 1996, www.energy.ca.gov/energy...ts/projects-html/solardogs.html
Alternative Energy Solar Box Cookers Northwest, The "Minimum" SolarBox Cooker, A great solar oven you can build quickly from two cardboard
boxes, July 8, 1996, www.accessone.comr sbcn/minimum.htm.
Mathematics - Toronto Blue Jays Baseball Club, Toronto, Canada, BaseballMath, July 8, 1996, www.bluejays.ca/bluejays/jjzone/bbmath.htm
Mathematics Math Forum, Calculating Tips and Tricks, SquaringNumbers, January 14, 1996,//forum.swarthmore.edu/k12/mathtips/2digit5.html or 1-800-756-7823.
Mathematics - AIMS Education Foundation, Problem Solving Puzzles bythe Month, Square Stumper, Squarely Constructed 1 and 2, Lost in Space,
Are All Sides Equal, The Heart Breaking Puzzle and Time Marches On,
January through July, 1996, July I, 1996,//204.161.33.100/Puzzle/square/squarel.html
Endangered Species - Wolves, Science Museum of Minnesota ,30 East 10thStreet, St. Paul, Minnesota 55101 or 1-800-221-9444, ext. 4747Lesson Plans on behavior, characteristics, etc. on wolves and dogs.July 12, 1996, gopher://gopher.informn...12/wolfguide/4/42
Other Sources
Endangered Species Bald Eagles, Lake Fairfield, Big Brown Mining,TUElectric and Texas Parks & Wildlife, 1995 Mid Winter Survey &Fairfield Lake Eagle Tour Brochure, Richard White
COAL, Cycle of Lignite Video, TUElectric, Orlan IhmsSurface Mining in a Suitcase, TUElectric, Orlan IhmsWet Scrubber Photo-Addison Wesley

Nancy McGregerBiology
Stroman High School, Victoria
Texas A&M University BiochemicalDepartment, College StationDr. Bruce McDonald, Mentor
129

TTIPCURRICULUM IMPLEMENTATION PLAN
Abstract
NAME: Nancy McGreger
INTERNSHIP: Texas A&M, Department of Plant Pathology
SCHOOL: Stroman High School, Victoria I.S.D.,Victoria, Texas
PRIMARY SUBJECTS: Biology I/II .
ACTIVITIES: Growth Study of Neurospora crassa using Race Tubes.Demonstration of Basic Genetic Principles using Neurospora crassa.
OBJECTIVES: Students will measure and record rates of growth.Students will practice aseptic technique. Students will displayinformation obtained in a graphical form. Students will becomefamiliar with basic microbiology and genetics words.
SUMMARY: Students will perform a lab using the fungus Neurosporacrassa. From this lab,students will gain knowledge in the areas ofmicrobiology, genetics and mycology. Important laboratorytechniques such as measurement, data recording and aseptictechnique will be emphasized.
RESOURCES.*Dr. Bruce McDonald, Department of Plant Pathology*Dr. Dan Ebbole, Department of Plant PathologyTexas A&M UniversityCollege Station, TX 77843
*Ryan, Beadle and Tatum, "The Tube Method of Measuring theGrowth Rate of Neurospora", American Journal of Botany,Volume 30, pp. 784-799, Dec. 1943.
*The Internet, World-wide-web
* The Fungal Genetics Stock CenterUniversity of Kansas Medical CenterKansas City, KS 66160-7420Ph: 913-588-7044
113

2
General Information on Fungi
When the word fungi is mentioned, most people probably think of
mushrooms. Actually a mushroom is only one type of organism in
an entire kingdom of very diverse organisms. There are manyamazing and important things about fungi.
Interesting Facts about Fungi:*The world's oldest and largest organism is a fungus. It was
discovered in a forest in Michigan. After taking many samples
and measurements, scientists estimated that this fungus is atleast 1500 years old, covers 15 hectares and weighs over22,000 pounds, which is more than a blue whale, the largest
living mammal.
*King Tut's revenge is actually Aspergillis flavus, a fungus.
When King Tut's tomb was opened, many people apparently
died due to the mummy's curse.. Scientists now think thatAspergillis flavus were growing on the mummies and foodstored with them. When the door was opened, large amounts
of spores were blown into the air and people breathed these
spores. These spores produce toxins which when present in
large amounts are capable of killing people.
Positive Effects of Fungi:*Fungi are food producers as well as sources of food. Some
fermented products of fungal metabolism are soy sauce, bread,
beer, wine. Fungi also serve as foods like truffles, morels and
other types of edible mushrooms.*There are medical applications of fungal products such as the
chemical Cyclosporin, without which organ transplantation
would not be possible. Cyclosporin suppresses the immune
system which prevents tissue rejection allowing the
transplanted organ to remain unrecognized as foreign by the
body's immune system.*Antibiotics are mainly products of fungi. They are used in
killing bacterial infections in the body.*Fungi play an important role in ecology. Fungi are important
in maintaining the ecological balance of the environment by
breaking down dead organisms, recycling nutrients, etc.
111122

3
Negative Effects of Fungi:*Fungi are responsible for causing large amounts of economicdamage by reducing crop yields by 20-30% worldwide.*In addition to crop damage in the field, fungi also decomposefinished products and stored crops.*Fungi create toxins called aflatoxins which cause cancer.These toxins lead to death in many other parts of the world.*Fungi cause disease in AIDS victims through opportunisticinfection, colonizing lung tissue and other body parts,eventually resulting in death.
Descriptions of Experiments using Neurospora crassaAs you can see, fungi have a large effect on our daily lives. As
a teacher, I find that not many of my students are familiar withfungi. I have also noticed that there is very little information in highschool textbooks on this subject. Keeping this in mind, I have tried todevelop some simple experiments using fungi which teach basicprinciple of biology and genetics.
The filamentous fungus Neurospora crassa was chosen forclassroom experiments for many of the same reasons researchers useit. It is inexpensive, small, easy to maintain, grows rapidly and issafe to work with and easy to dispose. An added plus is that this isthe organism that was researched by Nobel prize-winning scientistsBeadle and Tatum in their pioneering work in genetics andbiochemistry in the 1940's. Since Neurospora is a model organismand has been extensively studied, a large amount of information isknown about this organism. There are many different mutantsavailable that lend themselves well to the study of biochemicalpathways, circadian rhythms, complementation, recombination,phenotype, genotypes etc. These mutants have been used to designexperiments which illustrate simple genetic principles.
EXPERIMENTS
RACE TUBES : One simple experiment which we performed was tomeasure Neurospora growth rates in an apparatus called a "racetube". A race tube is essentially a tube or pipette in which a thinlayer of growth medium is poured and placed horizontally to solidify.These race tubes can then be inoculated with different Neurosporamutants and the hyphae will grow toward the opposite end of tube.We used the wild type and a ropy mutant. The hyphae of ropy

4
mutants grow in a curved and branching fashion which reduces thedistance it can grow as compared to the wild type, which hasstraighter filaments and less branching. Using the laboratoryprotocol given, students can work in groups of two. The teacher cangive each student a different strain and the students can conduct"races" with their fungi to see which strain can grow faster.
CIRCADIAN RHYTHMS: Fungal growth and sporulation aredetermined by circadian rhythms. Race tubes can be inoculated, left
in the light for a few hours and then covered with aluminum foil.
They are left in the dark 2-3 days and then uncovered and bands ofsporulation are marked. The distance between the bands and thetime are figured which results in the length in hours of thatparticular strain's circadian rhythm. This can be compared with the
frq mutant and the ropy mutant which have different rhythms.
TYPES OF GROWTH:: Two types of fungal growth can be examined,
yeast growth and filamentous growth. Yeasts grow by budding andNeurospora grows by extending filaments called hyphae. Petri
dishes can be inoculated with bread yeast and Neurospora. Allow
these cultures to grow at room temperature several days and havestudents observe the dishes every day. The observations recordedshould be part of the lab report. If the equipment is available, it isalso interesting to observe these petri dishes under a dissectingmicroscope as well as observing wet mounts under a compoundmicroscope. The differences between the types and rates of growthare clearly evident. This simple experiment shows that yeasts growbetter in a liquid type of environment than on the surface of agar,whereas the filamentous Neurospora grows very rapidly and covers
the dish in a short amount of time. This would be important inunderstanding how certain types of fungi are able to colonize asubstrate quickly whereas others cannot. For example, it makes
sense that yeast would grow better in liquid environments like beerand wine and that filamentous fungi would do better on solid
substrates where it could extend its hyphae long distances.
GENETIC ANALYSIS: Neurospora can also be used to perform asimple genetic analysis which illustrates basic genetic principles aswell. Using mutants with different colors of spores, it is easy todesign experiments that show the relationship between genetics and
biochemistry. Knowing that genes control the biochemistry of anorganism, it is possible to demonstrate the genetics of certain
124

biochemical pathways using phenotypes to show what genotypeswere present.
Complementation: It is possible to do complementation experimentswhere two mutants that are lacking genes to complete two differentsteps in a biochemical pathway are grown in close proximity. Thisallows the products of their respective functional genes to be sharedexternally, which would theoretically enable both mutants tocomplete the pathway. This would be shown by a color change in thearea that complementation is occurring. For example, two albinomutants make white spores but would have an orange color wherethe two different mutant hyphae meet and orange spores areproduced. To do complementation, you must have the same matingtype and different loci. For example, use strains 4659 (mutation inthe al-2 locus) and 4661 (mutation in the al-3 locus). These strainswould complement. In another example, strains 4657 and 4663would not complement because they both have mutations in the al-1locus.
Complementation Experiment:On a petri dish containing Neurospora growth medium, inoculate oneside with strain 4659 and one side with 4661. After about 3 days,the filaments should cover the entire dish. Observe the dish forseveral days after the filaments meet. The zone of complementationshould run down the middle of the plate and be evident as anorange line where orange spores form.
ComplementationZone (orange
spores)
PETRI DISH
1
4f)-) 5
Inoculation ofAlbino strain
(white spores)
5

6
FUNGAL GROWTH STUDYGrowing Neurospora crassa in Race Tubes
OBJECTIVES:1. Students will measure the rate of growth of the filamentous
fungus Neurospora crassa.2. Students will learn aseptic technique as it applies to the
preparation of microbiological media and transfer of fungi.3. Students will record growth rate data and report their
results graphically.4. Students will compare phenoptypes of various mutants.
MATERIALS NEEDED:1. 25 ml presterilized, plugged plastic pipettes.2. Pipe cutter3. Pipette bulb or pump4. Sterile caps for the ends of pipettes (Kim-Kap disposable
caps-from Fisher Scientific)5. 95% ethanol6. Disposable latex gloves7. Double-sided tape or clothespins8. Neurospora crassa mutants-at least two different mutants,
(ropy, albino, wild-type)9. Metric rulers10. Hot plate (preferably with stirring capability) or Bunsen
burner11. Glass stirring rod (if hot plate does not stir)
IMPORTANT TIPS:*This lab has been designed for each student to have their ownrace tube, working in pairs with each growing a different
strain. The best situation is to have one ropy strain and one
regular strain. Note: The albino and wild-type strains aremuch faster growing than the ropy strain.*Disposable caps can be sterilized in ethanol.*When cutting pipettes, have sterilized caps ready to place over
cut ends.*Fill pipette up to 25 ml mark, then dispense all but 12 ml back
into flask. This covers the inside of pipette and minimizescondensation.
126

7
*Disposal of Race Tubes and Neurospora crassa Cultures:Neurospora is a harmless organism which can simply bedisposed of in the trashcan.
*It is possible that the correct type of glass pipettes can bereused, but must be cleaned and autoclaved first. It is notrecommended that disposable glass or plastic pipettes bereused.
*The teacher might want to inoculate a petri dish about 4 daysahead of time to grow up a large culture for use with multipleclasses.
PROCEDURE:
Preparation of Neurospora crassa growth medium: When preparingmedia, approximately 25 ml is needed per petri dish and 15 ml perrace tube.
For 100 ml: For 1 Liter:1. Yeast extract=0.5g 1. Yeast extract=5 g2. Proteose Peptone #3 (Difco)=0.5g 2. Prot. Pep. #3=5 g3. Bacto- Agar =l.5g 3. Bacto-Agar=15 g4. Maltose=4.0g 4. Maltose=40 g
1. Measure the dry ingredients into an appropriately sizedErlenmeyer flask. Be sure the volume is no more than half of thevolume of the flask. For example, the 100 ml recipe should be madein at least a 200 ml flask.
2. Using a graduated cylinder, add the remaining volume of distilledwater and stir well.
3. Place a square of aluminum foil loosely over the mouth of theflask.
4. Heat the flask on the hot plate on high until the medium is aboutto boil, then lower to a medium temperature. Do not allow the flaskcontents to boil over.
5. Boil gently for at least 20 minutes to sterilize medium.
6. Remove flask from heat and allow it to cool until you cancomfortably touch it with your hands.
127
'I?

8
Preparation of Race Tubes:1. Prepare Neurospora growth medium as directed in the recipe
above.
2. Place pipette bulb or pump onto plugged end of pipette andslowly draw 25 ml of medium into flask. Let all of the medium but12 ml drain back into the flask. Make sure you are reading thecorrect side of the pipette.
3. Dip gloved finger of free hand into small beaker of ethanol.
4. Cover open end of (non-plugged) pipette with sterilized glovefinger.
5. Keeping your eyes on the plugged end, slowly place filled pipette(lowering the plugged end first) onto tape or clothespin, taking carenot to wet the cotton plug.
6. Do not touch the pipette until the medium is cool and solidified.
7. While medium is cooling, sterilize the plastic cap by dipping it into
ethanol and allowing it to air dry (open side down)..
8. When medium in the race tube is cool and solid (it should look
opaque), clamp the pipe cutter gently onto the open end of pipette,
make one or two full circles and gently snap off the end of the plastic
pipette.
9. Cover the open end of the race tube immediately with a sterileplastic cap.
10. Secure the cap with masking tape and place the tube in a secureplace.
128

9
Inoculation of Race Tubes with Neurospora: :
1. Obtain a pure culture of Neurospora and inoculate your race tubewith an inoculating loop. Be sure to use aseptic technique. Seeattached instructions if you are unfamiliar with this technique. If alaminar flow hood or a still air chamber is available, perform theinoculation of race tubes there.
2. Place inoculated race tubes in a secure place and mark the exactplace of inoculation on the outside of the race tube with a Sharpie orother indelible marker.
3. Measure the amount of growth daily in millimeters, marking eachgrowth front as close to the same time as possible each day.
4. Students should make a graph with recorded data. Be sure tolabel the axes correctly and include the units used. When graphs arecomplete, answer the student questions.
129
1 0
NAMECLASSDATE
NEUROSPORA LAB QUESTIONS
1. What does aseptic mean?
2. What is Neurospora crassa?
3. Why is it important to keep aluminum foil over the mouth of the
flask during and after boiling?
4. In the Preparation of Medium, Step #2, the instructions state that
you are to release some of the medium back into the flask. Is the
released medium contaminated at this point? Why or why not?
5. Name at least three possibilities for contamination of the medium
in this experiment:
6. Do you think the medium will show bacterial contamination after
a few days at room temperature? Why or why not?
7. Predict how much or how far the fungus will grow in 24 hours:
139

11
8. After two days of growth, how far do you think the fungal growthfront will be?
9. What is the difference between the wild-type and mutant strains?
10. How is the growth of a filamentous fungus different than othercells such as plant, animal or bacterial cells?
VOCABULARY LIST Define the following words. Be sure to give acomplete definition for each word.
1. Filamentous-
2. Aseptic-
3. Agar-
4. Petri dish-
5. Race tube-
6. Growth medium-
7. Mutant-
8. Wild type-
9. Contamination-
10. Phenotype-
1311Z3

12
NAMECLASSDATE
NEUROSPORA LAB QUESTIONS
1. What does aseptic mean? without contamination
2. What is Neurospora crassa? the genus and species name of a
filamentous fungus which has been widely used as a model organism,
for biochemical and genetic research.
3. Why is it important to keep aluminum foil over the mouth of the
flask during and after boiling? to prevent contamination from the air,
4. In the Preparation of Medium, Step #2, the instructions state that
you are to release some of the mediuin back into the flask. Is the
released medium contaminated at this point? Why or why not?
The medium should not be contaminated at this point because the
medium was pipetted into a sterile pipette and returned to the
sterile flask.
5. Name at least three possibilities for contamination of the medium
in this experiment: Answers will vary. Some possibilities are
breathing into the flask. touching the tip of the pipette on anonsterile surface. touching the top of the flask. failing to keep flask
covered while pipetting. etc.
6. Do you think the medium will show bacterial contamination after
a few days at room temperature? Why or why not? Yes: was
possibly contaminated during transfer to pipette. No: everything
was sterile and aseptic technique was correctly used,
7. Predict how much or how far the fungus will grow in 24 hours:
Answers will vary
132Lay

13
8. After two days of growth, how far do you think the fungal growth
front will be? Answers will vary.
9. What is the difference between the wild-type and mutant strains?Wild type is the strain that occurs in nature and has orange sporesand doesn't exhibit any major mutations, The mutant strains arewild type strains that have undergone a mutation that changes theirphenotype. In this case. a mutation has occurred in the biochemicalpathway that results in orange spore color causing only white sporesor unpigmented spores to be produced.
10. How is the growth of a filamentous fungus different than othercells such as plant, animal or bacterial cells? The filamentous fungus
1 t WI
area more quickly. Plant. animal and bacterial cells divide into twosmaller cells of the same shape. These cells are generally notarranged in filaments. which causes them to be arranged in aconcentrated group. not a long filament.
133s'

14
VOCABULARY LIST Define the following words. Be sure to give a
complete definition for each word.
1. Hypha- branching or straight filament that is the basic unit of agrowing fungus.- Plural: hyphae
2. Aseptic- free of contaminating organisms.
3. Agar-substance used to solidify culture media,
4. Petri dish- dish which is composed of two parts which is used to
grow cultures of bacteria or fungi.
5. Race tube-glass or plastic pipette which is filled halfway with
solid growth medium and used to conduct fungal "growth races".
6. Growth medium-an agar-based medium which contains a rich
supply of nutrients necessary for optimal growth of an organism.
7. Mutant-an organism carrying a gene that has undergone amutation or a change in genetic cote. In these experiments. artexample of a mutant would be the albino mutant. which produces
white spores instead of the normal wild type orange spores,
8. Wild type- a strain that normally occurs in nature which has not
undergone a mutation that changes it radically. In theseexperiments. Neurospora crassa wild type will produce orange spores
its filaments will also appear orange,
9. Contamination- not pure, having other organisms present which
are different than the pure culture.
10. Phenotype- she physical expression of a genotype.
134
15
DEMONSTRATION OF CAROTENOID ACTIVITYUSING
NEUROSPORA
This is a very simple and highly interesting way to show how lightaffects molecules called carotenoids.
Procedure:1. Pour Neurospora growth medium into a small Erlenmeyer
flask and allow it to solidify. A good size is a 50m1 or 100m1 flaskwith about 20m1 or 40m1 of medium.
2. Using an inoculating loop, transfer some Neurospora to thecenter of the medium. You should use a wild type strain or one thatis known to have some color. You might also want to prepareanother flask with an albino mutant to show that it will not changecolor.
3. Cover immediately and completely with aluminum foil andallow flask to sit at room temperature for 3-4 days.
4. At the beginning of class on the 3rd or 4th day, havestudents open their flasks and write their observations down. Havestudents record observations every twenty minutes until the end ofclass.
5. At the beginning of class the next day, have the studentsrecord their final observations. At this time, discuss with the classwhat they think caused the change and why would this be importantto fungi.
*Teacher Notes: Wild-type strains will appear white when the foil isremoved from the flask. Placed in light, the fungus should startturning orange.
135
1;27

16
TEACHER NOTES
QBIAILEGEE1113052MAE:RAINI:
Neurospora strains can be ordered from the Fungal Genetics StockCenter at a cost of $20 per strain. Once you have a culture, it is veryeasy to maintain it. You must use the FGSC number which is givenbelow for each strain ordered.
To order, write to::Kevin McCluskey, PhDCurator, Fungal Genetics Stock CenterDepartment of MicrobiologyUniversity of Kansas Medical CenterKansas City, KS 66160-7420
Phone: 913-588-7044Fax: [email protected]://kumchttp.mc.ukans.edu/research/fgsc/main.html
Neurospora crassa strains:Mating type
Albino strains A a
al-1 4657 4658al-2 4659 4660al-3 4661 4662
Yellow strains4669 4670ylo-1
ylo-2 4671 4672
Ropy strains2980 2981ro-4
Circadian rhythm strains2670frq;bd
frq;bd 4898
All strains used in these experiments are Neurospora crassa.

17
Teacher Options:1. You may want to prepare race tubes ahead of time and give themto your students and have them inoculate them.
2. You may want to have to students do this entire experiment.
3. You may want to demonstrate aseptic technique before you havethe students do it. This is strongly suggested.
4. You might want to prepare petri dishes with Neurospora growthmedium and let students open the dishes five to ten minutesoutdoors. The result will be a variety of colorful molds which growvery quickly and cover the dish in a couple of days.
A Note about Difficulty:While it is possible to do recombination with Neurospora, I feel
that this may involve more time and difficulty than a teacher wouldlike to undertake, especially for less advanced classes. I wouldrecommend this only for very advanced classes. If you would like tofind out more about this or if you have any other questions, you maycall me at school: Nancy McGreger at Stroman High School, Victoria,Texas: (512)- 578-2711 or Dr. Ebbole at Texas A&M.
1 3 7

Aseptic Technique
1. Wash hands thoroughly with antibacterial soap.
2. Sterilize the tabletop with 10% Clorox solution or 95% ethanol.
3. Flame inoculating loop with one hand.
Once the loop is flamed, do no, allow it to touch anything else butthe culture and the agar.After you have completed the transfer, flame the loop immediately.
4. Open the culture tube or plate and touch the loop to sterile agar tocool the loop.
5. Touch the loop to the fungus and withdraw the loop, taking carenot to touch the side walls.
6. Replace culture cap or lid.
7. Touch the loop to the agar surface, withdraw the loop and markplace of inoculation. Replace cap of race tube and flame the loop.
138130

Jennifer WillisChemistry
Per-Service Teacher
Texas A&M UniversityCenter for Chemical Characterization
and Analysis,College Station
Dr. E.A. Schweikert, Mentor
1 3 9

TTIPCURRICULUM IMPLEMENTATION PLAN
Abstract
NAME:
INTERNSHIP:
SCHOOL:
SUBJECTS :
ACTIVITIES:
Jennifer Willis
Texas A & M's Center for ChemicalCharacterization and Analysis (CCCA)
pre-service teacher
Chemistry I(H) or Chemistry II
Mass spectrometry instruction via Powerpoint 4.0Mass spectrometry analysis via slidesgroup projectself, group, and peer group evaluationoptional enrichment activities and advanced organizers
SUMMARY:
RESOURCES:
In this unit, a variety of teaching methods are madeavailable to the Chemistry teacher to aid in the instructionof the principles of basic mass spectrometry and time-of-flight mass spectrometry. Students are given theopportunity to work as a team while moving through thesix levels of Bloom's Taxonomy.
Dr. Emile A. Schweikert, Center for ChemicalCharacterization, TAMU, College Station, Texas,77843-3144.
Edward Funkhouser. Associate Head of UndergraduateEducation, Department of Biochemistry and Biophysics,Texas A & M University.
Brian T. Walenta, Project Coordinator, Texas Alliance forScience, Technology, and Mathematics Education, TAMU.
1994 & 1995 Texas Teacher Internship ProgramCurriculum Implementation Plan Publication.
140

Mass Spectrometry: The Adventure
Introduction:
These lessons have been constructed to provide the teacher with options
concerning the instruction of mass spectrometry and time-of-flight mass spectrometry.
This unit is designed for Chemistry I (H) or Chemistry II students, depending on the depth
of Chemistry taught in each course. This unit should follow a unit/set of lessons
pertaining to the molecule, the mole, calculating molecular mass, and defining the charge
on a molecule. While some lessons were prepared using Powerpoint 4.0 and Netscape
2.0, lesson notes are provided to assist the instructor without computer/computer softwareavailability. Alternative approaches are given at the beginning of each lesson for the
teacher without such equipment.The overall purpose of this unit is to challenge students to go beyond the state
standards established for Chemistry and participate in a unique research experience.
Students will develop valuable communication and critical thinking skills while gaining
an understanding of what scientists experience daily as they explore the world around
them. The unit is designed to build up to a final group project where students are
required to utilize the information made available to them on time-of-flight mass
spectrometry to simulate an experiment and present their results to their peers. The
enrichment activities are optional and given to provide the teacher with flexibility
regarding instruction. If the instructor, however, intends to have the students participate
in the group project, the material on time-of-flight mass spectrometry or other related
information needs to be available to the students. The instructor should provide as many
of the options supplied in this unit as possible to assist the students in completing the
group project successfully. The time allotted for each lesson will vary depending on the
bell schedule. Suggestions for traditional and block schedule are provided with each
lesson.
Goals:Upon completion of this unit, the student will be able to:
1)
2)
3)4)
5)
6)
understand the basic principles of mass spectrometry and
time-of-flight mass spectrometryunderstand the application of mass spectrometry and time-of-flight
mass spectrometryanalyze a simple mass spectrumparticipate in a group project using his/her knowledge on
time-of-flight mass spectrometryimprove on and utilize current communication skills in a group
presentation on time-of-flight mass spectrometrycritically evaluate him/herself, his/her group, and a peer group
upon completion of the project and presentation

If you would like a copy of the computerized lessons to be run on Powerpoint 4.0,please contact the author at the permanent address listed below:
Jennifer Willis108 Greenway
Victoria, Texas 77904512-578-6176
142

Mass Spectrometry - The Adventure Part I(a lesson prepared on Powerpoint 4.0)
Level:Chemistry I (H) or Chemistry II
Suggested Scheduling:1 traditional bell schedule (50 min)2/3 block schedule (1 hr 30 min)
Purpose:This tutorial is designed to teach the student the basic principles of mass
spectrometry and should follow a unit/set of lessons pertaining to the molecule, the mole,calculating molecular mass, and defining the charge on a molecule. The instructor may
opt to teach the class as a whole, utilizing the notes of the presentation or set-up thepresentation as part of a workstation for the student to learn on his/her own or with
his/her group. This lesson is the first of two lessons on mass spectrometry. The second
lesson furthers the discussion, focusing on time-of-flight mass spectrometry.
Objectives:Upon completion of this lesson, the student will be able to:
1. understand the basic principles governing mass spectrometry2. understand who uses this process3. understand what occurs to a sample following injection into a mass spectrometer
4. understand how the ions are separated in mass spectrometry5. understand how the ions are represented following separation
Materials:
an IBM computer with mouse hook connection (if available)Powerpoint 4.0 computer software (if available)Lesson 1 entitled, "Mass Spectrometry: The Adventure Part I," thecomputerized Powerpoint 4.0 version or the screen notes of the lesson that
follow this page.
Procedure:
Computer Option:The student/teacher will have to load the lesson into the computer from
Powerpoint 4.0 into the "slide show." The student willbe asked to advance from one
screen to the next by clicking on the mouse. The program takes the student step by step
through a tutorial covering the objectives stated above.
1431310

Teaching Option:The instructor will discuss the objectives of the lesson with the students and
proceed through the lesson, utilizing the notes provided (read the screens left to right) tomeet the objectives stated above.
Assessment of Student Achievement:
Computer Option:At the conclusion of this lesson, the student will check his/her own understanding
of the material with a short quiz on his/her own paper. The student will then submithis/her answers after correction to receive credit for participating in the tutorial. If agroup completes the lesson together, only one set of answers needs to be submitted forcredit.
Teaching Option:The instructor may utilize the evaluations given at the end of the presentation to
quiz the class on the material.
Scoring and Reteaching:Point values for each question are given with the quiz. Students are encouraged to
take notes during the presentation. Students scoring below a 60 are advised to repeat thelesson before advancing to lesson two. Their performance on the quiz provided at the endof the lesson will reflect their understanding of the material and ultimately, affect theirperformance on the group project.
Enrichment:Some enrichment opportunities are as follows:
1. Performing an internet search of "Mass Spectrometry" and reporting on theinformation made available.
2. Writing a report on Mass Spectrometry, utilizing several resources. Resources mightinclude the internet, a University library, and/or a trip to a mass spectrometrylaboratory or research facility.
3. Taking a field trip to a mass spectrometry laboratory and reporting on the findings.An evaluation sheet is provided with this lesson and may be used for this trip and/orany other field trip to a laboratory or research facility. Scheduling the class, as awhole, to go might be more beneficial.
144/ 3 7

Mass Spectrometry -The Adventure Part I
(click to advance to the next screen)
At the conclusion of the lesson, you willcheck your own understanding of thematerial you have learned with a shortquiz. Please take notes along the way,as it will help you to complete the quizsuccessfully.
(click to advance to the next screen)
Who uses mass spectrometry? All sorts ofpeople all over the world. In fact, here arejust a few.
chemists
engineers
doctors
police
biologists
physicists
(click to advance to the next screen)
The Plan: This lesson is the first of twolessons on Mass Spectrometry. In thislesson, we will discuss what massspectrometry comprises. In the secondlesson, our discussion will further,focusing on time-of-flight massspectrometry. 6.111111
1111
(click to advance to the next screen)
Objectives:
By the end of this lesson, you will beable to understand:
the basic principles governing mass spectrometry
who uses this processwhat occurs to a sample following injection into amass spectometerhow the ions are separated in mass spectrometry
how the ions are represented following separation
(click to advance to the next screen)
What is mass spectrometry used for?To identify compounds. Examples
of its use are:
steriod detectiondetection of dioxins in contaminated fish
determine composition of molecular speciesin spacedetermine specimen age in archaeology
establish elemental composition ofsemiconducting materials
(click to advance to the next screen)
i45) 38

Mass spectrometry is just one of severalmeans of compound analysis that scientistsuse to identify unknown compounds. Infra-red spectrometry, X-ray diffraction, andNuclear Magnetic Resonance are three othermeans of compound analysis widely usedtoday.
(click to advance to the next screen)
Molecules are converted to ions/chargedmolecules and their mass is then measuredvia mass spectrometry. How does this occur?A general mass spectrometry set-up isshown below.
TwomeI
(click to advance to the next screen)
ralitspoon=
Ionization breaks down the moleculecarbon dioxide, CO2, into fragments.Thus, it becomes:
CO2+ CO+ C+ 0+
(click to advance to the next screen)
According to The American Society forMass Spectrometry's (ASMS) 1995What is Mass Spectrometry?, massspectrometry is an analytical method usedto identify unknown compounds inquantities as small as 10^-15 gram.
(click to advance to the next screen)
Let's go through the analysis one portionat a time. A sample is injected into the inletand then ionized by a very powerful sourcesuch as a laser. Let's take a look at whathappens to the common compound,carbon dioxide.
it(click to advance to the next screen)
Recall that the positive sign in eachfragment/ion has lost an electron. (Exactlyhow this occurs during ionizationremains a mystery.)
Fragments/ions can be negativelycharged as well. For our purposes.however, we will always refer to thefragments/ions as positively charged.
(click to advance to the next screen)

Other ionization techniques (besides laser)are:
Fast Atom Bombardment
Secondary Ion Mass Spectrometry
Laser Desorption
Field Desorption
Electrospray
Electron Ionization
Chemical Ionization
(click to advance to the next screen)
After the sample is in its ionic form, theions are then sorted according to theirmass/charge ratio (m/z) in the analyzer.Each fragment has its own m/z value i.e.
CO2+ has a different m/z value than CO+or C+ or 0+.
imFamee aImanyset
(click to advance to the next screen) 4
The analyzer then transfers the ions to adetector that generates an electrical signal.that signal is recorded by the data systemor computer and prints out a mass spectrum.
=4"1YZer
MISS
specutso
Lth(click to advance to the next screen)
In the first five techniques listed, thesample is vaporized and ionized at thesame time. In the last two, the oldest ofionization techniques, the sample isvaporized prior to ionization.
..
(click to advance to the next screen)
Some mass analyzers in use todayare:
quadropole mass filters
magnetic/electric sectors
ion traps
time-of-flightFourier transform ion cyclotron resonancespectrometer
(click to advance to the next screen)
A spectrum is very similiar to a set offingerprints. Just like fingerprints givehelp identify who you are, a spectrumhelps scientists identify compounds andmolecules.
ipeozum
tgL
(click to advance to the next screen)

Each peak on the spectrum representsthe m/z (mass/charge) ratio for eachfragment of the molecule.
mh olio
ion Inez
cot. 44
Co. 211
0. 16
C. 12
(click to advance to the next omen)
The entire system is kept under vacuumor really low pressure to prevent moleculesfrom colliding with other molecules duringthe process.
=ECM101103
0111111
MOW
4
(click to advance to the next screen)
Quiz1. What is the main use of massspectrometry?
IcOCIME0
Lth
2. Name two professionals who use massspectrometry.
3. When a sample is injected into a massspectrometer, what occurs immediatelyfollowing the injection?
(click to advance to the next screen)
The fragmentation pattern in thespectrum provides scientists with cluesto help them identify compoundspresent in the sample.
(click to advance to the next screen)
You may now check your understandingof the material so far. Please take a fewmoments to answer the questions thatfollow by yourself and then advance tothe next screen to check your answers.
Each question is worth 20 points plusan extra 10 points for the bonus.
(click to advance to the next screen)
4. The ions of the molecule are thenseparated according to their what?
5. The m/z ratio of the ions is representedby what means?
148
(click to advance to the next screen)

Bonus (+10):What size samples are analyzed by a mass
spectrometer (i.e. big or small)?
That's it for the quiz, now let's check youranswers to see how you did!
(click to advance to the next screen)
Bonus: Samples as small as 10^-15 gram.
Your scores will not be recorded unlessotherwise specified by your instructor.
They do, however, reflect yourunderstanding of the material and willeffect your performance on the finalproject.
(click to advance to the next screen)
Information for this presentation wastaken from The American Society forMass Spectrometry's 1995 What isMass Spectrometry?
(click to advance to the next screen)
The answers to your quiz are as follows:
1. Mass spectrometry is used to identify unknown
compounds.2. Chemists, engineers, doctors, police, biologists,
and physicists.3. The sample is ionized.4. Mass/charge or m/z ratio.5. A mass spectrum displaying a peak for each
tn/z value.
(click to advance to the next screen)
If you scored below a 60, I suggest yourepeat this lesson before proceeding to
lesson two.Please correct your answers to this quiz
and submit a copy to your instructor forcredit on this tutorial (for groups, one is
sufficient).
149
(click to advance to the next screen)
This presentation was developed during
the summer of 1996 as part of the Texas
Teacher Internship Program (TTIP) atTexas A & M with the guidance of TT1P
Coordinator Brian T. Walenta.
(click to advance to the next screen)

Research for this presentation was performedat Texas A & M's Center for ChemicalCharacterization and Analysis under thesupervision of Dr. Fmile E. Schweikert,Chemistry Department Chair and Directorof the CCCA, and his research group.Members of the group were:
Dr. Michael Van StipdonkDr. Karima BaudinW. Ricky FerrellJim Blankenship
Shera von HamburgRonny HarrisVanessa SantiagoRobert English
(click to advance to the next eaten)
c/3
Produced and edited by:
Jennifer Willis
You have now completed Lesson 1 of thisseries on Mass Spectrometry. To continue,please exit this Lesson and open Lesson 2.
copyright 1996

Mass Spectrometry - The Adventure Part II(a lesson prepared on Powerpoint 4.0)
Level:Chemistry I (H) or Chemistry II
Suggested Scheduling:1 traditional bell schedule (50 min)2/3 block schedule (1 hr 30 min)
Purpose:This tutorial is designed to teach the student the basic principles of time-of-flight
mass spectrometry and should follow Mass Spectrometry - The Adventure Part I. Theinstructor may opt to teach the class as a whole, utilizing the notes of the presentation or
set-up the presentation as part of a workstation for the student to learn on his/her own or
with his/her group.
Objectives:Upon completion of this lesson, the student will be able to:
1. understand what the term "time-of-flight" indicates2. understand why 252 Cf is a good ionizing source3. understand the overall reason for using time-of-flight mass spectrometry over other
mass spectrometry techniques4. understand which fragments/ions will hit the detector first and last
Materials:
an IBM computer with mouse hook connection (if available)
Powerpoint 4.0 computer software (if available)Lesson 1 entitled, "Mass Spectrometry: The Adventure Part H," thecomputerized Powerpoint 4.0 version or the screen notes of the lesson that
follow this page.
Procedure:
Computer Option:The student/teacher will have to load the lesson into the computer from
Powerpoint 4.0 into the "slide show." The student will be asked to advance from one
screen to the next by clicking on the mouse. The program takes the student step by step
through a tutorial covering the objectives stated above.
151phi

Teaching Option:The instructor will discuss the objectives of the lesson with the students and
proceed through the lesson, utilizing the notes provided (read from left to right) to meetthe objectives stated above.
Assessment of Student Achievement:
Computer Option:At the conclusion of this lesson, the student will check his/her own understanding
of the material with a short quiz on his/her own paper. The student will then submithis/her answers after correction to receive credit for participating in the tutorial. If agroup completes the lesson together, only one set of answers needs to be submitted forcredit.
Teaching Option:The instructor may utilize the evaluations given at the end of the presentation to
quiz the class on the material.
Scoring and Reteaching:Point values for each question are given with the quiz. Students are encouraged to
take notes during the presentation. Students scoring below a 60 are advised to repeat thelesson. Their performance on the quiz provided at the end of the lesson will reflect theirunderstanding of the material and ultimately, affect their performance on the groupproject.
Enrichment:Some enrichment opportunities are as follows:
1. Performing an internet search of "Time-of-Flight Mass Spectrometry" and/or"Plasma Desorption Mass Spectrometry," reporting on the information madeavailable.
2. Writing a report on ToF-MS and/or PDMS, utilizing several resources. Resourcesmight include the internet, a University library, and/or a trip to a mass spectrometrylaboratory or research facility.
3. Taking a field trip to a mass spectrometry laboratory and reporting on the findings.An evaluation sheet is provided with this lesson and may be used for this trip and/orany other field trip to a laboratory or research facility. Scheduling the class, as awhole, to go might be more beneficial.
1

Mass Spectrometry -The Adventure Part II
(click to advance to the next screen)
At the conclusion of the lesson, you willcheck your own understanding of thematerial you have learned with a shortquiz. Please take notes along the way,as it will help you to complete the quiz
successfully.
(click to advance to the next screen)
Thus far, we have learned the basicprinciples associated with massspectrometry. Now, we will look at aspecific method of mass analysis known astime-of-flight.
(click to advance to the next screen)
153
The Plan: This lesson is the second of two
lessons on Mass Spectrometry. In this
lesson, we will discuss time-of-flightmass spectrometry.
(click to advance to the next screen)
Objectives:
By the end of this lesson, you will beable to understand:
what the term "time-of-flight" indicates
why 252 Cf is a good ionizing source
the overall reason for using time-of-flight massspectrometry over other mass spectrometrytechniqueswhich fragments/ions will hit the detector first and
last
(click to advance to the next screen)
With other mass analyzers (ion traps,quadropoles, etc...), only one m/z value canbe detected at one time. Time-of-flightmass spectrometry is able to give morethan one m/z value at the same time.
That's the advantage! More than one m/z
value!
(click to advance to the next screen)

The overall goal of mass spectrometry is tobe able to analyze smaller and smaller samplescomposed of larger molecules. Time-of-flight hasbeen around since 1974 and is used to analyzelarger biomolecules that can not be analyzed byother methods because they are too big.
Biomolecules of 500,000 to 750,000 amu (atomicmass units) have been analyzed so far!
(click to advance to the next screen)
The name "time-of-flight" correspondsto the time an ion is in flight and isproportional to the square root of m/z.The instrumentation is set up as follows:
O
isuut detector (.
time-of-flight tube wider vacuum
u 232 Cfionizing source
(click to advance to the next screen)
computer
This radioactive source is constantly undergoingfission. The detectors are like start and stopbuttons on a stop watch. When a 252 Cf sourceis used, one fission fragment from the 252 Cfwill strike the sample to ionize it while anotherfission fragment is given off in the oppositedirection and hits the detector.
(click to advance to the next screen)
Recall, the amu is 1/12 the mass of aCarbon atom. Calculations show that1 amu=1.6606 x 10^-24 gram, therefore,the largest biomolecules analyzed weighbetween 8.30 x 10^-19 and 1.20 x 10^-18gram.
That's still very small!
(click to advance to the next screen)
Let's take a look at the set-up one section at atime. First, we will discuss the detectors and onetype of ionizing source involved in time-of-flightmass spectrometry.
252 Californium (Cf) is a radioactive isotopeof the element Californium that is a type ofionizing source used in time-of-flight massspectrometry.
= 252 Cfionising source
(click to advance to the next screen)
The constant emission of fission fragmentsfrom the radioactive 252 Cf makes it a goodionizing source. (This is a special kind ofionization known as Plasma Desorption.)
Is= detector
time-of-flight tube under vacuum
®e 252 Cfionising source
(click to advance to the next screen I
15 4 BEST COPY AVAILABLEcl 7

The principle behind time-of-flight is that theions are being separated according to theirdifferent flight times over a given distance. Inorder for the sample ions to be accelerated andtheir flight times recorded, however, they haveto have a "kick" or be pushed off.
(click to advance to the next screen)
A power supply of approximately 10 kilovoltsis hooked up next to the sample to producethe "kick" and push off all of the ions at aconstant acceleration.
(click to advance to the next screen)
Lighter ions/fragments will reach the stopdetector in less time than heavier ones. Alighter ion/fragment will have less mass than aheavier ion/fragment. Using our example ofcarbon dioxide from Lesson 1, we wouldexpect the lighter ion C+ that has a mass of 12to reach the stop detector before the heavierfragment CO+ that has a mass of 28.
(click to advance to the next screen)
Think of a track runner waiting in his startingblock. Unless he pushes off with his foot whenthe whistle blows, he won't go anywhere!
(click to advance to the next screen)
The entire instrument, however, is poweredby electronics, thus there is a power supplyconnected to both detectors as well. In ourdrawings, we will show the power suppliesbut they are always present.
155
J'/ )
time-of-flight tube under vacuum
(click to advance to the next screen)
flight tube
0 C+
(click to advance to the next screen)

The start and stop detectors are connectedthrough the CFD, the Constant FractionDiscriminator, that filters out any unwanted"noise" from the ending spectrum.
(click to advance to the next screen)
For instance, in this spectrum, it is very difficultto determine what any of the peaks are due to theamount of "noise" present in the spectrum. Infact, "noise" is what keeps scientists busy, asthey try to eliminate it as much as possible fromtheir spectra.
"Noise"
mtz (click to advance to the next screen)
The signals are then transferred to a computeror data system and a spectrum given, just thesame as in regular mass spectrometry.
r
8time-of-flight tube under vacuum
= 252Cfionising source
(click to advance to the next screen)
156
"Noise" is represented by a lot of unnecessarypeaks that interfere with the overall analysis andcan be due to:
undetected fluctuations in temperatureelectrical outputoscillations in pressurevariations in humidityunwarranted instrumental vibrations
(click to advance to the next screen)
The CFD is then connected to the TDC ortime-to-digital converter. The TDC jga very fast stop clock that records the flighttimes of the ions. (Remember the track race -the detectors are the buttons that the guy pushesto time the runners. The TDC is the actualtiming device inside the stop watch.)
(click to advance to the next screen)
Recall from Lesson I, the entire system mustremain under vacuum to prevent the moleculesfrom colliding. The time-of-flight system massspectrometer is kept under 10A-6 torr, a verylow pressure. That means that almost no air ispresent in the system - you wouldn't be able tobreathe under those conditions!
(click to advance to the next screen)

You may now check your understandingof the material so far. Please take a fewmoments to answer the questions thatfollow by yourself and then advance tothe next screen to check your answers.
Each question is worth 25 points plusan extra 10 points for the bonus.
(click to advance to the next screen)
4. Will a heavier ion/fragment reach thedetector before/after a lighter ion/fragment?
Bonus (+10):What is the largest mass (in amu's) of a
molecule detected by time-of-flight massspectrometry thus far?
(click to advance to the next screen)
Your scores will not be recorded unlessotherwise specified by your instructor.
They do, however, reflect yourunderstanding of the material and willeffect your performance on the finalproject.
(click to advance to the next screen)
Quiz
1. The "time-of-flight" of an ion indicates thewhat?
2. Why is 252 Cf a good ionizing source?
3. What is the advantage of using time-of-flight over any other mass spectrometrytechnique?
(click to advance to the next screen)
The answers to your short quiz are as follows:
1. The time an ion remains in flight in themass spectrometer.2. It is constantly emitting fission fragmentsthat ionize the sample.3. More than one m/z value can be generatedat one time.4. After a lighter ion/fragment.
Bonus: 750,000 amu(click to advance to the next screen)
If you scored below a 60, I suggest yourepeat this lesson to gain a better under-standing of the material.
Please correct your answers to this quizand submit a copy to your instructor forcredit on this tutorial (for groups, one issufficient).
157I.r-o
(click to advance to the next screen)

Information on mass spectra analysis can befound in other tutorials. Catherine Fenselautakes you step by step through the analysis ofmass spectra, explaining fragmentation patternsand how to use them to identify differentcompounds. Look for her work on massspectral interpretation in multimedia form inyour local library.
(click to advance to the next screen)
Whitten, Gailey, and Davis's 1988 General Chemistrywith Qualitative Analysis, 3rd edition, published bySaunders College in Chicago, IL, pp. 41-42.
Skoog and Leary's 1992 Principles of InstrumentalAnalysis,4th edition, published by Saunders Collegein Fort Worth. TX, p. 47.
(click to advance to the next screen)
Research for this presentation was performedat Texas A & M's Center for ChemicalCharacterization and Analysis under thesupervision of Dr. Emile E. Schweikert,Chemistry Department Chair and Directorof the CCCA, and his research group.Members of the group were:
Dr. Michael Van StipdonkDr. Karima BaudinW. Ricky FerrellJim Blankenship
Shera von HeimburgRonny HarrisVanessa SantiagoRobert English
(click to advance to the next screen)
Information for this presentation was taken fromthe following:
Robert Cotter's 1988 paper "Plasma-Desorption:Coming of Age" published in The AmericanChemical Society's AnalxdraMem,' vol. 60,pp. 781-793.
Robert Cotter's 1992 paper 'Time-of-Flight MassSpectrometry for the Structural Analysis ofBiological Molecules" published in the AmericanChemical Society's Analy.tiaaLChemisay, vol. 64.pp. 1027-1039.
(click to advance to the next screen)
This presentation was developed duringthe summer of 1996 as part of the TexasTeacher Internship Program (TTIP) atTexas A & M with the guidance of TTIPCoordinator Brian T. Walenta.
(click to advance to the next screen)
Produced and edited by:
Jennifer Willis
You have now completed Lesson 2 of thisseries on Mass Spectrometry.
copyright 1996
BEST COPY AVAiLANLE
1. 5T

Mass Spectrum Analysis(slideshow)
Level:Chemistry I (H) or Chemistry II
Suggested Scheduling:1 traditional bell schedule (50 min)2/3 block schedule (1 hr 30 min)
Purpose:This tutorial is designed to teach the student how to analyze a mass spectrum.
The instructor may opt to teach the class as a whole, utilizing the notes of the presentation
or set-up the presentation as part of a workstation for the student to learn on his/her own
or with his/her group.
Objectives:Upon completion of this lesson, the student will be able to:
1. understand the purpose behind generating a mass spectrum2. understand and be familiar with common fragmentation patterns that occur in
molecules3. understand what the peaks in a mass spectrum represent4. identify specific peaks represented in a mass spectrum based on common
fragmentation patterns
Materials:
Catherine Fenselau's 1973 "Mass Spectral Interpretation File," published by the J.
Hu ley Association in Merion, Pa (check the nearest University library) or the notes
for some of the spectra she reviews that follow this plana slide-projector (if utilizing the slideshow)"Common Mass Spectrum Fragments" from Paul Young's tutorial on spectroscopy at
the University of Illinois, Chicago; found on an internet search on Netscape 2.0 underMurray's Mass Spectrometry Page click on Mass Spectrometry Resources,Information and Archives, Tutorial: Mass Spectrometry under the heading Education,and then Common Ions and Fragments to pull up the listing (the list is provided with
this lesson for your convenience)computer with Netscape 2.0 if you choose to locate the "Common Mass Spectrum
Fragments" yourself
Note: m/z is represented as m/e in these spectra
159

Procedure:
The teacher may opt to utilize the slideshow or use the notes of the first twospectra taken from Fenselau's work to teach the material. If the slideshow is used, theinstructor will need to load the slides into the projector and play the accompanying audiotape while the students listen to and watch the presentation. (The teacher may opt to setup the projector at a work station for the students as part of this unit. I would recommendthis be done based on the learning rate of the students. This material can get veryconfusing if the students are left to themselves.) The instructor should provide a copy ofthe "Common Mass Spectrum Fragments" (accompanies this lesson) to each student priorto the presentation to familiarize them with the common fragmentation patterns found inmolecules. The instructor should pause and ask the students if they understand thepresentation every so often and ask them to refer to the "Common Mass SpectrumFragments" worksheet during the presentation to identify the various peaks shown in thespectra under analysis.
** Students should be able to identify the peaks in a mass spectrum given the structure ofa molecule and the fragmentation patterns, not predict the patterns themselves nor namethe name/structure of a molecule these are higher order skills to be developed at thecollege level.
Assessment of Student Achievement:
The quiz that follows the material in this lesson exams the students' knowledge ofthe material. Each question is worth 25 points, for a total of 75 points. I recommendawarding 25 points to the students for participation during the presentation. A scorebelow 50 on the quiz would suggest that the student does not understand the material welland needs to review his/her notes before moving on with the other activities in this unit,especially the group project.
Whether utilizing the slideshow or the notes from Fenselau's file, ten unknownsare given in Fenselau's presentation to quiz the students on their understanding of thematerial. Included with this lesson is the unknown spectra acetone. The instructor needsto be familiar with the fragmentation patterns of the unknown to answer studentquestions. The spectra for acetone could easily be misunderstood for butane if thefragmentation patterns are not noted. Have the students use the common fragmentationpatterns provided to identify unknown compounds. Correct identification of the unknownacetone would indicate that the student has a good understanding of the material. Next,provide the students with the name and structure of the unknown molecule and ask themto use the common fragmentation patterns to identify the peaks shown in the spectrum.Identification of the peaks for the unknown, given this added information, would indicatethat the student has an average understanding of the material.
160I _S-3

Reteaching Option:
If the students are not able to correctly identify the peaks, review the knowns,identifying the peaks present. Then, analyze the unknown a second time with thestudents. When the students are comfortable with identifying the fragmentation patterns
and peaks on the spectrum, ask them to analyze other unknowns that you provide.
Enrichment:Some enrichment opportunities are as follows:
1. Identifying all ten unknowns in Fenselau's presentation or other spectra that the
students locate.2. Presenting the unknown identifications to the class.3. Extending this material to identify an unknown for a science project, working with a
mass spectrometry laboratory.
** I recommend that the instructor come back to the material learned in this uniton mass spectrometry and, in particular, spectral analysis after the students havelearned about naming compounds and organic molecules. Ask the students toidentify those molecules and compounds used to study fragmentation patterns inthis unit i.e. the naming of heptane, cyclohexanol, etc...

Common Mass Spectrum Fragments
Use the Back Arrow to return to a spectroscopy problem
Return to Mass Spectrum Home Page
Commonly Lost Fragments Common Stable Ions
m-15 CH3mie = 43 CH -C
m-17 OH
m-26 CN
m-28 H2C=CH2
m-29 CH2CH3 CHO
m-31 OCH3
m-35 CI
m-43 CH3C =0
m-45 OCH2CH3
m-91 CH2
mie = 91 CH2
011+mle = m-L c C
The lists given above are by no means exhaustive and represents only the simplest and most commonfragments seen in the mass spectrum.
Use the Back Arrow to return to a spectroscopy problem
Return to Mass Spectrum Home Page
Copyright 1995, Paul R. Young, University of Illinois at Chicago, All Rights Reserved

100
BenzeneIn a mass spectrum the ions are
80 presented according to the ratio oftheir mass to charge (m/e). The
; peak in the spectrum which
Crepresents the most abundantly
t 60 formed ion species is usually plotted
C with an intensity of 100 %. Theintensities of peaks representing allother ions are plotted relative to this.
: 40 Benzene has a molecular weight of
it78 amu. The peak at m/e 78, which
...1represents the molecular ion, is also
il: 52 the base peak, or the most intense
20 peak in the spectrum.
20
100 -
80-1..
60-z
l; 40-
40
111
20 40
60
AVE
52
80
M79
100
60 80 100
M/E /
PyridineThe molecular ion peak occurs at
m/e 79, and is also the base peak inthe spectrum. Molecular weight isusually the most important piece ofinformation which can be obtainedfrom the mass spectrum of anunknown sample. Only compoundswhich contain odd numbers ofnitrogen atoms - pyridine, forexample -have molecular weightswhich occur at odd numbers.Interpretation of a spectrumrequires comparison of the massof each fragment ion to the mass ofthe molecular ion, and considerationof the mass of the neutral fragmentwhich has been eliminated. Thesecond most intense peak in thespectrum of pyridine occurs at m/e52, and represents ions formed bythe loss of 27 atomic units fromthe molecular ion. The neutralfragment eliminated is known to beHCN.

100
80-
17)
60-
40-
20-
h Iti 1
20 40
Bromobenzene
u-8r]+77
79 81Br Br
tc60 i 80 100 120 140 160
M/E
This spectrum contains two molecular ion peaks which represent ionscontaining the two isotopes of bromine, Br79 and BrBl. The naturalabundances of these isotopes are nearly equal. Mass spectrometry isthe best way to measure the abundances of stable isotopes in amolecule.
1641s7

100-
80-
7;z
60-z
>40-
Wat
20-
43
29
29 57 85
5771
1 III 1 I I I
20 40 60 80 100 120
M/E
43
4.
M
85I00
71
Heptane
Every C-C bond in this simple hydrocarbon is broken to produce a
series of ions 14 mass units apart. In some ions, C-H bonds have
been cleaved as well. For the most part you will be interested in
the fragmentation characteristic of various functional groups.
However, every spectrum of an aliphatic compound will contain some
hydrocarbon peaks of the type seen here. The peak occurring one
mass unit above the molecular ion peak represents molecules containing
one C13 atom. The natural abundance of such moleculdi will be 1.1
percent for every carbon atom present. Thus the molecular ions of
mass 101 should be 7.7% as abundant as the molecular ion of mass 100.
165is-a?
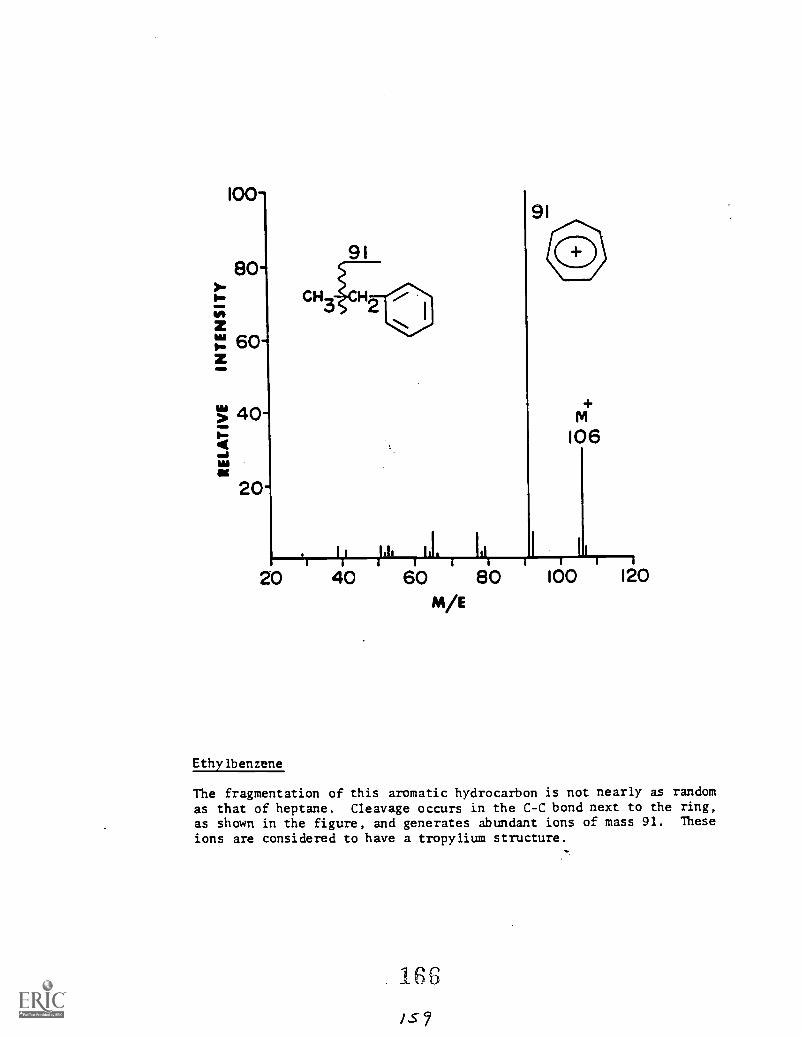
100-
80-I-
z60-
z
> 40-,-Weg
20-
CH
91
91
M
106
20 40 60 80 100 120
M/E
Ethylbenzene
The fragmentation of this aromatic hydrocarbon is not nearly as randomas that of heptane. Cleavage occurs in the C-C bond next to the ring,as shown in the figure, and generates abundant ions of mass 91. These
ions are considered to have a tropylium structure.
166

100-
;!60-C
40-
W
20-
20
w0-
80-
60-z
>a 40-
IM
20-
CH=04-H "120}:31 56 43
CH CH CH3 2 1-ButanolThe elimination of H2O from
31 the molecular ion is characteristic ofall but the shortest aliphatic alcohols.The abundant ions of mass 31 areformed by scission of the C-C bondnext to the hydroxyl group. This
may be termed alpha cleavage.
174.M
40 60 80 100
20 40
M/E
OH
66
M+
94
60 80 100
M/E
PhenolThe molecular ion peak is also the
base peak in the mass spectrum of
this aromatic compound. Ions ofmass 66 are known to be formed byelimination of CO from some of the
molecular ions.

I00
80p.
zIW 60-z
20-
Fig. 42
20
57
t111111I
40 60
M/E
UNKNOWN
(CYCLOHEXANONE REACTION PRODUCT)
82
M100
80 100
CyclohexanolThe molecular ion M+ for the molecule is shown at m/z=100 and is depicted
structurally as o) -r The peak at m/z=82 is the
and the peak at m/z=57 is the C9 Rci fragment.
168
fragment

100-
I; 40-
20u
20
Fig. 43
31
45
(Jill
UNKNOWN
59
M
74
II ill i I I
40 60 80 100
MiE
DiethyietherThe molecular ion M+ for the molecule is shown at m/z=74 and is depicted
structurally as \:,e,l-13 CiALO 0-11C1-lilThe peak at m/z=59 is the CP3Ctit00-12,4. fragment,
the peak at rn/z=45 is the C,i1 c+ fragment, and the peak at zn/z=31 is the
C 3 0 fragment.
14,
1 6 9

Advanced Organizer: Research Experience
Level:Chemistry I (H) or Chemistry II
Suggested Scheduling:1/2 of a traditional bell schedule with optional discussion time (50 min each):30 min of a block schedule with optional discussion time(1 hr 30 min):
Purpose:The purpose of this activity is to familiarize the student with the type of
experiences that a research team undergoes when trying to make a break through. Thisactivity will prepare the student for the group project/experiment in this unit.
Objectives:Upon completion of this lesson, the student will be able to:
1. make decisions and explain the reasoning behind his/her decisions2. critically evaluate what he/she learned via the experience3. compare the experience to one that a research team might undergo
Materials:the worksheet entitled "Research Experience Simulation"
Procedure:The instructor will distribute a copy of the worksheet "Research Experience
Simulation" to the students and ask the students to respond to the four scenarios provided.After all students have responded, the instructor may choose to utilize the remainder ofthe period or an additional 10-15 minutes discussing the students' responses to thescenarios.
Assessment of Student Achievement:The student's success will be based on his/her ability to answer each question and
evaluate his/her responses.
Reteaching:In the event that a student does not explain his/her choice to the provided
scenarios, the instructor may choose to meet with the student individually and review thescenarios with him/her. Another option may be to team up the student with anotherstudent and ask that the two students discuss the scenarios and explain their choices toeach other. After the student has had an opportunity to reason out his/her choice, he/shemay have the opportunity to explain his/her choices for credit.
170

Research Experience Simulation
You are part of a team entering the National Cake Bakers Annual Contest. Formonths, your team has been developing an innovative recipe for a creamy fudge marblecake. You expect to take top honors in the contest. In order to do so, your team has to
prepare, bake, and frost the cake on sight within one hour. Afterwhich, a panel of judgeswill evaluate your masterpiece. (There's no cheating involved. Each table is watched by
an "official timer" i.e. the guy with the stopwatch in his hand brooding over your group.)Read through the following scenarios and answer the questions that follow with at least
two sentences with legitimate answers. Please respond to the questions on your ownpaper and submit the answers for credit.
1. After setting up your booth, you and your team members begin to look for all of theneeded ingredients. Your recipe calls for six eggs (remember we're serving quite a few
people - judges, competitor, etc...) and you discover that you only have five in the carton.
You could (a) send someone to the nearest grocery store which is five miles away and
lose valuable time (remember he has to get to his car which is parked about that far
away), (b) borrow one from another group, or (c) change the recipe and risk ruining the
product?
Pick one option and explain why you chose that one.
2. You've now got the egg situation taken care of and your team begins to combine theneeded ingredients into a large mixing bowl. The bowl is part of an electric mixer. After
30 seconds, the mixer begins to make a horrible sputtering sound and quickly dies. Notsure of the cause of the problem, you must choose to (a) send a member to the nearestcontest director to have the power outlet checked, (b) have someone begin mixing thelarge amount of batter by hand, or (c) see if by chance someone will let you borrow their
mixer (not very likely)?
Pick one option and explain why you chose that one.
3. OK, the batter is now mixed up and ready to pour it into the cake pans. First,however, someone needs to grease the pans. Your group has always used Butter Flavored
Pan to grease the pans. You guessed it! Someone bought the Original Flavored Pam. Doyou (a) use it anyway and risk having the cake flavor tainted with, (b) send someone tothe same store five miles away, or (c) just use butter to grease the pans?
Pick one option and explain why you chose that one.

4. After 30 minutes, the cake is finally done. The judges will be making their rounds inthe next 10 minutes. The only step left is to frost the cake. While the cake was baking,some of your team members prepared the frosting. Whew! Right now, the cake iscooling on a rack. You look forthe decorative cake plate you had hoped to set yourcreation on for judging and discover that it was cracked somewhere along the way. Doyou (a) put the cake on the plate and hope that it covers the crack well enough duringjudging that no-one notices, (b) put the cake on a paper plate and revel in the attitude"Who cares!", or (c) super glue the plate together?
Pick one option and explain why you chose that one.
After all of the problems along the way, the judging is finally over. Much to yoursurprise, another group, also introducing a new recipe for creamy fudge marble cake, tooktop honors and your group was given honorable mention.
The experience you have just gone through is very similar to that which a researchteam experiences when trying to make a breakthrough that has not been made before.
Two final questions:
1. Having been a part of this experience, what have you learned? (5 sentence minimum)
2. What comparisons can you make between this experience and one that a research teammight undergo? (5 sentence minimum)

Time-of-Flight Mass SpectrometryGroup Project/Experiment
Level:Chemistry I (H) or Chemistry II
Suggested Scheduling:3 traditional bell schedules (50 min each):
1 for expt., 1 for preparing presentation, & 1 for presenting and evaluating2 block schedules (1 hr 30 min):
1 for expt. and putting together presentation1 for finishing up presentation, presenting, and evaluating
Purpose:The purpose of this lesson is to provide the student with an opportunity to
participate in a group project/experiment using his/her knowledge on time-of-flight massspectrometry. The lesson should follow an advanced organizer on undergoing a reseachexperience. The student will be expected to contribute equally to his/her team to thesuccess of the project. The teams will be required to meet specific guidelines for theirproject. The student will have an opportunity to improve on and utilize his/hercommunication skills in a presentation given by the group regarding their project.Each member will be asked to critically evaluate themselves, the group, and one otherteam. These evaluations are designed to encourage the student to make any necessarycorrections in his/her behavior regarding future group assignments.
* The instructor should simulate his/her own ToF apparatus beforehand to determinewhich materials would work best, are safer to use in his/her classroom, etc...
Objectives:Upon completion of this lesson, the student will be able to:
1. understand more fully the principles of time-of-flight mass spectrometry via a handson time-of-flight mass spectrometry simulation experiment
2. accept/reject his/her team's simulation design and explain why3. critically evaluate him/herself, his/her group, and one other team's project/expt.
Materials:suggested materials for building the ToF apparatus are listed on the assignment pageand may be altered according to those materials available to the instructor; each teamwill need a stopwatch or second hand to record the time-of-flightthe assignment entitled "Time-of-Flight Mass Spectrometry GroupProject/Experiment"
Ago 173

Procedure:Divide the students into teams and give them the assigment several days in
advance and instruct them to bring the materials they plan to use (from the list), if theyare not provided by the school, the day of the experiment simulation. Explain to thestudents that they will have to use their notes and all that they know about time-of-flightmass spectrometry to build their apparatus. (an example is attached)
Allott the students time to build their experimental device, perform theexperiment, present their project to the class, and submit their evaluations. (See"Suggested Scheduling" above.)
See attached pages for the assignment and evaluations.
Assessment of Student Achievement:The assessment will be seen in the student's evaluation of his/herself, his/her
group, and his/her peer group. The lesson will be deemed a success if the student has(1) an average understanding of time-of-flight mass spectrometry, (2) has criticallythought about his/her experiment, (3) has critically thought about his/her contribution tothe experiment, and (4) has critically thought about his/her peers' experiments. Credit forthe experiment and evaluations is explained in the assigment. As always, the instructormay modify the point values to his/her class and their needs.
Reteaching:This lesson follows a series of lessons regarding mass spectrometry and time-of-
flight mass spectrometry. If the student does not appear to understand these conceptswell enough after this project, the student may either (1) study some of the material againand be quizzed individually or (2) explain some of the more simple concepts that massspectrometry is based on i.e. the mole, the molecule, calculating molecular mass,identifying the charge on a molecule, etc...
The instructor should remember that this lesson is part of a unit designed tochallenge students to go beyond the state standards established for Chemistry andparticipate in a unique research experience. Not all of the students participating in thisexperience may be up to the level expected by the instructor.
Enrichment:Some enrichment opportunities regarding Mass Spectrometry and/or Time-of-
flight Mass Spectrometry are as follows:
1. Performing an internet search and reporting on the information made available.2. Writing a report, utilizing several resources. Resources might include the internet, a
University library, and/or a trip to a mass spectrometry laboratory or research facility.3. Taking a field trip to a mass spectrometry laboratory and reporting on the findings.
An evaluation sheet is provided with this lesson and may be used for this trip and/orany other field trip to a laboratory or research facility. Scheduling the class, as awhole, to go might be more beneficial.
174/ to 7

Tim
e-of
-flig
ht s
imul
atio
n
Rec
omm
enda
tion:
Tea
cher
onl
y gi
ve o
utsu
gges
tions
toth
ose
who
ask
i.e.
mak
e th
emth
ink!
targ
ettim
e-of
-flig
httu
be
0 ion so
urce
Exa
mpl
es: so
urce
= m
ouse
trap
, min
i see
-saw
usin
g to
ngue
depr
esso
rs &
woo
den
bloc
ks,
slin
g sh
ot
targ
et =
car
dboa
rd,p
oste
rboa
rd, d
artb
oard
ion/
frag
men
t = p
ing-
pong
bal
lsw
/vel
cro,
sty
rofo
am b
alls
,m
arbl
es
time-
of-f
light
= to
ilet p
aper
/pap
erto
wel
tube
, pos
terb
oard
rol
led
up
tube
175
176

Time-of-Flight Mass SpectrometryGroup Project/Experiment Assignment
Purpose:The purpose of this lesson is to provide you with an opportunity to be a part of a
team and use your knowledge on time-of-flight mass spectrometry to help simulate atime-of-flight mass spectrometry experiment. You will be expected to contribute equallyto your team to the success of the project. Your team will be required to meet specificguidelines for their project. You will also have an opportunity to improve on and utilizeyour communication skills in a presentation given by your group regarding your project.Each member of your team will be asked to critically evaluate themselves, your group,and one other team. You will be expected to be honest with yourself regarding theevaluations. Your instructor will be the only person to see your evaluations, unless youchoose to show them to a peer.
Objectives:By the end of this lesson, you will be able to:
1. understand more fully the principles of time-of-flight mass spectrometry via a handson time-of-flight mass spectrometry simulation experiment
2. accept/reject your team's simulation design and explain why3. critically evaluate yourself, your group, and one other team's project/expt.
Materials:
You may choose from the following list of materials, unless your instructor hassaid otherwise. Please check with him/her regarding the availability of these materials.
* cardboard * saran wrap * aluminum foil * toothpicks* styrofoam balls-
all sizes* flashlights * toilet paper * paper-towel
tubes* glue * tape (any kind) * sling shot * mouse traps* velcro * dart board * cloth * chalk* markers * construction paper * stopwatch * graph paper* tongue depressors* posterboard
* graph paper * marbles * wooden blocks/triangles
Your team will need a timing device of some kind. A stopwatch or second handwatch will suffice.
177
/

Requirements/Procedure:
Your team will be required to simulate a time-of-flight mass spectrometry
experiment, using only the materials listed(unless otherwise specified by your instructor.)
Yes, you are to build a model of a time-of-flight mass spectrometry apparatus andrun an experiment! Is this going to be easy? Of course not, however, you and yourother team members are being asked to combine what you know regarding time-of-flightmass spectrometry to simulate an experiment and meet the following requirements. Eachteam will be given a molecule/compound name to "perform" the experiment on (ask your
instructor). You will need to design your own source i.e. something to give yourions/fragments a "kick" and/or push them off. You willalso only be able to measurethe time-of-flight of one ion/fragment at a time. As this is not an "easy" assignment,please take the next few days to come up with a design for your experiment. Time is of
the essence in order for your team to produce a quality product for grading. You areasked to submit a report with all of your information (in a folder/binder - neatly arranged
and written) as well as to give a presentation to the class regarding your experiment.
Your team must:
1) Draw and label the fragmentation patterns for your molecule/compound. (You will
need to look up the information on your molecules for this part.)
2) Provide data for 5 runs regarding:
a) the time-of-flight of each anticipated fragment/ion (use stopwatch/
stopwatch)b) the m/z ratio for each fragment/ion (use the periodic table;
z=1 for our purposes)c) graph the time-of-flight of the anticipated ions/fragments plotting the
m/z on the x-axis and the time-of-flight on the y-axis (please color codeyour fragments/ions to be able to distinguish between them)
Please put your data from (a) & (b) in chart form.
3) Draw a diagram of your apparatus. Please do not dispose of your apparatus. You willbe asked to show the class what you came up with.
4) Answer the following questions in a brief essay of explanation for each one:
1. Did the time-of-flights correspond to the anticipated fragmentation patterns i.e.
did the lighter ions/fragments reach the "detector" faster? Why or why not?
2. What materials did you choose for your simulation? Did they work well?
Why/why not?
1'73
70

Mass Spectral Analysis Quiz
Answer the following questions. Each question is worth 25 points.
1) What is the purpose behind generating a mass spectrum?
2) List two common fragmentation patterns seen in molecules and their m/z values.
3) What do the peaks in a mass spectrum represent?
Answers:
1) To show the m/z values for each fragment/ion in an effort to identify unknowncompounds.
2) CH3 @ m/z=15, CH3CH2 @ rn/z=293) The m/z values for the common fragmentation patterns of molecules.

100
80-
r: 60-z
"a 40-
Wet
20-
Fig. 40
43
Ilk
UNKNOWN
M58
1 '% ills20 40 60 80 100
M/E
kcetoneThe molecular ion M+ for the molecule is shown at rn/z=58 and is depicted
:tructurally as ett3C C t!.;
It
The peak at m/z=43 is the Ci-l3c + fragment.

5) Present your project/experiment to the rest of the class as a team, using the data youcollected (you may choose to do an average graph of all of your runs to show theclass.)
6) Fill out a (1) self-evaluation, (2) group evaluation, and (3) a peer presentationevaluation and submit in your report. There is no need to read each other'sevaluations - these evaluations should be kept confidential. Your cooperation isappreciated.
Point Values:The following is a list of the point values for each part of this project. Please
make note, as your grade will depend on each part.
50 pts. Building an apparatus and performing the experiment.
20 pts. - Drawing and labeling the fragmentation patterns for your molecule/compound.
30 pts. - Providing data for 5 runs regarding (6 pts each run; each part worth 2 pts):
a) the time-of-flight of each anticipated fragment/ionb) the rn/z ratio for each fragment/ionc) graph of time-of-flight versus ink
10 pts. - Data in chart form.
20 pts. - Diagram of your apparatus.
20 pts. - Answering the essay questions. (10 pts each - make sure you answer thoroughly)
50 pts. - Presentation:
10 pts. - organization10 pts. - originality5 pts. - team effort
10 pts. well thought out10 pts. - clearly presented
5 pts. - reproducibility
60 pts. - Evaluations (20 pts each for completion):
40 pts. - Report submitted in a neat and organized format including all necessaryinformation and a title page listing all group members; due 1 period/block followingpresentation
Good luck on this assigment! If you have any questions, don't hesitate to askthe instructor.

NameGroup #
Self - Evaluation
Please answer the following questions. You are expected to be honest withyourself regarding your responses. Completion of this evaluation will count toward your
grade on the group project. Remember that everyone will receive a grade based on theirindividual participation as well as the work performed by the group as a whole. Theinstructor will be the only one to see this evaluation unless you show it to someone onyour own.
1) What were your responsibilities for this experiment/project?
2) Do you feel that you contributed equally to this experiment? Why/why not?
3) What would you personally have done differently if given the opportunity to re-do
this experiment/project?
4) What did you learn from participating in this experience?
182
17q

NameGroup #
Group Evaluation
Please answer the following questions. You are expected to be honest withyourself regarding your responses. Completion of this evaluation will count toward yourgrade on the group project. Remember that everyone will receive a grade based on theirindividual participation as well as the work performed by the group as a whole. Thisevaluation will only be seen by the instructor unless you show it to someone on your own.
1) Do you feel that everyone in your group contributed equally to thisexperiment/project? Why/why not?
2) If given the opportunity to redo this experiment/project, what suggestions do you havefor the group?
183
/ 7s-

Group # evaluated
Presentation Evaluation (by Instructor)
Your presentation grade is based on my evaluation, however, please review theevaluation performed by your peers as well to make any necessary improvements forfuture group assigments.
(Max. points possible)
(10) organization
(10) originality
(5) team effort i.e. can you tell everyone equally participated
(10) well thought out i.e. how well your team thought out the design for
the experiment
(10) clearly presented/explained
(5) reproducibility i.e. based on their information, could you reproducetheir experiment
= Total
Comments:
7 Co
1S4

Group # evaluated
Presentation Evaluation (by Peer)
Please designate point values for each category listed below regarding thepresentation of the group you are evaluating. You are expected to be honest regardingyour responses. Your peers' presentation grade is based on the instructor's evaluation,however, your evaluation may affect their score as well. Completion of this evaluationwill count toward your grade on the group project. Remember that everyone will receivea grade based on their individual participation as well as the work performed by the groupas a whole.
(Max. points possible)
(10) organization
(10) originality
(5) team effort i.e. can you tell everyone equally participated
(10) well thought out i.e. how well they thought out the design for theexperiment
(10) clearly presented/explained
(5) reproducibility i.e. based on their information, could you reproducetheir experiment
= Total
Comments:
185177
Name
Laboratory trip/Research facility Evaluation
This evaluation is worth 20 points total. The remaining 80 points are based onyour participation and behavior on the trip. Please be honest and thorough in yourresponses, as it will help us in scheduling future trips that are geared toward your interestsand help you learn the best.
1) What two things at the laboratory peaked your interest during our visit? Explain alittle about each. (10 points)
2) What would you have liked to see or see more of during our visit?
186

Enrichment Examples
The following sheets are examples of material found on the internet via Netscape2.01. The library information shown can be found on TexasA & M's home page under the Evans Library heading. Other major universities includetheir own home pages on the internet where library listings can be accessed.

A °a
Murray's Mass Spectrometry PageA Collection of Links to Mass Spectrometry Internet Sites
[ Search I Discussion I Groups I Companies I Resources I Software
SectionsUse the text menu bar at the top and bottom of each page for fast navigation.
Mass Spectrometry GroupsHome pages of mass spectrometry centers and research groups.
401 Mass Spectrometry CompaniesWeb sites for companies that manufacture mass spectrometers.
Mass Spectrometry ResourcesMiscellaneous internet mass spectrometry resources.
Mass Spectrometry SoftwareMass spectrometry utility software: links to programs and other index pages.
cal SearchSearch this page, the WWW, or Usenet groups.
DiscussionDiscussion forums for mass spectrometry. Mass spectrometry employment posts, general discussion.
and comments about this server.
Mass Spectrometry E-Mail ListserverAnother experiment in mass spectrometry electronic discussion.
GO Site InformationContains a site submission link and server information and statistics.
01995 Kermit K. Murray
led
188

Introduction to Mass Spectrometry (MS)***Pr*** *************MT.TM************************* 71.**M0***MW.********WM***
IntroductionMass spectrometers use the difference in mass-to-charge ratio (m/e) of ionized atoms or molecules to separatethem from each other. Mass spectrometry is therefore useful for quantitation of atoms or molecules and alsofor determining chemical and structural information about molecules. Molecules have distinctive fragmentationpatterns that provide structural information to identify structural components.
The general operation of a mass spectrometer is:
1. create gas-phase ions2. separate the ions in space or time based on their mass-to-charge ratio3. measure the quantity of ions of each mass-to-charge ratio
The ion separation power of a mass spectrometer is described by the resolution, which is defined as:R = m / delta m,where m is the ion mass and delta m is the difference in mass between two resolvable peaks in a massspectrum. E.g., a mass spectrometer with a resolution of 1000 can resolve an ion with a m/e of 100.0 from anion with an m/e of 100.1.
Instrumentation
*****,...***I9*****".**I.... , ..*****.******,.....**** ,
in general a mass spectrometer consists of an ion source, a mass-selective analyzer, and an ion detector. The.nagnetic-sector, quadrupole, and time-of-flight designs also require extraction and acceleration ion optics totransfer ions from the source region into the mass analyzer. The details of mass analyzer designs are discussedin the individual documents listed below. Basic descriptions of sample introduction/ionization and ion detectionare discussed in separate documents on ionization methods and ion detectors, respectively.
Mass analyzer designs:
Fourier-transform MSIon-trap MSMagnetic-sector MSQuadrupole MSTime-of-flight MS
Further Information
Science Hypermedia Home Page
Copyright © 1996 by Brian M. Tissue
updated 2/23/96
189/ 9/

Dorothy ChavezElementary Education
Gattis Elementary School, Round Rock ISD
ttAj..s
Texas Parks & Wildlife, AustinNancy Herron, Mentor
10

CURRICULUM IMPLEMENTATION PLAN
TEACHER: Dorothy Vaughan Chavez, Ph.D.
MENTORS: Bob Murphy and Nancy HerronTexas Parks and Wildlife, Austin, Texas
GOAL: To give students the opportunity to do research about theecoregion of Texas in which they live and, as authors of thatresearch, to share the information across Texas via the Internet.
OBJECTIVES: 1. Students will define "ecoregion" and apply itsmeaning to the region in which they live.
2. Students will use group processing skills todetermine the topic of their research:
natural resources,cultural resources,natural and cultural resourcesissue analysis and action plan
3. Students will identify and use all local resources aspart of their research.
4. Students will contact "Explore Texas" at TexasParks and Wildlife (TP&W) and other stateagencies, commissions, and departments to requestinformation from the experts in the field of researchafter doing their basic research.
5. Students will compile a group report to be submittedto "Explore Texas" for publication on the TP&Wweb pages of the department's Web Site.
6. Students will communicate with students from otherschools via the Internet to further share what theyhave learned.
Due to the nature of this paper, Nancy Herron edited the final copy to meet therequirement of Texas Parks and Wildlife.
* Any items referred to as being in the appendices may be obtained by writing: TexasParks and Wildlife; Attn: Explore Texas; 4200 Smith School Road; Austin, Texas 78744.

Exploring Texas
TABLE OF CONTENTS
Welcome to Exploring Texas 1
Environmental Literacy 2
Looking at Natural Resources 6
Looking at Cultural Heritage 8
Texas Ecoregions 9
The Curriculum Connection 19
Tackling Issues19
Choosing a Project 20
The Web Connection22
Submitting the Project Description 22
Let the Expedition Begin23
Working with Texas Parks & Wildlife 23
Submitting Your Web Pages 27
Field Test Evaluations 27
APPENDICES:
Resources
TEAN Guide
Web Page Style Guide
192
page)

Your students or youth groups are about to embark on an exciting and memorableWelcome to learning adventure. At the end of the journey await several unique opportunities -- to be
authors on the Internet to create a legacy of Texas resources as seen through their eyesExploring and creativity and most importantly, to interact with others about the wonders of where
they live, their cultural heritage, natural resources surrounding them, or an issue about
Texas which they care deeply.
They will, with your help, choose their project focus and decide how they will expresswhat they've learned. We'll place their web pages in a special section on the TP&WInternet site. We'll be using an "ecoregions" theme, with their pages helping to illustratethe diversity of our state. An "ecoregion" defines a part of the state by its mostcharacteristic vegetation, wildlife, geology, and climate. Your group will be creating abody of knowledge about the natural and cultural aspects of their ecoregion.
This manual will guide you through the process of choosing a project and alert you tosome of the resources available to you. We recommend that you choose a topic thatyou're comfortable with but more importantly that your students or youth group areinterested in exploring. Kids find work more meaningful if they take part in the decision-making process. Choose together the extent and depth of the project. You may choose atopic or issue based on natural resources, cultural heritage, or the interdependence ofpeople and resources (today, yesterday or tomorrow). Observations or exploratoryprojects are appropriate for any age; issues are best addressed by fifth graders and older,since objective observations, evaluations and critical-thinking skills will be key.
TP&W will review your topic with you at the onset of your project. TP&W will assist youwhen possible with materials and identifying informational resources. We'll also provideyou with a template for your web pages.
The project has two goals. Those who explore aspects of their environment will have adeeper understanding and appreciation for the diversity of Texas environment andculture. Those researching an issue will develop citizenship skills: the ability to face adifficult issue, responsibly research positions and impacts to the community, and thenapply critical thinking skills to evaluate attitudes, recommendations, or action plans.
Before you begin, read the following background information. Keep in mind the goal ofhelping prepare our youth to understand their world, and to become "environmentallyliterate."
193
127
page I

nvir6rithentai
era4
We think of "literacy" as the ability to understand and effectively use new informationbased on previously mastered skills. One can face new information or dilemmas, makeobservations based on what's known, question for more information, evaluate the qualityof that information, and apply critical thinking skills to cope, formulate opinions or createaction plans.
Environmental literacy describes the ability to understand and effectively participate indecision-making that affects natural and cultural resources not only how we live today,
but the quality of life for tomorrow.
The need for our youth, tomorrow's decision-makers, to be environmentally literate iscompelling. Texas is an amazingly diverse state facing daunting challenges in the next
decades.
Currently, 18.2 million people live in this state with a projection of over 30 million by theyear 2030. Eighty percent (80%) of our population lives in metropolitan areas. Of that
percentage, almost 67% of all Texans live in nine metropolitan areas.
We're concentrating more people in urban areas, depleting natural habitat andminimizing contact with nature. Additionally, families and communities are striving forways to maintain or reinvest in their cultural heritage to connect today's ever-changing
world with the roots of their past.
Lifestyle choices, legislation, and management of both private and public lands play a keyrole in conservation and preservation. However, the future of resources relies increasinglyon the shoulders of our citizens. Of its 266,807 square miles, Texas has a total of only
about 3% public lands. The stewardship of Texas is truly in the hands of private
landowners.
Educating the public about conservation and management of natural and culturalresources continually emerges as part of the answer to preserving the interests of today's
and future generations.
For guidance, we may turn to an international effort addressing mutual concerns for
conservation. The United Nations convened several conferences that broughtrepresentatives from many countries to address the state of the world's environment. Thefollowing definition of environmental education came out of the 1970 conference in
Stockholm.
Environmental education is a process of developing a world population that is awareof and concerned about the total environment and its associated problems, andwhich has the knowledge, skills, attitudes, motivation and commitment to workindividually and collectively toward solutions of current problems and theprevention of new ones. (UNESCO, 1978)
UNESCO held the First Intergovernmental Conference on Environmental Education, themost notable, in Tbilisi, Georgia, of the former U.S.S.R. Referred to as the Tbilisi
Declaration, the document set forth goals, objectives, and guiding principles to provide acommon beacon and common ground to unite the efforts of environmental educatorsaround the world. The conference provided a foundation for the development of futureprograms (UNESCO, 1977; Engleson, 1991)
page 2

being activejy
involved in tkis
process creates a
lifetime memory
make it fun and
The Tbilisi Declaration: Guiding Principles of Environmental Education
Environmental education should:1. Consider the environment in its totality -- natural and cultural, historical, moral,
aesthetic;2. Be a continuous lifelong process, beginning at the preschool level and continuing
through all formal and nonformal stages;3. Be interdisciplinary in its approach, drawing on the specific content of each discipline in
making possible a holistic and balanced perspective;4. Examine major environmental issues from local, national, regional, and international
points of view so that students receive insights into environmental conditions in othergeographical areas;
5. Focus on current and potential environmental situations, while taking intoaccount the historical perspective;
6. Promote the value and necessity of local, national and internationalcooperation in the prevention and solution of environmental operations;
7. Explicitly consider environmental aspects in plans for development and growth;8. Enable learners to have a role in planning their learning experiences and
provide an opportunity for making decisions and accepting theirconsequences;
9. Relate environmental sensitivity, knowledge, problem-solving skills, andvalues clarification to every age, but with special emphasis on environmentalsensitivity to the learner's own community in early years;
10. Help learners discover the symptoms and real causes of environmental problems;11. Emphasize the complexity of environmental problems and thus need to develop
critical thinking and problem solving skills;12. Utilize diverse learning environments and a broad array of educational
approaches to teaching and or learning about and from the environment, with duestress on practical activities and first-hand experience.
Effective environmental education develops an environmentally literate citizenry. Effectiveenvironmental education guides not what to think, but how to think environmentally, that is, interms of the "whole" -- recognizing the interdependence of the social, economic, political, andnatural influences. An environmentally literate person gains awareness and knowledge, learnsto gather and to the best of their ability assess new information, and applies critical thinkingskills to decision-making and individual action.
The Guiding Principles from the Tbilisi Declaration clarifies the goal of environmental literacy.Achieving this goal, however, follows a series of subgoals, illustrated in figure 1. This lifelongprocess leads to a citizen choosing positive environmental behavior throughout life. As the tableillustrates, the stages of Perceptual Awareness, Knowledge, Environmental Ethics, Citizen ActionSkills, and Citizen Action Experience are developmental and overlapping. Although not a strictmodel, you may want to compare your project's goal in terms of the age of your youth and asubgoal.
Figure 2 illustrates how these subgoals lead to choosing positive environmental behavior.
The project you choose will contribute toward one or more stages of development towardenvironmental literacy. You may think of the project as helping provide awareness of resourcesor heritage; gaining knowledge or insight; exploring or expressing environmental ethics,learning citizen action skills; or enacting a citizen action experience (such as presenting a well-researched issue to a local governing board for consideration).
ONIMINIMININIONIImmormedipwrommumnipmsruseraillelasmooligoliemmismolyprrowriollemmorMlyrel paee 3

Figure 1: Wisconsin Curriculum Model for Environmental ,ducation
SUBGOALS
K: 2 3 4 5 6 , 8 9 :10: 11:12
Perceptual Awareness
I I I I I I tI I I I t I I I I
I I I I I I I I tt i I I I I I I I
I I I I I I I I I
I I I I 1 I I I t
I S I I I I I I i
Knowledge
Environmental Ethic
Citizen Action Skills
Citizen Action Experience
I I I I I a
I I I I I I
I I I I I I
a I I I I I
I I I I I I
I I I I t I .
I I I a I a
i I I e I
a I I I a I I
I 6 I I I S I I I
I I I I I I I I I
I I I I I I I I I
I I I I a I I I I
I I I I I I I I I
I I I I I I t

Figure 2: Teaching for Positive Environmental behavior
."1\TIRONA,..
(S8) °I
47.?>

Looking at
NaturalResources
Whether in urban, rural, or suburban communities, we are surrounded by nature in some
form. Learning to notice the pieces of nature around us happens not by accident, but by
deliberate and caring guidance. Learning to understand the sense of ecosystems, the
dependence of species and elements upon each other, takes even greater patience and
guidance. It's a process of discovery and appreciation that may begin with one piece but
ends in the remarkable world of pieces that truly work together.
Your group may begin a discovery of their backyards, a community or state park, a
roadside, or some special place. Observations and accurate records or impressions will
help the rest of us know what and who lives in your ecosystem.
Some groups may choose to identify an environmental problem, caused either by
nature or by humans. They may tackle an environmental issue, the conflict that arises
from how people view problems. (J. R. Gardella, Environmental EducationCurriculum Inventory, School of Education, Northern Kentucky University, 1993)
Investigations of issues, looking at all sides, choosing an action plan, and participating in
a citizenship experience can be very rewarding.
To help understand issues and discuss the impact of behavior and decision making on the
total environment, we've listed below some basic principles of "ecosystems." Don't worry
about mastering all these principles. You may want to refer to some of these ideas,
principles, and laws after your investigation, and see if they fit.
A. First Principle of Ecosystems:All elements needed for life are part of a natural ecosystem. Recycling of wastes
sustains the resources in that system.B. Second Principle of Ecosystems:
Solar energy, which is abundant and nonpolluting, sustains natural ecosystems.
All life on the earth's surface is dependent on the sun's energy for survival.
C. Third Principle of Ecosystems:The producer level of the food pyramid can support the largest population. Plants
support the largest populations, whether people or other living things.
D. Principle of Population Change:Populations increase to the fullest of their potential until they meet with
resistance from the environment, which holds the population in balance. For
example, predatory birds keep rat populations from exploding.
E. Principle of Ecosystem StabilityMaintaining species diversity provides ecosystem stability. Disease or
environmental problems are less likely to adversely affect large parts of the
ecosystem if there's great diversity of plant and animal species.
F. Principle of Species SurvivalSpecies survival depends on maintaining genetic diversity and on minimizing
change within the species.G. Law of Limiting Factors
Living things operate within a range of factors required for life. If even one of the
factors drops below the lower limit or rises above the upper limit, then the
organism feels the effects. When the amount of water in the human body
fluctuates above or below the limits of the optimal range for that factor, the
human body feels stress that ultimately affects growth, reproduction, and
survival.
19819P.
ferrwel111411rummeillipiNmwrislaillimpuoiremilimummuloorm...msaipimammeirpage 6

H. First Law of ThermodynamicsEnergy cannot be created or destroyed but it can be converted from one form toanother.
I. Second Law of ThermodynamicsIn any energy change the amount of usable energy decreases because of theinevitable loss of heat.
J. Principles of the Human Component in EcosystemsHumans use ecosystems to meet their basic needs and desires.Humans are dominant in their ecosystems.Ecosystems affect humans.
(Nebel, 1990; Engleson, 1991)
These brief statements have power in terms of the decisions that humans make abouttheir interactions with the environment. Here is a glimpse of how some of them work.
The sun drives life on earth. The radiant energy that enters our atmosphere is necessaryfor photosynthesis -- the source of all of plant food. As a byproduct of that process, plantsput oxygen into the air and take out carbon dioxide. Change in our environment thatinterferes with the amount of radiant energy that reaches the earth's surface changes theliving and nonliving components of the earth. The potential for harnessing the energy ofthe sun to fuel human needs is highly desirable because of its abundance andnonpolluting quality.
Consider the action of throwing something away. There really isn't an "Away." The objector substance goes somewhere. What are the impacts of placing these objects orsubstances in that place? How may be deal with the "away" place more effectively?.
How much water does the earth have for drinking? You may have learned that the earthcontains about 30% freshwater and 70% saltwater. This doesn't translate to 30%drinkable water, however. Ice caps, glaciers, and sources inaccessible to humans containapproximately 29% of the freshwater. Humans have only 1% available. The most criticalissue to maintaining a sustainable environment today centers on water. What role will yourcommunity play in the availability of fresh water?
As you look at the area around you, refer to these principles and laws. If you wonder ifany of them directly involves your project, let that become part of the research. You mayachieve a new and better understanding of the how the earth works.
199

Looking at
Cultural
Heritage
Culture your history, your way of life, your values and beliefs all shape your living
environment. Attitudes and heritage guide the character of your community today and set
the direction for tomorrow. The richness of a people is reflected in its expressions of
culture, through social structure, religion, arts, industry, justice, economyand
government. And as much as people rely on natural resources for survival, those same
resources are impacted greatly by people. Understanding the history of human interaction
with natural resources provides an additional insight into a culture.
How do you investigate cultural heritage today? Oral and written history. Architecture.
Museums. Historic sites. Clothing. Music. Art. Examining patterns of community and
economic growth or lack of it. Getting to understand the creative expressions and
lifestyle choices of a people. Each thread weaves together into the fabric of culture.
People and artifacts each have a story to tell. In some cases, families pass down the
artifacts and stories from one generation to another and they remain within families.
Other times, the community becomes the keeper of these treasurers as collections and
writings fill libraries and museums. The past comes to life and gives meaning when one
can visualize, smell, hear, and sometimes taste the elements of earlier times (trying
recipes of one's ancestors, for example).
The search for cultural roots reaches back to the first humans who came onto this land.
Archeologists study these ancient peoples through the artifacts and the remnants of the
structures that they left behind, like tools, campsites, and villages. By carefully excavating
the cultural remains of these ancient native Americans, we canunderstand how they lived
and what they believed in. The remains of one of the earliestinhabitants of what is now
Texas were found in the Leander, Texas area on December 29, 1982. The excavation of
the Wilson Leonard Site uncovered the burial remains of a 20 to 30 year old woman
thought to have lived about 10,100 years ago. From those early Native Americans
developed many of the tribes found living here by the Spanish. Following the 200 years of
occupation by Spain and later Mexico, Stephen F. Austin brought the early Anglo-American
settlers into Texas, beginning a continuing influx of people that forever reshaped history.
Is Texas truly a "melting pot" of culture, customs, and beliefs from around the world?
How has one culture been affected by surrounding cultures? What efforts are being made
to preserve cultural heritage, or blend with others?
Who are your local legends are heroes? Why do they remain a part of the folklore of your
community?
Why have certain cultures moved on the land and stayed? What resources did they find
that held them here? How have they impacted resources and how hasthe land impacted
their culture? Natural resources and cultural resources remain interdependent and a
fascinating study.
) 9
page 8

Texas
_coregions
background
information
Diversity defines Texas. From coastal waters to desert mountains, Texas holds a plethoraof plants, wildlife, and people! One way to illustrate Texas' "biodiversity" is to think ofTexas in terms of ecoregions.
Biologists have divided Texas into regions according to several different criteria, based onplant and animal communities as well as topography, geology, soils, and climate. We'vechosen a delineation of eleven natural regions to frame the children's study projects.
To familiarize you with ecoregions, we've included excerpts from a program guidedeveloped at TP&W entitled "Exploring Texas Ecoregions." The guide includes moreinformation as well as learning activities especially suited for investigated rare andthreatened plants and animals. The "Resources" section of this manual gives informationon how to order these and other materials.
As you reflect on interplay of nature and culture, a picture should be forming inyourmind about the importance of helping our youth become environmentally literate citizenswho will be managing these vital resources.
The organization of Texas into ecoregions or natural regions enables us to informstudents about the diverse areas of Texas in an distinct way. By studying the similaritiesand differences of the various natural regions, students gain a practical and relevantperspective concerning how nature (rainfall, geology, plants and animals) and humansthroughout history have shaped the Texas we know today.
Due to its size and geographic location, Texas is unique among states. Covering 266,807sq. miles, 15 of the 50 states could fit within its borders. A large area of land will usuallyhave a great deal of variation in climate and landscapes, factors influencing habitatdiversity. The state has impressive topographic diversity, including 91 mountain peaksthat are a mile or more high. Our geographic location is also important in that easternhabitats meet western ones and southern subtropical habitats meet northern temperateones.
The natural regions of Texas look different from one another, both in terms of the livingaspects (plant and animal communities) and the non-living attributes (topography,geology, soils). Texas is divided into the following eleven natural regions:
1. Pineywoods2. Oak Woods and Prairies3. Black land Prairies4. Gulf Coast Prairies and Marshes5. Coastal Sand Plains6. South Texas Brush Country7. Edwards Plateau8. Llano Uplift9. Rolling Plains10. High Plains11. Trans Pecos
201The accompanying table entitled Features of the Natural Regions of Texas highlights theunique features of each ecoregion, such as size, topography, rainfall, soil types,predominant vegetation, native plant communities, and rare plants and animals.
91-fernumwmaipmm=imammimer.u.............00......4.04

It may be convenient to group some ecoregions in order to satisfy a 7 or 10 day schedule.
The brackets on the list above suggest one way to group the natural regions for study. An
interdisciplinary approach may be used by teaching the science portion of the unit inparallel with social studies, integrating the cultural aspects and geography of the regions
into the social studies curriculum.
The following is a brief description of each of the ecoregions of Texas.
Rolling terrain covered with pines and oaks, and rich bottomlands with tall hardwoods,Region 1 t characterize the forests of the east Texas Pineywoods. This region is part of a much larger
.ine9woocisarea of pine-hardwood forest that extends into Louisiana, Arkansas, and Oklahoma.
The average annual rainfall of 36 to 50 inches is fairly uniformly distributed throughout
the year, and humidity and temperatures are typically high. The soils of the region are
generally acidic and mostly pale to dark gray sands or sandy loams. Elevations range
from 200 to 500 feet above sea level.
Region 2.:
Oak Woods
and Frairies
The Pineywoods region can be described as pine and pine-hardwood forests with
scattered areas of cropland, planted pastures, and native pastures. Timber and cattle
production are important industries in the region. Farms and ranches are relatively small
in size compared to the state average.
Longleaf pine forests once dominated the southeastern part of the Pineywoods. A few
pockets of longleaf pine may still be seen today. Mixed pine-oak forests occur to the west
and north of the longleaf pine area. Dominant trees include loblolly pine, blackjack oak,
and post oak. Hardwood forests of sweetgum, magnolia, tupelo, elm, and ash occur in
the lowlands. Swamps are common and are most outstanding in the southern part of the
pine-oak forest.
The Oak Woods and Prairies region is a transitional area for many plants and animals
whose ranges extend northward into the Great Plains or eastward into the forests. This
region, sometimes called the Cross-Timbers, was named by early settlers, who found belts
of oak forest crossing strips of prairie grassland.
Average annual rainfall averages 28 to 40 inches per year. May or June usually brings a
peak in monthly rainfall. Upland soils are light colored, acidic sandy loam or sands.
Bottomland soils may be light brown to dark gray and acidic with textures ranging from
sandy loams to clays. The landscape of the region is gently rolling to hilly and elevations
range from 300 to 800 feet above sea level.
The region can be described as oak savannah, where patches of oak woodland are
interspersed with grassland. Cattle ranching is the major agricultural industry in the Oak
Woods and Prairies. Introduced grasses such as bermudagrass are grazed along with
forage crops and native grasslands.
/9(p
202
page 10

Region 3:
biackiand
rrairies
Region +
Gulf CoastPrairies and
Marshes
Region 5:
Coastal
Sand Flains
The Black land Prairies region is named for the deep, fertile black soils that characterizethe area. Blackland Prairie soils once supported a tallgrass prairie dominated by tall-growing grasses such as big bluestem, little bluestem, indiangrass, and switchgrass.Because of the fertile soils, much of the original prairie has been plowed to produce foodand forage crops.
The average annual rainfall ranges from 28 to 40 inches. May is the peak rainfall monthfor the northern end of the region; however, the south-central part has a fairly uniformrainfall distribution throughout the year. Typically, soils are uniformly dark-coloredalkaline clays, often referred to as "black gumbo," interspersedwith some gray acidicsandy loams. The landscape is gently rolling to nearly level, and elevations range from300 to 800 feet above sea level.
Crop production and cattle ranching are the primary agricultural industries.
The Gulf Coast Prairies and Marshes region is a nearly level, slowly drained plain less than150 feet in elevation, dissected by streams and rivers flowing into the Gulf of Mexico. Theregion includes barrier islands along the coast, salt grass marshes surrounding bays andestuaries, remnant tallgrass prairies, oak parklands and oak mottes scattered along thecoast, and tall woodlands in the river bottomlands.
Average annual rainfall varies from 30 to 50 inches per year distributed fairly uniformlythroughout the year. The growing season is usually more than 300 days, with highhumidity and warm temperatures. Soils are acidic sands and sandy loams, with claysoccurring primarily in the river bottoms.
Native vegetation consists of tallgrass prairies and live oak woodlands. Brush speciessuch as mesquite and acacias are more common now than in the past. Although much ofthe native habitat has been lost to agriculture and urbanization, the region still providesimportant habitat for migratory birds and spawning areas for fish and shrimp.
The Coastal Sand Plains is fairly level with elevations less than 150 feet above sea level.Average annual rainfall is 24 to 28 inches per year and the soils are primarily windblownsands. The vegetation can be described as tallgrass prairie with live oak woodlands,mesquite savannah, and salt marshes. Woody vegetation is more extensive now than inpre-settlement times.
Most of this region is grazed by cattle. In the past, the Coastal Sand Plains were called the"Wild Horse Prairie" because of the large herds of feral horses roaming here in the 19thcentury.
1?? 203
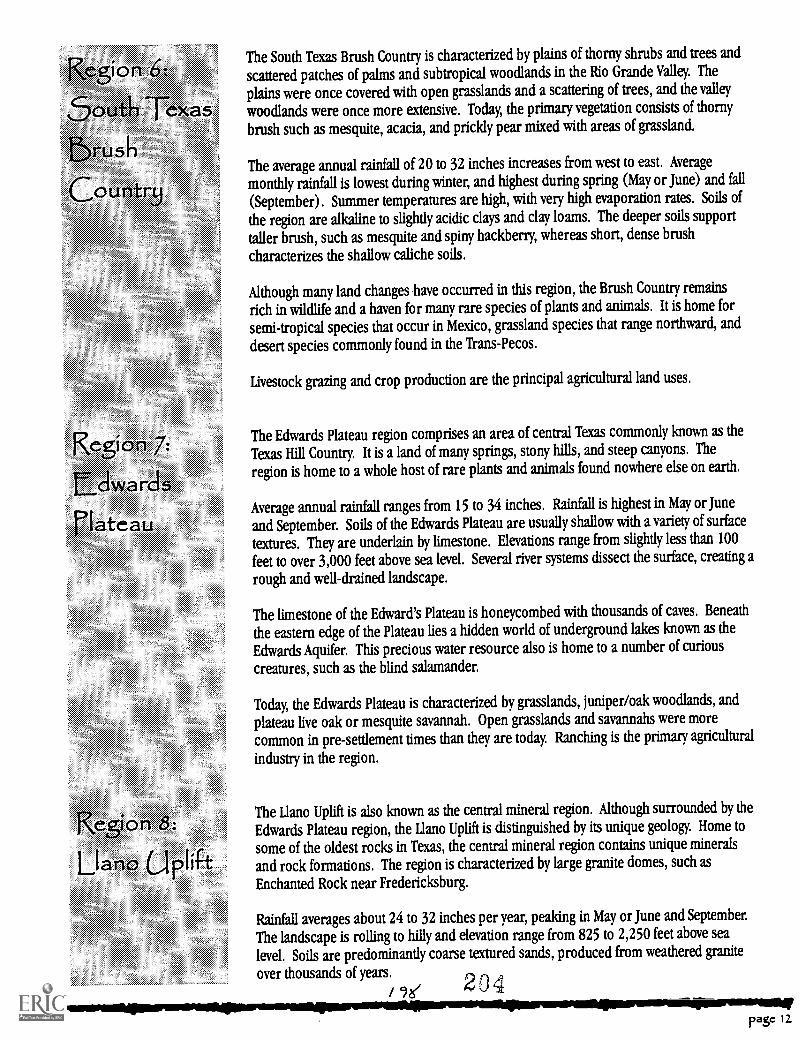
Region .6:
5outh Texas'5rusliCountr
The South Texas Brush Country is characterized by plains of thorny shrubs and trees and
scattered patches of palms and subtropical woodlands in the Rio Grande Valley. The
plains were once covered with open grasslands and a scattering of trees, and the valley
woodlands were once more extensive. Today, the primary vegetation consists of thorny
brush such as mesquite, acacia, and prickly pear mixed with areas of grassland.
The average annual rainfall of 20 to 32 inches increases from west to east. Average
monthly rainfall is lowest during winter, and highest during spring (May or June) and fall
(September). Summer temperatures are high, with very high evaporation rates. Soils of
the region are alkaline to slightly acidic clays and clay loans. The deeper soils support
taller brush, such as mesquite and spiny hackberry, whereas short, dense brush
characterizes the shallow caliche soils.
Although many land changes have occurred in this region, the Brush Country remains
rich in wildlife and a haven for many rare species of plants and animals. It is home for
semi-tropical species that occur in Mexico, grassland species that range northward, and
desert species commonly found in the Trans-Pecos.
Livestock grazing and crop production are the principal agricultural land uses.
Region 7' The Edwards Plateau region comprises an area of central Texas commonly known as the
Texas Hill Country. It is a land of many springs, stony hills, and steep canyons. The
waregion is home to a whole host of rare plants and animals found nowhere else on earth.
E,drcisAverage annual rainfall ranges from 15 to 34 inches. Rainfall is highest in May or June
riateau and September. Soils of the Edwards Plateau are usually shallow with a variety of surface
textures. They are underlain by limestone. Elevations range from slightly less than 100
feet to over 3,000 feet above sea level. Several river systems dissect the surface, creating a
rough and well-drained landscape.
Region 8:
Llano Uplift
The limestone of the Edward's Plateau is honeycombed with thousands of caves. Beneath
the eastern edge of the Plateau lies a hidden world of underground lakes known as the
Edwards Aquifer. This precious water resource also is home to a number of curious
creatures, such as the blind salamander.
Today, the Edwards Plateau is characterized by grasslands, juniper/oak woodlands, and
plateau live oak or mesquite savannah. Open grasslands and savannahs were morecommon in pre-settlement times than they are today. Ranching is the primary agricultural
industry in the region.
The Llano Uplift is also known as the central mineral region. Although surrounded by the
Edwards Plateau region, the Llano Uplift is distinguished by its unique geology. Home to
some of the oldest rocks in Texas, the central mineral region contains unique mineralsand rock formations. The region is characterized by large granite domes, such as
Enchanted Rock near Fredericksburg.
Rainfall averages about 24 to 32 inches per year, peaking in May or June and September.
The landscape is rolling to hilly and elevation range from 825 to 2,250 feet above sea
level. Soils are predominantly coarse textured sands, produced from weathered granite
over thousands of years. 204"e/page 12

Resion
Kalting Mains
Kegion 10:
tick Plains
Native vegetation consists of oak-hickory or oak-juniper woodlands, mesquite-mixedbrush savannah, and grasslands. Open grassland and savannah were once morecommon than they are today. Ranching is the predominant agricultural industry.
Several Texas rivers begin in the gently rolling hills and broad flats of the Rolling Plains.These rivers and their numerous tributaries are responsible for the rolling character ofthe land. The rivers have cut canyons that shelter some plants and animals typical of theRocky Mountains.
Average annual rainfall is 20 to 28 inches, with peaks in May and September. A summerdry period with high temperatures and high evaporation rates is typical. Soils vary fromcoarse sands along outwash terraces adjacent to streams, to tight clays and shales. Soilreaction is neutral to slightly alkaline. Elevations vary from 800 to 3,000 feet above sealevel.
The original prairie grasslands included tall and mid-grasses such as bluestems andgramas. Buffalo grass and other shortgrasses have increased under heavy, uncontrolledgrazing. Mesquite is a common invader on all soils. Much of the Rolling Plains today canbe described as a mesquite-shortgrass savannah. Stream floodplains are dominated byvarious hardwood species, and juniper is common on steep slopes along rivers.
Steep slopes, cliffs, and canyons occurring just below the edge of the High Plains Caprockcomprise the Escarpment Breaks area of the Rolling Plains. The Breaks are an ecotoneor transition zone between the High Plains grasslands and the mesquite savannah of theRolling Plains. Crop and livestock production are the major agricultural industries in thisregion.
The High Plains region, together with the Rolling Plains, comprise the southern end of theGreat Plains of the central United States. The High Plains is a relatively level high plateau,separated from the Rolling Plains by the Caprock Escarpment. Elevations range from3,000 to 4,500 feet above sea level.
Average annual rainfall is 15 to 22 inches. Rainfall is lowest in winter and mid-summerand highest in April or May and September or October. Extended droughts have occurredhere several times this century. Surface texture of soils ranges from clays on hardlandsites in the north to sands in the southern portion of the region. Caliche generallyunderlies these surface soils at depths of two to five feet.
Native vegetation of the High Plains is shortgrass prairie dominated by buffalo grass.Although historically a grassland, mesquite and yucca have invaded parts of the region.Shinnery oak and sand sage are common invaders on sandy lands, and juniper has spreadfrom the breaks onto the plains in some areas.
Immense herds of buffalo and pronghorn antelope once thundered across vast prairies ofblue grama and buffalo grass. Today, the plains are mostly irrigated cropland and thenative vegetation includes more mesquite and juniper. Although much of the shortgrassprairie and the vast prairie dog towns are gone, large flocks of wintering waterfowl stillcome to the playa lakes (shallow, round depressions which spot the surface, sometimescovering more than 40 acres).
/9.9 4r) 0 5

Region 11:
Trans recos
The Trans Pecos is perhaps the most complex of all the regions. It occupies the extremewestern part of the state eastward generally to the Pecos River. This is a region of diverse
habitats and vegetation, varying from the desert valleys and plateaus to wooded mountainslopes. Elevations range from 2,500 feet to more than 8,749 feet at Guadalupe Peak. Eventhe mountain ranges vary greatly in the environments they offer for plant and animal life.Some are characterized by volcanic rocks, others by limestone.
Over most of the area average annual rainfall is less than 12 inches, but varies greatlyfrom year to year and from lower to higher elevations. July and August are usually thehigher rainfall months. Mountain outwash materials have formed the soils of the TransPecos. Surface textures and profile characteristics are varied. Soil reaction is generally
alkaline.
Due to the diversity of soils and elevations, many vegetation types exist in the region. Theprincipal plant communities are creosote-tarbush desert scrub, desert grassland, yuccaand juniper savannahs, and montane forests of pinon pine and oak.
The various subregions reflect the diversity of the Trans Pecos. The Sand Hills areaconsists of shin oak and mesquite on wind-blown dunes. Flat-topped mesas and plateaus
are intersected by steep-walled canyons and dry washes that comprise the StocktonPlateau. Soils with high salt content and gypsum dunes are typical of the Salt Basin area.The Desert Scrub subregion is an area of low rainfall and rapid drainage. Creosotebushflats with yucca, lechuguilla, and various small-leafed plants are common. The DesertGrassland area occurs in the central part of the region and is characterized by deepersoils with high clay content. Finally, the Mountain Ranges have higher rainfall and woodyvegetation such as junipers, oaks, pinon pine, ponderosa pine, and Douglas fit
Ranching is the primary industry in the Trans Pecos region.
21w
1111110www4MINIMANIPM11101111ANIMIlliprormsmaillpormmoulffilleriummiiipmenmemilipirsimpumwpage 1+

E__co Regions of Texas
1. Pineywoods2. Oak Woods & Prairies3. Black land Prairies
4. Gulf Coast Prairies & Marshes5. Coastal Sand Plains6. South Texas Brush Country7. Edwards Plateau8. Llano Uplift9. Rolling Plains
10. High Plains11. Trans Pecos
207

1. P
iney
Woo
ds23
,500
Gen
tly r
ollin
g to
hilly
for
este
d la
nd
36-5
0Pi
ne, o
ak, a
nd o
ther
hard
woo
d
fore
sts
4,,
ir,f
.,;
1?:4
11O
f,11
;/ 7'
4;
Tex
asli-
allin
g Ph
lox
Dee
p sa
ndy
soils
of
long
-lea
f
pine
woo
dlan
dsW
hite
Ilig
kind
Nat
ural
ope
ning
s of
pin
e-oa
kw
oodl
ands
Fed-
cock
aded
Woo
dpec
ker
Pine
woo
ds w
ith w
idel
y-sp
aced
,la
rge,
mat
ure
pine
tree
sB
ald
Eag
le
Bre
edin
g-
In T
exas
, alo
ngri
ver
syst
ems
orbk
esho
res
with
larg
e,ta
ll tr
ees.
Bre
edin
g po
pula
tions
occu
r in
the
east
ern
half
of
Tex
as
Win
teri
ng -
Mos
tly n
ear
larg
ela
kes
and
rese
rvoi
rs. W
inte
ring
eag
les
occu
r in
sui
tabl
eha
bita
t thr
ough
out
Tex
as.
2. O
ak W
oods
and
19,5
00Pr
airi
es
0
Gen
tly r
ollin
g to
hilly
28-4
0O
ak a
nd h
icko
ry w
oodl
ands
;
tall
gras
s pr
airi
es
Lar
g01u
ll al
milj
gdze
nO
peni
ngs
with
in o
akw
oodl
and
on d
eep
sand
s
V.I
mol
tladk
amim
Ope
ning
s an
d dr
aina
gesi
n
post
oak
woo
dlan
ds
Hou
ston
Toa
dPi
ne/o
ak w
oodl
and
or s
avan
nah
on d
eep,
san
dy s
oils
3. B
lack
land
Pra
irie
s25
,500
Gen
tly r
ollin
g to
near
ly le
vel
28-4
0T
all g
rass
pra
irie
s; m
esqu
ite,
ceda
r el
m, s
ugar
berr
y
Tal
l Gra
ss P
rair
ie p
lant
com
mun
ityha
s be
com
e ra
re in
the
Bla
cida
nds
Reg
ion
4. G
ulf
Coa
st P
rair
ies
21,0
00an
d M
arsh
es
Nea
rly
leve
l
208
30-5
0G
rass
es; t
allg
rass
pra
irie
s;liv
e oa
k w
oodl
ands
; som
em
esqu
ite, a
nd a
caci
as
Prai
rie
Daw
nPo
orly
dra
ined
, spa
rsel
yve
geta
ted
area
s in
ope
n
gras
slan
dsSl
ende
r R
ush
Pea/
Sout
h
Tex
as A
mbr
osia
Gra
ssla
nds
or m
esqu
ite la
nded
gras
slan
ds
Tal
l gra
ss c
oast
al p
rair
iePa
ster
n B
row
nO
ffsh
ore
isla
nds,
spo
il is
land
s,m
udba
nks
ME
W :P
AM
Mig
rate
s th
roug
hth
e gr
assl
ands
from
the
Arc
tic tu
ndra
to P
ampa
sgr
assl
ands
of
Arg
entin
a
ftri
pjaa
mW
inte
rs a
long
Gul
f C
oast
;tid
al
mud
fla
ts, m
aws,
or
alga
lflat
s
Who
opin
g C
rane
Win
ters
on
Tex
as G
ulf
Coa
st;
mar
shes
and
san
dals
of
Ara
nsas
Nat
iona
l Wild
life
Ref
uge
and
near
by a
reas
209

5. C
oast
al S
and
Plai
ns4,
000
Fair
ly le
vel t
o
undu
latin
g
24-2
8
6. S
outh
Tex
as B
rush
28,0
00L
evel
to r
ollin
g20
-32
Cou
ntry
It) O
Tal
l gra
ss p
rair
ie, l
ive
oak
woo
dlan
ds, m
esqu
ite s
avan
nah
Bla
ddac
e C
actu
sG
rass
land
s or
mes
quite
inva
ded
gras
slan
ds
Tho
rny
brus
h in
clud
ing
mes
quite
, aca
cia,
pri
ckly
pear
, and
som
e gr
assl
and
area
s
Ash
y D
ogw
eed
Mes
quite
gra
ssla
nd o
peni
ngs
ofth
orny
shr
ubla
nds
on d
eep,
sand
y so
ilsJo
hnst
on's
Fra
nken
laR
ocky
hill
side
s or
sal
ine
day
loam
Oat
s w
ithin
ope
ning
s of
thor
ny s
hrub
land
s;ta
r C
actu
sO
peni
ngs
of th
orny
shr
ubla
nds
on r
ocky
day
loam
soi
ls
Inag
irgi
aSu
btro
pica
l woo
dlan
ds o
nal
luvi
al d
epos
its o
n fl
ood
plai
ns a
nd te
rrac
es o
f th
eR
io G
rand
eW
alke
rs M
anio
cO
peni
ngs
of th
orny
shr
ubla
nds
on s
andy
loam
soi
ls
1811
1181
:Pki
lakA
ZD
ense
, tho
rny,
low
bru
shIn
teri
or k
akm
Bar
e sa
nd, s
hell,
and
gra
vel
beac
hes,
and
bar
s an
dis
land
s, a
ssod
ged
with
rese
rvoi
rs a
long
the
Rio
Gra
nde
7. E
dwar
ds P
late
au31
,000
210
Flat
to r
ollin
g to
stee
p (r
efer
red
toas
the
Tex
as H
ill
Cou
ntry
)
15-3
4Sh
ortg
rass
gra
ssla
nds,
juni
per
shru
bs a
nd o
ak-j
unip
er f
ores
t,m
esqu
ite
Tex
as S
now
bells
Lim
esto
ne e
dges
or
clif
f fa
ces
alon
g pe
renn
al s
trea
ms
Tex
as W
ild -
rice
San
Mar
cos
Riv
er, d
ear,
cons
tant
tem
pera
ture
,sp
ring
-fed
wat
erT
obus
ch F
ishh
ook
Cac
tus
Ash
e ju
nipe
r/oa
k ra
ngel
ands
on r
ocky
alk
alin
e so
ils
Bla
cksa
nsill
mSe
mi-
open
ran
gela
nds
with
adi
vers
ity o
f lo
w g
row
ing
shru
bs
gold
en-c
heck
ed W
arbl
erM
atur
e w
oodl
ands
of
oaks
and
Ash
e Ju
nipe
rE
dwar
ds A
aulf
er S
oede
g (S
anM
arco
s Sa
lam
ande
r, M
au B
lind
Sala
man
der,
San
Mam
as G
ambu
sla,
Foun
tain
Dar
ter)
Spri
ng f
ed w
ater
s of
the
San
Mar
cos
and
Com
al r
iver
s in
Cen
tral
Tex
asge
ar C
reek
Gam
bust
aSp
ring
fed
hea
dwat
ers
of C
lear
Cre
ek,
a tr
ibut
ary
of th
e Sa
n Sa
ba R
iver
Kar
st I
nver
tebr
ates
(B
ee C
reek
Cav
eH
arm
an:a
m B
one
Cav
e H
arve
stm
an,
Tho
th C
ave
Pseu
doso
orpi
on, T
ooth
Cat
e Sp
kier
, Tho
th C
ave
Gro
und
Bee
tle,
kret
scbm
arr
Cav
e M
old
Bee
tle,C
olt 1
Cav
e M
old
Bee
tle)
limes
tone
cav
es, s
inkh
oles
& f
ract
ures

8. L
lano
Upl
ift
5,00
0
9 R
ollin
g Pl
ains
43,5
00
10. H
igh
Plai
ns34
,500
11. T
rans
Pec
os38
,000
Rol
ling
to h
illy
24-3
2O
ak-h
icko
ry w
oodl
ands
; som
em
esqu
ite ju
nipe
r br
ush
and
gras
slan
d
,AL
P:m
-rtp
ymlw
r,
Roc
k O
uillw
or(
Mac
k -
capp
ed
wea
ther
poo
ls o
n gr
anite
outc
rops
basi
n B
ellf
low
erG
rave
lly o
r sa
ndy
soils
Gen
tly r
ollin
g to
roug
h an
d di
ssec
ted
20-2
8O
rigi
nally
mid
-siz
ed g
rass
es; n
owm
ixed
with
oth
er g
rass
es; i
nvad
edby
mes
quite
and
juni
pers
; and
hard
woo
ds a
long
and
nea
r st
ream
s
Tex
as P
oppy
-mal
low
With
in g
rass
land
s or
ope
noa
k/m
esqu
ite w
oodl
ands
,us
ually
on
deep
san
ds
Inte
rior
aar
sta
(see
reg
ion
6)A
long
the
Can
adia
n an
d R
ed R
iver
s;ba
re s
and
& g
rave
l bea
ches
,sa
ndba
rs
Con
cho
Wat
er S
nake
Free
flo
win
g st
ream
s ov
erro
cks,
shal
low
rif
les,
and
roc
ks o
rcr
evic
es a
long
ban
ks &
sho
relin
es
Fair
ly le
vel
15-2
2Sh
ort g
rass
es; m
esqu
ite a
ndyu
cca
in s
ome
area
s,oa
k an
d
juni
per
in o
ther
s
Nat
ive
shor
tgra
ss p
rair
ies
and
thei
ras
soci
ated
pla
nt a
nd a
nim
al li
feha
s be
com
e ra
re in
the
Hig
h Pl
ains
.
Div
erse
, fro
m v
alle
y<
10-1
8fl
oors
to h
ills
topl
atea
us to
mou
ntai
ns
Gra
dien
t fro
m d
ry to
wet
ter
with
incr
easi
ng e
leva
tion:
Des
ert s
hrub
land
and
succ
ulen
t shr
ubla
nd, g
rass
land
,oa
k-ju
nipe
r-pi
nyon
woo
dlan
ds;
ever
gree
n fo
rest
s
* A
lthou
gh m
ost o
f T
exas
islo
cate
d on
fla
t pla
ins,
ther
e ar
esu
bsta
ntia
l
mou
ntai
ns in
the
Tra
ns-P
ecos
reg
ion
of f
ar W
est T
exas
. The
hig
hest
poin
t in
the
stat
e is
Gua
dalu
pePe
ak a
t 8,7
49 f
eet a
bove
sea
leve
l.Se
a
leve
l is
the
low
est e
leva
tion
in T
exas
and
can
be f
ound
in a
ll co
asta
l
coun
ties.
Ele
vatio
n na
tura
lly r
ises
from
eas
t to
wes
t and
sou
th to
nort
h.
212
Bun
ched
cor
y ca
ctus
Gre
ater
Lon
a -n
osed
Bat
Roc
ky s
lope
s, le
dges
and
fla
ts in
Hig
h de
sert
reg
ions
of
Big
the
Chi
huah
uan
Des
ert o
n lim
esto
neB
end
Nat
iona
l Par
k
Chi
sos
hedg
ehog
cac
tus
Mex
ican
Spo
tted
Ow
(
Ope
n sh
rubl
ands
on
grav
elly
flat
Can
yon
woo
dlan
ds in
allu
vial
fan
dep
osits
mou
ntai
n ra
nges
of
Gre
engE
n an
Wes
t Tex
as
Roc
ky h
illsi
des
of n
ovac
uilte
(a
Res
ell S
prin
g Fi
shes
(C
oman
che
part
icul
ar k
ind
of r
ock)
out
crop
sSp
ring
s Pu
pfts
b, L
eon
Spri
ngs
with
spa
rse
vege
tatio
nPu
pfts
b, P
ecos
Gam
busi
a, B
ig
iiink
lev'
s oa
kB
end
Gam
busi
a)
Foun
d al
ong
arid
lim
esto
ne s
lope
s at
Spri
ng-f
ed d
eser
t wet
land
s
mid
-ele
vatio
ns in
Chi
huah
uan
Des
ert
and
stre
ams
Nel
lie c
ory
cact
usD
ry, r
ocky
lim
esto
ne o
utcr
ops,
on
slop
es in
mou
ntai
ns o
f C
hihu
ahua
nD
eser
t
Peed
pin
cush
ion
cact
usD
ry, r
ocky
lim
esto
ne o
utcr
ops
onsl
opes
In
mou
ntai
ns o
f C
hihu
ahua
nD
eser
t
1414
1c.a
ulim
lEsa
lK
now
n to
occ
ur o
nly
with
in q
uiet
seep
age
pool
s in
Litt
leA
guja
Cre
ek in
the
Dav
is M
ount
ains
mar
ipos
a ca
ctus
In f
ull s
un o
n lim
esto
ne o
utcr
ops
orro
cky,
alk
alin
e so
ils o
n sl
opes
or
mes
asT
erlin
gua
Cre
ek c
at's
eve
Bar
ren,
dry
, rip
seou
s da
y or
chal
ky s
hale
s on
low
rou
nded
hill
s an
d sl
opes
with
spa
rsev
eget
atio
n
213

TheCurriculum
Connection
Tackling
Issues
Fitting new projects into existing curriculum can be a challenge. Science and / or socialstudies are natural fits. Having to express what they've learned involves language artsskills. Other applications will emerge as you look through your essential knowledge andskills. This project then offers practical applications to your students' developing skills,making learning more meaningful.
When facing TAAS preparation, consider using the project to enhance those objectives.Along with those practice books used to prepare the students, some of those objectivesmay be taught or reinforced through the work in this project.
From the natural resources perspective, the process skills found in science apply easily.Students can observe, predict, hypothesize, classify, measure, interpret, make inferences,and draw conclusions from the data. If approached from the scientific inquiry method,the young scientists go through the steps using those process skills. Any grade level thatteaches units on life science or earth science has a link to natural resources.
Teachers can involve several other areas of the curriculum. Math skills have a place incollecting data, especially when gathering quantitative information, measuring, andproducing any charts or graphs. language arts skills enable students to read for apurpose, gather supporting details, look for cause and effect, and write a report tellingabout the research and results.
Teaching students to keep a nature journal can improve their observation skills bycausing them to be more attentive to details. Their records evolve around describingwhat they see, touch, hear, smell, and occasionally taste. ("Taking samples" by sketches,and possibly photographs, recorded by the students rather than by taking part of the plantminimizes impact on that area, and prevents picking what may be a rare species.)Students must practice attention to detail by taking accurate notes. From theaccumulation of data, students have their own database of information to use for reportsand creative writing. Using the journal over a period of several years reveals growth inability but also provides information for showing changes in knowledge.
Projects involving the cultural resources of a region fit right into the social studiesprograms taught in Texas public schools. Applying information learned in the textbooksto the region in which the student lives helps to make a real-life connection. Findingpeople from the community that can enlighten the students through their own experiencesor from their knowledge of the past makes social studies personally meaningful.Experiences such as this project lead the student from the low level thinking skills ofsimple recall into higher levels of thinking as they apply their skills and knowledge to theunexpected.
Environmental issues consist of conflicts that arise from how people view problems.(j. R. Gardella, EnvironmentalEducation Curriculum Inventory, School of Education,Northern Kentucky University, 1993)
The goal of environmental education is to develop a citizenry that is capable of makingresponsible decisions and taking action. Issue analysis and action projects give thelearner the opportunity to go beyond just awareness and knowledge. Through such first-hand practice, the young citizen begins to feel that he or she can make a differencewhether it's in one's personal life, home, community, state, nation, or world.
sorismosumpoommamseporwasslownergweramiprommoormMINIIMONIMIIIMINIMMIPINIPMEMMIIINW

Choosing a
Project
Learning more about your region means recognizing that problems may exist that affect
the quality and quantity of resources. Issue analysis goes the additional step that looks atthe impact not only on resources, but also social , economic, politic and cultural impacts.Part of effective citizenship is believing that humans have the ability to bring about change
in a positive direction to solve or improve environmental problems.
Knowing and understanding the place where a person lives builds on a foundation of
awareness. Through that awareness the person realizes why the region in which he or she
lives holds special meaning. As pride and respect for the land and culture grows so doesthe desire to care for the environment. Why should a person care for something that has
no personal meaning?
As knowledge and skills increase, so does the ability to identify problems, analyze
positions on the issues involved, find ways to solve the problem, and make decisions as topossible action. By developing citizenship skills, youth will have the opportunity to
develop responsible, well-informed decision-making.
An essential aspect of tackling environmental issues is allowing "all sides" to be heard.
Don't interject a personal agenda or conclusion. Issues are by nature complex. Learning
how to cope with differing information and differing opinion is an essential life skill.
Taking Action
Participants who choose to work on issue analysis and want to involve their group in an
action project have special assistance through the booklet Taking Action: An Educator's
Guide to Involving Students in Environmental Action Projects by Project WILD and the
World Wildlife Fund. The guide includes descriptions of over 30 successful projects from
around the United States.
Helpful guidelines assist with choosing action projects, steps that facilitate the process,
clues to resolving conflicts, help with interviewing tips and brainstorming, models for
mapping out the project, and samples to help with assessment and evaluation.
Project WILD makes this booklet available for $7.00. You may contact the Project WILD
state program leader at TP&W headquarters or their national office at Project WELD, 5430
Grosvenor Lane, Bethesda, MI) 20814 (301) 493-5447.
We hope that at this point you're excited about the many options before you. You may
chose nature studies, cultural investigations or expressions, or probing issues.
Consider the interests of your group. If the group becomes part of the decision making
process, they remain more eager and active learners. Their age and experiences will help
determine the length and depth of the project.
As the project leader, you don't have to be an expert scientist or historian. Organizational
skills are very important, however. Consider several questions as you guide your studentstoward selecting a project focus. Can the group do the planning and preparation? Will they
be able to follow through? Develop not only project goals but direct the group, if they areold enough, through timelines as well. Help them take on a project marked for as muchindependence and success as possible and define that measure of success at the onset
of the project. 2/5ao(p1/1111/11NIZEMNIIMPIENNINOIONIENOMMOVININMINOINIMPIONWEIMININIMAIWIENVPIONwIWONIEWOMMINIMOIF
page 20

Consider how much preparation time this will take. How much time do you haveavailable? Do you have local resources to call on?
Plan on ample time for research and producing your results, anywhere from one to sixweeks. Although the project has the potential for extension beyond that time frame, youshould complete the work within twelve months. The group may choose to becomeinvolved again and do other projects in the future. Such participation can lead to higherlevels of awareness, knowledge, thinking skills, value formation, and empowerment ascitizens.
Remember to focus on the region in which you live. What can you learn about the naturaland/or cultural resources? One perspective might be to think about yourself becoming amini-expert gaining information about some particular aspect of the natural resourcessuch as the wildlife, plant life, and/or geology. Another might be to look at yourself asbeing a traveler in time. What would you see going on around you where you arestanding right now? What groups of people lived there?
Natural and/or cultural history might interest you. A person or event specific to yourregion could interest your group. What artifacts remain or what types of architecturefrom different periods of time exist? Another point to consider is the availability ofcommunity resources. Guidance and assistance could come from that person or group.Any of these ideas could lead you to a possible project.
Another option is "service learning." You choose a topic or location to learn about, withthe help of local managers. In exchange for their assistance and expertise, your groupoffers a service project chosen by the land or water manager. A wonderful partnershipand citizenship action result. This model of learning is gaining in popularity in otherstates.
Issue-analysis requires the greatest discipline and time commitment, but reapsunparalleled citizenship experience. Workshops and materials for this are available.
Remember that TP&W, if needed, will be helping you with their resources once you beginyour work. Our support may come in terms of materials, experts to answer thosequestions to which you have not been able to find the answer, or interpretation during afield trip to a natural or historical site.

IThe WE:15Thousands visit our world wide web site every day from every corner of theglobe. We
look forward to sharing your group's findings on our site. What better way to representthe diversity of Texas than through the eyes of our youth? The appendix includes a
Connection, template and style guide for your web page(s).
You may submit data, reports, creative writing, drawings, or photos. At the time of this
writing, video clips or sounds of more than a few second duration are difficult to transmit
on Internet. Please read the web page style guide carefully and feel free to contact the
TP&W project coordinator with any of your questions.
Submitting
to rroject
Description
If submitting drawings, pictures or posters, please have them scanned at a low resolution
and saved on a floppy disk. Again, details on picture file formats and size limitations are
listed in the style guide.
Several things to keep in mind when designing web pages: The Internet represents fresh,
interesting, conversational information. Keep in mind that if what you're considering isn't
interesting or compelling to the person next to you, it won't be of much interest to web
"surfers." Make your pages come alive with insightful or telling observations, unique
perspectives or presentations, and be accurate. You will be hosted on a state agency site,
and with that privilege comes responsibility. We will hold you to that responsibility. We
value our site and truly want your pages to be quality contributions to the information
about our state.
Look at the back of the notebook for the form to submit for acceptance of your project.
Describe as clearly and concisely as possible the objectives of your project.
TP&W will review your project with you before you begin to ensure that the topic will be
appropriate for the web site. Although we encourage creativity, we will check for
responsible language, accuracy, and if issue-based, evidence of scientific inquiry. You'll
want your project to be next to other projects of quality, and we must maintain the
integrity of our web site. Having said this, let's clarify that pictures drawn by
Kindergarteners will still be welcome, as long as they actually observed what they drew!
And we won't be editing their drawings for color or feather pattern!!
Mail your project description to the following address:
Exploring TexasTexas Parks and Wildlife4200 Smith School RoadAustin, Texas 78744
217
0 8)
poommegamigwommegossorruismansigeoteximmrammivermeremeigur....ftwormoommeirpage U

Each teacher or youth group leader comes to the project with his/her own set ofbackground experiences and skills. The following section compliments those differencesand provides a possible way of getting the job done. Feel free to go on with your owngame plan if you so desire.
As you set out to explore your region of Texas, you and your group have already plotted acourse in your project description. Now you need to plan how to reachyour destination.What routes you take and the tools/supplies that you have available greatly affect theoutcome. Plan and prepare for success.1. Record what you already know.2. Then record what you want to know.3. Think together who might have or where you would obtain the information you want to
know, when you need the information, and who will be responsible for contacting orobtaining the resource.
Begin by looking at the materials that you and the group have around you.
Check out schools and local libraries for reference books, histories, biographies, fieldguides, or nonfiction books that can get you started.
Have the children go through the resource directory (and your local phone!) book withyou. Think about the people in your area that might serve as a resource. Tell parents andfriends about your project and request their help in tracking down materials or people.Learning how to scope out resources is a skill worthy of development!
Have your questions well prepared and narrowed in scope. (Asking someone to "Tell useverything" is an impossible request, and met with limited success.)
Vary your sources. You'll find interesting perspectives by comparing publications, films,interviews, and trips and by using different resource organizations.
Make predictions about where and how those answers might unfold. Might they comefrom books, people, or exploration outdoors? Be alert to possible misconceptions. Asthe study develops, compare predictions with actual findings.
Keep records individually or by the group. Learning to keep a journal, whether a naturejournal or a historical journal, of your experiences is beneficial and provides you withsteady references when writing your material for the web page(s).
As you search for resources in your area, you may want to also use brochures, videos,and maps available through TP&W and other state agencies. In some cases, TP&W staffmay be available to answer those most difficult questions, or offer a facility tout TP&W'sfield offices are busy places, including law enforcement offices, fish and wildlife researchand management areas, fish hatcheries, park rangers and urban biologists.
We've listed below resources available through TP&W. Other state agencies havejurisdiction over similar resources, but with different roles. To help understand thedistinction of roles, we've listed some of them here. A more complete listing is in theTEAN guide in the appendices.
Contact the TP&W Exploring Texas coordinator for assistance in ordering materials orlocating local TP&W resources.
2o9 2 1 8

orking
TrPublications
The "Resources" section contains a list of publications available from TP&W. You are
welcome to order single copies of free publications. In addition, the Publications Sectionlists a variety of books and posters for sale. You'll find an order form at the end of the
resources section.
Videos
TP&W offers entertaining and educational videos through the weekly PBS series, Texas,
Parks, and Wildlife. The appendix contains descriptions of all segments of each program
for the past three years. In addition to copies of weekly shows, you may also purchase
videos compilations such as Destinations, The Best of TP&W; Birding Texas, Outstanding
Texans, and others. Complete listings are in the appendix.
Facilities Owned by TP&W
The public land managed by the department includes parks, natural areas, historic sites,
wildlife management areas, fish hatcheries, research/demonstration areas, and field
offices. Field trips can often be arranged. Preparation beforehand makes the trip much
more than just an outing to the park. Preplan with staff. Interviewing and note taking
skills take on new meaning when the children are on a fact-finding mission.
If traveling to the facility poses a problem, then letter writing suffices as the next best
method. Letters should narrow the field of inquiry to request information more specific
to your project rather than asking the interpreters to send you anything that they have.
Having the youth share what they have already found tells the reader that the group has
been working. Some areas offer outreach programs and make visits to schools or
meetings.
Part of the planning that goes into the development of a state park involves thoroughly
researching the biological, geological, and historical facts surrounding the area.Compiled in the Master Plan, the staff uses the material for the development of the park
and to produce booklets, pamphlets, displays and material for guided tours. For youth
involved in more advanced research, the park interpreters can copy pages from the
Master Plan. The bibliographical references in the Master Plan can also be helpful.
The Historical Parks throughout the state fit into twelve chronological periods. Knowing
that designation provides a key to the information from that site. Table 1 details the
chronological designation of historical parks.
Many of Texas' state parks owe their development to the diligent and lasting work of the
Civilian Conservation Corps (CCC) during the 1930s. Other parks represent facets of
history and feature living history or educational exhibits. Parks rich with significanthistoric components are listed in Table 2.
21,9

Natural Resources:
Texas Environmental Awareness Network (TEAN) Guide
This association of state agencies and environmental education organizations dedicates itsactivities to cooperative promotion of environmental public awareness. Their excellentguide, included in the appendix, provides the names of all of the state agencies involved inTEAN, descriptions of each agency, phone numbers, annual events, and order blanks foreducational materials. Projects that involve the natural resources and issue analysisshould find this guide beneficial.
Texas A&M Agricultural Extension
Extension agents are an absolute treasure of resources. Agriculture and home economicagents serve each county with information based on the research of Texas A&M, as well asinformation and guidance specific to the county. Additionally, extension employs expertson everything from bugs and soils to local plants and wildlife.
Texas Parks & Wildlife
In addition to state parks and wildlife management areas, TP&W employs conservationscientists who manage the state's natural resources. Fish and wildlife belong not to aproperty owner, but to the people of Texas. To responsibly manage fish, wildlife, and theirsupporting habitat, TP&W biologists research, track and manage for the health of habitats,species diversity and sustainability. TP&W biologists also offer guidance to privatelandowners, developers and urban planners.
Texas Natural Resource Conservation Commission
TNRCC may be best understood as the state version of EPA. TNRCC has regulatoryoversight for protecting air, water, and land resources in Texas. TNRCC has wonderfuleducational efforts and are resources for citizen action projects such as recycling orcleanups, as well as information on pollution. Dellis and contact numbers are in theTEAN guide in the appendices.
Archeology & Cultural Resources:
Texas Historical Commission (THC)
Texas Historical Commission archeologists investigate, gather, and preserve the remnantsfrom the past, and offer assistance to private landowners.
Office of the State ArcheologistTexas Historical CommissionP.O. Box 12276Austin, TX 78711-2276
Volunteer Speakers & Mentors
Texas Archeological Stewardship NetworkOffice of the State ArcheologistTexas Historical CommissionPO Box 12276
Austin, TX 78711-2276 (512) g ns 4allfornmeoureign1111.1011Ommipernmiremelprommiworger..........remir

Texas Parks & Wildlife Cultural Resources Program
During the past quarter century, the Public Lands Division of Texas Parks and Wildlife
Department has acquired, restored, preserved and operated historic properties, through
a legislative mandate, to assume stewardship of important elements of Texas' heritage.
TP&W holds a continuing commitment to this responsibility through the TP&W Cultural
Resources branch. Archeologists, historians, and interpreters offer insights on state parks
and historic sites. Materials and information available.
Archeology and Cultural Information on Public Lands:Cultural Resources ProgramTexas Parks & Wildlife4200 Smith School RoadAustin, TX 78744 .
Maps:
Texas General Land Office
Find original county maps that date back to the early 1800's, and acquisition maps going
as far back as the Spanish Land Grants. Using maps provides insight into the patterns of
settlement and development.Archives and Records DivisionTexas General Land OfficeStephen F. Austin Building1700 N. Congress AvenueAustin, TX 78701-1495
Bureau of Economic Geology
Explore natural history of ecoregions through geological maps from the Bureau of
Economic Geology. Forty six different maps are available from the Geologic Atlas of Texas.
Each packet contains a booklet describing geological deposits and formations. The
Geoscience Publications of Special Interest IQ Teachers and Students of Earth and
Environmental Sciences In Texas gives prices and ordering information.
The Geological Highway Map of Texas provides a colorful overall view of the geologic
formations and gives a chart of time and rock units for five sections of the state, a tectonic
map, physiographic map, a series of maps showing the restless crust of Texas, two cross
sections indicating the elevation of the crust and the known depth of formations along
with much more information.
The bureau offers assistance to you through the Public Information Geologist. This staff
member provides individualized help with those questions that surface when you have
exhausted your local resources. Your inquiries access information not ordinarily
available to the public.Bureau of Economic GeologyThe University of Texas at AustinUniversity Station, Box X
Austin, Texas 78713-8924
22111111OMMINNIMEWIIIIIIMMINOMIPIIIIININNININIIIIMMIIINVOINwatworwarmampoommeNlIdiplii~mailW
page 26

5ubmitting
Your WEE)
rages
rieici Test
Evaluation
Issue Analysis
University of Houston
Issue analysis is a comprehensive and structured process for tackling complex problems.The process examines all facets of decision making, including the impacts on theeconomy, culture, natural resources, and political climate. The goal of issue analysis isusing objective, scientific inquiry and critical thinking skills to develop citizenship skills.Workshops and curriculum guides are available. For more information, contact JohnRamsey at the University of Houston.
John RamseyUniversity of HoustonHouston, Texas 77204-5872
Project WILD and Aquatic WILD
Learn hands-on activities illustrating environmental concepts through the Project WILDworkshop and activity book. Contact TP&W to participate in a Project WED or AquaticWILD workshop.
Action Guide: Being a leader for an action project requires preparation, organization, andstrategies for effectiveness. This guide offers great suggestions. Contact the nationalProject WELD office to order.
Project WILD5439 Grosvenor LaneBethesda, Maryland 20814
Web Resources
You'll find a wealth of resources on the Internet on literally millions of subjects. Some ofour favorite "search engines" include AltaVista and Yahoo. Favorite educational sitesinclude TENET for Texas teachers and ERIC, an environmental education clearinghouse.
Follow the TP&W web page template and guidelines. Please submit your web pages oneither an IBM-compatible or Macintosh 3.5 inch floppy disk. Using a padded envelop,send your disk to Exploring Texas, TP&W, 4200 Smith School Rd, Austin, Texas, 78744.
Your evaluation of this project is essential to its success. You'll be judging the quality,usefulness and effectiveness of the workshop, this manual, the educational value of theproject for the participants and the project as a tool in your mission as teacher or youthgroup leader.
Please return your evaluations when you send us your web page disk.
a 00

< .
e nate
v
4'"
1;100^.. 4'0
..
0,4442,gfi'..{;),:.".<-,,..
444;44t...
:;41-z,
<
-.x% ,
4 >, ; =pc..1.2o,
- ;Itr--^
4TrASAV-74Q-`,1i;--4,a--:
;.;
,.
< "%Vtrsv' "'
(g.1
,t,erv,477*?`,4
us
W.`
11,73,-gtf" SV,
.444
IV, 1;4' .;;" ,t.....*..!-.10,$-...,L.
t' rtsrn-rtus-A-4-4t--r"'Avg.-4 wi.,>:;;Cr.' v""
,,>,..e..>: '*-4-'
n
Admiral Nimitz Museum
Battleship Texas
Caddoan Mounds
Casa Navarro
Confederate Reunion Grounds
Eisenhower Birthplace
Fannin BattlegroundFanthrop Inn
Fort Griffin
Fort Lancaster
Fort Leaton
Fort McKavett
Fort Richardson
Fulton Mansion
Goliad
Governor Hogg Shrine
Hueco Tanks
Jim Hogg
Kreische Brewery
Landmark Inn
Lipantitlan
Lubbock Lake Landmark
Lyndon B. Johnson
Magoffin Home
Mission Rosario
Monument Hill
Old Fort ParkerPort Isabel Lighthouse
Sabine Pass Battleground
Sam Bell Maxey House
San Jacinto Battleground
San Jose Mission
Sebastopol House
Seminole Canyon
Starr Family Home
Texas State Railroad
Varner-Hogg Plantation
Washington-on-the-Brazos
Zaragosa Birthplace
612
12
3
6
912
6
810
88
10
10
10
411
3
810
8
61
12
11
47
5
8
910
64
8
2
11
12
12
7
6
; v11141,:,
Acton
Fredericksburg
La Porte
Alin
Sam Antonio
Mecia
Denison
Gonad
Anderson
Albany
SbaeldPtesidoFort McKavett
Jacksboro 1968
Rockport 1976
Goliad 1932
Quitman 1946
El Paso 1969
Rusk 1941
LaGrange 1977
Castroville 1974
San Patricio 1937
Lubbock 1988
Stonewall 1966
El Paso 1976
Goliad 1972
LaGrange 1949
Groesbeck = 1936
Port Isabel 1950
Sabine Pass 1972
Paris 1976
La Porte 1965
San Antonio 1941
Seguin 1976
Comstock 1973
Marshall 1976
Rusk 1971
West Columbia 1956
Washington 1916
Goliad 1961
1911
1984
1983
1975
1975
1984
1959
1965
1977
1935
1967
1967
1967
The designated Historical Parks fulfill a framework of Texas History derived in 1970. Each park
has been assigned to one of twelve chronological periods: 1) Paleo-Indian, 2) Archaic, 3) ,-
American, 4) Early Exploration and Colonization, 5) Ealry Anglo-American and European
Colonization, 6) Mexican Texas and the Revolution, 7) Republic of Texas, 8) Early Statehood,
9) Confederate Texas, 10) Reconstruction, 11) Victorian, and 12) 1Wentieth Century Texas.
/
page Z8

arks.**4
ni can
omponent5,4
$...2.
3+,, ,s s:
Lnen444x.x,
Abilene CCC Imola 1933Balmorhea CCC Balmorhea 1934Bastrop CCC Bastrop 1933Big Bend Ranch Prehistory, Mining, Ranches Presido 1988Big Spring CCC Big Spring 1934Blanco CCC Blanco 1933Bonham CCC Bonham 1933Buescher CCC Smithville 1933Caddo Lake CCC Kama& 1933Caprock Canyons Prehistory Quitaque 1975Cedar Hill Penn Farm Cedar Hill 1981Cleburne CCC Cleburne 1935Daingerfield CCC Daingerfield 1935Davis Mountains CCC Fort Davis 1934Devils River Prehistory Del Rio 1988Fort Boggy Homesteads Leona 1986Fort Parker CCC, Townsite Mexia 1935Franklin Mountains Prehistory, Mining El Paso 1981Garner CCC Concan 1934Goose Island CCC Rockport 1931Government Canyon Homestead Helotes 1993Guadalupe River Homestead Spring Branch 1974Huntsville CCC Huntsville 1934Indian Lodge CCC Fort Davis 1935Inks Lake CCC Burnet 1940Kerrville-Schreiner CCC Kerrville 1934Lake Brownwood CCC Brownwood 1934Lake Corpus Christi CCC Mathis 1933Lake Mineral Wells WPA Mineral Wells 1976Lake Ray Roberts Jones Farm Pilot Point 1990Lockhart CCC Lockhart 1934Longhorn Cavern CCC Burnet 1932Matagorda Island Lighthouse, Civil War Port 0' Conner 1982McKinney Falls Prehistory, Homestead Austin 1970Meridian CCC Meridian 1933Mission Tejas CCC, Rice Log Home Weches 1935Mother Neff CCC, Prehistory Moody 1923Palmetto CCC Gonzales 1934Palo Duro Canyon CCC Canyon 1933Possum Kingdom CCC Caddo 1939South Llano River Buck Ranch Junction 1977Stephen F. Austin Townsite San Felipe 1940Tyler CCC Tyler 1934
2 2 4is-page 29

BIBLIOGRAPHY
Engleson, David C. Consultant. 1991. A Guide to Curriculum Planning in Environmental
Education. Madison, Wisconsin: Wisconsin Department of Public Instruction.
Gardella, J. R. 1993. Environmental Education Curriculum Inventory. Highland Heights,
Kentucky: School of Education, Northern Kentucky University.
Nebel, Bernard J. 1990. Environmental Science: The Way the World Works, Third Ed.
Englewood Clifts, New Jersey: Prentice Hall.
UNESCO. 1977. Final Report: Intergovernmental Conference on Environmental
Education, Tbilisi (USSR), 14-26 October 1977. Paris, France: UNESCO.
ED/MD/49. April 1978.
42`)17

Alan J. ChereponComposite Science
Westwood High School, Round Rock ISD
Texas Parks & WIldlife, AustinSteve Hall, Mentor
Scotty Oliver, Mentor
111
4
226

TTIPCURRICULUM LMPLEMENTATION PLAN
AbstractNAME:Alan J. Cherepon
INTERNSHIP:Texas Parks & Wildlife Department-Austin
SCHOOL:Westwood High School, Round Rock ISD
PRIMARY SUBJECTS:Physical Science, Principles of Technology, Astronomy, Geology
ACTIVITIES:Operation and tweeking of DART Target System(mobile, laser disc operated,computerized shooting range for hunter education), Creation and tweeking of database forhunting accident reports(using existing database in Access).
OBJECTIVES:Application of various aspects of the DART system into physics; Pulley andcam system on compound bows, mechanical advantage, estimation of force versus distance forarrow projectile, force transfer from bow (string) to arrow, concepts behind infrared lasers andsensors and application to security and other systems, optics of projector, systems analysis andconstruction in science application, instruction manual for technical communication, and for longterm/continued development-develop a Physics of Hunting manual for use and distribution toboth schools and the Texas Parks & Wildlife Department. Database applications in classroom-comparison between spreadsheets and databases and applications with scientific data input,manipulation, and interpretation.
SUMMARY:High Tech, Hunting and the use of firearms and archery equipment are subjectsthat interest many students. By applying the physical laws behind the operation of thesecomponents of the DART Target System, students and hunters can better learn the proper use ofthe equipment required for these activities. The integration of the basic physics and high-techapplications to firearms and hunter education should help students realize the practicalapplications of physics to all aspects of society, as well as providing an enjoyable way tointroduce them to the world of interactive systems spawning from the high-tech industry.Development of a unit on these aspects of hunting will teach them physics application in aninteresting and enjoyable manner, provide an application of system integration and teamworkconcepts stressed in lab activities, and the other elements of the instructional development model.Numerous life-lessons, including safe firearms handling and hunting procedures, can beincorporated as potential life-savering instruction. Use of the operations manual with the actualsystem can also serve as instruction for technical communications. Continued development ofthe unit can be enhanced by communication and input on the Internet by teachers and thoseinvolved in hunting and firearms and serve the hunter education programs around the country.
RESOURCES:Texas Parks & Wildlife Department, Hunter Education Section-SteveHall/Scotty Oliver, 4200 Smith School Rd., Austin, TX 78744-3292;(512)[email protected] or [email protected]
DART International, Don Ward, 1390 S. Potomac, Suite 100, Aurora, CO 80012;1-800-745-7501
Browning, Research & Development, Archery, Mike Sea lover, Rt. 1, Morgan, Utah 84050;1-800- 333 -5125, ext. 46 227

CURRICULUM IMPLEMENTATION PLAN
Alan J. Cherepon-Westwood HS, Round Rock ISDTexas Parks & Wildlife Department-Austin, Texas
DESCRIPTION/OBJECTIVES
This Curriculum Implementation Plan (CIP), developed as part of the requirements for the TexasTeacher Internship Program (TITF) at Texas A&M University, details the objectives, strategies,materials, and references for the begining of a Physics of Hunting unit plan, based on experienceand information gained at the Texas Parks & Wildlife Department, Hunter Education Section,Austin, Texas(Ref.1), during the summer of 1996. Primary work tasks included the operationand tweeking of a new DART Target System(See Ref. 2), a mobile, interactive, computeroperated shooting range, which focused on educating hunters to greater awareness of the TPWD'sHunter Education programs, including proper firearms handling and hunting technique.Sufficient application of physics, as per telephone communication with Browning (Ref. 3), andhigh-tech were incorporated into the overall system to integrate these applications into thebeginings of this Physics of Hunting unit for use in both the classroom and possibly State HunterEducation programs. The application of high-tech systems to recreation provides a practicalapplication of teamwork concepts utilized in science labs, demonstrates the need for creativityand problem-solving skills in science. This instructional unit is not a completed, "end-all"document, but is hopefully the foundation for a growing set of lessons that will help makephysics more real, interesting and palletablethrough integration with sport and recreationalactivities. Added bonuses could include safe hunting and firearms handling, which could savelives, as well as a greater appreciation for this sport and the monies the hunting program providesto preserving our wildlife resources in Texas and the USA. Addionally, developing/customizinghunter accident database provided insights into many teacher/classroom applications.
Specific expected objectives of this curriculum include:Clearer understanding/calculation of mechanical advantage(using compound bows-SeeRef. 5-6)Application of force transferal from bow to arrow and determination of trajectory andbow's practical shooting distance(See Ref. 5-9)Develop better problem-solving skills by back-calculating various values for archeryUse of simple and compound machines in such matters as stringing a recurved bow(SeeRef. 10)Principles of infrared lasers and sensors in an interactive system and elsewhereOptical principles of projector and transfer of images from laser disc to projector toscreenTeamwork, problem-solving/critical thinking skills development with componentintegration and system developmentApplication of known interactive systems(computer games), newly acquired knowledgeof such systems(DART) and projecting for future applications(holodeck in Star Trek-TheNext Generation) and more immediate educational uses(flight-simulators/driver's ed, etc.)
223Aao

Database/spreadsheet comparison and applications(Ref.1 and 11) to science and non-scienceTeacher use of database for tracking/evaluating teaching methods and students, trackingcontinuing ed/professional development and documentation/record keeping/organization(See Ref. 1)
STRATEGIES
One of the most effective teaching methods for teaching difficult concepts in science and math isto integrate the lesson with something the students are familiar with and enjoy, or at the veryleast, are interested in. The interactive, high-tech applications to computer games and virtualreality has quickly captured the minds and dollars of most students. The Dart Target System hastaken the existing technology as components in the laser disc, computer, large-screen projector,sensors, infrared lasers, and various firearms and has integrated them into a sport and trainingsystem. Already police and other firearm/archery training facilities are utilizing these systemsmuch the same way flight simulators are used tomore efficiently train pilots, especially for thenovice. Computer software includes such products as 3-D architectural programs for designing,building and decorating a house or business. Television and movies have even projectededucational applications of this technology in such shows as Star Trek-The Next Generation, orone of the Star Trek movies. The characters train on a holodeck, where holographic, 3-D virtualreality has taken the next step of tricking your senses into seeing and experiencing things that areonly images. Between these examples and the plethora of Nintendo- or Sega-Genesis-typeinteractive computer games, students both know of and enjoy such applications of technology.
The DART system's many components apply various principles of physics that can beincorporated in Physical Science, Physics, Principles of Technology, and Astronomy courses.Strategies for teaching each of the objectives bulleted in the above section are detailed below.
FORCE TRANSFER, MECHANICAL ADVANTAGE, EFFICIENCY, ANDTRAJECTORY
The concept of transfer of force is simple enough, except when considering the various loses thatoccur in the process. Using a compound bow and arrow, a Newton Scale, double chronographs,and some simple formulas and curves, numerous calculations can be made on the physics of thebow and arrow. More adventurous calculations involving force vectors could also be applied totest the effect of placing the nock of the arrow(rear grove where the string fits into arrow) atvarious offset distances along the serving (middle portion) of the bowstring(See Ref. 4 fordiagram and nomenclature of compound bow and arrow). The bow manufacturer providesstatistics on the bow, such as the draw weight (ex. 601b bow), percent let off (reduction fromdraw weight at peak) and force draw and/or velocity to weight curves. The actual values themanufacturer or another source (Bowhunting World magazine, Ref. 5) provides can be testedand compared to determine how these values were derived, a good means of developingproblem-solving skills and teamwork in lab. (Provided values will not be the same as those
229

students will get, as the testing labs that derive these values use mechanical devices(robots)todraw and shoot arrows and trigger the chronographs for consistent results). Comparisons canalso be made between different bows to determine which is better, and will also demonstrate ifstudents are truly grasping the concepts involved. Presentations and/or writeups can be requiredto stress oral and written communication skills.
The beauty of the compound bow, and the general physical laws applied to it, can best beexplained by comparison to firearms (Ref. 6). The rifle has a longer barrel than a handgun, thusapplied force is over a greater distance(barrel length). The same principle is used in thecompound bow as compared to other bows. An eccentric pulley(cam) applies greater force overa greater distance, as the arrow is already moving when it reaches peak pull weight at mid-drawdistance. Thus, more foot-pounds of energy are applied over a longer distance.
The pulley system is like a miniature block and tackle, having 3 supporting strands (amechanical advantage of 3). The eccentric pulley, or cam, is either an elliptical shape or wheelmounted off axis. This provides varying mechanical advantage as the string is drawn,comparable to suddenly lengthening the bow limbs on a recurved bow, resulting in a longer leverarm. The mechanical advantage can be seen on Force-draw curves(See Fig. in Ref.5), where theforce required to draw the string back beyond peak draw decreases. Two of the cables arearranged as "feedback" in which they are both pulling on the limbs at the same time, with thesame force, making the compound bow much more stable.
The cams transfer the mechanical advantage to the archer; when the cam turns over and locksinto place at peak draw, less force is exerted by the archer as the force is now held by the cam.This relaxation in tension is typically 5-20% and serves two purposes; it allows the archer tohold at peak draw weight with less effort, thus reqiuring less energy and enabling one to hold atpeak draw longer and steadier while waiting and/or aiming for an optimum shotting situation.
Unlike firearms, in which inertia is applied to the bullet alone, inertia in a bow system is not onlyapplied to the arrow, but to each bow limb and the string. Each limb of the bow weighs at least2 arrows in weight, so combining the weight of each limb and the arrow is like moving 5 arrowsof weight. This is why reducing arrow weight only moderately increases arrow speed, as youonly reduce no more than 1/5th of the total load.
The bow and arrow, even with continued improvements, will have certain physical and practicallimitations. Stored potential energy is dependent upon the body strength and size of the archer's"reach" or arm and bow draw length. Also, since no system can have 100% efficiency(the bestfor bows are near 85%, due to frictional and vibrational losses),and even if you could achieve100% efficiency, your shot would not be very accurate. Additionally, the trajectory for arrows isat a considerably greater slope than a bullet's, due to the velocity being an order of magnitudeless, as well as the drawn-out shape(See Ref.5&6).
CALCULATIONS
Numerous curves and given data can be used to varying degrees of difficulty in determining the
o

physical properties of the bow and arrow. The most important are the Force-Draw curve and theArrow Initial Velocity-Weight curve(See Ref.5). Students can create their own and comparethem to standard curves to check results. Equipment includes at least 2 different bows, a NewtonScale capable of reading up to 70 foot-pounds of force, and a setup for keeping the bow at thesame place while drawing back the string and measuring draw in inches and force in foot-poundsat set intervals. Calculation of the area under the curve will give you the Potential Energy orStored Energy of the bow.
The Velocity-Weight curve can be constructed by setting up two chronographs(digital timinggates) in line; one to begin the time and the other to stop the clock as the arrow sails past aknown distance interval. With distance and time data, the velocity can be calculated. The weightof the arrow can be either converted from the known weight in grains to pounds(7000 grains 1
pound) or placed on a balance scale and converted from metric to English units(the manyconversions involved in this work will be good exercise for the students, teaching them to becareful, organized, and improving their math skills). From this data, the Kinetic Energy can becalculated(ICE-1/2mv2), and a conversion factor of 7000 * 31.26 for grains to pounds and affectof gravity on arrow. The amount of output for amount of input force, or Dynamic Efficiency, canthen be calculated by setting up a ratio of KE to PE (or KE:PE )which includes the conversionfactors from the KE calculation and will be a %. 437,640The Velocity-Weight curves can be used to velocity for any arrow, and can be checked byshooting various arrows and recrding velocities to check accuracy of the student's calculations.Arrow trajectories can also be determined once the initial velocity and weight are known.Estimates can be made, such as if an animal were so far away, and you had a bow and arrow thatprovided a velocity of 280ft/sec., is it even sensible to take the shot or try to get closer, and howclose do you need to get to get a good shot, etc. The various charts and methods for calculatingtrajectory are provided in Ref. 7 & 8, interchanging various values to check to see if they aregrasping a working knowledge of the physics and math involved.
One additional exercise could include a comparison writeup report(similar to a consumer report)and even a presentation by the team to improve communication skills. This could involvespreadsheet tabulation of data and computer-generated curves to enhance the reports and helpwith calculations and organization. Career opportunities could be discussed at this point,demonstrating the various positions for these skills.
LASER, OPTICS, AND SYSTEM DEVELOPMENT
The Dart system has two applications of lasers; one is in the laser disc player that has the variousscenarios of animals and targets to shoot at, and the other is an infrared laser mounted in thefirearm barrel that shoots an invisible beam at the screen. The sensor, mounted below theprojector, detects when the laser or arrows impact the screen. Together, these componentsdemonstrate one application for these segments of the electromagnetic spectrum and can be usedas a demonstration of how laser security systems operate, as well as a lead-in to the various typesof lasers being used today. The projector is a good example for optics study and a demonstrationof energy signal transfer from the laser disc and computer to the projector and screen,culminating in the integration of various components into specific systems. The point can be
231a 2.3

stressed for being well-read and current on technology developments, as well as the need forcreativity and teamwork in system development and applications to previously untapped areas,such as hunting. These lessons and examples will hopefully expand student's ways of thinking(to overuse an overused word-paradigm shift).
Numerous applications of interactive technology can be found around us, including flightsimulators, educational and entertainment software, and the virtual reality systems that are intheir infancy stages. Another exercise would be to show examples of these, explaining whatinteractive means, and give examples of projected uses in the future(such as the "holodeck" inStar Trek-The Next Generation, where it is used for training for dangerous situations withouthaving to realy be put in that situation. This is similar to the DART system, in that hunters cantrain where and when to take a shot on animals that they may not see in their part of the world.students should be allowed time to name other examples of this technology and to exercise theircreativity in coming up with their own ideas on where this might be useful.
DATABASE
Databases and spreadsheets are extremely useful tools, especially in science. The similarities anddifferences should be presented, or as a problem solving skill(time permitting), have studentswork with both and write a short summary on this. The most useful features include theorganization, manipulation, and interpretation of data. Graphical interpretatations (Ref. 11)usually make trends and interesting or bad data points stand out, and can be utilized for trackingcertain data. Their use for physics labs are invaluable in not only teaching students the best waysto deal with large amounts of data, but also how to set up mathmatical formulas and conversionsfor computer calculation, and can also serve as a lead-in for how we use databases and graphs insuch jobs as auto parts stores, auto mechanic's and doctor's usage for diagnostic work,construction estimates such as density of materials curves for loading stresses and materialsdetermination, sales and distribution reports and forcasting, financial planning, and even insports, such as football scouting reports. Once students become aware of the many applicationsin everyday life and work, they become more motivated to learn these seemingly difficult aspectsof technology.
Specific uses of database during the internship involved changing an existing database fromanother state to conform to the needs of Texas Parks & Wildlife Department for huntingaccidents(Ref. 1). This involved basic computer skills, problem solving skills, and a finishedproduct for use in the annual report. The most readily apparent usefulness was in demographicaspects, such as what areas had the most accidents to see if there are special needs, especially ineducation, and if certain age groups or other factors were involved in the accidents. Teacherscould utilize the same principles for tracking students and teaching methods from year to year.The database helps to see trends and specific needs and changes(good and bad). Continuingeducation and professional development, as well as documentation and organization of ateacher's vital factors for our profession becomes easier once you get past the initial shock andeffort involved in setting up or tweeking existing databases for your specific needs. And, afterall, shouldn't we set the example for our students not to be technophobes, but instead, find new

ways to incorporate time-saving technology into the schools? If we do not, other nations maysurpass us, with the potential for a Third World status for the USA if we fail to motivate studentsin high tech and the sciences.
REFERENCES
1) TEXAS PARKS & WILDLIFE DEPARTMENT, Hunter Education Section, SteveHall/Scotty Oliver, 4200 Smith School Road, Austin, TX 78744-3292;(512)389-4800.Internetaccess: [email protected] or [email protected]
2) DART INTERNATIONAL, sales brochures, Don Ward, 1390 S. Potomac, Suite 100,Aurora, CO 80012; 1-800-745-7501
3) BROWNING MANUFACTURING COMPANY, Archery Products Division, Research andDevelopment, Mike Sea lover, 6343 Cottonwood Canyon Road, (Rt. 1), Morgan, UT 84050-9319;(801)878 -2751 or 1-800-333-5125, ext. 46
4) BEGINNER'S GUIDE TO CHOOSING TODAY'S ARCHERY EQUIPMENT,Sherwood Schoch and Randy Krysher, Bowhunter's Warehouse, Inc., P.O. Box 158, 1045 ZeiglerRoad, Wellsville, PA 17365, 1989
5) ADVANCED ARCHERY EQUIPMENT, The Technical Truth About: Velocity TrajectoryPenetration vs Mass Weight, sales brochure, 17800 Mitchell, P.O. Box 19188, Irvine, CA92714;(213)325-2772 (no date)
6) EASTON ALUMINUM, INC., Bowhunting (With Easton Aluminum Shafts), sales brochure,5040 W. Harold Gatty Dr., Salt Lake City, UT 84116-2897;(801)539-1400(no date)
7) BOWHUNTLNG WORLD, Norb Mullaney, Bow Report, Browning Ballistic Mirage, P. 58-63, February 1994
8) ARCHERY FACTS, Archery Product Knowledge-Basic Information On The Art Of SellingArchery Equipment, John Spomer, National Sporting Goods Association, 717 N.Michigan Ave.,Chicago, IL 60611, 1975
9) THE BIG SKY, Vol.11, No.4, An Archery Equipment Perspective, Norbert F. Mullaney,Fred Bear Sports Club, RR 4, 4600 S.w. 41st St., Gainsville, FL 32601, Summer 1983
10) NRA HUNTER SAFETY AND CONSERVATION PROGRAM(SUPPLEMENT),Instructor's Manual-Bowhunting(no date)
11) INTERNATIONAL HUNTER EDUCATION ASSOCIATION, 1995 Hunting AccidentReport, Jack A. Edwards, P.O. Box 490, Wellington, CO 80549;(970)568-7954
233

1994TEXAS HUNTING ACCIDENTS
ANALYSIS
Artwork: lzaak Walton League of America
Federal Aid ProjectW-104-S
For more information about hunting accidentsor the hunter education program in Texas, call (512)389-4999
234
AP-Co

TYPE OF CASUALTY
FATAL
NONFATAL
SELF-INFLICTED
TWO-PARTY
FIREARM INVOLVED
BOW 0CROSSBOW 0HANDGUN 4
MUZZLELOADER 0OTHER* 0RIFLE 13
SHOTGUN 23
DISTANCE FROM MUZZLETO WOUND.
"0 -10"
"11-50"
"51-100""101+"OTHER:
UNKNOWN
RESIDENCE OF
SHOOTER:
RESIDENT
NONRESIDENT
UNKNOWN
0 it6 ?1345--
0
HUNTER EDUCATION(SHOOTER)
ia 5 11'No,
SHOOTERPROSECUTED
TEXAS: 1995
A DIGEST OF INFORMATION COMPILED FROM
HUNTING ACCIDENT REPORTS
ANIMAL BEING HUNTED
ANTELOPE 0BEAR 0
BOBCAT 0
COTTONTAIL 3
COYOTECROW 0
DEER 10
DUCK/GEESE 3
DOVE/PIGEON 13
ELK 0
FOX 0
GROUSE 0HARES 0JAVLINA 0MOOSE 0NONGAME BIRD/MAMMAL 0
PHEASANT 0
QUAIL 2
RACCOON/OPOSSUM 1
SQUIRREL 2
TURKEY 0
WILD BOAR 0OTHER UPLAND GAME BIRD 0OTHER SMALL GAME 0OTHER* 0UNKNOWN
AGE OF SHOOTERS
1-09 0
10-19 9
20-29 5
30-39 9
40-49 4
50-59 5
60 AND OVER 2
UNKNOWN 4
AGE OF VICTIM
CAUSE OF CASUALTY
VICTIM MOVED INTO LINE OF FIREVICTIM COVERED BY SHOOTER SWINGING ON GAMEVICTIM OUT OF SIGHT OF SHOOTER
VICTIM MISTAKEN FOR GAMETRIGGER CAUGHT ON OBJECTLOADING FIREARMUNLOADING FIREARMIMPROPER CROSSING OF OBSTACLE
DROPPED FIREARM
CARELESS HANDLING OF FIREARM
SHOOTER STUMBLED AND FELL
RUNNING/WALKING WITH LOADED FIREARMREMOVING/PLACING LOADED FIREARM IN VEHICLEUSING FIREARM AS CLUBDISCHARGE FIREARM IN/ON VEHICLE
FIREARM FELL FROM INSECURE REST
SHOOTING FROM/ACROSS ROADWAYHORSEPLAY WHILE HUNTING
APPARENT USE OF INTOXICANTS/DRUGSARROW NOT MATCHED TO BOWCARELESS HANDLING OF BOW OR ARROWCARRYING NOCKED ARROWDEFECTIVE BOW OR ARROWSTRINGING BOWIMPROPER POWDER SUBSTITUTION
MIXED AMMO/INCORRECT AMMOFAULTY EQUIPMENT
RICOCHETOBSTRUCTION IN BARREL
OTHER*
UNKNOWNFALL WHILE CLIMBING INTO POSITIONFAILURE TO USE SAETY BELT
1
10
2
30
7
2
30
3
0
000
00000
0
0000
VICTIM WEARING HUNTER ORANGE?:
YES
NO
30
0
1-09
10-19
20-2930-3940-4950-5960 AND OVERUNKNOWN
7
9
2
0
0
BY TEXAS PARKS AND WILDLIFE DEPARTMENTHUNTER EDUCATION PROGRAM
YES
NO lo0
SELF-INFLICTED
FATAL
NONFATAL
235
-2 a '7

ARCHERY & COMBINATION SYSTEMS
The Dart Target System is a dynamic archery/firearms video targetsystem designed specifically for the shooting sports retailer. The heart
of the system is a technology commonly known as interactive video.The primary components include a computer, videodisc player, video
projection system and a target face complete with an extremely
accurate sensor. Our goal as a company was to develop a system that
contributes measurably to the bottom line of our customers, enhancesenjoyment and the skill level of the hunting sportsman, provides a
communications link between the sportsman and manufacturers of
shooting sports products and becomes a platform for the distributionof information critical to the future of shooting and hunting.
The end user of this system will experience situations that are asrealistic as a simulator of this type can create. The sights and soundsare exciting, just as they are in the field. The decisions to shoot or notto shoot, picking your "spot" and the instant feedback on placement ofthe shot, are just a few of the elements built into the system.
UNIQUE FEATURES
The Dart Target System is the only patented interactive video targetsystem on the market and has many unique features incorporated into
its design. These features include: over 800 video scenarios completewith critical audio; instant feedback to'the shooter after every shot; anautomated scoring system; league and competition format; a completedatabase function; a marketing function for advertising and promotionand a communications network linking all systems to the centralcomputer at the offices of Dart International.
The software which controls the system was developed specifically forthis product and is proprietary to Dart International. Additionally, thecompany has integrated off-the-shelf software to build valuabledatabase and communications programs. The sophistication of thesoftware and hardware that comprise this system are completelytransparent to the end user. The computer technology used in the DartTarget System is very powerful and yet extremely easy to use. There isvery little training needed to operate and maintain the system. Allinput screens are menu driven and are very simple to follow.

Dart International has received the
following recognition and awards:
Honored by Outdoor Life magazine
as one of the fifteen "Outstanding
People, Gear & Achievements" on
the 1994 Honor Roll.
Distinguished by Bowhunting World
as one of the Top Twenty Hot New
Products for 1993.
A
Featured on the ESPN program
"Ultimate Outdoors" with Wayne
Pearson in the Fall of 1995.
A
Recognized on The Nashville
Network (TNN) Celebrity
Outdoors Special, "Buck Madness",
in November L995.
Awarded the Special Achievement
Award at the International CINDY
Competition for innovative use of
interactive technology.
COMPANY HISTORY
Dart International, [pc. was formed in April of 1990 and is a Colorado
corporation. The company's mission is to identify and develop vision-ary products employing interactive multimedia technologies that
contribute to the growth and prosperity of the shooting sports industry
Dart installed its first video archery system in the fall of 1992 after
extensive development and testing. In 1993, after its debut at theBowhunting Trade Show and SHOT Show, Dart installed 80 targetsystems. As of January 1996, Dart Systems have been installed in
more than 200 locations in 42 states, Canada, Mexico and China.
Dan International received a U.S. Patent on the Dart Target System inJuly of 1994. Specific information about U.S. Patent Number
5,328,190 is available upon request. The Dart System is the only
patented interactive video target system for archery.
During 1994, Dart International formed an alliance of premierindustry companies whose common goal is to promote the growth ofarchery and the shooting sports. These elite companies are committedto protecting and preserving the future of hunting and shooting. In
conjunction with the Dart Mobile Systems, these companies will take
their message to thousands of consumers attending shows and eventsthroughout the United States.
The management team at Dart international is made up of a select
group of professionals who are experienced in their roles and are
dedicated to excellence. The strength of the entire Dart team lies inthe depth of their experience and the complimentary skills each
member contributes to the company.
237
AINTERNATIONAL, INC.
1-800-745-7501.22.1

The Dart Target System
is a revenue generating,
marketing machine that
has the capability to
dramatically influence
sales and cash flows at
all installed locations.
A TURN-KEY SYSTEM
This product is a turn-key system designed to drop into any existing
retail or range facility. It is modular by design and all of the
components are replaceable in the event of failure or malfunction.
Dart's technical staff is available 24 hours a day on our 1-800 number
to trouble-shoot any problem. Our standard practice is to swap out
malfunctioning components using next day delivery services. The
system has been designed to make this process simple and fast.
The system has a built-in marketing and advertising function to
accommodate advertising messages from leading industry
manufacturers. This unique feature is intended to help support
the sales of products and services in your store.
BENEFITS
The benefits of the Dart Target System include:
An exciting, fun-to-shoot experience during which customers
experience life-size animals in life-like surroundings.
Instant feedback on shot selection and shot placement.
Competitions which are simple and completely objective in terms
of scoring and results.
The creation of valuable marketing lists for the retailer.
Product advertisements from leading manufacturers to customers
who are likely to purchase those products.
An opportunity to attract young people to the shooting sports.
A platform for distribution of information that is critical to the
future of the shooting and hunting sports.
230

The #1 Video Target Systemin the shooting sports industry
combines the best of both worlds.
11/ .
I a
CI t
With a Dart System you can:
Attract the two-season hunter to your shop
Organize video leagues for all shooters
Offer training classes on firearms safety and
Bowhunter Education
Appeal to women and young people with
exciting shooting programs
Participate in National Tournaments
Draw from the largest library of interactive
video programs on the market
At Dart we are building one of the strongest dealernetworks in the industry We are committed toproviding the best service, support
and quality..period!
If you are ready to separate
your shop from the
competition, call
1-800-745-7501.
Shoot the DART!
239 ,DARTNTERNATIONAL, INC.&.23/
.. 6

CORPORATE INFORMATION
A1/4DARTINTERNATIONAL, INC.
Address 1390 S. Potomac Street, Suite 100Aurora, CO 30012 USA
Telephone (303) 745-16001-800-745-7501
FAX (303) 745-1666
Incorporated in Colorado April 6, 1990
Tax ID:: 84-1140817
U.S. Patent No. 5,328,190
240
0 1996 Dart International. inc. U.S. Pat. Mo. 5.328.190
232

AUGUST. BOWHUNTNG NEWS A 27
TRADITIONAL ARCHERY'
Tradition Meets 'Hr -Tech'
The 8th Dwarf Prong sometnng 1-11-Tecti?Nawww .. you gotta be kidding. ngnt?Noce. No pike!I was in Permsykere for the ocering of Our
first bcensed Screening Eagle Sore. Roger Ree.the sore owner, nod out in one of the new DARTedeo target systems I had some doubts. Thoseof you wino read my courrn Know Ina I am notexactly a fan of awning to do wen tecrndogy nmy °womb soon of °ramming. You also knowteat I am deem concerned about oownunter pro-ficiency and nunung etrucaly and sensory.
After snooting one round on me DART sys-tem. I was rooked. conyinceo that the system wasgreat for branurrong. and eninusasuc scout tell-ing other oowhunters scout me system
1 teacn oownunter education. h Odeon. Iteach severs txxvtiunting scroots each year. werethe students actually nun wane they are *wrungabort all the aspects of Downtime). The mostdifficult Ming to teacn any comusiter. regardless ofre or ner levee of proficiency. a wren to take theshot at a crater aro to envoys tick a soot. TheAde° target systems nave cnanged rat dramati-cally.
At the writing. I rise onty :rot Me DARTsystem. There are other systems out there. out Inaven't yet nib re cnarce to :root any of rem.I can say rat the DART system a realty impressive.I .ntensewed corroarry owners of me otner videotarget systems aro mat information will follow. I
guess one ring mat impressed me a Ina a sgrufi-cant Dorton of me woods at wren you sootwere firma an my ranch in Montana. Some ofthe Ducks in the system I haw actueiy passed seon film. is kind of neat to take me snot now andsee ill would have naiad rim or rn-m-m-missed!
The African footage a excellent althoughsome of the filming was done a ranges I deemare too far to memo with a bow The ous side toMet nowise& is to use that to tech a snooter thathe or ire should pass on the oarocuar snot Thena total realism for re rooter. is ready neat tohear me dotes and bads talkng write you arewading a Kudu come In to a water note.. The athe rem McCoy You are shooting at a real animalon the screen. =Mete with bacxcexabl no se.brash. and brarcres blowing at re crests.
The *stems seeable as of Ms writing wethe made by DART. Arcrery Visors. and ITS(Interacew Target Systems). As I marooned earlieron. 1 here shot the DART system. I rend to snootthe driers as soon as Me 000ontrant presentstwat.
The DART system a very ;mores:he. Thequality of the vicieo footage and me entree is too.The system will horde up to sx srcoters at a time.One of the things that I bid most maestro wontill DART ',stem a the areal message that iswon the shooter wro takes a poor rot If theangle a wrong. or there a onions at the way. butthe srcoter takes tre :rot tie screen reads. 'ZeroMend _. no snot snuabonr As a oohnunter edu-caton instructor and a concerns° oownisiter. !
lire re to oe great!I talked to Roger Rea wee orecoring for
ins once and asceo rum to give me MS mores-sore of the DART system now that he ties nab it inNs sore for a year. Roger s first comment wasrout the fact Mat me woo :rooting systemsteacn me townunters to rack a soot Remy rn-portant for the Oranunterl After 38 years oforairureng. that is SW my rumor ore tycoonwhen a big critter secs in front of me. I boo thatin a week of shooting re we° system. I wasalways cedung a soot Roger's second commentwas the same as mine avow Me erica mes-sage be poor shots taken. his third canines wethat me video system goes a long wey towardsteat:wig me soder the exact location of the vi-tas. wren are bashed on vie arumai wan nitThe exact location of re arrow re is also sown.wren Roger fees is a Dg pus Roger nonmedme rat DART is uric:yet:brig their *Stern COnStalivand will soon go from circles on me etas o actualdiagrams of the rears lung area
One other interesting fact tret Roger men-boned. and that I New actuaty witnessed Weestirs:erg at ha sue. a nosed opporturees dueto carton types of equoment Before I go anyfurther. remember that I am not treconicourd. oranb-sgtits I hoe stated that repeatedly 1 havealso sated that I think some of the gadgety snitsor handicaps the bovtrunter. These are to ten-ons _ so read on.
The Sowers who were using releases andsghts. and especially those *no were used tomooting at 3-0 tournaments. were sornetrnesnot getting tree sots off before the anima wakedoff the screen. The common request was forRoger to "sew me system clown so mat they couldhae more time to hod. am. and squeeze thetrigger.' It took some experung on both air partsto tell these shooters that re a the way we cnt-tee are naturally. You can't make a deer or elkwalk Sower. ern a certain way. or stand us so! It
represents a REAL HLIVTIVG SlTUATION. some-] Sing that 3-0 targets don't do. I guess mars why
I am so impressed with tne video srootrig systemsin genera
Archery Visions' system is cute a 01 Offer-! ent from the DART system in mat me shooter may
USH any read. including Oconee:Is. wee Pe outersystems rectum the use of a steel duet The ferna protected on to a bacsdroo ritefrom arrows. The arena stool owe a credeber-mined soot wnere tra 'etas are soca= n theconvulse set-uo. This system can be judged by aSte prigs for cornrow:bon purposes Arttey Vn-
sans has 155 systems w aryl nrong award thecam Weedy Aronety Visons' system a theleast exoerehe of al Me systems. so be mostafforciade for re sheer shoo/ramp Garet
ITS ffroxecow Target Sweetest offers 3modes: me Model 50. the Model 2C0. aril theModel 300. The Model 50 offers group rootingof up to 6 !rooters in racoon. The medal 200offers the same. taus Me calculation of arra speeda Ito time of the tit The Model 303 des all rethat and me additional OWN for three sodas toSnot seruitaneousay. Wien me rat cooa . a tor-so Id zone shade a lashed on me screen. songwith me score and Me arrow weed. ITS. has 125systems up and running around the courey
The purpose of this column a rot to tellYou bat one 01 the ',stems is Defter then surer.Since 1 New not srot two of the systems. I alieri'tdo that even rf I wanted to _ and I don't !wantedto port art me benefits of the video swamis tobown unters. both beginners and experiencedco...hinters alike.
I vire that ad of us. as bowrunters. sea toI that we we under a great deal of oreasse bar
ano-hunters. We snout, of know that oat of theorasem is id You bet! Every time someone goesafield with a bow in hand wry is not oreoared andwet-danced. we rave re memo for a warded"Tee. ageNtitsrsg Possore must oe done to elm-roe that mound:Ty a:moment Bo...nrset alum-
ton a one of the ways to team Seminars andcoons me otner teacnng veryces. Video targetsystems. in my opinion. rank very rygn in tree acui-ty to teacn oowncinters wnen to stoat and whereto soot
If you risen t snot one of the vole° sys-tems yet. I woud strongv rearnmeno 2 it's atremendous practice too aro Is really fun. Youcan moot it alone for practice. or vou can soot it,n competition. I orefer ust mooting with a coupeof friends and corroanng now we soot .. not forscore. out to see now we would hew done IN mewoods ... wriere It counts!
Haste La litstaThe 8th Dwarf 441
BEST COPY AVAILABLE
241
-2 33 Reprinted by permissionof BOWHUNTING NEWS

I ....,_ al I i 1s,,,.... -,,,,,tr,...-ril .70 r ....,-,... .- r-M., -; ,1 ST _.
,' -, ;: -c..... s.. z 1 r ". -c ' ''.
t..... , , .,-. ...i1,, '''' . .. ' . '
. ,,,,, - ..
. - . - . : . i : .. -. ' ."' .2. -, ',, fc ..' r ' .. - - .
I
,,1;;;., h;.1
....
11,111111'.;01
--.' 1=w--:----..-7.--7--
7 f
-'22 ' ,r
- .;
;
t -
'MR

:%

31
244 a3c,

44.11
41111.416.
OWHLINTERSDISCOUNT WAREHOUSE. INC.
P.O. Box 158, 1045 Zeigler RoadWellsville, PA 17365
717-432-8611
The folks at Bowhunters Warehouse ore full-line, full-time, year-round archery people. They ore only ophone call away and their knowledgeable and professional staff is always available to discuss any concernsand help you choose the proper equipment to make your bowhunting more enjoyable and successful.
245
.2 3 7.

i NG ARCHERY. -47 IIIIIIIMommink.--- rg" '. 4.. -
268 R85 JUL 16 '96 13:21
BROWNING BALLISTIC MIRAGEThe latest version of Browning's very successful Mirage series ofbows is the
Ballistic Nfirage. Using the existing handle and limbs, they mounted a cam withimproved performance and simplified the rigging with a new yoke and an axle-mounted cable adjustment The result is an exceptionally fine bow, one-quarter
pound lighter than the original and at least 5 feet per second faster.
The Ballistic Mirage is built on Browning's"Magnesium Overdraw SpeedRiser."Thishandle is a
ref esed design with the low point of the grip set about 1 1/8inches back from a line through the centers of the limb pivotbearings. The overall length of the handle is 22 12 inches,with the limb pivots located about 21 3/4 inches apart. Thesight window is cut 1/4 inch past center and has a usablelength of about 6 inches. The offset at the arrow pass addsanother 1/4 inch of clearance, making a total of 1/2 inch, mea-sured from the centerline of the handle.
The shooting string is offset 3/16 inch from the centerlineof the limbs toward the bow-arm side. This provides a totalclearance of 1 1/16 inch. measured from the surface of thearrow pass offset to the centerline of the string. Thecenterlineof the plunger hole is located approximately one inch abovethe shelf and is very close to a vertical line through the lowpoint of the grip. There is generous clearance for both broad-heads and tletching.
The mounting holes for a cable guard rod and/or otherat.ressorieS are positioned opposite each other below the grip.Each is equipped with a tapped steel bushing. The standardAMO two-hole sight mounting pattern is located on the off-side of the upper riser. The pockets for the limb butts arethree-sided with a closed base.
The replaceable grip is made from laminated wood in amedium wrist design. It is centered laterally on the handle.
The limbs for the ballistic Mirage are a recurved-reflexeddesign. Reflexing the limbs increases the level of pre-stressobtained when the bow is at brace height The constructionfeatures eight layers of laminations that are primarily fiber-glaz-reinforced, epoxy matrix material. but includes a lami-nation of graphite-reinforced epoxy under the backing glass.This is a totally synthetic composite which is not affected bymoisture or humidity. This technique fcc limb construction isideal for highly stressed, high-performance recurved limbsfor compounds equipped with aggressive cams. It is tough.durable and efficient
The plank:ern of the limbs is a reverse taper. with the great-est width at the tips and the smallest width at the butts. It is nota straight taper: rather. it approaches a parallel oudine in theslot section. The limbs have very short primary workinglengths. typical of the hinged-limb design found on manycompound bows. The thickness is maximum at the bun andtapers well trot into the length of the limb. The recurved outersection has a relatively uniform thickness to a point justbeyond the base of the slot. At this point the thickness tapersslowly toward the center of the limb.
The overall length of each limb is 16 inches. The slot forthe czun is located on the centerline and is essentially straight-skied with an elliptical base. The Ballistic Mirage lases semi-
- 2 51( cylindrical limb pivot bearings which are doweled into theface of the limb butts. These pivot bearings fit into matchingsockets in the ends of the hpineit

ERCAL/ 1 NG CIRCt-IEFC
',14;1...z...A.
The Ballistic Plus cam is similar in most respects to theother Browning cams. Part of the cable track is a rotating ckment that can be set in various positions to effect change indraw length. Some Browning cams also permit altering thepercent of let-off. but this is not nue of the Ballistic Plus cam.The base cam has the string-side track as its perimeter. andthe fixed section of the cable-side track is machined integralwith base. In addition. a citcular hub projects into the plane ofthe cable-side track This hub is used to support the adjustablesection of the cable track.
Browning calls this rotating adjustable section innercam." Part of the periphery of the inner earn is circular andmatches the inside surface of the fixed section of the cabletrack. The inner cam can be set in any of three positions toprovide three different draw lengths in one-inch increments. Itis fixed in the elected position by two flat-head. socket -typestews. The three positions are designated by the letters -A"."B" and "C'. There is an index mark on the fixed track to aidin positioning the inner cam. The base cam is machined fromaluminum alloy, while the inner cam is molded from rein-forced structural plastic.
There is a diecast double-headed pin. called a cable -lock.pressed into a hole in the central area of the base cam. Thiscable-lock projects on both sides and is used to anchor thestring on one side and the cable on the other side. Thc fixedsection of the cable track controls the force- draw characteris-tic from brace height to approximately 20 inches draw length.At this point the cable leaves the fixed track and transfers tothe track of the inner cam.
The cable actually bridges a gap in the two tracks bystretching straight across the gap. effectively creating a nalspot in the cam track This flat spot covers about two inches ofthe draw from 20 to 22 inches. The effect can be Keen as adimple or dip in the force-draw curve. Considering the designof the cam with its rotating inner cam, it would be very diffi-cult to eliminate this transition area and still maintain thestructural integrity of the end of the fixed track. While I wasable to show the dip effect with instrument readings. I found ithard to find when drawing the bow by hand. Browning usestwo cam sizes to provide draw length ranges of 28 to 30 inch-es and 30 to 32 inches. The cams are fitted with acctal alloybearings.
The rigging of the Ballistic Mirage has been greatly sim-plified at least visually, from that of the original Mirage thatuses the torque synchronizer system. The Ballistic Mirage isequipped with Browriing. s new axle synchronizers whicheliminate the multiple cable runs that the torque synchronizersrequired. Instead, the normal cable run is attached to a yokefitting which is suspended from the axle by means or a shortcable equipped with diecast end fittings. The axle passesthrough one end fitting while the other fining is pinned to aslotted clevis that is fitted over the axle. The position of theclevis with respect to the axle can be adjusted by a set savwset in the end of the clevis. The set screw has a locknut thatkeeps the screw from backing out once the earns have beenproperly synchronized.
Since only one end of the yoke cable is adjustable, thechange in the effective length of the main cable is one-halfthe length that the se screw is moved. I feel that this arrange-ment is a significant improvement over the prior rigging sinceit minimizes weight at the ends of the limbs. thus enhancingperformance. In addition. I believe that its simplified formalso increases the integrity of the rigging as well as improvingthe overall appearance of the bow. 247
14,41,
Rating Velocity
Stored Energy
Holding
Draw Ft
Mass V'-
Brace`
Avon
Canr
296 Pg6 16 '96 13:21
232.2 Peet oar
00 A 0100000000001A000100000 00110001111111111111111111110.11111111111.11. reuse1111111111301//411.11.0113211.1110113 It MIMEIMINIPSIIIII111111111111115.1111111.4.;.IMINSsmilmmomMaOlimmimmismeMUmommt-Alissaa811111111INNEms womara measeassma-ammeaIIIMIIIIIIIUmnessell1111111111monaMLANIumP
Nousw.411111111:q.M7"Atry. es.7.F. 7t1.01111211V011110/00001111010011111111111110100fr00000100;y1m00r00s0m004/a7 :::::ONEIN,sloalZaill11MadbassuCa6iikomit EMIN../1110104-ir0.1011111EnhaflaiNeMUM NG Tgaswas., .Isma isP0000,.'.,*"1013.100s-s.sisallioNsou* 11111111111PMIMPOSISIIINIIME111.111111111112cue sess7-.eura:are.4.1exerce f racessome gimewrOvENINIIPUrv.rommairP7=mssNtRIBIONwwwwwwilmommummin OOOOOO mammal.
is so
DRAW LENGTH (AMOI INCHES
Force-draw curves obtained fro,the static tests at all three test,conditions.
'
JUL
.4
:Nortr:MullamitehaBOwtunilripW.iirld fomaster's degrees'friaeroneuticelengineeppEngineer In the state of
Mullaney's Illelongiirsttdesign, buildSand expeequipment.iHeManufacturers OrganSubcommittee rasp!,archery products,. as4.Safety and Standard
Mullaney also hakze,35 years and is currihilBowhunters AssociaT
23? BEST COPY AVAILABLE

The bowstring is an 18-strand. FastFlight, endless loop type with a monofila-ment center serving. The 28- to 30-inchd r a w l e n g t h r e q u i r e s a s t r i n g l e n g t h o f 58 1/4
inches, while the 30- Da 32-inch draw lengthcalls fora string length of 61 3/4 inches.
The cable guard is a 3/8-inch diameter. round steel rod with a slick black finish. It isdog-legged to provide adjustment of cableclearance. The rod is threaded into the bush-ing located on the face of the lower riserbelow the grip and locked after being adjust-ed for tole desired clearance using a taperedferrule jam nut.
A Browning "FreeWheel Roller Guide"=ties the cables on the inside of the guardrod. 'The roller guide has a large wheel with a
Browning Ballistic MirageCOMPARATIVE TEST DATA
AWL Mow 001101- al"":74".7.1,1.0.1 POWMUM 0100Th - L1
era milAper
wow ram $I IDUCTIC0GeOr-orn- otACS.7
111.100V- R. tK
Ar-2,1411
.r.wires
60 6.5" 10
30 30 3026.8 28.2 302AO *4 6n 414ST3 56.6 56.98083'8726 90.83/447 ZPOL
244 .7.444 ,ter4.4/ 4./9 431MAI /3/.0 134 7
272.2 272.2 233.2A /a Ya4 is. S4 az.
49.4anr/c it4.1-311.
"V- groove that rides on the outside of therod. The base of the -Nr. groove has a nar-row and deeper groove that is fitted with an"0" ring that projects into the base of the"V- sufficiently to cause it to be slightlycompres.sed. This provides elastic loadingagainst the lateral pull of the cables to elimi-nate chatter.
The roller has an integral axle which fitsinto slots in two arms of the carrier clement.The carrier, which has a "U" shape. sur-rounds the guard rod with its closed end. Theclosed end of the "If' has a hub on eitherside oriented parallel with the guard rod.These hubs are through-drilled and a roll-pinis pressed into the hole flush with both endsof the hub. The hubs are slotted to expose the
r JUL' 10 "..,q0 1-5: de:
model available in basic silver highlightedin jade, red or blue, with color-coordinatedlimbs and chrome hardware. Adjustabledraw weight ranges are 45 to 70 you and60 to 80 pounds.
The TestsThe test:bow was rated at 45 - 70 poundspeak draw force, with a draw lengthadjustable between 28 and 30 inches. Iequipped the bow with a Center= arrowrestand tuned the setup for some hand shooting.One thing that impressed me immediatelywas the low noise level. Despite the veryobvious high arrow velocity, the bow wasvery quiet. After the hand shooting session. Idecided to test at three peak draw forces of
roll-pin which contacts the cables as theymove through the roller assembly. The unitretains the cables securely and has a verysmooth action. I have used this roller cablecarrier in the field many times and neverexperienced a problem.
The Ballistic Mirage is offered in twocamouflage patients. Mossy Oak Treestandand Deep Forest. In addition, there is a 3-D
ilLE 2Browning Ballistic MirageDOW EFFICIENCY - PER CENT
- as 41 as 1 as I a im I re AR t in #40
ram awe
60 .0 770 g1 74 71 7.7174000.5180,99./..34/.6
781184.Loilra.v143,..rji.0717 743
76.1749129174914429a.419141f4/831.
71
70DRAW LENGTH a 30 INCHES (AMO)
ARROW VELOCITY - FEET PER SECONO- OS SI at In NS
Maw OasPORN - IA I
60 271 MTEFIMIdMOM!!EOM
f. 2.143211.10t
.12K2.12. -
SI' . -
.7.s as0s.12.021
rays!66-70
Values ofbow ordynamic.. .efficiencyend initialarrow .velocity fore.'wide rangeof arrow.weight,srt thethree levelsof drawweight .
NAT I Co 1.i9-27-95
TheFree Wheelcable rollerguide and thelaminatedwood grip arestandardequipment onthe Ballistic'Mirage.
60. 65 and 70 pounds with a common drawlength of 30 inches AMO. This is a some-what higher range of peak draw fate thanthe usual test format, but because this bowhad a top draw weight of 70 pounds. I feltthat the higher level would provide a betterappraisal of its performance. After all. a 25-pound adjustable range for draw weight isunusual.
The static tests are run using a force-draWmachine equipped with a digital force gagethat measures draw force to the nearest one-tenth pound. Draw force is read in one-inchincrements as the bow is drawn from braceheight to the test draw length. in this instance30 inches AMO. Stored energy is calculatedfrom these data and other static measure-ments are also obtained.
The force-draw curves are presented inFigure 1 along with values of stored energyand the ratio of stored energy to peak drawforce (S.E./P.D.F.) for each of the selecteddraw weights. The transition am peculiar tothis design of cam is evident on each of thecurves near the beginning of the let-offslope. However, as stated earlier. I found thisdimple or dip difficult to feel while drawingthe bow by hand. While only the force-drawcurves are shown, the let-down curvesdemonstrate the same characteristic. The

2E' FOE JUL 16 '66 1:2E
The diecast magnesium alloyOverdraw SpamadRIser haslightening holes machined in thesides of the limb pockets.
draw and let-down are quite smooth, and thebottom-of-the-valley is precisely located at30 inches draw length. This bow has a veryshort valley with a pronounced wall as drawlength is increased. It should please anycompound shooter who likes to draw intothe "stops."
Stored energy levels are excellent, with80.85 foot-pounds at a peak draw force of 60pounds. 87.26 foot-pounds at 65 pounds, and94.83 foot-pounds at 70 pounds. The ratiosof stored energy to peak draw force were1.347 , 1.342 and 1.355 foot-pounds perpound. at 60, 65 and 70 pounds respectively.
Table 1 lists comparative data for ihcthree test conditions. The first nine lines arefrom the static tests. Brace height changedonly 1/8 inch as draw weight was increasedfrom 60 to 70 pounds. Let-off ranged from35.3 to 56.9 percent, increasing slightly asdraw weight was raised. Static hysteresis.which is a measure of friction in the bowand its components, is unusually low, rang-ing from 4.19 to 4.41 percent of stored ener-gy. This, along with the high levels of storedenergy, forecasts good performance.
Dynamic tests are performed with thebow mounted in a shooting machine inorder to insure consistency from shot toshot Arrow velocity is measured by a dou-ble chronograph arrangement. The twoinstruments are set in tandem. with the firstunit located 3 feet down-range from theback of the bow. Six test snows, varying inweight in approximate 50-grain incrementsfrom about 400 to 650 grains. are each shota minimum of five times in order to estab-lish credible average values of velocity.These experimental average velocity valuesare used to derive a curve of virtual massversus wow weight. From this curve, arrowvelocity can be calculated for any desired
BEST COPY AVAILABLE'
Please send methe FREERocky Mountain'Broadheadproductsbrochure.
Send To: Berne Archery. P.0.13431 4112. Dept.I.Weeece, MN 56093
Stms-"i7Gig6Z7
City State ZpTelephone ( ION MOM NM
ftiottaBOflaSfrWIWIMIN
Quality Outdoor Sportsmen'sSupplies kir Owe/ 33 Yeats
Gander Mountain'sArchery Catalog tea COmptstoyeafround source for the 'tenorand bownunter...trom bowfishing tobrig game...lrom 30 targets to camoClothing. YOull UM me latest in-sorsoorts m gear and MINN at
money-savlog df+cas. Send foryour FREE cony today!
MAIL TO: Gander MountainP.O. eoz 6. Dept. 8W294Wilmot. Ws 531e2
yrlire! Please send me yourYES! 1994 Archery Catalog.new. uppiss isso
10.espcheek other ~it of !Merest- .
g):Ri oAOtvo Q130ASitia-C1 CAMPO40:ii-0 HUNTING 0 RIMING 0 CLOTHING
Me/Mos/Miss/Ms (Cmcia Owl
ADostEss .
Send FREE catalogs to yo*tetrienct
MalMes/MissiMs (Cneta oks)
ADORESS
STATI 2v Bunt 21,
et 249.wil:
Bow hunting World February 1994 61

E01E75.5.L.6z EROWING PRO-ERy
I
P JUL 16 '56 1,3 : 26
14tb R E 2
Mss11111111M
MEM MEM ONII=11N1MII=IfMNO =MD =MI MIMI= NUM= *I I ro. 'Ar:f ONIMwe. =Ma MI ===============MMMMMMMMMMMMMMM =MIN=S.=1111111=1=11=. MI MI IIMI==1
-NM =I MI= WINO IMO, 1=1111Mel.: gill IBM MI MI 11.NO M.= EN Pr-J. alk . MeV ff., t11=11111111 NM==BMW IMMIN.mw.ms ==========M11=111111,=11UMINIMMIWb... IM=I INIMININIIMINWINIIII INNIMIIMMIMilem== === am wriEwI man NM IIMM11111=1=
===== MIMIEMIMMIIINSB=Wm ommi. MMM MM mrtma.. MMMMMMM IN11.111I= I= MMINNIMMIlm..MIMMIIII.1=1111==.:"MENIMIog, V A.=inim ...11 MIIM1=1..1 MI =IMMO p.711.111= mlyIMINI Os 41=INNIIIMONIIINmi=11= mos,' =HU Ma..../11 ==11MIL=4====== 71INIMOMIIMP ".=111.1r41MIMIMIEB=4==BM= ====== =I= IIIMMIII=1111..11111M =MEMI=1 =MI =I =MI IMO Im gmtml MM... OM IMIIW IMMI MEM
.11=110 IMINNINIIimmMonmt=1111= =NOM M.,=MI= IMa=11111111ir INNI=11111M1b.=11=
MIIMIMII=.111.11110.9=1111....+11111111111WM111===1111.:1111==MOM= VII fir Am .17 .1/ ar . IMINIIM111.0.=111MIIMM14.,==MIIMMII10111011111 lb.".11===0.11.1m1=11101114..-l l immilYal..=1=1M1111
11111111111MMINI ====== =====IMMEMessaommiain ========= mnb.:milmmtasoll..m.======== MIIIMI101111=11111111=Ir-.1111=11=IMI
11.711111111IMI1qm MUIR ======== MIMI= Iminir .1.10GM NOM=I============ =MINIM OM MEM MIIMININIEN MI
ARROW WEIGHT GRAINS
mom
1.2
at
.
Series ofcurves ofinitial errtfiv::;.i.velocityplotted . ,;..versus errdw:,weight tsksin,:i.,from the data.,..:In Table 2.
,
NPral9-27-93 t.. .I.
I
arrow weight The lower section of Table 2lists values of initial arrow velocity for awide range of arrow weight in incremerus of25 grains.
The initial arrow velocity values tabulat-ed in Table 2 are presented in graphic formin Figure 2. Here the velocity is plotted ver-sus arrow weight, with a separate curve foreach draw weight tested. While the curveslook quite parallel, they are actually diver-gent. The difference in velocity correspond-ing to a 5-pound change in draw weight for a
given heavy arrow is less than that for agiven light weight arrow. This is readily
teal of the arrow, all else being equal.Table 3 presents curves of initial kinetic
energy plotted versus arrow weight for thethree levels of draw weight tested. Observethat at all values of arrow weight, the ratioof kinetic energy to peak draw force isgreater than unity for all three draw weights.This ratio. which I call the power factor. is ameasure of the overall efficiency of the sys-tem. The system includes the bow, theanus'', the draw length and the personal (conand efficiency of the archer. In this case, thearcher is a shooting machine with almostperfect form and efficiency. The results of
The Ballistic Plus earns Incorporate three draw length Increments In a singlerotating inner cam element.
observed by referring to the tabulated valuesin Table 2.
Once the arrow velocity has beenobtained. the kinetic energy possessed by thearrow can be calculated, since the weight ofthe arrow is known. Kinetic energy is theenergy possessed by the speeding arrow bymason of its mass and velocity. The kineticenergy is a measure of the penetration poten-
thousands of tests of archers and their equip-ment over a number of years has shown thata powcr factor of I .(X) (unity) or greater rep-resents an exceptionally good combination.An average value of the power factor is inthe neighborhood of 0.843.
24q Power factor is improved by a bow withbetter performance. a heavier arrow,a longerdraw length or a more efficient archer. For
the Ballistic Mirage, using an arrow weightof 540 grains. a draw length of 30 inchesAMO, and our very efficient shootingmachine. the power factors are 1.078. 1.078and 1.087 at 60, 65 and 70 pounds respec-tively. The bow's exceptional performancemeans there is room there for those of uswith shorter draw lengths and less efficientexecution!
The bow or dynamic efficiency of thebow and arrow combination is obtained byexpressing the kinetic energy of the arrow asa percentage of the stored energy of the bow.In essence. it is what we get out for what weput in. Since we have determined the initialkinetic energy of the arrow, it is a simple mat-ter to calculate the dynamic efficiency of thebow when used with each weight of arrow.The first section of Table 2 lists the dynamicefficiency values corresponding to the arrowweights and velocity values shown. As indi-cated earlier by the static hysteresis, dynamicefficiency is very good, exceeding the 80 per-centile level for all three draw weights at anarrow weight of 550 grains.
The rating velocity is a standard perfor-mance parameter established by AMO topermit comparison of bows. It is defined asthe initial velocity of a 540-grain arrow shotfrom a tow set at 60 pounds peak or maxi-mum draw weight and 30 inches AMOdraw length. I determine the rating velocityfrom the curve of arrow velocity versusarrow weight established by the methoddescribed earlier. When the bow is tested atother than 60 pounds, the rating velocity iscorrected mathematically to provide a com-parative value.
Table I lists the rating velocities obtainedfor the test Ballistic Mirage at 60, 65 and 70pounds. The rating velocity at 60 pounds.232.2 feet per second is the significant para-meter. The other two are only for compari-son. In essence, they show that relative per-formance is identical at 65 pounds drawweight (232.2 feet per second) and slightlybetter at 70 pounds (2332 feet per second).This is quite believable, since the energystorage efficiency is improved at the highdraw weight and the dynamic efficiency isvery similar.
The virtual mass is another parameter thatdisplays the efficiency of a bow and arrowcombination. It functions inversely to thedynamic efficiency since the lower the virtu-al mass, the higher the dynamic efficiency.The Ballistic Mirage has an exceptionallylow level of average virtual mass, rangingfrom 131.0 to 133.6 grains. The virtual masscan be readily understood if it is visualizedas an imaginary mass that represents all ofthe inefficiencies of the bow and arrow com-bination. It is further imagined as being shotfrom the bow at the same velocity and at the

Eal -;276 -3333
same instant that the arrow is discharged It isunusual to find a compound bow with anaverage virtual mass below 140 rains.
The Ballistic Mirage offers a very highlevel of performance no matter which para-meter is used for comparison.
General CommentaryThe axle-to-axle length of the test bow mea-sured 41 1/4 inches. It did nor change whenthe draw weight was changed within therange tested. The included angle of the stringwas 89 1/2 degrees with a draw length of 30inches AMO. Cable clearthe' e was set at 1/2inch. measured from a 5/16-diameter shaftset in the plane of the string to the nearestcable.
It is interesting to compare the BallisticMirage to the Mirage I tested in 1990. TheBallistic, with its new cams, stores about 2foot-pounds more energy at the same drawweight than the earlier bow did. The statichysteresis is lower by,about 2 foot-pounds.and the dynamic efficiency is about 2 per-cent higher for equivalent arrow weights.The average virtual mass has been reducedby 16 to 18 grains. The rating velocity hasbeen increased by over 5 feet per second.The draw is smoother and just as easy for agiven draw weight, and the weight-in-handis 1/4 pound less,
With the new rigging, the Ballistic looksless complex and certainly more attractive. Ifall of that doesn't push you to trade in yourold Mirage, I miss my guess. I must admitthat I prefer the old molded grip to the newwood grip. It is narrower through the throatand seems to fit my bow-hand better.
1 found the Ballistic Mirage to haveexcellent shooting qualities It tuned withoutdifficulty, is a very quiet bow, and deliversan arrow with a great deal of authority. For a
The alloy axle synchronizer permitsfine tuning of cam roll-over to obtainperfect synchronization. A specialpin lock holds components together.
ERWiNG ARC.flEi7cY 256 P10 JUL 16 '96 13:26
;ea
.4111W
IMMIOMMOMMMIMMINVOM=MAINIMMMIMMMOMMINOMMIMMIMMOIOMMMOMMIMMMM=MMWMIMMMIMPIMMOMMMIMMIMMIMMOMMIMMMAM=IMMAMMW.IIMINWIIMMIIIMMMIMAMMAMMINIMUNIMIOAP. "LAO .../araimegm.1111111111111MMIAINIMMIIIIIIUMMOMMIIIM1111811.011MUM=1111011=1MINO1111MINIMMOMMIIMOMMIMMAIMMOMMMOMMAMMIMINMIMMIOWMMMIMMIMMMIMINIMMO=MMIOWOMIMMIONNIMMAMMUMIUmmulmiliMUMMOMMIMIMMIMIIMMMIOMMIMMMIIMMIMMIMMMIMMOMMOMMIRIMMIIMMWMOMMWAIMMOMMOMMIMMIVIIMILMMINIMMIMMIMMIMNIMMOMMOMMAIMMIIMMIMMMMIMWOMMININIMMUDIMMOM=IMMOMMIMIIMMUOMMIMMWEIMMIMMOMMWMOMMUMMINOMMOIMMIMMWOIMMIMIMIMM=MMIIMMIMMI=MMIMMP.POWINMOMOIMPUBWIMMIMMIMIEWORIMM0111111MIMOIMIMIMA.Alilr.M...V.V.11111111AMMMMIMIIOMMMWOMMMOSIMMIMMIWIMMISIMMORM=4111MMMM11111WW.mwmiadmimmilawimmimimmimmMUIBMWMIMMOMMI=MMOIMM=1111MMillMIMMUllMIUMNIA1111=1.= MMMMM111111==g0IIMMMI/IMM=Med=111111=1001INIMMLINIONIV_7-7-on.IIMII=M111111==IMIMIIMI=11=1011111EmimigoldimmimmiIMINDO111===VOMMEMINA.....ImOISIWIMMOMMIMMISIMMIMIMIMMMWMMIAMOPMT.MOMOMMIMMWM.WWWWWIWOMMMONI=MMIIMMINMM111111=MMIMMIMMM-WW%-11110-AMLAMMt=f4MMEMMOMMOOMAMMIMPUM/fMIIMMMMIIIIMM111AMMIMMIMMUOIMMOID=IMMOSIMP:a.AWOHIMMWIMIWWTCmmeasommamammommemrs..aresimmommummeammemeele.essememe.::emememirmeemmlweeme.ftwersfmmeeeleammil.memsemmmialeelmemeedreareemmmeeememmmeleimemmm.ammmeeammeemmememmilemmmeesmeemeemgemeemeee=z.......emeeememelmeeleeememalemmemerummememmimprommmeeleeemmalemmmimesm--_-_-..:.....sollameHmemmimmalleemeaemeseeemomecesommmeemormommemememmagemleimmaimmeelemeememeemseuesemmmeerammeemmmmememmeememe
bow with such high performance, it issmooth and easy to draw and pleasant toshoot.
Changing draw length is a matter ofremoving the two screws that hold the innercam in place, rotating the cam to the desiredposition and replacing the screws. Thescrews are readily accessible. but the manu-facturer cautions against over-tighteningthem. Too much pressure from the taper on
the underside of the head of the screw canbreak the inner cam. The cable load on theinner cam is taken by the hub and fixed trackon the base cam, and not by the attachingscrews. It is only necessary to tighten themsufficiently to hold the inner cam againstrotation..
In my judgment, the Ballistic Mirage isan excellent hunting bow and should proveto be a real contender in 3-D shooting. ie
The best way to tighten your belt...NordicTrack!
NordicTrack burns more fat.If Trutt Nu mull hang,. oo,..r t.,tr
NtyrdicTrick chi IX-M mdution. ThkNordicTracle VxerviNve offer' tits: rigorousworkout yuu nerd t., nwh fat away. In bat.you'll hum more ht than with trcadmills.stairmt.-ntlym and L.Avrei,... hike:. AndNorth. Intik tont-:. 311 'tutor ratty k ghnir.Ir. !Wing y,tur .11,0 own.
Diets alone don't work.cr.,41 Jita t-an Nlow your mksaholiNrn.
but NonlicTr.wk it. io you hum inory
cakv14: vv-11 Maly you km.
30-day in-home
Try our caiotic-biazing workout and burn upto 1.100 calories per how. Studies show that
in 14 =Pis Lebs1 hat& A Nordic Track fatLk:sight smog liar! an =rags of 12 rotunda.
Isn't it about time you got on trackwith NordicTrathl Call today:
1-800-441-7891 111
FREE Informationi
Nordic rackA CAL CaTIPV
mire clanging rah' Shape of ,intericce
BEST COPY AVAILABLE; (43 25
0 14sess seed ma t a FREE brocboare0 Alto LW MS plasoeve
'Name Phone (
I Street
SateSea to NonkTreck. Dept. 971344
70e Peavey Reed Chaska. MN 55318-2355etas* Madera& Ix. CKL Carper" Al Vie tribal1
Eloafbuntiag World February 1994 63

ARCHERYProduct Knowledge
Basic Information On The Art OfSelling Archery Equipment
written by
John Spomer
published by
National Sporting Goods Association717 No. Michigan Avenue
Chicago, Illinois 60611
2 52
copyright 1975all rights reserved

Bot
h ty
pes
are
mad
e fo
r ei
ther
tour
nam
ent o
r hu
ntin
gsh
ootin
g w
ith s
ome
mod
els
that
may
be
used
for
eith
ersp
ort.
The
han
dle
riser
on
take
-dow
n bo
ws
may
be
of m
agne
-si
um o
r an
allo
y of
mag
nesi
um a
nd a
lum
inum
, or
of la
m-
inat
ed a
nd d
yed
map
le o
r of
sol
id h
ardw
ood.
The
bet
ter
qual
ity b
ows
have
per
fect
ly m
atch
ed li
mbs
of
lam
inat
ed m
aple
and
fibe
rgla
ss c
onst
ruct
ion
in th
e re
-cu
rve
styl
e. T
he li
mbs
are
sol
d in
pai
rs a
nd th
e ar
cher
may
pur
chas
e se
vera
l pai
rs o
f lim
bs, i
n w
eigh
ts a
ndle
ngth
s fo
r to
urna
men
t sho
otin
g or
hun
ting
for
use
onth
e sa
me
hand
le.
Mod
erat
ely
pric
ed ta
ke-d
own
bow
s m
ay h
ave
solid
woo
dha
ndle
s an
d so
lid fi
berg
lass
rec
urve
d lim
bs. L
imbs
may
also
be
inte
rcha
nged
in th
is q
ualit
y.
Man
y ex
perie
nced
arc
hers
pre
fer
take
-dow
n bo
ws
be-
caus
e th
ey a
re m
ore
stab
le w
hen
shoo
ting
than
com
-po
site
bow
s, a
re e
asily
car
ried
and
stor
ed, a
nd a
re s
uit-
able
for
any
type
'sho
otin
g by
sim
ply
chan
ging
the
limbs
.
Cr,
One
var
iatio
n in
take
-dow
n bo
ws
has
a w
ood
hand
le r
iser
with
an
alum
inum
lock
ing
devi
ce a
nd p
in in
the
cent
erof
the
hand
le fo
r ta
ke-d
own.
The
lim
bs o
f thi
s bo
war
epe
rman
ently
mol
ded
to e
ach
hand
le s
ectio
n. In
appe
ar-
ance
this
bow
is v
ery
sim
ilar
to a
con
vent
iona
l com
posi
tebo
w.
The
Com
poun
d B
owH
ow It
Wor
ksT
hree
Prin
cipl
es
The
com
poun
d bo
w is
a n
ew c
once
pt th
at p
rom
ises
toso
lve
bow
-wei
ght p
robl
ems
and
incr
ease
an a
rche
r'sac
cura
cy. T
he c
ompo
und
bow
was
inve
nted
and
dev
el-
oped
by
Mr.
H. W
. Alle
n of
Bill
ings
, Mis
sour
i. M
ost c
om-
poun
d bo
ws
are
man
ufac
ture
d by
var
ious
com
pani
esun
der
licen
se fr
om M
r. A
llen.
2514
Com
poun
d B
ow T
erm
inol
ogy
15

Incr
ease
d F
oot-
Pou
nds
of E
nerg
yA
rifl
e w
ith a
20"
bar
rel p
rodu
ces
muc
h gr
eate
r m
uzzl
eve
loci
ty (
spee
d) th
an a
han
d gu
n w
ith a
6"
barr
elof
equa
l cal
iber
, bul
let w
eigh
t and
pow
der
char
ge. T
he r
ifle
appl
ies
the
gas
pres
sure
for
20"
rath
er th
an ju
st 6
", in
-cr
easi
ng th
e fo
ot-p
ound
s of
ene
rgy
appl
ied
to th
e bu
llet.
The
ecc
entr
ic p
ulle
ys o
n th
e lim
b tip
s of
the
com
poun
dbo
w a
ccom
plis
h th
is s
ame
prin
cipl
e by
app
lyin
g m
axi-
mum
pul
l wei
ght f
or a
gre
ater
num
ber
of in
ches
; in
the
conv
entio
nal b
ow, p
ull w
eigh
t dec
reas
es fr
om th
e in
stan
tof
rel
ease
at a
ste
ady
rate
as
the
bow
str
ing
mov
es fo
r-w
ard.
In th
e co
mpo
und
bow
, the
pea
k pu
ll w
eigh
t pou
nd-
age
is a
t mid
dra
w. T
here
fore
, as
the
bow
str
ing
mov
esfo
rwar
d fr
om r
elea
se, t
he p
ound
age
incr
ease
s to
pea
kan
d th
en d
ecre
ases
, giv
ing
a m
ajor
incr
ease
in lo
ot -
poun
ds o
f ene
rgy
for
appl
icat
ion
to th
e ar
row
.
Red
uctio
n of
Iner
tia (
Res
ista
nce
of W
eigh
t to
Mot
ion)
In th
e rif
le, t
he o
nly
iner
tia is
that
of t
he b
ulle
t. T
he to
tal
wei
ght w
hich
mus
t be
put i
n m
otio
n in
any
bow
, is
the
arro
w, p
lus
bow
str
ing,
plu
s th
at p
ortio
n of
eac
h bo
w li
mb
whi
ch m
oves
. In
the
conv
entio
nal b
ow, e
ach
limb
wei
ghs
mor
e th
an tw
ice
the
wei
ght o
f the
arr
ow, w
hich
mea
nsth
at y
ou m
ust m
ove
live
arro
ws
in w
eigh
t, in
ord
er to
shoo
t one
arr
ow. T
his
is w
hy r
educ
tion
of th
e w
eigh
t of
the
one
arro
w y
ou s
hoot
, pro
duce
s on
ly m
odes
t spe
edga
ins.
You
are
red
ucin
g th
e w
eigh
t of o
nly
1/5
of th
eto
tal l
oad.
Itis
als
o w
hy w
ith c
onve
ntio
nal b
ows
heav
yar
row
s an
d he
ads
are
reco
mm
ende
d fo
r hu
ntin
g pe
ne-
trat
ion.
Con
vent
iona
l bow
s ca
n no
t inc
reas
e sp
eed
to g
etpe
netr
atio
n. In
a 5
0# c
onve
ntio
nal b
ow, 5
0# m
ust p
rope
lth
e w
eigh
t of t
he li
mbs
a d
ista
nce
of 8
"; th
e sa
me
50#
mus
t pro
pel t
he c
ente
r of
the
strin
g an
d th
e ar
row
20"
tost
ring
rest
pos
ition
.
In c
ompo
und
bow
s. g
ener
ally
two
stra
nds
of c
able
(co
n-ne
cted
to a
con
vent
iona
l bow
str
ing)
run
ove
r pu
lleys
in a
man
ner
sim
ilar
to a
blo
ck a
nd ta
ckle
, the
refo
re w
ith a
tota
l of t
hree
str
ands
pul
ling
on th
e lim
b tip
s, li
mbs
mus
tbe
use
d eq
ual i
n st
reng
th to
a 1
50#
conv
entio
nal b
ow,
in o
rder
to r
esul
t in
a 50
# pu
ll on
the
strin
g of
a c
om-
poun
d bo
w. T
he li
mb
tip tr
avel
is r
educ
ed to
onl
y 3"
,ra
ther
than
8"
as in
the
conv
entio
nal b
ow.
The
refo
re, 1
50#
is a
vaila
ble
to m
ove
limbs
and
pul
leys
adi
stan
ce o
f onl
y 3"
whi
le th
e re
mai
nder
of t
he 5
0# fo
rce
255
16
on th
e st
ring
mov
es o
nly
the
strin
g an
d ar
row
the
norm
aldi
stan
ce o
f 20"
to s
trin
g re
st p
ositi
on. T
his
is w
hy r
educ
-tio
n of
tota
l arr
ow w
eigh
t in
a co
mpo
und
bow
pro
duce
sph
enom
enal
spe
ed in
crea
ses
of 5
0%. M
ost o
f the
iner
tiaof
the
limbs
is e
limin
ated
by
the
trip
led
forc
e ap
plie
d to
mov
ing
them
the
shor
ter
dist
ance
they
mus
t mov
e. T
hus
the
arro
w w
eigh
t red
uctio
n is
con
vert
ed d
irect
ly to
spe
edin
crea
se, w
ith li
ttle
or n
o lo
ss o
f im
pact
or
pene
trat
ion.
Red
uctio
n of
Arr
ow W
eigh
tIt
is p
ossi
ble
to u
se li
ghte
r ar
row
s in
a c
ompo
und
bow
beca
use
of th
e re
laxa
tion
at fu
ll dr
aw, d
ue to
the
actio
nof
the
ecce
ntric
pul
leys
on
the
limb
tips.
Acc
eler
atio
n is
grad
ual,
and
the
arro
w is
in m
otio
n be
fore
pea
k pu
sh is
appl
ied.
The
rel
axat
ion
is fr
om 1
5% to
20%
of t
he p
eak
wei
ght,
mea
ning
that
a 5
0# p
eak
setti
ng o
n a
com
poun
dbo
w w
ill h
old
at fu
ll dr
aw a
t abo
ut 4
0#. T
here
fore
, an
arro
w s
pine
d fo
r 40
# is
abo
ut w
hat c
an b
e us
ed. i
nstr
uc-
tion
shee
ts fo
r m
atch
ing
arro
ws
to c
ompo
und
bow
s ar
ein
clud
ed w
ith th
e bo
w a
nd s
houl
d be
follo
wed
.
Com
poun
d bo
ws
are
mad
e in
eith
er a
one
pie
ce fu
llle
ngth
sty
le o
r in
the
take
-dow
n st
yle.
Han
dle
riser
s m
aybe
eith
er m
agne
sium
or
hard
woo
d. L
imbs
are
lam
inat
edw
ood
and
fiber
glas
s in
the
top
qual
ity b
ows
and
solid
fiber
glas
s in
the
low
er q
ualit
y bo
ws.
Low
er q
ualit
y co
m-
poun
d bo
ws
may
be
mor
e ex
pens
ive
than
mos
t hig
hqu
ality
con
vent
iona
l bow
s.
Com
poun
d bo
ws
are
mad
e by
som
e m
anuf
actu
rers
inbo
th ta
rget
and
hun
ting
mod
els,
som
e m
ake
only
hun
ting
mod
els
and
som
e m
ake
one
styl
e th
at m
ay b
e us
ed fo
rbo
th ty
pes
of s
hoot
ing.
Tar
get b
ows
rang
e fr
om 5
6" to
58"
in le
ngth
. Hun
ting
bow
s ra
nge
from
48"
to 5
0" a
ndbo
ws
that
may
be
used
for
eith
er ty
pe o
f sho
otin
g ar
e in
the
51"
leng
th r
ange
.
In m
ost m
akes
of c
ompo
und
bow
s th
e tw
o id
ler
whe
el-
pulle
y as
sem
blie
s ar
e at
tach
ed to
the
bow
lim
bs p
art w
aydo
wn
the
limb
from
the
tip. T
he e
ccen
tric
-whe
el a
ssem
-bl
ies
are
atta
ched
at t
he ti
ps o
f the
lim
bs. T
he s
teel
cabl
es a
re a
ttach
ed to
a c
onve
ntio
nal b
ow s
trin
g ne
area
ch ti
p by
the
use
of S
hoo
ks. T
hese
bow
s ar
e ge
nera
llyav
aila
ble
in th
ree
targ
et a
nd th
ree
hunt
ing
limb
wei
ghts
and
draw
wei
ghts
. Gen
eral
ly d
raw
leng
ths
can
be a
d-ju
sted
and
pea
k w
eigh
t can
be
adju
sted
with
in a
10
lb.
rang
e. M
ass
wei
ght o
f the
se b
ows
will
var
y fr
om 3
lb. 8
oz.
to 4
lb. 4
oz.
17


11/40%./ALIDCK ru3rusi 1 T1UST trricienT arrow snarl- in me worla-
X-CALIBER SPECIFICATIONS and COMPARABLES
ShaftsSizes O.D. I.D.
Grain Wt,Per Inch
InsertGrain Wt.
FLUTE
Width; Depth
DEFLECTIONper 30"Centers
WALLThickness
ComparableAluminum Sizes
h' . ,:iv-at ,-1..i.',0.:.
--. 7.--. 73::*---:-..-.:- ..
. 13.88:: --- --::s.,._
,04,..000:----._ _______ _.
....875_,_-___,:..- -._ :,-_;-p,.._
.
.,(112___
, i;_.-,..:-. _-. ::- --_:::
98161981819916.717.421-..8/2013/2016___ __
The Advanced Archery Equipment Hunting Shaft Selection Chart was designed for the experienced Bowhunter andTarget Arcner as well as the Novice for fast reference of arrow shaft size per Bow Weight and Draw Length. TheX CALIBER fluted arrow shaft sizes have been added to the chart for quick reference from the CONVENTIONAL ROUNDARROW SHAFT (CRS) to the FLUTED ARROW SHAFT (FS).Note All shaft sizes on chart (1816 through 2412) are contractions of actual physical dimensions of the tubes.Example. 2212 Fluted shafts have 22/64" outside diameter and a .012" wall thickness.
12
34
-r-","9111111.-1.-1
5
67 0
8
9
1011
12
13
14
15
16
17
1819
20DISTANCE (YARDS) 160 FTS21 1 1 1 1111111111111111111,1111111 1 11111111111 1 1 1 1 1 1 L I 1 1 1 1 1 1 I 1 1
O IA O IA a 0cA .4)
ARROW TRAJECTORY CURVEI I
BOTH EXAMPLES TESTED WITH A 65 LEI COMPOUND BOW
EIN (BLUE) 2117 (CRS) Total Arrow Wt. 520 gr. wt.EXAMPLES: vs.
imml(RED) 2212 (FS) Total Arrow Wt. 380 gr. wt.
23&
280 FT/S270 FT /S260 FTIS250 FT/S
240 FT/S
230 FTIS
220 FT'S
210 FT /S
200 FTIS
190 FT/S
180 FT/S
170 FT /S

ARROW KINETIC-ENERGYCURVES
NOTE INCREASE OFKINETIC ENERGY
WITH FWTED SHAFT
320
300
280
240
220
xl 200
ion"m 160
O 140
<
Sr: 100
80
60
40
20
?- a s g § § §§ s r?,
ARROW WEIGHT (grains)§ §
60 FT-LB55 FT-LB50 FT -LB45 FT-LB40 FT-LB25 FT-LB30 FT-LB
25 FT-LB
20 FT-LB
15 FT-LB
10 FT-LB
5 FT-LB
ARROW MOMENTUMCURVES
A rtri,../ ,/.01.e...1.
.60 LB-S
55 LB-S
50 LB-S
45 LB-S
40 LB-S
35 LB-S
30 LB-S
25 LB-S
20 L8-S
15 LB-S
10 LB-S 25 905 LB-S
d-C12

ADVANCED ARCHERY EQUIPMENT HUNTING SHAFT SELECTION. CHART
ActualBow
Weight26
CRS F.S. CRS F.S. CRS F.S. CRS F.S. CRS F.S. CRS F.S.I31 32
ACTUAL HUNTING ARROW LENGTH28 29 30
201 F'
27CRS F.S.
35-40 1816 2012 1816 2012 18161916
20422014916 2012r .
1916 . 2012 2042016 -
[ 40-45 11816
45.50 11816it 1916
191650-55 2016
4:- -gzsilgs 2011 2046-2012 1-4946,, 2012 120i944 012 20.164
2012go'6
19162012 2016
2016 20162012 I 2018 2012 12018 2012
2114 2114
20162012 2018 2012
2114
2016620155.60 2042 2018 20122018
2114
201660-65 2018 2012
65-70
70-75
75-80
80-85
There have been many discussions in the field and at the Archery Pro shops about Vdlocity, Trajectory, Penetration VS.Mass Weight. Some archers say you need the mass weight for penetration and other archers say you don't. Withtoday's technology in arrow shaft design. you can achieve the same penetration with a certain increase in Velocity.With X-CALIBER fluted arrow shafts you also achieve a Flatter Trajectory, Better Accuracy and Greater Penetrationbecause of the 40% decrease in actual outside surface area. See examples on Kinetic Energy chart. We at AdvancedArchery Equipment hope you will enjoy these reference charts and thank you for your loyalty and continued interest inAAE Shafts & Accessories.
2 61
Yours in Archery
Carl LekavichPresident,
ADVANCED ARCHERY EQUIPMENT17800 MITCHELL, P.O. BOX 19188, IRVINE, CALIFORNIA 92714

BOWHUNTING
ITH EASTON LaINUM A OW S _FTS

THE TECHNICAL SIDE-BEYOND THE BASICS OF
HUNTING ARROWSELECTION
Arrow flight, speed, trajectory,accuracy, weight and penetration:these are the elements that deter-mine success or failure in bow hunt-ing. The more you understand aboutyour equipment, the greater yourchances of success in the tield.
The performance of a huntingarrow with a sharp broadheaddepends first upon the accuracy ofthe shot and, second, upon theenergy of the arrow at impact. Skilland properly tuned equipmentlargely determine accuracy. Assum-ing reasonable accuracy, it is thenthe mass weight and speed at impactthat determine the energy of thearrow and the effectiveness of thearrow on game. Easton Aluminumoffers the widest range of arrowshaft sizes and weights availableanywhere, thereby assuring thebowhunter that he will find in theEaston selection the ideal size andweight arrow for his draw length, hisbow, his quarry, and the huntingconditions he faces.
The material which follows is anadvanced guide for an individual'suse in selecting the optimumbowhunting arrow. It presents fac-tual data and figures with which theperformance of different huntingarrow sizes can be compared andevaluated.
The following step-by-step pro-cedure if used with the EASTONALUMINUM HUNTING SHAFTSELECTION CHART, ARROWBALLISTIC CHARTS and theVELOCITY-ARROW DROPCHART will allow you to analyze theeffect of hunting arrow weight andspeed based upon a derived compari-son figure called "Kinetic Energy':Kinetic Energy is the actual energyat impact (measured in foot-pounds)of a particular weight arrow travel-ing at a particular speed. For a hunt-ing arrow, Kinetic Energy is notnecessarily a measure of killingpower. However, Kinetic Energy fig-ures are a useful and logical means ofcomparing and evaluating the per-formance of different huntingarrowweights.
To determine the Kinetic Energyand impact velocity of your huntingarrow you will need to determine 1)your TOTAL ARROW WEIGHT andthe 2) EXIT VELOCITY (speed as itleaves the bow) of your arrow usingthe following methods:
1) TOTAL ARROW WEIGHTcan be determined by i hng on a
.
grain scale or by refe a e 8and 9 of the EASTONHUNTING SHAFT .TIONCHART. Immediate! eright ofeach arrow size on the art is theweight of the arrow in grains. Thelisted arrow weight includes theweight of an aluminum R.P.S. insertplus 35 grains for the fletching andnock. Point or broadhead weightmust be added to determine yourTOTAL ARROW WEIGHT.
2) Arrow EXIT VELOCITY canbe determined by shooting an arrowthrough a chronograph (check withyour local archery dealer) or by usingthe "Arrow Drop method describedon page 12 and the accompanyingVELOCITY-ARROW DROPCHART.
Once you have determined theEXIT VELOCITY of your arrow,then go to the ARROW BALLISTICCHARTS and locate the chart thatcorresponds most closely to yourTOTAL ARROW WEIGHT. In theleft hand column (zero distance) onthat chart find the closest listedEXIT VELOCITY to the EXITVELOCITY of your arrow. Thecolumns to the right of the EXITVELOCITY column will show aKinetic Energy and an impact veloc-ity figure at various hunting distan-ces. (Example: With a 600 grainarrow traveling at 200 feet persecond upon release, the KineticEnergy would be 51.4 foot poundsand 196.3 feet per second [fps] EXITVELOCITY at 10 yards and 42.0 footpounds and 177.6 fps EXITVELOCITY at 60 yards).
Should you wish to be more pre-cise in determining the KineticEnergy and/or impact velocity ofyour arrow, you may use one of thefollowing methods:
1) Interpolate between the fig-ures on the TOTAL ARROWWEIGHT charts that bracket yourTOTAL ARROW WEIGHT figureand between the EXIT VELOCITYfigures that bracket your EXIT VE-LOCITY on those same two charts.
2) Use the formula shown below:Kinetic Energy Impact Velccity r2 x Arrow Mass Weight
2
Exact impact velocity can bedetermined by shooting through achronograph at various distances.You cannot use EXIT VELOCITY inthis formula.
The mass weight of an arrow inpounds is calculated by dividing theTOTAL ARROW WEIGHT of thearrow (in grains) by 7000 x 32.16.
Kinetic Energy is measured infoot pounds at point of impact. Theformula can be written as:C." Impact Velocpv a Impart Velamtv e r ;run Weprla Arm.EnergyA ac 2 ,t 7000 11.I6t lmpt
As you delve more deeply intothe technical process of arrow selec-tion, one other vital element must beconsidered. That element is theanticipated hunting situation. Thereal key to selecting the optimumbowhunting arrow is to carefullycombine the calculated comparisonfigures with the specific nature ofthe expected hunting situation. Fac-tors such as the distance of the aver-age shot, the terrain, and the size ofthe game must be balanced with thetechnical factors of arrow speed,arrow weight and resultant KineticEnergy. Specific bowhunting condi-tions will often call for a differentweight arrow. For example, the idealarrow for a 15 yard tree stand shot atwhitetail buck may not be the idealarrow for a 50 yard stalking shot inopen country at pronghorn antelope.Larger game at a reliably known andreasonably short distance maydemand an arrow possessing maxi-mum weight and Kinetic Energy.Speed and flatter trajectory wouldtherefore become secondary consid-erations. On the other hand, a longershot at an antelope might require anarrow with higher speed and there-fore a flat trajectory. The resultantloss of Kinetic Energy is traded bythe hunter for increased accuracy atlong and/or unknown distances.
Knowing your equipment welland then selecting a hunting arrowweight based on desired arrow per-formance for a specific hunting con-dition is the formula for success.
The best bowhunters havelooked to Easton Aluminum since1946 for technical information andthe widest choice of high perfor-mance hunting shafts available.
2 2

ARROW DROP METHODOF DETERMINING
ARROW EXIT VELOCITY
To find EXIT VELOCITY bythe Arrow Drop method, begin bymeasuring your anchor pointheight (the distance between thecenter of your eye and the top ofthe arrow shaft) while at fulldraw using your normal anchorpoint. Next, mark off two linesexactly 15 and 25 yards from atarget on level ground and placean aiming spot on the target.With repeated shooting from the15 yard line, carefully set a sightpin so your arrows group closelyaround the aiming spot. Awooden match taped to the bowcan act as a sight pin if you do notuse a sight. Then move back tothe 25 yard mark and shoot againusing the same 15 yard sight pinsetting while aiming at the samespot on the target. When you haveestablished a good arrowgroupbelow the aiming spot, measurehow much lower the center ofyour 25 yard group is below thecenter of the aiming spot. Thismeasurement is your Arrow Dropfigure. With your Arrow Drop fig-ure then go to the VELOCITY-ARROW DROP CHART and fromthe Arrow Drop figure listed onthe vertical axis, move horizontallyacross the chart until you reach acurve or a point between thecurves corresponding to yourmeasured anchor point height.Then move straight down fromthat intersection or point to locatethe arrow EXIT VELOCITY onthe horizontal axis of the chart.Example: With a drop of 9.6inches and a three inch anchorpoint height, the EXIT VELOCITYis 203 feet per second.
Easton is grateful to Larry Luter-man for the many hours he workedcreating the technical ballisticinformation presented in thiscatalog.
Edited by Elizabeth White.
VELOCITY VS ARROW DROP AT 25 YARDS WITH 15 YARD MARK23'
140 i50 160 170 180 190 200 210 220 230 240 250 260 270 280 290 300 310
VELOCITY-FPS
3' ANC HOE 4' ANCHOR - ANC HOR
BALLISTIC COEFFICIENT = 6x 10⁻⁴
12

. ARROW BALLISTIC CHARTS280 grains 300 grains
Exit Distance in Yards Exit Distance in YardsVelocity 10 20 30 40 50 60 Velocity 10 20 30 40 50 60
Velocity 200 196.3 192.5 188.8 185.0 181.3 177.6 Velocity 200 196.3 192.5 188.8 185.0 181.3 177.6Energy 24.0 23.0 222 21.3 20.4 19.6 Energy 25.7 24.7 23.8 22.8 21.9 21.0Velocity 220 215.9 211.8 207.7 203.6 199.4 195.3 Velocity 220 215.9 .211.8 207.7 203.6 199.4 195.3Energy 29.0 27.9 26.8 25.8 24.7 23.7 Energy 3 28.7 27.6 26.5 25.4Velocity 240 235.5 231.0 226.5 222.1 217.6 213.1 Velocity 240 235.5 :; 231.0 226.5 222.1 217.6 213.1Energy 34.5 33.2 31.9 30.7 29.4 282 Energy - 342 32.9 31.5 30.3Velocity 260 255.1 250.3 245.4 240.6 235.7 230.8 Velocity 260 255.1-":!250.3 245.4 240.6 235.7 230.8Energy 40.5 39.0 37.5 36.0 34.5 33.1 Energy 43.4.44L7 40.1 38.6 37.0 35.5Velocity 280 274.8 269.5 264.3 259.1 253.8 248.6 Velocity 280 274.8 269.5 264.3 259.1 253.8 248.6Energy 47.0 45.2 43.4 41.7 40.1 38.4 Energy 50.3 48.4 46.5 44.7 42.9 41.2Velocity 300 294.4 288.8 283.2 277.6 272.0 266.4 Velocity 300 294.4 288.8 2832 277.6 272.0 266.4Energy 53.9 51.9 49.9 47.9 46.0 44.1 Energy 57.8 55.6 53.4 51.3 49.3 47.3
320 grains 340 grains
Exit Distance in Yards Exit Distance in YardsVelocity 10 20 30 40 50 60 Velocity 10 20 30 40 50 60
Velocity 200 196.3 192.5 188.8 185.0 181.3 177.6 Velocity 200 196.3 192.5 188.8 185.0 181.3 177.6Energy 27.4 26.3 25.3 24.3 23.4 22.4 Energy 29.1 28.0 26.9 25.8 24.8 23.8Velocity 220 215.9 211.8 207.7 203.6 199.4 195.3 Velocity 220 215.9 211.8 207.7 203.6 199.4 195.3Energy 33.1 31.9 30.7 29.5 28.3 27.1 Energy 35.2 33.9 32.6 31.3 30.0 28.8Velocity 240 235.5 231.0 226.5 222.1 217.6 213.1 Velocity 240 235.5 231.0 226.5 222.1 217.6 213.1Energy 39.4 37.9 36.5 35.1 33.7 32.3 Energy 41.9 40.3 38.7 37.3 35.8 34.3Velocity 260 255.1 250.3 245.4 240.6 235.7 230.8 Velocity 260 255.1 250.3 245.4 240.6 235.7 230.8Energy 46.3 44.5 42.8 41.1 39.5 37.9 Energy 49.1 47.3 45.5 43.7 42.0 402Velocity 280 274.8 269.5 264.3 259.1 253.8 248.6 Velocity 280 274.8 269.5 264.3 259.1 953 8 248.6Energy 53.7 51.6 49.6 47.7 45.8 43.9 Energy 57.0 54.8 52.8 50.7 48.6 46.7Velocity 300 294.4 288.8 2832 277.6 272.0 266.4 Velocity 300 294.4 288.8 283.2 277.6 272.0 266.4Energy 61.6 59.3 57.0 54.8 52.6 50.4 Energy 65.5 63.0 60.6 58.8 55.9 53.6
360 grains 380 grains
Exit Distance in Yards Exit Distance in YardsVelocity 10 20 30 40 50 60 Velocity 10 20 30 40 50 60
Velocity 190 186.4 182.9 179.3 175.8 172.2 168.7 Velocity 190 186.4 182.9 179.3 175.8 1722 168.7Energy 27.8 26.7 25.7 24.7 23.7 22.8 Energy 29.3 28.2 27.1 26.1 25.0 24.0Velocity 210 206.1 202.1 198.2 194.3 190.4 186.4 Velocity 210 206.1 202.1 1982 194.3 190.4 186.4Energy 34.0 32.7 31.4 302 29.0 27.8 Energy 35.9 34.5 33.2 31.9 30.6 29.3Velocity 230 225.7 221.4 217.1 212.8 208.5 204.2 Velocity 230 225j 221.4 217.1 212.8 208.5 2042Energy 40.7 39.2 37.7 362 34.8 33.3 Energy 43.0 41.4 39.8 382 36.7 352Velocity 250 245.3 240.7 236.0 231.3 226.6 222.0 Velocity 250 245.3 240.7 236.0 231.3 226.6 222.0Energy 48.1 46.3 44.5 42.8 41.1 39.4 Energy 50.8 48.9 47.0 452 43.3 41.6Velocity 270 265.0 259.9 254.9 249.8 244.8 239.7 Velocity 270 265.0 259.9 254.9 249.8 244.8 239.7Energy 56.2 54.0 52.0 49.9 47.9 45.9 Energy 59.3 57.0 54.8 52.7 50.6 48.5Velocity 290 284.6 279.2 273.7 268.3 262.9 257.5 Velocity 290 284.6 2792 273.7 268.3 262.9 257.5Energy 64.8 62.3 59.9 57.6 55.3 53.0 Energy 68.4 65.8 632 60.8 58.3 56.0
400 grains 420 grains
Exit Distance in Yards Exit Distance in YardsVelocity 10 20 30 40 50 60 Velocity 10 20 30 40 50 60
Velocity 190 186.4 182.9 179.3 175.8 1722 168.7 Velocity 190 186.4 182.9 179.3 175.8 1722 168.7Energy 30.9 29.7 28.6 27.5 26.3 25.3 Energy 32.4 312 30.0 28.8 27.7 26.5Velocity 210 206.1 202.1 198.2 194.3 190.4 186.4 Velocity 210 206.1 202.1 1982 194.3 190.4 186.4Energy 37.7 36.3 34.9 33.5 322 30.9 Energy 39.6 38.1 36.6 352 33.8 32.4Velocity 230 225.7 221.4 217.1 212.8 208.5 204.2 Velocity 230 225.7 221.4 217.1 212.8 208.5 204.2Energy 45.3 43.5 41.9 402 38.6 37.0 Energy 47.5 45.7 44.0 422 40.6 38.9Velocity 250 245.3 240.7 236.0 231.3 226.6 222.0 Velocity 250 245.3 240.7 236.0 231.3 226.6 222.0Energy 53.5 51.5 49.5 47.5 45.6 43.8 Energy 56.1 54.0 52.0 49.9 47.9 46.0Velocity 270 265.0 259.9 254.9 249.8 244.8 239.7 Velocity 270 265.0 259.9 254.9 249.8 244.8 239.7Energy 62.4 60.0 57.7 55.4 532 51.0 Energy 65.5 63.0 60.6 582 55.9 53.6Velocity 290 284.6 2792 273.7 268.3 262.9 257.5 Velocity 290 284.6 2792 273.7 268.3 262.9 257.5Energy 72.0 69.3 66.6 64.0 61.4 58.9 Energy 75.6 72.7 69.9 672 64.5 61.9
Tables are based on a ballistic coefficient of 6x10'' which is appropriate for most huntingarrows with plastic vanes.
13 264 BEST COPY AVAILABLE

265E ST N ALUMINUM.EASTON ALUMINUM. INC . 5040 W. HAROLD GATTY R. SALT LAKE CITY. UT 841 1 6 -289 7 USA. 8011539-1400 FAX 18011533 -9907 TELEX 469190 REFLEX SV CI
s-

If
..s1 Fam..111171"IL
f.
::-,An, i. i"..-,,,,T.t. ,,,...fl
Gainesville, Florida 32601 Summer 1983
AN ARCHERY EQUIPMENT PERSPECTIVENONGAME
TAX CHECKOFF
This year, Indiana residents will beable to contribute a portion of their1982 income tax refund to their state'sDepartment of Natural Resources, Di-vision of Fish and Game.
The Indiana Wildlife Federationplayed an instrumental role in securingpassage of the new non-game check-off, approved by the 1981-82 IndianaGeneral Assembly.
Officials expect $300,000 or morewill be raised during the first year thecheck-off is in effect.
Nationally, $3.3 million was raisedlast year through the income tax check-off program, now underway in over 20states. Contributions averaged $5.73each, based on the 570,000-plus tax-payers participating in 1982.
National Wildlife Federation
SEND US YOURHUNTING PHOTOS
FBSC members are invited to send intheir recent photographs of animalsthat have been harvested with bow andarrow. Be sure to scotchtape a piece ofpaper to the back of each print withyour name, address, telephone, yearthe animal was taken, make of bow,arrows and hunting head used. Alsothe species, and area taken in. Be sureto include your FBSC number. Sendthem to: Dick Lattimer, Fred BearSports Club, Fred Bear Drive at ArcherRoad, Gainesville, Florida 32601.
totheynu booboo WOO yo SOINHUIMIOG
AO
70
SO
So
JO
:0
0
...
7ii ,
.......
... ....
:4(o4ITICAsJ. At IC,
4EIW 4
,RA:Nelli11:1 m..Ito 40
a.ls .117.0f14(
'001LOS. 4441.0mHr ;O.
4441.0.,701.,s,7,Z,..
1';e:',111AWii.Z.,,f
.,0S*
:77:11i4f01A.
kiAGIN
{AWN
II ASmi0
/074,
A
4,
,,
71:04A
/A4A
; 4.,47Aor !
4F
rAra,
II 4r
r
47.1:
7 /7
7'A,
1."
.11
v/4
4r
,
IA
7-
A20
FIGURE 1. Typical force-draw diagrams for:Theoretical 100% efficient bow & practicalmaximum 90% efficient bow.
10
Z7S
7S0
F.r.
zoo
SO
MAXPER
',Tort PooR t-rAiv
ENT/ALE PoR .6,
MIW/N151111MiMillidSgirS
rialli aco..,
ti ALL 50Pee Cc
s AterSSifICA
p,c41.0A4
EXCEPTPOrefAir
7'
fiat A
L. At/CAL
itorIS
SE
_DR*
h/. T ,A -
Led4Tpec7A0fri
30 meDS.MisArt
10 SO 70 70
FIGURE 2. Comparison of hunting wowvelocity for various bow types.
a2.5. g 2,
ByNorbert F. MullaneyProfessional Engineer
Independent Testing LaboratoryMilwaukee, Wisconsin
(Editor's Note: With all of the technologicaladvances in archery equipment in recentyears, the bow and arrow still remains aviable historical "primitive" weapon. Its useas a recreational tool has never been morepopular or valid as it is today. Norb Mul-laney's fresh viewpoint on this subjectpoints this out.)
It began when archers first taped amatchstick or a hatpin to the back ofthe bow riser and used it for a sightingdevice. It became more audible whenaluminum alloy arrows demonstratedconsistent superiority over traditionalwooden arrows. It was rekindled whenrelease aids began to be used by morethan just a handful of experimentersand flight shooters. But, it has becomea matter for serious considerationsince the introduction and refinementof the compound bow.
More frequently now, since the ap-pearance of programmed cams forcompound bows, we hear concernvoiced over the continued improve-ment of archery equipment as a resultof seemingly never ending technologi-cal development. Serious, knowledge-able, and thinking archery people aswell as many state DNR and Fish andGame authorities wonder whether our"primitive" long bow and arrow isbecoming a space-age projectilelauncher that will ultimately rival a fire-arm in hunting efficiency and effect.
Quite frankly, this concern is notfounded in fact. It can be readilydemonstrated that the generic "longbow" has distinct physical and prac-tical limitations that no amount of ad-vanced science or technology can sur-mount. Some small improvements arepossible over the up-to-date bows andarrows that we know and use today,
Continued on Page 2
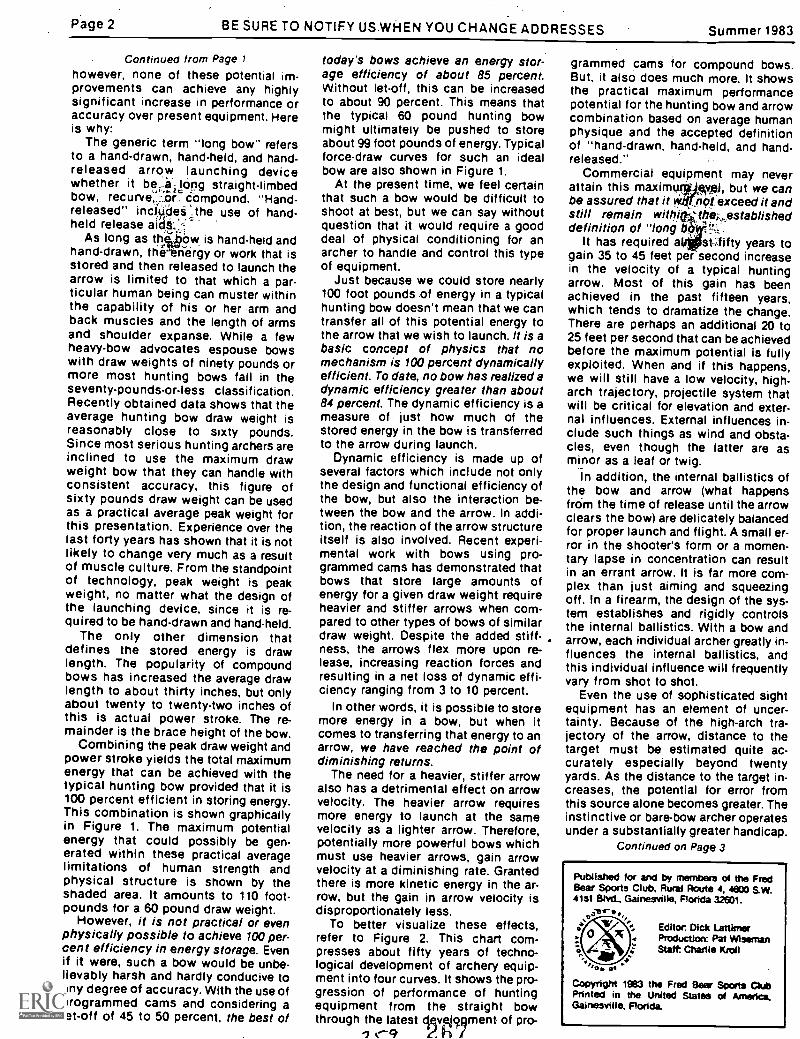
Page 2 BE SURE TO NOTIFY US WHEN YOU CHANGE ADDRESSES Summer 1983
Continued from Page 1however, none of these potential im-provements can achieve any highlysignificant increase in performance oraccuracy over present equipment. Hereis why:
The generic term "long bow" refersto a hand-drawn, hand-held, and hand-released arrow launching devicewhether it beAlOng straight-limbedbow, recurve,..-or. compound. "Hand-released" includes .,the use of hand-held release
As long as thibOw is hand-held andhand-drawn, theriergy or work that isstored and then released to launch thearrow is limited to that which a par-ticular human being can muster withinthe capability of his or her arm andback muscles and the length of armsand shoulder expanse. While a fewheavy-bow advocates espouse bowswith draw weights of ninety pounds ormore most hunting bows fall in theseventy-pounds-or-less classification.Recently obtained data shows that theaverage hunting bow draw weight isreasonably close to sixty pounds.Since most serious hunting archers areinclined to use the maximum drawweight bow that they can handle withconsistent accuracy, this figure ofsixty pounds draw weight can be usedas a practical average peak weight forthis presentation. Experience over thelast forty years has shown that it is notlikely to change very much as a resultof muscle culture. From the standpointof technology, peak weight is peakweight, no matter what the design ofthe launching device, since it is re-quired to be hand-drawn and hand-held.
The only other dimension thatdefines the stored energy is drawlength. The popularity of compoundbows has increased the average drawlength to about thirty inches, but onlyabout twenty to twenty-two inches ofthis is actual power stroke. The re-mainder is the brace height of the bow.
Combining the peak draw weight andpower stroke yields the total maximumenergy that can be achieved with thetypical hunting bow provided that it is100 percent efficient in storing energy.This combination is shown graphicallyin Figure 1. The maximum potentialenergy that could possibly be gen-erated within these practical averagelimitations of human strength andphysical structure is shown by theshaded area. It amounts to 110 foot-pounds for a 60 pound draw weight.
However, it is not practical or evenphysically possible to achieve 100 per-cent efficiency in energy storage. Evenif it were, such a bow would be unbe-lievably harsh and hardly conducive toany degree of accuracy. With the use ofprogrammed cams and considering alet-off of 45 to 50 percent, the best of
today's bows achieve an energy stor-age efficiency of about 85 percent.Without let-off, this can be increasedto about 90 percent. This means thatthe typical 60 pound hunting bowmight ultimately be pushed to storeabout 99 foot pounds of energy. Typicalforce-draw curves for such an idealbow are also shown in Figure 1.
At the present time, we feel certainthat such a bow would be difficult toshoot at best, but we can say withoutquestion that it would require a gooddeal of physical conditioning for anarcher to handle and control this typeof equipment.
Just because we could store nearly100 foot pounds of energy in a typicalhunting bow doesn't mean that we cantransfer all of this potential energy tothe arrow that we wish to launch. It is abasic concept of physics that nomechanism is 100 percent dynamicallyefficient. To date, no bow has realized adynamic efficiency greater than about84 percent. The dynamic efficiency is ameasure of just how much of thestored energy in the bow is transferredto the arrow during launch.
Dynamic efficiency is made up ofseveral factors which include not onlythe design and functional efficiency ofthe bow, but also the interaction be-tween the bow and the arrow. In addi-tion, the reaction of the arrow structureitself is also involved. Recent experi-mental work with bows using pro-grammed cams has demonstrated thatbows that store large amounts ofenergy for a given draw weight requireheavier and stiffer arrows when com-pared to other types of bows of similardraw weight. Despite the added stiff-ness, the arrows flex more upon re-lease, increasing reaction forces andresulting in a net loss of dynamic effi-ciency ranging from 3 to 10 percent.
In other words, it is possible to storemore energy in a bow, but when itcomes to transferring that energy to anarrow, we have reached the point ofdiminishing returns.
The need for a heavier, stiffer arrowalso has a detrimental effect on arrowvelocity. The heavier arrow requiresmore energy to launch at the samevelocity as a lighter arrow. Therefore,potentially more powerful bows whichmust use heavier arrows, gain arrowvelocity at a diminishing rate. Grantedthere is more kinetic energy in the ar-row, but the gain in arrow velocity isdisproportionately less.
To better visualize these effects,refer to Figure 2. This chart com-presses about fifty years of techno-logical development of archery equip-ment into four curves. It shows the pro-gression of performance of huntingequipment from the straight bowthrough the latest clevejggment of pro-
/ cq h
grammed cams for compound bows.But. it also does much more. It showsthe practical maximum performancepotential for the hunting bow and arrowcombination based on average humanphysique and the accepted definitionof "hand-drawn, hand-held, and hand-released."
Commercial equipment may neverattain this maximuljp*, but we canbe assured that it redt.not exceed it andstill remain wittytbzthei:,establisheddefinition of "long b..., .7-':.
It has required al
stAitty years togain 35 to 45 feet per second increasein the velocity of a typical huntingarrow. Most of this gain has beenachieved in the past fifteen years,which tends to dramatize the change.There are perhaps an additional 20 to25 feet per second that can be achievedbefore the maximum potential is fullyexploited. When and if this happens,we will still have a low velocity, high-arch trajectory, projectile system thatwill be critical for elevation and exter-nal influences. External influences in-clude such things as wind and obsta-cles, even though the latter are asminor as a leaf or twig.
In addition, the internal ballistics ofthe bow and arrow (what happensfrcim the time of release until the arrowclears the bow) are delicately balancedfor proper launch and flight. A small er-ror in the shooter's form or a momen-tary lapse in concentration can resultin an errant arrow. It is far more com-plex than just aiming and squeezingoff. In a firearm, the design of the sys-tem establishes and rigidly controlsthe internal ballistics. With a bow andarrow, each individual archer greatly in-fluences the internal ballistics, andthis individual influence will frequentlyvary from shot to shot.
Even the use of sophisticated sightequipment has an element of uncer-tainty. Because of the high-arch tra-jectory of the arrow, distance to thetarget must be estimated quite ac-curately especially beyond twentyyards. As the distance to the target in-creases, the potential for error fromthis source alone becomes greater. Theinstinctive or bare-bow archer operatesunder a substantially greater handicap.
Continued on Page 3
Published for and by members of the FredBear Sports Club, Rural Route 4, 4600 S.W.41st Blvd., Gainesville, Florida 32601.
'',2Copyright 1983 the Fred Bear Sports ClubPrinted in the United Slates of America.Gainesville, Florida
Editor Dick LattimerProduction: Pat WisemanStith Charlie Kroll

Page 3 TAKE A BUDDY BOWFISHING Summer 1983
Continued from Page 2
He or she relies on a visual distancejudgment plus an intimate knowledgeof the normal trajectory of his arrow todirect the shot. This system introducescritical variables that only skill andregular practice can conquer on a con-sistent basis.
To establish a perspective for thehigh-arch trajectory of an arrow, con-sider that a 540 grain typical huntingarrow with an initial horizontal velocityof 200 feet per second will drop about9% feet in 50 yards. A 170 grain type30-30 projectile from a standard load ri-fle cartridge will have a muzzle velocityabout 2200 feet per second, and dropless than 11/2 inches for the samerange. (Fig. 3).
Taken at its maximum potential, thebow and arrow remains a minimumvelocity, multiple-variable, short-rangehunting system. With practical huntingequipment, it will never reach one-quarter the speed of sound. The in-dividual human control of the internalballistics phase of the launch can andwill continue to limit accuracy for thegreat majority of bowhunters. This fac-tor is even more critical with equip-ment that will deliver arrow velocity inthe higher levels. In other words, con-trol is more important and also moredifficult to achieve with equipmentcapable of providing the higher velocityarrows.
These factors combine to keep theup-to-the-minute hand-drawn, hand-held, and hand-released long bow andarrow a "primitive" hunting system.Within this accepted definition, thereis insufficient scientific potential toprogress beyond that category.
140 R Z 0A/TA Lz°. BORE L/A/EI
BEAR ARCHERYACQUIRES JENNINGS!
COMPOUND BOWSGAINESVILLE, FLORIDARobert F.
Kelly, president. Bear Archery sub-sidiary of Kidde, Inc., today announcedthe acquisition by Bear of the JenningsCompound Bow line. .
The Jennings® line of bow.* to bemade by Bear Archery, will'-dOntinuethe philosophy, high quality - `design,construction and performance*. Jen-nings® bows to which the archeryworld has become accustomed.
Kelly stated, "We are delighted tobring together two of the finest namesin the Archery Industry today. I ampleased to announce that Tom Jenningswill continue his association with Jen-nings® as a consultant to Bear Archery.Tom's innovative mind and productdevelopments have played a major rolein the popularity and growth of thesports of target archery and bowhunt-ing over the past two decades.
"Bear and the Jennings® Companyshared many of the same dealers andwe know that they too will be pleasedwith the continuation of the Jennings®product line and bowmaking phi-losophy.
"We expect to begin delivery of theJennings® line from our Gainesvillelocation within 120 days."
Company spokesman indicated thatwarranty service on Jennings® bowsmade by Bear will be taken care ofpromptly.
For more information about JenningsCompound Bows, call Area Code904-376-0476, or write: Jennings, PostOffice Box 1750, Gainesville, FL 32601.
TICATECToAr or /70 GR.30 -30 RIFLE eczorEcpi_E14/77,1 NoRizeA/TAL/11/ZZLE yeLoCirr of IA2200 FPS. 41,,
pics4d S
rimy( cToRy Or C40fflAn4/ ARROW '4/ 7p#
/A//T /AL HoRizoAlTALvELoc Tr or 200 F.P.S.
Ei0 "sig/0 20 30 40
DOWN alfAnfoE -yARDs
FIGURE 3. Comparison of projecticle drop at 50 yards.
.26/0 2{63
NEW MODIFICATIONPERFECTS BEAR'S
SUPER RAZORHEAD
Gainesville, Florida...In 1977 whenthe new Bear Super Razorhead S/S wasintroduced, a simplified system of at-taching the machined aluminum alloyferrule to the stainless steel blade wasinaugurated.
On the old-style Razorheads the fer-rule and blade had been joined by spotwelding. In the new version, a highpressure clamping action took theplace of the weld.
Bowhunters hailed the upgradedstainless steel heads for their ability towithstand rust and corrosion and theresistance of the highly sharpenedblade edges to dulling.
One difficulty did, however, occa-sionally surface in the field. Upon hit-ting rocks, tree trunks or other hardsurfaces at an angle, the fore end of theferrule sometimes separated from itspressure juncture with the blade.
Now, thanks to a new D-Hole Modi-fication worked out by Bear's Research
Development Department, the junc-ture between blade and ferrule hasbeen strengthened to the point where itwill withstand 300 lbs. of blow force.Not only is the D-Hole Modificationmany times stronger, but the bladeseating remains undeviating throughlack of any clamping pressure distor-tion and the alignment of blade and fer-rule is consistently truer.
Confirming proof of the strength in-herent in this new D-Hole Modificationcan be had by clamping the fore end ofthe head in a vise and working it backand forth through 180 degrees until theblade snaps off. lt will be found that theferrule remains firmly attached to theblade throughout this 'torture' test.
Since it was first introduced by FredBear back in 1956, the Bear Razorheadhas been the favorite of knowledgeablebowhunters, having probably accountedfor more than half of the big gameanimals taken by bowmen since thattime. Now, with this latest modifica-tion, we at Bear can state unequivo-cably that it is the finest broadhead inthe world.
Charlie Kroll

SUPPLEMENT TO:
Chapter S-1
BOWHUNTING
TEACHING LESSON PLAN
INSTRUCTIONAL UNIT
TRAINING SUPPLEMENT
NOhuntersafety andconservationprogramINSTRUCTOR'S MANUAL
TEACHING LESSON PLAN
OBJECTIVE:
METHOD OF TEACHING:TIME REQUIRED:
ASSISTANTS REQUIRED:
INSTRUCTIONAL AIDS:
PHYSICAL SET-UP:
BowhuntingTo have a basic knowledge of archery equipment, itscare and safe handling. To understand the fundamen-tals of shooting and their relationship to field situa-tions. To know and understand the limitations ofarchery equipment. To accept the personal limitationsof the bowhunter.
Lecture; demonstration; practical exercises, if possible.
One hour. Practical work, including both stringing thebow and shooting, will require additional time. Theamount of time will be determined by the number ofqualified assistants, the amount of equipment, and thenumber of target positions available.
One demonstrator.
Student handbook; charts; slides or actual photo-graphs; selection of archery equipment.
Classroom with demonstration area situated so all cansee.
269BEST COPY AVAILABLE

III. Classroom ExercisesBracing the BowA. Cord stringer method:
B. Step-through method:
1. Slip the upper loop over the upper bow limb.:2. Place the lower bowstring loop in the groove of the
lower nock, and secure with a rubber bow-tip protector.3. Fit the stringer pouches over the bow tips.4. Stand on the center of the bowstringer, pulling the bow
up while holding it by the handle.5. When the bow has sufficient flex, slip the upper string
loop into the grooved nock.
279_2(02-
.7;
1. The bowstring should be loopedover the upper limb and nockedon the lower limb, as describedin the previous method.
1. With the right leg, step throughcar between string and bow, andhook lower recurve on the out-side of left foot and over theinstep. The use of a foot or ankleharness will guard against twist-ing the bow limb.
3. Place thigh against the bowhandle and apply pressure back-ward, at the same time bendingthe bow by leaning forwardfrom the waist and applyingpressure with the right hand.The string loop can then beslipped into place in the uppernock. Before pressure is released,check to make sure the stringloops are firmly seated in thebow nocks.
17

INTERNATIONALHUNTEREDUCATIONASSOCIATION
4.4Zia .1:1-Ate
1995 HuntingAccident Report
Hunting Accident Reportwith Graphics of 1991-1995 Data

8
80
70U)1Z 60
U 50
<40LL
20
10
0
REGION 1 ACCIDENTS5 YEAR TREND
_____......_1111111
1111111
1111111
111111.
InE3
i 1
weEll
,
1991 1992 1993 1994 1995
Fatal
Non-fatal
Total
120
80
0cew 4003
20
0
REGION 2 ACCIDENTS5 YEAR TREND
1991 1992 1993 1994 19
Fatal
Non-fatal
Total
272,26

a
Ft,
s`.`
111111
11111111111111111111111111111111111111111111111
4-.4112EZ
ZM
IXE
Maina .
--_t
1111111111111111111111111111111111111111111111111
s;,\:;';Z
aats7LE
iii11111111111H11111111111111111111111111111111111
9: .S.
11101111111111tiuninitIMIM
IIIIIIiI1111111
,72iaTZ
EM
NIE
NS
P11111111111111101111111111111111111111111111111111111111
5+,1",
X.,
I.
I
'14i
a
aSS4
411
'V
-;.
,4:.71,..,..... :,2;,..-=.
MN
"--.;r:46,..-;.,:.1;_,J,,;2-
larS: 7-,-,,,,..,.....,.. .:.1S.L
.,". 14iii
ill :.. <,z,s.,.1..kkt.`:..,`,., z,S
,,,,;1..,., ,k, \
.

1986-1995 TWO PARTY ACCIDENTSBY EQUIPMENT BEING USED
Bow (0.9%)Other (0.6%)-1
Handgun (1.6%)7 !Muzzle Loader (1.1%) I I
Shotgun (68.6%)
1986-1995 TWO PARTY ACCIDENTSBY AGE OF SHOOTER
Age Unknown (15.7%)
Age 60 + (5.1%)
Age 50-59 (6.5%)
Age 40-49 (11.6%)
Age 30-39 (17.9%)
rAge 1-9 (0.6%)
274IS

Vickie SmithComposite Science
Fulmore Middle School, Austin ISD
Texas Parks & WildlifeProject WILD, Austin
Kathryn Hampton, Mentor
rya
275

TTIPCurriculum Implementation Plan
Abstract
Name: Vickie Dun levy Smith
Internship: Texas Parks and Wildlife Department
School: Fulmore Middle School, Austin, Texas
Subject: Life Science
Activities: Measuring urban mammal skullsLearning Scientific names for skull partsUsing a key to identify urban mammal skullscleaning mammal skulls
Summary: Life Science involves the study of living organisms.With the use of teeth, jaws, and skullsstudents can examine what was once alive andsee how each mammal species has adapted totheir environment. The objective of the Key toUrban Mammals exercise is for the students tomaster using a scientific tool- the key-, applyinga specific vocabulary, practice with measurement,and using observation skills to help determinemore about the urban mammals and their habitat.
The Key to Urban Mammals is one of many activitiesthat can be found in a special educational trunk availablethrough urban biologist with Texas Parks and WildlifeDepartment. The WILD in the City trunk contains 12mammal skulls, 9 samples of fur, 7 books, 14 slides of theurban mammals, track and scat replicas, deer antlers, acow horn, and legs from a deer, bob cat and much more.The goal of the trunk is to increase urban educationthrough Project WILD activities. For further informationsee the list of general resources.
.2 6, 9
g G

Curriculum Implementation Plan
Objectives:
Students will be able to:
1. identify urban mammal skulls with the aid of a key.
2. measure using metric units.
3. recognize specialized teeth in mammals.
4. develop an appreciation for scientific terms.
5. compare and contrast the mammal skulls for the needs of each species.
Background:
Students need to have the 12 mammal skulls available. They can work ingroups or individually. The skulls need to be handled gently and withcaution since many are very fragile.
This lesson can be taught with existing units on mammals or the skeleton.Reference material can be obtained by using the general resources at the endof this document.Finally, examination of the skulls and teeth can show characteristics whichare similar in humans.Once the skulls have been identified, ask the students questions about thephysiology of each species. Have them write a conclusion as to why anarmadillo has no incisors or canines yet it eats meat and plants. Anotherquestion might be why do the nocturnal mammals have such a wideinterorbital width? The deer skull brings up the question as to why do somemammals have antlers or horns and most have nothing protruding from theskull. How are these specimens similar or different from our own skull? Dowe have long sharp canines or long incisors? How have humans adapted theenvironment of today?

How To Use the Skull Key
The identification of a mammal skull or jaw is made with the help of a "key". A keyis a selection of features arranged in a sequence of alternatives, from which a choicemust be made at each step of the sequence. By following through the series of choicescorrectly, you are guided to an identification. The key is arranged by a series ofnumbered steps, and at each step, two or more contrasting features are described, eachindicated by a, b, c, or d. At most steps only two choices are offered.The key uses a minimum of technical terms. All terms are listed in the glossary. Mostmeasurements are only approximations. The measurements are given in centimeters(2.5cm equals 1 inch). All measurements are taken with the skull or jaw in a positionsuch that the molar or cheek teeth are in a nearly horizontal position.
Glossary of Terms:
Anterior - toward the front of the skull or lower jaw bone.
Canine -one of the four teeth in the front corners of the mouth.Canine teeth are usually large and pointed in meat-eatingspecies, but may be small, or even absent, in plant eaters.They are the first (the most anterior) teeth in the maxilla,or upper jaw bone. In humans, they are sometimescalled 'eye-teeth' because they are located just below theeyes.
Cheek Teeth -Teeth rooted in the maxilla (upper jaw bone), behind thecanines, along the sides of the mouth. They include bothpremolars and molars, and may have from 1 to 5 roots,depending on their size. In the lower jaw all teethbehind canines (or incisors, if canines are absent) are alsocheek teeth.
Cranium the skull without the lower jaws.
Incisor - tooth in the front of the mouth, between the canines.Incisors of the upper jaw grow from the premaxilla; allother upper teeth grow from the maxilla.
Interorbital width -Distance between the upper edges of the orbits (eyesockets), measured across the top of the skull.
Jaw - the lower jaw, or mandible; it is formed of the twodentary bones, one on each side.
,.278v
027/

Length of jaw
Length of skull
Maxilla-
- greatest length of the lower jaw, measured from thefront of the incisors to the most posterior point of thejaw, either at the angle of the jaw or at the condyle(movable joint where the jaw meets the skull).
- greatest length of the lower jaw, measured from thefront of the incisors or from the most anterior part of thepremaxilla, or nasals (which ever is most anterior), to themost posterior part of the skull.
- bone forming major portion of the upper jaw on eachside, and supporting the upper canines and the cheekteeth.
Nasal bones- - from the upper surface of the rostrum, or muzzle, lyingabove the nasal openings.
Orbit-
Posterior
Premaxilla
- the eye socket. The size of the orbit can be determinedby measuring its diameter, from rim to rim. The lengthof the orbit is its diameter from front to rear.
toward the back, or rear, of the skull or lower jaw.
- forms the most anterior part of the skull, the front tipof the upper jaw, in front of the maxilla. Supports theincisor teeth, curves upwards toward the nasal bones.
For more information:The Mammals of Texas, by William B. Davis and David J. Schmid ly ( Texas Parksand Wildlife, 1994)The Golden Guide to Mammals, Golden Press, 1987A Key Guide to Mammal Skulls and Lower Jaw Bones by Aryan I. Roest (Mad RiverViziugslE1911)mited- Moore OKAmerican Head Hunter-Dayton, TXMoscow Trading Co.- Moscow, IDR&R Trappers Supply- New Ulm, MN
279
.2 7,,

A Key to Urban Mammal Skulls
1- a. Large skull, over than 20cm: go to step 2b. Medium skull, 10 -19cm: go to step 3c. Small skull, 3 -9cm: go to step 7d. Tiny skull, less than 3 cm: go to step 9
2- a. No canine teeth: whitetail deerb. long canine teeth: coyote
3- a. canine teeth: go to step 4b. no canines or incisors: armadillo
4- a. Molar row longer than 3.5cm: go to step 5b. Molar row 2 -3cm: go to step 6
5- a. 5 incisors, 6-7 cheek teeth: opossumb. 3 incisors, 6 cheek teeth,braincase narrows toward the back: raccoon
6- a. length of canine 3cm ,
inter orbital (eye socket) width 3cm: bobcatb. length of canine 1cm,inter orbital width 2.5cm: domestic cat
7- a. canine teeth: go to step 8b. no canine teeth: rabbit
8- a. length of skull longer than 7cm: skunkb. length of skull less than 7cm squirrel
9- a. skull chunky, 1 or 2 incisors on each side separatedin front of skull by a distinct notch: batb. skull 2.5 cm long, incisors not notchedor grooved: house mouse
73

Cleaning Skulls
Some people may wish to order cleaned skulls from companies which deal in thistrade. But for those who want to clean skulls which have been found, especially if theskulls are not broken and still have most of their teeth the following will help with
the process.
If the skull or jaw bone is nearly stripped of flesh by insects when it is found, soakingin plain water for 24 hours and a simple brushing, with an old toothbrush, soap andrunning water, may be enough to clean it. Be sure all soft tissue is removed from thebrain cavity and the nasal passages before allowing the scrubbed skull to dry.
If hair and meat are still attached to the skull, they should be removed. In most casesthis is easily accomplished by cooking the skull. If it is a small skull, it can be droppedinto boiling water for a few minutes; usually five minutes is enough. Then removethe skull from the boiling water (using forceps or tongs), hold it under cool runningwater, and pull off any bits of loose tissue with forceps, fingers. or whatever seems towork best. An old toothbrush is very useful here too.
Larger skulls should not be dropped into boiling water, since the sudden change intemperature may cause large teeth to split. They can be placed in cool water in a largepan, can or bucket to which a bit of detergent has been added to cut the grease. Placethese on the stove or hot plate to warm or simmer-- no warmer. This should not bedone in the kitchen the garage or outside is better. After several hours, orovernight, or even several days if the skull is very large, the soft tissue can be easilyremoved from the skull bones. A little trimming by hand under running water, andsome brushing with a small brush will produce a nice cleaned skull.
Cleaned skulls can be left in the sun for a few days to dry and bleach a bit. They canalso be soaked, for a few minutes only, in a solution of hydrogen peroxide (1/2 cupper gallon of water) to whiten them. After a brief soaking, allow the skull to drywithout rinsing. Commercial bleaches should be used only as a very dilute solutionwith water since they tend to cause the bones to be brittle and leave a crusty sediment.
Skulls can also be cleaned by allowing them to rot in water, without heating orcooking. But this is a very smelly process. The results are excellent but allow enoughtime for all the soft tissue to be rotted away. Avoid letting flies get to the soft tissue of
a fresh skull. They may lay eggs on the flesh; which quickly develop into maggots, andthe maggots will clean the skull of tissue. However, they also release materials which
may stain or discolor the underlying bone.

For More Information
General Resources
Acorn Naturalist17300 East 17th St. # J -236Tustin, Ca 92680
American HeadhunterP.O. Box 61Dayton, Tx 77535(409) 258-3102
Bat Conservation InternationalP.O. Box 162603Austin, Tx 787161-800-538-BATS
City Kids and City Critters! by Janet Wier Roberts and Carole Huelbig(McGraw Hill, 1996)
Furs Plus/Don CooperP.O. Box 1107Linda le, Tx 75771(903) 882-4294
The Fur Bearers of Texas by David J. Schmid ly (Texas Parks and WildlifeDepartment Bullitin No. 111)Golden Guide to Mammals by Herbert S. Zim and Donald F. Huffmiester(Golden Press, New York, 1987)
The Kids' Wildlife Book by Warner Shedd (Williamson Publishing, 1994)
Learn about...Texas Indians by Georg Zappler and Elena T. Ivy (Texas Parksand Wildlife Press, 1996)
The Mammals of Texas by William B. Davis and David J. Schmid ly (TexasParks and Wildlife Department, 1994)
'282,2

Moscow Hide and FurP.O. Box 8918Moscow, Idaho(208) 882-0601
OBIS- Outdoor Biology Instructional StrategiesDelta EducationP.O. Box 915Hudson, N.H. 03051-0915
PawtographsMichael Huges209 Post Creek RdNashville, Tn 37221
Peterson's First Guide to Urban Wildlife by Sarah B. Landry (HoughtonMifflin Co., 1994)
Project WILD5430 Grosvenor Ln.Bethesda, Md 20814(301) 493-5447Email- [email protected]
Rocky Mountain Elk Foundation2291 West BroadwayP.O. Box 8249Missoula, Mt 59807-82491-800-CALL-ELK
R&R Trapper's Supply1405 North BroadwayNew Ulm, Mn 56073(507) 354-5318
Sharing Your SpaceDakota Department of Game, Fish and Parks
Skulls Unlimited InternationalP.O.Box 6741Moore, Ok 731531-800-659-SKULL
A-7U
283

Texas Memorial Museum PublicationsThe University of Texas2400 TrinityAustin, Tx 78705
Texas Parks and Wildlife Department4200 Smith School RoadAustin, Texas 787441-800-792-1112Web Sitehttp://www.tpwd.state.tx.us
Texas Wildscapes, Backyard Wildlife Habitat Packet (Texas Parks andWildlife Department Nongame and Urban Program, 4200 Smith School Rd,Austin, Tx 78744)
Take Along Guide Tracks, Scats and Signs by Leslie Dendy(Northwood Press, Inc., Minocqua, Wisconsin, 1995)
ZoobooksP.O. Box 85271San Diego, Ca 93128
7
264
WILD in the CITY-The Urban June leHands-on activities for students and educators learning
about urban wildlife of Texas
Introductory PacketAcknowledgmentsWILD in the City and Project WILD wish to thank the followingbusinesses and individuals who generously helped put together theWILD in the City-The Urban Jungle trunks for educators in Texas:
Wild Basin Preserve- Austin, Tx
The American Head Hunter-Paul Micallef
R&R Trapper's Supply
Furs Plus- Don Cooper
Johnny Stewart Game Calls-Waco, Tx- Gerald Stewart
Skulls Unlimited- Moore, Ok
Texas Memorial Museum- University of Texas at Austin
Special thanks to the Texas Parks and Wildlife Departmentand to these individuals who were especially helpful:
Donnie Harmel Kerr Wildlife Management Area- Hunt, TxSusan Harris ISS, Austin, TxElena Ivy Public Lands, Austin, TXJuliann Pool Public Lands, Austin, TXRay Whitney Urban Biologist, Cedar Hill, TxPaul Hope Retired, Austin, TX
285

General Information
The WILD in the City program is part of an effort by the Texas Parks& Wildlife Department to bring the world of wildlife to inner-citystudents across the state. This program was created in 1995 by the
nationally renowned Project WILD program which is a K-12
conservation and environmental education program emphasizingwildlife. Through a $6,000 grant provided by the Phillips PetroleumCompany and the National Fish and Wildlife Foundation the TexasProject WILD office has created the "WILD in the City--the UrbanJungle" program.
These trunks have been designed to assist educators in developinglesson plans that will spark student interest in urban mammals suchas the grey squirrel, bat, opossum, raccoon, whitetail deer, cotton tailrabbit, coyote, armadillo, mouse, and skunk and wildlifeconservation. The trunk design allows for an interactive learningapproach through the use of hands on activities and lessons fromprograms such as Project WILD, OBIS, National 4-H, and books such
as The Kids' Wildlife Book, Introducing Mammals to Young
Naturalists and Zoobooks. These books have been referenced by tabs
placed on the appropriate page for easy guidance to the backgroundinformation and activities.
The trunks have been designed for use by teachers and educatorswith students in grades K-12. However, there are more applicationsfor the upper elementary and middle school level students.
Teachers may use some or all of the activities/presentations in thetrunks to enhance their classroom lessons.
Trunks are available from Texas Parks and Wildlife Department on afirst come first serve basis and the loan period is not to exceed three
weeks.
The trunk may be picked up and returned to the urban wildlife
offices of theTexas Parks and Wildlife Department urban biologists
office nearest your school.
286
ago

All borrowers must complete a Receipt for property. This holds theborrower responsible for the trunk and its contents from theft orloss. The replacement cost for each trunk is $1000. Individual itemcost varies and may be purchased to replace those that become lostor damaged while the trunk is in your possession.
The trunks contain valuable items and should be kept locked, in asecure place when not in use.
A teacher evaluation form is enclosed in the trunks to allow forteacher comment and to provide the Texas Parks and WildlifeDepartment with suggestions on how to better assist educators intheir missions. Borrowers are encouraged to complete the evaluationform.
For more information about how you can receive the. Project WILDactivity guide please contact:
Texas Parks & Wildlife Departmentattn: Project WILD coordinator4200 Smith School RoadAustin, TX 78744800-792-1112 ext. 64

Trunk Components Checklist
Slide Show (14 slides, script)Introducing Mammals to Young NaturalistsThe Kids' Wildlife Book
1. MammalsGolden Guide to Mammal
"Bats" Zoobook
A Key to Urban Mammal Skulls9 mammal skins/fursBones and Teeth"Dilly of a 'Di llo" Project WILD Activity
Mammals ofTexasFur Bearers ofTexas12 SkullsTape Measure
2. Mammal SignTake Along Guide to Tracks, Scat and Sign9 Scat Replicas 11 Track
Replicas
Bobcat Leg with paw Deer Leg withhoof
"Tracks!" Project WILD activityCoyote skin with legs and foot
3. Mammal SurvivalDeer Call Squirrel Call Sound Safari Cassette
Tape"Night Animals" Zoobook (available early 1997)"Quick Frozen Critters" Project WILD ActivityOBIS activities "Sound Off", Silent Stalking","Invent and Animal"
4. Deer"Deer Family" Zoobook Antlers
5 JawbonesHow to Age Deer Activity Cow HornLearn About Whitetails, TPWD publication"Oh Deer" Project WILD ActivityBody Language Silhouettes Cards and key"Deer Crossing" Project WILD Activity
5. Hides9 Mammal Skins
"Make A Coat" Project WILD ActivityMoccasin Pattern
Za:S28a-

Code for Skulls, Tracks, Scats, and Furs:
I. Armadillo
II. Bat
III. Bobcat
IV. Coyote
V. Deer
VI. Domestic Cat
VII. Mouse
VIII. Opossum
IX. Rabbit
X. Raccoon
XI. Skunk
XII. Squirrel
289

WILD in the CITYTrunk Evaluation Form
Thank you for your interest in WILD in the CITY. Texas Parks and WildlifeDepartment and Project WILD are interested in your response to the project.Your feedback will help us evaluate the program and make improvements.Please include your name and address so we can keep you updated withadditional information and services that we may offer in the future.Please photocopy this form, then fill out and send the copy to:
Texas Parks & Wildlife DepartmentAttn. Project WILD Coordinator
4200 Smith SChool RoadAustin, Tx 78744
Please Print
Name: Male Female
EthnicitySchool Name:Your Students' Grade LevelSchool Address:
Home Address:
How did you hear about WILD in the CITY?the Project WILD coordinatorattended a WILD in the CITY workshopother
Please rate the trunk materials on a scale of 1-5 (one being the best
rating):Were the materials age-appropriate? yes no
Why or why not?
Did the WILD in the CITY materials blend into your regular lesson
plans?yes no Why or why not?
vi

"What You Wear Is What They Were"Project WILD Activity
6. Urban Nature SearchPeterson's First Guide to Urban WildlifeWildscapes Information PacketNational 4-H Wildlife Project"Urban Nature Search" and "Wildwork"
Project WILD Activities" Microtrek Treasure Hunt" Project WILD Activity
WILD in the CITY Slide Show
1.
2.3.4.5.6.7.8.
9.10.11.12.13.14.

1- MAMMALSBackground: Each species of mammal is especially adapted to its
way of life, (where it lives, what it eats, etc.), but all mammalsshare certain characteristics. Mammals are warm- bloodedvertebrates that have hair and produce milk to feed their young.Some mammals eat plants (herbivores), some are meat eaters(carnivores), and others have a diet of both plant and animal(omnivores). Because mammals have this varied diet they also havespecialized teeth. Front teeth called incisors, bite and cut. Predators
such as bobcats have sharp pointed canine teeth next to the incisorsto grip and tear. Premoloars and molars are used to shred, grind,
and crush by animals like deer, rabbits, squirrels, opossums andskunksFor more information: Little Golden Guide To Mammals,Mammals of Texas, The Kids' Wildlife Book , Introducing MammalsTo' Young Naturalists, and Fur Bearers of TexasMaterials and ObjectivesFor these activities, you will need:Little Golden Guide to Mammals, Mammals of Texas, andKids'Wildlife BookMammal skulls, bones, and teethTape MeasureA Key to Urban Mammal SkullsMammal Hides"Dilly of a 'Dillo" activity adapted from Project WILDGiant Armadillo and Grid TransparencyCarpenter's Chalk Line and ChalkIn this segment, students will learn:-Body structure and parts of mammalsDifferences between a predator skull and a prey animal
skull- Identification of different mammal skulls, bones andfur-Measurement skills needed to compare and contrast mammalsizes and proportionWhat to do:1. Examination: Look at and handle the hides, skulls, teeth, andbones from the trunk. What characteristics do these samples have in
common? What differences do they display?
2. Diet: Look at the teeth on each skull. Can you tell whichmammals eat meat (carnivores)? Which eat plants (herbivores)?

3. Identify: Use the skull key to key out the mammal skulls. Whichskull belongs to which urban mammal?4. Research about size and structure: Read through The Kids'Wildlife Book , The Little Golden Guide to Mammals, The Mammalsof Texas and Introducing Mammals to Young Naturalists for moreinteresting facts on body structure and characteristics of mammals.What might allow some mammals to live in the city and others toavoid the urban areas?6. "Dilly of a Dillo": The class can create a life-size prehistoric giantarmadillo based on the Aquatic WILD activity "Whale of a Tail".Discuss the structure and size of the Ice-Age mammal and thechallenges and needs of such a large animal compared to the modernarmadillo and ourselves.
293

A Key to Urban Mammal Skulls
1- a. Large skull, over than 20cm: go to step 2b. Medium skull, 10-19cm: go to step 3c. Small skull, 3 -9cm: go to step 7d. Tiny skull, less than 3 cm: go to step 9
2- a. No canine teeth: whitetail deerb. long canine teeth: coyote
3- a. canine teeth: go to step 4b. no canines or incisors: armadillo
4- a. Molar row longer than 3.5cm: go to step 5b. Molar row 2-3cm: go to step 6
5- a. 5 incisors, 6-7 cheek teeth: opossumb. 3 incisors, 6 cheek teeth,braincase narrows toward the back: raccoon
6- a. length of canine 3cm ,inter orbital (eye socket) width 3cm: bobcatb. length of canine 1cm,inter orbital width 2.5cm: domestic cat
7- a. canine teeth: go to step 8b. no canine teeth: rabbit
8- a. length of skull longer than 7cm: skunk
b. length of skull less than 7cm squirrel
9- a. skull chunky, 1 or 2 incisors on each side separatedin front of skull by a distinct notch: bat
b. skull 2.5 cm long, incisors not notchedor grooved: house mouse
2E4

How To Use the Skull Key
The identification of a mammal skull or jaw is made with the help of a "key".A key is a selection of features arranged in a sequence of alternatives, fromwhich a choice must be made at each step of the sequence. By followingthrough the series of choices correctly, you are guided to an identification.The key is arranged by a series of numbered steps, and at each step, two ormore contrasting features are described, each indicated by a, b, c, or d. At moststeps only two choices are offered.The key uses a minimum of technical terms. All terms are listed in theglossary. Most measurements are only approximations. The measurementsare given in centimeters (2.5cm equals 1 inch). All measurements are takenwith the skull or jaw in a position such that the molar or cheek teeth are in anearly horizontal position.
Glossary of Terms:
Anterior
Canine
Cheek Teeth
Cranium
Incisor
In terorbital width
- toward the front of the skull or lower jaw bone.
one of the four teeth in the front corners of themouth. Canine teeth are usually large and pointedin meat-eating species, but may be small, or evenabsent, in plant eaters. They are the first (the mostanterior) teeth in the maxilla, or upper jaw bone.In humans, they are sometimes called 'eye-teeth'because they are located just below the eyes.
-Teeth rooted in the maxilla (upper jawbone), behind the canines, along the sides ofthe mouth. They include both premolarsand molars, and may have from 1 to 5 roots,depending on their size. In the lower jaw allteeth behind canines (or incisors, if caninesare absent) are also cheek teeth.
- the skull without the lower jaws.
- tooth in the front of the mouth, between the canines. Incisors of the upper jaw grow from thepremaxilla; all other upper teeth grow from themaxilla.
Distance between the upper edges of the orbits (eyesockets), measured across the top of the skull.
295A 87

Jaw - the lower jaw, or mandible; it is formed of the twodentary bones, one on each side.
Length of jaw
Length of skull
Maxilla
- greatest length of the lower jaw, measured fromthe front of the incisors to the most posterior pointof the jaw, either at the angle of the jaw or at thecondyle (movable joint where the jaw meets theskull).
- greatest length of the lower jaw, measured fromthe front of the incisors or from the most anteriorpart of the premaxilla, or nasals (which ever is mostanterior), to the most posterior part of the skull.
- bone forming major portion of the upper jaw oneach side, and supporting the upper canines and thecheek teeth.
Nasal bones - from the upper surface of the rostrum, ormuzzle, lying above the nasal openings.
Orbit - the eye socket. The size of the orbit can bedetermined by measuring its diameter, from rim torim. The length of the orbit is its diameter fromront to rear.
Posterior - toward the back, or rear, of the skull or lower jaw.
Premaxill a - forms the most anterior part of the skull, the fronttip of the upper jaw, in front of the maxilla.Supports the incisor teeth, curves upwards towardthe nasal bones.
For more information: The Mammals of Texas,Skulls Unlimited, American Head Hunter, Moscow Trading Co., R&R
2k)

Cleaning Skulls
Some people may wish to order cleaned skulls from companies which deal inthis trade. But for those who want to clean skulls which have been found,especially if the skulls are not broken and still have most of their teeth thefollowing will help with the process.
If the skull or jaw bone is nearly stripped of flesh by insects when it is found,soaking in plain water for 24 hours and a simple brushing, with an oldtoothbrush, soap and running water, may be enough to clean it. Be sure allsoft tissue is removed from the brain cavity and the nasal passages beforeallowing the scrubbed skull to dry.
If hair and meat are still attached to the skull, they should be removed. Inmost cases this is easily accomplished by cooking the skull. If it is a smallskull, it can be dropped into boiling water for a few minutes; usually fiveminutes is enough. Then remove the skull from the boiling water (usingforceps or tongs), hold it under cool running water, and pull off any bits ofloose tissue with forceps, fingers. or whatever seems to work best. An oldtoothbrush is very useful here too.
Larger skulls should not be dropped into boiling water, since the suddenchange in temperature may cause large teeth to split. They can be placed incool water in a large pan, can or bucket to which a bit of detergent has beenadded to cut the grease. Place these on the stove or hot plate to warm orsimmer-- no warmer. This should not be done in the kitchen -- the garage oroutside is better. After several hours, or overnight, or even several days if theskull is very large, the soft tissue can be easily removed from. the skull bones.A little trimming by hand under running water, and some brushing with asmall brush will produce a nice cleaned skull.
Cleaned skulls can be left in the sun for a few days to dry and bleach a bit.They can also be soaked, for a few minutes only, in a solution of hydrogenperoxide (1/2 cup per gallon of water) to whiten them. After a brief soaking,allow the skull to dry without rinsing. Commercial bleaches should be usedonly as a very dilute solution with water since they tend to cause the bones tobe brittle and leave a crusty sediment.
Skulls can also be cleaned by allowing them to rot in water, without heatingor cooking. But this is a very smelly process. The results are excellent butallow enough time for all the soft tissue to be rotted away. Avoid letting fliesget to the soft tissue of a fresh skull. They may lay eggs on the flesh, whichquickly develop into maggots, and the maggots will clean the skull of tissue.However, they also release materials which may stain or discolor theunderlying bone.

2- MAMMAL SIGNBackground: One of the best ways to determine where animalshave been is to look for their tracks and signs that are left behind.Tracks can tell you where the mammal feeds and rests, their travelroutes, and how fast they were traveling. Tracks can also tell youhow many animals live in an area at a given time of year. Some ofthe signs left behind are tree rubs, scat (droppings), antlers, brokenshells and seeds, and bones.For more information: Take Along Guide to Tracksand Scat,. Introducing Mammals To Young Naturalists ,The Kids' Wildlife Book, and Project WILD "Tracks!"activity
Materials and ObjectivesFor these activities, you will need:Take Along Guide to Tracks and ScatThe Kids' Wildlife GuideTrack ReplicasScat ReplicasCoyote and Deer legBobcat footRaccoon FootProject WILD "Tracks!" activityIn this segment, students will learn:-What signs indicate the presence of mammalsIdentify each urban mammals' sign and trackDetermine why mammals leave some of the signs they
do-Size and shape of urban mammals tracksStructure of urban mammals feet
What to do:1. Look at the legs and feet and track samples. Which one camefrom which mammal? How are hoofs different from claws?2. Plaster tracks: Follow the instructions for the Project WILD activity"Tracks!" to create plaster tracks.3. Comparisons: Draw or find pictures of other wildlife that lives in
your area. Compare mammal tracks to those of other animals.4. Look at the difference between the various mammal scat. How do
you tell a carnivore or omnivore's scat from an herbivore's?5. Reasons for sign: Why do deer rub trees? Why might coyote scat
change in consistency upon the season?
293

6. Hunt for sign: Next time you are out for a hike, look for animalsign. If it's something you can take a picture of or carry back to youclassroom, share it with the rest of your class. See if you can identifythe animal that left the sign and what it might have been doing atthe time. (R emember: In some places, like national parks, it isillegal to remove natural objects like deer antlers.)
299
A93.

3- MAMMAL SURVIVALBackground: In nature, there are no good or bad animals. There arethose animals which kill to eat (predators) and those which are killedand eaten (prey). When a coyote chases, catches, kills and eats the
rabbit, it is not being cruel. It is only meeting its physical need forfood. Its meal could also be a mouse, rat or other small creature ifone of them had been closer or easier to catch. Some animals haveadapted to their surroundings and nature by being night creatures(nocturnal) to avoid being prey. While other mammals havedeveloped sounds to communicate with each other to warn of dangeror intimidate their enemy.For more information: Night Animals Zoobook, BatsZoobook, Introducing Mammals to Young Naturalists and
The Kids' Wildlife Book
Materials and ObjectivesFor these activities, you will need:Mammal skullsSound Safari cassette tape (available in early 1997)animal callsProject WILD "Quick Frozen Critters" activityOBIS activities: "Sound Off", "Silent Stalking", and"Invent an Animal"Night Animals ZoobookBats ZoobookIn this segment, students Nv i 1 1 learn:-Mammal adaptations for survival-Nocturnal vs. diurnal vs. crepuscular animals-Predator/ Prey relationships-Sounds and calls of some urban mammals-What the different animal sounds mean-How to make animal soundsWhat to do:1. Observation: Compare the skulls to discover which mammal is a
nocturnal animal. Which skulls are from nocturnal mammals?Which are diurnal? Which are both diurnal and nocturnal or
crepuscular? (see "Night Animals" Zoobook)
2. Listening and Identifying: Use your sense of hearing while
carefully listening to the Sound Safari cassette tape. Which animals
make which sounds? Why do animals make sounds? (see references
above)3. Imitation: Try to make the animal call using the provided calls. If
you have a park or wooded area near by, try calling in predators to
,29,./ 300

your prey sounds. When will a squirrel make the barking sound?When will the doe bleat?4. Adaptation: Do the Project WILD activity, "Quick Frozen Critters" orthe night time OBIS activities "Sound Off" and "Silent Stalking". Howdifficult is the life of a nocturnal animal? Can people adapt? Arehumans a better predator or prey animal?
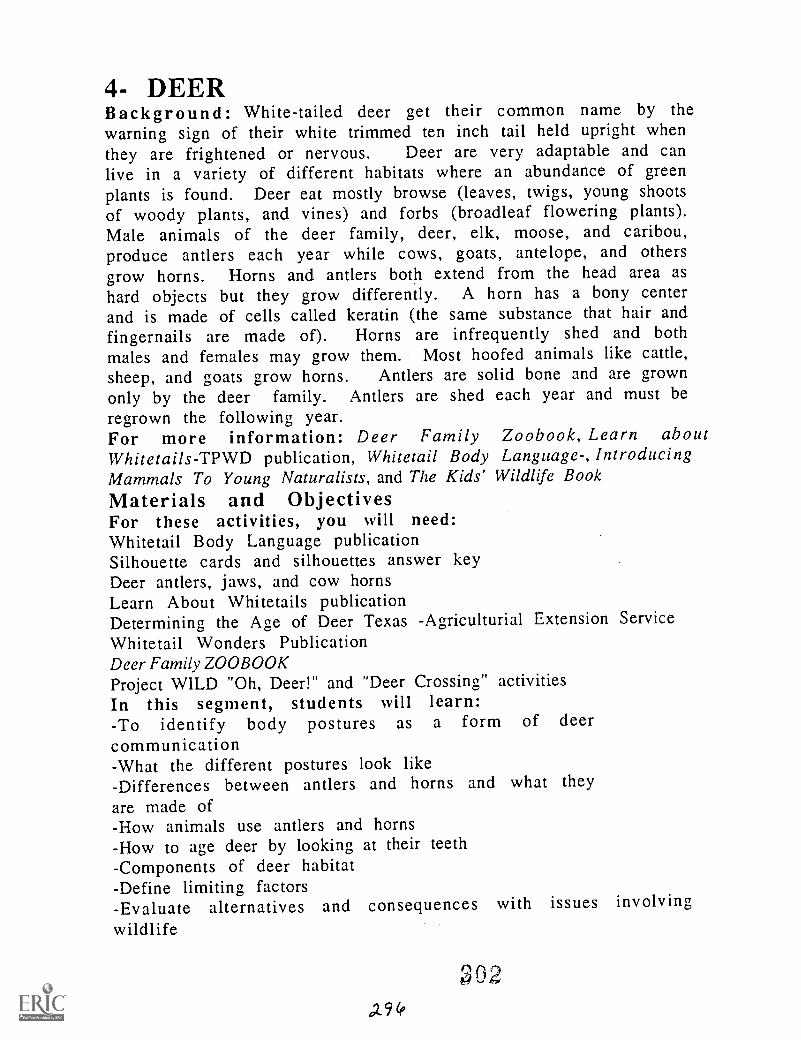
4- DEERBackground: White-tailed deer get their common name by thewarning sign of their white trimmed ten inch tail held upright whenthey are frightened or nervous. Deer are very adaptable and canlive in a variety of different habitats where an abundance of greenplants is found. Deer eat mostly browse (leaves, twigs, young shootsof woody plants, and vines) and forbs (broadleaf flowering plants).Male animals of the deer family, deer, elk, moose, and caribou,produce antlers each year while cows, goats, antelope, and othersgrow horns. Horns and antlers both extend from the head area ashard objects but they grow differently. A horn has a bony centerand is made of cells called keratin (the same substance that hair andfingernails are made of). Horns are infrequently shed and bothmales and females may grow them. Most hoofed animals like cattle,sheep, and goats grow horns. Antlers are solid bone and are grownonly by the deer family. Antlers are shed each year and must beregrown the following year.For more information: Deer Family Zoobook, Learn aboutWhitetails-TPWD publication, Whitetail Body Language-, IntroducingMammals To Young Naturalists, and The Kids' Wildlife Book
Materials and ObjectivesFor these activities, you will need:Whitetail Body Language publicationSilhouette cards and silhouettes answer keyDeer antlers, jaws, and cow hornsLearn About Whitetails publicationDetermining the Age of Deer Texas -Agriculturial Extension ServiceWhitetail Wonders PublicationDeer Family ZOOBOOKProject WILD "Oh, Deer!" and "Deer Crossing" activitiesIn this segment, students will learn:To identify body postures as a form of deer
communicationWhat the different postures look likeDifferences between antlers and horns and what they
are made ofHow animals use antlers and hornsHow to age deer by looking at their teeth
-Components of deer habitatDefine limiting factors
-Evaluate alternatives and consequences with issues involving
wildlife
X02A94,

What to do:1. Using body language: Look around the room and describe thebody language of others around you. Have students use their bodylanguage to convey a message to another student.2. Matching: Match the deer silhouettes with the body languagedescription. Then check yourself against the answer key and read thefull description of the postures in the "Whitetail Body Language"publication. Why and when will animals use body language?3. Reasons for body language: Act out or discuss situations in whichdeer or other mammals need to use the various postures.4. Identification: Identify what animal each horn or antler camefrom. For what purposes do animals use their antlers and horns?(use references stated above)5. Aging animals: You can age a bighorn sheep by counting thenumber of rings on its horn. Can you age a deer by counting itspOints? Why or why not? Use the Learn about Whitetails publication"How to Age Deer" guide. How can you age a deer?6. Aging Deer: Use the jawbones of the deer with the "How to AgeDeer Guide". How old were the deer? How do the jawbones and teethchange with age?7. Compatibility: Do the Project WILD activities "Oh, Deer!" and "DeerCrossing". What will the future bring to the urban deer? Can humansand deer co-habitat?
303
d97

5- HIDESBackground: All mammals have true hair. Their skin or hideprovides protection from the weather, (heat, cold, water, etc.) andthis layer contains many specialized cells and glands including sweat,scent, fat, and hair. Hair may help the animal feel, like the whiskers
on a cat or they may act as as camouflage to help the mammal blendinto the surroundings like the spots on a new fawn. Humans haveused animal skins for their own protection against the weather andfor utensils and tools for thousands of years.For more information: Introducing Mammals to Young
Naturalists , Project WILD "Make A Coat!" and "What You Wear IsWhat They Were" activities, Fur Bearers of Texas and The Kids'Wildlife Book
Materials and ObjectivesFor these activities, you will need:Hides and fursHistoric Uses of Deer ListProject WILD activities-"Make A COAT!" and"What You Wear Is WhatThey Were"Moccasin patternThe Kids' Wildlife Book "Pouch Pattern" p. 22
In this segment, students will learn:Structure of mammal hide and hairTo identify furs and skins of different mammals
- Present and historical/cultural uses of mammal hides and
other body parts
WHAT TO DO:1. Identify: Which skin or hide belongs to which
mammal?2. Uses for mammal skins: Have students drape the coyote skin and
deer hide over their bodies. Compare the difference betweencotton/polyester clothing to the coats made of the animal skin. What
are some uses, past, and present, of mammal hides? Are parts of ahide better for some uses than others? (use references listed above
for more Native American uses of mammals and the hides).3. "Make A Coat!", "Make a Moccasin", "Make a Pouch": Use the ProjectWILD activity, Moccasin pattern and The Kids' Wildlife Book pouch
pattern to make clothing and tools. You can fashion them out of
brown packaging paper or paper bags. To soften the paper and make
Al

it look like leather, dampen and crinkle it up, then spread it out todry for a while.4. Renewable or not? Use Project WILD activity "What You Wear isWhat They Were" to learn about natural resources and renewable vs.nonrenewable resources.
305
0/99
6- URBAN NATURE SEARCHBackground: Wildlife is not just the large animals like cougars,mountain lions, and bears. Wildlife includes all animals that have notbeen domesticated by people. Domesticated animals are those whichhave been tamed, made captive and bred for special purposes. Farmanimals and pets are considered to be domesticated animals. Wildanimals are all the rest. Wildlife is important in urban areas fornumerous reasons. People can understand themselves by observingand sharing space with wildlife. Animals can also be an indicator ofthe health of what is occurring in our environment. The natural lawsthat influence wildlife deal with the animals habitat- food, water,cover, and space. Animals that do not find an appropriate habitatenvironment will either starve, be preyed upon, be unable to nurtureyoung or progress to a better environment.For more information: Texas Parks & Wildlife "Wildscapes"Packet, Peterson's First Guide to Urban Wildlife, National 4-HWildlife Project- "Urban and Backyard Wildlife" and The Kids'Wildlife BookMaterials and ObjectivesFor these activities, you will need:Peterson's First Guide to Urban WildlifeTexas Parks & Wildlife Department's WildscapesinformationProject WILD "Urban Nature Search" and "Microtrek Treasure Hunt"activities4-H Wildlife Projects "Urban and Backyard Wildlife" and "WildlifeObservations""Project WILD "Wildwork" activityIn this segment, students will learn:Observation skills for recognizing wildlife
-To identify forms of wildlife other than urban mammals-Each environment has characteristic life forms-Humans and wildlife share environmentsHow students can help the wildlife in their environmentAbout careers in Wildlife Management
What to do:1. Treasure Hunt!: Follow the Project WILD activity, "Microtrek
Treasure Hunt". How can "evidence" be used to interpret
environments?2. Classify: Make a questionnaire/survey for the Project WILD"Urban Nature Search" activity. The survey might include topicsrelating to: looking for evidence of predator/prey relationships,
3 ov

attempting to determine which animal is the predator or prey,looking for evidence of a food chain, or tracing water's path in anarea. What types of wildlife are found around the school? Yourhome?3. List: From the previous activities make a chart describing what youto do to keep these forms of wildlife healthy or encourage more wildlifeto come to your environment. Where would these animals find food?Shelter? Water?4. Take Action! : Using TPWD wildscapes information add a source offood, water or cover for your urban Wildlife.4. Careers: Use the Project WILD activity "Wild Work" to explorefuture employment options in the field of wildlife. What trainingand qualifications are necessary to have a job working with animalsand wildlife? Contact the personnel offfice of the Texas Parks andWildlife Department. (See resources page for addresses and furtherinformation).
307
30/

Dina ArmstrongMathematics
Central Middle School, Galveston ISD
University of Texas Medical BranchPublic Health, GalvestonDr. Todd Miller, Mentor
308

AV AVAVAV AY AV AV AV AV Aarikir AV Alf AV AVAV AV AV AV Al
Dina F. ArmstrongAVAVAVAVAVAVAVAVSCHOOL DISTRICT: Galveston Independent School DistrictSCHOOL: Central Middle SchoolSUBJECT: MathematicsINTERNSHIP LOCATION: University of Texas Medical Branch at Galveston
ABSTRACT
The summer internship that I participated in was housed in thePreventive Medicine and Community Health Department. Thisdepartment enables scientists to apply theories and methods of thesocial and behavior sciences to the study of factors related to healthpromotion, risk of illness and the delivery of health services. I hadseveral mentors with whom I worked with for a period of two weekseach. This put me in a self-study mode with plenty of help from allmentors.
The first area of study was on Flaws and Fallacies in StatisticalThinking. Students will investigate ways that data can bemisrepresented through graphs and percent. The second area ofstudy was devoted to the methods of clinical research. Students willconduct an experiment using similar methods of a clinical researcher.The third area of study was on the measures of risk. Students will polla group of subjects on a particular risk factor questioniare andcompute the absolute risk, relative risk, attributable risk andattributable risk percent on this group of subjects.
309

Curriculum Implementation PlanOBJECTIVE; TLW:
I. Develop critical thinking skills2. Learn sequencing ant :rder :ng3. identify the three measures of central tendencies.4. Explore two ways for finding mean of a set of data5. identify the measures of dispersion6. identify the measures of relationships between two or morevariables.
7. Conduct a rudimentary experiment using statistics8. Promote social growth9. improve writing skills
MATERIALS
1. Graph paper2. scales3. yard sticks4. special forms (provided in plan)5. cartoons on percent misrepresentation (provided in plan)
PROCEDURES: Students viii enhance social skills by performingtales in groups.
ACTIVITIES: conduct survey on cafeteria food preferencs.
Make graphs to show results:1. Each group discuss his graph2. Lecture of JTPA experiment3. Practice worksheet4. Measure classmates weight and height5. Make a scatter diagram6. Make a frenquency distribution table with intervals7. Find the mean of raw and grouped data8. Find the measure of dispersion (range)9. Calculate Pearson r10. Write an article on the results of statistical data
BEST COPYAVAILABLEa, I0

ZIE
TIC

Flaws and Fallacies
Statistics is a set of methods used
to gather, organize, present and
analyze numerical facts. However, it
is sometimes difficult to make sense of
massive data. This difficulty is the
precise reason that graphs and charts
are so often used to convey
information. Sometimes graphs are
employed to mislead the reader. This
can be accomplished by manipulation of
the vertical and horizontal axes of a
graph. Through this manipulation, one
can convey almost any desired
impression.
313
30
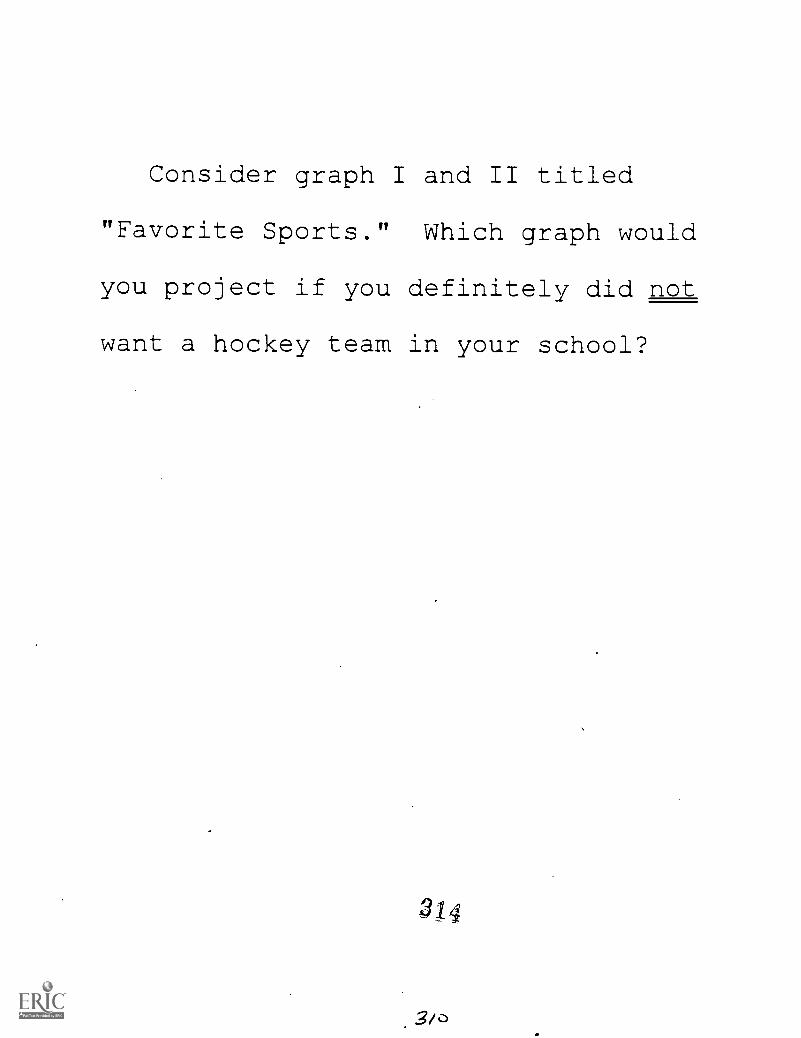
Consider graph I and II titled
"Favorite Sports." Which graph would
you project if you definitely did not
want a hockey team in your school?
314
.3/0

girlam
jeind!uuliv

The Manipulative Axis
Favorite Sports
10
Tara Bs* NM Foo PiSOW
Favorite Sports
Taft aics100 Foote.800,1

0
The Manipulative Axis
Favorite Drinks
Orgy,0drice
Favorite Drinks
SIVNbany
....,
05
50
45
40
35
33
Z20
15
10
5
n
Cob OrrisDdriat
318

225
Type of Books
75
1
o I
Romance Science FictionType of Books

250
Type of Books
200
1 150
o
4; 100
0
Romance Science FictionType of Books

230
210
Type of Books
190
.15
170
150
130
PAYstery Romance Science FictionType of Books
3213/7

,V7aais and ,graltacies
322

Fla
ws
and
Fal
laci
es
Percent, as a statistical
measure,
has been used
more often or
more effectively, or in
a wider
variety of ways to
prop up
wobbly arguments for
years.
You can improve
or worsen
miy situation on paper
as long
as there are numbers around
to
be converted into
percent.
Some decades ago Johns Hopkins
University began admitting women
to the university.
The report
came out that 33 1/3% of the
women enrolled had married a
faculty member. The story was
not as impressive when it was
revealed that only three women
were admitted and only one married
4cu /-/
rl1E
m 4
er.
323

4p
746 /21.34.Ie/ -7°0,7eic
Ls-)rcz.7fr.,///fr-ssl AAiv; r i
,strie46

MaIe =30 Female=33PG 2
Weight Height
Name: Weight, Height, & Gender of JPTA
Gender Weight Height Gender
N=63
138 65 260 77 M
130 61 F 130 68 M
145 67 F 170 75 M
142 67 M 159 69 M
152 68 F 140 68 M
136 67 M 140 68 M
179 63 F 125 60 M
130 67 F 175 69 M
180 65 F 149 69 M
154 64 F 180 70 M
135 66 F 132 67 M
190 71 M 160 67 F
175 72 M 135 61 F
110 63 F 163 67 F
135 71 M 155 67 F
125 62...
F 140 60 F
140 65 M 250 68 M
185 70 M 136 68 F
120 62 F 135 64 F
139 63 F 135 67 F
155 69 M 132 64 F
181 72 M 120 68 M
240 69 F 212 73 M
160 65 F 220 71 M
153 - 71 M 185 65 F
180 69 F 130 67 F
250 72 M 117 66 F
145 64 M 165 66 M
112 61 F 127 60 F
326

Male=30 Female=33PG 2
Name: Weight, Height, & Gender of PTA N=63
Weight Height Gender Weight Height Gender
110 62 F 140 66 F210 70 F 195 76 M280 76 M
Mw = 158.7
Mh= 67.1
327

Wei
ght &
Hei
ght o
f JT
PA
Pro
gram
280
260
-\ -
240
220
200
180
160
140
120
100 60
6162
6364
6566
6768
6970
7172
7374
7576
7778
7980
328
329

Fre
quen
cy D
istr
ibut
ion
of J
TP
A P
rogr
am
110-
122
123-
135
136-
148
149-
161
162-
174
175-
187
188-
200
201-
213
214-
226
over
226
330
331

\ilales=30 Females=33
Intervals Tally
Name: Weight of JPTA
f Cumf Cumf0/
110-122
123-135
136-148
149-161
162-174
175-187
188-200
210-213
wt over 213
6 6
r71.4 71-4 15 21
11 ihL
9
3
41
44
77-s 1/11 9 53
/I 2 55
/1
/
2 57
6 63
9
33.3
50.7
65.1
69.8
84
37.3
90.4
100
qq23 3/

Males= Females=
Intervals Median
Name: Mean of Weights
f fx
110-122 116 6 696123-135 129 15 1935136-148 142 11 1562149-161 155 9 1395162-174 168 3 504175-187 181 9
. 1629188-200 194 2 388201-213 207 2 414Qugr 213(214-280) 247 6 1482
Efx=10,005
m= 10,005
63
.
, Mw=158.8
,2Znr
..
33?-

Males-30 Females-33 Name : Height of JTPA
Intervals Tally f Cumf Cumf%
60-627144 /1// 9 9 14.3
63-65Thq- /1)(1 i / 12 21 33.3
66-68 7*/ thi.l. 7/./4 /X i 21 42 66.6
69-71 7i-ti NI i / ( 13 55 87.3
72-74 /11/ 4 59 93.6
75-77 /fir 4 63 100
a
334333

Sample Space
Male= Female= 33Name: Weight, Height & Gender N-33
Weight Height Gender
138 65 F130 61
145 67
152 68
179 63
130 67
180 66
154 64
135 66
110 63
125 62
120 62
139 63
240 69
160 65
180 69
117 66
112 61
127 60
110 62
140 66
210 70
160 67
135 61
163 67
155 67
140 60
136 68
135 64
135 67
132 64
185 65 mh= 621,q130 67 Mw---- 142.5
335 335 --
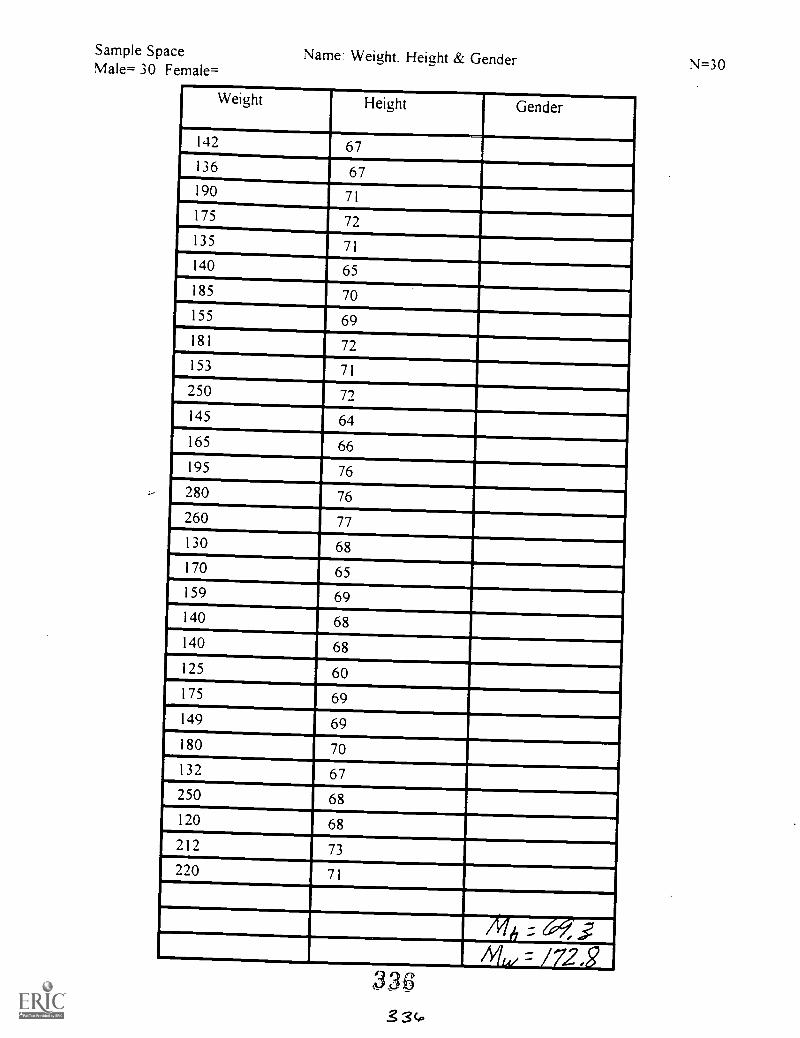
Sample SpaceMale= 30 Female=
Name: Weight, Height & Gender N=30
Weight Height Gender
142 67i
136 67190 71
175 72135 71
140 65
185 70155 69181 72
153 71
250 72
145 64
165 66
195 76
280 76
260 77
130 68
170 65
159 69
140 68
140 68
125 60
175 69
149 69
180 70
132 67
250 68
120 68
212 73
220 71
At/ = /72,g336
3cp

Fas0
/1r
The relationship between
two variables can be demonstrated by
two methods:
Correlation coefficient (visualized
by scatter gram) and Regression
analysis(provides
an equation that estimates the change in
a dependent variable per unit change in
an
independent variable.
Pearson r measures the degree of closeness
of the linear relationship between
two variables. It always lie between
1 and -1.
Positive values of
r indicate a tendency
of x and y to increase together.
Negative
values of r indicate large
values of x
are associated with small values of
y.
When low correlations
are found, one may be quick to conclude that there
is little
or no relationship between the two variables
under study.
However, the Pearson r shows
only the linear relationship between
two variables.
Our failure to find evidence
of a re] Lionship maybe because
of (1) The variables
are unrelated or (2)
The variables
are related in a non linear fashion.
338
337

Males- Females-
Intervals Median
Name: Mean of Heights
f fx
60-62 61 9 54963-65 64 12 76866-68 67 21 140769-71 70 13 91072-74 73 4 29275-77 76 4 304
fx=4230
Mh=4230
63
Mh=67.1
.-
OU
3 3.1e

PRACTICE WORK SHEET
DIRECTIONS Use the frequency distribution table to answer the following questions.
1. How many students weighed between 123 and 135 pounds ?
2. What percent of students surveyed weighed 174 pounds or less?
3. How many students surveyed weighed more than 200 pounds?
4. How many students surveyed weighed less than 200!
5. out of all students surveyed, what percent weighed more than 226 pounds?
6. How' many students wielghed more than 187 pounds?
7. Consider the following data :
6,8,7,6,6,5,8,8,9,3,3,3,8,9,7,8,9,6,6,7,4,6,6,and 7
Make a frequency table which consist of:
Intervals
Tally marks
Frequency
cummulative frequency
Cummulative frequency percent
349
339

Sample SpaceMale= Female=
Name: Weight, Height & Gender N=
Weight Height Gender
3413 V/

No. Males-
Intervals
No. Females-
Median
Name:
f fx
3 I 2-

No. Males- No. Females Name:
Intervals Tally f Cumf Cumf °,%
34s
3,13

Cross Sectional StudyWhich Would You Choose?
(D. Armstrong)
A young basketball player's main vein was cut while slam-dunking the ball on a glass
basketball goal. He lost an enormous amount of blood and was facing death. The only blood
available was taken from an HIV positive person. 'NOTE: Great strides have been taken in
discovering a vaccine to eradicate AIDS or at most improve the quality of life for AIDS patients.
Would you
A. Refuse the blood and die immediately?
B. Take the blood with a guarantee of two years of normal life and after two years, long suffering
before death?
3 ,/,1
344

N=110
basketball
A choices
52
16
a+c=68
JTPA Participants
B
10
32
d+b=42
a+b=62
c+d=48
62 Players48 nonplayers
Absolute Risk for Players = *=!1.83.9%
Absolute Risk for nonplayers = F5.7.4=4=33.3%
According to this study, 83.9% of the players polled would ratherdie immediately as opposed to 33.3% of non-players.
Relative Risk 2a+h c+0 .333
therefore, relative to non-players, players are 2.5 times aslikely to choose to die immediately based on this study.
Attribution Risk =
incidence among players -- incidence of non-playersAtt Risk = 83.9 - 33.3 = 50.6
Often attributable risk is expressed as attributive risk percent,where attributable risk is a percentage of the absolute risk ofplayers.
Att Risk of = Att Riskabs risk (players)" 1 00=839
60%
Therefore, 60% of the time, the difference in the incidence ofthe choices between those who were at risk and those who were notat risk maybe directly attributable to the percent of the riskfactor in this study.
345

rsS H144/
20 -2.42
24-2g
UZIe.s7-7)/'
2(U114 e le-7zhe,4,474-
0,---/-im 4 /
Oilerole/74.
IA er,4-/-er 22 Ole s

V41Kbad P JOCALEN
0
0U)
.c
LLco
AINELI' '
NW 4-..,
-.4,N pvi f. r.:ILv.t
tr,, nt RE ti
satiommonsw
7,377
St V IR 2Gidoecl Jo JegtUriN

I
0
93
55
50
45
40
The Manipulative Axis
Favorite Drinks
1Favorite Drinks
Strweberty
Ccla Strawberry

Kenneth BaratkoMathematics/Computer Science
Jones Sr. High School, Houston ISD
University of Texas Medical Branch,Galveston
Dr. William Buford, Mentor
349 BEST COPY AVAILABLE

Frances BeesonBiology/Physical Science
Dickinson High School, Dickinson
University of Texas Medical Branch,Galveston
Dr. Chandra Yallampalli, Mentor
350 BEST COPY AVAILABLE

BEESON 1
Curriculum Implementation Plan
TEACHER: Frances E. Beeson
SITE: University of Texas Medical Branch, Galveston, Texas 77555-1062
MENTOR: Dr. Chandra Yallampalli, D.V. M., Ph.D.
LAB PERSONNEL ASSISTING IN PROJECT:Dr. Yuan-Lin Dong, M.D., Ph.D.Dr. Li Fang, Ph.D.Dr. Pandu R.R. Gangula, Ph.D.Ms. Terri Chapa, Research Assistant
My summer research internship will help my teaching curriculum in thefollowing ways:
(1) students will be able to see scientific method in use as they viewabstracts in a content area of the Biology Curriculum, the endocrinesystem.
(2) students will use teamwork in the Cooperative Learning Lesson tolearn new endocrine vocabulary words.
(3) students will view a new medical research field by applying someresearch laboratory principles and techniques while conducting a labactivity.
(4) as a teacher, I will be better informed in the content area especially ashormones relate to pregnancy and high blood pressure. I will alsobe better motivated because of a recharged battery as a result ofthe stimulation this experience provided.
GOALS: To improve the quality of learning by:
(1) becoming personally more informed and updated on the endocrine system.
(2) developing a high interest lesson for students on endocrinology as it relatesto pregnancy.
(3) establishing a sense of teamwork by the use of a Cooperative LearningLesson to learn the unfamiliar endocrinology vocabulary by use of flashcards and games in a structured team setting.
(4) developing a complete lesson any teacher could use to assist and enhancetheir teaching of a unit on the endocrine system.
351

(5) rewriting an abstract at a lower reading level for the practice of the readingportion of the Biology Exit Exam.
(6) providing graphs or charts for interpretation as practice for the Biology Exit
Exam.
STRATEGIES:
(1) Learn endocrine vocabulary through teacher and student use of flash cards(list and definitions provided in CIP lesson).
(2) Reinforce vocabulary through the student use of a card game usingvocabulary words and definitions following a "rummy' format wheredefinitions is matched with vocabulary word for points.
(3) Use of Vocabulary Quiz (provided in CIP Lesson).
(4) Using teacher note information, lead students through a discussion ofendocrinology as it relates to pregnancy. Discuss interpretation of graphs as
they are used in this type of research. Discuss steps of Scientific Method as
it applies to research.
(5) Students will read and answer questions related to the EndocrinologyAbstract and graphs that are rewritten in the Biology Exit Exam format.
(6) Students will conduct an experiment using plants and hormones andfollowing the Scientific Method. data will be collected, charted andappropriate documentation will be written in correct form.

BEESON 3
Endocrinology of Pregnancy
What is endocrinology?The study of hormones and their physiology (effects on other organs).
This includes the study of the endocrine system, diagnosis and treatment ofdisorders of the glands of internal secretion (endocrine glands).
What is pregnancy?The condition of having a developing embryo or fetus in the body, after
union of an ovum and spermatozoan. In women, duration of the pregnancyfrom conception to delivery is about 266 days. During this time, manyhormonal changes occur in the mother and the developing fetus. Pregnancy ismarked by cessation of the menstrual cycle, nausea on arising in the morning(referred to as morning sickness), enlargement of the breast, pigmentation ofthe nipples and progressive enlargement of the abdomen.(1)
How does fertilization occur?1) In fertile women, the egg (ovum) is released (ovulation) 12-16
days after the onset of the previous menses (menstrual cycle).
2) The ovum must be fertilized (by the sperm from the male),within 24-48 hours if conception is to result. Of the 200 x 106sperm deposited during intercourse, only approximately 200reach the distal uterine tube awaiting an ovum to reach theampulla (flask shape organ).
3) 6 or 7 days later, when the conceptus is a blastocyst of 1000-10,000 cells, implantation in the uterus occurs.
4) After about 3 weeks of gestation, human chorionic gonadatropin(hCG) is detectable in maternal mother's serum.
5) Under the influence of hCG, the corpus luteum continues tosecrete steroid hormones in increasing quantities. Withouteffective implantation and subsequent hCG production, the corpusluteum survives for only about 14 days after ovulation. (Failurewould result in miscarriage).
6) Embryo - The derivities of the fertilized ovum that eventuallybecome the offspring. In humans, the developing organism isfrom the end of the second week after fertilization to the end of
35.3

the eighth week. Beginning with the 9th week until birth, it isthen called the fetus.
What are the symptoms of pregnancy?Symptoms include breast tenderness, fatigue, nausea, absence of
menstruation, softening of the uterus, and a sustained elevation of basal body
temperature. All of these symptoms are attributable to hormone production bythe corpus luteum and the developing placenta.
What are some of the major hormones of pregnancy?Progesterone is essential for maintenance of early pregnancy, and
withdrawal of progesterone leads to the termination of pregnancy.
The corpus luteum produce hormones which include: progesterone, 17-hydroxyprogesterone, and estradiol. After about the seventh week, theplacenta has increased production of hormones until the corpus luteum is no
longer essential. Another marker of corpus luteum function is the polypeptide
hormone relaxin; a dipeptide mass of 6000 (similar to insulin). Relaxin and
hCG become detectable at about the same time and continues to rise, reaching
a maximum concentration during the first trimester. Then the concentration
drops to approximately 20 percent and is constant for the remainder of the
pregnancy. Relaxin ripens the cervix and acts with progesterone to inhibit
uterine contractions.
How does the growth factors play a part in the pregnancy?The function of the placenta is to establish effective communication
between the mother and the developing fetus while, maintaining the immuneand generic integrity of both individuals. Initially, the placenta functionsautonomously however, the fetal endocrine system is sufficiently developed by
the end of the first trimester to influence placental function, and provide
hormone precursors to the placenta. From this time, it is useful to consider the
conceptus as the fetal-placental unit.
Seven days after fertilization when implantation begins, the trophoblast
invades the endometrium and two layers of developing placenta can be
demonstrated. The syncytiotrophoblast adjacent to the endometrium is derived
from the precursor cytotrophoblast and is a major source of hormoneproduction.
The decidua is the endometrium of pregnancy. It is capable ofsynthesizing a variety of polypeptide hormones including prolactin (mPRL)
and relaxin. Its source of prostaglandins during labor is certain.
4.3 4
3 (0o

BEESON 5
hCG human chorionic gonadatropin:1) first measurable product.of the placenta
2) consists of 237 amino acids
3) 30% carbohydrate by weight
4) In early weeks of pregnancy, concentration of hCG doubles every1.7 to 2 days. It provides an index of trophoblast function. Itsconcentration peaks at the tenth gestational week then declines inthird trimester.
5) Production of hCG makes pregnancy test possible (earliest test is8-14 days after ovulation).
6) The concentration of that found in the mother. However, there isevidence that fetal hCG is an important regulator of thedevelopment of the fetal adrenal and gonad during the firsttrimester.
7) Progesterone production: The placenta relies on maternalcholesterol as it substrate for progesterone production. 250-350mg. of progesterone is produced daily by the third trimester.The maternal progesterone rises progressively throughoutpregnancy and appears to be independent of factors that normallyregulate steroid synthesis and secretion. Progesterone is necessaryfor establishment and maintenance of pregnancy. Lack may causeinfertility and recurrent pregnancy loss.
8) Estrogen production by the placenta depends on circulatingprecursors from both fetal and maternal steroids.
(Over head transparency chart)
How does the mother adapt to pregnancy?The "fetal-placental unit" acts as a "parasite". It manipulates the
maternal "host" for its own gain but normally avoids imposing excessive stressthat would jeopardize the "host" and thus the "parasite" itself.
The prodigious production of polypeptide and steroid hormones by thefetal-placental unit directly or indirectly results in physiologic adaptations ofvirtually every maternal organ system.
355
-3(t

The mother's anterior pituitary gland hormones have little influence onpregnancy after implantation has occurred.
The thyroid gland becomes enlarged during the first trimester ofpregnancy. Uptake of iodine by the thyroid is increased. These changes aredue in large part to the increased renal clearance of iodine, which causes arelative iodine deficiency. Total serum thyroxine is elevated.
The maternal parathyroid gland must make some changes. The netcalcium requirement imposed by fetal skeletal development is estimated to beabout 30g by term. This is met by elevated serum levels of parathyroidhormone.
The nutritional demands of the fetus require alteration of maternalmetabolic homeostatic control, which results in both structural and functionchanges in the maternal pancreas. The size of the pancreatic inlets increase.Basal levels of insulin are lower or unchanged in early pregnancy but increaseduring the second trimester. Thereafter, pregnancy is a hyperinsulinemicstate. The increased concentration of insulin has been shown to be a result ofincreased secretion rather than decreased metabolic clearance.
The major role of insulin and glucagon is the control of concentrationsof nutrients, specifically glucose, amino acids, and fatty acids. Theseconcentrations are regulated during pregnancy primarily for fetal need, andpre- and postpartum feeding levels cause pancreatic responses that act tosupport the fetal economy. Insulin is not transported across the placenta butrather exerts its effects on transportable metabolites.
The normal result of pregnancy, then is to reduce glucose levelsmodestly but to reserve glucose for fetal needs while maternal energyrequirements are met increasingly by peripheral metabolism of fatty acids.These energy changes are beneficial to the fetus and innocuous to the motherwith adequate diet. Even modest fasting, however, causes ketosis, which ispotentially injurious to the fetus.
What hormonal changes are occurring to the fetus duringgestation?
All of the adult anterior pituitary hormones are extractable from thefetal adenohypophysis by 12 weeks. Hypothalamic hormones thyrotropin-releasing hormone (TRH), Gonadotropin-releasing hormone (GnRH) andsomatostallin are present by 8-10 weeks. The direct circulatory connectionbetween hypothalamus and pituitary develops later, with capillary initiallyvisible at about 16 weeks..
36-2-

BEESON 7
Development of the gonads and adrenals during the first trimesterappears to be directed by hCG rather than by fetal trophic hormones, and thedevelopment of the thyroid glands during the first trimester occursindependently of TSH production by the fetus.
During the second trimester, there is a marked increase in secretion ofall of the anterior pituitary hormones, which coincides with maturation of thehypophyseal portal system. Gonadotropin production also increases, with thefemale achieving higher FSH levels in both pituitary and serum than does themale. The fetal gonadotropins do not direct the events of early gonadaldevelopment but are essential for normal development of the differentiatedgonads and external genitalia.
Vasopressin and oxytocin (fetal posterior pituitary hormones, aredemonstrable by 12-18 weeks in the fetal posterior pituitary gland andcorrelate with the development of their sites of production, the supraoptic andparaventricular nuclei. The hormone content of the gland increases towardterm, with no evidence of feedback control. During labor, umbilical arteryoxytocin is higher than umbilical vein oxytocin. It has been suggested that thefetal posterior pituitary may contribute to the onset or maintenance of labor.
The fetal thyroid gland develops at about the same stage in developmentas the pituitary. By 12 weeks the thyroid is capable of iodine-concentratingactivity and thyroid hormone synthesis. During the second trimester, TRH,TSH, and free T4 all begin to rise. The maturation of feedback mechanisms issuggested by the subsequent plateau of TSH at about 20 fetal weeks. At birth,conversion of T4 and 13 becomes demonstrable. Very little placental transferof thyroid hormone occurs in physiologic concentrations. This preventsmaternal thyroid disorders from affecting the fetal compartment but alsoprevents effective therapy for fetal hypothyroidism through maternalsupplementation. The function of the fetal thyroid hormones appears crucial tosomatic growth for successful neonatal adaptation.
The fetal parathyroid gland is capable of synthesizing parathyroidhormone by the end of the first trimester. Because the placenta activelytransports calcium into the fetal compartment, the fetus remains relativelyhypercalcemic throughout gestation. This contributes to the suppression ofparathyroid hormone and fetal serum levels in the umbilical cord have beenreported to be low or undetectable. Fetal serum calcitonin levels are elevated,enhancing bone accretion.
357oL)
3622-

Fetal gonads, the testis, is a detectable structure by six fetal weeks. The
interstitial, or leydig cells, which synthesize fetal testosterone, are functional
at this same stage. The maximum production of testosterone coincides with
maximal production of hCG by the placenta; binding of hCG to fetal testes
with stimulation of testosterone release has been demonstrated. Other fetal
testicular products of importance are the reduced testosterone metabolite
dihydrotestosterone and muilerian duct inhibitory factor. Dihydrotestosterone
is responsible for development of female internal structures. Little is known
about fetal ovarian function.
How does the endocrine control parturition (labor)?In the last few weeks of a normal pregnancy, two processes signal
approaching labor. Uterine contractions become more frequent and the cervix
becomes softer and thinner. This process is known as effacement, or"ripening". The onset of labor is usually fairly abrupt with regularcontractions every 2-5 minutes, leading to delivery in less than 24 hours. The
key inciting event has eluded detection. The difficulty in identifying a single
initiating event in human labor suggest that there is more than one.
Progesterone causes hyperpolarization of the myometrium, decreasing
the amplitude of action potentials and preventing effective contractions. In
various experimental systems, progesterone decreases alpha-adrenergicreceptors, stimulates cAMP production, and inhibitis estrogen receptor
synthesis, promotes the storage of prostaglandin precursors in the decidua and
fetal membranes, and stabilizes the lysosomes containing prostaglandin-
synthesizing enzymes. Estrogen opposes progesterone in these actions and may
have an independent role in ripening the uterine cervix and promoting uterine
contractility. Thus the estrogen-progesterone ratio may be an important
parameter. It has shown that an increase in the estrogen-progesterone ratio
increases the number of myometrial gap junctions. This finding may explain
the coordinate, effective contractions that characterize true labor as opposed to
ineffective contractions of false labor.
Oxytocin infusion is commonly used to induce or augment labor. Both
maternal and fetal oxytocin levels increase spontaneously during labor. Data in
animals suggest that oxytocin's role in initiation of labor is due to increased
sensitivity of the uterus to oxytocin rather than increased plasma concentration
of the hormone.
Prostaglandin E2 will induce labor in most women in the thirdtrimester. Prostaglandins are almost certainly involved in the maintenance of
labor once it is established. They probably are important in initiating labor in
some circumstances. They probably are part of the "final common pathway"
a 53
34.q

BEESON 9
of labor. Prostaglandin synthetase inhibitors abolish premature labor but theirclinical usefulness has been restricted by their simultaneous effect of closingthe ductus arteriosus, which can lead to fetal pulmonary hypertension. (2)
How can pregnancy be prevented by hormones?Since the development of the oral contraceptive pill in 1951, the
development of hormonal methods has continued; doses of steroids have beenreduced and new oestrogens and progesterones have been introduced. Alongwith changes in the pill, the range of hormonal methods has been enlarged bylong-acting formulations such as implants which enable continuous delivery oflow doses of the drugs, thus avoiding peaks and troughs in circulating levels ofsteroids seen after oral pills. As a result, today's contraceptive hormonepreparations have a higher degree of safety while remaining extremelyeffective when directions on dosage are followed explicitly. (3)
There are two basic types of hormonal contraceptives. One of these is amicrocrystalline aqueous suspension of medroxyprogesterone acetate (Depro-Provera) by Upjohn,
The second is an oily solution of norethesterone enanthate (Nboristerat) bySchering A G
Both of these hormonal methods work by inhibiting the release of the ovum(ovulation)(4)
o r 9

FETAL ANDROGENSI(produced mains by fetal adrenal)
IDEHYDROEPIANDROSTERONESULFATE (DHEA SULFATE)
(converted by cental sulfatase)
I FREE HYDROEPIANDROSTERONE (DHEA)
(passes through enzymatic pathways aromatized by the placenta)
estrone estradiol
increases 50 fold during pregnancy
metabolize to3rd estrogen
ESTRIOL
increases approx. 1000 foldduring pregnancy
Measurements of estriol (serum or urinary) reflect fetal as well as placental
function, integrity of fetal circulation and metabolism. It is the best available
biochemical indicator of fetal well being. It can signal congenital
derangements or iatrogenic intervention.
36(p

BEESON 11
References
1. Dor land's Illustrated Medical Dictionary, Ed., 28, W.B. Saunders Co.,1994.
2. Greenspan, F.: Basic and Clinical Endocrinology, 3rd ed. Norwalk, CT;Appleton and Lang, 1991:543-566.
3. Von Hertzen, H. 1994. Hormonal Contraceptives for Women. In CurrentConcepts in Fertility Regulation and Production. C. Puri, Ed. WileyEastern Limited, New Age International Limited, New Delhi, 39-40.
4. Bialy, G., R. P. Blye. 1994. Role of Pharmacokinetics in the Developmentof Long-acting Contraceptive Drugs. In Current Concepts in FertilityRegulation and Production. C. Puri, Ed. Wiley Eastern Limited, New AgeInternational Limited, New Delhi, 43-46.
361
3(0 7

COOPERATIVE LEARNING VOCABULARY LESSON
DIRECTIONS FOR CARD GAME
TEACHER: Using 3 X 5 index cards, place the vocabulary word on one card and the
definition on a second card. The words and definitions may be duplicated(recommend on set per group of 4), cut apart and pasted from the list given.
It is helpful if each set is on a different color of card so the sets can be easily separated
if they should get mixed up. I like to laminate the cards and to have a minimum of one
set of cards for each four students in the class, if possible.
STUDENTS: Shuffle cards, deal cards.if 2 players 12 cardsif 3 players 8 cardsif 4 players 7 cards
Put remaining cards in a pile face down for "drawing". Place one card face up. theobject is to match the card with the definition (similar to Rummy)). You get 10 points for
each pair. The person with the greatest number of points wins. The person to the right
of the dealer begins.FOLLOW THIS PROCESS
(1) Either "draw" a card from the stack OR take the card or cards from the
discard stack. You may take more than one card in ORDER if it isavailable but you must play the LAST card you pick up.
(2) Put down any pairs that you have face up.
(3) Discard a card from your hand.
When you no longer have cards in your hand, you have 'gone out". If you you have
cards left in your hand when someone has "gone out", it cost you 5 points per card for
each of the remaining cards. Subtract that from your pair total for your score.
PAIRS SHOULD BE CHECKED TO BE SURE THEY ARE PAIRS BY A VOCABULARY
LIST.
9
36,s,
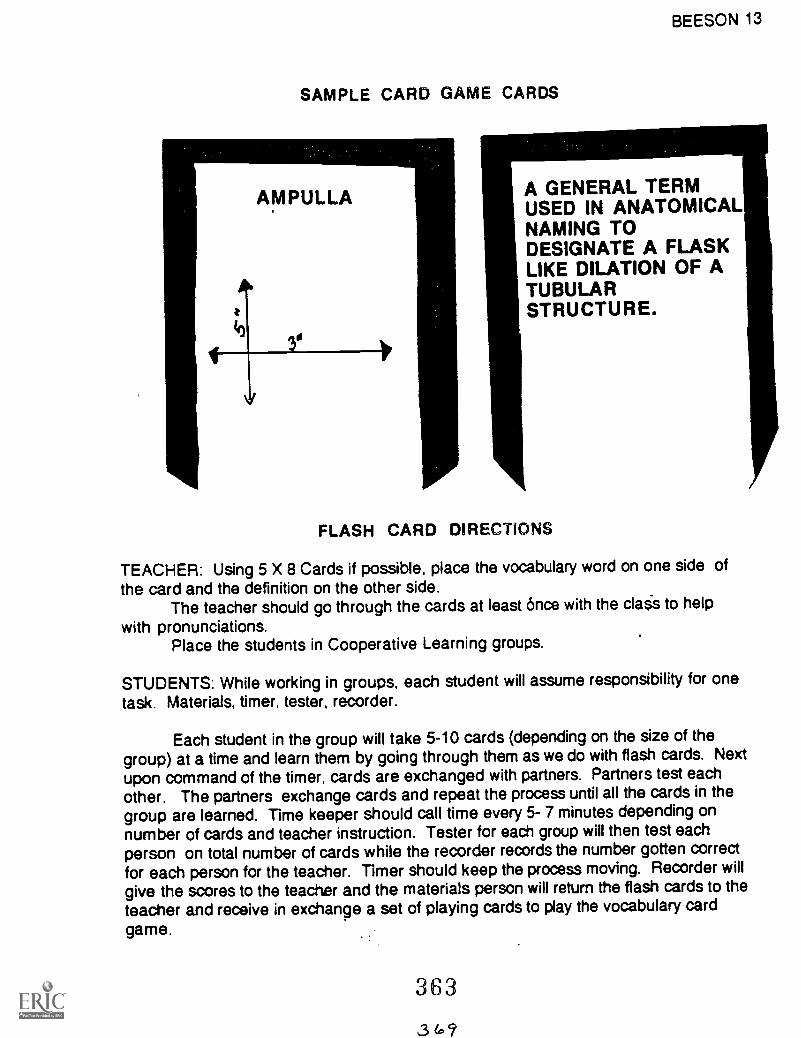
SAMPLE CARD GAME CARDS
BEESON 13
A GENERAL TERMUSED IN ANATOMICALNAMING TODESIGNATE A FLASKLIKE DILATION OF ATUBULARSTRUCTURE.
FLASH CARD DIRECTIONS
TEACHER: Using 5 X 8 Cards if possible, place the vocabulary word on one side ofthe card and the definition on the other side.
The teacher should go through the cards at least once with the clas to helpwith pronunciations.
Place the students in Cooperative Learning groups.
STUDENTS: While working in groups, each student will assume responsibility for one
task. Materials, timer, tester, recorder.
Each student in the group will take 5-10 cards (depending on the size of thegroup) at a time and learn them by going through them as we do with flash cards. Nextupon command of the timer, cards are exchanged with partners. Partners test eachother. The partners exchange cards and repeat the process until all the cards in thegroup are learned. Time keeper should call time every 5- 7 minutes depending onnumber of cards and teacher instruction. Tester for each group will then test eachperson on total number of cards while the recorder records the number gotten correctfor each person for the teacher. Timer should keep the process moving. Recorder willgive the scores to the teacher and the materials person will return the flash cards to theteacher and receive in exchange a set of playing cards to play the vocabulary card
game.
363
31.?

VOCABULARY
AMPULLA
A GENERAL TERMUSED IN ANATOMICALNAMING TODESIGNATE A FLASKLIKE DILATION OF ATUBULARSTRUCTURE.
AUTONOMOUSLY
PERTAINING TO: THESTATE OFFUNCTIONINGINDEPENDENTLY,WITHOUTEXTRANEOUSINFLUENCE
CONCEPTUS
THE SUM OF THEDERIVATIVES OF AFERTILIZEDOVUM(EGG) AT ANYSTAGE OFDEVELOPMENT FROMFERTILIZATION UNTILBIRTH, INCLUDINGEXTRAEMBRYOICMEMBRANES AS WELLAS THE EMBRYO ORFETUS.
BLASTOCYST
THE MAMMALIANCONCEPTUS IN THEPOST-MORULA STAGE- HAS FLUID FILLEDCAVITY WITH MORETHAN ONE GERMLAYER.
CORPUS LUTEUM
"YELLOW BODY" AYELLOW GLANDULARMASS IN THE OVARYFORMED BY ANOVARIAN FOLLICLETHAT HAS MATUREDAND DISCHARGED ITSOVUM. IF OVUM HASBEEN IMPREGNATED,IT INCREASES IN SIZEAND PERSISTS FORSEVERAL MONTHS. IFOVUM ISN'TIMPREGNATED, ITDEGENERATES ANDSHRINKS. ITPRODUCESPROGESTERONE.
DECIDUA
THE ENDOMETRIUMOF THE PREGNANTUTERUS, ALL OFWHICH THE DEEPESTLAYER IS SHED ATPARTURITION.
DISTAL
DISTANT, REMOTE,
364370
POINT OF REFERENCE
ENDOMETRIUM
THE INNER MUCOUSMEMBRANE OF THEUTERUS; THETHICKNESS ANDSTRUCTURE OFWHICH VARIES WITHTHE MENSTRUALCYCLE.
FERTILIZATION
THE ACT OFRENDERING GAMETESFERTILE OR CAPABLEOF FURTHERDEVELOPMENT.BEGINS WITHCONTACT BETWEEN ASPERMATOZOON ANDAN OVUM; LEADINGTO THEIR FUSION ANDRESTORES THEDIPLOID NUMBER OFCHROMOSOMES -BIPARENTALINHERITANCE ANDDETERMINATION OFSEX. LEADS TOFORMATION OFZYGOTE.
GESTATION
THE PERIOD OFDEVELOPMENT OFTHE YOUNG INVIVIPAROUS ANIMALS

FROM THE TIME OFFERTILIZATION OFTHE OVUM UNTILBIRTH.
HYPERTHYROIDISM
A CONDITION CAUSEDBY EXCESSIVEPRODUCTION OFIODINATED THYROIDHORMONES ANDMARKED BY GOITER,TACHYCARDIA,ATRIALFIBRILLATION,WIDENED PULSEPRESSURE,EXCESSIVE,SWEATING, WARMSMOOTH, MOISTSKIN, WEIGHT LOSSAND MUSCLEWEAKNESS.
HYPERTENSION
HIGH ARTERIALBLOOD PRESSURE140-200 mm HgSYSTOLIC AND 90DIASTOLIC. MAYHAVE NO KNOWNCAUSE - USUALLYASSOCIATED WITHOTHER DISEASES.
HYPOTHYROIDISM
DEFICIENCY OFTHYROID ACTIVITY.MOST COMMON IN
WOMEN.CHARACTERISTICS;LOW BASALMETABOLISM,FATIGUE LETHARGY,SENSITIVITY TOCOLD.
hCG
HUMAN CHORIONICGONADTROPIN
INHIBIT
TO RETARD, ARRESTOR RESTRAIN
MATERNAL
PERTAINING TO THEMOTHER
INTEGRITY
STATE OF BEINGUNIMPAIRED.SOUNDNESS,COMPLETENESS,WHOLE.
IMPLANTATION
THE ATTACHMENTAND EMBEDDING OFTHE FERTILIZEDOVUM IN THEUTERINE WALL.
365371
PARTURITION
PROCESS OF GIVINGBIRTH TO A CHILD
PRECURSOR
SOMETHING THATPRECEDES A SUB-STANCE FROM WHICHANOTHER, USUALLYMORE ACTIVE ORMATURE SUBSTANCEIS FORMED. A SIGNOR SYMPTOM THATHERALDS ANOTHER.
PRE-ECLAMPSIA
A COMPLICATION OFPREGNANCYCHARACTERIZED BYHYPERTENSION,EDEMA, AND/ORPROTEINURIA, WHENCONVULSIONS ANDCOMA AREASSOCIATED, IT ISCALLED ECLAMPSIA.
PROGRESSIVELY
ADVANCING, GOINGFORWARD; GOINGFROM BAD TO WORSE;INCREASING INSCOPE OR SEVERITY.
SERUM

THE CLEAR PORTIONOF ANY BODY FLUIDSUCH AS BLOOD.
SUBSTRATE
A SUBSTANCE UPONWHICH AN ENZYMEACTS. A SURFACEUPON WHICH ADIFFERENT MATERIALIS DEPOSITED ORADHERES SUCH AS ACOATING OR LAYER.
SYNCYTIOTROBLAST
THE OUTERSYNCYTIAL LAYER OFTHE TROPHOBLAST(BEGINNING OF THEEMBRYO)
372

BEESON 17
VOCABULARYAMPULLA
A GENERAL TERM USED IN ANATOMICAL NAMING TODESIGNATE A FLASK LIKE DILATION OF A TUBULARSTRUCTURE.
AUTONOMOUSLY
PERTAINING TO: THE STATE OF FUNCTIONINGINDEPENDENTLY, WITHOUT EXTRANEOUS INFLUENCE
CONCEPTUS
THE SUM OF THE DERIVATIVES OF A FERTILIZED OVUM(EGG)AT ANY STAGE OF DEVELOPMENT FROM FERTILIZATIONUNTIL BIRTH, INCLUDING EXTRAEMBRYOIC MEMBRANES ASWELL AS THE EMBRYO OR FETUS.
BLASTOCYST
THE MAMMALIAN CONCEPTUS IN THE POST-MORULA STAGE -HAS FLUID FILLED CAVITY WITH MORE THAN ONE GERMLAYER.
CORPUS LUTEUM
"YELLOW BODY" A YELLOW GLANDULAR MASS IN THE OVARYFORMED BY AN OVARIAN FOLLICLE THAT HAS MATURED ANDDISCHARGED ITS OVUM. IF OVUM HAS BEEN IMPREGNATED,IT INCREASES IN SIZE AND PERSISTS FOR SEVERAL MONTHS.IF OVUM ISN'T IMPREGNATED, IT DEGENERATES AND
367
373

SHRINKS. IT PRODUCES PROGESTERONE.
DECIDUA
THE ENDOMETRIUM OF THE PREGNANT UTERUS, ALL OFWHICH THE DEEPEST LAYER IS SHED AT PARTURITION.
DISTAL
DISTANT, REMOTE, FURTHER FROM ANY POINT OFREFERENCE
ENDOMETRIUM
THE INNER MUCOUS MEMBRANE OF THE UTERUS; THETHICKNESS AND STRUCTURE OF WHICH VARIES WITH THEMENSTRUAL CYCLE.
FERTILIZATION
THE ACT OF RENDERING GAMETES FERTILE OR CAPABLE OFFURTHER DEVELOPMENT. BEGINS WITH CONTACT BETWEENA SPERMATOZOON AND AN OVUM; LEADING TO THEIRFUSION AND RESTORES THE DIPLOID NUMBER OFCHROMOSOMES - BIPARENTAL INHERITANCE ANDDETERMINATION OF SEX. LEADS TO FORMATION OFZYGOTE.
GESTATION
THE PERIOD OF DEVELOPMENT OF THE YOUNG INVIVIPAROUS ANIMALS FROM THE TIME OF FERTILIZATION OFTHE OVUM UNTIL BIRTH.

BEESON 19
hCG
HUMAN CHORIONIC GONADTROPIN
HYPERTHYROIDISM
A CONDITION CAUSED BY EXCESSIVE PRODUCTION OFIODINATED THYROID HORMONES AND MARKED BY GOITER,TACHYCARDIA, ATRIAL FIBRILLATION, WIDENED PULSEPRESSURE, EXCESSIVE, SWEATING, WARM SMOOTH, MOISTSKIN, WEIGHT LOSS AND MUSCLE WEAKNESS.
HYPERTENSION
HIGH ARTERIAL BLOOD PRESSURE 140-200 mm Hg SYSTOLICAND 90 DIASTOLIC. MAY HAVE NO KNOWN CAUSE - USUALLYASSOCIATED WITH OTHER DISEASES.
HYPOTHYROIDISM
DEFICIENCY OF THYROID ACTIVITY. MOST COMMON INWOMEN. CHARACTERISTICS; LOW BASAL METABOLISM,FATIGUE LETHARGY, SENSITIVITY TO COLD.
INHIBIT
TO RETARD, ARREST OR RESTRAIN
INTEGRITY
STATE OF BEING UNIMPAIRED. SOUNDNESS,COMPLETENESS, WHOLE.
IMPLANTATION
3693 7.S

BEESON 20
THE ATTACHMENT AND EMBEDDING OF THE FERTILIZEDOVUM IN THE UTERINE WALL
MATERNAL
PERTAINING TO THE MOTHER
PARTURITION
PROCESS OF GIVING BIRTH TO A CHILD
PRECURSOR
SOMETHING THAT PRECEDES A SUB-STANCE FROM WHICH ANOTHER, USUALLY MORE ACTIVE ORMATURE SUBSTANCE IS FORMED. A SIGN OR SYMPTOMTHAT HERALDS ANOTHER.
PRE-ECLAMPSIA
A COMPLICATION OF PREGNANCY CHARACTERIZED BYHYPERTENSION, EDEMA, AND/OR PROTEINURIA, WHENCONVULSIONS AND COMA ARE ASSOCIATED, IT IS CALLEDECLAMPSIA
PROGRESSIVELY
ADVANCING, GOING FORWARD; GOING FROM BAD TOWORSE; INCREASING IN SCOPE OR SEVERITY.

BEESON 21
SERUM
THE CLEAR PORTION OF ANY BODY FLUID SUCH AS BLOOD.
SUBSTRATE
A SUBSTANCE UPON WHICH AN ENZYME ACTS. A SURFACEUPON WHICH A DIFFERENT MATERIAL IS DEPOSITED ORADHERES SUCH AS A COATING OR LAYER.
SYNCYTIOTROBLAST
THE OUTER SYNCYTIAL LAYER OF THE TROPHOBLAST(BEGINNING OF THE EMBRYO)

AM
PU
LLA
AU
TO
NO
K O
US
LYC
ON
CE
PT
US
BLA
ST
CY
ST
CO
RP
US
LUT
EU
N37
INT
EG
RIT
Y37
3
CO m rn 0) 0 z

GE
ST
AT
ION
I"-
HY
PE
R-
0T
HY
RO
IDIS
Mz
tl
HY
PE
RT
EN
SIO
NH
YP
O-
3"T
HY
RO
IDIS
N37
5

II\P
LAN
TA
TIO
NP
AR
TU
RIT
IOP
RE
CU
RS
OR
PR
EE
CLA
MP
SL
PR
OG
RE
SS
IVE
LY37
6M
. TE
RN
AL
377

SE
RU
MD
SU
BS
TR
TE
E__
<
SY
NC
YT
IO-
-(1)
TR
OB
LA S
Ta
aE
ND
OM
ET
RIU
NF
ER
TIL
E)
TIO
N37
9
co m m 0 z cn

ENDOCRINOLOGY VOCABULARY TESTDirections: Multiple Choice - select the best answer and place its letter on the
scantron sheet by the appropriate number.
1. A GENERAL TERM USED IN ANATOMICAL NAMING TO DESIGNATE A FLASKLIKE DILATION OF A TUBULAR STRUCTURE.A. AUTONOMOUSLY B. CORPUS LUTEUMC. AMPULLA D. ENDOMETRIUM
2. THE MAMMALIAN CONCEPTUS IN THE POST-MORULA STAGE HAS FLUIDFILLED CAVITY WITH MORE THAN ONE GERM LAYER.A. BLASTOCYST B. AMPULLAC. ENDOMETRIUM D. CORPUS LUTEUM
3. THE SUM OF THE DERIVATIVES OF A FERTILIZED OVUM(EGG) AT ANY STAGEOF DEVELOPMENT FROM FERTILIZATION UNTIL BIRTH, INCLUDINGEXTRAEMBRYOIC MEMBRANES AS WELL AS THE EMBRYO OR FETUS.A. FERTILIZATION B. PARTURITIONC. PRE-ECLAMPSIA D. CONCEPTUS
4. THE ENDOMETRIUM OF THE PREGNANT UTERUS, ALL OF WHICH THEDEEPEST LAYER IS SHED AT PARTURITION.A. GESTATION B. INHIBITC. DECIDUA D. MATERNAL
5. THE ACT OF RENDERING GAMETES FERTILE OR CAPABLE OF FURTHERDEVELOPMENT. BEGINS WITH CONTACT BETWEEN A SPERMATOZOON ANDAN OVUM; LEADING TO THEIR FUSION AND RESTORES THE DIPLOIDNUMBER OF CHROMOSOMES- BIPARENTAL INHERITANCE ANDDETERMINATION OF SEX. LEADS TO FORMATION OF ZYGOTE. .
A. FERTILIZATION B. CONCEPTUSC. PARTURITION D. SUBSTRATE
6. "YELLOW BODY" A YELLOW GLANDULAR MASS IN THE OVARY FORMED BYAN OVARIAN FOLLICLE THAT HAS MATURED AND DISCHARGED ITS OVUM.IF OVUM HAS BEEN IMPREGNATED, IT INCREASES IN SIZE AND PERSISTSFOR SEVERAL MONTHS. IF OVUM ISN'T IMPREGNATED, IT DEGENERATESAND SHRINKS. IT PRODUCES PROGESTERONE.A. ENDOMETRIUM B. CORPUS LUTEUMC. AMPULLA D. BLASTOCYST
7. THE INNER MUCOUS MEMBRANE OF THE UTERUS; THE THICKNESS ANDSTRUCTURE OF WHICH VARIES WITH THE MENSTRUAL CYCLE.A. AMPULLA B. AUTONOMOUSLYC. CORPUS LUTEUM D. ENDOMETRIUM
339

BEESON 27
page 2 Vocabulary Test8. DISTANT, REMOTE, FURTHER FROM ANY POINT OF REFERENCE
A. PRECURSOR B. PROGRESSIVELYC. DISTAL D. SYNCYTIOTROBLAST
9. THE OUTER SYNCYTIAL LAYER OF THE TROPHOBLAST (BEGINNING OF THEEMBRYO)A. PRECURSOR B. PROGRESSIVELYC. DISTAL D. SYNCYTIOTROBLAST
10. A SUBSTANCE UPON WHICH AN ENZYME ACTS. A SURFACE UPON WHICHA DIFFERENT MATERIAL IS DEPOSITED OR ADHERES SUCH AS A COATINGOR LAYER.A. PRE-ECLAMPSIA B. SUBSTRATEC. CONCEPTUS D. PARTURITION
11. A COMPLICATION OF PREGNANCY CHARACTERIZED BY HYPERTENSION,EDEMA, AND/OR PROTEINURIA.A. PRE-ECLAMPSIA B. SUBSTRATEC. CONCEPTUS D. PARTURITION
12. STATE OF BEING UNIMPAIRED. SOUNDNESS, COMPLETENESS, WHOLE.A. HYPOTHYROIDISM B. HYPERTENSIONC. INTEGRITY D. IMPLANTATION
13. HIGH ARTERIAL BLOOD PRESSURE 140-200 mm Hg SYSTOLIC AND 90DIASTOLIC. MAY HAVE NO KNOWN CAUSE-USUALLY ASSOCIATED WITHOTHER DISEASES.A. INTEGRITY B. HYPERTENSION .
C. HYPOTHYROIDISM D. IMPLANTATION
14. THE CLEAR PORTION OF ANY BODY FLUID SUCH AS BLOOD.A. PROGRESSIVELY B. PRECURSORC. SERUM D. SYNCYTIOTROBLAST
15. SOMETHING THAT PRECEDES A SUBSTANCE FROM WHICH ANOTHER,USUALLY MORE ACTIVE OR MATURE SUBSTANCE IS FORMED. A SIGN ORSYMPTOM THAT HERALDS ANOTHER.A. PROGRESSIVELY B. SYNCYTIOTROBLASTC. SERUM D. PRECURSOR
16. PERTAINING TO: THE STATE OF FUNCTIONING INDEPENDENTLY, WITHOUTEXTRANEOUS INFLUENCE.A. AUTONOMOUSLY B. AMPULLAC. CORPUS LUTEUM D. ENDOMETRIUM
381
3g3

BEESON 28
17. HUMAN CHORIONIC GONADTROPIN,A. INHIBIT B. DECIDUAC. hCG D. MATERNAL
18. TO RETARD, ARREST OR RESTRAINA. INHIBIT B. hCGC. DECIDUA D. MATERNAL
19. ADVANCING, GOING FORWARD; GOING FROM BAD TO WORSE; INCREASINGIN SCOPE OR SEVERITY.
A. SYNCYTIOTROBLAST B. SERUMC. PRECURSOR D. PROGRESSIVELY
20. A CONDITION CAUSED BY EXCESSIVE PRODUCTION OF IODINATEDTHYROID HORMONES AND MARKED BY GOITER, TACHYCARDIA, ATRIALFIBRILLATION, WIDENED PULSE PRESSURE, EXCESSIVE, SWEATING, WARMSMOOTH, MOIST SKIN WEIGHT LOSS AND MUSCLE WEAKNESS.A. INTEGRITY B. HYPERTENSIONC. HYPOTHYROIDISM D. HYPERTHYROIDISM
21. DEFICIENCY OF THYROID ACTIVITY. MOST COMMON IN WOMEN.CHARACTERISTICS; LOW BASAL METABOLISM, FATIGUE LETHARGY,SENSITIVITY TO COLD.A. INTEGRITY B. HYPERTENSIONC. HYPOTHYROIDISM D. HYPERTHYROIDISM
22. THE PERIOD OF DEVELOPMENT OF THE YOUNG IN VIVIPAROUS ANIMALSFROM THE TIME OF FERTILIZATION OF THE OVUKUNTIL BIRTH.A. GESTATION B. INHIBITC. DECIDUA D. MATERNAL
23. PERTAINING TO THE MOTHERA. GESTATIONC. DECIDUA
B. INHIBITD. MATERNAL
24. PROCESS OF GIVING BIRTH TO A CHILDA. PRE-ECLAMPSIA B. CONCEPTUSC. PARTURITION D. FERTILIZATION
25. THE ATTACHMENT AND EMBEDDING OF THE FERTILIZED OVUM IN THEUTERINE WALL.A. INTEGRITY B. HYPERTENSION
C. HYPOTHYROIDISM D. IMPLANTATION
3$2

ANSWER KEY TO ENDOCRINOLOGY VOCABULARY TEST
1.02.A3.D4. C5.A6.B7.D8. C9.D
10. B11. A12. C13. B14. C15. D16. A17. C18. A19. D20. B21. C22. A23. D24. C25. D
383
BEESON 29

HORMONES USED 1N THE REPRODUCTIVE PROCESS IN PLANTS
LABORATORY
(NOTE THIS LAB SHOULD BE STARTED AT LEAST THREE WEEKS PRIOR TO
STUDYING HORMONES)
The purpose of this lab is to determine if cuttings of plants are treated with plant
hormone such as Rodtone will develop root systems faster than plants not treated with
the hormone.
Materials that you will use are 3 cuttings approximately 6 inches long with visiblenodes (good choices of plants are Pathos Ivy or Scottish Ivy), small flower pots or other
suitable containers (need holes in bottom for drainage), soil for pots, Rootone or otherplant hormone and water. A grow light or sunshine is necessary.
Procedure:
(1) Cut cuttings approximately 6 inches long with visible nodes on each piece.
(2) Label containers, your name, hormone or no hormone and the date.Don't forget to have a control.
(3) Dip one cutting in Rootone and plant 1-2 inches into soil.
(4) Plant cutting 2 and 3 without hormone.
(5) Water all plants and keep them moist during the entire experiment.
(6) Keep under grow light or in filtered sunlight (they love to be under a tree or on a
porch if it is available).
(7) Check carefully after three weeks for root growth by gently removing the soil byplacing the plant in a pan of water.
(8) Record your results.
g 4

BEESON 31
TITLE: READING FOR BIOLOGY EXIT ANALYSIS PRACTICE
FROM: ABSTRACT INTERACTION BETWEEN NITRIC OXIDE ANDPROSTAGLANDIN E2 PATHWAYS IN PREGNANT RAT UTERI.
AUTHORS: YUAN-UN DONG, M.D., PHD AND DR. CHANDRAYALLAMPALLI, D.V.M., PHD.
VOCABULARY: SEE HELPFUL VOCABULARY WORDS AT THEEND OF THE READING
LINE Doctors Dong and Yallampalli examined the possible2 interrelationships between nitric oxide (NO) and3 cyclooxygenase (COX) products in the uterus during4- pregnancy and labor.5 As a result of this laboratory study, these observations(e) were made.`7 (1) rat uteri during labor, at term (22nd day of
gestation), demonstrated 69% decrease in nitriteq production and 217% increase in prostaglandin E2
/0 (PGE2)compared to day 18 of pregnancy.// (2) interleukin-18 (1L-18 ) induced a pronounced/A elevation of both nitrites and prostaglandin E2 (PGE2)in/3 the rat uteri,/41 (3) diethylenetriamine/NO, a donor of Nitric Oxide,
induced a significant increase of PGE2 production by the
uterus in a dose dependent manner. (the increase of dose/7 quantity caused a similar increase in production of PGE2)
lQ (4) NG- Nitro-L-Arginine methyl ester, an inhibitorof NO(nitric oxide) synthesis markedly inhibited 1 L -1 B
eta induced nitrite and PGE2(prostaglandin E2) production in
I the rat uteri: This inhibitory action was reversed bycoincubation with L-arginine
.73 (5) Exogenous PGE2 significantly inhibited 1L - 1 B
Ali induced but not constitutive, nitrite production.(6),Inhibition of endogeneous PGE2 (prostaglandin E2
AO by indomethacin substantially increased nitrite
385387

BEESON 32
LINE production.
7 This would lead one to believe that there is an interaction
IV between NO (Nitric Oxide) and COX pathways and this could
419 be important in the regulation of uterine contractility.30 during pregnancy and labor.3/ Nitric Oxide (NO) is a multifunctional molecule thatal mediates a number of diverse physiological processes.33 These include vasodilation neurotransmission , platelet31/ antiaggregaton, cytostasis, and cytotoxicity.
35 Relaxation of vascular smooth muscle by nitrovasodilatorse. is thought to be mediated by the increases of quanosine 3,
37 5 - cyclic monophosphate (cGMP) in smooth muscle cells.
Studies from our laboratory provide convincing evidence39 that NO generated from L-arginine by NO synthase (NOS) in4 the gravid uterus plays a role in maintaining uterine41/ quiescence (calmness) during pregnancy but not during
.1 labor. We demonstrated the existence of an L- Arginine
43 NO-cGMP in the rat uterus and that the production of NO is4./.1i up regulated during pregnancy and down-regulated during././5 labor and postpartum (after delivery)
17149 Present studies demonstrate that Ihe decrease in NO
Ir7 production (69%) at term labor is accompanied by an#g increase (217%) in PGE2 production by the uterus compared
.49 with that during day 18 of pregnancy. Furthermore, PGE2
50 inhibits and indomethacin increases the 1L - 1B -5/ stimulated NO production, whereas NO was stimulatory to
PGE2 production.
These results, together with our previous studies indicate
,52/ that the NOS pathway is upregulated during gestation to
3 s/

BEESON 33
LINE .55 maintain uterine quiescence and that an increase in PGE2
.5-6 production at term could attenuate uterine NO production,57 facilitating the initiation of labor. Therefore, the uterine1/45? NO and PG pathways may interact and these interaction%.59 could be important in the regulation of uterine60 contractility during pregnancy and labor.
6/ Present studies confirm our earlier report that the uterine6A NO increases PGE2 production by the rat uterus.
63 The underlying mechanisms controlling the NO and PGE2
62/ production by the uterus during pregnancy remains unclear.c',5 Our present studies suggest that both endogenous and66 exogenous NO increases PGE2 production by the rat uterus.
67 In current experiments, the most significant finding is6/ that the uterine NO production is substantially reduced by6 9 PGE2. This was demonstrated both by the administration
70 of exogenous PGE2 and by the manipulation of endogenous
'7/ PGE2.
qa Exogenous PGE2 inhibited 1 L-1 B -stimulated NO
gi production, but failed to alter basal NO production,indicating that PGE2 inhibits an inducible NOS(iNOS) in the
'75" uterus.
"7 This is further supported by the observations that7'7 inhibition of endogeneous PGE2 by indomethacin amplified
7g the stimulator)/ effects of 1 L -1 B on NO production but no79 effect on basal NO generation by the uterus.
RO Therefore, it is tempting to speculate that increased PGE2
8/ at term could downregulate inducible NO production by theS o? uterus, increasing contractility. Indeed, the pregnancy -83 associated increase and84 labor - associated decrease in uterine NO productiontg. appear to be through changes in iNOS content in the uterus.
387

BEESON 34
LINE 86 This conclusion is based on studies in the rat and rabbitger utilizing both NOS enzyme activity (biochemical)data and88 Western Immunoblotting (protein content) data onI9 isoforms of NOS in the uterus .
90 A strong association between steroid hormones and uterine9/ PG .production in relation to pregnancy and labor is well901 recognized. Estradiol stimulates and progesterone inhibits93 PGE2 production by the uterus and fetal membranes.
944 In summary, our studies with the rat demonstrate that:95" (1) Uterine NO production is decreased at term labor,96 coinciding with increased PGE2 synthesis;'Fq (2) PGE2 inhibits uterine 1L-1 B - stimulated NO
9g production, providing a potential mechanism to decreasetit? NO production at term;/CO (3) NO stimulates PGE2 synthesis. Because
/0/ cytokines are elevated during pregnancy, the NOS and COX/OA pathways may interact with each other, and the relation/du between the two pathways could be important in regulating/044 uterine contractility and initiation of labor.
References
I. Dong, Yuan-Lin, C. Yallampalli, 1996. Interactionbetween nitric oxide and prostaglanadin E2 pathways inpregnant rat uteri, American Physiological Society,01 93-1 849/96.
37°

BEESON 35
WORDS AND DEFINITIONS FOR USE. WITH BIOLOGY EXIT EXAM READINGPRACTICE
1. ATTENUATE - TO MAKE SMALL; TO REDUCE IN STRENGTH, AMOUNT,WEAKEN
2. cGMP - GUANOSINE 3'.5' - CYLIC MONOPHOSPHATE INCREASE ISTHOUGHT TO CAUSE RELAXATION OF VASCULAR SMOOTH MUSCLE BYNITROVASODILATORS.
3. CONSTITUTIVE - MAKING A THING WHAT IT IS; ESSENTIAL
4. CONTRACTILITY - TO BECOME REDUCED IN SIZE-BY OR/AS IF DRAWNTOGETHER; SHRINK
S. CYTOSTASIS - THE CLOSURE OF CAPILLARIES BY WHITE BLOODCORPUSCLES IN THE EARLY STAGES OF INFLAMMATION
6. CYTOTOXICITY - A TOXIN (POISON) OR ANTIBODY THAT HAS A SPECIFICTOXIC ACTION UPON CELLS OF SPECIAL ORGANS.
7. DOSE DEPENDENT MANNER - THE INCREASE OF DOSAGE QUANTITY CAUSEA SIMILAR INCREASE IN THE PRODUCT MADE.
8. ENDOGENEOUS - PRODUCED FROM WITHIN, ORIGINATING FROM AN ORGANOR PART.
9. DOWN-REGULATED - CAUSED TO PRODUCE LESS
10. EXOGENOUS - DERIVED OR DEVELOPED FROM EXTERNAL CAUSES.HAVING A CAUSE EXTERNAL TO THE BODY.
11. GRAVID - PREGNANT; HEAVY
12. INDUCED - TO STIMULATE THE OCCURRENCE OF, OR CAUSE. TO LEAD ORMOVE BY INFLUENCE OR PERSUASION
389

BEESON 36
13. INDUCIBLE - POSSIBLE TO STIMULATE OR CAUSE TO OCCUR
14. INHIBITOR - A SUBSTANCE USED TO RETARD (SLOW DOWN) OR HALT ANUNDESIRABLE REACTION
15. INITIATION - TO BEGIN OR ORIGINATE
16. L-ARGININE - SUBSTANCE THAT REVERSES THE INHIBITIVE ACTION OF
NO AND PGE2 SYNTHESIS IN RAT UTERI CAUSED BY NG - NITRO - L -
ARGININE METHYL ESTER17. MARKEDLY - HAVING A NOTICEABLE, DISTINCTIVE TRAIT OR CHANGE;
CLEARLY DEFINED
18. NEUROTRANSMISSION - A PROCESS BY WHICH A NEUROTRANSMITTER ISRELEASED, CROSSES THE SYNAPSE, AND AFFECTS THE ACTION OF THETARGET CELL.
19. NO - NITRIC OXIDE
20. PLATELET ANTI AGGREGATION - PLATELETS(BLOOD) LACKINGCLUMPING TOGETHER.
21. POSTPARTUM - OCCURRING IN THE PERIOD SHORTLY AFTER CHILDBIRTH.
22. SYNTHESIS - THE COMBINING OF SEPARATE ELEMENTS OR PARTS TO
MAKE A WHOLE SUCH AS A COMPOUND.
23. SUBSTANTIALLY - CONSIDERABLE IN AMOUNT OR IMPORTANCE
24. UPREGULATED - CAUSED TO PRODUCE MORE
25. UTERINE QUIESCENCE - INACTIVE, STILL, CALM, UNMOVING UTERUS(NOT HAVING CONTRACTIONS)
26. VASODILATION - DILATION (EXPANSION) OF A BLOOD VESSEL.
3 .90
391-

BEESON 37
QUESTIONS FOR PRACTICE OF THE READING PORTION OF BIOLOGY EXIT EXAMDIRECTIONS: Multiple-Choice - 'select the best answer and placeinthe appropriate blank.
1. The statements labeled (1),(2),(3),(4),(5),(6), beginning on Iine_7is what step in Scientific Method.a. Problem or. objective b. Hypothesisc. Procedure d. Results e. Conclusion
2. The statement beginning on line_27_, Beginning with, " This wouldlead contractility during. labor;" would be used in which step ofScientific Method.a. Problem or objective b. Hypothesisc. Procedure d. Results e. Conclusion
3. In lines 38-45 , this information would lead us to believe that NOa. would help keep down problems of early delivery or miscarriageb. would keep the baby from developing nervous disorders.c. would help the baby sleep betterd. prevents the baby form being born on time.
4. In lines 42-45. of this reading, from the information gathered, if weinterpret the data it appears.a. that the mother's body can't decide if the baby needs this hormone
so it makes it sometimes, but not othersjust as a precaution.
b. the baby needs more NO during delivery so it makes mote at thistime.
c. it makes more NO during the gestational period to prevent earlycontraction (labor pains) then decreases production at term as thebaby is about to be born.
d. it doesn't make NO as it's been found to be ineffective.
5. Why are rats used for this experimenta. because of availabilityb. because of likeness of reproductive organs and processes.c. because human trials always follow lower animal studies.d. all of the above.
391353

BEESON 38
KEY
QUESTIONS FOR PRACTICE OF THE READING PORTION OF BIOLOGY EXIT. EXAMDIRECTIONS: Multiple-Choice - select the best answer and placeinthe appropriate blank.
1. The statements labeled (1),(2),(3),(4),(5),(6), beginning on line_7is what step in Scientific Method.a. Problem or objective b. Hypothesisc. Procedure Q Results e. Conclusion
2. The statement beginning on line_27_, Beginning with, " This wouldlead contractility during labor;" would be used in which step ofScientific Method.a. Problem or objective b. Hypothesisc. Procedure d. Results Conclusion
3. In lines 38-45 , this information would lead us to believe that NOwould help keep down problems of early delivery or miscarriage
b. would keep the baby from developing nervous disorders.c. would help the baby sleep betterd. prevents the baby form being born on time.
4. In lines 42-45. of this reading, from the information gathered, if weinterpret the data it appears.a. that the mother's body can't decide if the baby needs this hormone
so it makes it sometimes, but not others just as a precaution.
b. the baby needs more NO during delivery so it makes more at thistime.
it makes more NO during the gestational period to prevent earlycontraction (labor pains) then decreases production at term as thebaby is about to be born.
d. it doesn't make NO as it's been found to be ineffective.
5. Why are rats used for this experimenta. because of availabilityb. because of likeness of reproductive organs and processes.c. because human trials always follow lower animal studies.
all of the above.
Id2

Heather LentzComposite Science
Spence Middle School, Dallas ISD
University of Texas Southwest Medical CenterSTARS Program
Dr. Skip Garner, Mentor
393

APPENDICES

TEXAS TEACHER INTERNSHIP PROGRAM EVALUATIONSummer 1996
MENTORS
List at least two things that you and/or your department gained by hosting a teacherintern this summer.
communicated an important program effectively.increased level of awareness as to the importance of individual
performance.learned needs of local area and our plants.gained knowledge/insight into "The Life of a Middle School Science
Teacher."I now have a liaison with an educator.Do projects which there isn't time to do during the academic year.Interface with the schools in Galveston & Harris Co.Teacher insight into education as we are making strategic decisions on this
issue in our agency.Interviewing, interpretive, non-technical communicative skills of a teacher
working objectively within an industrial setting.Teacher doing project that staff members do not have time to do in the
academic year.Bringing a real classroom connection to our education projects.
Describe the development of the teacher's position (i.e. the job description/projectfrom conception of the idea to implementation with the intern). Includeinformation about changes that were made along the way and why.
Knew need to communicate program > described product needed > setgoal. Interviewed teachers & presented idea (found match). Need to includeassistance to help with computer skills.
Was behind in implementing program time-line. Turned program over tointerns judgment and science expertise. Spent summer conferencing tobring program to near completion.
We solicit expressions of interest from faculty throughout organization.Matched applications with openings.
We knew we were going to do an internet-based project and chose theTeacher Internship Program as one mechanism to develop the project. Theintern became a full team member in the project and has assumed a majorrole in developing/implementing the concept.
Better direction/planning during first few weeks on internship.Pre-internship planning.Set up internship earlier.
Did the teacher fit into the natural flow of production/work in your facility?Yes 80%no 20%
395

Please describe any transition problems that occurred during the first few weeks.Need to wait on upper management. Time for training - use of equipment
such as Power Point, digital camera, etc.NoneOne teacher had a composite program with three mentors, which was
difficult to coordinate and is still disconnected.None
Were you involved in the interview/selection of the teacher intern?yes 70%no 30%
If yes, what was your involvement and how would you change this in the future.Presented idea of project. Determined qualification, interest, logistics, salary.Start placement earlier, involve assistant ASAP.Made the match between openings and teachers, and in some cases seek
other openings to match certain teacher interests.Selected intern from a pool of about ten candidates. All were viable and
would have done a good job.Team approach to interview/selection was very appropriate to this
internship.
The following questions were offered as a pre-evaluation and post-evaluation.Ere E0.51 ±1:
1. I believe it is important for teachers torequire students to:a. Work in groups. 4.6 4.7 .1
b. Complete joint or group projects. 4.3 4.7 .4
c. Give oral reports or presentations. 4.7 4.5 <.2>
d. Submit formal written reports. 4.3 4.2 <.1>
e. Do special projects or assignments oncurrent issues or new developmentsin math, science or computer science. 4.1 4.7 .6
2. I believe teachers' instruction should includeinformation on:a. New developments in subject area. 4.6 4 <.6>
b. Current research in subject area. 4.6 4 <.6>
c. State-of-the-art techniques in subjectarea. 4.2 4.5 .3
3. I believe it is important for teachers tofacilitate the integration of science,mathematics and technology in theclassroom. 4.7 4.5 <.2>

4. I believe it is important for teachers toprovide information about career optionsand educational requirements in math,science or computer science fields. 4.7 4.5 <.2>
5. I believe that teachers are keeping current on:a. careers in math, science or computer
science 3.1 3 <.1>b. technological advances 2.8 3 .2c. the realities of the workforce 3.1 2.6 <.5>d. the advances in research 3.1 3 <.1>
6. I believe teachers should stress students'development/use of problem solving andhigher order thinking skills in theclassroom. 4.6 5 .4
7. I believe it is important to utilize computersand other technologies in the classroom. 4.6 4.5 <.1>
8. It is my present understanding that teachersare maximizing the use of available resourcesin the classroom. 2.7 3.5 .8
9. I believe that I have a clear understanding ofthe challenges teachers face today. 3.1 3 <.1>
10. I believe my teacher intern did return to theclassroom with:a. an increased knowledge of their
content area. 4.7 4.2 <.5>b. an increased confidence in presenting
current information to students andcolleagues. 4.7 4.2 <.5>
c. information concerning careeropportunities/educational requirementthat will assist in counseling students oncareers in math, science and/or computerscience fields. 4.2 4.5 .3
d. resources to enhance classroominstruction 4.6 4.7 .1
11. I intend to continue a working relationshipwith my teacher intern, providing support,as necessary, during the school year. 4.7 5 .3
397

12. I believe that definite improvements ineducation did result from the collaborationof teachers and professional experts. 4.8 4.7 <.1>
Comments / Suggestions:Conference calls between Alliance, prospective mentors and experienced
mentors in similar fields.Need an assistant (in industry) / work in a team.Two year project or one that will be finished by staff.Be a mentor - it will take time & commitment it is not an independent
study project.Education of the program throughout upper management (visit with
mentor's manager during orientation to get their buy-in/support).

TEXAS TEACHER INTERNSHIP PROGRAM EVALUATION SUMMARYSummer 1996
TEACHERSMale: 2Female: 10
Black 1 Elementary 1Caucasian 10 Middle 5Hispanic 0 Secondary 6
1. Please rate the values of your internship experience compared to otherprofessional development experiences you have had.Scale: 1 = low/poor . . 5 = outstanding/excellence 4.5
2. The best thing about my summer internship was ...developing fungi curriculum for my classroom and using new software to
research it.the diversity - I really learned how very applicable critical thinking and
problem solving skills I try to reinforce constantly are constantly andconsistently valued in real life.
the opportunity to be treated with respect, recognition of my value &expertise as an educator, opportunity to accumulate real world & technicalknowledge, making new friends & networking and discovering the internet.
working with multiply talented professionals.learning how to clean skulls & jawbones! Working with wonderful people
at Texas Parks & Wildlife.freedom to learn and diversified my knowledge.contacts made for bringing new technology and equipment into the
classroom.I was given the freedom to decide what to do with the information I learned
i.e. I wasn't told I had to write something specifically.a chance to work professionally with other adults and a chance to have fun
while working and earning a little money.the interaction between teacher and mentors being able to search on the
computer learning how clinical researchers do research.it was a totally new environment for me. I've been in government
agencies, companies, academic settings, but this was completely different.
3. The worst thing about my summer internship was ...no air conditioning in my building for 3 long days.so very many things to experience and so little time really there were no
worst experience.lack of time.summer was too short.
399

not enough time to do all the things I wanted to do.internal consulting, or at least I didn't find it, concerning some technical
items.100T days in a tent very hot.at times I was frustrated because there wasn't a lot of contact between me
and my coordinator i.e. I wasn't sure exactly what was expected of me.my seed experiment gave me a hard time and my computer went out at a
bad time. The doctor who was very helpful was called "home" for 3 weeks toretrieve his family.
by the time I was getting to know my way around and had defined jobs, itwas time to leave.
my assignment was clearly defined, but the implementation phase of it was
not thought out.
4. The most important thing that I have gained (personally and/or professionally)from my internship experience was ...
a greater level of computer literacy and refinement of pre-existing lab skills.
my computer skills were enhanced and nurtured I feel not quite butalmost comfortable with Power Point -- my resource base broadenedtremendously. I also learned to roller-blade!
ability to create science math & technology lab experiences based on newinformation & to acquire a mentor.
tremendous wealth or resources -- personal and materials.Experience! All of the experiences cannot be matched.I will say a good groundwork for actually knowing what hardware/software
to get as well as working on grant specifications.having and taking time to learn and organize new technology/ideas for
making science more exciting and practical.what a researcher goes through daily i.e. I was able to identify with and
observe others when things went wrong.recharged battery better knowledge of hormones, an opportunity to work
with profused rats, an opportunity to think professionally again.how to do a simple studies.I did not realize the immensity of an industry such as Exxon, but I especially
did not realize the diverse backgrounds necessary to keep such an operationrunning.
5. My job assignment was:Clearly defined 4Appropriate for my background 4.6
Mentally stimulating/challenging 4.9

6. My mentor was:Prepared for my arrival 3.8Knowledgeable about the program 3.5Supportive of my effort/work 4.4Supportive of my curriculum plan 4.3Helpful in my transition to the new environment 4.2
7. Overall, my mentor/teacher relationship was:Professionally fulfilling 4.1Effective for my growth 4.2Contributed to the attaining of my goals for
the internship 4.2
General comments about your mentor/teacher relationship ...very organized, specific goals were set and reached, there was a lot of
flexibility on the mentors part with respect to finished product.my mentors were personable and supportive we related on any levels I
felt perfectly comfortable to approach them with any problem.my mentor, a former educator, was very supportive, non-restrictive, a
coach, teacher he is the best -- most receptive to ideas.were available to me whatever I wanted and needed to do my job
effectively.we were fast friends and will continue to work on educational tools
together.very open and trusting.very good, would have been nice to be able to do broader "exploring" time
in agency to get info on other work that may be helpful and applicable to mysubjects. Could have used a better computer than then one I had.
was very supportive but not present very often. Post doc could have caredless most of the time.
his projects are wonderful and very successful, of course, this means thatthe demands on his time are great.
my mentors were very supportive when I had questions, they were friendlyand willing to help.
the mentor I was working with was not involved in my project at all, thementor who interviewed me and set up my project is an excellent chemist,but except for meetings hardly ever interacted with me.
8. Increased self-confidence 3.9
9. Personal revitalization 4.1
10. Renewed enthusiasm for teaching 4.1
11. Increased knowledge of your teaching subject area 4.4
401

12. Increased knowledge of practical applications withinyour subject area 4.6
13. Increased knowledge in other related subject areas 4.4
14. New perspectives on the teaching of your subject 4.2
15. Increased knowledge of careers 4.4
16. Increased knowledge of necessary skills andbackground required in the workplace 4.6
17. Addition of new content to lessons of labs 4.6
18. Revision of content within existing lessons 4.4
19. Examples and applications from internship work(with necessary modifications of activities foryour classroom) 4.4
20. Lessons on careers and educational requirements 4.2
21. Visits from your mentor and other professionalfrom your internship site 3.3
22. Providing opportunities for interaction betweenyour students and professionals from yourinternship site 3.5
23. Using materials and equipment from yourinternship site 3.9
24. Sharing materials and resources with other teachers 4.6
25. Sharing experience details and benefits/informationwith teachers and community members/groups 4.6
26. Assigning projects based on "real-world" problems 4.5
27. Having students working in groups 4.5
28. Requiring students to complete group projects 4.4
29. Requiring oral reports and group presentations 4.8
30. Requiring formal written reports 4.4
4, 2

31. Integrating math, science and technology 4.6
32. Integrating other subject areas 4.3
33. Introducing new technology 4.2
34. Using computer applications 4.4
35. Emphasizing work habits (i.e. deadlines, neatness, etc.) 4.3
36. Emphasizing laboratory safety 4.1
The following questions were offered as a pre-evaluation and post-evaluation.
37. I believe it is important for my students to:a. Work in groups.b. Complete joint or group projects.c. Give oral reports or presentations.d. Submit formal written reports.e. Do special projects or assignments on
current issues or new developmentsin math, science or computer science.
38. In my classroom lectures or discussions,I believe it is important to refer to:a. New developments in subject area.b. Current research in subject area.c. State-of-the-art techniques in
subject area.
39. I believe it is important to integrationscience, mathematics and technology inthe classroom.
40. I believe it is important to provide mystudents with information about careers inmath, science or computer science fields.
41. I believe that I am keeping current on:a. careers in math, science or
computer scienceb. technological advancesc. the realities of the workforced. the advances in research
403
Etc fast
3.9 4.5 .63.9 4.4 .54.3 4.6 .34 4.5 .5
4.5 4.6 .1
4.6 4.7 .14.6 4.5 <.1>
4.6 4.3 <.3>
4.7 4.8 .1
4.5 4.6 .1
3.4 4 .63.5 4 .53.9 4.4 .53.4 3.9 .5

42. I feel comfortable counseling students inpossible careers in math, science orcomputer science fields. 3.7 4 .3
43. I believe it is important to stress problemsolving and higher order thinking skillsof my students. 4.6 4.7 .1
44. I believe it is important to utilize computersand other technologies in the dassroom. 4.5 4.6 .1
45. I am enthusiastic about teaching. 4.7 4.9 .2
46. I believe that collaboration with industryprofessionals during the school year willenrich my classroom teaching. 5 4.6 <.4>
47. I intend to continue a working relationshipwith my mentor during the school year. 4.1 4.2 .1
48. I believe that definite improvements ineducation will result from the collaborationof teachers and professional experts. 4.6 4.9 .3

TEXAS TEACHER INTERNSHIP PROGRAMIntern Information List
Summer 1996
NAME: Ann T. Kelley NAME: Nancy McGregerISD: Houston ISD ISD: Victoria ISDSCHOOL: Stephen F. Austin High School SCHOOL: Stroman High SchoolPRINCIPAL: Jose Trevino PRINCIPAL: Dr. Annette ScottAREA(S): Composite Science AREA(S): Biology/GermanSPONSOR: Exxon Chemical SPONSOR: Texas A&M University
5000 Bayway Drive Biochemistry DepartmentBaytown, Texas 77520 College Station, Tx 77843
MENTOR Dr. Brigitte Laki MENTOR: Dr. Bruce McDonald713-425-5224 409-845-1491
HOME: 1323 B West Pierce HOME: 1505 Lova Dr.Houston, Tx. 77019 Victoria, Tx 77901
SCHOOL: 1700 Durable SCHOOL: P.O. Box 1759Houston, Tx 77023 Victoria, Tx 77902713-924-1600 512-788-9804
NAME: Linda Rhoden NAME: Jennifer WillisISD: Pasadena ISO ISD: Pre-Service TeacherSCHOOL: J.F. Dobie High School SCHOOL:PRINCIPAL: Jerry Speer PRINCIPAL:AREA(S): Composite Science AREA(S): ChemistrySPONSOR: Fina - Deer Park SPONSOR: Texas A&M University
P.O. Box 1200 Center for ChemicalDeer Park, Texas 77536 Characterization and Analysis
MENTOR: Lu Ann Kelly & Dr. Jose Sosa College Station, Tx 77843409-884-0546 MENTOR: Dr. E.A. Schweikert
HOME: 1713 San Sebastion 409-845-2341Houston, Tx 77058-4103 HOME: 12703 Jones Rd. #610
SCHOOL: 11111 Beamer Rd. Houston, Tx 77070Houston, Tx 77089 SCHOOL:713-481-3000 E -MAIL: [email protected]
NAME: Norene Rose Flaherty NAME: Dorothy ChavezISD: Dallas ISO ISD: Round Rock ISDSCHOOL: Long Middle School SCHOOL: Gattis Elementary SchoolPRINCIPAL: Alan Harris PRINCIPAL: Janell SandersAREA(S): Science AREA(S): Environmental EducationSPONSOR: TU Electric SPONSOR: Texas Parks & Wildlife
1601 Bryan 4200 Smith School RoadDallas, Texas 75266 Austin, Texas 78744
MENTOR: Orlan Ihms MENTOR: Nancy Herron214-812-5097 512-389-4360
HOME: P.O. Box 644 HOME: 4107 Mark RaeMidlothian, Tx 76065 Austin, Tx 78727
SCHOOL: 6116 Reiger SCHOOL: 2920 Round Rock Ranch RdDallas, Tx 75214 Round Rock, Tx 78664214-841-5270
405

TEXAS TEACHER INTERNSHIP PROGRAMIntern Information List
Summer 1996
NAME: Alan J. Cherepon NAME: Kenneth Baratko
ISD: Round Rock ISD ISD: Houston ISD
SCHOOL: Westwood High School SCHOOL: Jones Sr. High School
PRINCIPAL: Linda Watkins PRINCIPAL: Para lee Crawford
AREA(S): Composite Science AREA(S): Mathematics /Chemistry
SPONSOR: Texas Parks & Wildlife SPONSOR: UTMB-Galveston4200 Smith School Road 362 Childrens HospitalAustin, Texas 78744 Galveston, Tx 77555
MENTOR: Steve Hall/Scotty Oliver MENTOR: Dr. William Buford512-3894568 409-772-2189
HOME: 2904 Martin Drive HOME: 8333 NairnCedar Park, Tx 78613 Houston, Tx 77074-3825
SCHOOL: 12400 Mellow Meadows Dr. SCHOOL: 7414 St. LA
Austin, Tx 78750 Houston, Tx 77033
512-464-4000 713-733-1111
E-MAIL: chereponaCkenet.edu E -MAIL: [email protected]
NAME: Vickie Smith NAME: Frances Beeson
ISD: Austin ISD ISD: Dickinson ISD
SCHOOL: Fulmore Middle School SCHOOL: Dickinson High School
PRINCIPAL: Victoria Baldwin PRINCIPAL: Mike LaTouche
AREA(S): Composite Science AREA(S): Biology, Physical Science
SPONSOR: Texas Parks & Wildlife SPONSOR: UTMB-GalvestonConservation Communications Galveston, Tx 77555
Austin, Texas MENTOR: Dr. Chandra YallampalliMENTOR: Kathryn Hampton HOME: 4909 Blue Water Lane
805 N. Capital of Texas Hwy. Dickinson, Tx 77539
Wild Basin Preserve SCHOOL: 3800 Baker Drive
HOME: 2505 Bowman Ave. Dickinson, Tx 77539
Austin, Texas 78703 713-534-6800
SCHOOL: 204 E. MaryAustin, Texas 78704512-320-0111
NAME: Dina Armstrong NAME: Heather Lentz
ISD: Galveston ISD ISD: Dallas ISD
SCHOOL: Central Middle School SCHOOL: Spence Middle School
PRINCIPAL: Jack Stork PRINCIPAL: Claudia Lozano
AREA(S): Mathematics AREA(S): Composite Science
SPONSOR: UTMB-Galveston SPONSOR: STARSGalveston, TX 77555 University of Texas Southwest
MENTOR: Dr. Todd Miller Medical Center
HOME: 1115 Highway 146 #1303 5323 Harry Hines BoulevardTexas City, Tx 77590 Dallas, Tx 75235
SCHOOL: 3014 Ball Street MENTOR: Dr. Skip GarnerGalveston, Tx 77550 HOME: 7150 E. Grand Ave., #1505
Dallas, Tx 75223SCHOOL: 4001 Capital Dr.
Dallas, Tx 75204
403

(9/92)
U.S. DEPARTMENT OF EDUCATIONOffice of Educational Research and Improvement (OERO
Educational Resources Information Center (ERIC)
NOTICE
REPRODUCTION BASIS
ERIC
This document is covered by a signed "Reproduction Release(Blanket)" form (on file within the ERIC system), encompassing allor classes of documents from its source organization and, therefore,does not require a "Specific Document" Release form.
This document is Federally-funded, or carries its own permission toreproduce, or is otherwise in the public domain and, therefore, maybe reproduced by ERIC without a signed Reproduction Releaseform (either "Specific Document" or "Blanket").