Embed Size (px)
Citation preview
DOCUMENT RESUME
ED 081 714 SP 006 520
AUTHOR Harnischfeger, AnnegretTITLE Personal and Institutional Characteristics Affecting
Teacher Mobility.INSTITUTION Stanford Univ., Calif. Stanford Center for Research
and Development in Teaching..SPONS AGENCY National Inrt..of Education (DHEW), Washington,
D.C.PUB DATE Feb 73CONTRACT OEC-6-10-078NOTE 22p.; Paper presented at the Annual Meeting of the
American Educational Research Association (NewOrleans, Louisiana, February 1973)
EDRS PRICE -$0.65 HC-$3.29DESCRIPTORS Faculty Mobility; *Individual Characteristics;
*Institutional Environment; *Institutional Role;Records (Forms); *Teacher Characteristics
ABSTRACTThe major purposes of this study were to identify the
effects of personal characteristics of teachers and institutionalcharacteristics of schools on teacher mobility. The methodologyinvolved multiple regression analyses of nobility measures onpersonal characteristic variables and on institutionalcharacteristics with control for personal characteristics. The datawere derived from school and teacher records in two California schooldistricts over a 4-year period..Both personal and institutionalcharacteristics were found to affect teacher mobility. Some policyimplications of these findings are discussed..(Author)
Ut Of Tut Of mttTotOUCT IP% III LLLLL.411(0%11. tkaliTUtt Or
OUCTIO*4. ,APt f ut rt0
C) rArlk At, Ai t)
r10 CIO (!lo rd.., t I. C%
04 1.0 44,v.1 A COO cyo,
:Al D *.c. h1 (I , 1.11'%1
.01%1 e. ,*,. c
Iru en,
PERSONAL AND INSTITUTIONAL CHARACTERISTICS
AFFECTING TEACHER MOBILITY*
Annegret Harnischfeger
University of Chicago
Paper prepared for the Annual Meeting of the AmericanEducational Research Association, New Orleans
February 26 - March I, 1973
The research reported heroin was conducted atthe Stanford Center for Research and DevelopmentIn Teaching, which is supported in part as aresearch and development center by funds from theNational Institute of Education, U.S. Departmentof Health, Education, and Welfare. The opinionsexpressed in this publication do not necessarilyreflect the position, policy, or endorsement ofthe National Institute of Education. (ContractNo. OEC-6-10-078, Component R1553D)
*The author wants to express her special thanks to David E. Wiley,University of Chicago, for enlightening conversations on theconceptual model and his consultation on the statistical analysis.
rFILMED FROM BEST AVAILABLE COPY
TABLE OF CONTENTS
I. Issues in the Study of Teacher Mobility
1. The Research Orientation of Teacher Mobility
During the Past Twenty Years Page 1,
2. The Concept of Teacher Mobility and a Model
for its Investigation Page 5
3. Objectives of the Present Study and Data
SoJrces Page 13
4. Methods and Techniques of Data Analysis. . Page 14
II. Teacher Mobility in a California School District
2. Characteristics of the Area and the School
District Pa/e 16
2. Description of Teadher and School Variables Page 17
3. Description of the Teacher Population . . . Page 19
4. Zero-Order Relations Between Teacher
Characteristics and Teacher Mobility Page 20
5. Adjusted Relations Between Teacher CheracZerist.t,es
and Teacher Mobility Page 24
6. Relations Between Teacher and School
Characteristics and Teacher Mobility . . . Page 32
7. Implications for Educational Policy: Some
Tentative Comments Page 36
1. ISSUES IN THE STUDY OF TEACHER MOBILITY1
1. The Research Orientation of Teacher Mobility during the Past
Twenty Years
In the past twenty years of research in teacher mobility researchers
were predominantly facing a period of increasing expenditure in education.
In the fifties enrollment was growing. This fact andtta policy of class
size reduction created considerably mono teaching positions. Teacher demand
was much higher than teacher supply.
Research on teacher mobility consequently focused on the reasons for
teacher dropout, primarily investigating teacher but also institutional
characteristics. Teacher characteristics were mostly studied by means of
teacher personnel files of school districts while institutional character-
istics were mostly investigated through teacher opinion rather than more
objective characteristics.
The policy implications considered in most of the studies on institut-
ional characteristics concentrated on recommending higher salaries, smaller
class sizes, and more instructional support for difficult schools. But
many studies assume that institutional characteristics are relatively
unimportant compared to teacher characteristics. .Studies focusing on teacher
characteristics provided the school district personnel department with des-
criptions of teachers to be hired because of their good survival risk.
If school districts were to follow these studies' conclusions, they
would avoid hiring young female, married teachers and tend to look for
teachers who have at least four years of teaching experience and are near
30 years old; they would prefer unmarried female teachers and male to ferale
teachers. Fortunately, districts consider other factors too. Some districts
are limited in their hiring practices for budgetary reasons. They cannot
afford to hire experrenced'teachers. But if they consider the higher turn-
over rate for young teachers and that the recruitment fee for a teacher is
about $1000 (Ridefer, 1962), they might well reconsider their hiring policy.
Some districts place great weight on the racial distribution of their
teachers to that at least the consequences of the above mentioned teacher
characteristics have to be seen through these glasses. And then, there are
1) This section is a condensed selection of parts of a report entitled"Personal and Institutional Characteristics Affecting Teacher Mobility.
The Problem of Teacher Mobility." Stanford Center for Research and
Development in Teaching, Stanford University, in production (1973),
Page 2
many more or less obvious factors to be taken Into consideration: cottage
grades, .degree held, special training, bilinguality, special work interests
("difficult" or handicapped children).
The simple consequences of these obvious teacher characteristics, as
studied in most of the investigations seem to this investigator only relovant
to provide the district personnel departments with a general dropout fore-
casting instrument solely based on teacher characteristics which assumes
the status quo, In this sense, a proposal made by Charters is understandable.
He developed a model for a teacher's separation chances in a certain time
period which was the sum of the probabilities of occurrence of various
factors inducing withdrawal from the job within that time unit. Only the
probabilities for a few of these factors from existing empirical work are
calculable. This model can, however, be completed. It might become-a
helpful working instrument In forecasting teacher separations but also can
be used by school districts and as the basis for the above simplistic
hiring policy.
But, what is there useful to learn or to infer by the district office
from the studies of teacher characteristics and teacher mobility besides an
improvement in forecasting such mobility? Are those variables such as age,
sex,marltat status, and years of experience which are strongly related to
teacher mobility also powerful criteria for determining desired school out-
comes? This question has not been raised by the studies of teacher mobility
and Is not the primary concern of the district personnel department. The
main interest of the district personnel department is to hire teachers and
to lose as few as possible. Control of school outcomes is not their major
concern.
Studies on teacher mobility have not investigated whether the better
teachers are more dropout prone than the less effective ones. Maybe the
ineffective teachers drop out so that the process of teachers staying and
dropping out is caused by some unknown Cinderella sorting. Two possible
facts are in, favor of this hypothesis. One is that the teachers' teaching
experience, at (cast over some years, increases his teaching quality.
inexperienced teachers are usually considered less good teachers than ex-
perienced ones. The other possibility is that teachers who are highly
motivated to teach surely are less prone to drop out than teachers with
Page
little motivation. Although a highly motivated teacher need not necessarily
be a good teacher, there are lots of possibilities that she maybe better
than an unmotivated teacher holding other characteristics constant. As age
and sex are not usually considered to be related to teaching performance,
we do not have any more evidence about the relation of teacher mobility
to teaching performance.
To summarize, studies which focus only on t.-acher characteristics like
age, sex, marital status, years of experience, and race and their relations
to teacher mobility are exclusively useful in giving a general forecast for
the district personnel department on teacher mobility. Only if they simul-
taneously consider criteria for teaching quality can they be relevant to
the individual teacher hiring process. This means that only when teaching
quality is equal, might a district be more prone to hire a male than a
female married teacher, or decide upon the age or years of experierice.
But the major background for these investigations was the problem of filling
teaching positions. So nearly all studies were carried out at the level of
the school district as the hiring agency, taking the teacher as the unit of
analysis without consideration of teaching quality and school characteristics.
In the middle sixties educational policy began to be concerned about
equ .1 distribution of educational resources. Unequal distribution of educa-
tional services was not only found between districts, but also within dis-
tricts, varying from school to school with schools in low-income areas
receiving a considerably smaller share than many schools in white suburban
neighborhoods. The general focus on the schoo! revealed differences in
teacher staff characteristics between low-income and middle class schools.
Only a few studies on teacher mobility, taking the school as the unit of
analysis, have been carried out since then. And those had controversial
results. Some report much higher teacher mobility In low income schools
which is partly due to biased teacher assignment as young, more drop-out
prone teachers are more often assigned to low-Income schools. Other studies
found no differences in teacher mobility between low-income and middle class
schools.
Several investigatOrs have argued that teacher nobility in low- income
schools is lowered for two reasons:
(1) Poorer teachers, who have not had a chanceto transfer to middle
Page 4
class schools, adapt to the situation and remain.
(2)Teachers in ethnic minority groups who, in large number, are
assigned to schools of the same ethnic group, do not have a chance to
transfer to middle class white schools and therefore stay In these
schools. This has been reported specifically for Black schools and
Black teachers. Some studies report that Black teachers on the average
are less well trained than white teachers and are more dissatisfied in
their Jobs in low Income schools. Thus teacher mobility might be In-
fluenced through the district assignment and transfer policy which can
discriminate against certain types of teachers and schools. This might
result in a lower teacher turnover rate on the whole although at the
same time it might perpetuate vnegual educational services among schools.
This argument implies that teachar mobility Is only one variable in
the evaluation of students' educational resources and that it is very
important to study the teachers moves among schools and not just districts;
'In order to evaluate some aspects of the student's educational situation.
This task becomes more prominant when we consider a hypothesis originally
proposed by Becker (1952), saying that teachers tend to move from low
income to middle ciass schools during their teaching careers. If this
is true, then, low income schools would'always have many more young in-
experienced teachers than middle class schools. But again, little empiri-
cal data are available.
Many of the studies of school characteristics fall to objectively
Investigate the Impact of school characteristics on teacher mobility, as
they have been to a considerable degree based on teacher surveys and not
on actual school data.
There have been policy recommendations, however, ask'ng for smaller
class sizes, specific kinds of teacher training, and additional instruct-
ional materials for low-income schools which have been supported*by
studies focusing on student achievement rather than teacher mobility in
these schools. Teacher mobility studies at the district level Indicate
disadvantages for rural areas, small districts, and poor districts.
Now, we are facing the situation of decreasing student enrollment,
decreasing school district budgets, and a surplus of teachers. Some
school districts because of their financial situation, only hire young
Page S
inexperienced teachers because they cost less. Are these inexperienced
teachers now predominately in the districts' low-income schools? Now
under the situation of teacher surplus, do we find different patterns
of teacher mobility compared to the times of high teacher demand?
Does this situation now reduce differences in teacher staff charcacteristics
between low income and middle class schools? Are there relationships
between teacher and school characteristics and teacher mobility? We will
attempt to answer these. questions in a new empirical study, some of whose
result we will present here after clarifying the concept of teacher
mobility and defining a model for the relation between teacher, school,
district, and other factors and teacher mobility.
2. The Concept of Teacher Mobility and A Model for Its Investigation
The de facto unequal distribution of educational resources and
services among districts and even within them focuses attention
necessarily on the school as the educational unit'with respect to teacher
mobility. As teacher mobility above a certain rate is probably disruptive
to the educational climate of the school and might have an impact on the
outcome of schooling, it is important not only to study mobility rates but
to also investigate different kinds and to search for the factors in-
fluencing teacher mobility as well as those factors which are influenced
by it. Only then will we be able to give specific and relevant recommen-
dations to districts and seaols which might be effective in improving
the educational situation of pupils.
Page 6
The teacher mobility variable maybe defined as the probability of
a teacher leaving a school in which she or he teaches within a specified
period of time. I will divide this general concept into subcategories
according to the kinds of moves a teacher makes.
(1) Separation: a) Retirementpisease; A teacher leaves her teaching
position at a school after she reaches the retirement age or dies. Al-
though one might expect on the first glance that these factors are some-
thing like "natural constants" this is only true, to a limited extent,
on the individual level. At the school level the rate of retirement
depends on the age distribution of the teachers in the school which is
itself dependent on the growth of the district in the past forty years,
,n characteristics affecting teacher mobility within that time period,
such as district hiring policies, current factors such as rules for
retirement, the general and individual economic situation, and
charadteristics of the specific school.
(b) Resignation: A teacher leaves her teaching position at a school
and terminates her employment with the school district. She might
take a teaching or non-teaching position in another district, or take
a job outside education including that of housewife. Termination of
employment is the most widely studied subcategory in the previous
research on teacher mobility. It remains to be shown whether the major
causes are indeed the individual teacher characteristics which were
assumed in most of the earlier studies.
(2) Leave of Absence: A teacher leaves her teaching position at a school
for a specified time peri:d. This does not imply that after that period
she necessarily returns to the same position in the same school nor does
it mean that she necessarily will return to teaching at all. A specific
leave of absence might be prolonged. , or followed by resignation or retire-
ment. But teachers on leave remain, during that time period, employees
of the district although generally without salary.
Page 7
(l) Transfer: Transfer is defined as a teacher leaving her position
at a particular school in order to take the same kind of position at
another school within the same district. Thus transfers to other
districts are excluded her and are included under resignation. A
teacher who transfers is still, clearly, an employee of the same school
district. This aspect of teacher mobility has been only rarely studied.
(4) Promotion: A teccher moves to a non-classroom teaching position
with higher salary within the district. These are usually moves from
classroom teaching to a teaching specialist's position or to supervisory
and administrative positions such as principalships or positions within
central office administration. Because of the normal hierarchical
structure the rates will'be small compared to those in the other sub-
categories. When these kinds of moves occur to other districts they
are excluded here and included in the category of resignation.
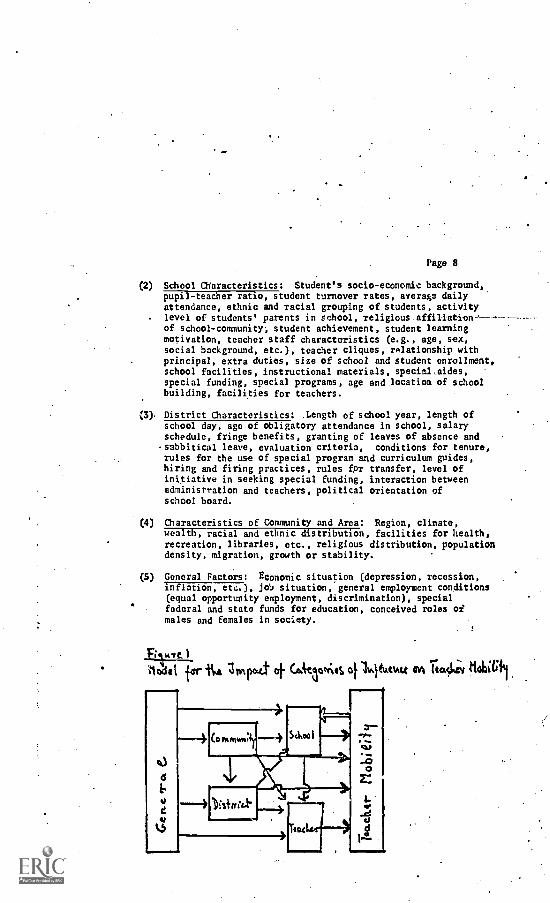
The definitions and categorisations of teacher mobility given above
are oriented towards teacher mobility within a district taking the school
as the unit of analysis. Many factors can be conceived as being related
to teacher mobility. Below illustrative examples of these are grouped
and the causal relations between those groups of factors and teacher mobility
which seem to have the strongest and most direct effects are shown in
the model (Figure 1).
(1) Teacher Characteristics: Age, sex, ethnic or racial group,marital status (if married, spouse's profession and income)number and age of children, health condition, degree heldand special' credentials, level of teaching (kindergarten,elementary, junior high, and high school), years of experience,motivation fog teaching, career orientation, religiousaffiliation, political and social view, distance betweenteacher's hoee and school.
Page 8
(2) School Characteristics: Student's socio-economic background,pupil-teacher ratio, student turnover rates, average dailyattendance, ethnic and racial grouping of students, activitylevel of students' parents in school, religious affiliation-- ------.of school-community, student achievement, student learningmotivation, teacher staff characteristics (e.g., age, sex,social background, etc.), teacher cliques, relationship withprincipal, extra duties, size of school and student enrollment,school facilities, instructional materials, special aides,special funding, special programs, age and location of schoolbuilding, facilities for teachers.
District Characteristics: Length of school year, length ofschool day, age of obligatory attendance in school, salaryschedule, fringe benefits, granting of leaves of absence andsubbitical leave, evaluation criteria, conditions for tenure,rules for the use of special program and curriculum guides,hiring and firing practices, rules fpr transfer, level ofinitiative in seeking special funding, interaction betweenadministration and teachers, political orientation ofschool board.
(3).
(4) Characteristics of Community and Area: Region, climate,TiFiTTETracial and ethnic distribution, facilities for health,recreation, libraries, etc., religious distribution, populationdensity, migration, growth or stability.
(5) General Factors: Economic situation (depression, recession,inflation, etc.), job situation, general employment conditions(equal opportunity employment, discrimination), specialfederal and state funds for education, conceived roles ofmales and females in society.
Aohot ior 114 1ovt.tt of CcAtrits of 14EktAtct ovt Ttack; &WW1.

Page 9
I will just briefly explain the model with a few *samples such
Illustrate only the prevailing directions of influence.
The general factors influence all other groups of factors and
teacher mobility through them. The economic situation in general will
effect the magnitude of educational resources and thus the job situation.
Political issues such as the zero population growth movement influence
student enrollment and the job situation. factors like these can easily
be seen as having an effect on the community. the indivi:Jal school
district and school, and on the teachers, all of which his*. in turn,
as we will see, an impact on teacher mobility.
Community_characteristics influence school district policy and
administration but also directly the schools, teacher characteristics and
teacher mobility. Industry, climate, cultural facilities, for example.
each attract certain kinds of people. Industrial growth might cause
heavy inmigration, closing down of an industry out migration. These
events affect teacher mobility tilrectly by decreasing or increasing
' numbers of students, Lut also indirectly through the school district's
financial sitalon which is tepatident on the wealth of the community,
and which, ia turn, influences the teachers' salaries, the rules :or
loaves of absence, the fringe benefits, *tr.
Community characteristics also affect t4 schools directly. The
racial and socio-economic distribution of the population, which is
partly caused by the job situation. is an important determinant of the
school's pupil population which influences teacher mobility. Also
Page 10
community factors directly influence sone teacher characteristics:
certain kinds of teachersare attracted by the climate, the wealth of
the district, the housing situation, and by the racial and ethnic
attributes of the cornunity. Further, the community effects teacher
mobility directly rat1. than through the type of teacher: for
example, the crime rate in an area sight male a teacher leave.
The school district policy and administration have a very strong
impact on the schools and also directly on teacher characteristics and
teacher mobility. It affects teacher mobility directly through: its
hiring policy, its rules for tenure and leaves of absence, and its
budget allocations to individual schools. It also influences teacher
mobility through teacher characteristics in aggregate. Although the
district has of course. no influence on an individual teacher's age,
sex, etc., basically the distribution of those characteristics are
heavily determined by the district's hiring policy. Other effects of
a school district on teacher mobility are mediated through Its schools
teacher assignments to schools, special funding, desegregation policy,
s rules for transfer. For example, previous studies have indicated that
younger teachers who are more drop-out prone are more often assigned
to difficult schools.
The individual school influences teacher Characteristics on an
individual and on a group level and also teacher mobility directly.
If we look at those effects mediated through the school, it is obvious
that the district has the strongest impact of all those under consideration.

rage 11
The school district provides the rules according to which: the
school is run, the teachers and principal are assigned, and, to
some extent, by which the student population is formed. Curriculum
guides, instrutionai materials, special aides, and special funding
are subject to district rules.
School factor' as the students' socio-economic background,
racial and ethnic distribution, achievement level, discipline,
turnover and average daily attendance, are factors influencing
teacher mobility as indicated by prcrious research.
A major conceptual concern at the level of schools and teacher
characteristics is the direction of causality. This problem becomes
very relevant for general school outcomes, and more narrowly, student
achievement. The question is whether the student's low motivation
and achievement attract or repel certain kinds of teachers and thus
affect teacher mobility or whether certain teacher characteristics
partially cause low achievement of students and teacher mobility or
low achievement as a consequence of that teacher mobility.
We do know from previous research that teacher characteristics
are related to teacher mobility. We also know sh r. certain school
characteristics affect teacher mobility. furthermore, certain schools
have higher percentages of teachers with certain characteristics (age,
years of experience, sex, etc.) than others. So it is possible that
when poorer or more highly drop-out prone teachers are assigned to a
school, they might ler, student achievement. It might also be that the
average or better teachers are assigned to schools with low student
Page 12
achievement and le&ve those schools because school characteristics
such u many non-motivated and low achieving pupils make their jobs
unsatisfying. In the former case, we would expect, in longitudinal
study, that pupil achievement would decrease as a consequence of poor
teachers and h gh teacher mobility, while in the latter case, we
would expect hi%h teacher mobility as a consequence of low student
achievement. In principle, we could disentangle these influences by
means of longitudinal study. However, we would probably need a
relatively large sample of schools in order to .adjust for the influence
of other factors. Both directions of causality are probably sensible.
for the purpose of this study we divided the school characteristics
into two groups: those which are more likely to influence teacher
mobility (characteristics of the building such as age; instructional
materials and teacher aides; site and enrollment of school; socio-
economic level of students; pupil-teacher ratio; student turnover; ethnic
and racial groups of the students; principal and teacher staff character-
istics), and those which are more likely to be influenced by teacher
. mobility (student achievement; discipline problems; parents' activities;
average daily attendance, organization and communication of teachers).
One can surely question this dichotomy in some ways. It would be more
precise to indicate how much of achievement or average daily attendance
can be accounted for by teacher mobility. As we lack this precision, and
oversimplified model of causality will have to suffice.
Page 13
The assumed causal relationship between school characteristics
and teacher mobility is sometimes definitional, for example, student
enrollment and teacher-pupil ration define the size of the staff.
But there are also indirect relationships of teacher characteristics
as were discussed earlier.
We also saw earlier that teacher characteristics relevant to
teacher mobility are affected by most of the foregoing groups of factors.
However, it always seems important to differentiate between the influence
of individual teacher characteristics (age, sex, etc.), and teacher
characteristics at the district level (distribution of age, sex, etc.).
3. Objectives of the Present Study and Data Sources
Using the concept of teacher mobility with its subcategories of
separation (retirement and resignation), transfer, leave of absence, and
promotion, we will using the model explained in the previous section
attempt:
(1) to identify the relationship between a set of teachers'personal characteristics and teacher mobility;
(2) to identify the relationship between school characteristic:and teacher mobility;
(3) to identify the influence of school district, communityand general characteristics on teacher mobility;
(4) to differentiate the influence on teacher mobility ofteachers personal characteristics from those of schoolcharacteristics and district as well as communitycharacteristics.
Page 14
These questions are the major foci of the study. Questions
(1), (7), and (4) are most directly answerable within the scope of
this study which is focused on only two districts. On question (5)
this study may only shed a little light. We will attempt to answer
these questions and discuss there implications for policy decisions
on the basis of selected variables from one of the school districts
studied.
The sources of data for this study are two California school
districts (Richmond, San Jose) which have some comparable features
as well as some clearly distinct characteristics. The major data
sources were the districts' teacher files for the years 1968-69 through
1971 -72 and several state and federal reports on schools in these
districts with respect to pupil, staff, and administrative character-
istics of schools over the four year period of the study. The data
collection was carried out between February and July, 1972.
4. Methods and Techniques of Data Analysis
The major methodological prerequisite for carrying out this study
was the creation of a data file organized by school for the two urban
California school districts which contains a record for:
(1) Each school in each district containing a series of character-
istics, permanent as well as varying, for a period of four
years (1968-69 through 1971-72). Some examples of the school
Characteristics and characteristics of the pupils and
communities served by the school were: pupil's ethnic
distribution, enrollment, achievement, socio-economic
ratings of the school community, etc.

Page IS
(2) Each teacher who taught in each school during the four
year period (1968-69 through 1971-72) is characte.Hzed
by personal characteristics, permanent and varying.
Some examples of teachers' personal characteristics were:
race, sex, age, years of experience, educational level, etc.
Multiple regression analyses were performed using the individual
teacher as the unit of analysis to establish the relationship between
the teachers' personal characteristics and teacher mobility. These
regression analyses also allow the production of control variables
which summarize the influences of these characteristics on teacher
mobility. Values for these control variables were produced for every
individual in the sample. They measure the teachers' propensity to leave
the school based on their personal characteristics. These values were
averaged for all the teachers in a particular school to produce an
aggregate teacher mobility propensity measure for each school.
These control variables were used together with a set of school
characteristics thought to be relevant for teacher mobility in
regression equations which were defined using school as the unit of
analysis. These equations allow the evaluation of the effects of the
various group characteristics on teacher mobility while controlling
for personal propensity to leave on the part of the teachers in a
given school.
We will, however, first give a brief description of the school
district (San Jose) and the selected teacher and school characteristics
and their relations to teacher mobility on the basis of cross tabu-
latims and only after these basic analyses will the results of the
regrf4sion analyses be presented and discussed.
Page 16
II. Teacher Mobility in a California School District
1. Characteristics of the Area and the School District2)
San Jose (California) is situated at the south end of San
Francisco Hay. .During the last decade it was the fastest growing
major, city in the United States (population 1960: 204,196; 1970:
443,950). The income per household was with about $13,000 in 1970
one of the highest in California. The only large ethnic minority group
is Mexican4merican.
The San Jose Unified School District is, with a student popula-
tion of over 35,000, one of the nations' larger districts. It has 36
elementary and 12 secondary schools. With more than a fourth of
the student population,Mexican-Americans form a sizable minority
group, all other minority groups having about two percent or less
of the population. A high percentage of Mexican-American students
come from low income families concentrated in the inner-city 'of
San Jose. Thus the schools in the district vary widely with respect
to the racial and ethnic distribution of pupils. Teacher salaries
in California are the highest in the nation. San Jose's minimal
teachers' salaries are even above the California average minimum.
The above characteristics were selected to form a concrete background
for the analysis of teacher mobility.
2Sections 1 through 3 are condensed parts of a report: "Descriptive
Characteristics of the San Jose Unified School District." StanfordCenter for Research and Development in Teaching, Stanford University(in Production).
Page 17
2. Description of Teacher and School Variables
This study is restricted to the analysis of teacher mobility
in elementary schools (kindergarten through grade 6), as we conceive
different dynamics for elementary and secondary schools and were not
able to carry out studies on both school levels. The teacher
variables sleeted for this analysis are the following:
1) Sex
2) Age
3) Length of service in the district
4) Years of teaching experience (salary step)
S) Highest degree held
6) Professional growth measured in semester graduate units(salary class)
We further selected the following school variables:
a) Pupil enrollment
b) Percent teachers "Other white" (not: Spanish surname, Negro,Oriental, other non-white)
c) Percent pupils with Spanish surname
d) Socio-economic status of student population measured aspercent pupils receving a free lunch
Most of the variables are self-explanatory and the levels that they
assume will be clear from the tables presented later. It :teems, however,
necessary to add that years of teaching experience (4) which is one
component of the salary schedule, is only credited up to 12 years and
that professional growth (6) measured in semester graduate units, bated
at the Bachelor's degree, forms the other major component of the
salary schedule.
Page IS
With respect to the school variables it seems necessary to
explain that we selected the percentage of pupils receiving a free
lunch as the best obtainable variable to measure the socio-economic
status (d) of the student population. Also, it should be mentioned.',
that the racial and ethnic identification of teachers (b) was only
available at the level of the school.
These variables are the independent variables in our analyses,
the dependent variables being the subcategories of teacher mobility
using the following definitions:
(1) Separation (resignation and retirment): Teachers leave their
teaching job either to retire or to end their employment with
the district for any other reason such as moving, taking a
job in another district, etc.
(2) Leave of absence: A teacher remains an employee of the district
but takes a leave for three quarters of the school year or mere.
In this category we also include promotions to non - teaching jobs
because there were too few to form a separate category.
.(3) Transfer: A teacher moves from one school to another or to or
from,an assignment in the central office but continues teaching
with at least half a normal teaching lead.
(4) Atay.1 A teacher stays at the same school over.the period.
A teacher is defined as carrying at :oast half a normal teaOhing load.
TeaCharmObiIity will be 'investigated first for a two -year periods
1969/70 to 1971/72.
. .
Page 19
3. Description of the Teacher Population
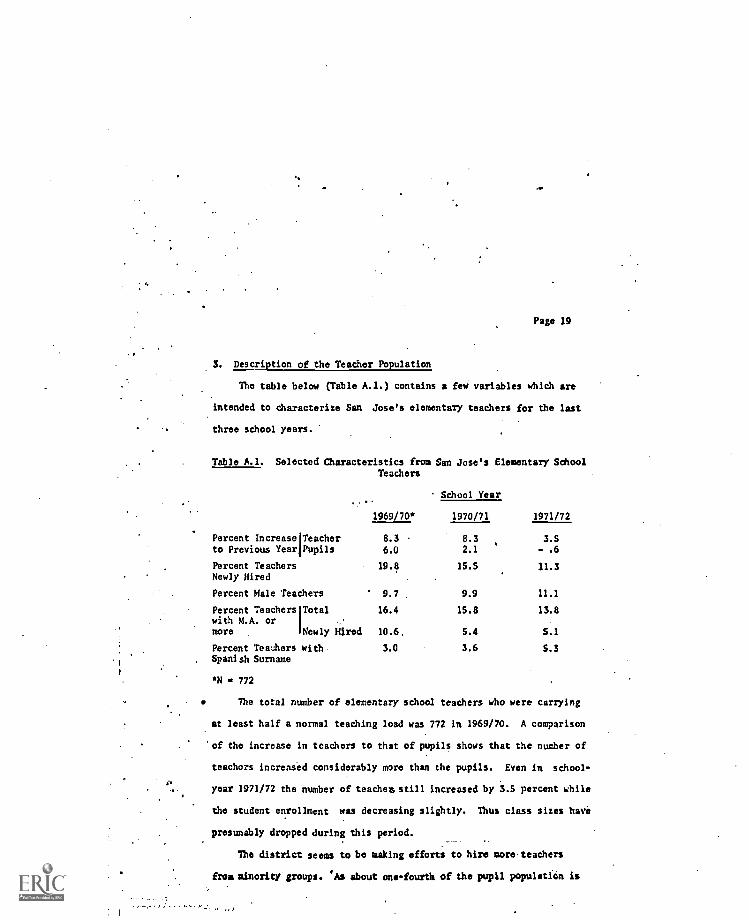
The table below (Table A.1.) contains a few variables which are
intended to characterize San Jose's elementary teachers for the last
three school years.
Table A.1. Selected Characteristics fromTeachers
1969/70
San Jose's Elementary
School Year
School
1971/721970/71
Percent Increase Teacher 8.3 8.3 3.Sto Previous Year Pupils 6.0 2.1 - .6
Percent Teachers 19.8 15.5 11.3Newly Hired
Percent Male Teachers 9.7 9.9 11.1
Percent Teacherswith M.A. ormore
Total
Newly Hired
16.4
10.6
15.8
5.4
13.8
5.1
Percent Teachers with 3.0 3.6 5.3Spanish Surname
772
The total number of elementary school teachers who were carrying
at least half a normal teaching load was 772 In 1969/70. A comparison
of the increase in teachers to that of pupils shows that the number of
teachers increased considerably more than the pupils. Even in school -
year 1971/72 the number of teaches still increased by 3.5 percent while
the student enrollment was decreasing slightly. Thus class sizes have
presumably dropped during this period.
The district seems to be making efforts to hire more teachers
from minority groups. As about one-fourth of the pupil population is
_ . .
Page 20
Mexican-American, the increase in teachers with Spanish surnames
indicates a concern for this minority group, although the percentage
of Mexican-American teachers is still low compared to that of pupils.
The percentage of teachers with a Master's degree or more is
smaller in San Jose than in the United States as a whole. It is also
decreasing. Looking at the degrees of teachers who were hired during
each of the last years, it seems that the district policy is to hire
fewer teachers with a Master's degree. Budgetary constraints could be
a reason for this. It is also obvious that the number of newly hired
teachers is decreasing. The reason for this can be multifold: fewer
teachers retire because of changes in the age distribution; or fewer
teachers resign, because of the job situation; or fewer teachers take
a leave of absence.
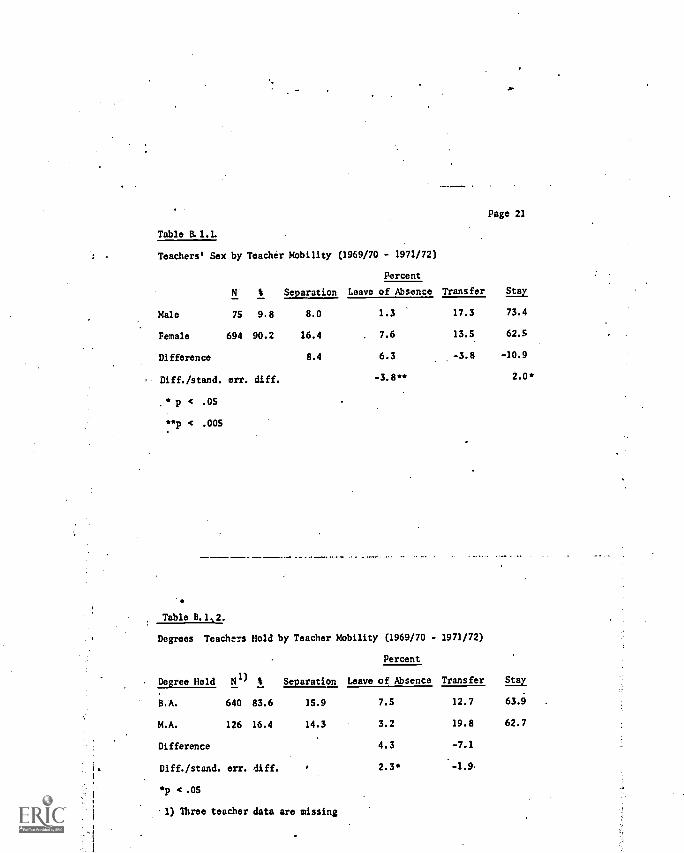
4. Zero-Order Relations Between Teacher Characteristics and TeacherMobility
Tables 8.1.1. through B.1.6. are tables of teacher mobility
rates. These tables are based on cross-tabulations of each set of
teacher mobility categories. The teacher characteristics in these
tables are identical with the list of teacher variables given above.
The rates in a particular table are not adjusted for the variables
represented in the other tables.
Page 21
Table B.1.1.
Teachers' Sex by Teacher Mobility (1969/70 - 1971/72)
Percent
N t Separation Leave of Absence Transfer Stay
Male 75 9.8 8.0 1.3 17.3 73.4
Female 694 90.2 16.4 7.6 13.5 62.S
Difference 8.4 6.3 -3.8 -10.9
Diff./stand. err. diff. -3.8** 2.0
.p < .05
p < .005
Table 8.1 2.
Degrees Teachers Hold by Teacher Mobility (1969/70 - 1971/72)
Percent
Degree Held NI) % Separation Leave of Absence Transfer Lay.
B.A. 640 83.6 15.9 7.5 12.7 63.9
M.A. 126 16.4 14.3 3.2 19.8 62.7
Difference 4.3 -7.1
Diff./stand. err. diff. , 2.3 4.9
p < .05
1) Three teacher data are missing
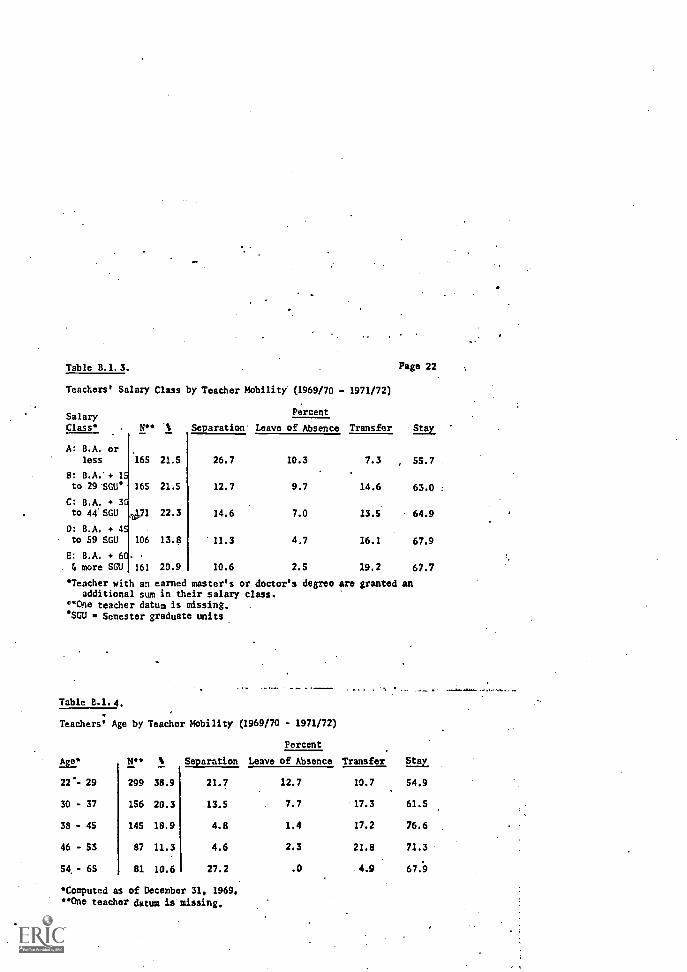
Table B.1.3.
Class
N** It
by Teacher Mobility'
Separation' Leave
(1969/70 -
Percent
1971/72)
Transfer
Page 22.
Stay
Teachers' Salary
SalaryClass* of Absence
A: B.A. orless 165 21.5 26.7 10.3 7.3 , 55.7
8: B.A.' + 15
to 29 SGU' 165 21.5 12.7 9.7 14.6 63.0
C: B.A. + 3'to 44 SGU 471 22.3 14.6 7.0 13.5 64.9
0: B.A. + 4to 59 SGU 106 13.8 11.3 4.7 16.1 67.9
E: B.A. + 6
more SGU 161 20.9 10.6 2.5 19.2 67.7
*Teacher with an earnedadditional sum in their salary
One teacher datum is missing.'SGU Semester graduate units
master's or doctor's degree are granted anclass.
Table B.1.4.
Teachers' Age by Teacher Mobility (1969/70 - 1971/72)
Percent
Re 1.1** % Separation Leave of Absence Transfer Stay
22.- 29 299 38.9 21.7 12.7 10.7 54.9
30 - 37 156 20.3 13.5 7.7 17.3 61.5
38 - 45 145 18.9 4.8 1.4 17.2 76.6
46 - 53 87 11.3 4.6 2.3 21.8 71.3
54 - 65 81 10.6 27.2 .0 4.9 67.9
*Computed as of December 31, 1969.
**One teacher datum is missing.
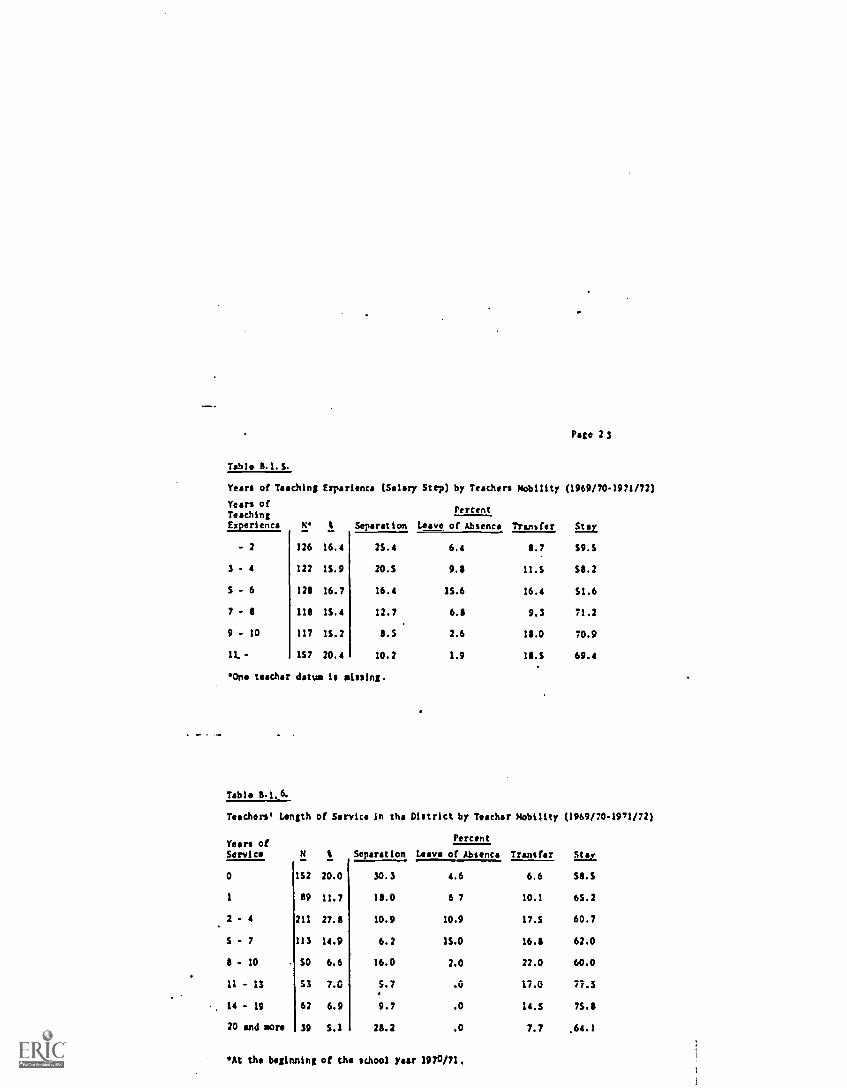
Pate 2 3
Table 8.1.3.
Years of Teaching
Years ofTeachingExperience
Experience
/4* t
126 16.4
(Salary
Separation
Step) by Teachers
Percent
Nobility
Transfer
(1969/70-1971/72)
Eat
S9.5
Leave of Absence
-2 25.4 6.4 8.7
3 - 4 122 15.9 20.S 9.8 11.5 S8.2
5 - 6 128 16.7 16.4 1S.6 16.4 51.6
7 - 8 118 15.4 12.7 6.8 9.3 71.2
9 - 10 117 15.2 8.5 2.6 18.0 70.9
11. - 157 20.4 10.2 1.9 18.5 69.4
One teacher datum is missing.
Table 8.1.6.
Teachers' Length of Service in the District by Teacher Nobility (1969/70.1971/72)
Years ofService N % Sxparation
Percent
Transfer am.Leave of Absence
0 1S2 20.0 30.3 4.6 6.6 58.5
1 89 11.7 18.0 6 7 10.1 6S.2
2 - 4 211 27.8 10.9 10.9 17.S 60.7
5 - 7 113 14.9 6.2 1S.0 16.8 62.0
8 - 10 SO 6.6 16.0 2.0 22.0 60.0
11 - 13 53 7.0 5.7 .0 17.0 77.3
14 - 19 62 6.9 9.7 .0 14.5 7S.8
20 and more 39 S.1 28.2 .0 7.7 .64.1
At the beginning of the school year 1970/71.
Page 24
S. Adjustet. Relations between Teacher Characteristics and TeacherNobility
A series of three multiple regression analyses using teachers as
the units of analysis was performed on the teacher mobility data. The
dependent variables were dichotomies representing whether or not a
teacher who was teaching in the district in 1949/70 was (a) no longer
employed, 04 on leave of absence, or (c) teaching in a different
school in 1971/72. The variables were coded "1" if the category occurred
or if the teacher remained teaching in the sane school. The independent
variables were based on the teachers' characteristics during the 1969/70
school year. These variables also took the fors of dichotomies for each
of the levels of each variable. One level of each variable was omitted
from the regression to avoid redundancy. The variables and tbeir levels
are labeled in the tables which report the unadjusted and adjusted cross
tabulations of each with teacher nobility.
The regression analyses model, used for the result! reported 10,-m.
contained main effects only and did not allow the evaluation of inter-
actions representing son-additive effects of independent variables on
teacher Nobility.
Tables 11.2.1. through 1.2.6 are based on the regression analyses
and contain estimates of the teacher mobility rates for each category of
each independent variable. These rates are adjusted for differences in
the distributions of the other ttecher characteristics between the levels
of the variable In question. These adjusted rates are fised to be st
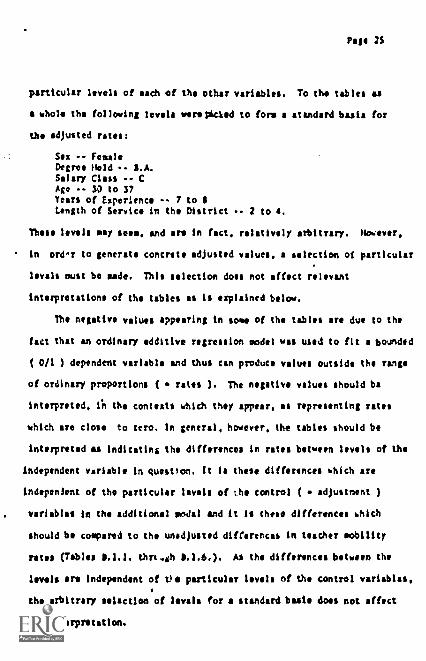
Page 2S
particular levels of each of the other variables. To the tables as
a whole the following levels were poked to form standard basis for
the adjusted rates;
Sex -- FemaleDegree Held -- S.A.Salary Class CAge 30 to 37Years of Experience -- 7 to SLength of Service in the District -- 2 to 4.
These levels may seem, and are in fact, relatively arbitrary. However,
in order to generate concrete adjusted values, a selection of particular
levels must be made. This selection does not affect relevant
interpretations of the tables as is explained below.
The negative values appearing in some of the tables are due to the
fact that an ordinary additive regression model was used to fit a bounded
( 0/1 ) dependent variable and thus can produce valves outside the range
of ordinary proportions ( rates ). The negative values should be
interpreted, in the contests which they appear, as representing rates
which are close to zero. In general, however, the tables should be
interpreted as indicating the differences in rates between levels of the
independent variable in question. tt is these differences which are
independent of the particular levels of the control ( adjustment )
variables in the additional model and it is these differences which
should be compared to the unadjusted differences in teacher mobility
rotes (Tables D.1.1. thrt.gh S.1.6.). As the differences between the
levels ere independent of tie particular levels of the control variables,
the arbitrary selection of levels for a standard basis does not affect
the interpretation.
Page 26
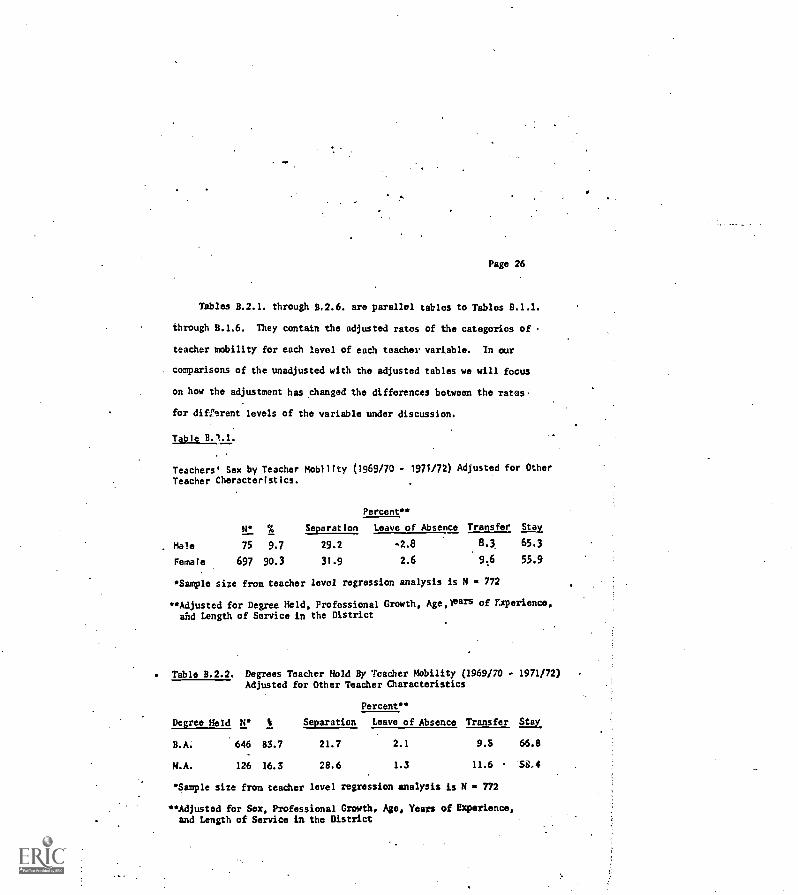
Tables B.2.1. through 8.2.6. are parallel tables to Tables B.1.1.
through 8.1.6. They contain the adjusted rates of the categories of
teacher mobility for each level of each teacher variable. In our
comparisons of the unadjusted with the adjusted tables we will focus
on how the adjustment has changed the differences between the rates
for direrent levels of the variable under discussion.
Table B.1.1.
Teachers' Sex by Teacher Mobility (1969/70 - 1971/72) Adjusted for Other
Teacher Characteristics.
Percent**
H* % Separation Leave of Absence Transfer Stay.
Male 75 9.7 29.2 -2.8 8.3. 65.3
Female 697 90.3 31.9 2.6 9.6 55.9
Sample size from teacher level regression analysis is N 772
**Adjusted for Degree Held, Professional Growth, Age,Years of Experience,and Length of Service in the District
Table B.2.2. Degrees Teacher Hold By Teacher Mobility (1969/70 - 1971/72)Adjusted for Other Teacher Characteristics
Percent**
Degree Held N % Separation Leave of Absence Transfer Stay
B.A. 646 83.7 21.7 2.1 9.5 66.8
N.A. 126 16.3 28.6 1.3 11.6 58,4
*Sample size from teacher level regression analysis is N 772
"Adjusted for Sex, Professional Growth, Age, Years of Experience,and Length of Service in the District
Page 27
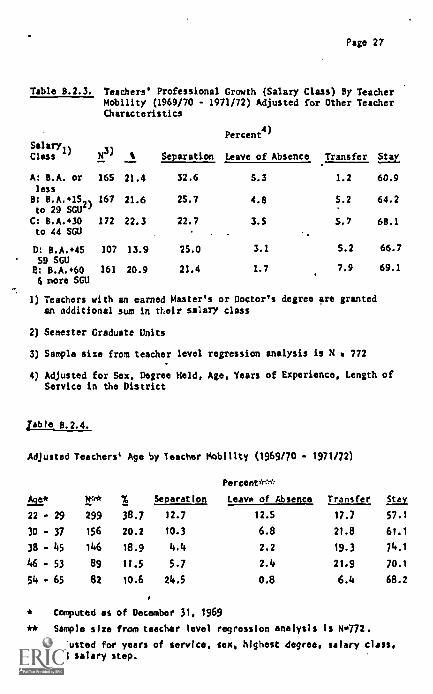
Table B.2.3. Teachers' Professional Growth (Salary Class) By TeacherMobility (1969/70 - 1971/72) Adjusted for Other Teacher
Salaryl,Class '
Characteristics
N 6 Separation
Percent4)
Leave of Absence Transfer Ste/.
A: B.A. orless
165 21.4 32.6 5.3 1.2 60.9
8: B.A..1Sto 29 SGU
2)167 21.6 25.7 4.8 5.2 64.2
C: B.A..30to 44 SGU
172 22.3 22.7 3.5 5.7 68.1
D: B.A..45 107 13.9 25.0 3.1 5.2 66.7
59 SGUE: B.A..60 161 20.9 21.4 1.7 7.9 69.1
6 more SGU
1) Teachers with an earned Master's or Doctor's degree are grantedan additional sum in their salary class
2) Semester Graduate Units
3) Sample size from teacher level regression analysis is N a 772
4) Adjusted for Sex, Degree Held, Age. Years of Experience, Length ofService in the District
21111 8.2.4.
Adjusted Teachers' Age by Teacher Mobility (1969/70 - 1971/72)
Aye* W*22 - 29 299
30 - 37 156
38 - 45 146
46 - 53 89
54 - 65 82
Computed as of December 31, 1969
** Sample size from teacher level regression analysis is 8772.
*** Adjusted for years of service, sex, highest degree, salary class,and salary step.
Percenvwe,
% Separation Leave of Absence Transfer atx
38.7 12.7 12.5 17.7 57.1
20.2 10.3 6.8 21.8 61.1
18.9 4.4 2.2 19.3 74.1
11.5 5.7 2.4 21.9 70.1
10.6 24.5 0.8 6.4 68.2
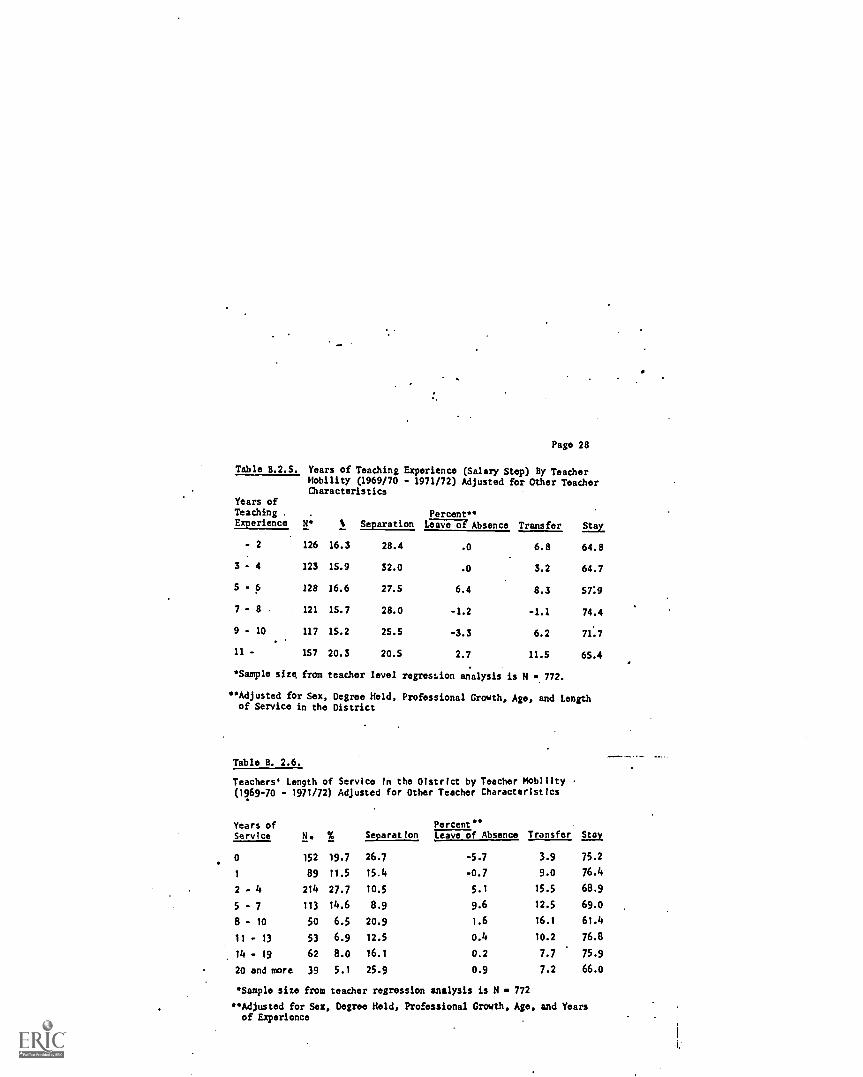
Table 8.2.5.
Page 28
Years of Teaching Experience (Salary Step) By TeacherMobility (1969/70 - 1971/72) Adjusted for Other TeacherCharacteristics
Years ofTeaching . Percent'Experience N' % Separation aiiiiOTAbsence Transfer Stay
- 2 126 16.3 28.4 .0 6.8 64.8
3 - 4 123 15.9 32.0 .0 3.2 64.7
S - 6 128 16.6 27.5 6.4 8.3 57:9
7 - 8 121 15.7 28.0 -1.2 -1.1 74.4
9 - 10 117 15.2 25.5 -3.3 6.2 71.7
11 - 157 20.3 20.5 2.7 11.5 65.4
Sample size from teacher level regression analysis is N 772.
*Adjusted for Sex, Degree Held, Professional Growth, Age, and Lengthof Service in the District
Table B. 2.6.
Teachers' Length of Service In the OistrIct by Teacher Mobility(1969-70 - 1971/72) Adjusted for Other Teacher Characteristics
Years of Percent"Service N. % Separation Leave of Absence Transfer Lax
0 152 19.7 26.7 -5.7 3.9 75.2
1 89 11.5 15.4 -0.7 9.0 76.4
2 - 4 214 27.7 10.5 5.1 15.5 68.9
5 - 7 113 14.6 8.9 9.6 12.5 69.0
8 - 10 50 6.5 20.9 1.6 16.1 61.4
11 - 13 53 6.9 12.5 0.4 10.2 76.8
14 - 19 62 8.0 16.1 0.2 7.7 75.9
20 and more 39 5.1 25.9 0.9 7.2 66.0
'Sample size from teacher regression analysis is N 772
"Adjusted for Sex, Degree Held, Professional Growth, Age, and Yearsof Experience
Page 29
Sex: M overall comparison of teacher mobility between unadjusted
and adjusted values shows that the mobility for female teachers is
higher than for males. Female teachers stay less long in a particular
school than their male colleagues, even after control for effects of
other characteristics. It is obvious, however, that the differences in
teacher mobility are considerably smaller when we controll for degree,
professional growth, age, and teaching experience, than we previously
thought. The difference between separation rates nearly disappears
after adjustment. This is unexpected, because so many previous studies
report higher drop-out rates for female than for male teachers. The
difference on transfer rate also almost disappears after adjustment.
It even changed sign. Leave of absence seems not to depend on the control
factors. The difference stays about the same after adjustment and
indicates that females take more leaves of absence than males, a fact
that is mainly caused by motherhood and the mother role. On the whole
this comparison shows that the causal factor for separation is obviously
primarily not sex but other factors, a finding which is contradictory
to most previous research.
Degree Held: On the whole it seems that teachers with a Master's
degree, even after controlling for sex, professional growth, age, and
teaching experience, are more mobile than teachers with a Bachelor's
degree. That fact that they stay less long at a particular school
than teachers with a Bachelor's degree is mainly due to their higher
separation rate. Diffe'rences in rates of leave of absence and transfer
Page 30
disappear when controlling for other factors. It might be that teachers
with a Master's degree do not plan a career as a classroom teacher and
resign in order to take other than teaching positions on the elementary
level.
Professional Growth (Salary Class): Before adjustment there was a
large difference in the separation rates of the lowest (A) and adjacent
(B) salary class level. After controlling for sex, degree held, age,
and teaching experience, this difference has shrunk considerably, but still
a higher separation rate for teachers with only the minimal teaching re-
quirements is'obvious. No difference exists among the other salary classes
and in the category of leave of absence no particular salary class seems to
have a discrepant effect. After adjustment the differences in rates for
leave of absence diminish in all salary classes. In the category of transfer
it looked, before adjustment, as if rate would be a function of salary class:
After controlling for other teacher characteristics this relation disappeari.
Most of the differences are due to other factors. The salary class thus has
effects on teachers' rate of staying at a particular school.
Age: Age is a relatively strong factor in teacher mobility. The
unadjusted as well as the adjusted rates for teachers who stay at a
particular school over more than a two year period indicate that younger
teachers leave the school at considerably higher rate. When we ask where
these teachers go, it becomes clear that younger teachers have higher drop-
out rates although the difference shrinks very such after adjustment for
sex, degree held, salary class, and teaching experience. Also a higher
Page 31
percentage of younger teachers take leaves of absence. Further, age
has an effect on transfer independent of other factors. On the whole,
it is obvious that age has an effect on teacher mobility but it is
also correlated with other effective factors. Clearly age is the
only factor for separation for older teachers. The discrepancy in
separation rate at the ages of S4 to 6S is not affected by adjustment.
Separation in this age group is solely due to retirement.
Years of Experience (Salary Step): Looking at the category of
stay a large difference exists between the levels of S to 6 and 7
to 8 years of teaching experience. The steady decrease in separation
rate as a functioning of years of experience practically disappears
after adjustment for the other factors. The increase and subsequent
decrease in leave rates becomes less extreme after adjustment. This
effect was accentuated in the uncontrolled rates by the other factors.
The increase in transfer rates which occurs up to six years which
might have originally been attributed to seniority disappears after
adjustment. The anomalous depression in transfer rate at 7 to 8 years
of experience remains after adjustment.
Length of Service in the District: There are no systematic
detectable differences in patterns in separation, leave of absence,
and transfer up to 19 years of serve in the district. However, the
cumulative effects of small differences in these categories become
apparent in the staying rates. After adjustment there is only a small
difference in staying rate between zero and two years of service in the
Page 32
district. The difference, however, between 5 to 7 and 8 to 10 yens of
service increases somewhat. The twenty or more years of service category
becomes much different from the others after adjustment. The different
adjustment rate of separation is nine points higher than the unadjusted
difference when we compare the separation rate for this level with
the preceeding one. This may be due to differences in retirement benefits
depending on years of service in the district.
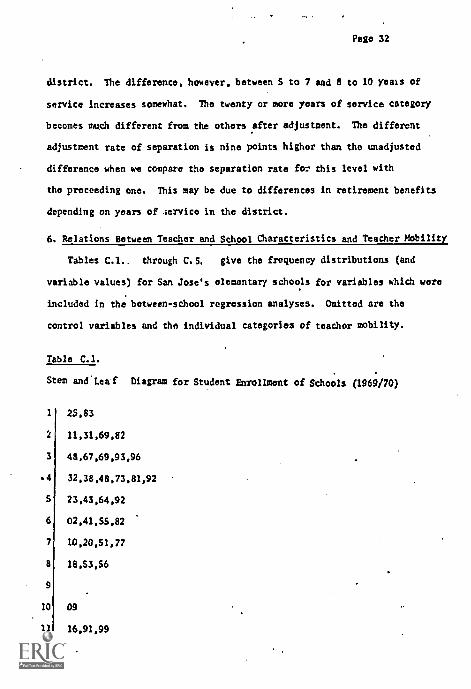
6. Relations Between Teacher and School Characteristics and Teacher Mobility
Tables C.1.. through C.5. give the frequency distributions (and
variable values) for San Jose's elementary schools for variables which were
included in the between - school regression analyses. Omitted are the
control variables and the individual categories of teacher mobility.
Table C.1.
Stem and.Leaf Diagram for Student Enrollment of Schools (1969/70)
1 25,83
2 11,31,69,82
3 48,67,69,93,96
.4 32,38,48,73,81,92
5 23,43,64,92
6 02,41,55,82
7 10,20,51,77
8 18,53,56
9
10 09
11 16,91,99
Page 33
s.1
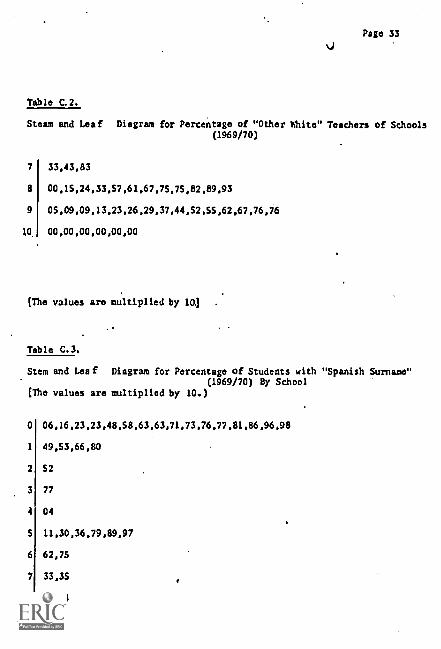
Table C.2.
Steam and Leaf Diagram for Percentage of "Other hhite" Teachers of Schools(1969/70)
7
a
9
10.
33,43,83
00,15,24,33,57,61,67,75,75,82,89,93
05,09,09,13,23,26,29,37,44,52,55,62,67,76,76
00,00,00,00,00,00
[The values are multiplied by 10.E .
Table C.3.
Stem and Leaf Diagram for Percentage of Students with "Spanish Surname"(1969/70) By School
[The values are multiplied by 10.)
0
1
2
3
4
5
6
7
8
9
06,16,23,23,48,58,63,63,71,73,76,77,81,86,96,98
49,53,66,80
52
77
04
11,30,36,79,89,97
62,75
33,35
64,64
43
Page 34
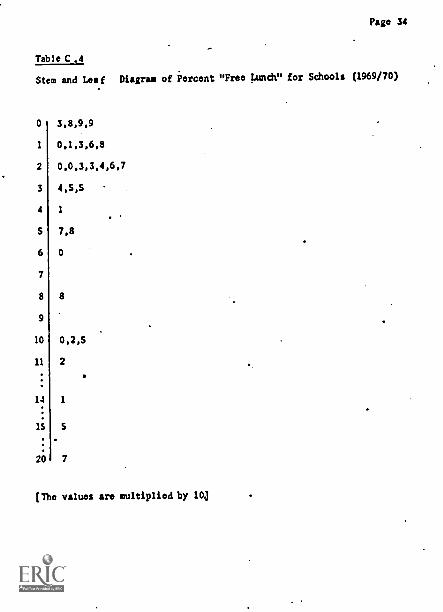
Table C.4
Stem and Leaf Diagram of Percent "Free Lunch" for Schools (1969/70)
0
1
2
3
4
S
6
7
8
9
10
11
14
IS
20
3.8,9,9
0.1,3,6.8
0,0,3,3,4,6,7
4,S,S
1
7.8
0
8
0.2,5
2
I
S
7
(The values are multiplied by 10.]
Page 35
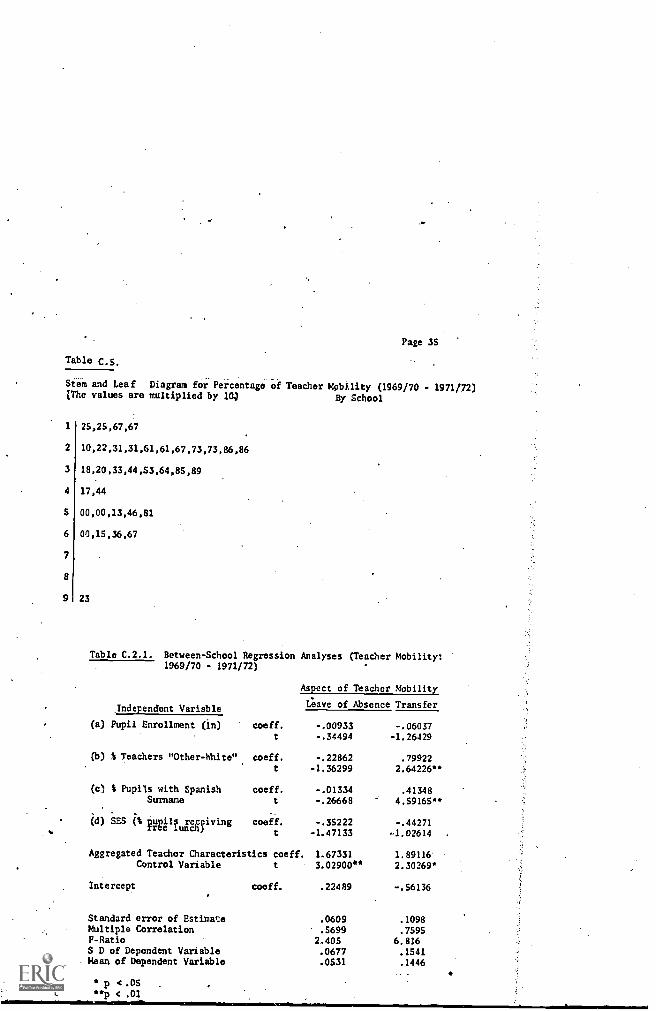
Table C.S.
Stem and Leaf Diagram for Percentage of Teacher Mobility (1969/70 - 1971/72)[The values are multiplied by 104 By School
1
2
3
4
S
6
7
8
9
25,25,67,67
10,22,31,31,61,61,67,73,73,86,86
18,20,33,44,53,64,85,89
17,44
00,00,13,46,81
00,15,36,67
23
Table C.2.1. Between-School Regression Analyses (Teacher Mobility:
Aspect of Teacher Mobility
1969/70 - 1971/72)
,Independent Variable Leave of Absence Transfer
: coeff. -.00933 -.06037(a) Pupil Enrollment (in)
t -.34494 -1.26429
(b) % Teachers "Other-White" coeff. -.22862 .79922t -1.36299 2.64226
(c) t Pupils with Spanish coeff. -.01334 .41348Surname -.26668 4.59165
.
(d) SES (% pygl!ungiving coeff. -.35222 -.44271t -1.47133 -1.02614
Aggregated Teacher Characteristics coeff. 1.67331 1.89116Control Variable t 3.02900 2.30269
Intercept coeff. .22489 -.56136
Standard error of Estimate .0609 .1098Multiple Correlation .5699 .7595P-Ratio 2.405 6.816S D of Dependent Variable .0677 .1541Mean of Dependent Variable .0531 .1446
p < .05< .01
fsge 36
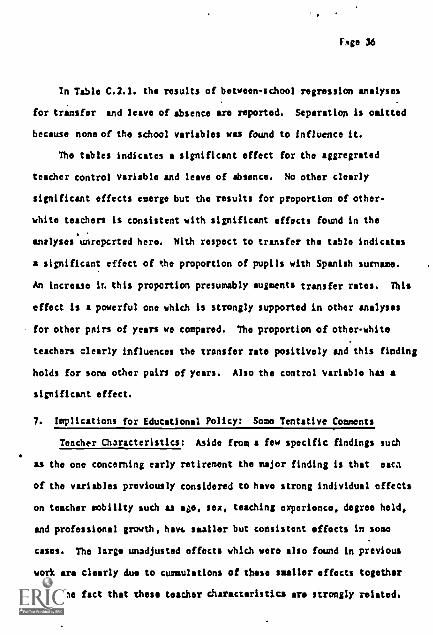
In Table C.2.1. the results of between-school regression analyses
for transfer and leave of absence are reported. Separation is omitted
because none of the school variables was found to Influence it.
The tables indicates a significant effect for the aggregrated
teacher control variable and leave of absence. No other clearly
significant effects emerge but the results for proportion of other-
white teachers is consistent with significant effects found in the
analyses unreperted here. With respect to transfer the table indicates
a significant effect of the proportion of pupils with Spanish surname.
An increase ir. this proportion presumably augments transfer rates. This
effect is a powerful one which is strongly supported in other analyses
for other pairs of years we compared. The proportion of other-white
teachers clearly influences the transfer rate positively and this finding
holds for some other pairs of years. Also the control variable has a
significant effect.
7. Implications for Educational Policy: Some Tentative Comments
Teacher Characteristics: Aside from a few specific findings such
as the one concerning early retirement the major finding is that eaca
of the variables previously considered to have strong individual effects
on teacher mobility such as age, sex, teaching experience, degree held,
and professional growth, have smaller but consistent effects in some
cases. The large unadjusted effects which were also found in previous
work are clearly due to cumulations of these smaller effects together
with the fact that these teacher characteristics are strongly related.
Page 57
That is, it is reasonable to say that a young inexperienced female
teacher has a higher probability of leaving the school because each of
the variables, age, sex, and teaching experience makes a sep
small contribution to teacher mobility. The district policy should,
however, consider teacher characteristics separately and in terns of
their individual degrees of impact on teacher mobility uncontaminated
by the influences of other variables. Only in this way will decision
processes be based on the causal structure of teacher mobility.
An example of an issue of concern is the fact that teachers who
hold Master's degrees have higher sews,. t rates than teachers wits
Bachelor's degrees. If this implies that more effective teachers 141i
be leaving tho district at a higher rate then the reasons for this must
be clearly explicated in order to form a sound basis for district
policy.
School Characteristics: The major finding for school characteristics
is that, therm are systematic influences on aspects of teacher mobility
after adequate control for the differences in the distribution of teacher
Characteristics from school to school. It is interesting that the
school characteristics -- school site and a cluster of SES characteristics --
have no detectable systematic impact on teacher separation. If this
finding is supportLI in other districts and other years it has important
implications for teacher assignment policies. It could be due, however,
in this case to lack of power in the statistical test. Zero-order
relations between the SES characteristics of the schools and separation
rate have the expected sign configurations, but the sample site (N.151)
is not sufficient for statistical significance.
Page 38
The findings suggest that there are relations between the social
composition of the school and leave of absence and transfer rates.
More refined interpretations, however, will have to await confirmatory
analyses in other years and in our other district.