Embed Size (px)
Citation preview
NCES 2011-348 U.S. DEPARTMENT OF EDUCATION
Documentation to the NCES Common Core of Data Public Elementary/ Secondary School Universe Survey: School Year 2009–10 Version 1a
Documentation to the NCES Common Core of Data Public Elementary/Secondary School Universe Survey: School Year 2009–10 Version 1a April 2011 Chen-Su Chen National Center for Education Statistics Jennifer Sable Lindsey Mitchell Education Statistics Services Institute – American Institutes for Research Fei Liu Education Statistics Services Institute – MacroSys LLC
NCES 2011-348 U.S. DEPARTMENT OF EDUCATION
U.S. Department of Education Arne Duncan Secretary
Institute of Education Sciences John Q. Easton Director National Center for Education Statistics Jack Buckley Commissioner
Elementary/Secondary & Libraries Studies Division Jeffrey Owings Associate Commissioner
The National Center for Education Statistics (NCES) is the primary federal entity for collecting, analyzing, and reporting data related to education in the United States and other nations. It fulfills a congressional mandate to collect, collate, analyze, and report full and complete statistics on the condition of education in the United States; conduct and publish reports and specialized analyses of the meaning and significance of such statistics; assist state and local education agencies in improving their statistical systems; and review and report on education activities in foreign countries.
NCES activities are designed to address high-priority education data needs; provide consistent, reliable, complete, and accurate indicators of education status and trends; and report timely, useful, and high-quality data to the U.S. Department of Education, the Congress, the states, other education policymakers, practitioners, data users, and the general public. Unless specifically noted, all information contained herein is in the public domain.
We strive to make our products available in a variety of formats and in language that is appropriate to a variety of audiences. You, as our customer, are the best judge of our success in communicating information effectively. If you have any comments or suggestions about this or any other NCES product or report, we would like to hear from you. Please direct your comments to
NCES, IES, U.S. Department of Education 1990 K Street NW Washington, DC 20006-5651
April 2011
This report was prepared for the National Center for Education Statistics under Contract No. ED-CO-0044 with American Institutes for Research. Mention of trade names, commercial products, or organizations does not imply endorsement by the U.S. Government.
This publication is only available online. To download, view, and print the report as a PDF file, go to the NCES World Wide Web Publications and Products address shown above. Suggested Citation
Chen, C., Sable, J., Mitchell, L., & Liu, F. (2011). Documentation to the NCES Common Core of Data Public Elementary/Secondary School Universe Survey: School Year 2009–10 (NCES 2011-348). U.S. Department of Education. Washington, DC: National Center for Education Statistics. Retrieved [date] from http://nces.ed.gov/pubsearch/pubs.info.asp?pubid=2011348. Content Contact Chen-Su Chen 202-502-7393 [email protected]
Contents Page
List of Tables……………………………………………………………………………………..iv
I. Introduction to the NCES Common Core of Data Public Elementary/Secondary School Universe Survey: School Year 2009–10, Version 1a ................................................................1
II. User’s Guide ..............................................................................................................................3
A. Methodology .........................................................................................................................3
B. User Guidelines for Processing the Public Elementary/Secondary School Universe Survey Data Files ................................................................................................................17
C. Guidelines for Using the Flat ASCII Data File ...................................................................17
Appendixes
Appendix A—Record Layout for the Common Core of Data Public Elementary/Secondary School Universe Survey: School Year 2009–10 ................................................. A-1
Appendix B—Value Distribution, Field Frequencies, and Data Tables for the Common Core of Data Public Elementary/Secondary School Universe Survey: School Year 2009–10................................................................................................................B-1
Appendix C—Glossary for the Common Core of Data: School Year 2009–10 ..........................C-1
Appendix D— State Notes for the Common Core of Data: School Year 2009–10 .................... D-1
iii
iv
List of Tables
Table Page
1. American National Standards Institute (ANSI) state codes and abbreviations used in CCD datasets .....................................................................................................................................15
2. List of schools with mailing address in another state: School year 2009–10 ..........................16
B-1. Distribution of responses of character variable data, by response value: School year 2009–10................................................................................................................................ B-3
B-2. Minimum, maximum, and mean for continuous variables, by variable: School year 2009–10................................................................................................................................ B-4
B-3. Frequencies of categorical variables: School year 2009–10 .............................................. B-11
B-4. Number of operating public elementary and secondary schools, by school type, charter, magnet, Title I and Title I schoolwide status, and state or jurisdiction: School year l2009–10 ............................................................................................................................. B-15
B-5. Number of students in membership in operating public elementary and secondary schools, by school type, charter, magnet, Title I and Title I schoolwide status, and state or jurisdiction: School year 2009–10 ................................................................................. B-17
B-6. Median student/teacher ratio for regular operating public elementary and secondary schools with membership, by instructional level and state or jurisdiction: School year 2009–10.............................................................................................................................. B-19
B-7. Average student membership size of regular operating public elementary and secondary schools with membership, by instructional level and state or jurisdiction: School year 2009–10 .......................................................................................................... B-21
B-8. Number of operating city, suburban, town, and rural public elementary and secondary schools with membership and percentage distribution of student membership in these schools, by state or jurisdiction: School year 2009–10 ...................................................... B-23
D-1. States with missing or not applicable values for all records in the Common Core of Data (CCD) Public Elementary/Secondary School Universe Survey, by variable: School year 2009–10 .......................................................................................................... D-3
D-2. States with missing or not applicable values for all records in the Common Core of Data (CCD) Local Education Agency (LEA) Universe Survey, by variable: School year 2009–10.............................................................................................................................. D-9
D-3. States with missing or not applicable values for all records in the Common Core of Data (CCD) State Nonfiscal Survey of Public Elementary/Secondary Education, by variable: School year 2009–10 ......................................................................................... D-14
D-4. Local education agency identification numbers (LEAID) used in the Common Core

v
Public Schools district: School year 2009–10 ................................................................. D-24
1
I. Introduction to the NCES Common Core of Data Public Elementary/Secondary School Universe Survey: School Year 2009–10, Version 1a The Common Core of Data (CCD) nonfiscal surveys consist of data submitted annually to the National Center for Education Statistics (NCES) by state education agencies (SEAs) in the 50 states, the District of Columbia, Puerto Rico, the four U.S. Island Areas (American Samoa, Guam, the Commonwealth of the Northern Mariana Islands, and the U.S. Virgin Islands), the Department of Defense (DoD) dependent schools (overseas and domestic), and the Bureau of Indian Education (BIE). In order to provide data comparable across states to the maximum extent feasible, NCES and SEAs have worked since the 1950s to develop and accept common data items and definitions. SEAs report school-, agency-, and state-level education data for the CCD through the U.S. Department of Education’s EDFacts collection system. CCD survey staff1 edits the data to produce a clean data file, which NCES uses to construct general-purpose publications and specialized reports. The principal users of CCD nonfiscal data are the federal government; the education research community; state and local government officials, including school boards and local education agency (LEA) administrators; and the general public. The purpose of the CCD nonfiscal surveys is to provide a listing of all schools and agencies providing free public elementary and secondary education, along with basic descriptive statistical information on each school and agency listed. The CCD includes all settings in which free public education is provided to children. However, some SEAs do not provide information on education outside of the traditional public school system—such as schools in correctional facilities or hospitals—while others do provide this information. In the 2009–10 CCD Public Elementary/Secondary School Universe Survey, there are 103,959 records—one for each public elementary and secondary school in the 50 states, the District of Columbia, Puerto Rico, the four U.S. Island Areas, the DoD schools (overseas and domestic), and the BIE. Schools coded as being open in the 2008–09 file, but coded as closed in the 2009–10 file (2,137 schools), will be kept on the file for one year, and then removed (i.e., they do not appear in files for subsequent years).2 Closed schools are indicated by a value of ‘2’ for the variable STATUS09. Excluding closed schools, there were 101,822 schools on the 2009–10 file—including new, added, changed agency, inactive, future, and reopened schools. Of these 101,822 schools, 91,522 are regular elementary and secondary, 2,123 are special education, 1,457 are vocational/technical, and 6,720 are other/alternative schools. The DoD dependent schools (overseas and domestic), American Samoa, and Guam did not report data for the 2009–10 school year. Their school universes were based on information from the SEAs’ websites3 and all the other data items were left as missing. 1 CCD survey staff collectively refers to staff that are employed by NCES as well as staff who are employed by other organizations who perform collection, editing, and processing tasks on behalf of NCES. For 2009–10 these organizations included staff at the U.S. Census Bureau and the American Institutes for Research. 2 Includes 301 reportable programs that were incorrectly reported as schools in 2008–09. For more information, see the discussion of reportable programs as part of “TYPE09” in Comments About the Variables. 3DDESS: http://www.am.dodea.edu//ddessasc/districts/schools.html DODEA Pacific –Guam: http://www.guam.pac.dodea.edu/ American Samoa: http://www.doe.as/index.jsp Guam: http://www.gdoe.net
The CCD system is designed to be inclusive rather than exclusive. Thus, CCD files contain a substantial number of records representing administrative and operating units that are unlike typical public schools and school districts—for example, schools or districts without students and special education schools. In 2009–10, 10 percent of all open schools were unlike typical schools (nontypical schools are types 2, 3, or 4)4 and 24 percent of all open school districts were unlike typical districts (nontypical districts are type 3, 4, 5, 6, 7, or 8).5 The CCD system provides features that enable the data provider and the data user to identify and select records according to the categories of interest to them. Definitions and categories used in the CCD are deliberately generic so that they may accommodate many and varied organizational structures used in the provision of public elementary and secondary education across the nation. The Public Elementary/Secondary School Universe file includes data for the following variables: NCES school ID number, state school ID number, name of the school, name of the agency that operates the school, mailing address, physical location address, phone number, school type, operational status, locale code, latitude, longitude, county number, county name, full-time-equivalent (FTE) classroom teacher count, low/high grade span offered, Congressional district code, school level, free lunch eligible students, reduced-price lunch eligible students, total free and reduced-price lunch eligible, student totals and detail (by grade, by race/ethnicity, and by sex), and pupil/teacher ratio. The file also contains flags indicating whether a school is Title I eligible, schoolwide Title I eligible, a magnet school, a charter school, a shared time school, a BIE school6, and whether student counts by race/ethnicity were reported by five or seven racial/ethnic categories. The remainder of this document contains a user’s guide and four appendixes. The user’s guide contains information on CCD methodology, including certain conditions that are unique to this data file.
• Appendix A—Record Layout gives the variable names and labels of the data elements discussed throughout the documentation, as well as their location in the data file.
• Appendix B—Value Distribution, Field Frequencies, and Data Tables indicates the
minimum, maximum, and mean values for each continuous variable as well as the frequency,
4 Type codes for schools are as follows: 1—regular school; 2—special education school; 3—vocational school; and 4—other/alternative school. 5 Type codes for school districts are as follows: 1—local school district that is not a component of a supervisory union; 2—local school district that is a component of a supervisory union sharing a superintendent and administrative services with other local school districts; 3—supervisory union administrative center, or a county superintendent serving the same purpose; 4—regional education services agency, or a county superintendent serving the same purpose; 5—state-operated institution charged, at least in part, with providing elementary and/or secondary instruction or services to a special-needs population; 6—federally operated institution charged, at least in part, with providing elementary and/or secondary instruction or services to a special-needs population; 7—charter school agencies; and 8—other education agencies that do not fit into the first six categories. 6 Starting with the 2009–10 school year, the variable “BIES09” was added to the school file to indicate a state-reported school that was also reported by the Bureau of Indian Education.
2
• Appendix C—Glossary defines all of the CCD data items.
• Appendix D—State Notes provides comments for data users on individual states.
II. User’s Guide A. Methodology The EDFacts data collection system is the primary collection tool for the CCD. NCES works collaboratively with the Department of Education’s Performance Information Management Service to develop the CCD collection procedures and data definitions. Coordinators from State Education Agencies (SEAs) submit the CCD data at different levels (school, agency, and state) to the EDFacts collection system. Prior to submitting CCD files to EDFacts, SEAs must collect and compile information from their respective Local Education Agencies (LEAs) via established administrative records systems within their state or jurisdiction. Once SEAs have completed their submissions, the CCD survey staff analyzes and verifies the CCD for quality assurance. CCD survey staff routinely verified data through SEA coordinators and did not contact LEAs or individual schools to verify data except in unusual circumstances. After performing edit and consistency checks, CCD survey staff referred discrepancies to SEA coordinators for resolution. It is CCD policy to accept the judgment of the respondent unless there is a clear conflict or unacceptable inconsistency. In the context of the CCD, a school is an organization composed of students and staff.7 The CCD school definition recognizes that this organization may encompass several locations but must have a single contact point, which is the mailing address entered on the CCD school record. There may be situations in which students are attending two schools at the same time (e.g., a regular school and a vocational school). In these situations, the student is counted where he/she receives education for the majority of the time. States report data to the EDFacts collection system through multiple file groups that are submitted on a reporting schedule at different dates throughout the year. The 2009–10 school year EDFacts collection of CCD submissions opened in January 2010. NCES extracted data from EDFacts between April 29th, 2010 and January 3rd, 2011. CCD processed these file groups on a flow basis, so the date of the extract for each file group and each state may vary depending on when SEAs completed their submission for each file group. Once a file group was edited and verified for a particular state, CCD survey staff did not continue to incorporate late reports or updates unless these late reports or updates resulted in a major change of the reported data. Late reports or updates from SEAs may be included in subsequent file releases. 7 Schools in the CCD may have no reported enrollment but still serve students because students can only be reported among the membership of one school. For example, a vocational school may serve students who are dually enrolled in a regular school and the regular school reports their membership. This vocational school serves students, but would have no reported enrollment in the CCD because the students are included in the membership of the regular school.
3
Comments About the Public Elementary/Secondary School Universe Survey Data File Users of the data file need to be aware of certain characteristics of the file. Coverage . The coverage of the Public Elementary/Secondary School Universe Survey includes all public schools providing education services to prekindergarten, kindergarten, grade 1–12, and ungraded students. There are 59 responding units: the 50 states, the District of Columbia, Puerto Rico, the Bureau of Indian Education, and the four U.S. Island Areas. The DoD dependent schools (overseas and domestic), American Samoa, and Guam did not report data for the 2009–10 school year. Their school universes were based on information from the SEAs’ websites and all the other data items were left as missing. Response. Item response is described in Appendix B—Value Distribution, Field Frequencies, and Data Tables. This appendix lists the minimum, maximum, and mean value of each numeric variable as well as the total number of units and the number of units with missing data. Appendix B also lists the frequency of responses by option for each of the categorical values. Nonsampling error. Nonsampling error is the error in an estimate arising at any stage in the survey from sources exclusive of sampling error. Nonsampling error includes nonresponse error; data processing or data entry errors, or reporting error because respondents misinterpret survey questions or do not follow survey instructions or do not follow the item definitions correctly. State education policies may differ in such a way that does not allow them to map their data exactly to the CCD definitions. For example, some states issue several kinds of high school credentials, while other states issue a regular diploma to every student who meets requirements (which may also vary). Another source of nonsampling error may be variations in the reference period for the reported data. For example, CCD requests data for October 1 of each school year, but a state may report their information for another date because they were not able to capture the data for October 1. Coverage error and vertical consistency. Coverage error is another source of nonsampling error; for example, the same agency or school could be reported twice (overcoverage) or an agency or school could be omitted (undercoverage). Although CCD coverage of traditional (i.e., regular; see glossary in appendix C for definition) public schools and school districts is virtually 100 percent, the same cannot be said for publicly funded education outside of traditional settings and organizations. The CCD asks states to report all free elementary/secondary public education in their state regardless of who administers the schools or districts. However, some states that do not report schools that are administered by state organizations other than SEAs (such as a health and human services or a corrections department). These schools include schools for the deaf and blind, university lab schools, and other schools not covered by the authority of the SEA. Conversely, when these institutions are correctly reported on the CCD school and agency universe files, the students and teachers may not be included in the count of persons for whom the state assumes responsibility in its official report. NCES attempts to minimize nonsampling error through the use of annual training of SEA coordinators, extensive quality reviews, and survey editing procedures.
4
NCES attempts to minimize nonsampling error through the use of annual training of SEA coordinators, extensive quality reviews, and survey editing procedures. Longitudinal consistency. Although longitudinal consistency is a key principle of the CCD, it is impossible for NCES to guarantee that state data coordinators follow CCD conventions regarding the deletion of closed schools or agencies and the addition of new ones. Confusion is particularly likely when local education agencies merge. Coverage issues (deletions of schools/agencies, merging of schools/agencies) can affect the ability to track a given school/agency over time. Missing value options. All data elements are either completed by the state or have been filled with a “0,” “-1,” “-2,” “M,” or “N.”
• 0 – There are no occurrences of this data element. A value was expected and measured, but there were no cases in the category. (For example, a high school having no 12th-graders would report 0.)
• M (or -1 for numeric values) – Data are missing. A value was expected and none was
measured. (For example, a school that has at least one 12th-grader but cannot measure the number of 12th-graders would report -1.)
• N (or -2 for numeric values) – Data are not applicable. A value was neither expected nor
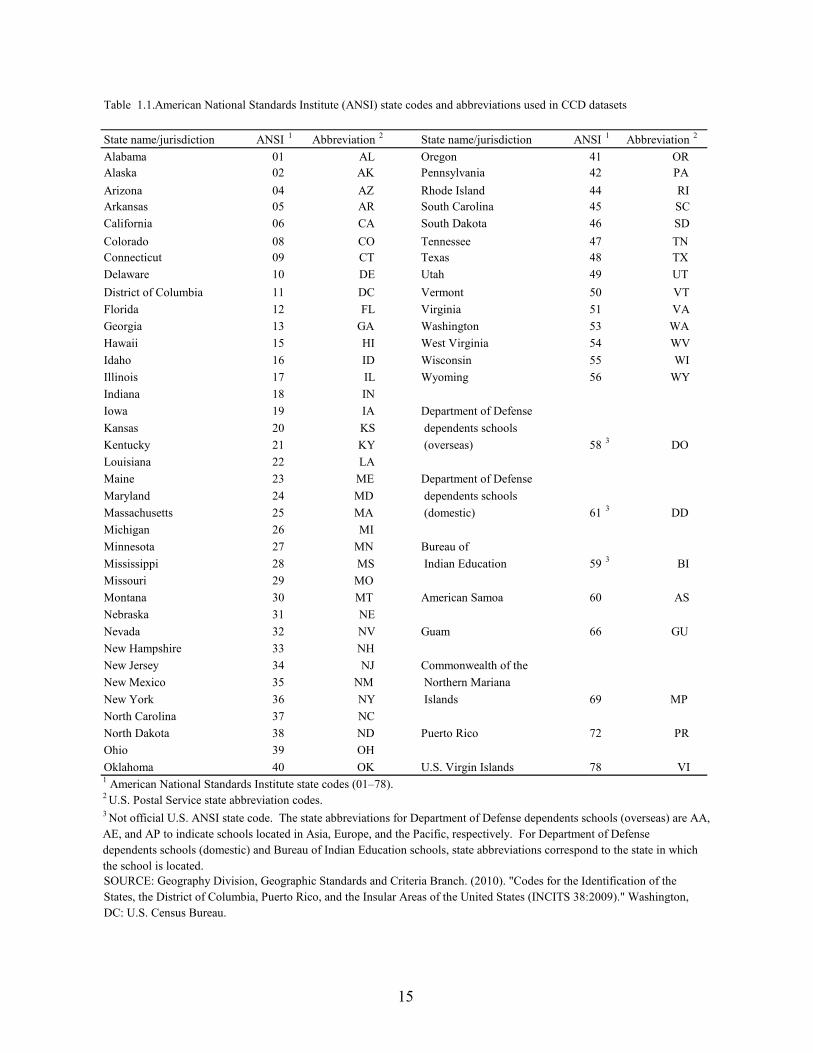
measured. (For example, an elementary school would report -2 for 12th-graders.) Note that starting with the 2002–03 CCD, all numeric fields contain a -1 to indicate “missing” and a -2 to indicate “not applicable.” Previously, numeric fields contained an “M” for missing and an “N” for not applicable. Character fields continue to use “M” for missing and “N” for not applicable. In the 2009–10 collection, EDFacts allowed states to report null values (i.e., no value at all for a cell), which are not accepted by the CCD. CCD survey staff edited null values to missing, not applicable, or zero as appropriate. Appendix D identifies missing and not applicable data items for each state. Comments About the Variables Data users should also take note of certain conditions regarding each variable in the file. The code in parentheses before the variable description indicates the variable name, which is also referenced in appendix A. Counts are based on schools with STATUS = 1, 3, 4, 5, 6, 7, or 8 only. (Operational status codes are defined below.) (FIPST) ANSI8 State Codes. Each record contains an American National Standards Institute (ANSI) state code. A list of ANSI codes for each state and jurisdiction is presented in table 1. 8 American National Standards Institute (ANSI) codes replace the Federal Information Processing Standards (FIPS) codes previously issued by the National Institute of Standards and Technology (NIST) for the 50 states, the District of Columbia, and the U.S. Island Areas. ANSI code values map directly to the retired FIPS code values.
5
are the ANSI code. (SCHNO) NCES School ID. Each record contains a unique NCES school identification number. Combining the NCES Local Education Agency ID with the NCES School ID allows the user to uniquely identify each school on the file. (STID09) State Local Education Agency ID. Each record contains a State Local Education Agency ID. State Local Education Agency ID numbers are assigned by SEAs and may not be unique across states. (SEASCH09) State School ID. Each record contains a State School ID. State School ID numbers are assigned by SEAs and may not be unique across states. (LEANM09) Name of Education Agency. Each record includes the name of the agency that operates the school. NCES reviewed any record filling the 60 characters assigned, and may have edited the agency name to improve readability (i.e., applied standard abbreviations). (SCHNAM09) Name of School. Each record has a school name. NCES reviewed any record filling the 50 characters assigned, and may have edited the school name to improve readability (i.e., applied standard abbreviations). (MSTREE09) Mailing Street. This field may contain a street address or a P.O. Box number. Also, some mailing addresses consist solely of a city and state, indicated by an “N” in the street address field. This field contains an “N” for 11 records in the data file and “M” for 4 records. If mailing street, city, state, and ZIP Code fields were left blank or missing, data from the corresponding location address fields were inserted. (MCITY09) Mailing City. There may be some valid cases in which a school may be located in one city and have a mailing address in another city. (MSTATE09) Mailing State (PO Abbreviation). Each record contains a mailing state. There are instances where a school that is part of one state’s education system reports a mailing address in another state; these situations have been confirmed by the reporting state. A list of the 13 schools that have a mailing state code different from their ANSI state code is included at the end of this document (see table 2). (MZIP09, MZIP409) Mailing ZIP Code +4. Each record displays a mailing ZIP Code in this field. The +4 may be left blank if it is unknown. (PHONE09) Area Code + Telephone Number. If a valid phone number was not provided for a school for the 2009–10 school year, NCES researched prior year data files back to the 2004–05 school year to determine if a valid phone number was reported for the school in a prior year. If a valid number was found in a prior year, this phone number was carried forward to the 2009–10 data file. After completing this editing process, phone numbers are missing (“M”) for 185 records.
6
valid number was found in a prior year, this phone number was carried forward to the 2009–10 data file. After completing this editing process, phone numbers are missing (“M”) for 185 records. (LSTREE09) Location Street. If the location street, city, state, and ZIP Code fields were left blank, data from the corresponding mailing address fields were inserted. In some instances, SEAs did not report physical locations for the location street field, but rather reported Post Office boxes and other addresses that did not represent the location of a school. NCES sponsored research to determine the physical location (and latitude and longitude coordinates) for these types of location street reports. Missing or nonlocation addresses (e.g., Post Office box numbers) were resolved through several means, including telephone calls to individual schools. In addition to this research, if a valid location street was not provided for a school for the 2009–10 school year, NCES researched prior year data files back to the 2004–05 school year to determine if a valid location street was reported for the school in a prior year. If a valid location street was found for a prior year, this value was carried forward to the 2009–10 data file. After completing this editing process, 212 schools have missing location street values. (LCITY09) Location City. Each record displays a location city in this field. (LSTATE09) Location State (PO Abbreviation). Each record displays a location state in this field. (LZIP09, LZIP409) Location ZIP Code + 4. Each record displays a location ZIP Code in this field. The +4 may be left blank if it is unknown (TYPE09) School Type Code. Each record contains a school type code. 1 = Regular school 2 = Special education school 3 = Vocational education school 4 = Alternative/other school
5 = Reportable program Beginning with the 2007–08 school year, the CCD edits the reported school type if it does not agree with the CCD definition. For example, if a school name indicated that it focused primarily on the needs of students with disabilities or if the state reported that at least 80 percent of the students enrolled in the school had special education individual education programs (IEPs), NCES reclassified the school as a special education school. (The number of students with IEPs was reported to EDFacts collection system at the school and LEA level, but the CCD only contained IEP data at the LEA level.) Similarly, if a school name suggested that it was a vocational or alternative school, NCES researched the school through different resources (e.g., school website or education association) or by calling the school to determine if the school should be reclassified as a vocational or alternative school. NCES asked CCD Coordinators to review these reclassifications, and if they provided evidence that a school met the CCD criteria for the originally reported type, the school type was not changed.
7
(STATUS09) Operational Status Code. Each record contains a status code to reflect the school’s operational status for the 2009–10 school year. Valid responses include the following:
1 = School was operational at the time of the last report and is currently operational. 2 = School has closed since the time of the last report. 3 = School has been opened since the time of the last report. 4 = School was operational at the time of the last report but was not on the CCD list at that
time. 5 = School was listed in previous year’s CCD school universe as being affiliated with a
different education agency. 6 = School is temporarily closed and may reopen within 3 years.
7 = School is scheduled to be operational within 2 years. 8 = School was closed on previous year’s file but has reopened.
Schools with an operational status code of “2” remain on the file for one year for historical purposes. Code “6” and “7” response options for the STATUS field were added to the CCD starting with the 2002–03 file. Code “8” response option for the STATUS field was added to the CCD starting with the 2005–06 file. (ULOCAL09) Urban-centric Locale Code. The locale code is an indication of a school’s location relative to a populous area. Beginning with the 2006–07 CCD files, the locale code methodology was changed from a 1-digit code based on metropolitan statistical areas to a 2-digit code based on urban clusters. In order to distinguish the two methodologies, the older system of locale codes is referred to as “metro-centric” and the current system is referred to as “urban-centric.” The methodology used to assign locale codes is provided at the end of this section. American Samoa, the Commonwealth of the Northern Mariana Islands, Guam, the Virgin Islands, and the Department of Defense Dependents Schools were assigned a locale code as not applicable (N) because the geographic and governmental structures of these entities do not fit the definitional scheme used to derive the code. ULOCAL09 is shown as missing (M) for 82 schools in the states of California (35 schools), Idaho (4 schools), Illinois (1 school), Michigan (37 schools), and Pennsylvania (5 schools) because the SEAs submitted new directory information for these schools after the file had undergone geocode processing. The 12 urban-centric locale code categories are defined below. Locale codes are divided into four main locale types (city, suburb, town, and rural) and each of the four locale types has three subtypes (large, midsize, and small for city and suburb locale types and fringe, distant, and remote for town and rural locale types).
11 = City, Large: Territory inside an urbanized area and inside a principal city with population of 250,000 or more. 12 = City, Midsize: Territory inside an urbanized area and inside a principal city with population less than 250,000 and greater than or equal to 100,000.
8
13 = City, Small: Territory inside an urbanized area and inside a principal city with population less than 100,000. 21 = Suburb, Large: Territory outside a principal city and inside an urbanized area with population of 250,000 or more. 22 = Suburb, Midsize: Territory outside a principal city and inside an urbanized area with population less than 250,000 and greater than or equal to 100,000. 23 = Suburb, Small: Territory outside a principal city and inside an urbanized area with population less than 100,000. 31 = Town, Fringe: Territory inside an urban cluster that is less than or equal to 10 miles from an urbanized area.
32 = Town, Distant: Territory inside an urban cluster that is more than 10 miles and less than or equal to 35 miles from an urbanized area. 33 = Town, Remote: Territory inside an urban cluster that is more than 35 miles of an urbanized area. 41 = Rural, Fringe: Census-defined rural territory that is less than or equal to 5 miles from an urbanized area, as well as rural territory that is less than or equal to 2.5 miles from an urban cluster. 42 = Rural, Distant: Census-defined rural territory that is more than 5 miles but less than or equal to 25 miles from an urbanized area, as well as rural territory that is more than 2.5 miles but less than or equal to 10 miles from an urban cluster. 43 = Rural, Remote: Census-defined rural territory that is more than 25 miles from an urbanized area and is also more than 10 miles from an urban cluster.
(CDCODE09) Congressional District Code. The Congressional District Code denotes legislatively defined subdivisions of a state for the purpose of electing representatives or delegates to the House of Representatives of the United States Congress. Starting in 2006–07, the Congressional Districts of the United States Code was added to the agency file. The ANSI code provides the structure of numeric codes for representing congressional districts and similar areas defined for the various Congresses of the United States. CDCODE09 is shown as missing (M) for 82 schools in the states of California (35 schools), Idaho (4 schools), Illinois (1 school), Michigan (37 schools), and Pennsylvania (5 schools) because the SEAs submitted new directory information for these schools after the file had undergone geocode processing. See appendix C for more information. (LATCOD09) Latitude. Latitude is the north or south angular distance from the equator, with positive values going north and negative values going south. When combined with longitude, it
9
reflects an estimation of where the school is physically situated on the street segment to which it was coded. Coordinate degrees, minutes, and seconds have been converted to, and are displayed in terms of, their decimal equivalent. The digits to the left of the decimal point represent the number of degrees from the equator, and the digits to the right of the decimal point represent the fraction of the degree carried out to six decimal places. For example, if a building’s latitude is 30 degrees, 30 minutes north, then it is shown as 30.500000. Addresses that could not be found at the Census block level were assigned a blank. (LONCOD09) Longitude. Longitude is the east or west angular distance from the prime meridian, with positive values going east and negative values going west. When combined with latitude, it reflects an estimation of where the school is physically situated on the street segment to which it was coded. Coordinate degrees, minutes, and seconds have been converted to, and are displayed in terms of, their decimal equivalent. The digits to the left of the decimal point represent the number of degrees from the prime meridian. The digits to the right of the decimal point represent the fraction of the next degree carried out to six decimal places. For example, if a building’s longitude is 90 degrees, 15 minutes west, then it is shown as –90.250000. Addresses that could not be found at the Census block level were assigned a blank. (CONAME09) County Name. This field was added to the school file starting in 2002–03. The values for this field are determined by the Census Bureau based on the reported location address. CONAME09 is shown as missing (M) for 82 schools in the states of California (35 schools), Idaho (4 schools), Illinois (1 school), Michigan (37 schools), and Pennsylvania (5 schools) because the SEAs submitted new directory information for these schools after the file had undergone geocode processing. (CONUM09) ANSI County Code. This field was added to the school file starting in 2002–03. The values for this field are determined by the Census Bureau based on the reported location address. A small number of supervisory unions in New England states have an ANSI county code that differs from the county in which the school is physically located. CONUM09 is shown as missing (M) for 82 schools in the states of California (35 schools), Idaho (4 schools), Illinois (1 school), Michigan (37 schools), and Pennsylvania (5 schools) because the SEAs submitted new directory information for these schools after the file had undergone geocode processing. (FTE09) FTE Teachers. A school’s count of full-time-equivalent teachers is collected to the nearest hundredth. Some schools may report teachers, but no pupils, while other schools may report pupils in membership but no teacher FTE. These are valid records indicating situations in which more than one school provides services to pupils, but the pupils are attributed to a single school to avoid double counting, or where a teacher provides services to pupils at multiple schools. An example of the former situation might be a vocational school whose pupil membership is attributed to the high school that sends its pupils to obtain vocational services. Because teacher counts are collected at all three levels of the CCD files (school, agency, and state), one data anomaly is that the sum of teacher counts aggregated from the lower level to the state level may exceed the sum of teacher counts from a higher level aggregated to the state level (i.e., school FTE data aggregated to the state level may exceed agency-level FTE data aggregated to the state or state-level reported data). Beginning with school year 2008–09, if the
10
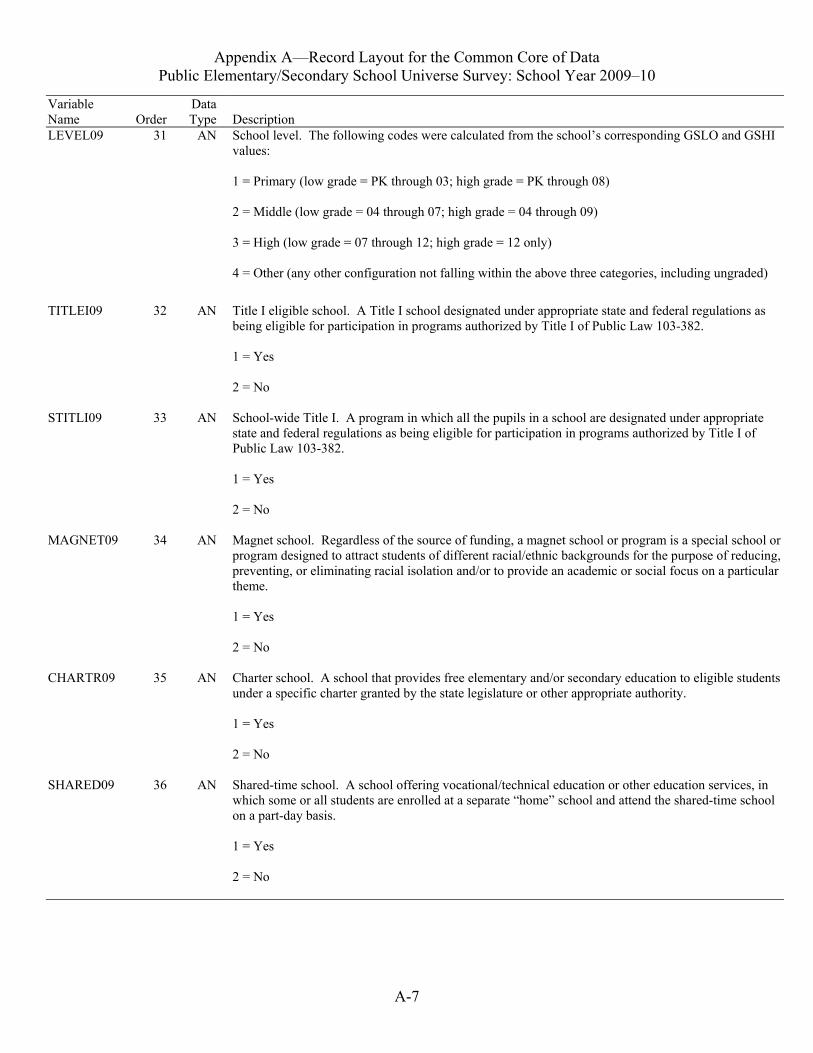
sum of teacher FTE aggregated to the state level reported on the school file exceeded the sum of teacher FTE aggregated to the state on the agency file or exceeded state file reports, teacher FTE may have been edited on one or more of the three levels. School-level FTE aggregated to the agency level is allowed to exceed agency-level FTE reports. (GSLO09, GSHI09) Low/High Grade Span Offered. The lowest and highest grades offered in each school was calculated by NCES using two types of information reported by states: (1) binary ‘grade offered’ flags that indicate whether a given grade (e.g., prekindergarten, kindergarten, grade 1) was offered by the school; and (2) reports of enrollment by grade. (LEVEL09) Level. A school-level code was added to the school file starting in 2000–01. This code indicates the instructional level of the school. The following codes were calculated from the school’s corresponding low/high grade span (GSLO/GSHI) values:
1 = Primary (low grade: PK through 03; high grade: PK through 08) 2 = Middle (low grade: 04 through 07; high grade: 04 through 09) 3 = High (low grade: 07 through 12; high grade: 12 only) 4 = Other (any other configuration not falling within the above three categories, including
ungraded and operational schools with nonapplicable grade spans) (TITLEI09) Title I Eligible School. This flag denotes a Title I school designated under appropriate state and federal regulations as being eligible for participation in programs authorized by Title I of Public Law 103-382.
1 = Yes 2 = No
(STITLI09) Schoolwide Title I. This flag denotes a program in which all the pupils in a school are designated under appropriate state and federal regulations as being eligible for participation in programs authorized by Title I of Public Law 103-382.
1 = Yes 2 = No
(MAGNET09) Magnet School. If a state reports MAGNET = 2 for all its schools, then MAGNET is set to “N” (not applicable).
1 = Yes 2 = No
(CHARTR09) Charter School. If a state reports CHARTR = 2 for all its schools and does not have charter school legislation, then CHARTR is set to “N” (not applicable).
1 = Yes 2 = No
11
1 = Yes 2 = No
(CHARTR09) Charter School. If a state reports CHARTR = 2 for all its schools and does not have charter school legislation, then CHARTR is set to “N” (not applicable).
1 = Yes 2 = No
(SHARED09) Shared Time School. This flag denotes a shared time school. Typically, this is a school offering vocational/technical education or other education services, in which some or all students are enrolled at a separate “home” school and attend the shared-time school on a part-day basis.
1 = Yes 2 = No
(BIES09) Bureau of Indian Education (BIE) School Flag. This field indicates whether or not a school was also reported by the Bureau of Indian Education in their submission of school data. This field was added to the school file in 2009–10.
1 = Yes. 2 = No.
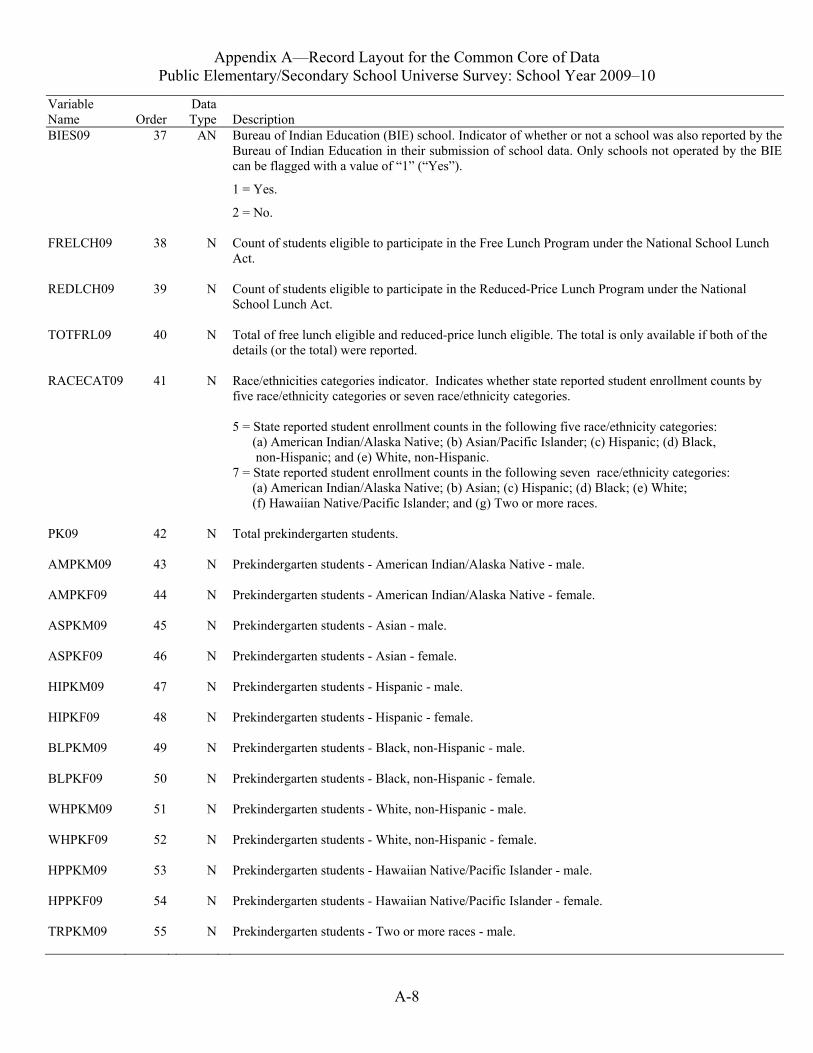
Only states or jurisdictions other than the BIE can contain a value of “1” (“Yes”) for this flag. (FRELCH09) Free Lunch Eligible Students. This student count may be taken by a school at a different time than the membership count; therefore, free lunch and membership counts may not be comparable in a given school. In some states, a single school may provide the free lunch program for a cluster of schools; thus, the free lunch eligible count for the school providing services may overrepresent the school’s total membership. To avoid identifying specific students as eligible for free lunch, the reported number may have been edited. (REDLCH09) Reduced-Price Lunch Eligible Students. See preceding paragraph. (TOTFRL09) Total Free and Reduced-Price Lunch Eligible Students. If not reported, this total field was calculated using reported free and reduced-price lunch detail. (RACECAT09) Race/ethnicities category indicator. The data item RACECAT is a race/ethnicities category indicator that indicates whether the state reported student enrollment counts by five race/ethnicity categories or seven race/ethnicity categories. Prior to 2008–09, NCES asked states to report student enrollment counts by five racial/ethnic categories. For the 2008–09 and 2009–10 data collection, NCES asked states to submit counts of students by race/ethnicity by seven race/ethnicity categories if their state data system allowed for such
12
reporting. Starting 2010–11, every state and jurisdiction should report student enrollment counts by seven racial/ethnic categories. For the 2008–09 and 2009–10 data collection, the data item RACECAT contains two values:
5 = State reported student enrollment counts in the following five race/ethnicity categories: (a) American Indian/Alaska Native; (b) Asian/Pacific Islander; (c) Hispanic; (d) Black; and (e) White.
7 = State reported student enrollment counts in the following seven race/ethnicity categories: (a) American Indian/Alaska Native; (b) Asian; (c) Hispanic of any race; (d) Black; (e) White; (f) Hawaiian Native/Pacific Islander; and (g) Two or more races.
In the current file, for the states that reported five race/ethnicity categories (i.e., RACECAT09=5), the variables related to the Asian race category include students who are Asian, Hawaiian Native, or Pacific Islander; for the states that reported seven race/ethnicity categories (i.e., RACECAT09=7), the variables related to the Asian race category include Asian students only. In appendix A, the race/ethnicity categories represented by the five and seven reporting categories are followed by a notation of “(5)” or “(7),” respectively. Student membership (MEMBER09), students by Grade (PK–12), by Race/Ethnicity, and by Sex. Membership is the count of students enrolled on October 1st of the school year. CCD collects membership counts at three levels: school, agency, and state. The total student membership reported by states at one level may often be different than what was reported at one or both of the other levels. In general, the total student membership on lower level file should be less than or equal to the total membership on higher level files. A common reason for these differences is that SEAs report a student membership in the school the student attends, but report a student’s membership in the LEA that is financially responsible for the student. For example, a regular school district may not be able to provide services to students with special needs and may instead pay tuition for students to attend private schools that provide services to students with special needs. These students are then counted in the regular school district, but not in any of the schools in CCD school file. In school year 2008–09, CCD survey staff began editing student membership at one or more levels to ensure that the sum of the lower level membership does not exceed the sum of the higher level membership. For states with membership discrepancies that exceed five percent of the lower level membership, CCD survey staff routinely follows up with SEAs and asks SEAs to verify the reported membership and provide explanations of the differences. Ungraded Students by Race/Ethnicity and by Sex. The classification of “ungraded” is not used for students in Alabama, Alaska, Colorado, Connecticut, Delaware, Florida, Georgia, Idaho, Illinois, Indiana, Iowa, Louisiana, Maine, Maryland, Minnesota, Missouri, Montana, Nebraska, New Hampshire, New Mexico, North Dakota, Ohio, Oregon, Rhode Island, South Carolina, South Dakota, Tennessee, Texas, Utah, Vermont, Virginia, Washington, West Virginia, Wisconsin, Wyoming, the Bureau of Indian Education, and the U.S. Virgin Islands.
13
14
set of standard geographic concepts as the metro-centric system it replaces, but it prioritizes an urban approach that combines size and distance from an urbanized area. Locale types (city, suburb, town, and rural) and subtypes (large, midsize, and small for city and suburb locale types and fringe, distant, and remote for town and rural locale types) were assigned to all schools in the 50 states, District of Columbia, and Puerto Rico. Locale codes were not assigned for U.S. Island Areas (the U.S. Virgin Islands, Guam, American Samoa, and the Northern Mariana Islands) or the Department of Defense dependents schools (overseas). A geographic information system (GIS) was used to evaluate the spatial relationships of the various thematic layers included in the locale criteria. Distances for town and rural locale types were based on straight-line or Euclidean distance. Although this simple geometric measure does not account for the presence or absence of road networks that may offer point-to-point drive time estimates, it is also unaffected by short-term changes to the transportation infrastructure that could cause significant fluctuations in those estimates. The basic unit for these distance indicators—2.5 miles—was borrowed from the Census Bureau’s criterion for connecting densely settled non-contiguous territory to a qualifying core of an urbanized area or an urban cluster during the urban delineation process. Distances used to define locale subtypes are multiples of the basic distance unit of 2.5 miles (i.e., 2.5, 5, 10, and 25 miles for rural; 10 and 35 miles for towns). The U.S. Island Areas, Hawaii, and Puerto Rico were classified according to the proposed locale and subtype criteria that define the four locale types and three locale subtypes. Schools were spatially integrated with these territories based on school geocodes (i.e., their position was determined by each school’s latitude and longitude). Third, the schools were assigned a locale and subtype based on their location (i.e., they received the same assignment given to the territory where they were located).
15
Table 1.—1.A merican National Standards Institute (ANSI) state codes and abbreviations used in CCD datasets Table 1.—
1 2 1 2 State name/jurisdiction ANSI Abbreviation State name/jurisdiction ANSI Abbreviation Alabama 01 AL Oregon 41 OR Alaska 02 AK Pennsylvania 42 PA Arizona 04 AZ Rhode Island 44 RI Arkansas 05 AR South Carolina 45 SC California 06 CA South Dakota 46 SD Colorado 08 CO Tennessee 47 TN Connecticut 09 CT Texas 48 TX
Delaware 10 DE Utah 49 UT District of Columbia 11 DC Vermont 50 VT
Florida 12 FL Virginia 51 VA Georgia 13 GA Washington 53 WA
Hawaii 15 HI West Virginia 54 WV Idaho 16 ID Wisconsin 55 WI
Illinois 17 IL Wyoming 56 WY Indiana 18 IN Iowa 19 IA Department of Defense Kansas 20 KS dependents schools
3 Kentucky 21 KY (overseas ) 58 DO Louisiana 22 LA Maine 23 ME Department of Defense
Maryland 24 MD dependents schools 3 Massachusetts 25 MA (domes tic) 61 DD
Michigan 26 MI Minnesota 27 MN Bureau of
3 Mississippi 28 MS Indian Education 59 BI Missouri 29 MO
Montana 30 MT American Samoa 60 AS Nebraska 31 NE Nevada 32 NV Guam 66 GU New Hampshire 33 NH
New Jersey 34 NJ Commonwealth of the New Mexico 35 NM Northern Mariana New York 36 NY Islands 69 MP
North Carolina 37 NC North Dakota 38 ND Puerto Rico 72 PR Ohio 39 OH
Oklahoma 40 OK U.S. Virgin Islands 78 VI 1 American National Standards Institute state codes (01–78).
2 U.S. Postal Service state abbreviation codes. 3 Not official U.S. ANSI state code. The state abbreviations for Department of Defense dependents schools (overseas) are AA, AE, and AP to indicate schools located in Asia, Europe, and the Pacific, respectively. For Department of Defense dependents schools (domestic) and Bureau of Indian Education schools, state abbreviations correspond to the state in which the school is located. SOURCE: Geography Division, Geographic Standards and Criteria Branch. (2010). "Codes for the Identification of the States, the District of Columbia, Puerto Rico, and the Insular Areas of the United States (INCITS 38:2009)." Washington, DC: U.S. Census Bureau.
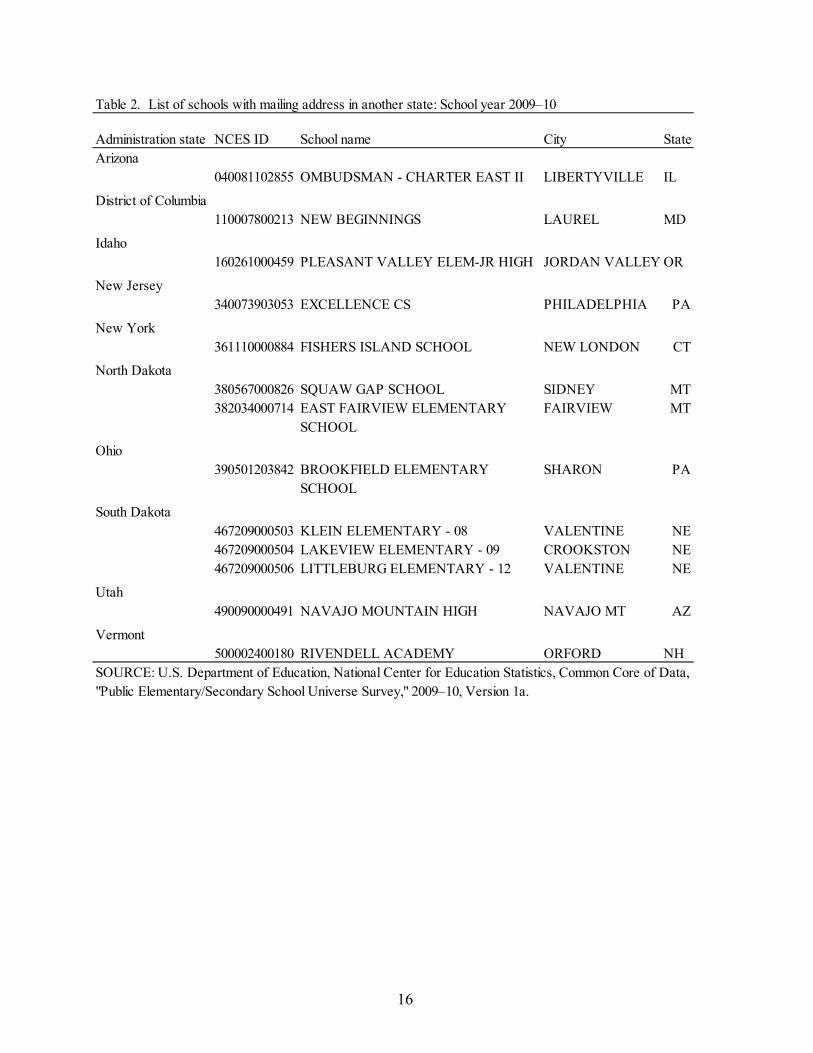
Table 2. List of schools with mailing address in another state: School year 2009–10
Administration state NCES ID School name City StateArizona
040081102855 OMBUDSMAN - CHARTER EAST II LIBERTYVILLE IL
District of Columbia110007800213 NEW BEGINNINGS LAUREL MD
Idaho160261000459 PLEASANT VALLEY ELEM-JR HIGH JORDAN VALLEY OR
New Jersey340073903053 EXCELLENCE CS PHILADELPHIA PA
New York361110000884 FISHERS ISLAND SCHOOL NEW LONDON CT
North Dakota380567000826 SQUAW GAP SCHOOL SIDNEY MT382034000714 EAST FAIRVIEW ELEMENTARY FAIRVIEW MT
SCHOOL
Ohio390501203842 BROOKFIELD ELEMENTARY SHARON PA
SCHOOL
South Dakota467209000503 KLEIN ELEMENTARY - 08 VALENTINE NE467209000504 LAKEVIEW ELEMENTARY - 09 CROOKSTON NE467209000506 LITTLEBURG ELEMENTARY - 12 VALENTINE NE
Utah490090000491 NAVAJO MOUNTAIN HIGH NAVAJO MT AZ
Vermont500002400180 RIVENDELL ACADEMY ORFORD NH
SOURCE: U.S. Department of Education, National Center for Education Statistics, Common Core of Data,"Public Elementary/Secondary School Universe Survey," 2009–10, Version 1a.
16
B. User Guidelines for Processing the Public Elementary/Secondary School Universe Survey Data Files Starting in 1999–2000, CCD data file names were changed to include a two-digit version number. The 2009–10 Public Elementary/Secondary School Universe Survey SAS file is called SC091A.SD2. The flat ASCII file is called SC091A.DAT. The first two characters of the file name indicate the type of file (SC = School Universe, AG = Agency Universe, ST = State), the third and fourth characters indicate the file year (09 = 2009–10 CCD collection), and the fifth and sixth characters indicate the version number (1 = final file; a = first version). The record layout for the file is contained in appendix A. If errors are discovered in the published 1a files (final file, first version), or if states report new or corrected data, NCES may revise the file. The revised file is labeled 1b, unless another revision of the original file has occurred sometime in that year due to an NCES error found in the file.
C. Guidelines for Using the Flat ASCII Data File
When using the flat ASCII data file, care should be taken to label the identification number variables (e.g., NCESSCH) as character fields. This is necessary in order to retain the leading zero in many of the identification numbers. It is necessary to keep the leading zeroes when merging these data with other files. This can be accomplished in Excel by using the ‘Import Wizard’ to select the ID fields and set them as text fields.
17
Appendix A—Record Layout for the Common Core of Data Public Elementary/Secondary School Universe Survey: School Year 2009–10
A-1

A-2
Page intentionally left blank.
Appendix A—Record Layout for the Common Core of Data Public Elementary/Secondary School Universe Survey: School Year 2009–10
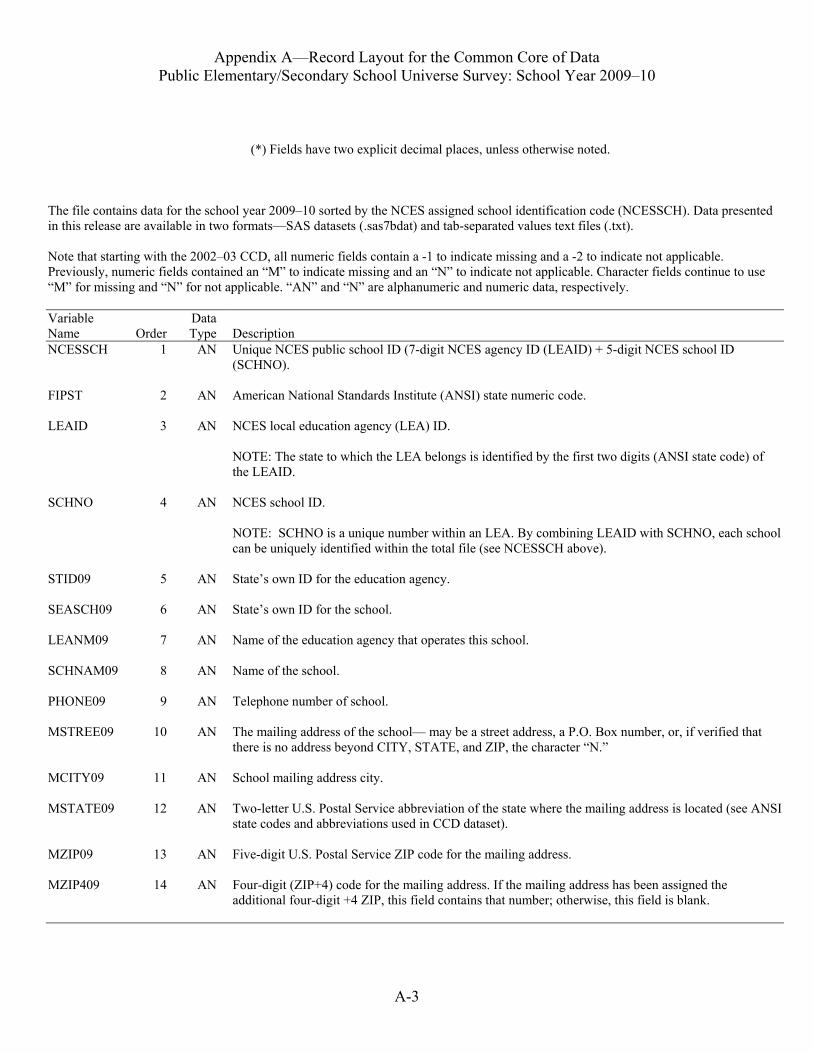
(*) Fields have two explicit decimal places, unless otherwise noted. The file contains data for the school year 2009–10 sorted by the NCES assigned school identification code (NCESSCH). Data presented in this release are available in two formats—SAS datasets (.sas7bdat) and tab-separated values text files (.txt). Note that starting with the 2002–03 CCD, all numeric fields contain a -1 to indicate missing and a -2 to indicate not applicable. Previously, numeric fields contained an “M” to indicate missing and an “N” to indicate not applicable. Character fields continue to use “M” for missing and “N” for not applicable. “AN” and “N” are alphanumeric and numeric data, respectively. Variable Name
Order
Data Type
Description
NCESSCH
FIPST
LEAID
SCHNO
STID09
SEASCH09
LEANM09
SCHNAM09
PHONE09
MSTREE09
MCITY09
MSTATE09
MZIP09
MZIP409
1
2
3
4
5
6
7
8
9
10
11
12
13
14
AN
AN
AN
AN
AN
AN
AN
AN
AN
AN
AN
AN
AN
AN
Unique NCES public school ID (7-digit NCES agency ID (LEAID) + 5-digit NCES school ID (SCHNO). American National Standards Institute (ANSI) state numeric code. NCES local education agency (LEA) ID. NOTE: The state to which the LEA belongs is identified by the first two digits (ANSI state code) of the LEAID. NCES school ID. NOTE: SCHNO is a unique number within an LEA. By combining LEAID with SCHNO, each school can be uniquely identified within the total file (see NCESSCH above). State’s own ID for the education agency. State’s own ID for the school. Name of the education agency that operates this school. Name of the school. Telephone number of school. The mailing address of the school— may be a street address, a P.O. Box number, or, if verified that there is no address beyond CITY, STATE, and ZIP, the character “N.” School mailing address city. Two-letter U.S. Postal Service abbreviation of the state where the mailing address is located (see ANSIstate codes and abbreviations used in CCD dataset). Five-digit U.S. Postal Service ZIP code for the mailing address. Four-digit (ZIP+4) code for the mailing address. If the mailing address has been assigned the additional four-digit +4 ZIP, this field contains that number; otherwise, this field is blank.
A-3
Appendix A—Record Layout for the Common Core of Data Public Elementary/Secondary School Universe Survey: School Year 2009–10
Variable Name
Order
Data Type
Description
LSTREE09
LCITY09
LSTATE09
LZIP09
LZIP409
TYPE09
STATUS09
15
16
17
18
19
20
21
AN
AN
AN
AN
AN
AN
AN
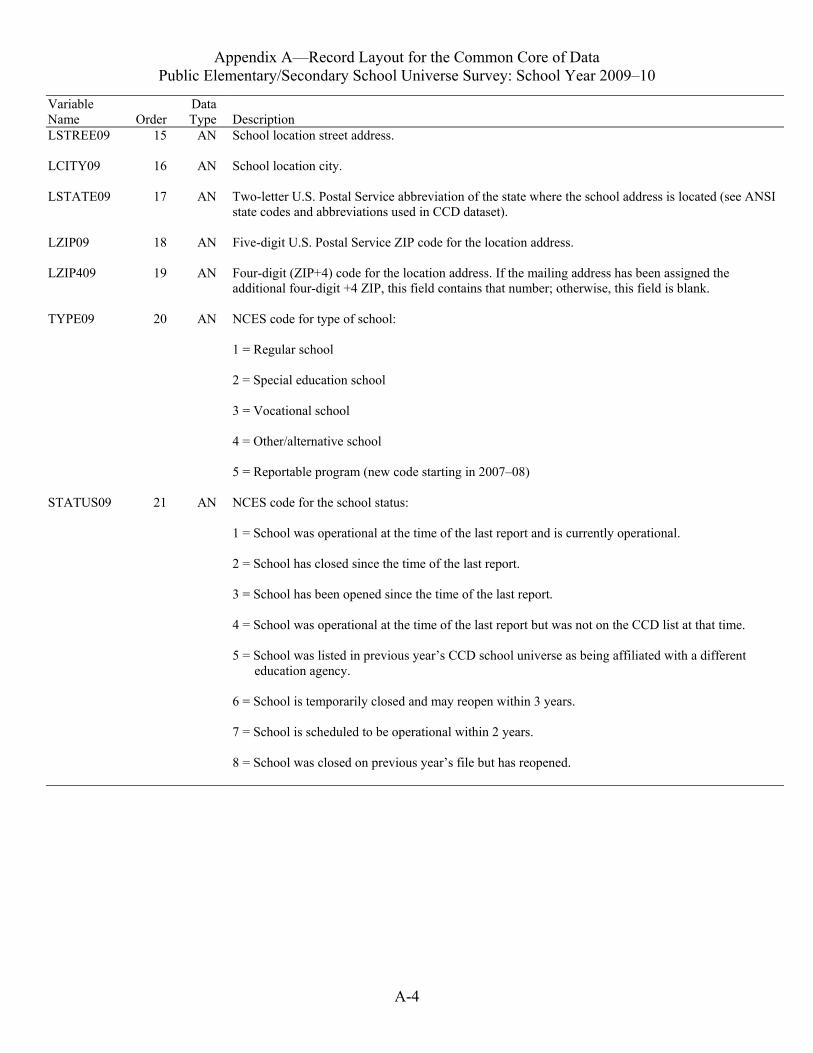
School location street address. School location city. Two-letter U.S. Postal Service abbreviation of the state where the school address is located (see ANSI state codes and abbreviations used in CCD dataset). Five-digit U.S. Postal Service ZIP code for the location address. Four-digit (ZIP+4) code for the location address. If the mailing address has been assigned the additional four-digit +4 ZIP, this field contains that number; otherwise, this field is blank. NCES code for type of school: 1 = Regular school 2 = Special education school 3 = Vocational school 4 = Other/alternative school 5 = Reportable program (new code starting in 2007–08) NCES code for the school status: 1 = School was operational at the time of the last report and is currently operational. 2 = School has closed since the time of the last report. 3 = School has been opened since the time of the last report. 4 = School was operational at the time of the last report but was not on the CCD list at that time. 5 = School was listed in previous year’s CCD school universe as being affiliated with a different
education agency. 6 = School is temporarily closed and may reopen within 3 years. 7 = School is scheduled to be operational within 2 years. 8 = School was closed on previous year’s file but has reopened.
A-4
Appendix A—Record Layout for the Common Core of Data Public Elementary/Secondary School Universe Survey: School Year 2009–10
Variable Name
Order
Data Type
Description
ULOCAL09
LATCOD09
LONCOD09
22
23
24
AN
N
N
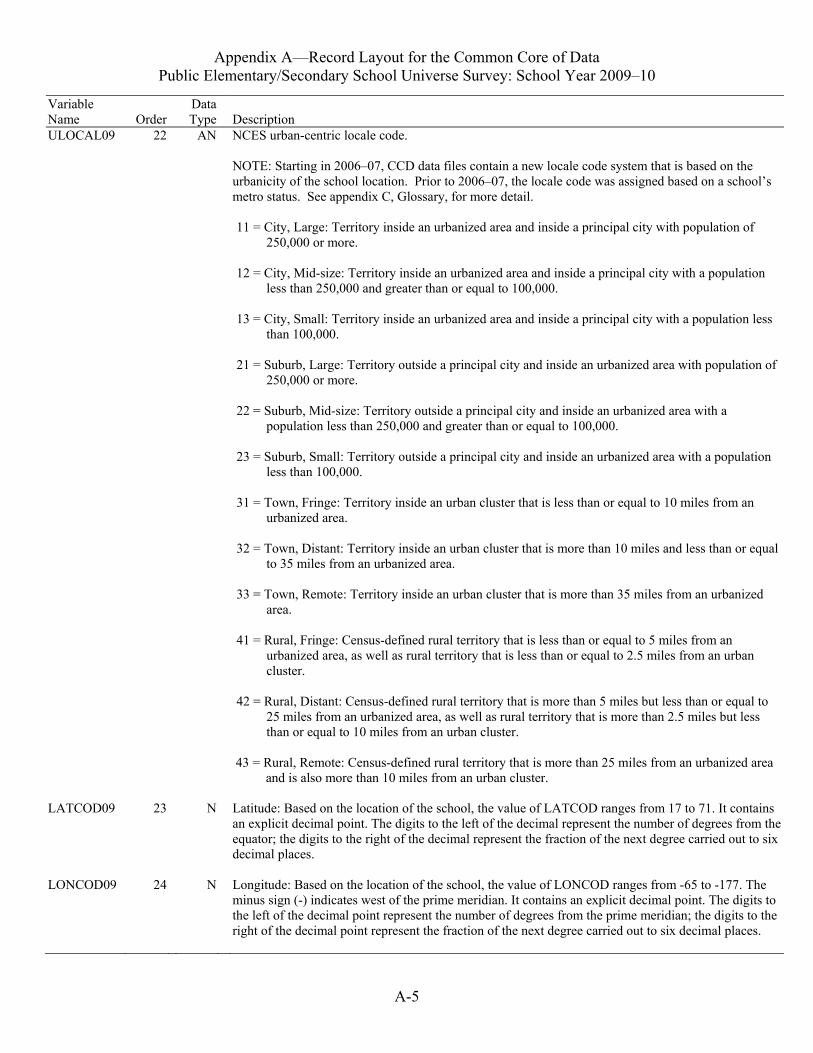
NCES urban-centric locale code. NOTE: Starting in 2006–07, CCD data files contain a new locale code system that is based on the urbanicity of the school location. Prior to 2006–07, the locale code was assigned based on a school’s metro status. See appendix C, Glossary, for more detail. 11 = City, Large: Territory inside an urbanized area and inside a principal city with population of
250,000 or more. 12 = City, Mid-size: Territory inside an urbanized area and inside a principal city with a population
less than 250,000 and greater than or equal to 100,000. 13 = City, Small: Territory inside an urbanized area and inside a principal city with a population less
than 100,000. 21 = Suburb, Large: Territory outside a principal city and inside an urbanized area with population of
250,000 or more. 22 = Suburb, Mid-size: Territory outside a principal city and inside an urbanized area with a
population less than 250,000 and greater than or equal to 100,000. 23 = Suburb, Small: Territory outside a principal city and inside an urbanized area with a population
less than 100,000. 31 = Town, Fringe: Territory inside an urban cluster that is less than or equal to 10 miles from an
urbanized area. 32 = Town, Distant: Territory inside an urban cluster that is more than 10 miles and less than or equal
to 35 miles from an urbanized area. 33 = Town, Remote: Territory inside an urban cluster that is more than 35 miles from an urbanized
area. 41 = Rural, Fringe: Census-defined rural territory that is less than or equal to 5 miles from an
urbanized area, as well as rural territory that is less than or equal to 2.5 miles from an urban cluster.
42 = Rural, Distant: Census-defined rural territory that is more than 5 miles but less than or equal to
25 miles from an urbanized area, as well as rural territory that is more than 2.5 miles but less than or equal to 10 miles from an urban cluster.
43 = Rural, Remote: Census-defined rural territory that is more than 25 miles from an urbanized area and is also more than 10 miles from an urban cluster.
Latitude: Based on the location of the school, the value of LATCOD ranges from 17 to 71. It contains an explicit decimal point. The digits to the left of the decimal represent the number of degrees from the equator; the digits to the right of the decimal represent the fraction of the next degree carried out to six decimal places. Longitude: Based on the location of the school, the value of LONCOD ranges from -65 to -177. The minus sign (-) indicates west of the prime meridian. It contains an explicit decimal point. The digits to the left of the decimal point represent the number of degrees from the prime meridian; the digits to the right of the decimal point represent the fraction of the next degree carried out to six decimal places.
A-5
Appendix A—Record Layout for the Common Core of Data Public Elementary/Secondary School Universe Survey: School Year 2009–10
Variable Name
Order
Data Type
Description
CONUM09
CONAME09
CDCODE09
FTE09
GSLO09
GSHI09
25
26
27
28 *
29
30
AN
AN
AN
N
AN
AN
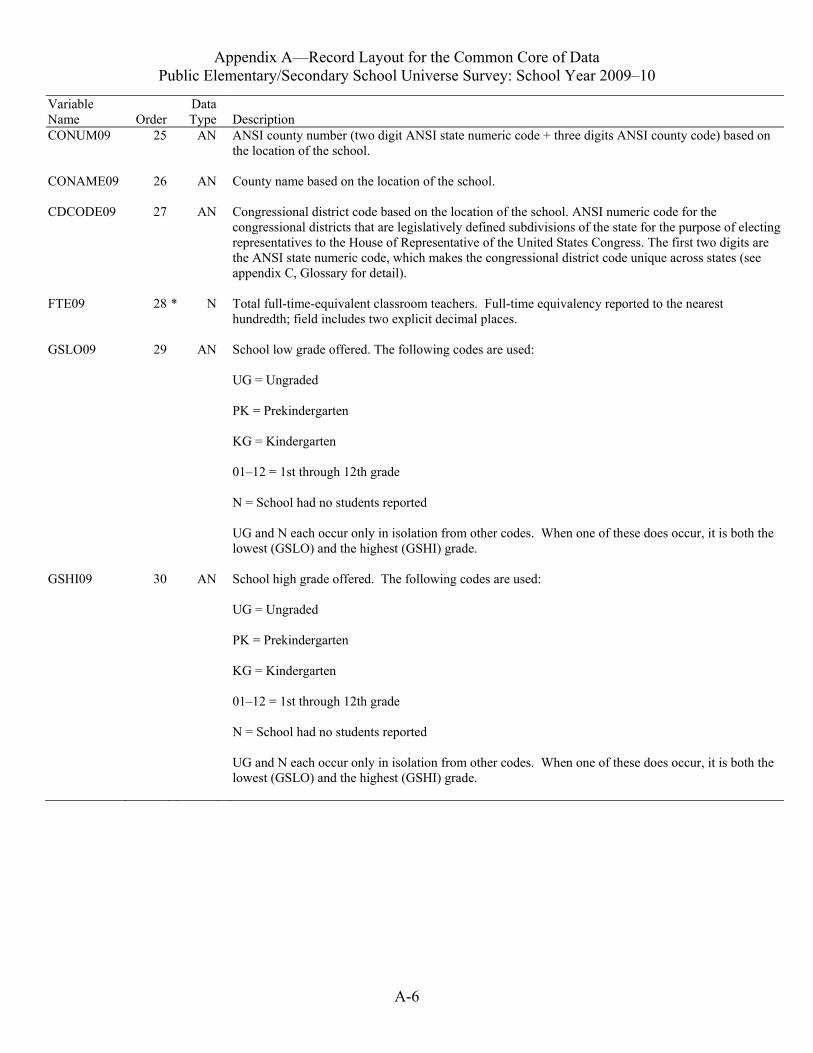
ANSI county number (two digit ANSI state numeric code + three digits ANSI county code) based on the location of the school. County name based on the location of the school. Congressional district code based on the location of the school. ANSI numeric code for the congressional districts that are legislatively defined subdivisions of the state for the purpose of electing representatives to the House of Representative of the United States Congress. The first two digits are the ANSI state numeric code, which makes the congressional district code unique across states (see appendix C, Glossary for detail). Total full-time-equivalent classroom teachers. Full-time equivalency reported to the nearest hundredth; field includes two explicit decimal places. School low grade offered. The following codes are used: UG = Ungraded PK = Prekindergarten KG = Kindergarten 01–12 = 1st through 12th grade N = School had no students reported UG and N each occur only in isolation from other codes. When one of these does occur, it is both the lowest (GSLO) and the highest (GSHI) grade. School high grade offered. The following codes are used: UG = Ungraded PK = Prekindergarten KG = Kindergarten 01–12 = 1st through 12th grade N = School had no students reported UG and N each occur only in isolation from other codes. When one of these does occur, it is both the lowest (GSLO) and the highest (GSHI) grade.
A-6
Appendix A—Record Layout for the Common Core of Data Public Elementary/Secondary School Universe Survey: School Year 2009–10
Variable Name
Order
Data Type
Description
LEVEL09
TITLEI09
STITLI09
MAGNET09
CHARTR09
SHARED09
31
32
33
34
35
36
AN
AN
AN
AN
AN
AN
School level. The following codes were calculated from the school’s corresponding GSLO and GSHI values: 1 = Primary (low grade = PK through 03; high grade = PK through 08) 2 = Middle (low grade = 04 through 07; high grade = 04 through 09) 3 = High (low grade = 07 through 12; high grade = 12 only) 4 = Other (any other configuration not falling within the above three categories, including ungraded)
Title I eligible school. A Title I school designated under appropriate state and federal regulations as being eligible for participation in programs authorized by Title I of Public Law 103-382. 1 = Yes 2 = No School-wide Title I. A program in which all the pupils in a school are designated under appropriate state and federal regulations as being eligible for participation in programs authorized by Title I of Public Law 103-382. 1 = Yes 2 = No Magnet school. Regardless of the source of funding, a magnet school or program is a special school or program designed to attract students of different racial/ethnic backgrounds for the purpose of reducing, preventing, or eliminating racial isolation and/or to provide an academic or social focus on a particular theme. 1 = Yes 2 = No Charter school. A school that provides free elementary and/or secondary education to eligible students under a specific charter granted by the state legislature or other appropriate authority. 1 = Yes 2 = No Shared-time school. A school offering vocational/technical education or other education services, in which some or all students are enrolled at a separate “home” school and attend the shared-time school on a part-day basis. 1 = Yes 2 = No
A-7
Appendix A—Record Layout for the Common Core of Data Public Elementary/Secondary School Universe Survey: School Year 2009–10
Variable Name
Order
Data Type
Description
BIES09
FRELCH09
REDLCH09
TOTFRL09
RACECAT09
PK09
AMPKM09
AMPKF09
ASPKM09
ASPKF09
HIPKM09
HIPKF09
BLPKM09
BLPKF09
WHPKM09
WHPKF09
HPPKM09
HPPKF09
TRPKM09
37
38
39
40
41
42
43
44
45
46
47
48
49
50
51
52
53
54
55
AN
N
N
N
N
N
N
N
N
N
N
N
N
N
N
N
N
N
N
Bureau of Indian Education (BIE) school. Indicator of whether or not a school was also reported by the Bureau of Indian Education in their submission of school data. Only schools not operated by the BIE can be flagged with a value of “1” (“Yes”).
1 = Yes.
2 = No. Count of students eligible to participate in the Free Lunch Program under the National School Lunch Act. Count of students eligible to participate in the Reduced-Price Lunch Program under the National School Lunch Act. Total of free lunch eligible and reduced-price lunch eligible. The total is only available if both of the details (or the total) were reported. Race/ethnicities categories indicator. Indicates whether state reported student enrollment counts by five race/ethnicity categories or seven race/ethnicity categories. 5 = State reported student enrollment counts in the following five race/ethnicity categories: (a) American Indian/Alaska Native; (b) Asian/Pacific Islander; (c) Hispanic; (d) Black, non-Hispanic; and (e) White, non-Hispanic. 7 = State reported student enrollment counts in the following seven race/ethnicity categories: (a) American Indian/Alaska Native; (b) Asian; (c) Hispanic; (d) Black; (e) White; (f) Hawaiian Native/Pacific Islander; and (g) Two or more races. Total prekindergarten students. Prekindergarten students - American Indian/Alaska Native - male. Prekindergarten students - American Indian/Alaska Native - female. Prekindergarten students - Asian - male. Prekindergarten students - Asian - female. Prekindergarten students - Hispanic - male. Prekindergarten students - Hispanic - female. Prekindergarten students - Black, non-Hispanic - male. Prekindergarten students - Black, non-Hispanic - female. Prekindergarten students - White, non-Hispanic - male. Prekindergarten students - White, non-Hispanic - female. Prekindergarten students - Hawaiian Native/Pacific Islander - male. Prekindergarten students - Hawaiian Native/Pacific Islander - female. Prekindergarten students - Two or more races - male.
A-8
Appendix A—Record Layout for the Common Core of Data Public Elementary/Secondary School Universe Survey: School Year 2009–10
Variable Name
Order
Data Type
Description
TRPKF09
KG09
AMKGM09
AMKGF09
ASKGM09
ASKGF09
HIKGM09
HIKGF09
BLKGM09
BLKGF09
WHKGM09
WHKGF09
HPKGM09
HPKGF09
TRKGM09
TRKGF09
G0109
AM01M09
AM01F09
AS01M09
AS01F09
HI01M09
HI01F09
BL01M09
BL01F09
WH01M09
WH01F09
56
57
58
59
60
61
62
63
64
65
66
67
68
69
70
71
72
73
74
75
76
77
78
79
80
81
82
N
N
N
N
N
N
N
N
N
N
N
N
N
N
N
N
N
N
N
N
N
N
N
N
N
N
N
Prekindergarten students - Two or more races - female. Total kindergarten students. Kindergarten students - American Indian/Alaska Native - male. Kindergarten students - American Indian/Alaska Native - female. Kindergarten students - Asian - male. Kindergarten students - Asian - female. Kindergarten students - Hispanic - male. Kindergarten students - Hispanic - female. Kindergarten students - Black, non-Hispanic - male. Kindergarten students - Black, non-Hispanic - female. Kindergarten students - White, non-Hispanic - male. Kindergarten students - White, non-Hispanic - female. Kindergarten students - Hawaiian Native/Pacific Islander - male. Kindergarten students - Hawaiian Native/Pacific Islander - female. Kindergarten students - Two or more races - male. Kindergarten students - Two or more races - female. Total grade 1 students. Grade 1 students - American Indian/Alaska Native - male. Grade 1 students - American Indian/Alaska Native - female. Grade 1 students - Asian - male. Grade 1 students - Asian - female. Grade 1 students - Hispanic - male. Grade 1 students - Hispanic - female. Grade 1 students - Black, non-Hispanic - male. Grade 1 students - Black, non-Hispanic - female. Grade 1 students - White, non-Hispanic - male. Grade 1 students - White, non-Hispanic - female.
A-9
Appendix A—Record Layout for the Common Core of Data Public Elementary/Secondary School Universe Survey: School Year 2009–10
Variable Name
Order
Data Type
Description
HP01M09
HP01F09
TR01M09
TR01F09
G0209
AM02M09
AM02F09
AS02M09
AS02F09
HI02M09
HI02F09
BL02M09
BL02F09
WH02M09
WH02F09
HP02M09
HP02F09
TR02M09
TR02F09
G0309
AM03M09
AM03F09
AS03M09
AS03F09
HI03M09
HI03F09
BL03M09
83
84
85
86
87
88
89
90
91
92
93
94
95
96
97
98
99
100
101
102
103
104
105
106
107
108
109
N
N
N
N
N
N
N
N
N
N
N
N
N
N
N
N
N
N
N
N
N
N
N
N
N
N
N
Grade 1 students - Hawaiian Native/Pacific Islander - male. Grade 1 students - Hawaiian Native/Pacific Islander - female. Grade 1 students - Two or more races - male. Grade 1 students - Two or more races - female. Total grade 2 students. Grade 2 students - American Indian/Alaska Native - male. Grade 2 students - American Indian/Alaska Native - female. Grade 2 students - Asian - male. Grade 2 students - Asian - female. Grade 2 students - Hispanic - male. Grade 2 students - Hispanic - female. Grade 2 students - Black, non-Hispanic - male. Grade 2 students - Black, non-Hispanic - female. Grade 2 students - White, non-Hispanic - male. Grade 2 students - White, non-Hispanic - female. Grade 2 students - Hawaiian Native/Pacific Islander - male. Grade 2 students - Hawaiian Native/Pacific Islander - female. Grade 2 students - Two or more races - male. Grade 2 students - Two or more races - female. Total grade 3 students. Grade 3 students - American Indian/Alaska Native - male. Grade 3 students - American Indian/Alaska Native - female. Grade 3 students - Asian - male. Grade 3 students - Asian - female. Grade 3 students - Hispanic - male. Grade 3 students - Hispanic - female. Grade 3 students - Black, non-Hispanic - male.
A-10
Appendix A—Record Layout for the Common Core of Data Public Elementary/Secondary School Universe Survey: School Year 2009–10
Variable Name
Order
Data Type
Description
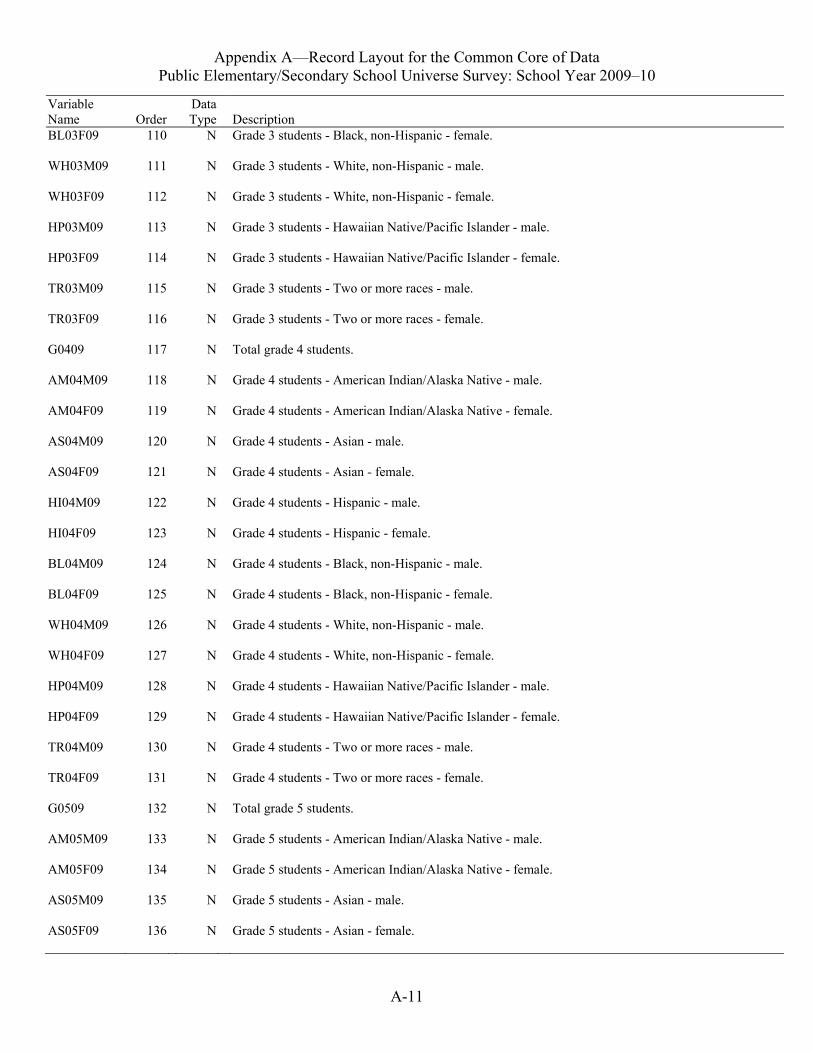
BL03F09
WH03M09
WH03F09
HP03M09
HP03F09
TR03M09
TR03F09
G0409
AM04M09
AM04F09
AS04M09
AS04F09
HI04M09
HI04F09
BL04M09
BL04F09
WH04M09
WH04F09
HP04M09
HP04F09
TR04M09
TR04F09
G0509
AM05M09
AM05F09
AS05M09
AS05F09
110
111
112
113
114
115
116
117
118
119
120
121
122
123
124
125
126
127
128
129
130
131
132
133
134
135
136
N
N
N
N
N
N
N
N
N
N
N
N
N
N
N
N
N
N
N
N
N
N
N
N
N
N
N
Grade 3 students - Black, non-Hispanic - female. Grade 3 students - White, non-Hispanic - male. Grade 3 students - White, non-Hispanic - female. Grade 3 students - Hawaiian Native/Pacific Islander - male. Grade 3 students - Hawaiian Native/Pacific Islander - female. Grade 3 students - Two or more races - male. Grade 3 students - Two or more races - female. Total grade 4 students. Grade 4 students - American Indian/Alaska Native - male. Grade 4 students - American Indian/Alaska Native - female. Grade 4 students - Asian - male. Grade 4 students - Asian - female. Grade 4 students - Hispanic - male. Grade 4 students - Hispanic - female. Grade 4 students - Black, non-Hispanic - male. Grade 4 students - Black, non-Hispanic - female. Grade 4 students - White, non-Hispanic - male. Grade 4 students - White, non-Hispanic - female. Grade 4 students - Hawaiian Native/Pacific Islander - male. Grade 4 students - Hawaiian Native/Pacific Islander - female. Grade 4 students - Two or more races - male. Grade 4 students - Two or more races - female. Total grade 5 students. Grade 5 students - American Indian/Alaska Native - male. Grade 5 students - American Indian/Alaska Native - female. Grade 5 students - Asian - male. Grade 5 students - Asian - female.
A-11
Appendix A—Record Layout for the Common Core of Data Public Elementary/Secondary School Universe Survey: School Year 2009–10
Variable Name
Order
Data Type
Description
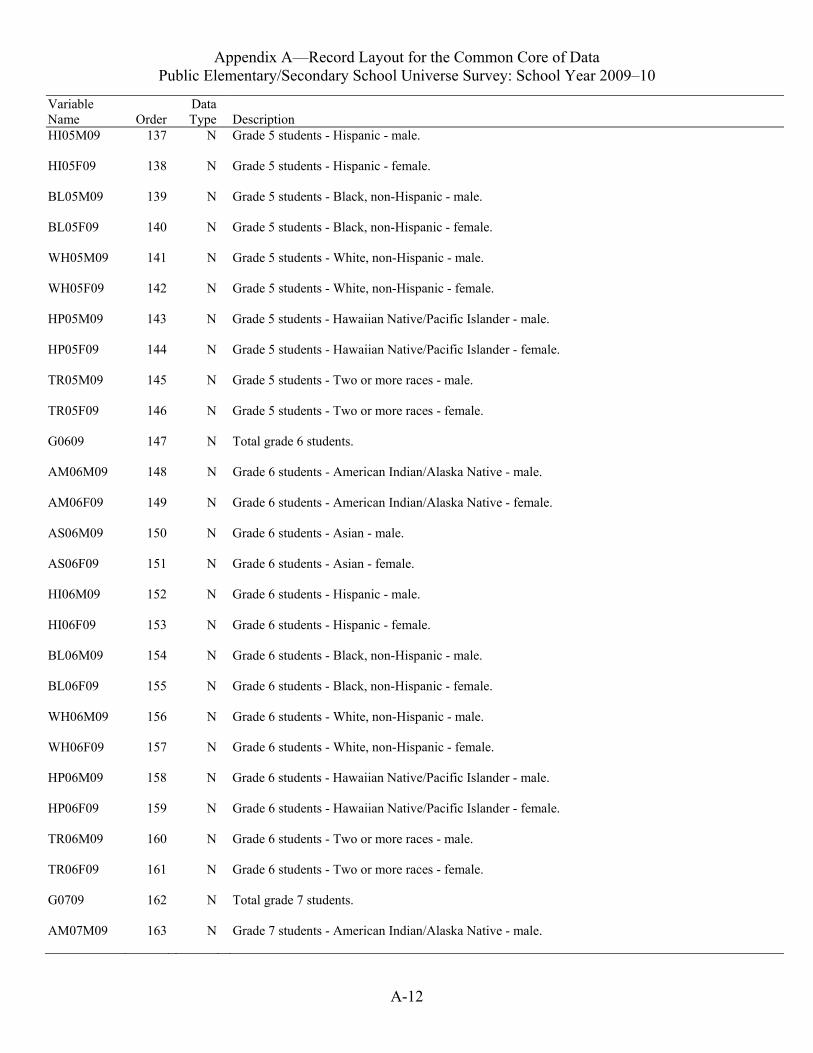
HI05M09
HI05F09
BL05M09
BL05F09
WH05M09
WH05F09
HP05M09
HP05F09
TR05M09
TR05F09
G0609
AM06M09
AM06F09
AS06M09
AS06F09
HI06M09
HI06F09
BL06M09
BL06F09
WH06M09
WH06F09
HP06M09
HP06F09
TR06M09
TR06F09
G0709
AM07M09
137
138
139
140
141
142
143
144
145
146
147
148
149
150
151
152
153
154
155
156
157
158
159
160
161
162
163
N
N
N
N
N
N
N
N
N
N
N
N
N
N
N
N
N
N
N
N
N
N
N
N
N
N
N
Grade 5 students - Hispanic - male. Grade 5 students - Hispanic - female. Grade 5 students - Black, non-Hispanic - male. Grade 5 students - Black, non-Hispanic - female. Grade 5 students - White, non-Hispanic - male. Grade 5 students - White, non-Hispanic - female. Grade 5 students - Hawaiian Native/Pacific Islander - male. Grade 5 students - Hawaiian Native/Pacific Islander - female. Grade 5 students - Two or more races - male. Grade 5 students - Two or more races - female. Total grade 6 students. Grade 6 students - American Indian/Alaska Native - male. Grade 6 students - American Indian/Alaska Native - female. Grade 6 students - Asian - male. Grade 6 students - Asian - female. Grade 6 students - Hispanic - male. Grade 6 students - Hispanic - female. Grade 6 students - Black, non-Hispanic - male. Grade 6 students - Black, non-Hispanic - female. Grade 6 students - White, non-Hispanic - male. Grade 6 students - White, non-Hispanic - female. Grade 6 students - Hawaiian Native/Pacific Islander - male. Grade 6 students - Hawaiian Native/Pacific Islander - female. Grade 6 students - Two or more races - male. Grade 6 students - Two or more races - female. Total grade 7 students. Grade 7 students - American Indian/Alaska Native - male.
A-12
Appendix A—Record Layout for the Common Core of Data Public Elementary/Secondary School Universe Survey: School Year 2009–10
Variable Name
Order
Data Type
Description
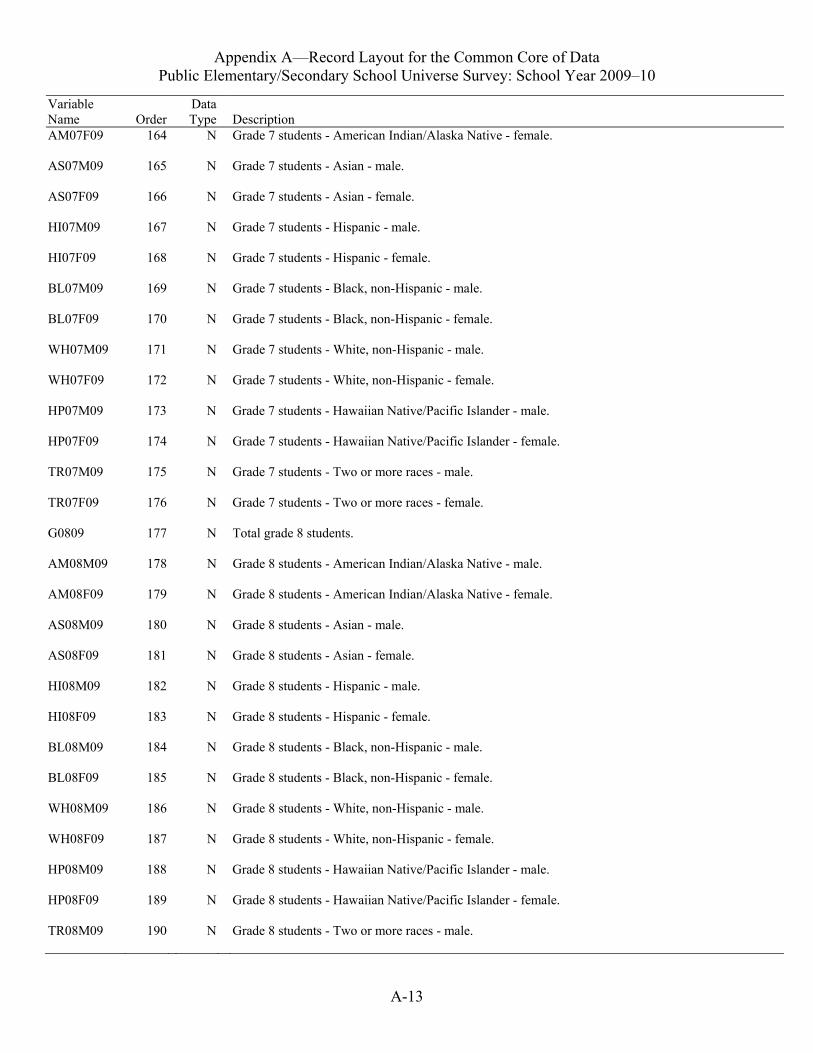
AM07F09
AS07M09
AS07F09
HI07M09
HI07F09
BL07M09
BL07F09
WH07M09
WH07F09
HP07M09
HP07F09
TR07M09
TR07F09
G0809
AM08M09
AM08F09
AS08M09
AS08F09
HI08M09
HI08F09
BL08M09
BL08F09
WH08M09
WH08F09
HP08M09
HP08F09
TR08M09
164
165
166
167
168
169
170
171
172
173
174
175
176
177
178
179
180
181
182
183
184
185
186
187
188
189
190
N
N
N
N
N
N
N
N
N
N
N
N
N
N
N
N
N
N
N
N
N
N
N
N
N
N
N
Grade 7 students - American Indian/Alaska Native - female. Grade 7 students - Asian - male. Grade 7 students - Asian - female. Grade 7 students - Hispanic - male. Grade 7 students - Hispanic - female. Grade 7 students - Black, non-Hispanic - male. Grade 7 students - Black, non-Hispanic - female. Grade 7 students - White, non-Hispanic - male. Grade 7 students - White, non-Hispanic - female. Grade 7 students - Hawaiian Native/Pacific Islander - male. Grade 7 students - Hawaiian Native/Pacific Islander - female. Grade 7 students - Two or more races - male. Grade 7 students - Two or more races - female. Total grade 8 students. Grade 8 students - American Indian/Alaska Native - male. Grade 8 students - American Indian/Alaska Native - female. Grade 8 students - Asian - male. Grade 8 students - Asian - female. Grade 8 students - Hispanic - male. Grade 8 students - Hispanic - female. Grade 8 students - Black, non-Hispanic - male. Grade 8 students - Black, non-Hispanic - female. Grade 8 students - White, non-Hispanic - male. Grade 8 students - White, non-Hispanic - female. Grade 8 students - Hawaiian Native/Pacific Islander - male. Grade 8 students - Hawaiian Native/Pacific Islander - female. Grade 8 students - Two or more races - male.
A-13
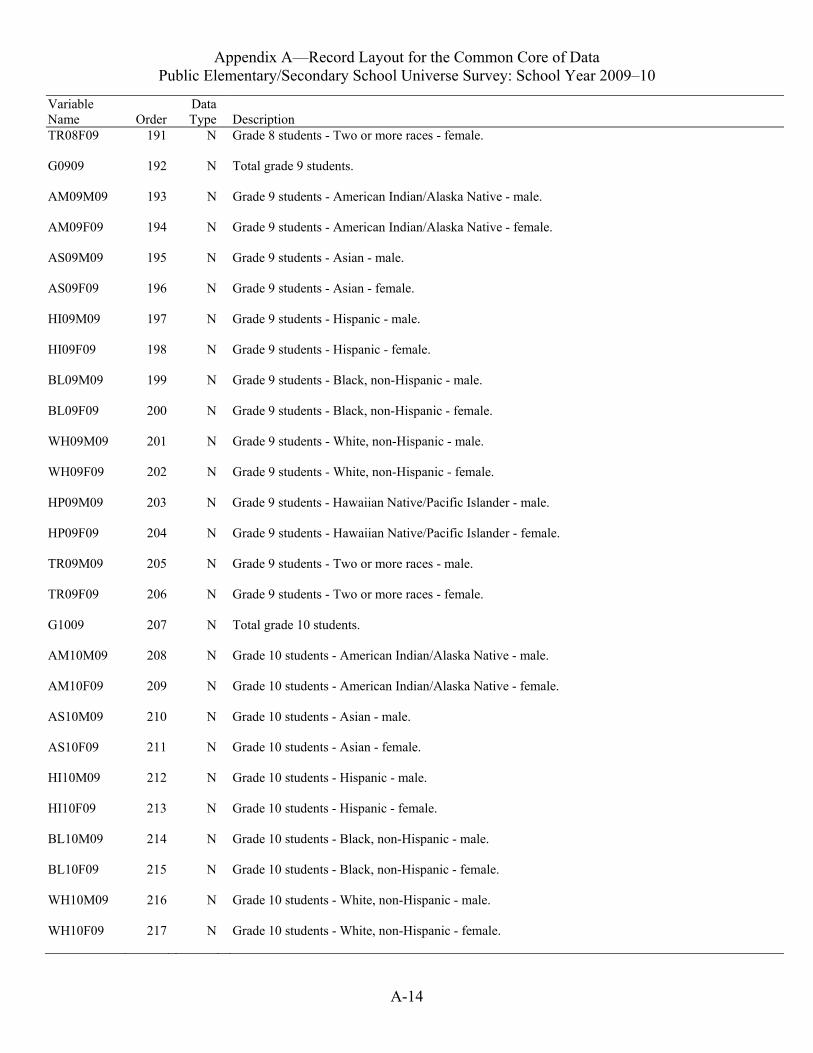
Appendix A—Record Layout for the Common Core of Data Public Elementary/Secondary School Universe Survey: School Year 2009–10
Variable Name
Order
Data Type
Description
TR08F09
G0909
AM09M09
AM09F09
AS09M09
AS09F09
HI09M09
HI09F09
BL09M09
BL09F09
WH09M09
WH09F09
HP09M09
HP09F09
TR09M09
TR09F09
G1009
AM10M09
AM10F09
AS10M09
AS10F09
HI10M09
HI10F09
BL10M09
BL10F09
WH10M09
WH10F09
191
192
193
194
195
196
197
198
199
200
201
202
203
204
205
206
207
208
209
210
211
212
213
214
215
216
217
N
N
N
N
N
N
N
N
N
N
N
N
N
N
N
N
N
N
N
N
N
N
N
N
N
N
N
Grade 8 students - Two or more races - female. Total grade 9 students. Grade 9 students - American Indian/Alaska Native - male. Grade 9 students - American Indian/Alaska Native - female. Grade 9 students - Asian - male. Grade 9 students - Asian - female. Grade 9 students - Hispanic - male. Grade 9 students - Hispanic - female. Grade 9 students - Black, non-Hispanic - male. Grade 9 students - Black, non-Hispanic - female. Grade 9 students - White, non-Hispanic - male. Grade 9 students - White, non-Hispanic - female. Grade 9 students - Hawaiian Native/Pacific Islander - male. Grade 9 students - Hawaiian Native/Pacific Islander - female. Grade 9 students - Two or more races - male. Grade 9 students - Two or more races - female. Total grade 10 students. Grade 10 students - American Indian/Alaska Native - male. Grade 10 students - American Indian/Alaska Native - female. Grade 10 students - Asian - male. Grade 10 students - Asian - female. Grade 10 students - Hispanic - male. Grade 10 students - Hispanic - female. Grade 10 students - Black, non-Hispanic - male. Grade 10 students - Black, non-Hispanic - female. Grade 10 students - White, non-Hispanic - male. Grade 10 students - White, non-Hispanic - female.
A-14
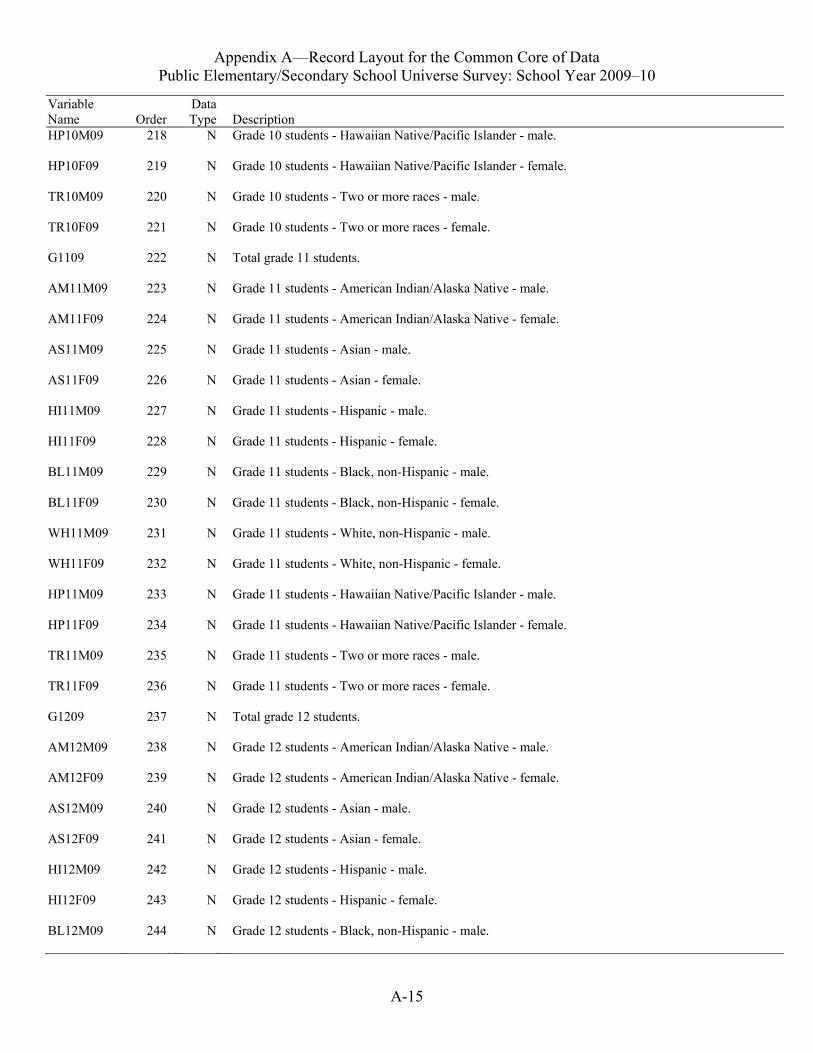
Appendix A—Record Layout for the Common Core of Data Public Elementary/Secondary School Universe Survey: School Year 2009–10
Variable Name
Order
Data Type
Description
HP10M09
HP10F09
TR10M09
TR10F09
G1109
AM11M09
AM11F09
AS11M09
AS11F09
HI11M09
HI11F09
BL11M09
BL11F09
WH11M09
WH11F09
HP11M09
HP11F09
TR11M09
TR11F09
G1209
AM12M09
AM12F09
AS12M09
AS12F09
HI12M09
HI12F09
BL12M09
218
219
220
221
222
223
224
225
226
227
228
229
230
231
232
233
234
235
236
237
238
239
240
241
242
243
244
N
N
N
N
N
N
N
N
N
N
N
N
N
N
N
N
N
N
N
N
N
N
N
N
N
N
N
Grade 10 students - Hawaiian Native/Pacific Islander - male. Grade 10 students - Hawaiian Native/Pacific Islander - female. Grade 10 students - Two or more races - male. Grade 10 students - Two or more races - female. Total grade 11 students. Grade 11 students - American Indian/Alaska Native - male. Grade 11 students - American Indian/Alaska Native - female. Grade 11 students - Asian - male. Grade 11 students - Asian - female. Grade 11 students - Hispanic - male. Grade 11 students - Hispanic - female. Grade 11 students - Black, non-Hispanic - male. Grade 11 students - Black, non-Hispanic - female. Grade 11 students - White, non-Hispanic - male. Grade 11 students - White, non-Hispanic - female. Grade 11 students - Hawaiian Native/Pacific Islander - male. Grade 11 students - Hawaiian Native/Pacific Islander - female. Grade 11 students - Two or more races - male. Grade 11 students - Two or more races - female. Total grade 12 students. Grade 12 students - American Indian/Alaska Native - male. Grade 12 students - American Indian/Alaska Native - female. Grade 12 students - Asian - male. Grade 12 students - Asian - female. Grade 12 students - Hispanic - male. Grade 12 students - Hispanic - female. Grade 12 students - Black, non-Hispanic - male.
A-15
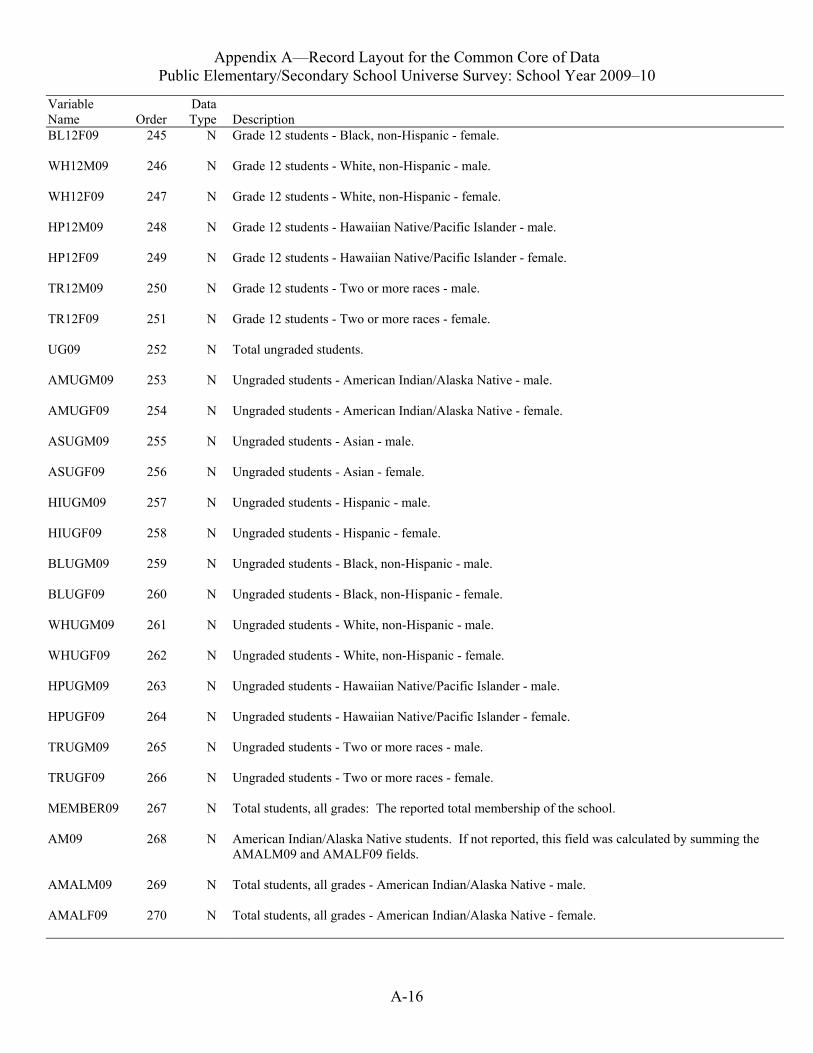
Appendix A—Record Layout for the Common Core of Data Public Elementary/Secondary School Universe Survey: School Year 2009–10
Variable Name
Order
Data Type
Description
BL12F09
WH12M09
WH12F09
HP12M09
HP12F09
TR12M09
TR12F09
UG09
AMUGM09
AMUGF09
ASUGM09
ASUGF09
HIUGM09
HIUGF09
BLUGM09
BLUGF09
WHUGM09
WHUGF09
HPUGM09
HPUGF09
TRUGM09
TRUGF09
MEMBER09
AM09
AMALM09
AMALF09
245
246
247
248
249
250
251
252
253
254
255
256
257
258
259
260
261
262
263
264
265
266
267
268
269
270
N
N
N
N
N
N
N
N
N
N
N
N
N
N
N
N
N
N
N
N
N
N
N
N
N
N
Grade 12 students - Black, non-Hispanic - female. Grade 12 students - White, non-Hispanic - male. Grade 12 students - White, non-Hispanic - female. Grade 12 students - Hawaiian Native/Pacific Islander - male. Grade 12 students - Hawaiian Native/Pacific Islander - female. Grade 12 students - Two or more races - male. Grade 12 students - Two or more races - female. Total ungraded students. Ungraded students - American Indian/Alaska Native - male. Ungraded students - American Indian/Alaska Native - female. Ungraded students - Asian - male. Ungraded students - Asian - female. Ungraded students - Hispanic - male. Ungraded students - Hispanic - female. Ungraded students - Black, non-Hispanic - male. Ungraded students - Black, non-Hispanic - female. Ungraded students - White, non-Hispanic - male. Ungraded students - White, non-Hispanic - female. Ungraded students - Hawaiian Native/Pacific Islander - male. Ungraded students - Hawaiian Native/Pacific Islander - female. Ungraded students - Two or more races - male. Ungraded students - Two or more races - female. Total students, all grades: The reported total membership of the school. American Indian/Alaska Native students. If not reported, this field was calculated by summing the AMALM09 and AMALF09 fields. Total students, all grades - American Indian/Alaska Native - male. Total students, all grades - American Indian/Alaska Native - female.
A-16
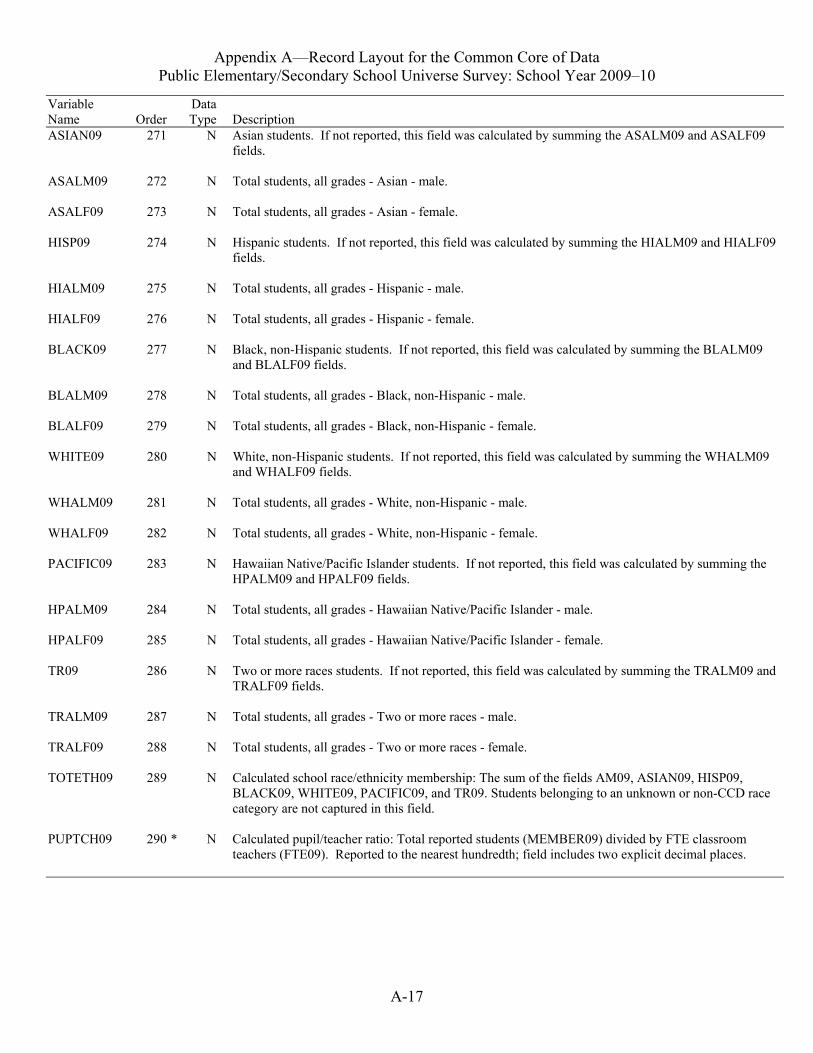
Appendix A—Record Layout for the Common Core of Data Public Elementary/Secondary School Universe Survey: School Year 2009–10
Variable Name
Order
Data Type
Description
ASIAN09
ASALM09
ASALF09
HISP09
HIALM09
HIALF09
BLACK09
BLALM09
BLALF09
WHITE09
WHALM09
WHALF09
PACIFIC09
HPALM09
HPALF09
TR09
TRALM09
TRALF09
TOTETH09
PUPTCH09
271
272
273
274
275
276
277
278
279
280
281
282
283
284
285
286
287
288
289
290 *
N
N
N
N
N
N
N
N
N
N
N
N
N
N
N
N
N
N
N
N
Asian students. If not reported, this field was calculated by summing the ASALM09 and ASALF09 fields. Total students, all grades - Asian - male. Total students, all grades - Asian - female. Hispanic students. If not reported, this field was calculated by summing the HIALM09 and HIALF09 fields. Total students, all grades - Hispanic - male. Total students, all grades - Hispanic - female. Black, non-Hispanic students. If not reported, this field was calculated by summing the BLALM09 and BLALF09 fields. Total students, all grades - Black, non-Hispanic - male. Total students, all grades - Black, non-Hispanic - female. White, non-Hispanic students. If not reported, this field was calculated by summing the WHALM09 and WHALF09 fields. Total students, all grades - White, non-Hispanic - male. Total students, all grades - White, non-Hispanic - female. Hawaiian Native/Pacific Islander students. If not reported, this field was calculated by summing the HPALM09 and HPALF09 fields. Total students, all grades - Hawaiian Native/Pacific Islander - male. Total students, all grades - Hawaiian Native/Pacific Islander - female. Two or more races students. If not reported, this field was calculated by summing the TRALM09 and TRALF09 fields. Total students, all grades - Two or more races - male. Total students, all grades - Two or more races - female. Calculated school race/ethnicity membership: The sum of the fields AM09, ASIAN09, HISP09, BLACK09, WHITE09, PACIFIC09, and TR09. Students belonging to an unknown or non-CCD race category are not captured in this field. Calculated pupil/teacher ratio: Total reported students (MEMBER09) divided by FTE classroom teachers (FTE09). Reported to the nearest hundredth; field includes two explicit decimal places.
A-17
Appendix B—Value Distribution, Field Frequencies, and Data Tables for the Common Core of Data Public Elementary/Secondary School Universe Survey:
School Year 2009–10
B-1

B-2
Page intentionally left blank.
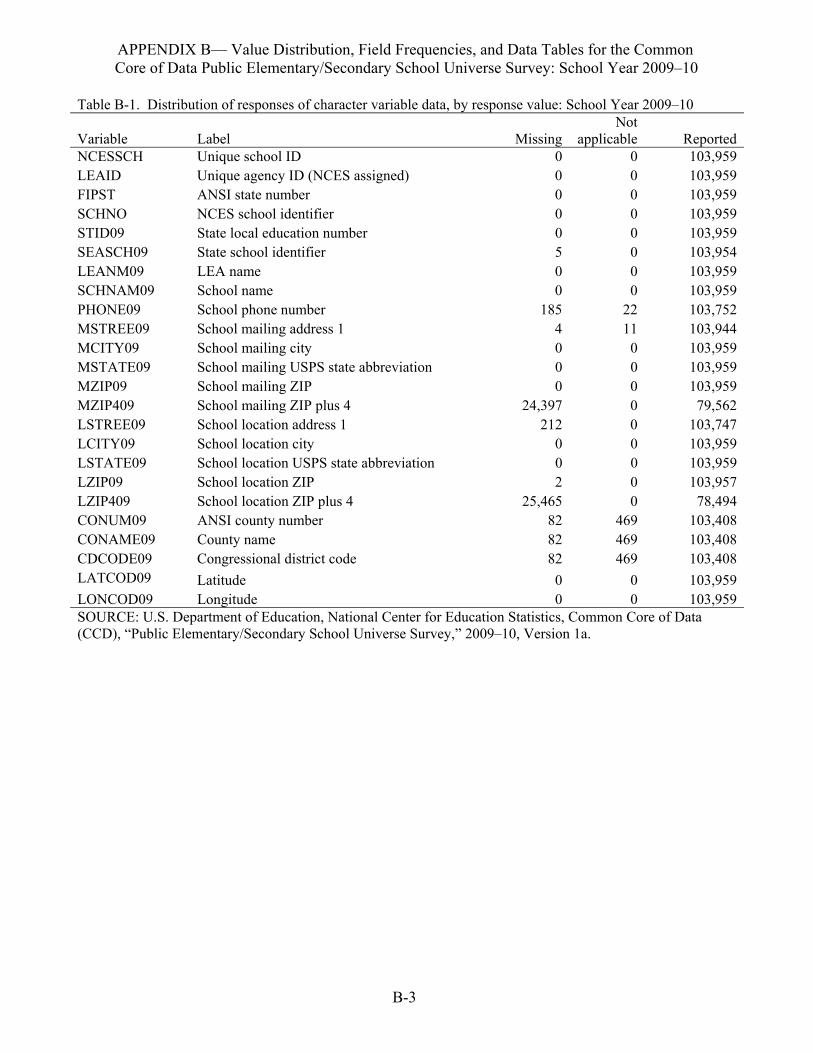
APPENDIX B— Value Distribution, Field Frequencies, and Data Tables for the Common Core of Data Public Elementary/Secondary School Universe Survey: School Year 2009–10
Table B-1. Distribution of responses of character variable data, by response value: School Year 2009–10
Variable Label MissingNot
applicable ReportedNCESSCH LEAID FIPST SCHNO STID09 SEASCH09 LEANM09 SCHNAM09PHONE09 MSTREE09 MCITY09 MSTATE09 MZIP09 MZIP409 LSTREE09 LCITY09 LSTATE09 LZIP09 LZIP409 CONUM09CONAME09CDCODE09 LATCOD09 LONCOD09
Unique school ID Unique agency ID (NCES assigned) ANSI state number NCES school identifier State local education number State school identifier LEA name
School name School phone number School mailing address 1 School mailing city School mailing USPS state abbreviation School mailing ZIP School mailing ZIP plus 4 School location address 1 School location city School location USPS state abbreviation School location ZIP School location ZIP plus 4
ANSI county number County name
Congressional district code Latitude Longitude
00000500
1854000
24,397212
002
25,46582828200
0 0 0 0 0 0 0 0
22 11
0 0 0 0 0 0 0 0 0
469 469 469
00
103,959103,959103,959103,959103,959103,954103,959103,959103,752103,944103,959103,959103,95979,562
103,747103,959103,959103,95778,494
103,408103,408103,408103,959103,959
SOURCE: U.S. Department of Education, National Center for Education Statistics, Common Core of Data (CCD), “Public Elementary/Secondary School Universe Survey,” 2009–10, Version 1a.
B-3
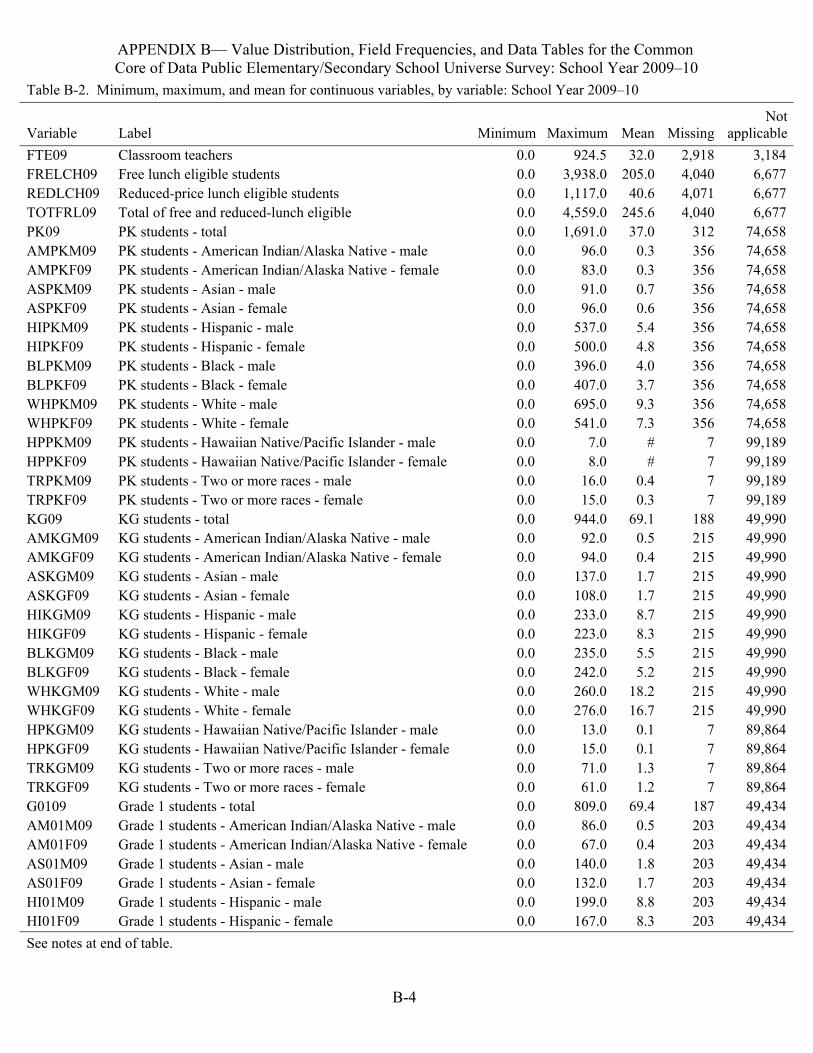
APPENDIX B— Value Distribution, Field Frequencies, and Data Tables for the Common Core of Data Public Elementary/Secondary School Universe Survey: School Year 2009–10
Table B-2. Minimum, maximum, and mean for continuous variables, by variable: School Year 2009–10
Variable Label Minimum Maximum Mean MissingNot
applicableFTE09 FRELCH09 REDLCH09 TOTFRL09 PK09 AMPKM09 AMPKF09 ASPKM09 ASPKF09 HIPKM09 HIPKF09 BLPKM09 BLPKF09 WHPKM09 WHPKF09 HPPKM09 HPPKF09 TRPKM09 TRPKF09 KG09 AMKGM09 AMKGF09 ASKGM09 ASKGF09 HIKGM09 HIKGF09 BLKGM09 BLKGF09 WHKGM09 WHKGF09 HPKGM09 HPKGF09 TRKGM09 TRKGF09 G0109 AM01M09 AM01F09 AS01M09 AS01F09 HI01M09 HI01F09
Classroom teachers Free lunch eligible students Reduced-price lunch eligible students Total of free and reduced-lunch eligible PK students - total PK students - American Indian/Alaska Native - male PK students - American Indian/Alaska Native - female PK students - Asian - male PK students - Asian - female PK students - Hispanic - male PK students - Hispanic - female PK students - Black - male PK students - Black - female PK students - White - male PK students - White - female PK students - Hawaiian Native/Pacific Islander - male PK students - Hawaiian Native/Pacific Islander - female PK students - Two or more races - male PK students - Two or more races - female KG students - total KG students - American Indian/Alaska Native - male KG students - American Indian/Alaska Native - female KG students - Asian - male KG students - Asian - female KG students - Hispanic - male KG students - Hispanic - female KG students - Black - male KG students - Black - female KG students - White - male KG students - White - female KG students - Hawaiian Native/Pacific Islander - male KG students - Hawaiian Native/Pacific Islander - female KG students - Two or more races - male KG students - Two or more races - female Grade 1 students - total Grade 1 students - American Indian/Alaska Native - male Grade 1 students - American Indian/Alaska Native - female Grade 1 students - Asian - male Grade 1 students - Asian - female Grade 1 students - Hispanic - male Grade 1 students - Hispanic - female
0.00.00.00.00.00.00.00.00.00.00.00.00.00.00.00.00.00.00.00.00.00.00.00.00.00.00.00.00.00.00.00.00.00.00.00.00.00.00.00.00.0
924.5 3,938.0 1,117.0 4,559.0 1,691.0
96.0 83.0 91.0 96.0
537.0 500.0 396.0 407.0 695.0 541.0
7.0 8.0
16.0 15.0
944.0 92.0 94.0
137.0 108.0 233.0 223.0 235.0 242.0 260.0 276.0 13.0 15.0 71.0 61.0
809.0 86.0 67.0
140.0 132.0 199.0 167.0
32.0205.040.6
245.637.0
0.30.30.70.65.44.84.03.79.37.3
##
0.40.3
69.10.50.41.71.78.78.35.55.2
18.216.70.10.11.31.2
69.40.50.41.81.78.88.3
2,9184,0404,0714,040
312356356356356356356356356356356
7777
188215215215215215215215215215215
7777
187203203203203203203
3,1846,6776,6776,677
74,65874,65874,65874,65874,65874,65874,65874,65874,65874,65874,65899,18999,18999,18999,18949,99049,99049,99049,99049,99049,99049,99049,99049,99049,99049,99089,86489,86489,86489,86449,43449,43449,43449,43449,43449,43449,434
See notes at end of table.
B-4
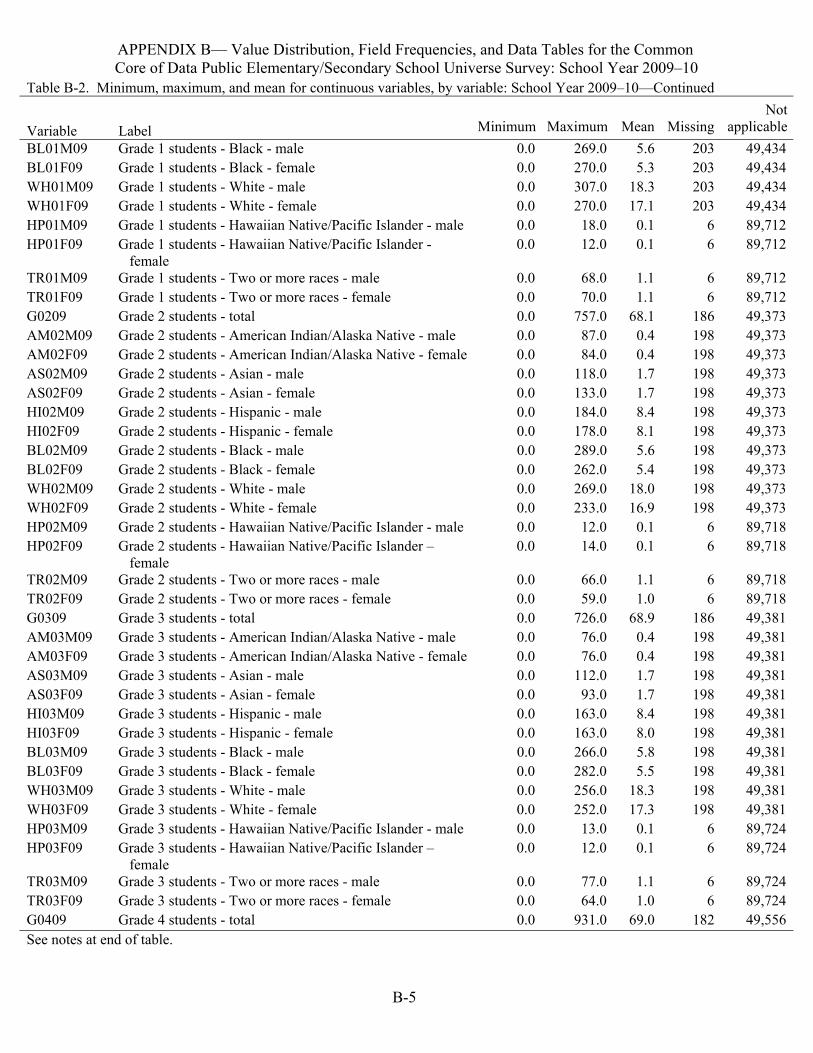
APPENDIX B— Value Distribution, Field Frequencies, and Data Tables for the Common Core of Data Public Elementary/Secondary School Universe Survey: School Year 2009–10
Table B-2. Minimum, maximum, and mean for continuous variables, by variable: School Year 2009–10—Continued
Variable Label Minimum Maximum Mean MissingNot
applicableBL01M09 BL01F09 WH01M09 WH01F09 HP01M09 HP01F09
TR01M09 TR01F09 G0209 AM02M09 AM02F09 AS02M09 AS02F09 HI02M09 HI02F09 BL02M09 BL02F09 WH02M09 WH02F09 HP02M09 HP02F09
TR02M09 TR02F09 G0309 AM03M09 AM03F09 AS03M09 AS03F09 HI03M09 HI03F09 BL03M09 BL03F09 WH03M09 WH03F09 HP03M09 HP03F09
TR03M09 TR03F09 G0409
Grade 1 students - Black - male Grade 1 students - Black - female Grade 1 students - White - male Grade 1 students - White - female Grade 1 students - Hawaiian Native/Pacific Islander - male Grade 1 students - Hawaiian Native/Pacific Islander - female Grade 1 students - Two or more races - male Grade 1 students - Two or more races - female Grade 2 students - total Grade 2 students - American Indian/Alaska Native - male Grade 2 students - American Indian/Alaska Native - female Grade 2 students - Asian - male Grade 2 students - Asian - female Grade 2 students - Hispanic - male Grade 2 students - Hispanic - female Grade 2 students - Black - male Grade 2 students - Black - female Grade 2 students - White - male Grade 2 students - White - female Grade 2 students - Hawaiian Native/Pacific Islander - male Grade 2 students - Hawaiian Native/Pacific Islander – female Grade 2 students - Two or more races - male Grade 2 students - Two or more races - female Grade 3 students - total Grade 3 students - American Indian/Alaska Native - male Grade 3 students - American Indian/Alaska Native - female Grade 3 students - Asian - male Grade 3 students - Asian - female Grade 3 students - Hispanic - male Grade 3 students - Hispanic - female Grade 3 students - Black - male Grade 3 students - Black - female Grade 3 students - White - male Grade 3 students - White - female Grade 3 students - Hawaiian Native/Pacific Islander - male Grade 3 students - Hawaiian Native/Pacific Islander – female Grade 3 students - Two or more races - male Grade 3 students - Two or more races - female Grade 4 students - total
0.00.00.00.00.00.0
0.00.00.00.00.00.00.00.00.00.00.00.00.00.00.0
0.00.00.00.00.00.00.00.00.00.00.00.00.00.00.0
0.00.00.0
269.0 270.0 307.0 270.0 18.0 12.0
68.0 70.0
757.0 87.0 84.0
118.0 133.0 184.0 178.0 289.0 262.0 269.0 233.0 12.0 14.0
66.0 59.0
726.0 76.0 76.0
112.0 93.0
163.0 163.0 266.0 282.0 256.0 252.0 13.0 12.0
77.0 64.0
931.0
5.65.3
18.317.1
0.10.1
1.11.1
68.10.40.41.71.78.48.15.65.4
18.016.9
0.10.1
1.11.0
68.90.40.41.71.78.48.05.85.5
18.317.3
0.10.1
1.11.0
69.0
203203203203
66
66
186198198198198198198198198198198
66
66
186198198198198198198198198198198
66
66
182
49,43449,43449,43449,43489,71289,712
89,71289,71249,37349,37349,37349,37349,37349,37349,37349,37349,37349,37349,37389,71889,718
89,71889,71849,38149,38149,38149,38149,38149,38149,38149,38149,38149,38149,38189,72489,724
89,72489,72449,556
See notes at end of table.
B-5
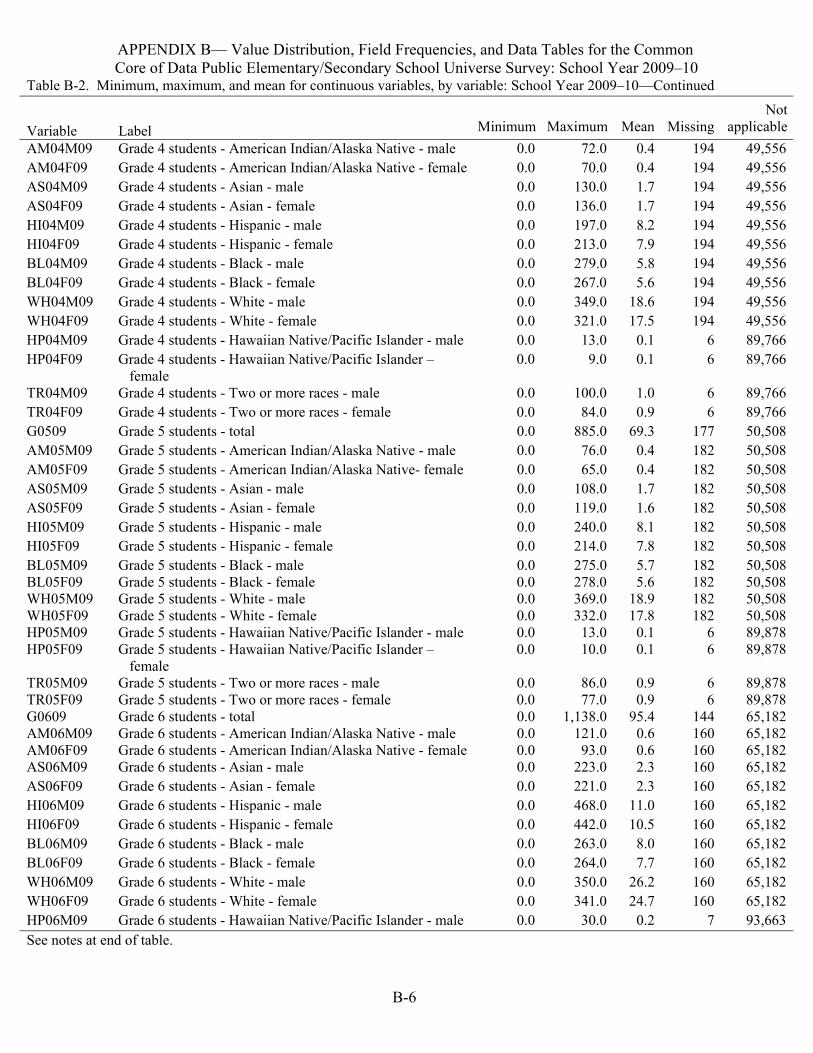
APPENDIX B— Value Distribution, Field Frequencies, and Data Tables for the Common Core of Data Public Elementary/Secondary School Universe Survey: School Year 2009–10
Table B-2. Minimum, maximum, and mean for continuous variables, by variable: School Year 2009–10—Continued
Variable Label Minimum Maximum Mean MissingNot
applicableAM04M09 AM04F09 AS04M09 AS04F09 HI04M09 HI04F09 BL04M09 BL04F09 WH04M09 WH04F09 HP04M09 HP04F09
TR04M09 TR04F09 G0509 AM05M09 AM05F09 AS05M09 AS05F09 HI05M09 HI05F09 BL05M09 BL05F09 WH05M09 WH05F09 HP05M09 HP05F09
TR05M09 TR05F09 G0609 AM06M09 AM06F09 AS06M09 AS06F09 HI06M09 HI06F09 BL06M09 BL06F09 WH06M09 WH06F09 HP06M09
Grade 4 students - American Indian/Alaska Native - male Grade 4 students - American Indian/Alaska Native - female Grade 4 students - Asian - male Grade 4 students - Asian - female Grade 4 students - Hispanic - male Grade 4 students - Hispanic - female Grade 4 students - Black - male Grade 4 students - Black - female Grade 4 students - White - male Grade 4 students - White - female Grade 4 students - Hawaiian Native/Pacific Islander - male Grade 4 students - Hawaiian Native/Pacific Islander – female Grade 4 students - Two or more races - male Grade 4 students - Two or more races - female Grade 5 students - total Grade 5 students - American Indian/Alaska Native - male Grade 5 students - American Indian/Alaska Native- female Grade 5 students - Asian - male Grade 5 students - Asian - female Grade 5 students - Hispanic - male Grade 5 students - Hispanic - female Grade 5 students - Black - male Grade 5 students - Black - female Grade 5 students - White - male Grade 5 students - White - female Grade 5 students - Hawaiian Native/Pacific Islander - male Grade 5 students - Hawaiian Native/Pacific Islander – female Grade 5 students - Two or more races - male Grade 5 students - Two or more races - female Grade 6 students - total Grade 6 students - American Indian/Alaska Native - male Grade 6 students - American Indian/Alaska Native - female Grade 6 students - Asian - male Grade 6 students - Asian - female Grade 6 students - Hispanic - male Grade 6 students - Hispanic - female Grade 6 students - Black - male Grade 6 students - Black - female Grade 6 students - White - male Grade 6 students - White - female Grade 6 students - Hawaiian Native/Pacific Islander - male
0.00.00.00.00.00.00.00.00.00.00.00.0
0.00.00.00.00.00.00.00.00.00.00.00.00.00.00.0
0.00.00.00.00.00.00.00.00.00.00.00.00.00.0
72.0 70.0
130.0 136.0 197.0 213.0 279.0 267.0 349.0 321.0 13.0 9.0
100.0 84.0
885.0 76.0 65.0
108.0 119.0 240.0 214.0 275.0 278.0 369.0 332.0 13.0 10.0
86.0 77.0
1,138.0 121.0 93.0
223.0 221.0 468.0 442.0 263.0 264.0 350.0 341.0 30.0
0.40.41.71.78.27.95.85.6
18.617.5
0.10.1
1.00.9
69.30.40.41.71.68.17.85.75.6
18.917.8
0.10.1
0.90.9
95.40.60.62.32.3
11.010.5
8.07.7
26.224.7
0.2
194194194194194194194194194194
66
66
177182182182182182182182182182182
66
66
144160160160160160160160160160160
7
49,55649,55649,55649,55649,55649,55649,55649,55649,55649,55689,76689,766
89,76689,76650,50850,50850,50850,50850,50850,50850,50850,50850,50850,50850,50889,87889,878
89,87889,87865,18265,18265,18265,18265,18265,18265,18265,18265,18265,18265,18293,663
See notes at end of table.
B-6
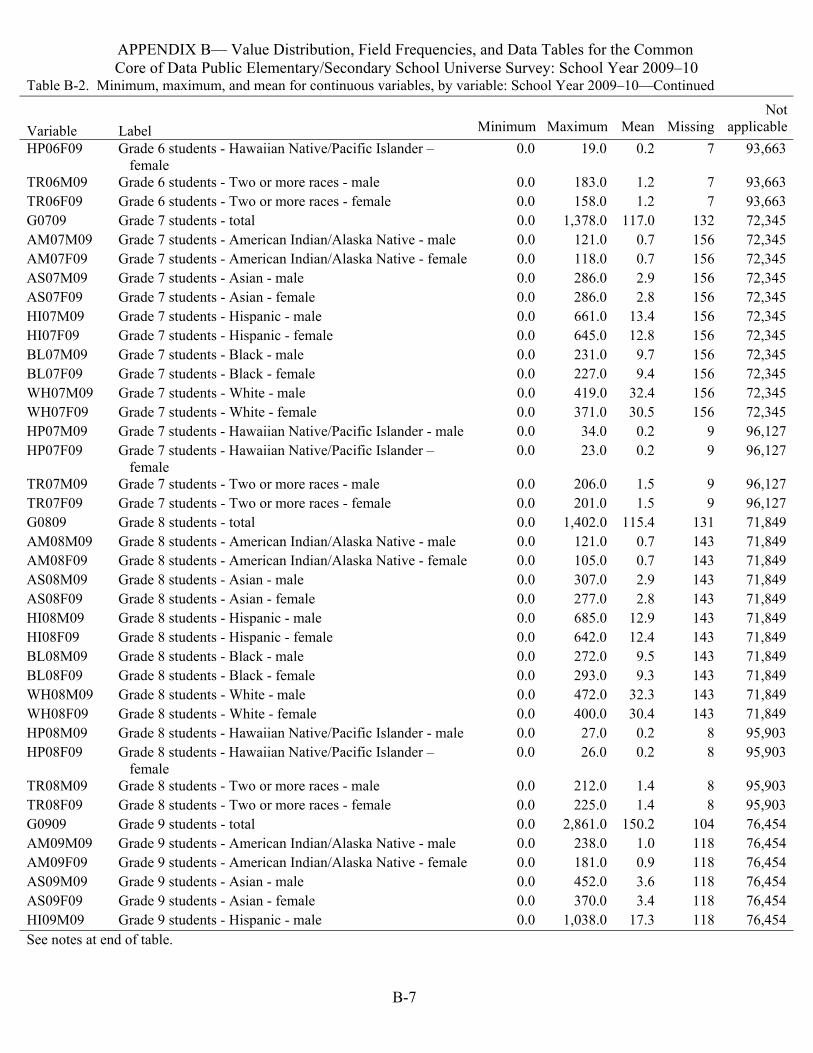
APPENDIX B— Value Distribution, Field Frequencies, and Data Tables for the Common Core of Data Public Elementary/Secondary School Universe Survey: School Year 2009–10
Table B-2. Minimum, maximum, and mean for continuous variables, by variable: School Year 2009–10—Continued
Not Variable Label Minimum Maximum Mean Missing applicableHP06F09 Grade 6 students - Hawaiian Native/Pacific Islander – 0.0 19.0 0.2 7 93,663
female TR06M09 Grade 6 students - Two or more races - male 0.0 183.0 1.2 7 93,663TR06F09 Grade 6 students - Two or more races - female 0.0 158.0 1.2 7 93,663G0709 Grade 7 students - total 0.0 1,378.0 117.0 132 72,345AM07M09 Grade 7 students - American Indian/Alaska Native - male 0.0 121.0 0.7 156 72,345AM07F09 Grade 7 students - American Indian/Alaska Native - female 0.0 118.0 0.7 156 72,345AS07M09 Grade 7 students - Asian - male 0.0 286.0 2.9 156 72,345AS07F09 Grade 7 students - Asian - female 0.0 286.0 2.8 156 72,345HI07M09 Grade 7 students - Hispanic - male 0.0 661.0 13.4 156 72,345HI07F09 Grade 7 students - Hispanic - female 0.0 645.0 12.8 156 72,345BL07M09 Grade 7 students - Black - male 0.0 231.0 9.7 156 72,345BL07F09 Grade 7 students - Black - female 0.0 227.0 9.4 156 72,345WH07M09 Grade 7 students - White - male 0.0 419.0 32.4 156 72,345WH07F09 Grade 7 students - White - female 0.0 371.0 30.5 156 72,345HP07M09 Grade 7 students - Hawaiian Native/Pacific Islander - male 0.0 34.0 0.2 9 96,127HP07F09 Grade 7 students - Hawaiian Native/Pacific Islander – 0.0 23.0 0.2 9 96,127
female TR07M09 Grade 7 students - Two or more races - male 0.0 206.0 1.5 9 96,127TR07F09 Grade 7 students - Two or more races - female 0.0 201.0 1.5 9 96,127G0809 Grade 8 students - total 0.0 1,402.0 115.4 131 71,849AM08M09 Grade 8 students - American Indian/Alaska Native - male 0.0 121.0 0.7 143 71,849AM08F09 Grade 8 students - American Indian/Alaska Native - female 0.0 105.0 0.7 143 71,849AS08M09 Grade 8 students - Asian - male 0.0 307.0 2.9 143 71,849AS08F09 Grade 8 students - Asian - female 0.0 277.0 2.8 143 71,849HI08M09 Grade 8 students - Hispanic - male 0.0 685.0 12.9 143 71,849HI08F09 Grade 8 students - Hispanic - female 0.0 642.0 12.4 143 71,849BL08M09 Grade 8 students - Black - male 0.0 272.0 9.5 143 71,849BL08F09 Grade 8 students - Black - female 0.0 293.0 9.3 143 71,849WH08M09 Grade 8 students - White - male 0.0 472.0 32.3 143 71,849WH08F09 Grade 8 students - White - female 0.0 400.0 30.4 143 71,849HP08M09 Grade 8 students - Hawaiian Native/Pacific Islander - male 0.0 27.0 0.2 8 95,903HP08F09 Grade 8 students - Hawaiian Native/Pacific Islander – 0.0 26.0 0.2 8 95,903
female TR08M09 Grade 8 students - Two or more races - male 0.0 212.0 1.4 8 95,903TR08F09 Grade 8 students - Two or more races - female 0.0 225.0 1.4 8 95,903G0909 Grade 9 students - total 0.0 2,861.0 150.2 104 76,454AM09M09 Grade 9 students - American Indian/Alaska Native - male 0.0 238.0 1.0 118 76,454AM09F09 Grade 9 students - American Indian/Alaska Native - female 0.0 181.0 0.9 118 76,454AS09M09 Grade 9 students - Asian - male 0.0 452.0 3.6 118 76,454AS09F09 Grade 9 students - Asian - female 0.0 370.0 3.4 118 76,454HI09M09 Grade 9 students - Hispanic - male 0.0 1,038.0 17.3 118 76,454See notes at end of table.
B-7
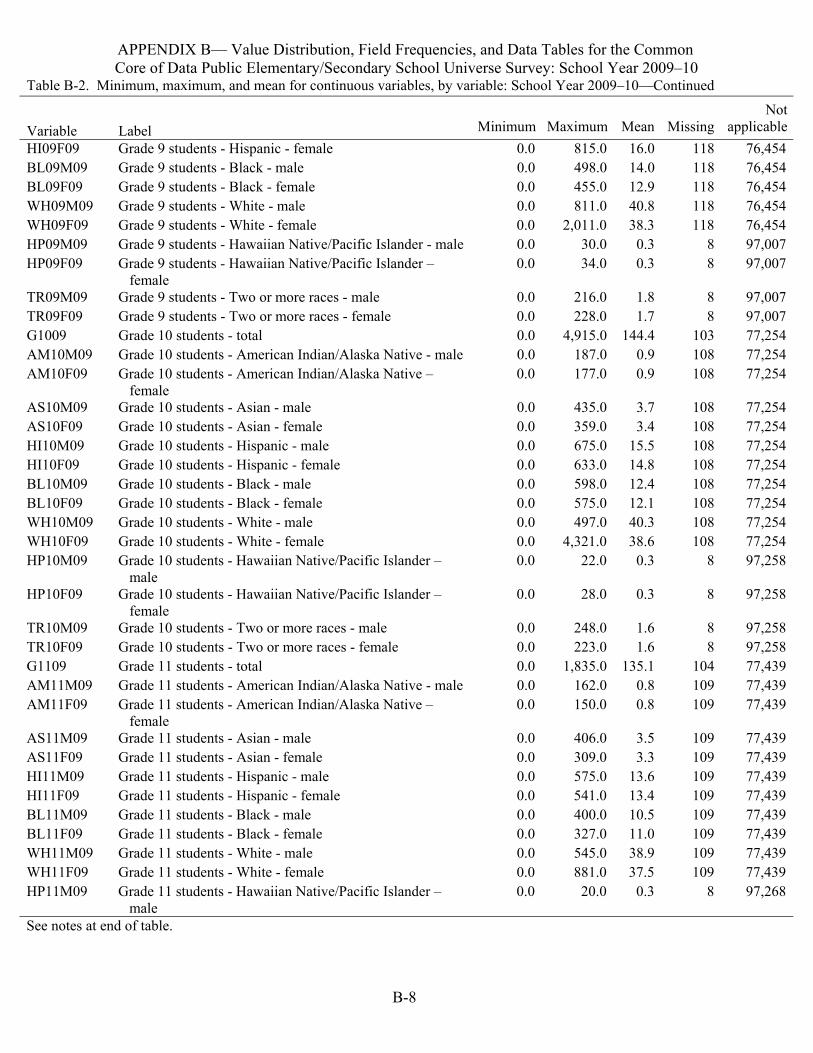
APPENDIX B— Value Distribution, Field Frequencies, and Data Tables for the Common Core of Data Public Elementary/Secondary School Universe Survey: School Year 2009–10
Table B-2. Minimum, maximum, and mean for continuous variables, by variable: School Year 2009–10—Continued
Variable Label Minimum Maximum Mean MissingNot
applicableHI09F09 BL09M09 BL09F09 WH09M09 WH09F09 HP09M09 HP09F09
TR09M09 TR09F09 G1009 AM10M09 AM10F09
AS10M09 AS10F09 HI10M09 HI10F09 BL10M09 BL10F09 WH10M09 WH10F09 HP10M09
HP10F09
TR10M09 TR10F09 G1109 AM11M09 AM11F09
AS11M09 AS11F09 HI11M09 HI11F09 BL11M09 BL11F09 WH11M09 WH11F09 HP11M09
Grade 9 students - Hispanic - female Grade 9 students - Black - male Grade 9 students - Black - female Grade 9 students - White - male Grade 9 students - White - female Grade 9 students - Hawaiian Native/Pacific Islander - male Grade 9 students - Hawaiian Native/Pacific Islander – female Grade 9 students - Two or more races - male Grade 9 students - Two or more races - female Grade 10 students - total Grade 10 students - American Indian/Alaska Native - male Grade 10 students - American Indian/Alaska Native – female Grade 10 students - Asian - male Grade 10 students - Asian - female Grade 10 students - Hispanic - male Grade 10 students - Hispanic - female Grade 10 students - Black - male Grade 10 students - Black - female Grade 10 students - White - male Grade 10 students - White - female Grade 10 students - Hawaiian Native/Pacific Islander – male Grade 10 students - Hawaiian Native/Pacific Islander – female Grade 10 students - Two or more races - male Grade 10 students - Two or more races - female Grade 11 students - total Grade 11 students - American Indian/Alaska Native - male Grade 11 students - American Indian/Alaska Native – female Grade 11 students - Asian - male Grade 11 students - Asian - female Grade 11 students - Hispanic - male Grade 11 students - Hispanic - female Grade 11 students - Black - male Grade 11 students - Black - female Grade 11 students - White - male Grade 11 students - White - female Grade 11 students - Hawaiian Native/Pacific Islander – male
0.00.00.00.00.00.00.0
0.00.00.00.00.0
0.00.00.00.00.00.00.00.00.0
0.0
0.00.00.00.00.0
0.00.00.00.00.00.00.00.00.0
815.0 498.0 455.0 811.0
2,011.0 30.0 34.0
216.0 228.0
4,915.0 187.0 177.0
435.0 359.0 675.0 633.0 598.0 575.0 497.0
4,321.0 22.0
28.0
248.0 223.0
1,835.0 162.0 150.0
406.0 309.0 575.0 541.0 400.0 327.0 545.0 881.0 20.0
16.014.012.940.838.3
0.3 0.3
1.81.7
144.40.9
0.9
3.73.4
15.514.812.412.140.338.6
0.3
0.3
1.61.6
135.10.8
0.8
3.53.3
13.613.410.511.038.937.5
0.3
118118118118118
88
88
103108108
108108108108108108108108
8
8
88
104109109
109109109109109109109109
8
76,45476,45476,45476,45476,45497,00797,007
97,00797,00777,25477,25477,254
77,25477,25477,25477,25477,25477,25477,25477,25497,258
97,258
97,25897,25877,43977,43977,439
77,43977,43977,43977,43977,43977,43977,43977,43997,268
See notes at end of table.
B-8
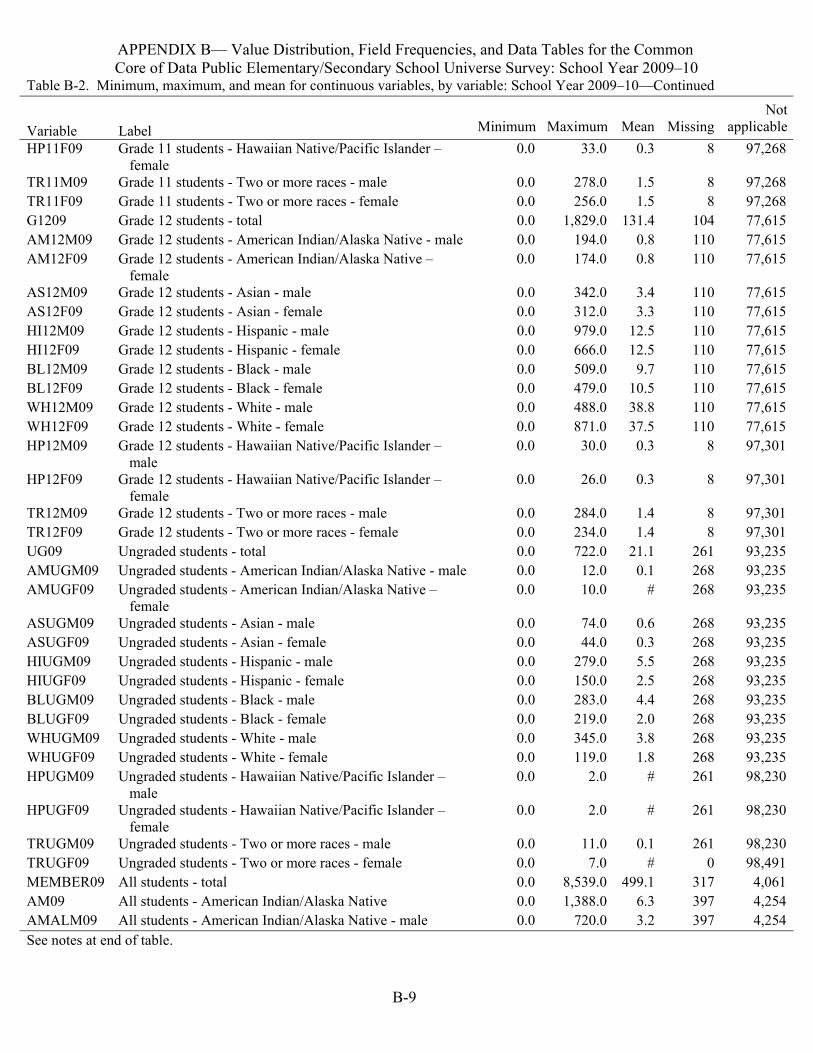
APPENDIX B— Value Distribution, Field Frequencies, and Data Tables for the Common Core of Data Public Elementary/Secondary School Universe Survey: School Year 2009–10
Table B-2. Minimum, maximum, and mean for continuous variables, by variable: School Year 2009–10—Continued
Variable Label Minimum Maximum Mean MissingNot
applicableHP11F09
TR11M09 TR11F09 G1209 AM12M09 AM12F09
AS12M09 AS12F09 HI12M09 HI12F09 BL12M09 BL12F09 WH12M09 WH12F09 HP12M09
HP12F09
TR12M09 TR12F09 UG09 AMUGM09 AMUGF09
ASUGM09 ASUGF09 HIUGM09 HIUGF09 BLUGM09 BLUGF09 WHUGM09 WHUGF09 HPUGM09
HPUGF09
TRUGM09 TRUGF09 MEMBER09 AM09 AMALM09
Grade 11 students - Hawaiian Native/Pacific Islander – female Grade 11 students - Two or more races - male Grade 11 students - Two or more races - female Grade 12 students - total Grade 12 students - American Indian/Alaska Native - male Grade 12 students - American Indian/Alaska Native – female Grade 12 students - Asian - male Grade 12 students - Asian - female Grade 12 students - Hispanic - male Grade 12 students - Hispanic - female Grade 12 students - Black - male Grade 12 students - Black - female Grade 12 students - White - male Grade 12 students - White - female Grade 12 students - Hawaiian Native/Pacific Islander – male Grade 12 students - Hawaiian Native/Pacific Islander – female Grade 12 students - Two or more races - male Grade 12 students - Two or more races - female Ungraded students - total Ungraded students - American Indian/Alaska Native - male Ungraded students - American Indian/Alaska Native – female Ungraded students - Asian - male Ungraded students - Asian - female Ungraded students - Hispanic - male Ungraded students - Hispanic - female Ungraded students - Black - male Ungraded students - Black - female Ungraded students - White - male Ungraded students - White - female Ungraded students - Hawaiian Native/Pacific Islander – male Ungraded students - Hawaiian Native/Pacific Islander – female Ungraded students - Two or more races - male Ungraded students - Two or more races - female All students - total All students - American Indian/Alaska Native All students - American Indian/Alaska Native - male
0.0
0.00.00.00.00.0
0.00.00.00.00.00.00.00.00.0
0.0
0.00.00.00.00.0
0.00.00.00.00.00.00.00.00.0
0.0
0.00.00.00.00.0
33.0
278.0 256.0
1,829.0 194.0 174.0
342.0 312.0 979.0 666.0 509.0 479.0 488.0 871.0 30.0
26.0
284.0 234.0 722.0 12.0 10.0
74.0 44.0
279.0 150.0 283.0 219.0 345.0 119.0
2.0
2.0
11.0 7.0
8,539.0 1,388.0
720.0
0.3
1.51.5
131.40.80.8
3.43.3
12.512.5
9.710.538.837.5
0.3
0.3
1.41.4
21.10.1
#
0.60.35.52.54.42.03.81.8
#
#
0.1#
499.16.33.2
8
88
104110110
110110110110110110110110
8
8
88
261268268
268268268268268268268268261
261
2610
317397397
97,268
97,26897,26877,61577,61577,615
77,61577,61577,61577,61577,61577,61577,61577,61597,301
97,301
97,30197,30193,23593,23593,235
93,23593,23593,23593,23593,23593,23593,23593,23598,230
98,230
98,23098,491
4,0614,2544,254
See notes at end of table.
B-9
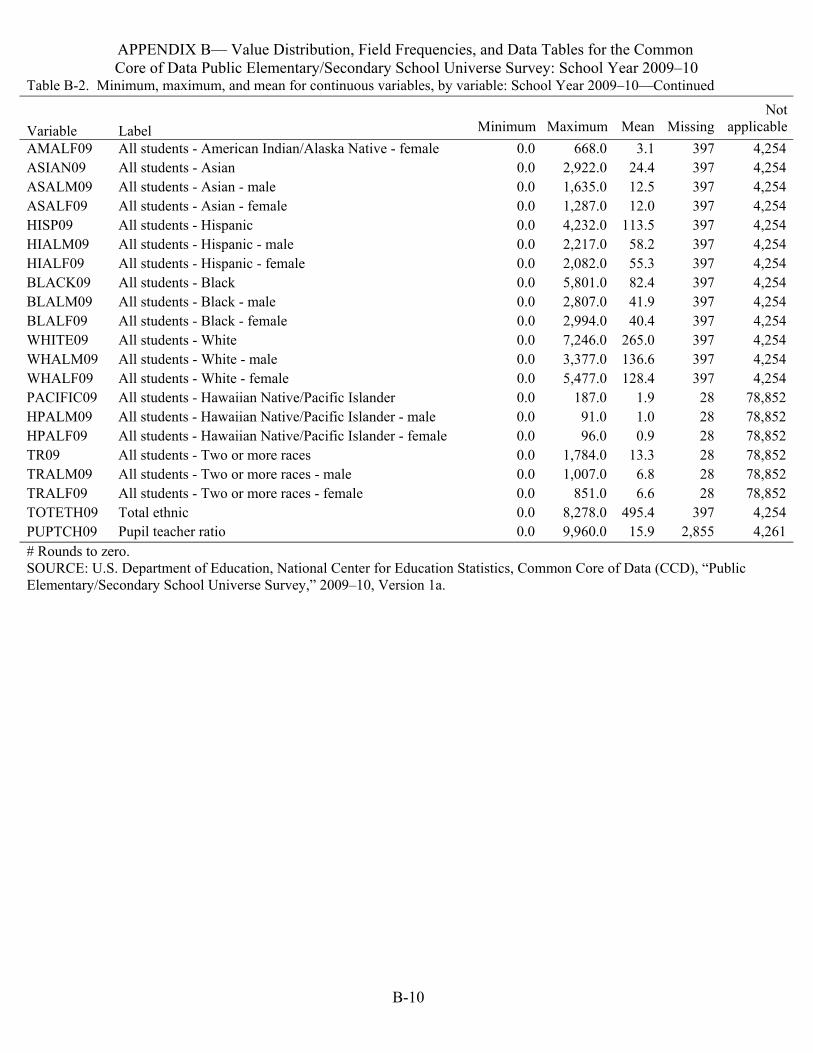
APPENDIX B— Value Distribution, Field Frequencies, and Data Tables for the Common Core of Data Public Elementary/Secondary School Universe Survey: School Year 2009–10
Table B-2. Minimum, maximum, and mean for continuous variables, by variable: School Year 2009–10—Continued
Not Minimum Maximum Mean Missing applicableVariable Label
AMALF09 All students - American Indian/Alaska Native - female 0.0 668.0 3.1 397 4,254ASIAN09 All students - Asian 0.0 2,922.0 24.4 397 4,254ASALM09 All students - Asian - male 0.0 1,635.0 12.5 397 4,254ASALF09 All students - Asian - female 0.0 1,287.0 12.0 397 4,254HISP09 All students - Hispanic 0.0 4,232.0 113.5 397 4,254HIALM09 All students - Hispanic - male 0.0 2,217.0 58.2 397 4,254HIALF09 All students - Hispanic - female 0.0 2,082.0 55.3 397 4,254BLACK09 All students - Black 0.0 5,801.0 82.4 397 4,254BLALM09 All students - Black - male 0.0 2,807.0 41.9 397 4,254BLALF09 All students - Black - female 0.0 2,994.0 40.4 397 4,254WHITE09 All students - White 0.0 7,246.0 265.0 397 4,254WHALM09 All students - White - male 0.0 3,377.0 136.6 397 4,254WHALF09 All students - White - female 0.0 5,477.0 128.4 397 4,254PACIFIC09 All students - Hawaiian Native/Pacific Islander 0.0 187.0 1.9 28 78,852HPALM09 All students - Hawaiian Native/Pacific Islander - male 0.0 91.0 1.0 28 78,852HPALF09 All students - Hawaiian Native/Pacific Islander - female 0.0 96.0 0.9 28 78,852TR09 All students - Two or more races 0.0 1,784.0 13.3 28 78,852TRALM09 All students - Two or more races - male 0.0 1,007.0 6.8 28 78,852TRALF09 All students - Two or more races - female 0.0 851.0 6.6 28 78,852TOTETH09 Total ethnic 0.0 8,278.0 495.4 397 4,254PUPTCH09 Pupil teacher ratio 0.0 9,960.0 15.9 2,855 4,261# Rounds to zero. SOURCE: U.S. Department of Education, National Center for Education Statistics, Common Core of Data (CCD), “Public Elementary/Secondary School Universe Survey,” 2009–10, Version 1a.
B-10
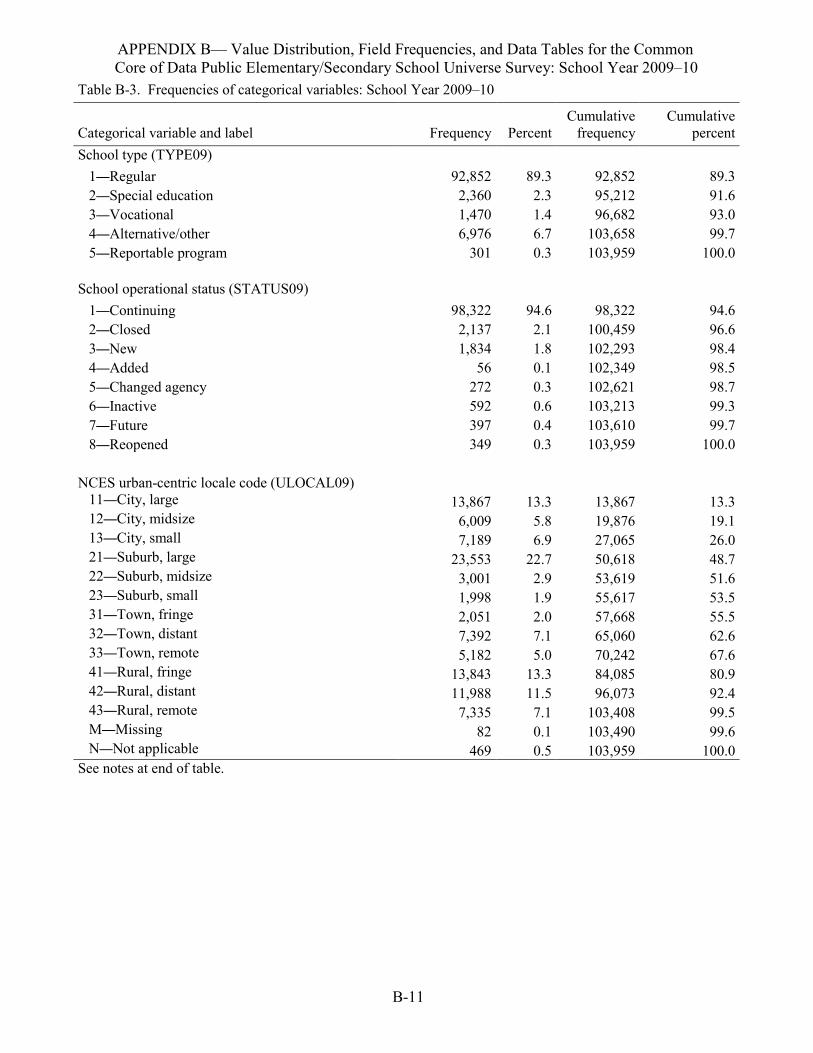
APPENDIX B— Value Distribution, Field Frequencies, and Data Tables for the Common Core of Data Public Elementary/Secondary School Universe Survey: School Year 2009–10
Table B-3. Frequencies of categorical variables: School Year 2009–10
Categorical variable and label Frequency Percent Cumulative
frequency Cumulative
percent School type (TYPE09) 1—Regular 2—Special education 3—Vocational 4—Alternative/other 5—Reportable program School operational status (STATUS09) 1—Continuing 2—Closed 3—New 4—Added 5—Changed agency 6—Inactive 7—Future 8—Reopened NCES urban-centric locale code (ULOCAL09) 11—City, large 12—City, midsize 13—City, small 21—Suburb, large 22—Suburb, midsize 23—Suburb, small 31—Town, fringe 32—Town, distant 33—Town, remote 41—Rural, fringe 42—Rural, distant 43—Rural, remote M—Missing N—Not applicable
92,852 2,360 1,470 6,976 301
98,322 2,137 1,834 56 272 592 397 349
13,867 6,009 7,189 23,553 3,001 1,998 2,051 7,392 5,182 13,843 11,988 7,335 82 469
89.3 2.3 1.4 6.7 0.3
94.6 2.1 1.8 0.1 0.3 0.6 0.4 0.3
13.3 5.8 6.9
22.7 2.9 1.9 2.0 7.1 5.0
13.3 11.5 7.1 0.1 0.5
92,852 95,212 96,682
103,658 103,959
98,322 100,459
102,293 102,349 102,621 103,213
103,610 103,959
13,867 19,876
27,065 50,618 53,619 55,617
57,668 65,060 70,242
84,085 96,073
103,408 103,490
103,959
89.3 91.6 93.0 99.7
100.0
94.6 96.6 98.4 98.5 98.7 99.3 99.7
100.0
13.3 19.1 26.0 48.7 51.6 53.5 55.5 62.6 67.6 80.9 92.4 99.5 99.6
100.0 See notes at
end of table.
B-11
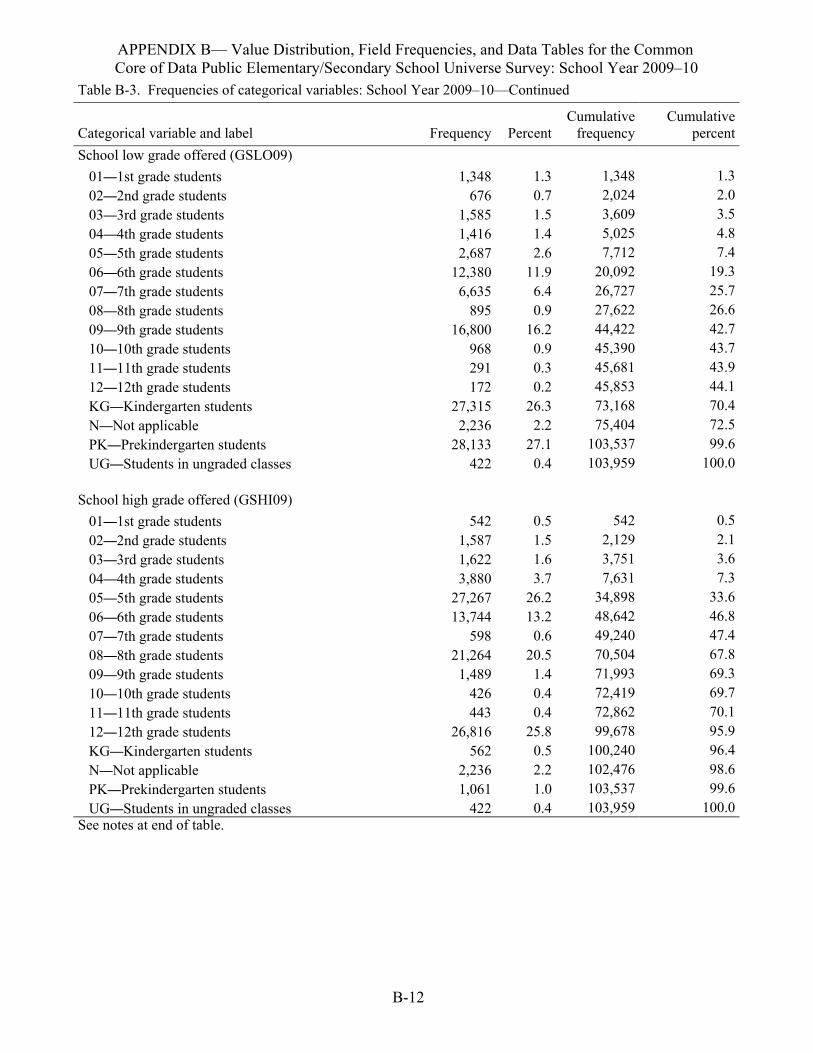
APPENDIX B— Value Distribution, Field Frequencies, and Data Tables for the Common Core of Data Public Elementary/Secondary School Universe Survey: School Year 2009–10
Table B-3. Frequencies of categorical variables: School Year 2009–10—Continued
Categorical variable and label Frequency PercentCumulative
frequency Cumulative
percentSchool low grade offered (GSLO09) 01—1st grade students 02—2nd grade students 03—3rd grade students 04—4th grade students 05—5th grade students 06—6th grade students 07—7th grade students 08—8th grade students 09—9th grade students 10—10th grade students 11—11th grade students 12—12th grade students KG—Kindergarten students N—Not applicable PK—Prekindergarten students UG—Students in ungraded classes School high grade offered (GSHI09) 01—1st grade students 02—2nd grade students 03—3rd grade students 04—4th grade students 05—5th grade students 06—6th grade students 07—7th grade students 08—8th grade students 09—9th grade students 10—10th grade students 11—11th grade students 12—12th grade students KG—Kindergarten students N—Not applicable PK—Prekindergarten students UG—Students in ungraded classes
1,348 676 1,585 1,416 2,687 12,380 6,635
895 16,800
968 291 172 27,315 2,236 28,133
422
542 1,587 1,622 3,880 27,267 13,744
598 21,264 1,489
426 443 26,816 562 2,236 1,061
422
1.30.71.51.42.6
11.96.40.9
16.20.90.30.2
26.32.2
27.10.4
0.51.51.63.7
26.213.2
0.620.5
1.40.40.4
25.80.52.21.00.4
1,348 2,024 3,609 5,025 7,712 20,092 26,727 27,622 44,422 45,390 45,681 45,853 73,168 75,404 103,537 103,959
542 2,129 3,751 7,631 34,898 48,642 49,240 70,504 71,993 72,419 72,862 99,678 100,240 102,476 103,537 103,959
1.32.03.54.87.4
19.325.726.642.743.743.944.170.472.599.6
100.0
0.52.13.67.3
33.646.847.467.869.369.770.195.996.498.699.6
100.0See notes at end of table.
B-12
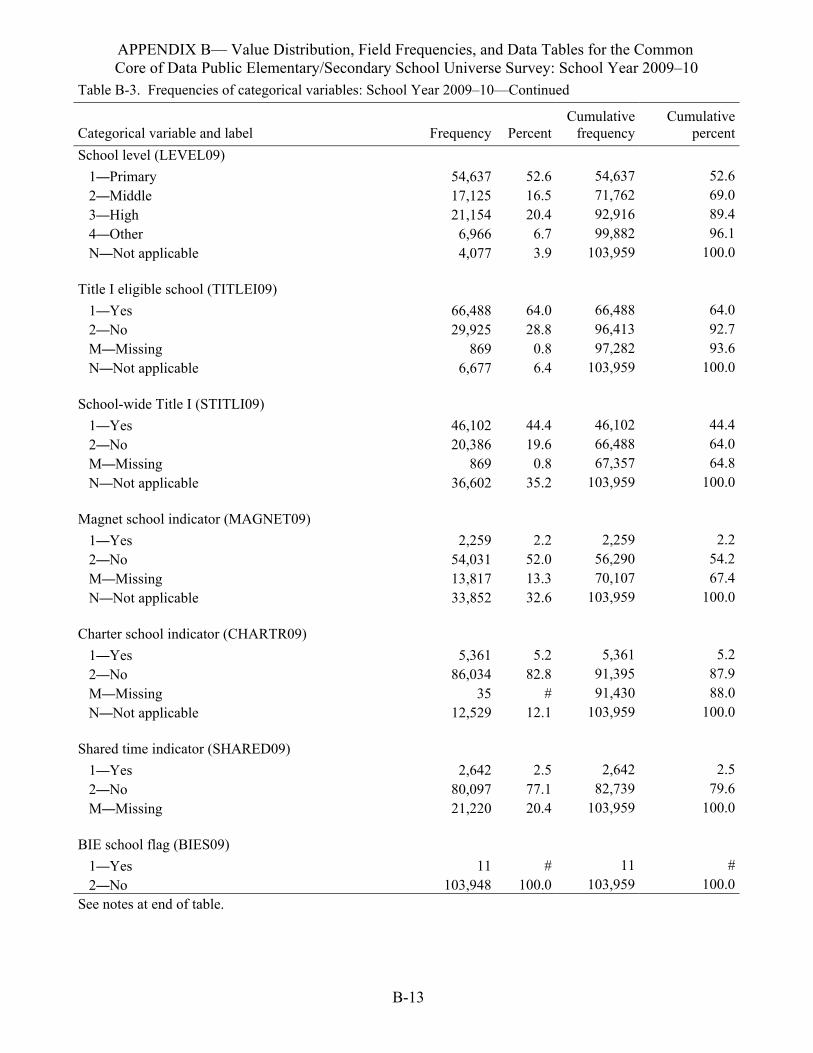
APPENDIX B— Value Distribution, Field Frequencies, and Data Tables for the Common Core of Data Public Elementary/Secondary School Universe Survey: School Year 2009–10
Table B-3. Frequencies of categorical variables: School Year 2009–10—Continued
Categorical variable and label Frequency PercentCumulative
frequency Cumulative
percentSchool level (LEVEL09) 1—Primary 2—Middle 3—High 4—Other N—Not applicable Title I eligible school (TITLEI09) 1—Yes 2—No M—Missing N—Not applicable School-wide Title I (STITLI09) 1—Yes 2—No M—Missing N—Not applicable Magnet school indicator (MAGNET09) 1—Yes 2—No M—Missing N—Not applicable Charter school indicator (CHARTR09) 1—Yes 2—No M—Missing N—Not applicable Shared time indicator (SHARED09) 1—Yes 2—No M—Missing BIE school flag (BIES09) 1—Yes 2—No
54,637 17,125 21,154 6,966 4,077
66,488 29,925 869 6,677
46,102 20,386 869 36,602
2,259 54,031 13,817 33,852
5,361 86,034 35 12,529
2,642 80,097 21,220
11 103,948
52.6 16.5 20.4
6.7 3.9
64.0 28.8
0.8 6.4
44.4 19.6
0.8 35.2
2.2 52.0 13.3 32.6
5.2 82.8
# 12.1
2.5 77.1 20.4
# 100.0
54,637 71,762 92,916 99,882 103,959
66,488 96,413 97,282 103,959
46,102 66,488 67,357
103,959
2,259 56,290 70,107 103,959
5,361 91,395 91,430
103,959
2,642 82,739 103,959
11 103,959
52.669.089.496.1
100.0
64.092.793.6
100.0
44.464.064.8
100.0
2.254.267.4
100.0
5.287.988.0
100.0
2.579.6
100.0
#100.0
See notes at end of table.
B-13
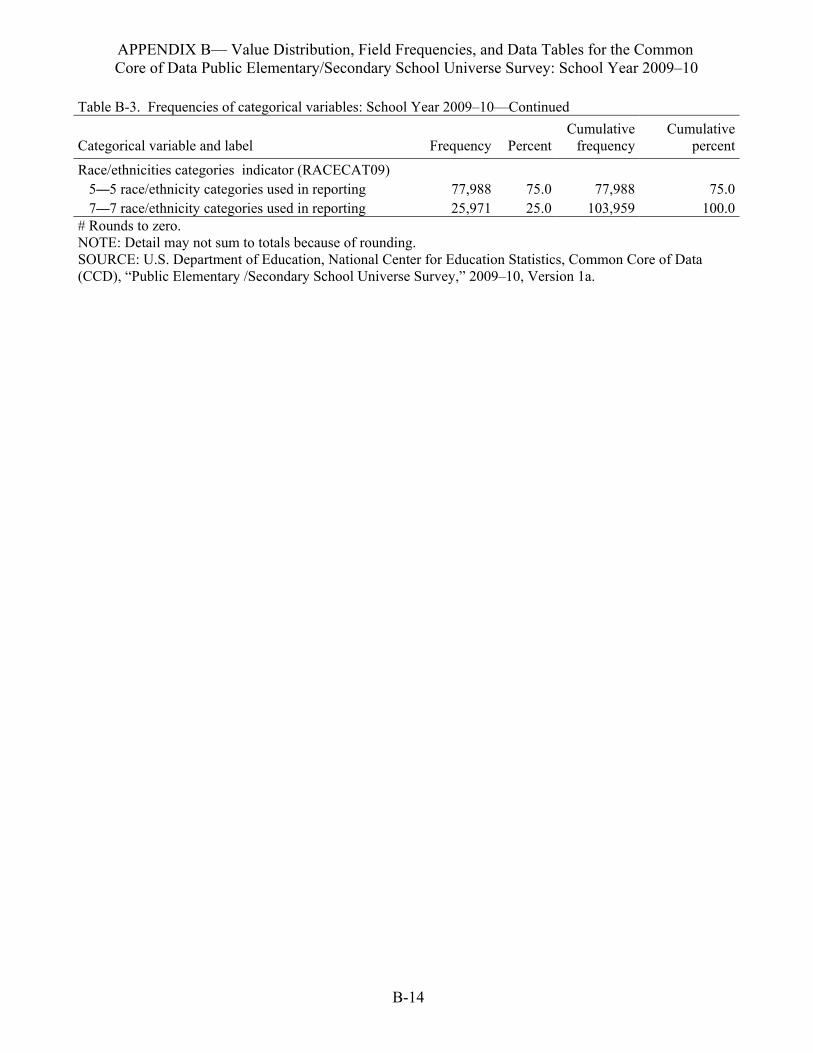
APPENDIX B— Value Distribution, Field Frequencies, and Data Tables for the Common Core of Data Public Elementary/Secondary School Universe Survey: School Year 2009–10
Table B-3. Frequencies of categorical variables: School Year 2009–10—Continued
Cumulative CumulativeCategorical variable and label Frequency Percent frequency percent
Race/ethnicities categories indicator (RACECAT09) 5—5 race/ethnicity categories used in reporting 77,988 75.0 77,988 75.0 7—7 race/ethnicity categories used in reporting 25,971 25.0 103,959 100.0# Rounds to zero. NOTE: Detail may not sum to totals because of rounding. SOURCE: U.S. Department of Education, National Center for Education Statistics, Common Core of Data (CCD), “Public Elementary /Secondary School Universe Survey,” 2009–10, Version 1a.
B-14
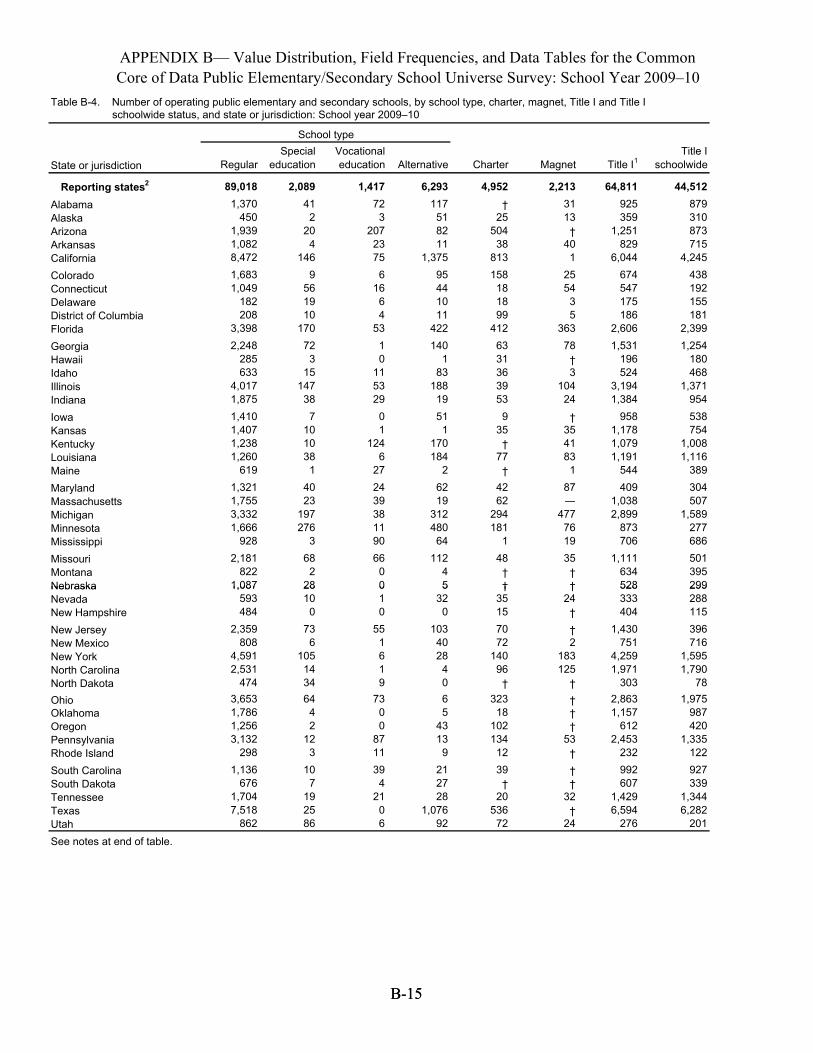
Table B-4. Table B-1.
APPENDIX B— Value Distribution, Field Frequencies, and Data Tables for the CommonCore of Data Public Elementary/Secondary School Universe Survey: School Year 2009–10
Number of operating public elementary and secondary schools, by school type, charter, magnet, Title I and Title I schoolwide status, and state or jurisdiction: School year 2009–10
State or jurisdiction
School type
Charter Magnet Title I1Title I
schoolwideRegular Special Vocational
education education Alternative
Reporting states2
AlabamaAlaskaArizonaArkansasCaliforniaColoradoConnecticutDelawareDistrict of ColumbiaFloridaGeorgiaHawaiiIdahoIllinois IndianaIowaKansasKentuckyLouisianaMaineMarylandMassachusettsMichiganMinnesotaMississippiMissouriMontanaNebraskaNebraskaNevadaNew HampshireNew JerseyNew MexicoNew YorkNorth CarolinaNorth DakotaOhioOklahomaOregonPennsylvaniaRhode IslandSouth CarolinaSouth DakotaTennesseeTexasUtah
89,0181,370
4501,9391,0828,4721,6831,049
182208
3,3982,248
285633
4,0171,8751,4101,4071,2381,260
6191,3211,7553,3321,666
9282,181
8221,0871,087
593484
2,359808
4,5912,531
4743,6531,7861,2563,132
2981,136
6761,7047,518
862
2,089412
204
1469
561910
170723
15147387
1010381
4023
197276
3682
2828100
736
10514346442
123
107
192586
1,417723
20723756
1664
5310
11532901
1246
2724393811906600010
551619
7300
8711394
2106
6,293117518211
1,37595441011
422140
183
18819511
170184
26219
31248064
112455
320
10340284065
43139
212728
1,07692
4,952†
2550438
813158181899
41263313639539
35†
77†
4262
294181
148†††
35157072
14096†
32318
1021341239†
2053672
2,2133113†
401
255435
36378†3
10424
†3541831
87—
477761935†††
24††2
183125
††††
53†††
32†
24
64,811925359
1,251829
6,044674547175186
2,6061,531
196524
3,1941,384
9581,1781,0791,191
544409
1,0382,899
873706
1,111634528528333404
1,430751
4,2591,971
3032,8631,157
6122,453
232992607
1,4296,594
276
44,512879310873715
4,245438192155181
2,3991,254
180468
1,371954538754
1,0081,116
389304507
1,589277686501395299299288115396716
1,5951,790
781,975
987420
1,335122927339
1,3446,282
201
See notes at end of table.
B-15B-15
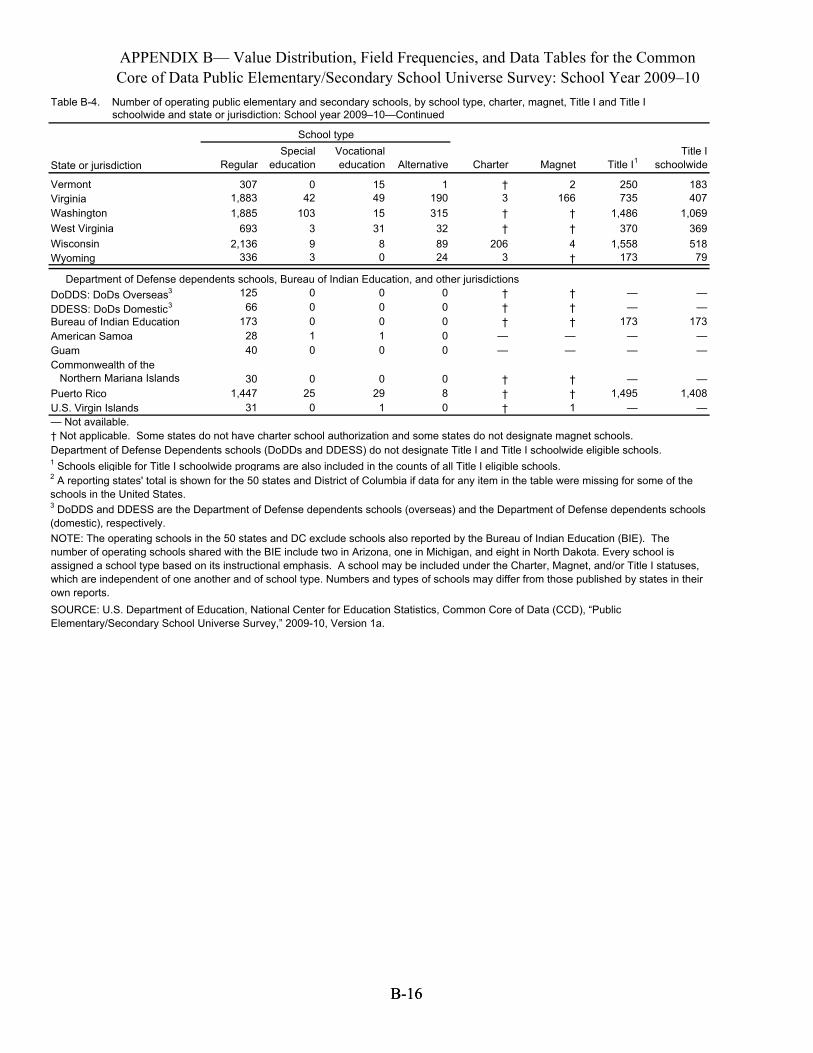
Table B-4. Table B-1.
APPENDIX B— Value Distribution, Field Frequencies, and Data Tables for the CommonCore of Data Public Elementary/Secondary School Universe Survey: School Year 2009–10
Number of operating public elementary and secondary schools, by school type, charter, magnet, Title I and Title I schoolwide and state or jurisdiction: School year 2009–10—Continued
State or jurisdiction
School type
Charter Magnet Title I1Title I
schoolwideRegular Special Vocational
education education Alternative
VermontVirginiaWashingtonWest VirginiaWisconsinWyoming
3071,8831,885
6932,136
336
042
103393
1549153180
1190315328924
†3††
2063
2166
††4†
250735
1,486370
1,558173
183407
1,06936951879
Department of Defense dependents schools, Bureau of Indian Education, and other jurisdictionsDoDDS: DoDs Overseas3 125 0 0 0 †DDESS: DoDs Domestic3 66 0 0 0 †Bureau of Indian Education 173 0 0 0 †American Samoa 28 1 1 0 —Guam 40 0 0 0 —Commonwealth of the Northern Mariana Islands 30 0 0 0 †Puerto Rico 1,447 25 29 8 †U.S. Virgin Islands 31 0 1 0 †
†††
——
††1
——
173——
—1,495
—
——
173——
—1,408
—— Not available.† Not applicable. Some states do not have charter school authorization and some states do not designate magnet schools.Department of Defense Dependents schools (DoDDs and DDESS) do not designate Title I and Title I schoolwide eligible schools.1 Schools eligible for Title I schoolwide programs are also included in the counts of all Title I eligible schools.2 A reporting states' total is shown for the 50 states and District of Columbia if data for any item in the table were missing for some of the schools in the United States.3 DoDDS and DDESS are the Department of Defense dependents schools (overseas) and the Department of Defense dependents schools (domestic), respectively.NOTE: The operating schools in the 50 states and DC exclude schools also reported by the Bureau of Indian Education (BIE). The number of operating schools shared with the BIE include two in Arizona, one in Michigan, and eight in North Dakota. Every school is assigned a school type based on its instructional emphasis. A school may be included under the Charter, Magnet, and/or Title I statuses, which are independent of one another and of school type. Numbers and types of schools may differ from those published by states in their own reports. tSOURCE: U.S. Department of Education, National Center for Education Statistics, Common Core of Data (CCD), “Public Elementary/Secondary School Universe Survey,” 2009-10, Version 1a.
B-16B-16
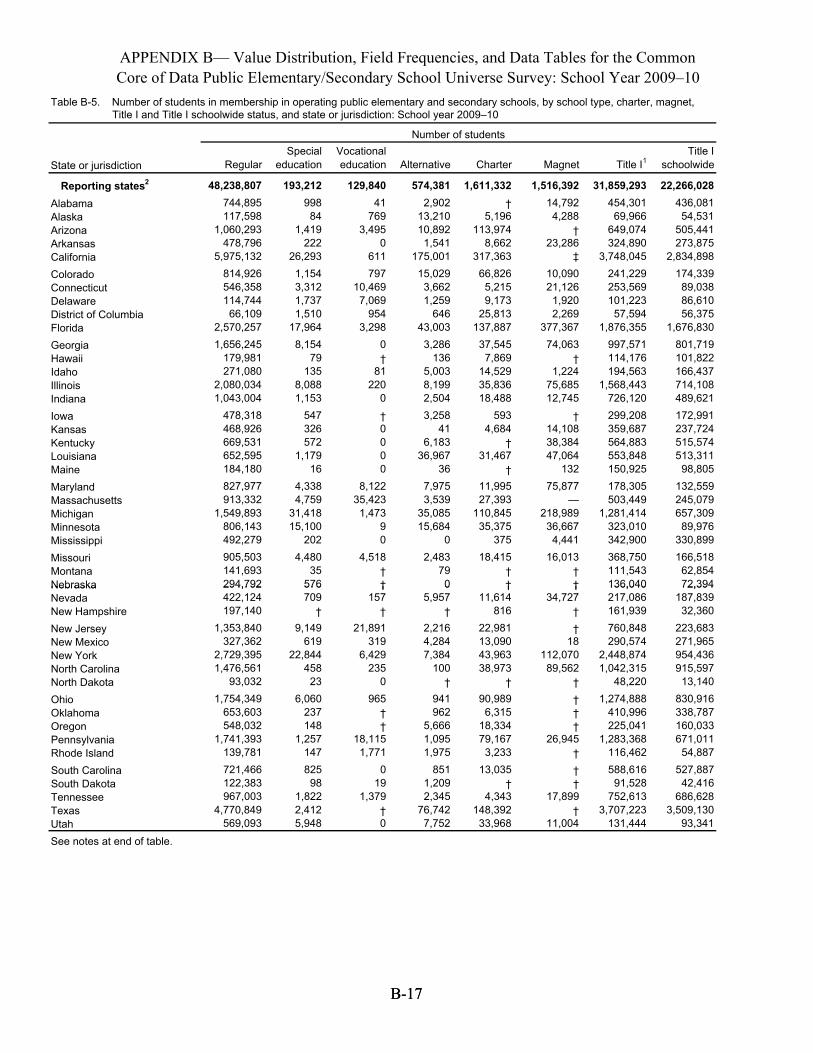
Table B-5. Table B-2.
APPENDIX B— Value Distribution, Field Frequencies, and Data Tables for the CommonCore of Data Public Elementary/Secondary School Universe Survey: School Year 2009–10
Number of students in membership in operating public elementary and secondary schools, by school type, charter, magnet, Title I and Title I schoolwide status, and state or jurisdiction: School year 2009–10
State or jurisdiction
Number of students
Regular Special
educationVocational education Alternative Charter Magnet Title I1
Title I schoolwide
Reporting states2
AlabamaAlaskaArizonaArkansasCaliforniaColoradoConnecticutDelawareDistrict of ColumbiaFloridaGeorgiaHawaiiIdahoIllinois IndianaIowaKansasKentuckyLouisianaMaineMarylandMassachusettsMichiganMinnesotaMississippiMissouriMontanaNebraskaNebraskaNevadaNew HampshireNew JerseyNew MexicoNew YorkNorth CarolinaNorth DakotaOhioOklahomaOregonPennsylvaniaRhode IslandSouth CarolinaSouth DakotaTennesseeTexasUtah
48,238,807744,895117,598
1,060,293478,796
5,975,132814,926546,358114,74466,109
2,570,2571,656,245
179,981271,080
2,080,0341,043,004
478,318468,926669,531652,595184,180827,977913,332
1,549,893806,143492,279905,503141,693294294,,792792422,124197,140
1,353,840327,362
2,729,3951,476,561
93,0321,754,349
653,603548,032
1,741,393139,781721,466122,383967,003
4,770,849569,093
193,21299884
1,419222
26,2931,1543,3121,7371,510
17,9648,154
79135
8,0881,153
547326572
1,17916
4,3384,759
31,41815,100
2024,480
35576576709
†9,149
61922,844
45823
6,060237148
1,25714782598
1,8222,4125,948
129,84041
7693,495
0611797
10,4697,069
9543,298
0†
81220
0
†0000
8,12235,4231,473
90
4,518†††
157†
21,891319
6,429235
0965
††
18,1151,771
019
1,379†0
574,3812,902
13,21010,8921,541
175,00115,0293,6621,259
64643,0033,286
1365,0038,1992,5043,258
416,183
36,96736
7,9753,539
35,08515,684
02,483
7900
5,957†
2,2164,2847,384
100†
941962
5,6661,0951,975
8511,2092,345
76,7427,752
1,611,332†
5,196113,974
8,662317,36366,8265,2159,173
25,813137,88737,5457,869
14,52935,83618,488
5934,684
†31,467
†11,99527,393
110,84535,375
37518,415
†††
11,614816
22,98113,09043,96338,973
†90,9896,315
18,33479,1673,233
13,035†
4,343148,39233,968
1,516,39214,7924,288
†23,286
‡10,09021,1261,9202,269
377,36774,063
†1,224
75,68512,745
†14,10838,38447,064
13275,877
—218,98936,6674,441
16,013†††
34,727††
18112,07089,562
††††
26,945†††
17,899†
11,004
31,859,293454,30169,966
649,074324,890
3,748,045241,229253,569101,22357,594
1,876,355997,571114,176194,563
1,568,443726,120299,208359,687564,883553,848150,925178,305503,449
1,281,414323,010342,900368,750111,543136136,,040040217,086161,939760,848290,574
2,448,8741,042,315
48,2201,274,888
410,996225,041
1,283,368116,462588,61691,528
752,6133,707,223
131,444
22,266,028436,08154,531
505,441273,875
2,834,898174,33989,03886,61056,375
1,676,830801,719101,822166,437714,108489,621172,991237,724515,574513,311
98,805132,559245,079657,30989,976
330,899166,518
62,8547272,,394394
187,83932,360
223,683271,965954,436915,597
13,140830,916338,787160,033671,011
54,887527,88742,416
686,6283,509,130
93,341
See notes at end of table.
B-17B-17
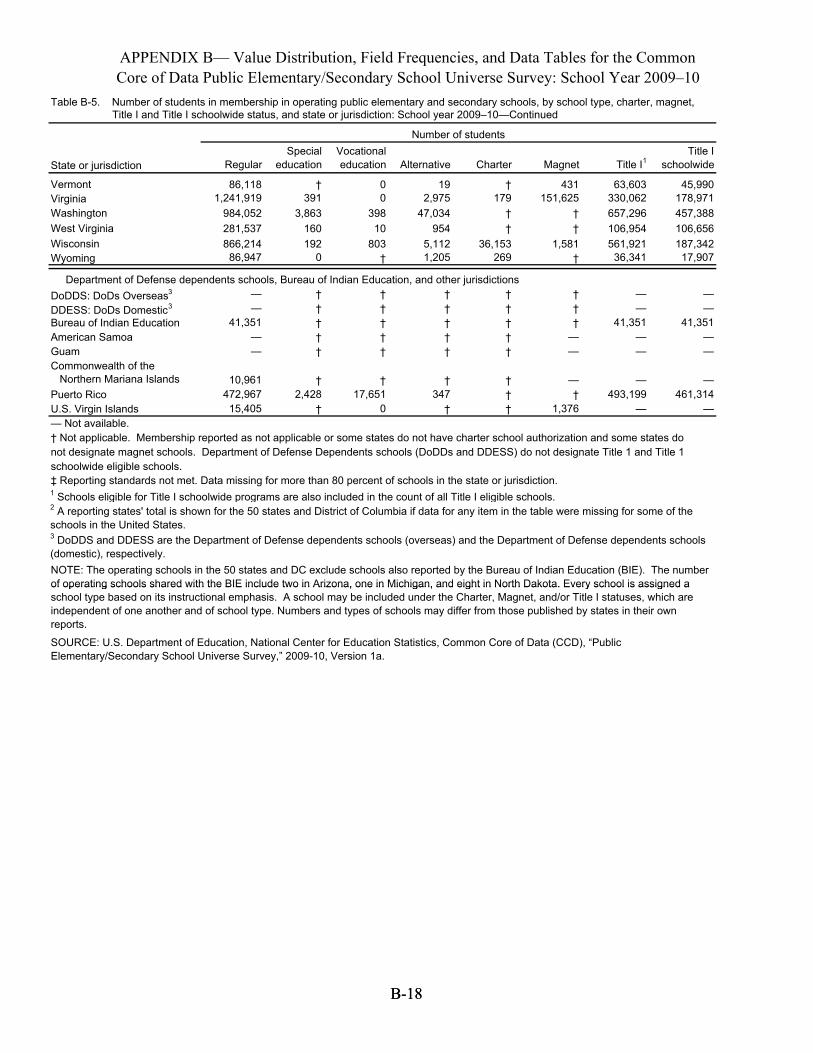
APPENDIX B— Value Distribution, Field Frequencies, and Data Tables for the CommonCore of Data Public Elementary/Secondary School Universe Survey: School Year 2009–10
Table B-5. Number of students in membership in operating public elementary and secondary schools, by school type, charter, magnet, Table B-2. Title I and Title I schoolwide status, and state or jurisdiction: School year 2009–10—Continued
Number of studentsSpecial Vocational Title I
State or jurisdiction Regular education education Alternative Charter Magnet Title I1 schoolwide
Vermont 86,118 † 0 19 † 431 63,603 45,990Virginia 1,241,919 391 0 2,975 179 151,625 330,062 178,971Washington 984,052 3,863 398 47,034 † † 657,296 457,388West Virginia 281,537 160 10 954 † † 106,954 106,656Wisconsin 866,214 192 803 5,112 36,153 1,581 561,921 187,342Wyoming 86,947 0 † 1,205 269 † 36,341 17,907
Department of Defense dependents schools, Bureau of Indian Education, and other jurisdictionsDoDDS: DoDs Overseas3 — † † † † † — —DDESS: DoDs Domestic3 — † † † † † — —Bureau of Indian Education 41,351 † † † † † 41,351 41,351American Samoa — † † † † — — —Guam — † † † † — — —Commonwealth of the Northern Mariana Islands 10,961 † † † † — — —Puerto Rico 472,967 2,428 17,651 347 † † 493,199 461,314U.S. Virgin Islands 15,405 † 0 † † 1,376 — —— Not available.† Not applicable. Membership reported as not applicable or some states do not have charter school authorization and some states donot designate magnet schools. Department of Defense Dependents schools (DoDDs and DDESS) do not designate Title 1 and Title 1schoolwide eligible schools.‡ Reporting standards not met. Data missing for more than 80 percent of schools in the state or jurisdiction. 1 Schools eligible for Title I schoolwide programs are also included in the count of all Title I eligible schools.2 A reporting states' total is shown for the 50 states and District of Columbia if data for any item in the table were missing for some of the schools in the United States.3 DoDDS and DDESS are the Department of Defense dependents schools (overseas) and the Department of Defense dependents schools (domestic), respectively.NOTE: The operating schools in the 50 states and DC exclude schools also reported by the Bureau of Indian Education (BIE). The number of operating schools shared with the BIE include two in Arizona, one in Michigan, and eight in North Dakota. Every school isof operating schools shared with the BIE include two in Arizona, one in Michigan, and eight in North Dakota. Every school is assigned a assigned a school type based on its instructional emphasis. A school may be included under the Charter, Magnet, and/or Title I statuses, which are independent of one another and of school type. Numbers and types of schools may differ from those published by states in their own reports.
SOURCE: U.S. Department of Education, National Center for Education Statistics, Common Core of Data (CCD), “Public Elementary/Secondary School Universe Survey,” 2009-10, Version 1a.
B-18B-18
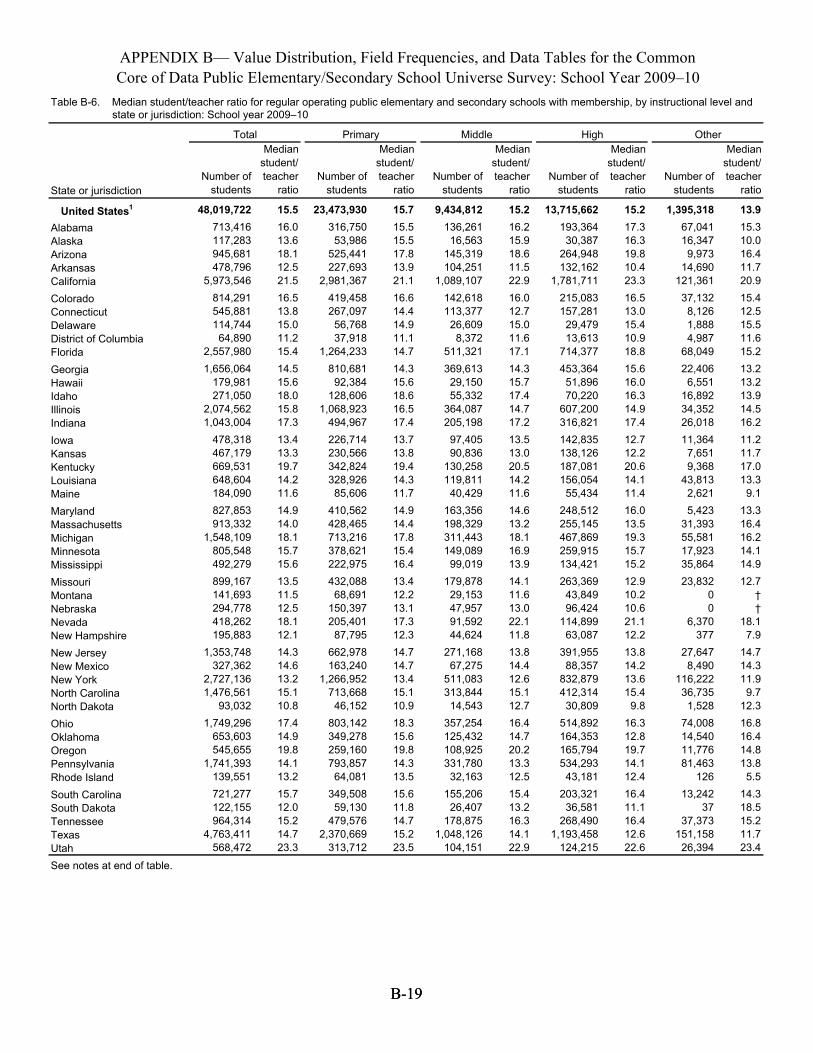
APPENDIX B— Value Distribution, Field Frequencies, and Data Tables for the CommonCore of Data Public Elementary/Secondary School Universe Survey: School Year 2009–10
B-19B-19
Table B-6. Median student/teacher ratio for regular operating public elementary and secondary schools with membership, by instructional level andTable B-3. state or jurisdiction: School year 2009–10
Total Primary Middle High Other
State or jurisdictionNumber of
students
Median student/ teacher
ratioNumber of
students
Median student/ teacher
ratioNumber of
students
Median student/ teacher
ratioNumber of
students
Median student/ teacher
ratioNumber of
students
Median student/ teacher
ratio
United States1 48,019,722 15.5 23,473,930 15.7 9,434,812 15.2 13,715,662 15.2 1,395,318 13.9Alabama 713,416 16.0 316,750 15.5 136,261 16.2 193,364 17.3 67,041 15.3Alaska 117,283 13.6 53,986 15.5 16,563 15.9 30,387 16.3 16,347 10.0Arizona 945,681 18.1 525,441 17.8 145,319 18.6 264,948 19.8 9,973 16.4Arkansas 478,796 12.5 227,693 13.9 104,251 11.5 132,162 10.4 14,690 11.7California 5,973,546 21.5 2,981,367 21.1 1,089,107 22.9 1,781,711 23.3 121,361 20.9
Colorado 814,291 16.5 419,458 16.6 142,618 16.0 215,083 16.5 37,132 15.4Connecticut 545,881 13.8 267,097 14.4 113,377 12.7 157,281 13.0 8,126 12.5Delaware 114,744 15.0 56,768 14.9 26,609 15.0 29,479 15.4 1,888 15.5District of Columbia 64,890 11.2 37,918 11.1 8,372 11.6 13,613 10.9 4,987 11.6Florida 2,557,980 15.4 1,264,233 14.7 511,321 17.1 714,377 18.8 68,049 15.2
Georgia 1,656,064 14.5 810,681 14.3 369,613 14.3 453,364 15.6 22,406 13.2Hawaii 179,981 15.6 92,384 15.6 29,150 15.7 51,896 16.0 6,551 13.2Idaho 271,050 18.0 128,606 18.6 55,332 17.4 70,220 16.3 16,892 13.9Illinois 2,074,562 15.8 1,068,923 16.5 364,087 14.7 607,200 14.9 34,352 14.5Indiana 1,043,004 17.3 494,967 17.4 205,198 17.2 316,821 17.4 26,018 16.2
Iowa 478,318 13.4 226,714 13.7 97,405 13.5 142,835 12.7 11,364 11.2Kansas 467,179 13.3 230,566 13.8 90,836 13.0 138,126 12.2 7,651 11.7Kentucky 669,531 19.7 342,824 19.4 130,258 20.5 187,081 20.6 9,368 17.0Louisiana 648,604 14.2 328,926 14.3 119,811 14.2 156,054 14.1 43,813 13.3Maine 184,090 11.6 85,606 11.7 40,429 11.6 55,434 11.4 2,621 9.1
Maryland 827,853 14.9 410,562 14.9 163,356 14.6 248,512 16.0 5,423 13.3Massachusetts 913,332 14.0 428,465 14.4 198,329 13.2 255,145 13.5 31,393 16.4Michigan 1,548,109 18.1 713,216 17.8 311,443 18.1 467,869 19.3 55,581 16.2Minnesota 805,548 15.7 378,621 15.4 149,089 16.9 259,915 15.7 17,923 14.1Mississippi 492,279 15.6 222,975 16.4 99,019 13.9 134,421 15.2 35,864 14.9
Missouri 899,167, 13.5 432,088, 13.4 179,878, 14.1 263,369, 12.9 23,832, 12.7Montana 141,693 11.5 68,691 12.2 29,153 11.6 43,849 10.2 0 †Nebraska 294,778 12.5 150,397 13.1 47,957 13.0 96,424 10.6 0 †Nevada 418,262 18.1 205,401 17.3 91,592 22.1 114,899 21.1 6,370 18.1New Hampshire 195,883 12.1 87,795 12.3 44,624 11.8 63,087 12.2 377 7.9
New Jersey 1,353,748 14.3 662,978 14.7 271,168 13.8 391,955 13.8 27,647 14.7New Mexico 327,362 14.6 163,240 14.7 67,275 14.4 88,357 14.2 8,490 14.3New York 2,727,136 13.2 1,266,952 13.4 511,083 12.6 832,879 13.6 116,222 11.9North Carolina 1,476,561 15.1 713,668 15.1 313,844 15.1 412,314 15.4 36,735 9.7North Dakota 93,032 10.8 46,152 10.9 14,543 12.7 30,809 9.8 1,528 12.3
Ohio 1,749,296 17.4 803,142 18.3 357,254 16.4 514,892 16.3 74,008 16.8Oklahoma 653,603 14.9 349,278 15.6 125,432 14.7 164,353 12.8 14,540 16.4Oregon 545,655 19.8 259,160 19.8 108,925 20.2 165,794 19.7 11,776 14.8Pennsylvania 1,741,393 14.1 793,857 14.3 331,780 13.3 534,293 14.1 81,463 13.8Rhode Island 139,551 13.2 64,081 13.5 32,163 12.5 43,181 12.4 126 5.5
South Carolina 721,277 15.7 349,508 15.6 155,206 15.4 203,321 16.4 13,242 14.3South Dakota 122,155 12.0 59,130 11.8 26,407 13.2 36,581 11.1 37 18.5Tennessee 964,314 15.2 479,576 14.7 178,875 16.3 268,490 16.4 37,373 15.2Texas 4,763,411 14.7 2,370,669 15.2 1,048,126 14.1 1,193,458 12.6 151,158 11.7Utah 568,472 23.3 313,712 23.5 104,151 22.9 124,215 22.6 26,394 23.4
See notes at end of table.
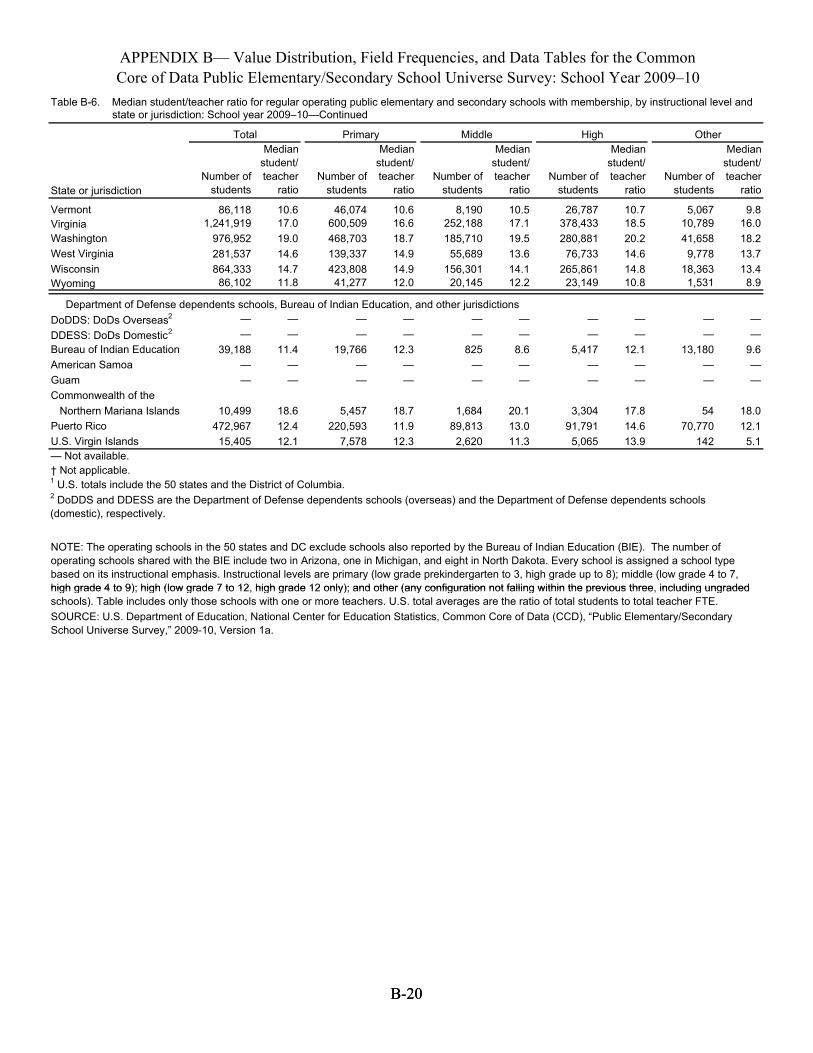
APPENDIX B— Value Distribution, Field Frequencies, and Data Tables for the CommonCore of Data Public Elementary/Secondary School Universe Survey: School Year 2009–10
B-20B-20
Table B-6. Table B-3.
Median student/teacher ratio for regular operating public elementary and secondary schools with membership, by instructional level andstate or jurisdiction: School year 2009–10—Continued
State or jurisdiction
Total Primary Middle High Other
Number of students
Median student/ teacher
ratio
Median student/
Number of teacher students ratio
Median student/
Number of teacher students ratio
Number of students
Median student/ teacher
ratioNumber of
students
Median student/ teacher
ratio
VermontVirginiaWashingtonWest VirginiaWisconsinWyoming
86,1181,241,919
976,952281,537864,33386,102
10.617.019.014.614.711.8
46,074600,509468,703139,337423,80841,277
10.616.618.714.914.912.0
8,190252,188185,71055,689
156,30120,145
10.517.119.513.614.112.2
26,787378,433280,88176,733
265,86123,149
10.718.520.214.614.810.8
5,06710,78941,6589,778
18,3631,531
9.816.018.213.713.48.9
Department of Defense dependents schools, Bureau of Indian Education, and other jurisdictionsDoDDS: DoDs Overseas2 — — — — — —DDESS: DoDs Domestic2 — — — — — —Bureau of Indian Education 39,188 11.4 19,766 12.3 825 8.6American Samoa — — — — — —Guam — — — — — —Commonwealth of the Northern Mariana Islands 10,499 18.6 5,457 18.7 1,684 20.1Puerto Rico 472,967 12.4 220,593 11.9 89,813 13.0U.S. Virgin Islands 15,405 12.1 7,578 12.3 2,620 11.3
——
5,417——
3,30491,7915,065
——
12.1——
17.814.613.9
——
13,180——
5470,770
142
9.6——
18.012.15.1
— Not available.† Not applicable. 1 U.S. totals include the 50 states and the District of Columbia.2 DoDDS and DDESS are the Department of Defense dependents schools (overseas) and the Department of Defense dependents schools (domestic), respectively.
NOTE: The operating schools in the 50 states and DC exclude schools also reported by the Bureau of Indian Education (BIE). The number of operating schools shared with the BIE include two in Arizona, one in Michigan, and eight in North Dakota. Every school is assigned a school type based on its instructional emphasis. Instructional levels are primary (low grade prekindergarten to 3, high grade up to 8); middle (low grade 4 thigh grade 4 to 9); high (low grade 7 to 12, high grade 12 only); and other (any configuration not falling within the previous three , includinghigh grade 4 to 9); high (low grade 7 to 12 high grade 12 only); and other (any configuration not falling within the previous three including ung ungschools). Table includes only those schools with one or more teachers. U.S. total averages are the ratio of total students to total teacher FTE.SOURCE: U.S. Department of Education, National Center for Education Statistics, Common Core of Data (CCD), “Public Elementary/Secondary School Universe Survey,” 2009-10, Version 1a.
o 7, raded raded
——
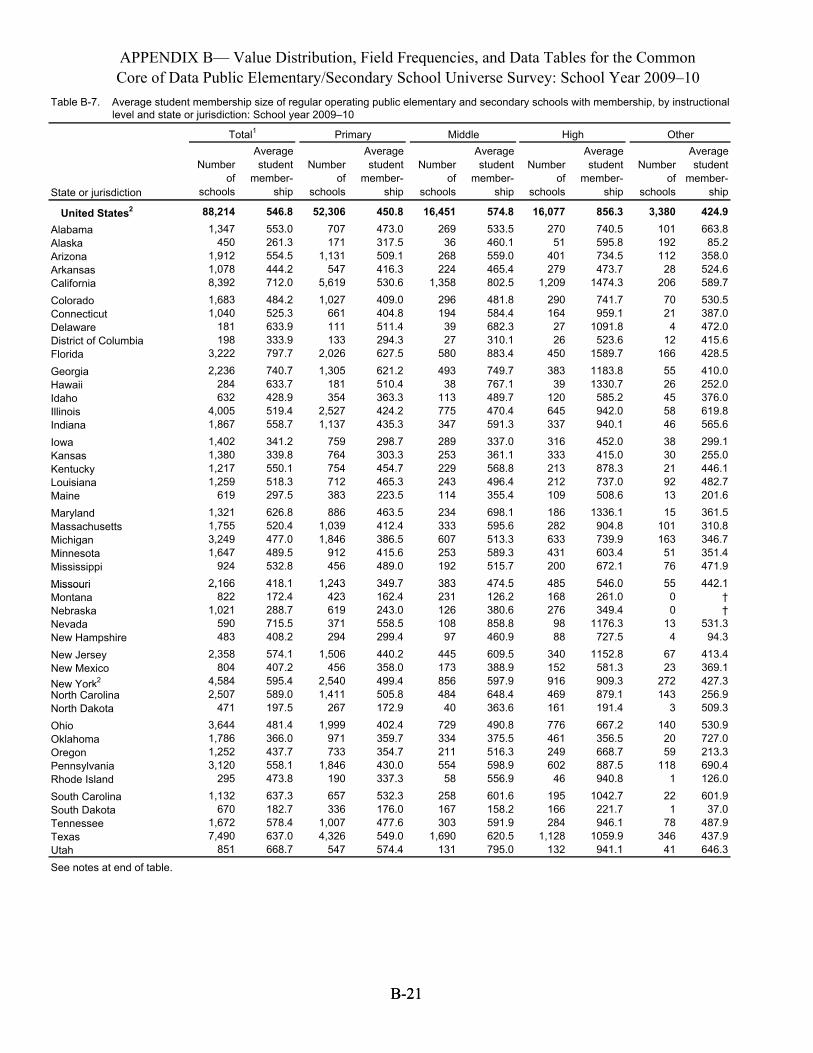
APPENDIX B— Value Distribution, Field Frequencies, and Data Tables for the CommonCore of Data Public Elementary/Secondary School Universe Survey: School Year 2009–10
B-21B-21
Table B-7. Average student membership size of regular operating public elementary and secondary schools with membership, by instructionalTable B-4. level and state or jurisdiction: School year 2009–10
Total1 Primary Middle High OtherAverage Average Average Average Average
Number student Number student Number student Number student Number student of member- of member- of member- of member- of member-
State or jurisdiction schools ship schools ship schools ship schools ship schools ship
United States2 88,214 546.8 52,306 450.8 16,451 574.8 16,077 856.3 3,380 424.9Alabama 1,347 553.0 707 473.0 269 533.5 270 740.5 101 663.8Alaska 450 261.3 171 317.5 36 460.1 51 595.8 192 85.2Arizona 1,912 554.5 1,131 509.1 268 559.0 401 734.5 112 358.0Arkansas 1,078 444.2 547 416.3 224 465.4 279 473.7 28 524.6California 8,392 712.0 5,619 530.6 1,358 802.5 1,209 1474.3 206 589.7
Colorado 1,683 484.2 1,027 409.0 296 481.8 290 741.7 70 530.5Connecticut 1,040 525.3 661 404.8 194 584.4 164 959.1 21 387.0Delaware 181 633.9 111 511.4 39 682.3 27 1091.8 4 472.0District of Columbia 198 333.9 133 294.3 27 310.1 26 523.6 12 415.6Florida 3,222 797.7 2,026 627.5 580 883.4 450 1589.7 166 428.5
Georgia 2,236 740.7 1,305 621.2 493 749.7 383 1183.8 55 410.0Hawaii 284 633.7 181 510.4 38 767.1 39 1330.7 26 252.0Idaho 632 428.9 354 363.3 113 489.7 120 585.2 45 376.0Illinois 4,005 519.4 2,527 424.2 775 470.4 645 942.0 58 619.8Indiana 1,867 558.7 1,137 435.3 347 591.3 337 940.1 46 565.6
Iowa 1,402 341.2 759 298.7 289 337.0 316 452.0 38 299.1Kansas 1,380 339.8 764 303.3 253 361.1 333 415.0 30 255.0Kentucky 1,217 550.1 754 454.7 229 568.8 213 878.3 21 446.1Louisiana 1,259 518.3 712 465.3 243 496.4 212 737.0 92 482.7Maine 619 297.5 383 223.5 114 355.4 109 508.6 13 201.6
Maryland 1,321 626.8 886 463.5 234 698.1 186 1336.1 15 361.5Massachusetts 1,755 520.4 1,039 412.4 333 595.6 282 904.8 101 310.8Michigan 3,249 477.0 1,846 386.5 607 513.3 633 739.9 163 346.7Minnesota 1,647 489.5 912 415.6 253 589.3 431 603.4 51 351.4Mississippi 924 532.8 456 489.0 192 515.7 200 672.1 76 471.9
MissouriMissouri 2,1662,166 418.1418.1 1,2431,243 349.7349.7 383383 474.5474.5 485485 546.0546.0 5555 442.1442.1Montana 822 172.4 423 162.4 231 126.2 168 261.0 0 †Nebraska 1,021 288.7 619 243.0 126 380.6 276 349.4 0 †Nevada 590 715.5 371 558.5 108 858.8 98 1176.3 13 531.3New Hampshire 483 408.2 294 299.4 97 460.9 88 727.5 4 94.3
New Jersey 2,358 574.1 1,506 440.2 445 609.5 340 1152.8 67 413.4New Mexico 804 407.2 456 358.0 173 388.9 152 581.3 23 369.1
4,584 595.4 2,540 499.4 856 597.9 916 909.3 272 427.3New York2
North Carolina 2,507 589.0 1,411 505.8 484 648.4 469 879.1 143 256.9North Dakota 471 197.5 267 172.9 40 363.6 161 191.4 3 509.3
Ohio 3,644 481.4 1,999 402.4 729 490.8 776 667.2 140 530.9Oklahoma 1,786 366.0 971 359.7 334 375.5 461 356.5 20 727.0Oregon 1,252 437.7 733 354.7 211 516.3 249 668.7 59 213.3Pennsylvania 3,120 558.1 1,846 430.0 554 598.9 602 887.5 118 690.4Rhode Island 295 473.8 190 337.3 58 556.9 46 940.8 1 126.0
South Carolina 1,132 637.3 657 532.3 258 601.6 195 1042.7 22 601.9South Dakota 670 182.7 336 176.0 167 158.2 166 221.7 1 37.0Tennessee 1,672 578.4 1,007 477.6 303 591.9 284 946.1 78 487.9Texas 7,490 637.0 4,326 549.0 1,690 620.5 1,128 1059.9 346 437.9Utah 851 668.7 547 574.4 131 795.0 132 941.1 41 646.3
See notes at end of table.
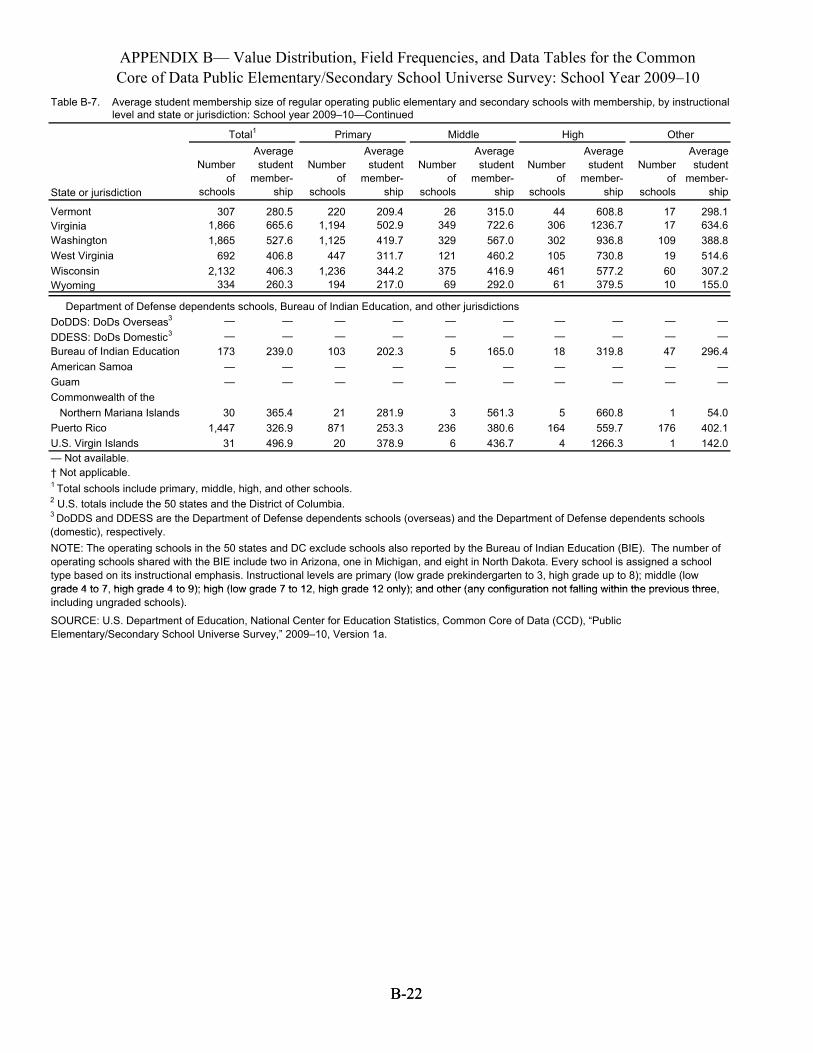
APPENDIX B— Value Distribution, Field Frequencies, and Data Tables for the CommonCore of Data Public Elementary/Secondary School Universe Survey: School Year 2009–10
B-22B-22
Table B-7. Table B-4.
Average student membership size of regular operating public elementary and secondary schools with membership, by instructional level and state or jurisdiction: School year 2009–10—Continued
State or jurisdiction
Total1 Primary Middle High OtherAverage
Number student of member-
schools ship
Average Number student
of member-schools ship
Average Number student
of member-schools ship
Average Number student
of member-schools ship
Average Number student
of member-schools ship
VermontVirginiaWashingtonWest VirginiaWisconsinWyoming
3071,8661,865
6922,132
334
280.5665.6527.6406.8406.3260.3
2201,1941,125
4471,236
194
209.4502.9419.7311.7344.2217.0
2634932912137569
315.0722.6567.0460.2416.9292.0
4430630210546161
608.81236.7936.8730.8577.2379.5
1717
109196010
298.1634.6388.8514.6307.2155.0
Department of Defense dependents schools, Bureau of Indian Education, and other jurisdictionsDoDDS: DoDs Overseas3 — — — — — —DDESS: DoDs Domestic3 — — — — — —Bureau of Indian Education 173 239.0 103 202.3 5 165.0American Samoa — — — — — —Guam — — — — — —Commonwealth of the Northern Mariana Islands 30 365.4 21 281.9 3 561.3Puerto Rico 1,447 326.9 871 253.3 236 380.6U.S. Virgin Islands 31 496.9 20 378.9 6 436.7
——18——
5164
4
——
319.8——
660.8559.7
1266.3
——47——
1176
1
——
296.4——
54.0402.1142.0
— Not available.† Not applicable. 1 Total schools include primary, middle, high, and other schools.2 U.S. totals include the 50 states and the District of Columbia.3 DoDDS and DDESS are the Department of Defense dependents schools (overseas) and the Department of Defense dependents schools (domestic), respectively.NOTE: The operating schools in the 50 states and DC exclude schools also reported by the Bureau of Indian Education (BIE). The number of operating schools shared with the BIE include two in Arizona, one in Michigan, and eight in North Dakota. Every school is assigned a school type based on its instructional emphasis. Instructional levels are primary (low grade prekindergarten to 3, high grade up to 8); middle (low grade 4 t o 7 higrade 4 to 7, gh grade 4 t o 9) hi; gh (low grade 7 thigh grade 4 to 9); high (low grade 7 to 12 o 12, high grade 12 d only); an t other (any configuration no llifa ng within the previous thhigh grade 12 only); and other (any configuration not falling within the previous threeree, including ungraded schools).
SOURCE: U.S. Department of Education, National Center for Education Statistics, Common Core of Data (CCD), “Public Elementary/Secondary School Universe Survey,” 2009–10, Version 1a.
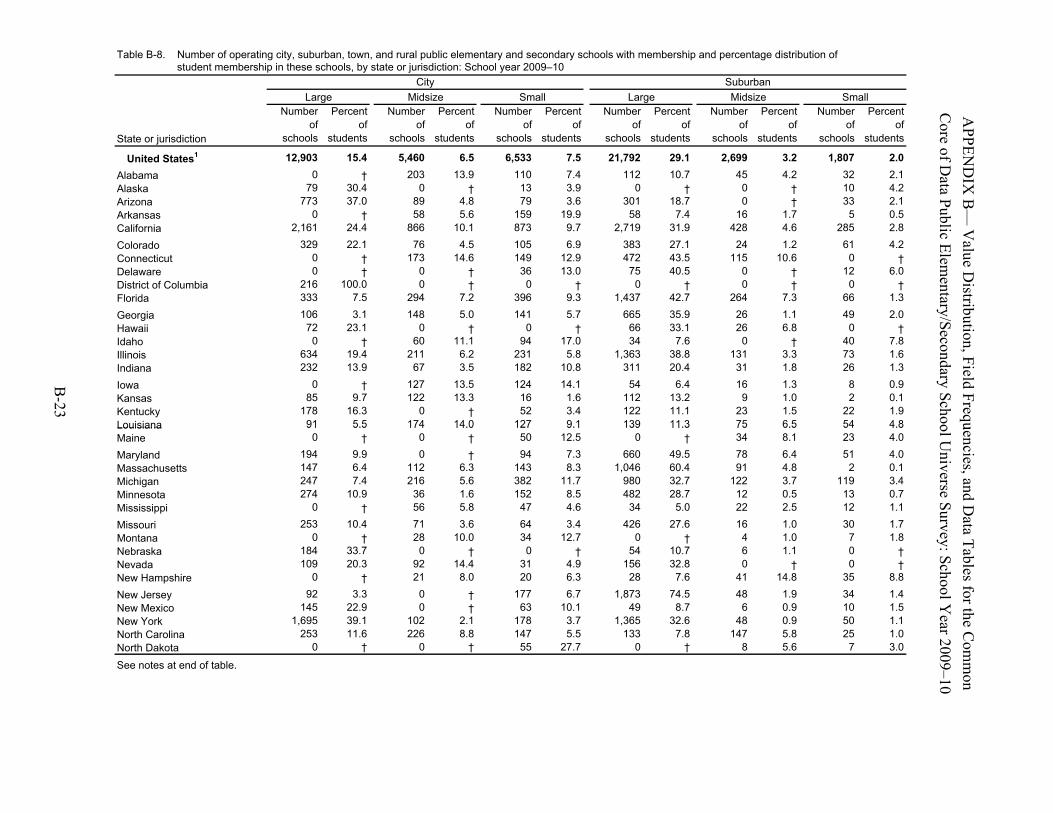
Table B-8. on of Number of operating city, suburban, town, and rural public elementary and secondary schools with membership and percentage distributiTable B-5. student membership in these schools, by st
LargeNumber Percent
ate or jurisdiction: SchoCity
MidsizeNumber Percent
ol year 2009–10
SmallNumber Percent
LargeNumber Percent
SuburbanMidsize
Number Percent Small
Number Percent Coof of of of of of of of of of
APPof of
State or jurisdiction
United States1
schools
12,903
students
15.4
schools stu
5,460
dents
6.5
schools s
6,533
tudents
7.5
schools stu
21,792
dents
29.1
schools s
2,699
tudents
3.2
schools st
1,807
Ere of
udents
2.0Alabama 0 † 203 13.9 110 7.4 112 10.7 45 4.2 32
ND
IX2.1Alaska 97 30.4 0 † 13 3.9 0 † 0 † 10
Data P4.2
Arizona 773 37.0 89 4.8 79 3.6 301 18.7 0 † 33
B2.1Arkansas 0 † 58 5.6 159 19.9 58 7.4 16 1.7 5
—ublic
0.5California 2,161 24.4 866 10.1 873 9.7 2,719 31.9 428 4.6 285 V2.8
Colorado 329 22.1 76 4.5 105 6.9 383 27.1 24 1.2 61
alE4.2Connecticut 0 † 173 14.6 149 12.9 472 43.5 115 10.6 0
uelem†Delaware 0 † 0 † 36 13.0 75 40.5 0 † 12 6.0District of Columbia 621 100.0 0 † 0 † 0 † 0 † 0
Disen†
Florida 333 7.5 294 7.2 396 9.3 1,437 42.7 264 7.3 66
tritary/S
1.3
Georgia 106 3.1 148 5.0 141 5.7 665 35.9 26 1.1 49
bu2.0Hawaii 27 23.1 0 † 0 † 66 33.1 26 6.8 0
tion,
†Idaho 0 † 60 11.1 94 17.0 34 7.6 0 † 40
ec
7.8Illinois 634 19.4 211 6.2 231 5.8 1,363 38.8 131 3.3 73 F
ondary
1.6Indiana 232 13.9 67 3.5 182 10.8 311 20.4 31 1.8 26 ield F
1.3
Iowa 0 † 127 13.5 124 14.1 54 6.4 16 1.3 8 0.9Kansas 85 9.7 122 13.3 16 1.6 112 13.2 9 1.0 2 r
Sc0.1Kentucky 817 16.3 0 † 52 3.4 122 11.1 23 1.5 22
eqho1.9LouisianaLouisiana 9191 5.55.5 174174 14.014.0 127127 9.19.1 139139 11.311.3 7575 6.56.5 5454 uuoo4.84.8Maine 0 † 0 † 50 12.5 0 † 34 8.1 23
enl 4.0
Maryland 419 9.9 0 † 94 7.3 660 49.5 78 6.4 51
cieU
n4.0Massachusetts 147 6.4 112 6.3 143 8.3 1,046 60.4 91 4.8 2
s,iv0.1Michigan 247 7.4 216 5.6 382 11.7 980 32.7 122 3.7 119
anderse
3.4Minnesota 274 10.9 36 1.6 152 8.5 482 28.7 12 0.5 13 0.7Mississippi 0 † 56 5.8 47 4.6 34 5.0 22 2.5 12
DuS1.1
Missouri 253 10.4 71 3.6 64 3.4 426 27.6 16 1.0 30
atrvey: S
1.7Montana 0 † 28 10.0 34 12.7 0 † 4 1.0 7
a T1.8Nebraska 418 33.7 0 † 0 † 54 10.7 6 1.1 0 a†Nevada 109 20.3 92 14.4 31 4.9 156 32.8 0 † 0
blc†New Hampshire 0 † 21 8.0 20 6.3 28 7.6 41 14.8 35
es ho8.8
New Jersey 29 3.3 0 † 177 6.7 1,873 74.5 48 1.9 34
fool1.4New Mexico 514 22.9 0 † 63 10.1 49 8.7 6 0.9 10
r t Year 2009–10
1.5New York 1,695 39.1 102 2.1 178 3.7 1,365 32.6 48 0.9 50 1.1North Carolina 253 11.6 226 8.8 147 5.5 133 7.8 147 5.8 25
he Com
mon
1.0North DakotaSee notes at end of table.
0 † 0 † 55 27.7 0 † 8 5.6 7 3.0
B-23
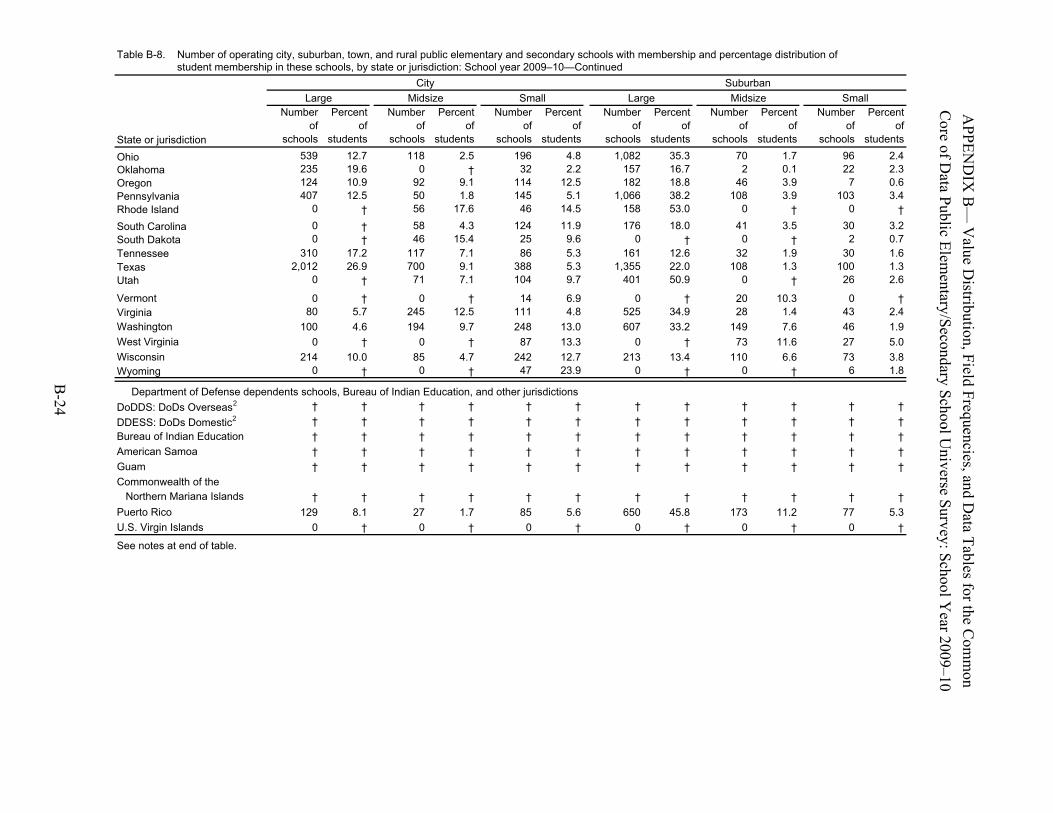
Table B-8.
on of Number of operating city, suburban, town, and rural public elementary and secondary schools with membership and percentage distributiTable B-5. student membership in these schools, by sta
LargeNumber Percent
te or jurisdiction: SchoCity
MidsizeNumber Percent
ol year 2009–10—Continued
SmallNumber Percent
LargeNumber Percent
SuburbanMidsize
Number Percent Small
Number Percent Co
of of of of of of of of of of
APProf of
State or jurisdictionOhio
schools students539 12.7
schools students118 2.5
schools students196 4.8
schools students1,082 35.3
schools students70 1.7
Ee of
schools students96 2.4
Oklahoma 523 19.6 0 † 32 2.2 157 16.7 2 0.1 22
ND
IXD
2.3Oregon 124 10.9 92 9.1 114 12.5 182 18.8 46 3.9 7 0.6Pennsylvania 407 12.5 50 1.8 145 5.1 1,066 38.2 108 3.9 103 B3.4Rhode Island 0 † 56 17.6 46 14.5 158 53.0 0 † 0 —
ata Public
†South Carolina 0 † 58 4.3 124 11.9 176 18.0 41 3.5 30 3.2South Dakota 0 † 46 15.4 25 9.6 0 † 0 † 2
VaE0.7
Tennessee 310 17.2 117 7.1 86 5.3 161 12.6 32 1.9 30
lulem1.6Texas 2,012 26.9 700 9.1 388 5.3 1,355 22.0 108 1.3 100
e 1.3Utah 0 † 71 7.1 104 9.7 401 50.9 0 † 26
Disen2.6
Vermont 0 † 0 † 14 6.9 0 † 20 10.3 0
tritary/S
†Virginia 80 5.7 245 12.5 111 4.8 525 34.9 28 1.4 43
bu2.4Washington 100 4.6 194 9.7 248 13.0 607 33.2 149 7.6 46
tio1.9West Virginia 0 † 0 † 87 13.3 0 † 73 11.6 27
eco5.0Wisconsin 214 10.0 85 4.7 242 12.7 213 13.4 110 6.6 73
n, Findary
3.8Wyoming 0 † 0 † 47 23.9
Department of Defense dependents schools, Bureau of Indian Education, and other jurisdictions
0 † 0 † 6 eld F S
1.8
2DoDDS: DoDs Overseas † † † † † † † † † † †
requchoo
†2DDESS: DoDs Domestic † † † † † † † † † † † ueo†
Bureau of Indian Education † † † † † † † † † † †
enl †American Samoa † † † † † † † † † † †
cieU
n†Guam † † † † † † † † † † †
s, ive†
Commonwealth of the
an
Northern Mariana Islands † † † † † † † † † † †
d †Puerto Rico 129 8.1 27 1.7 85 5.6 650 45.8 173 11.2 77
Da
rse Survey: S
5.3U.S. Virgin Islands 0 † 0 † 0 †
See notes at end of table.
0 † 0 † 0
ta Tables for the Com
mon
chool Year 2009–10
†
B-24
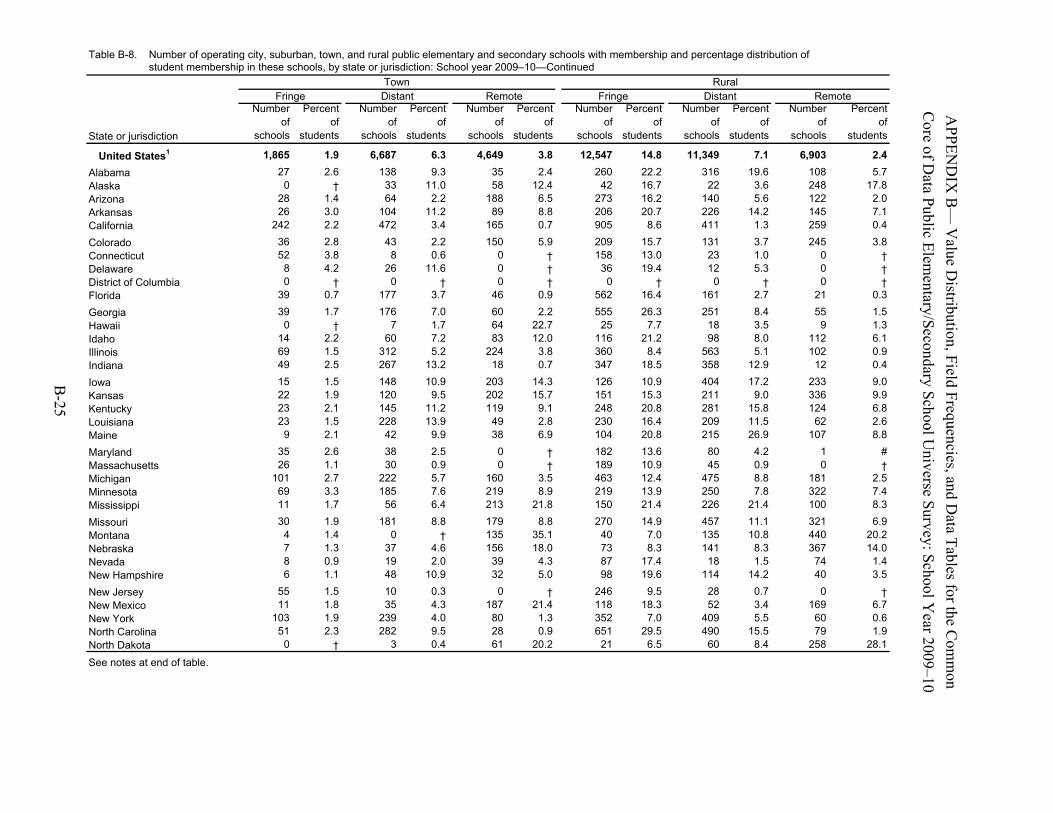
Table B-8.
Number of operating city, suburban, town, and rural public elementary and secondary schools with membership and percentage distribution of Table B-5. student membership in these schools, by state or jurisdiction: School year 2009–10—Continued
Town RuralgFrin e Distant Remote Fringe Distant Remote
Number Percent Number Percent Number Percent Number Percent Number Percent Number Percent Coof of of of of of of of of of
APPof of
State or jurisdiction
United States1
schools st
1,865
udents
1.9
schools s
6,687
tudents
6.3
schools st
4,649
udents
3.8
schools s
12,547
tudents
14.8
schools s
11,349
tudents
7.1
schools
6,903
Ere of
students
2.4Alabama 27 2.6 138 9.3 35 2.4 260 22.2 316 19.6 108
ND
IXD
ata P
5.7Alaska 0 † 33 11.0 58 12.4 42 16.7 22 3.6 248 17.8Arizona 28 1.4 64 2.2 188 6.5 273 16.2 140 5.6 122
B2.0Arkansas 26 3.0 104 11.2 89 8.8 206 20.7 226 14.2 145
—ublic Elem
7.1California 242 2.2 472 3.4 165 0.7 905 8.6 411 1.3 259 0.4
Colorado 36 2.8 43 2.2 150 5.9 209 15.7 131 3.7 245
Va3.8
Connecticut 52 3.8 8 0.6 0 † 158 .13 0 23 1.0 0
lu
†Delaware 8 4.2 26 11.6 0 † 36 .19 4 12 5.3 0
e †District of Columbia 0 † 0 † 0 † 0 † 0 † 0
Dien†
Florida 39 0.7 177 3.7 46 0.9 562 16.4 161 2.7 21
strtary/S
0.3
Georgia 39 1.7 176 7.0 60 2.2 555 26.3 251 8.4 55
ibu1.5Hawaii 0 † 7 1.7 64 22.7 25 7.7 18 3.5 9 ti1.3Idaho 14 2.2 60 7.2 83 12.0 116 21.2 98 8.0 112
ec6.1Illinois 69 1.5 312 5.2 224 3.8 360 8.4 563 5.1 102
on, Fondary
0.9Indiana 49 2.5 267 13.2 18 0.7 347 18.5 358 12.9 12 ield F
0.4
Iowa 15 1.5 148 10.9 203 14.3 126 10.9 404 17.2 233 9.0Kansas 22 1.9 120 9.5 202 15.7 151 15.3 211 9.0 336 r
Scho
9.9Kentucky 23 2.1 145 11.2 119 9.1 248 20.8 281 15.8 124 equ6.8Louisiana 23 1.5 228 13.9 49 2.8 230 16.4 209 11.5 62 uoo2.6Maine 9 2.1 42 9.9 38 6.9 104 20.8 215 26.9 107
e enl 8.8
Maryland 35 2.6 38 2.5 0 † 182 13.6 80 4.2 1
ciU
n#Massachusetts 26 1.1 30 0.9 0 † 189 .10 9 45 0.9 0
es,iv†Michigan 101 2.7 222 5.7 160 3.5 463 12.4 475 8.8 181
anderse2.5
Minnesota 69 3.3 185 7.6 219 8.9 219 13.9 250 7.8 322 7.4Mississippi 11 1.7 56 6.4 213 21.8 150 21.4 226 21.4 100
Du S
8.3
Missouri 30 1.9 181 8.8 179 8.8 270 14.9 457 11.1 321
atrvey: S
6.9Montana 4 1.4 0 † 135 35.1 40 7.0 135 10.8 440
a 20.2Nebraska 7 1.3 37 4.6 156 18.0 73 8.3 141 8.3 367
Ta14.0Nevada 8 0.9 19 2.0 39 4.3 87 17.4 18 1.5 74
blc1.4New Hampshire 6 1.1 48 10.9 32 5.0 98 19.6 114 14.2 40
es ho3.5
New Jersey 55 1.5 10 0.3 0 † 246 .9 5 28 0.7 0
fool†New Mexico 11 1.8 35 4.3 187 21.4 118 18.3 52 3.4 169
r t Year 2009–10
6.7New York 103 1.9 239 4.0 80 1.3 352 7.0 409 5.5 60 0.6North Carolina 51 2.3 282 9.5 28 0.9 651 29.5 490 15.5 79
he Com
mon
1.9North DakotaSee notes at end of table.
0 † 3 0.4 61 20.2 21 6.5 60 8.4 258 28.1
B-25
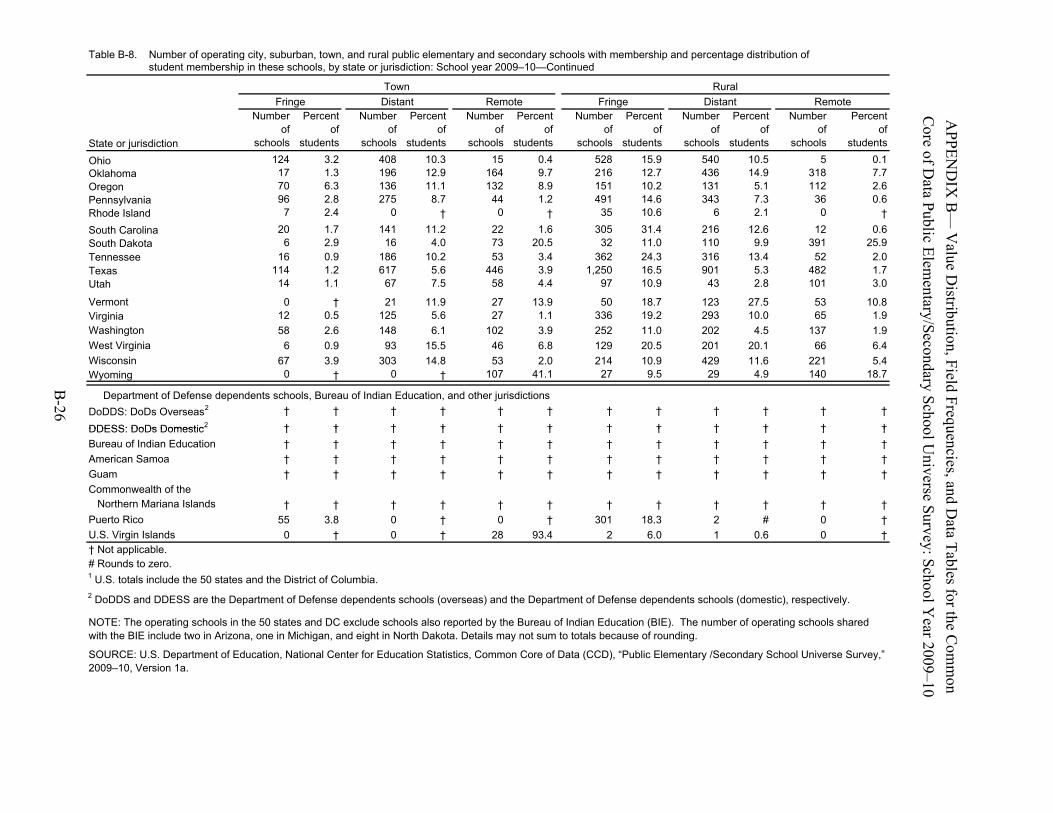
Table B-8.
Number of operating city, suburban, town, and rural public elementary and secondary schools with membership and percentage distribution ofTable B-5. student membership in these schools, by state or jurisdiction: Scho
Town
ol year 2009–10—Continued
RuralgFrin e
Number Percent Distant
Number Percent Remote
Number Percent Fringe
Number Percent Distant
Number Percent Remote
Number Percent Coof of of of of of of of of of
APPof of
State or jurisdictionOhio
schools students124 3.2
schools students408 10.3
schools students15 0.4
schools students528 15.9
schools students540 10.5
Ere of
schools students5 0.1
Oklahoma 17 1.3 196 12.9 164 9.7 216 12.7 436 14.9 318
ND
IXD
ata P
7.7Oregon 70 6.3 136 11.1 132 8.9 151 10.2 131 5.1 112 2.6Pennsylvania 96 2.8 275 8.7 44 1.2 491 14.6 343 7.3 36 B0.6Rhode Island 7 2.4 0 † 0 † 35 .10 6 6 2.1 0 —ublic Elem
†South Carolina 20 1.7 141 11.2 22 1.6 305 31.4 216 12.6 12 0.6South Dakota 6 2.9 16 4.0 73 20.5 32 11.0 110 9.9 391
Va25.9
Tennessee 16 0.9 186 10.2 53 3.4 362 24.3 316 13.4 52
lu2.0Texas 114 1.2 617 5.6 446 3.9 1,250 16.5 901 5.3 482
e 1.7Utah 14 1.1 67 7.5 58 4.4 97 10.9 43 2.8 101
Dien3.0
Vermont 0 † 21 11.9 27 13.9 50 18.7 123 27.5 53
strtary/S
10.8Virginia 12 0.5 125 5.6 27 1.1 336 19.2 293 10.0 65
ibu1.9Washington 58 2.6 148 6.1 102 3.9 252 11.0 202 4.5 137
ti1.9West Virginia 6 0.9 93 15.5 46 6.8 129 20.5 201 20.1 66
eco6.4Wisconsin 67 3.9 303 14.8 53 2.0 214 10.9 429 11.6 221
ndary
5.4Wyoming 0 † 0 † 107 41.1
Department of Defense dependents schools, Bureau of Indian Education, and other jurisdictions
27 9.5 29 4.9 140
on, Field F S
18.7
DoDDS: DoDs Overseas2 † † † † † † † † † † †
reqchoo
†2DDESS: DoDs DomesticDDESS: DoDs Domestic2 †† †† †† †† †† †† †† †† †† †† †† uuo††
Bureau of Indian Education † † † † † † † † † † †
enl U†American Samoa † † † † † † † † † † †
cieni†Guam † † † † † † † † † † †
s, ve†Commonwealth of the
an
Northern Mariana Islands † † † † † † † † † † †
d †Puerto Rico 55 3.8 0 † 0 † 301 .18 3 2 # 0
Da
rse Survey: S
†U.S. Virgin Islands 0 † 0 † 28 93.4† Not applicable.
2 .6 0 1 0.6 0
ta Ta
†
# Rounds to zero.
bles 1 U.S. totals include the 50 states and the District of Columbia.
cho
2 DoDDS and DDESS are the Department of Defense dependents schools (overseas) and the Department of Defense dependents schools (domestic), respectively.
for ol
NOTE: The operating schools in the 50 states and DC exclude schools also reported by the Bureau of Indian Education (BIE). The number of operating schools shared
the Com
mon
Year 2009–10
with the BIE include two in Arizona, one in Michigan, and eight in North Dakota. Details may not sum to totals because of rounding.
SOURCE: U.S. Department of Education, National Center for Education Statistics, Common Core of Data (CCD), “Public Elementary /Secondary School Universe Survey,” 2009–10, Version 1a.
B-26
C-1
Appendix C—Glossary for the Common Core of Data: School Year 2009–10

C-2
Page intentionally left blank.
C-3
For the CCD to have comparable data across states, all states must abide by the same standard definitions when reporting on schools, students, and staff. To ensure a common understanding, definitions for critical terms are presented below. The glossary contains definitions for all variables and terms found on the CCD school, agency, or state files.
Agency Charter Status Indication of the relationship between the agency and associated charter schools. Categories are: all associated schools are charters; some associated schools are charter; no associated schools are charter.
Alternative Education School A public elementary/secondary school that (1) addresses needs of students that typically cannot be met in a regular school, (2) provides nontraditional education, (3) serves as an adjunct to a regular school, or (4) falls outside the categories of regular, special education, or vocational education.
American Indian/Alaska Native A person having origins in any of the original peoples of North and South America (including Central America), and who maintains tribal affiliation or community attachment (OMB directive, 1977, 1997).
American National Standards Institute (ANSI) Code Two-digit code, assigned by the Federal Information Processing Standards, that uniquely identifies a state or other jurisdiction.
Asian A person having origins in any of the original peoples of the Far East, Southeast Asia, or the Indian subcontinent including, for example, Cambodia, China, Japan, Korea, Malaysia, Pakistan, the Philippine Island, Thailand, and Vietnam (OMB directive, 1997).
Asian/Pacific Islander A person having origins in any of the original peoples of the Far East, Southeast Asia, the Indian subcontinent, or the Pacific Islands. This area includes, for example, Cambodia, China, India, Japan, Korea, Malaysia, Pakistan, Thailand, Vietnam, Guam, the Philippine Islands, Samoa, and other Pacific Islands (OMB directive, 1977).
Black or African American A person having origins in any of the black racial groups of Africa (OMB directive, 1977, 1997).
Boundary Change See “Operational Status, Agency” for definition. Name of term was changed to “Operational Status, Agency” after 1997–98.
Charter School A school providing free public elementary and/or secondary education to eligible students under a specific charter granted by the state legislature or other appropriate authority, and designated by such authority to be a charter school.
C-4
City Locale See “Locale, Urban-Centric.”
Classroom Teacher See “Teacher.”
Combined Statistical Area (CSA) If an area that qualifies as a metropolitan area (MA) has more than one million people, two or more core-based statistical areas (CBSAs) may be defined within it. Each CBSA consists of a large urbanized county or cluster of counties (cities and towns in New England) that demonstrate very strong internal economic and social links, in addition to close ties to other portions of the larger area. When CBSAs are established, the larger MA of which they are component parts is designated a combined statistical area (CSA). CSAs and CBSAs are established only where local governments favor such designations for a large MA.
Congressional District Code Congressional districts are legislatively defined subdivisions of a state for the purpose of electing representatives or delegates to the House of Representatives of the United States Congress. A state or equivalent entity may comprise a single congressional district or similar representational area. The American National Standards Institute (ANSI) provides the structure of numeric codes for representing congressional districts and similar areas defined for the various Congresses of the United States.
The Congressional District Codes are two-digit numeric codes used to represent the congressional districts of each multi-district state of the United States. For example, the First Congressional District is identified as “01,” the Second Congressional District as “02,” etc. The Congressional District in a state with only a single representative elected “at large” is designated as “00.” In the 110th Congress, this applies to Alaska, Delaware, Montana, North Dakota, South Dakota, Vermont, and Wyoming. For an entity with a nonvoting delegate—the District of Columbia, American Samoa, Guam, Puerto Rico (whose delegate is referred to as a “resident commissioner”), and the U.S. Virgin Islands—the representational area is designated as “98.” Those entities with no representation in the Congress—the Northern Mariana Islands, Palau, and the several U.S. minor outlying islands are designated as “99.”
Although congressional district codes are unique within each state and equivalent entity, and for each Congress, the congressional districts in different states may have the same code. For example, the First Congressional District of Alabama and of Arizona are both coded “01.” Since the Common Core of Data (CCD) requires the identification of congressional districts in more than one state, the congressional district code is preceded by the ANSI State numeric code. For example, the First Congressional District of Arizona is coded “0401,” with the first two digits (04) representing the ANSI State numeric code.
Core Based Statistical Area (CBSA) If an area that qualifies as a metropolitan area (MA) has more than one million people, two or more core-based statistical areas (CBSAs) may be defined within it. Each CBSA consists of a large urbanized county or cluster of counties (cities and towns in New England) that demonstrate very strong internal economic and social links, in addition to close ties to other portions of the larger area.
County Name, Local Education Agency (LEA) File The name of the county in which a local education agency is located. Prior to 2006–07, the county assignment was based on the counties of the schools associated with the local education agency, weighted by student enrollment.
County Name, School File The name of the county in which a school is located.
C-5
County Number Five-digit code, assigned by the American National Standards Institute (ANSI) that uniquely identifies every county in the United States. Digits 1 and 2 are the state ANSI code and digits 3–5 identify a county within that state.
Diploma Recipient A student who received a diploma recognizing the completion of secondary school requirements during the previous school year and subsequent summer school. It excludes high school equivalency and other high school completers (e.g., those granted a certificate of attendance.) (See also “Graduate, High School.”)
Diploma, High School A formal document certifying the successful completion of a secondary school program prescribed by the state education agency or other appropriate body.
District Locale Code, Metro-Centric See “District Locale, Metro-Centric.”
District Locale Code, Urban-Centric See “District Locale, Urban-Centric.”
District Locale, Metro-Centric A code derived from the locale codes of schools within the district, weighted by the number of students in each locale type. The metro-centric locale assignment system was used until 2006–07. (See also, “Locale, Metro-Centric.”)
District Locale, Urban-Centric A code derived from the locale codes of schools within the district, weighted by the number of students in each locale type. The urban-centric locale assignment system has been used starting in 2006–07. (See also, “Locale, Urban-Centric.”)
Dropout A student who was enrolled in school at some time during the previous school year; was not enrolled at the beginning of the current school year; has not graduated from high school or completed a state- or district-approved educational program; and does not meet any of the following exclusionary conditions: has transferred to another public school district, private school, or state- or district-approved educational program; is temporarily absent due to suspension or school-approved illness; or has died. Item was first collected in 1992–93.
Education Agency A government agency administratively responsible for providing public elementary and/or secondary instruction or educational support services.

C-6
Elementary A general level of instruction classified by state and local practice as elementary, composed of any span of grades not above grade 8; preschool or kindergarten included only if it is an integral part of an elementary school or a regularly established school system.
Elementary Teacher Teacher of a group or class that is within a general level of instruction classified by state and local practice as elementary. Preschool or kindergarten are included only if it is an integral part of an elementary school or a regularly established school system.
English Language Learner (ELL) “English language learner (ELL)” was formerly referred to as “limited English proficient (LEP).” Refers to students being served in appropriate programs of language assistance (e.g., English as a Second Language, High Intensity Language Training, bilingual education). Does not include pupils enrolled in a class to learn a language other than English. Also, ELL students are individuals who were not born in the United States or whose native languages are languages other than English; individuals who are migratory, whose native language are languages other than English, and who come from environments where a language other than English is dominant; individuals who are Native Americans or Alaska Natives, or native residents of the outlying areas and who come from environments where languages other than English have a significant impact on their level of English language proficiency; and individuals who have sufficient difficulties in speaking, reading, writing, or understanding the English language to deny such individuals the ability to meet the State’s proficient level or achievement on State assessments, or the ability to successfully achieve in classrooms where the language of instruction is English, or the opportunity to participate fully in society. Item was first collected in 1998–99.
Federally-Operated Education Agency A federally operated agency that is charged, at least in part, with providing elementary and/or secondary instruction or support services.
Free Lunch Eligible Student A student who is eligible to participate in the Free Lunch Program under the National School Lunch Act.
Full-time Equivalency (FTE) The amount of time required to perform an assignment stated as a proportion of a full-time position and computed by dividing the amount of time employed by the time normally required for a full-time position.
General Educational Development (GED) Test A comprehensive test used primarily to appraise the educational development of students who have not completed their formal high school education and who may earn a high school equivalency certificate through achievement of satisfactory scores.
Grade Span Offered The span of grades intended to be served by a school or agency, whether or not there are students currently enrolled in all grades. If a high school also has a prekindergarten program, the grade span of the high school is reported as a high school, not as a PK–12 school. Also, the ungraded designation (UG) cannot be used in a grade span unless the whole school consists of ungraded students, and in this case the grade span is reported as UGUG. “Grade span” was calculated from school membership through 1997–98 and first collected as a separate item in 1998–99.

C-7
Graduate, High School A student who received a diploma recognizing the completion of secondary school requirements during the previous school year and subsequent summer school. It excludes high school equivalency and other high school completers (e.g., those granted a certificate of attendance). (See also, “Diploma Recipient.”)
Guidance Counselor/Director Professional staff assigned specific duties and school time for counseling students and parents, addressing learning problems, evaluating student abilities, and assisting students in career and personal development. The state applies its own standards in apportioning the aggregate of guidance counselors/directors into the elementary and secondary level components.
Head Start Program A federally funded program that provides comprehensive educational, social, health, and nutritional services to low-income preschool children and their families, and children from ages 3 to school entry age (i.e., the age of compulsory school attendance). Head Start students and teachers are reported on the CCD only when the program is administered by a local education agency.
High School Completion Count A count of diploma recipients and other high school completers. Does not include high school equivalency recipients.
High School Equivalency Certificate A formal document certifying that an individual met the state requirements for high school graduation equivalency by obtaining satisfactory scores on an approved examination, and meeting other performance requirements (if any) set by a state education agency or other appropriate body.
High School Equivalency Recipient Individual who received a high school equivalency certificate during the previous school year or subsequent summer. The CCD reports only equivalency recipients who are 19 years of age or younger. Item was last reported on the Local Education Agency Survey in 1990–91, but was collected by the State Nonfiscal Survey through 2002–03. Beginning with the 2003–04 collection, the item was replaced by the number of individuals age 19 or younger who passed the GED examination, as reported by the GED Testing Service.
High School Graduate, Other Programs A student who received a high school diploma, equivalency diploma, or other completion credential during the previous school year or subsequent summer school; the credential is based upon completion of other than the standard high school requirements or is achieved through nontraditional means. Term was last used in 1986–87. See “Other Diploma Recipient,” “High School Equivalency Recipient,” and “Other High School Completer.”
High School Graduate, Regular Day School A student who received a high school diploma during the previous school year or subsequent summer school; the diploma is based upon completion of high school requirements through traditional means. Term was last used in 1986–87. See “Regular Diploma Recipient.”
C-8
Hispanic A person of Mexican, Puerto Rican, Cuban, Central or South American, or other Spanish culture or origin, regardless of race (OMB directive, 1977, 1997).
Individualized Educational Program (IEP) A written instructional plan for students with disabilities designated as special education students under the Individuals With Disabilities Education Act (IDEA, Part B). Each plan includes a (1) statement of the child’s present levels of educational performance, (2) statement of measurable annual goals, including academic and functional goals, (3) for children with disabilities who take alternate assessments aligned to alternate achievement standards, description of benchmarks or short term objectives; (4) statement of the special education and related services and supplementary aids and services; and (5) statement of any individual accommodations that are necessary to measure the academic achievement and functional performance of the child on State and districtwide assessment; and if the IEP Team determines that the child must take an alternate assessment instead of a particular regular State or districtwide assessment of student achievement, a statement of why the child cannot participate in the regular assessment and why the particular alternate assessment selected is appropriate for the child.
Instructional Aide Staff assigned to assist a teacher with routine activities associated with teaching (i.e., activities requiring minor decisions regarding students), such as monitoring, conducting rote exercises, operating equipment, and clerking. Includes only paid staff, and excludes volunteer aides.
Instructional Coordinator and Supervisor Staff supervising instructional programs at the school district or subdistrict level, including supervisors of educational television staff; coordinators and supervisors of audiovisual services; curriculum coordinators and in-service training staff; Title I coordinators and home economics supervisors; and supervisory staff engaged in the development of computer-assisted instruction. School-based department chairpersons are excluded.
Kindergarten A group or class that is part of a public school program and is taught during the year preceding first grade.
Kindergarten Teacher Teacher of a group or class that is part of a public school program and is taught during the year preceding first grade.
Large City Locale See “Locale, Metro-Centric.”
Large Town Locale See “Locale, Metro-Centric.”
Latitude Latitude is the north or south angular distance from the equator, with positive values going north and negative values going south. When combined with longitude, it reflects an estimation of where the school is physically situated on the street segment to which it was coded. Coordinate degrees, minutes, and seconds have been converted to, and are displayed in terms of, their decimal equivalent. The digits to the left of the decimal point represent the number of degrees from the equator, and the digits to the right of the decimal point represent the fraction of the degree carried

C-9
out to six decimal places. For example, if a school’s latitude is 30 degrees, 30 minutes north, then it is shown as 30.500000.
Librarian or Media Specialist A professional staff member or supervisor assigned specific duties and school time for professional library services activities. These include selecting, acquiring, preparing, cataloging, and circulating books and other printed materials; planning the use of the library by students, teachers, and instructional staff; and guiding individuals in the use of library books and material maintained separately or as a part of an instructional materials center.
Library and Media Support Staff Staff member who renders other professional library and media services; also includes library aides and those involved in library/media support. Duties include selecting, preparing, caring for, and making available to instructional staff, equipment, films, filmstrips, transparencies, tapes, TV programs, and similar materials maintained separately or as part of an instructional materials center. Also include activities in the audiovisual center, TV studio, related work-study areas, and services provided by audiovisual personnel.
Limited-English Proficient (LEP) See “English Language Learner (ELL).”
Local Education Agency (LEA) Administrative Support Staff Staff members providing direct support to LEA administrators, business office support, data processing, secretarial and other clerical staff.
Local Education Agency (LEA) Administrator Chief executive officers of education agencies, including superintendents, deputies, and assistant superintendents; other persons with districtwide responsibilities, e.g., business managers and professional instructional support staff. Excludes supervisors of instructional or student support staff.
Local Education Agency ID Seven-digit code assigned by NCES that uniquely identifies each local education agency. Digits 1 and 2 are the ANSI state code; digits 3–7 are assigned by NCES and unique within a state.
Local Education Agency Type A classification of educational agencies according to the level of administrative and operational control. The types are (1) local school district that is not a component of a supervisory union; (2) local school district that is a component of a supervisory union; (3) supervisory union administrative center; (4) regional education services agency; (5) state-operated agency; (6) federally-operated agency; (7) charter agency; and (8) other education agencies.
Locale Code, Metro-Centric See “Locale, Metro-Centric.”
Locale Code, Urban-Centric See “Locale, Urban-Centric.”
C-10
Locale, Metro-Centric An indication of school’s location relative to a populous area. The locales assigned to school districts are based on the locale code of their schools, weighted by the size of the schools’ membership. The metro-centric locale assignment system was used from 1998–99 through 2005–06.
The locale code categories are defined below.
Large city: A principal city of a metropolitan core based statistical area (CBSA), with the city having a population greater than or equal to 250,000.
Midsize city: A principal city of a metropolitan CBSA, with the city having a population less than 250,000.
Urban fringe of a large city: Any incorporated place, Census-designated place, or non-place territory within a metropolitan CBSA of a large city and defined as urban by the Census Bureau.
Urban fringe of a midsize city: Any incorporated place, Census-designated place, or non-place territory within a metropolitan CBSA of a midsize city and defined as urban by the Census Bureau.
Large town: An incorporated place or Census-designated place with a population greater than or equal to 25,000 and located outside a metropolitan CBSA or inside a micropolitan CBSA.
Small town: An incorporated place or Census-designated place with a population less than 25,000 and greater than or equal to 2,500 and located outside a metropolitan CBSA or inside a micropolitan CBSA.
Rural, outside CBSA: Any incorporated place, Census-designated place, or non-place territory not within a metropolitan CBSA or within a micropolitan CBSA and defined as rural by the Census Bureau.
Rural, inside CBSA: Any incorporated place, Census-designated place, or non-place territory within a metropolitan CBSA and defined as rural by the Census Bureau.
Locale, Urban-Centric An indication of school’s location relative to a populous area. The locales assigned to school districts are based on the locale code of their schools, weighted by the size of the schools’ membership. The urban-centric locale assignment system has been used starting in 2006–07.
The locale code categories are defined below.
City, Large: Territory inside an urbanized area and inside a principal city with population of 250,000 or more.
City, Midsize: Territory inside an urbanized area and inside a principal city with population less than 250,000 and greater than or equal to 100,000.
City, Small: Territory inside an urbanized area and inside a principal city with population less than 100,000.
Suburb, Large: Territory outside a principal city and inside an urbanized area with population of 250,000 or more.
Suburb, Midsize: Territory outside a principal city and inside an urbanized area with population less than 250,000 and greater than or equal to 100,000.
Suburb, Small: Territory outside a principal city and inside an urbanized area with population less than 100,000.
Town, Fringe: Territory inside an urban cluster that is less than or equal to 10 miles from an urbanized area.
Town, Distant: Territory inside an urban cluster that is more than 10 miles and less than or equal to 35 miles from an urbanized area.
Town, Remote: Territory inside an urban cluster that is more than 35 miles of an urbanized area.
Rural, Fringe: Census-defined rural territory that is less than or equal to 5 miles from an urbanized area, as well as rural territory that is less than or equal to 2.5 miles from an urban cluster.
Rural, Distant: Census-defined rural territory that is more than 5 miles but less than or equal to 25 miles from an urbanized area, as well as rural territory that is more than 2.5 miles but less than or equal to 10 miles from an urban cluster.
C-11
Rural, Remote: Census-defined rural territory that is more than 25 miles from an urbanized area and is also more than 10 miles from an urban cluster.
Longitude Longitude is the east or west angular distance from the prime meridian, with positive values going east and negative values going west. When combined with latitude, it reflects an estimation of where the school is physically situated on the street segment to which it was coded. Coordinate degrees, minutes, and seconds have been converted to, and are displayed in terms of, their decimal equivalent. The digits to the left of the decimal point represent the number of degrees from the prime meridian. The digits to the right of the decimal point represent the fraction of the next degree carried out to six decimal places. For example, if a school’s longitude is 90 degrees, 15 minutes west, then it is shown as –90.250000.
Magnet School or Program A special school or program designed to attract students of different racial/ethnic backgrounds for the purpose of reducing, preventing, or eliminating racial isolation (50 percent or more minority enrollment); and/or to provide an academic or social focus on a particular theme (e.g., science/math, performing arts, gifted/talented, or foreign language).
Media Specialist See “Library and Media Support Staff.”
Membership The count of students on the current roll taken on the school day closest to October 1, by using either the sum of original entries and re-entries minus total withdrawals or the sum of the total present and the total absent.
Metropolitan Statistical Area (MSA) An area consisting of one or more contiguous counties (cities and towns in New England) that contain a core area with a large population nucleus, as well as adjacent communities having a high degree of economic and social integration with that core.
Metropolitan Status (Metro Status) Metro status is defined as the classification of the reported location of an education agency’s administrative office relative to a metropolitan statistical area. (See also “Metropolitan Statistical Area.”)
Micropolitan Statistical Area A core based statistical area associated with at least one urban cluster that has a population of at least 10,000 but less than 50,000. The micropolitan statistical area comprises the central county or counties that contain the core, plus adjacent outlying counties having a high degree of social and economic integration with the central county as measured through commuting.
Midsize City Locale See “Locale, Metro-Centric.”
C-12
Migrant Student Children who are, or whose parents or spouses are, migratory agricultural workers, including migratory dairy workers, or migratory fishers, and who, in the preceding 36 months, in order to obtain, or accompany such parents or spouses, in order to obtain, temporary or seasonal employment in agricultural or fishing work (a) have moved from one local education agency (LEA) to another; (b) in a state that comprises a single LEA, have moved from one administrative area to another within such LEA; or (c) reside in an LEA of more than 15,000 square miles, and migrate a distance of 20 miles or more to a temporary residence to engage in a fishing activity.
Native Hawaiian or Other Pacific Islander A person having origins in any of the original peoples of Hawaii, Guam, Samoa, or other Pacific Islands (OMB directive, 1997).
Officials and Administrators See “Local Education Agency Administrator.”
Operational Status, Agency Classification of the operational conditions or changes in an education agency’s boundaries or jurisdiction. Classifications include currently operational; closed; new; added; changed boundry; temporarily closed and may reopen within 3 years; scheduled to be operational within 2 years; and reopened. Prior to 1998–99, the term “Boundary Change” was used.
Operational Status, School Classification of the operational condition of a school. Classifications include currently operational; closed; new; added; changed agency; temporarily closed and may reopen within 3 years; scheduled to be operational within 2 years; and reopened.
Other Diploma Recipient A student who received a diploma through other than a regular school program during the previous school year or subsequent summer. Last reported in 1997–98; combined with “Regular Diploma Recipient” in 1998–99, with both categories reported as “Diploma Recipient.”
Other High School Completer Student who has received a certificate of attendance or other certificate of completion in lieu of a diploma during the previous school year and subsequent summer school.
Other Support Staff Support staff not reported in instructional or student support. Include employees such as plant and equipment maintenance, bus drivers, security, and food service workers.
Prekindergarten Student A student who is enrolled in a group or class that is part of a public school program taught during the year or years preceding kindergarten, excluding Head Start students unless part of an authorized public education program of a local education agency.

C-13
Prekindergarten Teacher Teacher of a group or class that is part of a public school program that is taught during the year or years preceding kindergarten; includes teachers of Head Start students if part of an authorized public education program of a local education agency.
Public School An institution that provides educational services and: (1) has one or more grade groups (prekindergarten through grade 12) or is ungraded; (2) has one or more teachers to give instruction; (3) is located in one or more buildings or sites; (4) has an assigned administrator; (5) receives public funds as primary support; and (6) is operated by an education agency.
Reduced-Price-Lunch Eligible Student A student who is eligible to participate in the Reduced-Price Lunch Program under the National School Lunch Act.
Regional Education Service Agency An agency created for the purposes of providing specialized educational services to other education agencies.
Regular Diploma Recipient See “High School Graduate, Regular Day School.” Last reported in 1997–98; combined with “Other Diploma Recipient” in 1998–99, with both categories reported as “Diploma Recipient.”
Regular School A public elementary/secondary school providing instruction and education services that does not focus primarily on special education, vocational/technical education, or alternative education, or on any of the particular themes associated with magnet/special program emphasis schools.
Reportable Program A program within a school that may be self-contained, but does not have its own principal.
Rural Locale See “Locale, Urban-Centric.”
Rural, Inside CBSA See “Locale, Metro-Centric.”
Rural, Outside CBSA See “Locale, Metro-Centric.”
School Administrative Support Staff Staff whose activities are concerned with support of the teaching and administrative duties of the office of the principal or department chairpersons. Category includes clerical staff and secretaries.
C-14
School Administrator Staff whose activities are concerned with directing and managing the operation of a particular school. Category includes principals, assistant principals, and other assistants; and persons who supervise school operations, assign duties to staff members, supervise and maintain the records of the school, and coordinate school instructional activities with those of the education agency, including department chairpersons.
School District An education agency or administrative unit that operates under a public board of education.
School Identification (ID) Number Twelve-digit code assigned by NCES that uniquely identifies each public school. Digits 1 and 2 are the ANSI state code; digits 3–7 are the LEA ID; and digits 8–12 identify the school uniquely within a state.
Schoolwide Title I Eligible School A school that is a Title I eligible school and its percentage of low-income students is at least 40 percent. (See also “Title I Eligible School.”)
Secondary The general level of instruction classified by state and local practice as secondary and composed of any span of grades beginning with the next grade following the elementary grades and ending with or below grade 12.
Secondary Teacher Teacher of a group or class that is within the general level of instruction classified by state and local practice as secondary.
Shared Time School A school in which some or all of the students are enrolled at a different school of record and attend the shared time school on a part-day basis: for example, a regional vocational center attended by students from multiple high schools on a part-day basis.
Small Town Locale See “Locale, Metro-Centric.”
Special Education School A public elementary/secondary school that focuses primarily on special education—including instruction for any of the following students with: autism, deaf-blindness, developmental delay, hearing impairment, intellectual disability, multiple disabilities, orthopedic impairment, serious emotional disturbance, specific learning disability, speech or language impairment, traumatic brain injury, visual impairment, and other health impairments—and that adapts curriculum, materials, or instruction for students served.
State Education Agency (SEA) An agency of the state charged with primary responsibility for coordinating and supervising public instruction, including setting standards for elementary and secondary instructional programs.

C-15
State, Federal, and Other Agencies Include stated operated agency, federally operated agency, and other education agency. (See also “State Operated Agency,” “Federally Operated Agency,” and “Other Education Agency.”)
State-Operated Agency Agency that is charged, at least in part, with providing elementary and/or secondary instruction or support services. Examples include elementary/secondary programs operated by the state for the deaf or blind; and programs operated by state correctional facilities.
Student An individual for whom instruction is provided in an elementary or secondary education program that is not an adult education program and is under the jurisdiction of a school, school system, or other education institution.
Student Support Services Staff Professional staff members whose activities are concerned with the direct support of students and who nurture, but do not instruct, students. Includes attendance officers; staff providing health, psychology, speech pathology, audiology, or social services; and supervisors of the preceding staff and of health, transportation, and food service workers.
Suburb Locale See “Locale, Urban-Centric.”
Supervisory Union An education agency where administrative services are performed for more than one school district by a common superintendent.
Teacher A professional school staff member who instructs students in prekindergarten, kindergarten, grades 1–12, or ungraded classes and maintains daily student attendance records.
Teacher of Ungraded Class
Teacher of a group or class that is not organized on the basis of grade grouping and has no standard grade designation. This includes regular classes that have no grade designations and special classes for exceptional students that have no grade designations. Such a class is likely to contain students of different ages who, frequently, are identified according to level of performance in one or more areas of instruction rather than according to grade level or age level.
Title I Eligible School A Title I eligible school is a school designated under appropriate state and federal regulations as being high poverty and eligible for participation in programs authorized by Title I of P.L. 107-110. A Title I eligible school is one in which the percentage of children from low-income families is at least as high as the percentage of children from low-income families served by the LEA as a whole or that the LEA has designated as Title I eligible because 35 percent or more of the children are from low-income families.
C-16
Town Locale See “Locale, Urban-Centric.”
Two or More Races A person choosing more than one of the five race categories (OMB directive, 1997).
Ungraded Student Individual assigned to class or program that does not have standard grade designations.
Urban Fringe of a Large City Locale See “Locale, Metro-Centric.”
Urbanized Area An area that is a densely settled core with a population concentration of at least 50,000.
Vocational Education School A public elementary/secondary school that focuses primarily on providing formal preparation for semiskilled, skilled, technical, or professional occupations for high school-age students who have opted to develop or expand their employment opportunities, often in lieu of preparing for college entry.
White A person having origins in any of the original peoples of Europe, North Africa, or the Middle East (OMB directive, 1977, 1997).

Appendix D—State Notes for the Common Core of Data: School Year 2009–10
D-1

Page intentionally left blank.
D-2
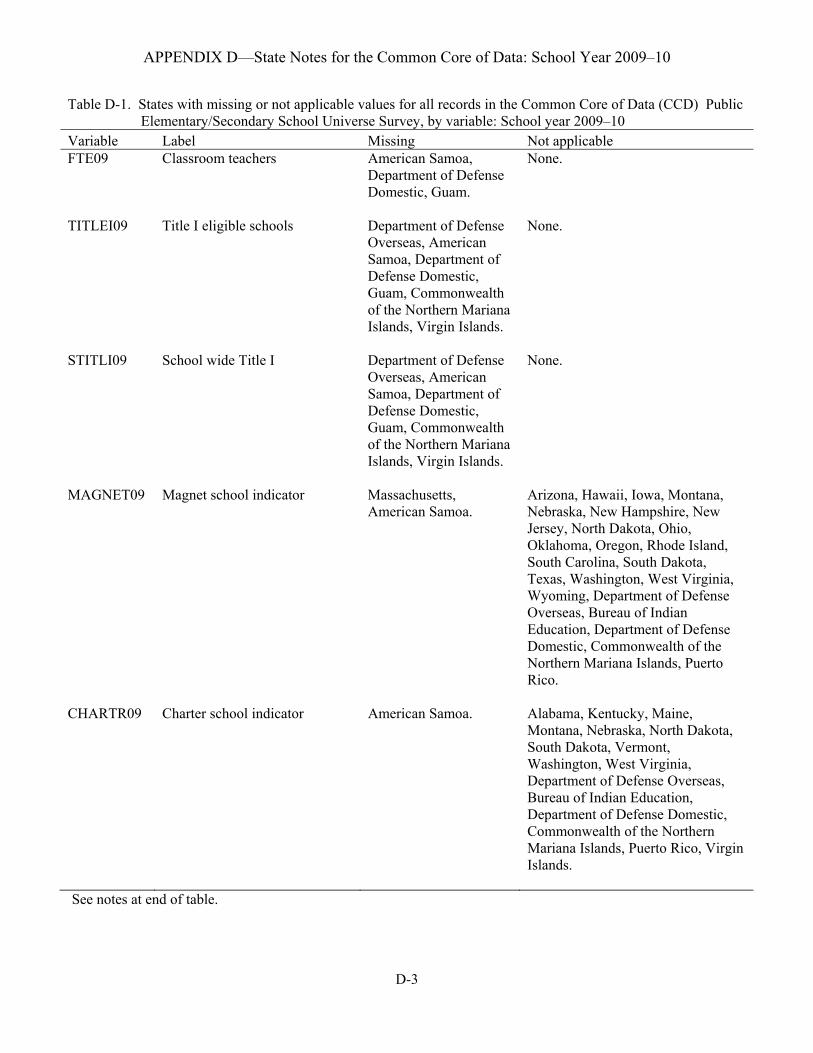
APPENDIX D—State Notes for the Common Core of Data: School Year 2009–10
Table D-1. States with missing or not applicable values for all records in the Common Core of Data (CCD) Public Elementary/Secondary School Universe Survey, by variable: School year 2009–10 Variable Label Missing Not applicable FTE09 Classroom teachers American Samoa,
Department of Defense Domestic, Guam.
None.
TITLEI09 Title I eligible schools Department of Defense Overseas, American Samoa, Department of Defense Domestic, Guam, Commonwealth of the Northern Mariana Islands, Virgin Islands.
None.
STITLI09 School wide Title I Department of Defense Overseas, American Samoa, Department of Defense Domestic, Guam, Commonwealth of the Northern Mariana Islands, Virgin Islands.
None.
MAGNET09 Magnet school indicator Massachusetts, American Samoa.
Arizona, Hawaii, Iowa, Montana, Nebraska, New Hampshire, New Jersey, North Dakota, Ohio, Oklahoma, Oregon, Rhode Island, South Carolina, South Dakota, Texas, Washington, West Virginia, Wyoming, Department of Defense Overseas, Bureau of Indian Education, Department of Defense Domestic, Commonwealth of the Northern Mariana Islands, Puerto Rico.
CHARTR09 Charter school indicator American Samoa. Alabama, Kentucky, Maine, Montana, Nebraska, North Dakota, South Dakota, Vermont, Washington, West Virginia, Department of Defense Overseas, Bureau of Indian Education, Department of Defense Domestic, Commonwealth of the Northern Mariana Islands, Puerto Rico, Virgin Islands.
See notes at end of table.
D-3
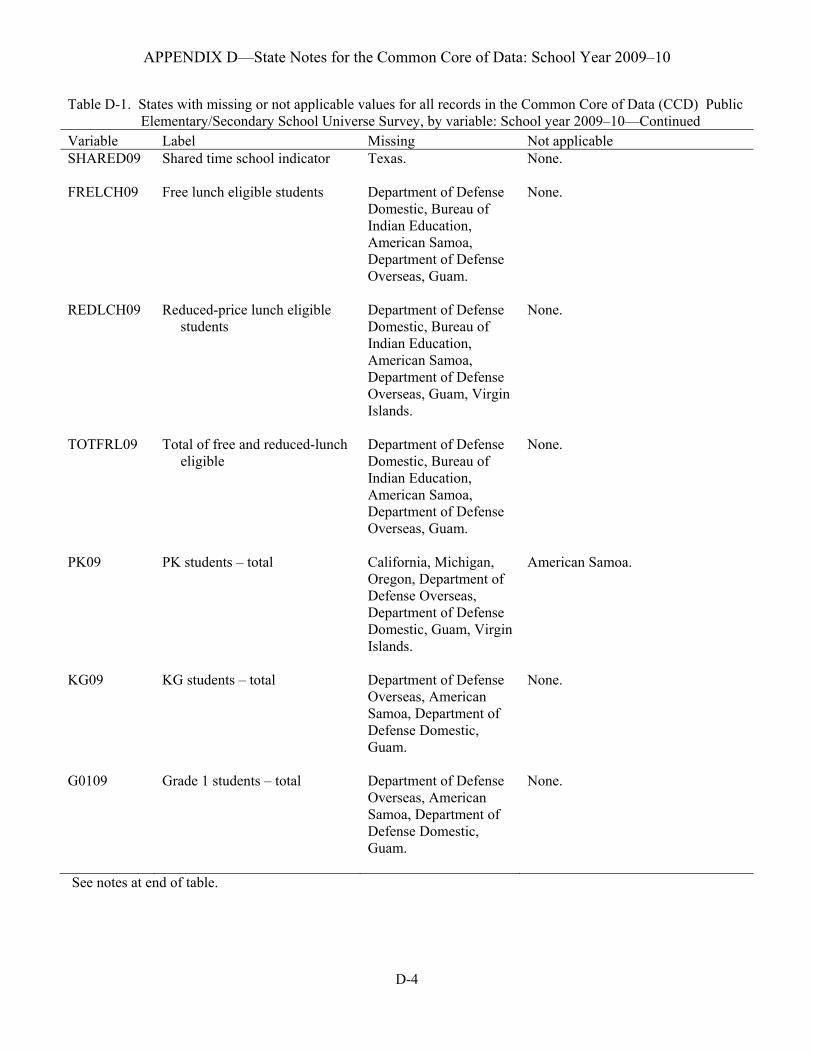
APPENDIX D—State Notes for the Common Core of Data: School Year 2009–10
Table D-1. States with missing or not applicable values for all records in the Common Core of Data (CCD) Public Elementary/Secondary School Universe Survey, by variable: School year 2009–10—Continued Variable Label Missing Not applicable SHARED09 Shared time school indicator Texas.
None.
FRELCH09 Free lunch eligible students Department of Defense Domestic, Bureau of Indian Education, American Samoa, Department of Defense Overseas, Guam.
None.
REDLCH09 Reduced-price lunch eligible students
Department of Defense Domestic, Bureau of Indian Education, American Samoa, Department of Defense Overseas, Guam, Virgin Islands.
None.
TOTFRL09 Total of free and reduced-lunch eligible
Department of Defense Domestic, Bureau of Indian Education, American Samoa, Department of Defense Overseas, Guam.
None.
PK09 PK students – total California, Michigan, Oregon, Department of Defense Overseas, Department of Defense Domestic, Guam, Virgin Islands.
American Samoa.
KG09 KG students – total Department of Defense Overseas, American Samoa, Department of Defense Domestic, Guam.
None.
G0109 Grade 1 students – total Department of Defense Overseas, American Samoa, Department of Defense Domestic, Guam.
None.
See notes at end of table.
D-4
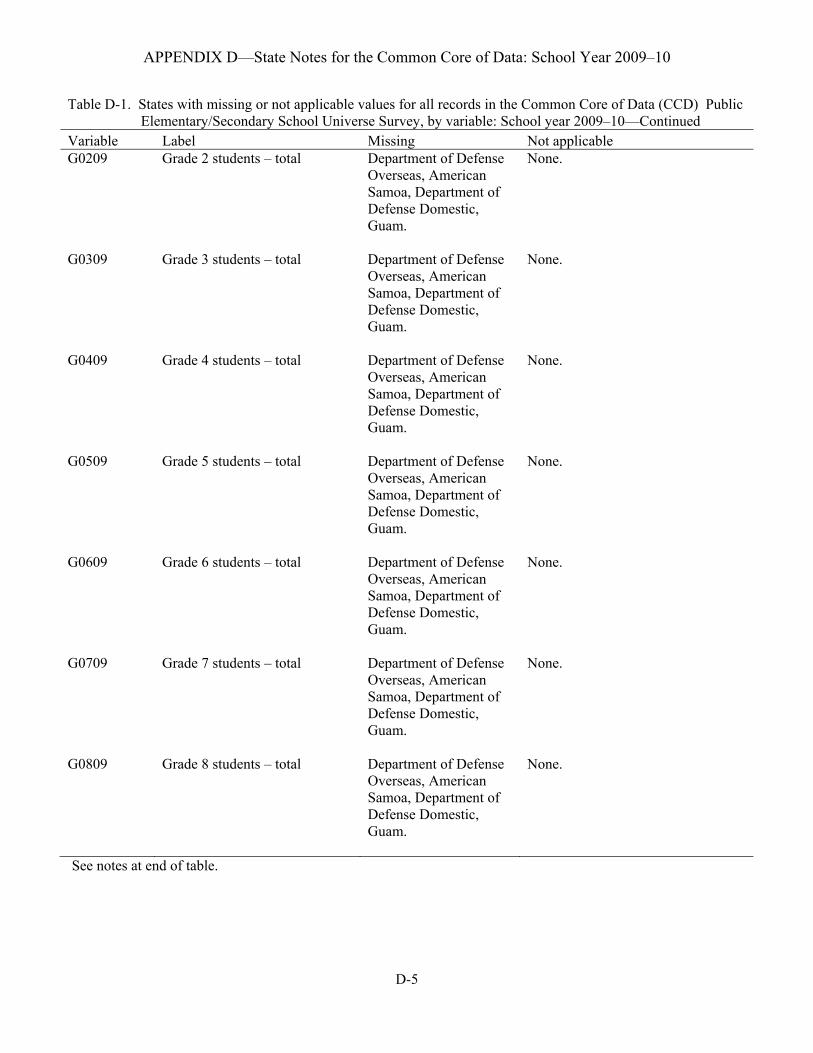
APPENDIX D—State Notes for the Common Core of Data: School Year 2009–10
Table D-1. States with missing or not applicable values for all records in the Common Core of Data (CCD) Public Elementary/Secondary School Universe Survey, by variable: School year 2009–10—Continued Variable Label Missing Not applicable G0209 Grade 2 students – total Department of Defense
Overseas, American Samoa, Department of Defense Domestic, Guam.
None.
G0309 Grade 3 students – total Department of Defense Overseas, American Samoa, Department of Defense Domestic, Guam.
None.
G0409 Grade 4 students – total Department of Defense Overseas, American Samoa, Department of Defense Domestic, Guam.
None.
G0509 Grade 5 students – total Department of Defense Overseas, American Samoa, Department of Defense Domestic, Guam.
None.
G0609 Grade 6 students – total Department of Defense Overseas, American Samoa, Department of Defense Domestic, Guam.
None.
G0709 Grade 7 students – total Department of Defense Overseas, American Samoa, Department of Defense Domestic, Guam.
None.
G0809 Grade 8 students – total Department of Defense Overseas, American Samoa, Department of Defense Domestic, Guam.
None.
See notes at end of table.
D-5
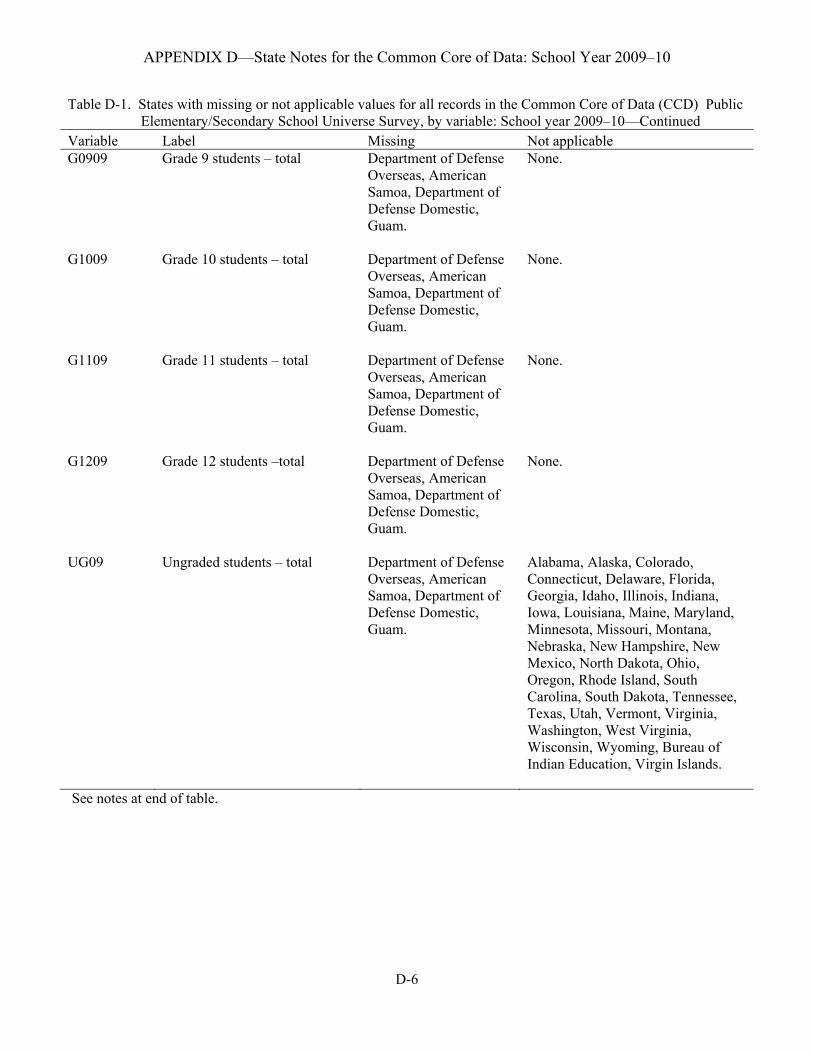
APPENDIX D—State Notes for the Common Core of Data: School Year 2009–10
Table D-1. States with missing or not applicable values for all records in the Common Core of Data (CCD) Public Elementary/Secondary School Universe Survey, by variable: School year 2009–10—Continued Variable Label Missing Not applicable G0909 Grade 9 students – total Department of Defense
Overseas, American Samoa, Department of Defense Domestic, Guam.
None.
G1009 Grade 10 students – total Department of Defense Overseas, American Samoa, Department of Defense Domestic, Guam.
None.
G1109 Grade 11 students – total Department of Defense Overseas, American Samoa, Department of Defense Domestic, Guam.
None.
G1209 Grade 12 students –total Department of Defense Overseas, American Samoa, Department of Defense Domestic, Guam.
None.
UG09 Ungraded students – total
Department of Defense Overseas, American Samoa, Department of Defense Domestic, Guam.
Alabama, Alaska, Colorado, Connecticut, Delaware, Florida, Georgia, Idaho, Illinois, Indiana, Iowa, Louisiana, Maine, Maryland, Minnesota, Missouri, Montana, Nebraska, New Hampshire, New Mexico, North Dakota, Ohio, Oregon, Rhode Island, South Carolina, South Dakota, Tennessee, Texas, Utah, Vermont, Virginia, Washington, West Virginia, Wisconsin, Wyoming, Bureau of Indian Education, Virgin Islands.
See notes at end of table.
D-6
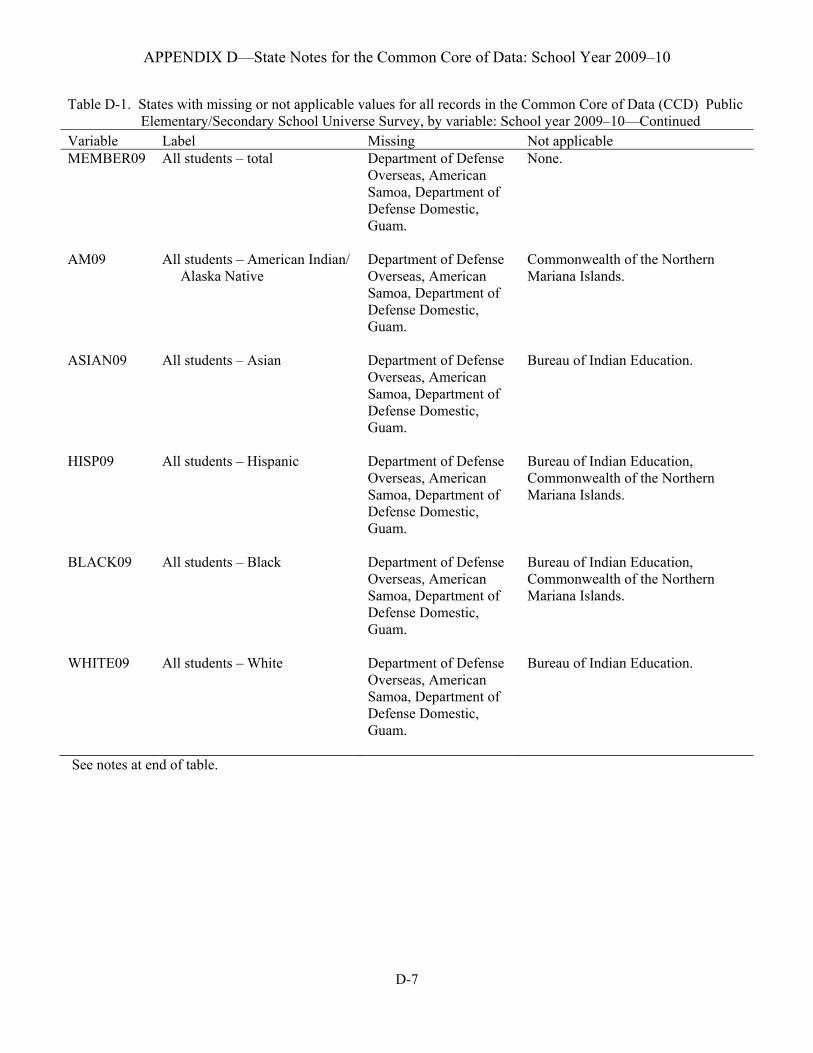
APPENDIX D—State Notes for the Common Core of Data: School Year 2009–10
Table D-1. States with missing or not applicable values for all records in the Common Core of Data (CCD) Public Elementary/Secondary School Universe Survey, by variable: School year 2009–10—Continued Variable Label Missing Not applicable MEMBER09 All students – total Department of Defense
Overseas, American Samoa, Department of Defense Domestic, Guam.
None.
AM09 All students – American Indian/ Alaska Native
Department of Defense Overseas, American Samoa, Department of Defense Domestic, Guam.
Commonwealth of the Northern Mariana Islands.
ASIAN09 All students – Asian Department of Defense Overseas, American Samoa, Department of Defense Domestic, Guam.
Bureau of Indian Education.
HISP09 All students – Hispanic Department of Defense Overseas, American Samoa, Department of Defense Domestic, Guam.
Bureau of Indian Education, Commonwealth of the Northern Mariana Islands.
BLACK09 All students – Black Department of Defense Overseas, American Samoa, Department of Defense Domestic, Guam.
Bureau of Indian Education, Commonwealth of the Northern Mariana Islands.
WHITE09 All students – White Department of Defense Overseas, American Samoa, Department of Defense Domestic, Guam.
Bureau of Indian Education.
See notes at end of table.
D-7
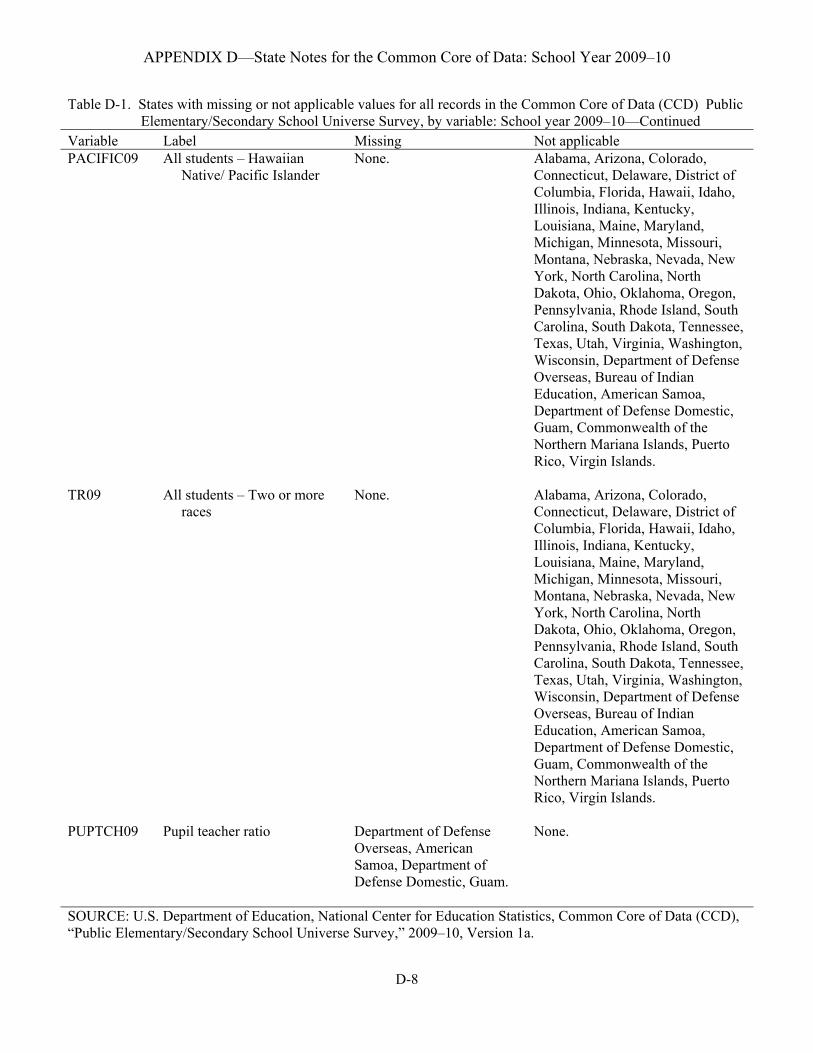
APPENDIX D—State Notes for the Common Core of Data: School Year 2009–10
Table D-1. States with missing or not applicable values for all records in the Common Core of Data (CCD) Public Elementary/Secondary School Universe Survey, by variable: School year 2009–10—Continued Variable Label Missing Not applicable PACIFIC09 All students – Hawaiian
Native/ Pacific Islander None. Alabama, Arizona, Colorado,
Connecticut, Delaware, District of Columbia, Florida, Hawaii, Idaho, Illinois, Indiana, Kentucky, Louisiana, Maine, Maryland, Michigan, Minnesota, Missouri, Montana, Nebraska, Nevada, New York, North Carolina, North Dakota, Ohio, Oklahoma, Oregon, Pennsylvania, Rhode Island, South Carolina, South Dakota, Tennessee, Texas, Utah, Virginia, Washington, Wisconsin, Department of Defense Overseas, Bureau of Indian Education, American Samoa, Department of Defense Domestic, Guam, Commonwealth of the Northern Mariana Islands, Puerto Rico, Virgin Islands.
TR09 All students – Two or more races
None. Alabama, Arizona, Colorado, Connecticut, Delaware, District of Columbia, Florida, Hawaii, Idaho, Illinois, Indiana, Kentucky, Louisiana, Maine, Maryland, Michigan, Minnesota, Missouri, Montana, Nebraska, Nevada, New York, North Carolina, North Dakota, Ohio, Oklahoma, Oregon, Pennsylvania, Rhode Island, South Carolina, South Dakota, Tennessee, Texas, Utah, Virginia, Washington, Wisconsin, Department of Defense Overseas, Bureau of Indian Education, American Samoa, Department of Defense Domestic, Guam, Commonwealth of the Northern Mariana Islands, Puerto Rico, Virgin Islands.
PUPTCH09 Pupil teacher ratio Department of Defense Overseas, American Samoa, Department of Defense Domestic, Guam.
None.
SOURCE: U.S. Department of Education, National Center for Education Statistics, Common Core of Data (CCD), “Public Elementary/Secondary School Universe Survey,” 2009–10, Version 1a.
D-8
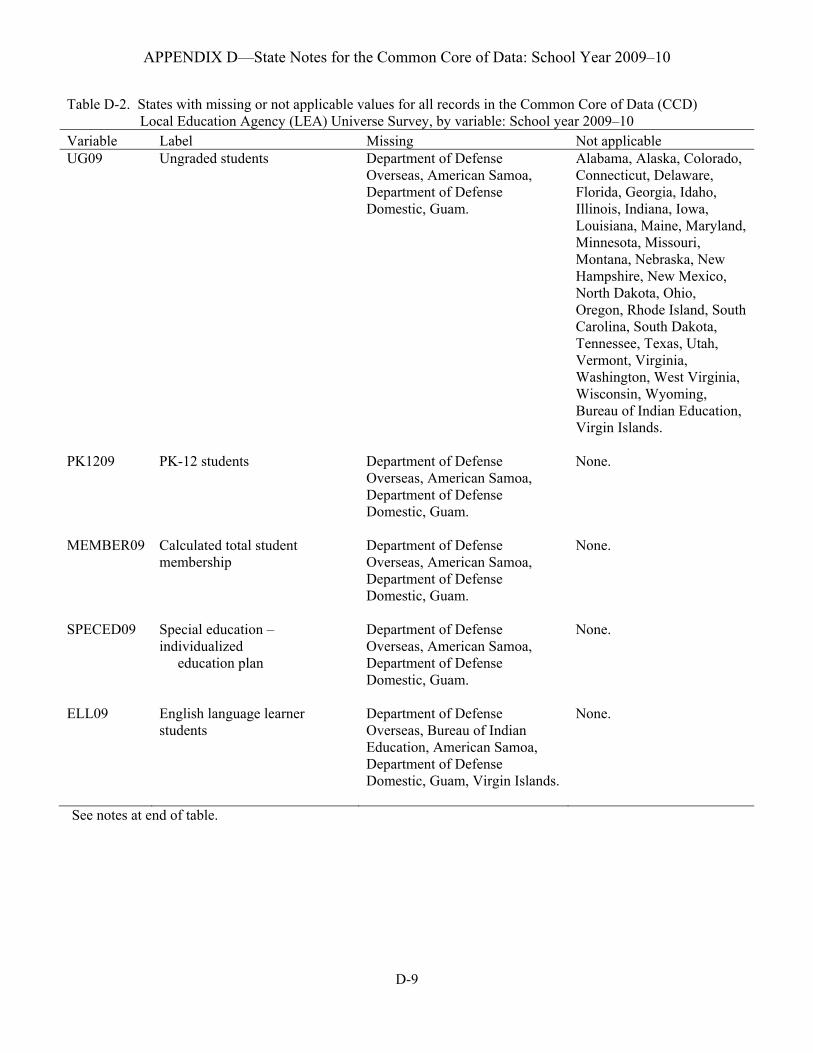
APPENDIX D—State Notes for the Common Core of Data: School Year 2009–10
Table D-2. States with missing or not applicable values for all records in the Common Core of Data (CCD) Local Education Agency (LEA) Universe Survey, by variable: School year 2009–10 Variable Label Missing Not applicable UG09 Ungraded students Department of Defense
Overseas, American Samoa, Department of Defense Domestic, Guam.
Alabama, Alaska, Colorado, Connecticut, Delaware, Florida, Georgia, Idaho, Illinois, Indiana, Iowa, Louisiana, Maine, Maryland, Minnesota, Missouri, Montana, Nebraska, New Hampshire, New Mexico, North Dakota, Ohio, Oregon, Rhode Island, South Carolina, South Dakota, Tennessee, Texas, Utah, Vermont, Virginia, Washington, West Virginia, Wisconsin, Wyoming, Bureau of Indian Education, Virgin Islands.
PK1209 PK-12 students Department of Defense Overseas, American Samoa, Department of Defense Domestic, Guam.
None.
MEMBER09 Calculated total student membership
Department of Defense Overseas, American Samoa, Department of Defense Domestic, Guam.
None.
SPECED09 Special education – individualized education plan
Department of Defense Overseas, American Samoa, Department of Defense Domestic, Guam.
None.
ELL09 English language learner students
Department of Defense Overseas, Bureau of Indian Education, American Samoa, Department of Defense Domestic, Guam, Virgin Islands.
None.
See notes at end of table.
D-9
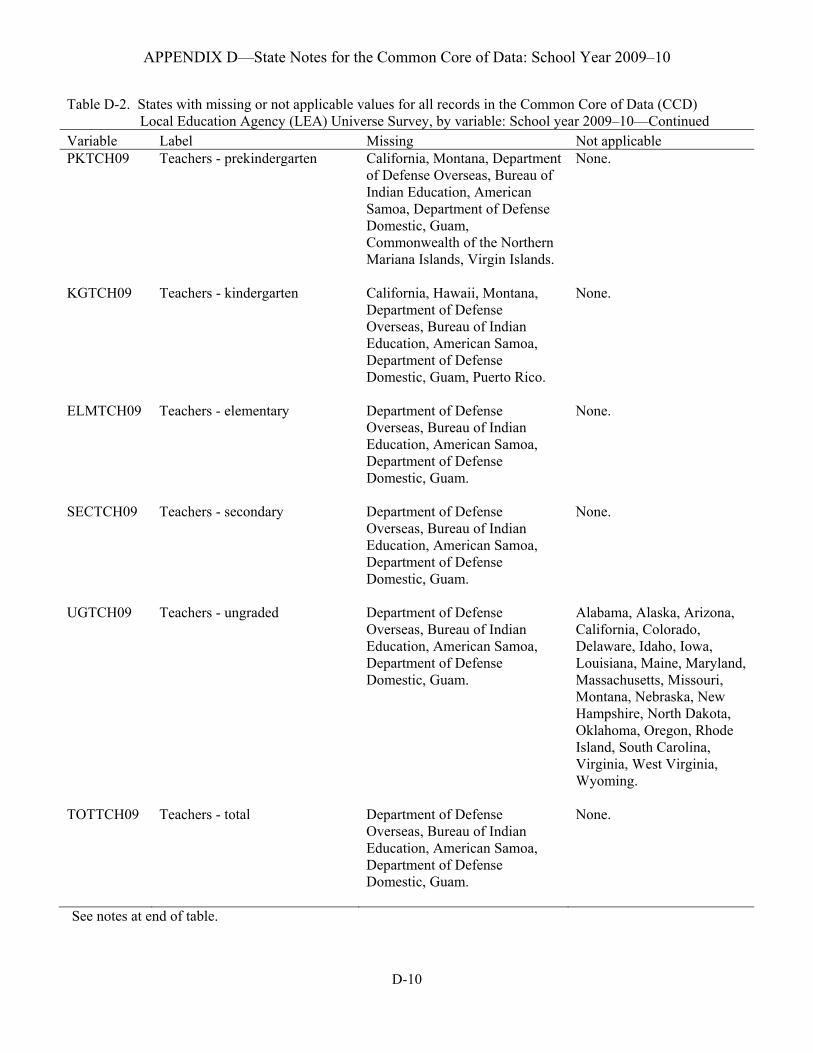
APPENDIX D—State Notes for the Common Core of Data: School Year 2009–10
Table D-2. States with missing or not applicable values for all records in the Common Core of Data (CCD) Local Education Agency (LEA) Universe Survey, by variable: School year 2009–10—ContinuedVariable Label Missing Not applicable PKTCH09 Teachers - prekindergarten California, Montana, Department
of Defense Overseas, Bureau of Indian Education, American Samoa, Department of Defense Domestic, Guam, Commonwealth of the Northern Mariana Islands, Virgin Islands.
None.
KGTCH09 Teachers - kindergarten California, Hawaii, Montana, Department of Defense Overseas, Bureau of Indian Education, American Samoa, Department of Defense Domestic, Guam, Puerto Rico.
None.
ELMTCH09 Teachers - elementary Department of Defense Overseas, Bureau of Indian Education, American Samoa, Department of Defense Domestic, Guam.
None.
SECTCH09 Teachers - secondary Department of Defense Overseas, Bureau of Indian Education, American Samoa, Department of Defense Domestic, Guam.
None.
UGTCH09 Teachers - ungraded Department of Defense Overseas, Bureau of Indian Education, American Samoa, Department of Defense Domestic, Guam.
Alabama, Alaska, Arizona, California, Colorado, Delaware, Idaho, Iowa, Louisiana, Maine, Maryland, Massachusetts, Missouri, Montana, Nebraska, New Hampshire, North Dakota, Oklahoma, Oregon, Rhode Island, South Carolina, Virginia, West Virginia, Wyoming.
TOTTCH09 Teachers - total Department of Defense Overseas, Bureau of Indian Education, American Samoa, Department of Defense Domestic, Guam.
None.
See notes at end of table.
D-10
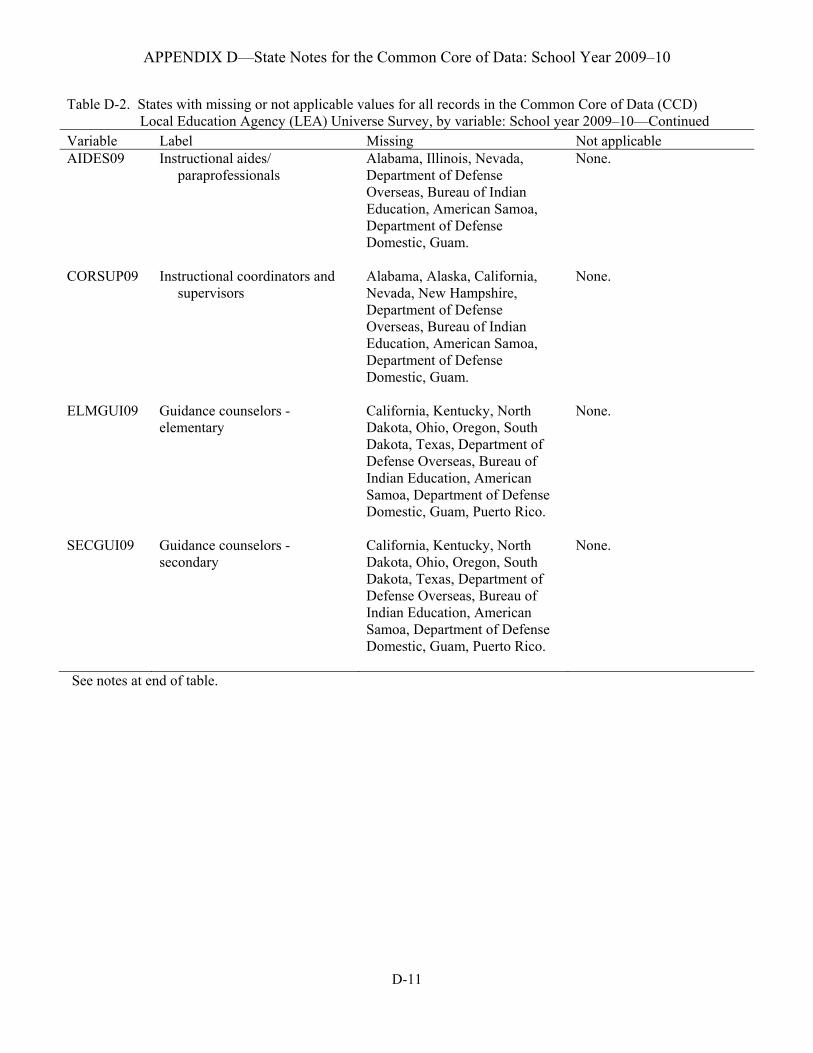
APPENDIX D—State Notes for the Common Core of Data: School Year 2009–10
Table D-2. States with missing or not applicable values for all records in the Common Core of Data (CCD) Local Education Agency (LEA) Universe Survey, by variable: School year 2009–10—ContinuedVariable Label Missing Not applicable AIDES09 Instructional aides/
paraprofessionals Alabama, Illinois, Nevada, Department of Defense Overseas, Bureau of Indian Education, American Samoa, Department of Defense Domestic, Guam.
None.
CORSUP09 Instructional coordinators and supervisors
Alabama, Alaska, California, Nevada, New Hampshire, Department of Defense Overseas, Bureau of Indian Education, American Samoa, Department of Defense Domestic, Guam.
None.
ELMGUI09 Guidance counselors - elementary
California, Kentucky, North Dakota, Ohio, Oregon, South Dakota, Texas, Department of Defense Overseas, Bureau of Indian Education, American Samoa, Department of Defense Domestic, Guam, Puerto Rico.
None.
SECGUI09 Guidance counselors - secondary
California, Kentucky, North Dakota, Ohio, Oregon, South Dakota, Texas, Department of Defense Overseas, Bureau of Indian Education, American Samoa, Department of Defense Domestic, Guam, Puerto Rico.
None.
See notes at end of table.
D-11
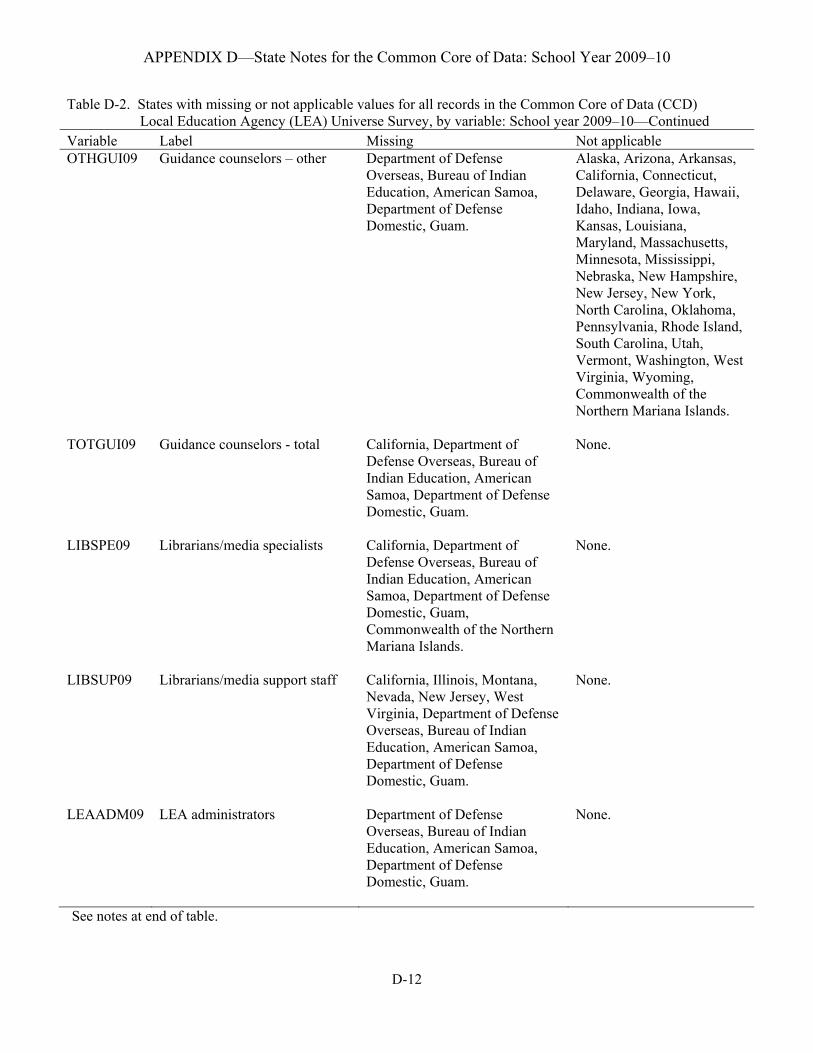
APPENDIX D—State Notes for the Common Core of Data: School Year 2009–10
Table D-2. States with missing or not applicable values for all records in the Common Core of Data (CCD) Local Education Agency (LEA) Universe Survey, by variable: School year 2009–10—ContinuedVariable Label Missing Not applicable OTHGUI09 Guidance counselors – other
Department of Defense Overseas, Bureau of Indian Education, American Samoa, Department of Defense Domestic, Guam.
Alaska, Arizona, Arkansas, California, Connecticut, Delaware, Georgia, Hawaii, Idaho, Indiana, Iowa, Kansas, Louisiana, Maryland, Massachusetts, Minnesota, Mississippi, Nebraska, New Hampshire, New Jersey, New York, North Carolina, Oklahoma, Pennsylvania, Rhode Island, South Carolina, Utah, Vermont, Washington, West Virginia, Wyoming, Commonwealth of the Northern Mariana Islands.
TOTGUI09 Guidance counselors - total California, Department of Defense Overseas, Bureau of Indian Education, American Samoa, Department of Defense Domestic, Guam.
None.
LIBSPE09 Librarians/media specialists California, Department of Defense Overseas, Bureau of Indian Education, American Samoa, Department of Defense Domestic, Guam, Commonwealth of the Northern Mariana Islands.
None.
LIBSUP09 Librarians/media support staff
California, Illinois, Montana, Nevada, New Jersey, West Virginia, Department of Defense Overseas, Bureau of Indian Education, American Samoa, Department of Defense Domestic, Guam.
None.
LEAADM09 LEA administrators Department of Defense Overseas, Bureau of Indian Education, American Samoa, Department of Defense Domestic, Guam.
None.
See notes at end of table.
D-12
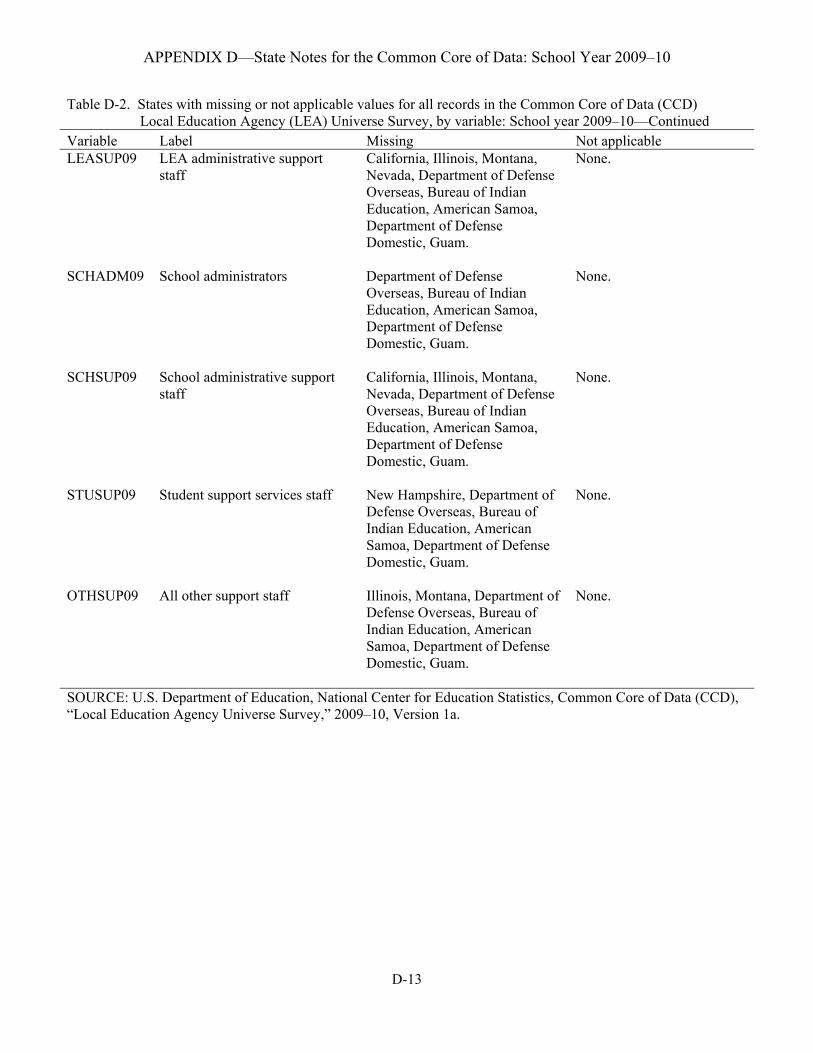
APPENDIX D—State Notes for the Common Core of Data: School Year 2009–10
Table D-2. States with missing or not applicable values for all records in the Common Core of Data (CCD) Local Education Agency (LEA) Universe Survey, by variable: School year 2009–10—ContinuedVariable Label Missing Not applicable LEASUP09 LEA administrative support
staff California, Illinois, Montana, Nevada, Department of Defense Overseas, Bureau of Indian Education, American Samoa, Department of Defense Domestic, Guam.
None.
SCHADM09 School administrators Department of Defense Overseas, Bureau of Indian Education, American Samoa, Department of Defense Domestic, Guam.
None.
SCHSUP09 School administrative support staff
California, Illinois, Montana, Nevada, Department of Defense Overseas, Bureau of Indian Education, American Samoa, Department of Defense Domestic, Guam.
None.
STUSUP09 Student support services staff New Hampshire, Department of Defense Overseas, Bureau of Indian Education, American Samoa, Department of Defense Domestic, Guam.
None.
OTHSUP09 All other support staff Illinois, Montana, Department of Defense Overseas, Bureau of Indian Education, American Samoa, Department of Defense Domestic, Guam.
None.
SOURCE: U.S. Department of Education, National Center for Education Statistics, Common Core of Data (CCD), “Local Education Agency Universe Survey,” 2009–10, Version 1a.
D-13
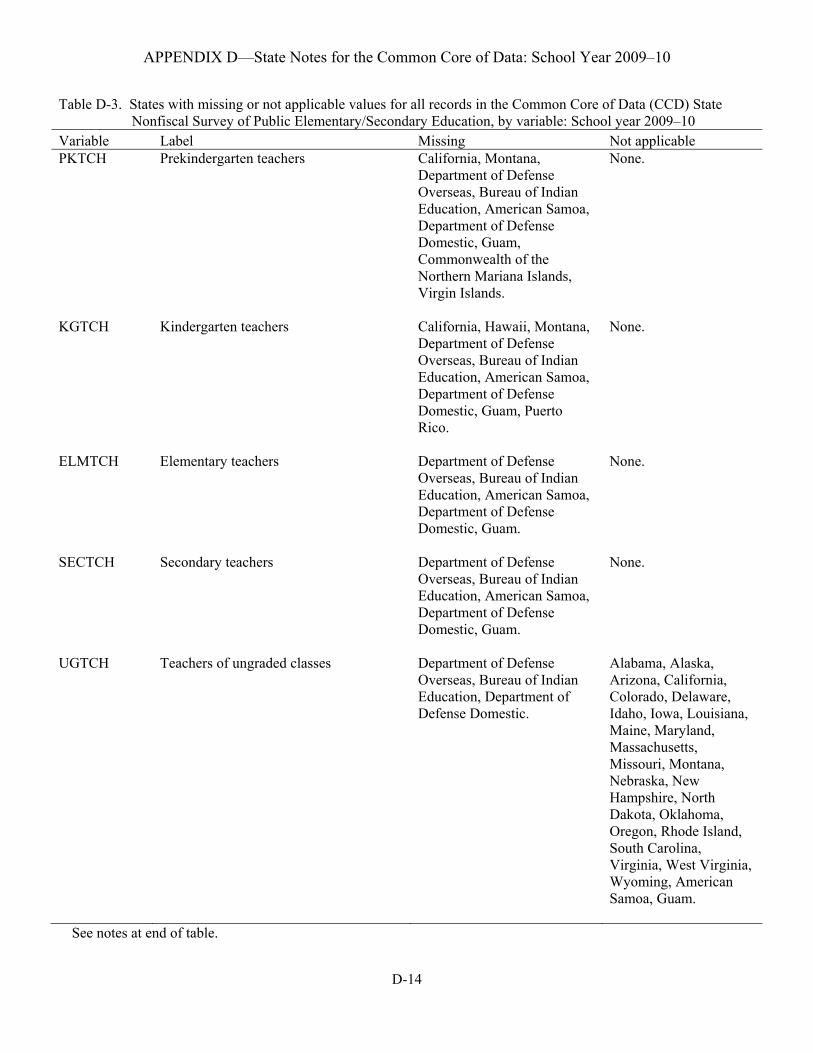
APPENDIX D—State Notes for the Common Core of Data: School Year 2009–10
Table D-3. States with missing or not applicable values for all records in the Common Core of Data (CCD) State Nonfiscal Survey of Public Elementary/Secondary Education, by variable: School year 2009–10 Variable Label Missing Not applicable PKTCH Prekindergarten teachers California, Montana,
Department of Defense Overseas, Bureau of Indian Education, American Samoa, Department of Defense Domestic, Guam, Commonwealth of the Northern Mariana Islands, Virgin Islands.
None.
KGTCH Kindergarten teachers California, Hawaii, Montana, Department of Defense Overseas, Bureau of Indian Education, American Samoa, Department of Defense Domestic, Guam, Puerto Rico.
None.
ELMTCH Elementary teachers Department of Defense Overseas, Bureau of Indian Education, American Samoa, Department of Defense Domestic, Guam.
None.
SECTCH Secondary teachers Department of Defense Overseas, Bureau of Indian Education, American Samoa, Department of Defense Domestic, Guam.
None.
UGTCH Teachers of ungraded classes Department of Defense Overseas, Bureau of Indian Education, Department of Defense Domestic.
Alabama, Alaska, Arizona, California, Colorado, Delaware, Idaho, Iowa, Louisiana, Maine, Maryland, Massachusetts, Missouri, Montana, Nebraska, New Hampshire, North Dakota, Oklahoma, Oregon, Rhode Island, South Carolina, Virginia, West Virginia, Wyoming, American Samoa, Guam.
See notes at end of table.
D-14
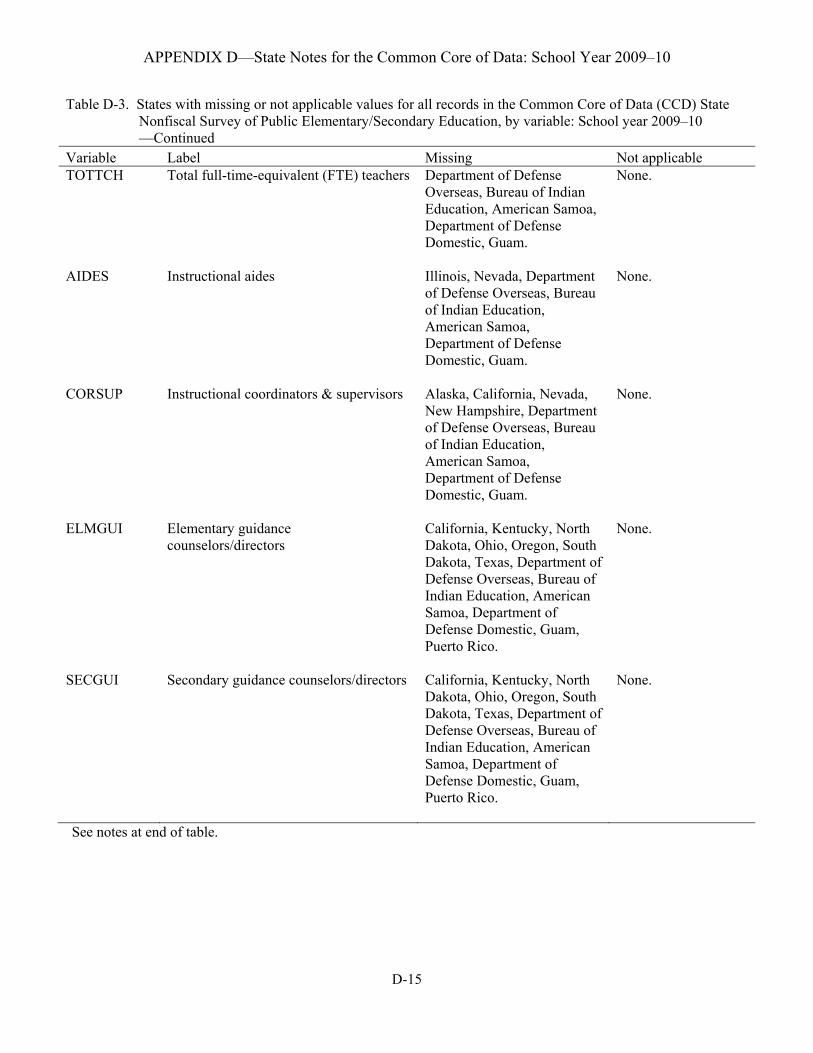
APPENDIX D—State Notes for the Common Core of Data: School Year 2009–10
Table D-3. States with missing or not applicable values for all records in the Common Core of Data (CCD) State Nonfiscal Survey of Public Elementary/Secondary Education, by variable: School year 2009–10 —Continued Variable Label Missing Not applicable TOTTCH Total full-time-equivalent (FTE) teachers Department of Defense
Overseas, Bureau of Indian Education, American Samoa, Department of Defense Domestic, Guam.
None.
AIDES Instructional aides Illinois, Nevada, Department of Defense Overseas, Bureau of Indian Education, American Samoa, Department of Defense Domestic, Guam.
None.
CORSUP Instructional coordinators & supervisors Alaska, California, Nevada, New Hampshire, Department of Defense Overseas, Bureau of Indian Education, American Samoa, Department of Defense Domestic, Guam.
None.
ELMGUI Elementary guidance counselors/directors
California, Kentucky, North Dakota, Ohio, Oregon, South Dakota, Texas, Department of Defense Overseas, Bureau of Indian Education, American Samoa, Department of Defense Domestic, Guam, Puerto Rico.
None.
SECGUI Secondary guidance counselors/directors California, Kentucky, North Dakota, Ohio, Oregon, South Dakota, Texas, Department of Defense Overseas, Bureau of Indian Education, American Samoa, Department of Defense Domestic, Guam, Puerto Rico.
None.
See notes at end of table.
D-15
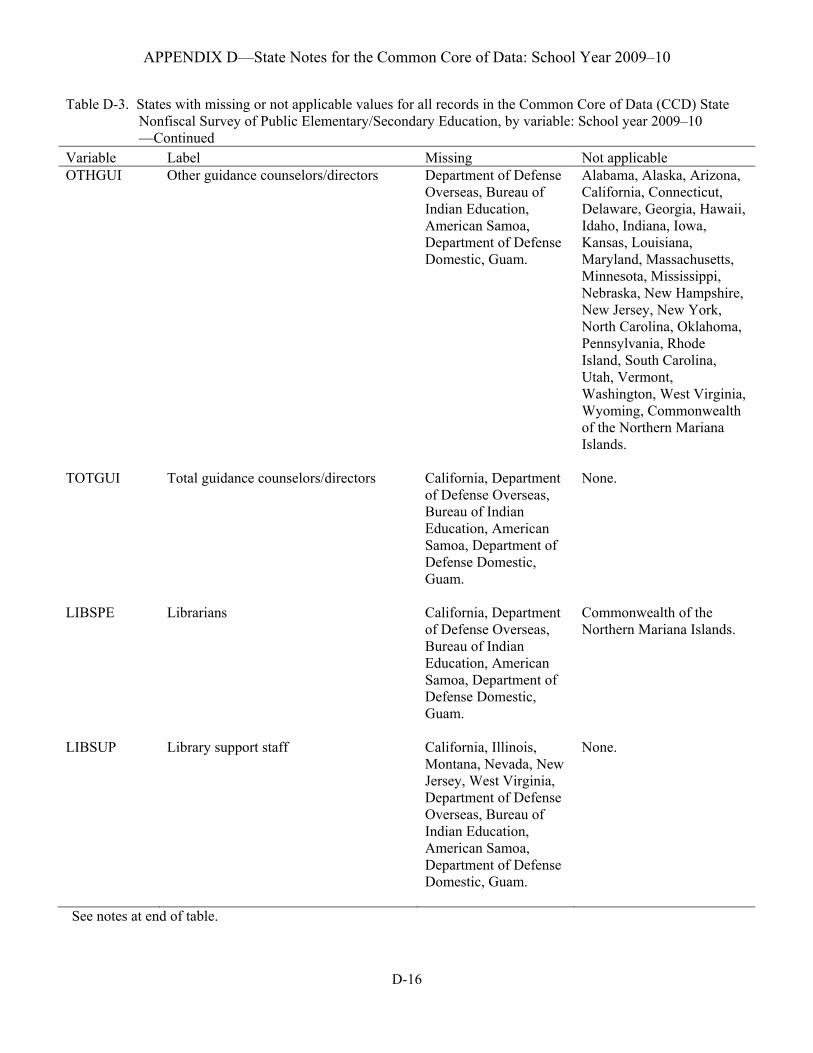
APPENDIX D—State Notes for the Common Core of Data: School Year 2009–10
Table D-3. States with missing or not applicable values for all records in the Common Core of Data (CCD) State Nonfiscal Survey of Public Elementary/Secondary Education, by variable: School year 2009–10 —Continued Variable Label Missing Not applicable OTHGUI Other guidance counselors/directors Department of Defense
Overseas, Bureau of Indian Education, American Samoa, Department of Defense Domestic, Guam.
Alabama, Alaska, Arizona, California, Connecticut, Delaware, Georgia, Hawaii, Idaho, Indiana, Iowa, Kansas, Louisiana, Maryland, Massachusetts, Minnesota, Mississippi, Nebraska, New Hampshire, New Jersey, New York, North Carolina, Oklahoma, Pennsylvania, Rhode Island, South Carolina, Utah, Vermont, Washington, West Virginia, Wyoming, Commonwealth of the Northern Mariana Islands.
TOTGUI Total guidance counselors/directors California, Department of Defense Overseas, Bureau of Indian Education, American Samoa, Department of Defense Domestic, Guam.
None.
LIBSPE Librarians California, Department of Defense Overseas, Bureau of Indian Education, American Samoa, Department of Defense Domestic, Guam.
Commonwealth of the Northern Mariana Islands.
LIBSUP Library support staff California, Illinois, Montana, Nevada, New Jersey, West Virginia, Department of Defense Overseas, Bureau of Indian Education, American Samoa, Department of Defense Domestic, Guam.
None.
See notes at end of table.
D-16
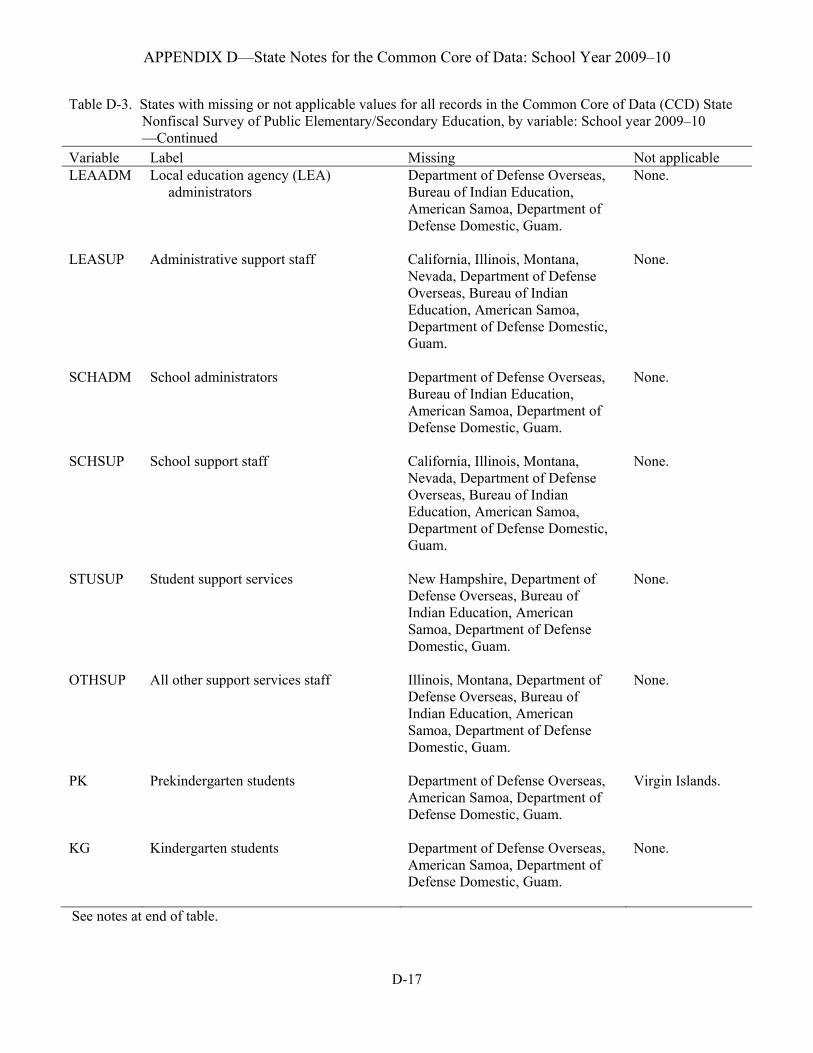
APPENDIX D—State Notes for the Common Core of Data: School Year 2009–10
Table D-3. States with missing or not applicable values for all records in the Common Core of Data (CCD) State Nonfiscal Survey of Public Elementary/Secondary Education, by variable: School year 2009–10 —Continued Variable Label Missing Not applicable LEAADM Local education agency (LEA)
administrators Department of Defense Overseas, Bureau of Indian Education, American Samoa, Department of Defense Domestic, Guam.
None.
LEASUP Administrative support staff California, Illinois, Montana, Nevada, Department of Defense Overseas, Bureau of Indian Education, American Samoa, Department of Defense Domestic, Guam.
None.
SCHADM School administrators Department of Defense Overseas, Bureau of Indian Education, American Samoa, Department of Defense Domestic, Guam.
None.
SCHSUP School support staff California, Illinois, Montana, Nevada, Department of Defense Overseas, Bureau of Indian Education, American Samoa, Department of Defense Domestic, Guam.
None.
STUSUP Student support services New Hampshire, Department of Defense Overseas, Bureau of Indian Education, American Samoa, Department of Defense Domestic, Guam.
None.
OTHSUP All other support services staff Illinois, Montana, Department of Defense Overseas, Bureau of Indian Education, American Samoa, Department of Defense Domestic, Guam.
None.
PK Prekindergarten students Department of Defense Overseas, American Samoa, Department of Defense Domestic, Guam.
Virgin Islands.
KG Kindergarten students Department of Defense Overseas, American Samoa, Department of Defense Domestic, Guam.
None.
See notes at end of table.
D-17
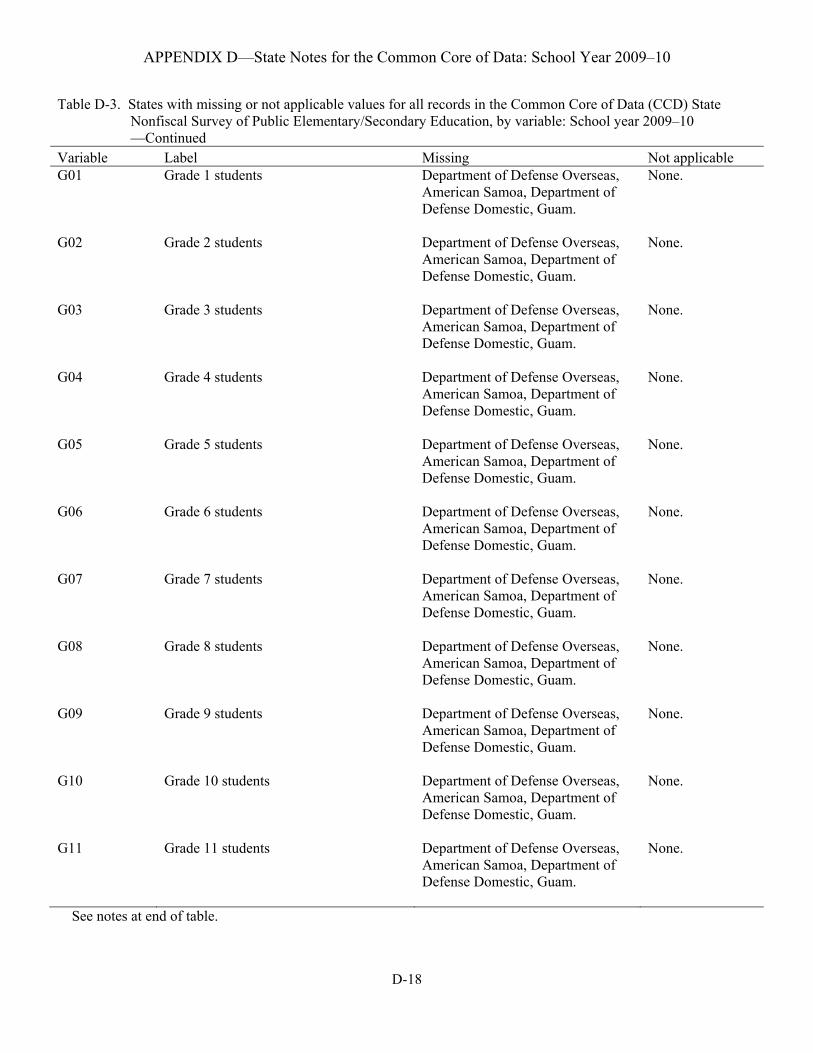
APPENDIX D—State Notes for the Common Core of Data: School Year 2009–10
Table D-3. States with missing or not applicable values for all records in the Common Core of Data (CCD) State Nonfiscal Survey of Public Elementary/Secondary Education, by variable: School year 2009–10 —Continued Variable Label Missing Not applicable G01 Grade 1 students Department of Defense Overseas,
American Samoa, Department of Defense Domestic, Guam.
None.
G02 Grade 2 students Department of Defense Overseas, American Samoa, Department of Defense Domestic, Guam.
None.
G03 Grade 3 students Department of Defense Overseas, American Samoa, Department of Defense Domestic, Guam.
None.
G04 Grade 4 students Department of Defense Overseas, American Samoa, Department of Defense Domestic, Guam.
None.
G05 Grade 5 students Department of Defense Overseas, American Samoa, Department of Defense Domestic, Guam.
None.
G06 Grade 6 students Department of Defense Overseas, American Samoa, Department of Defense Domestic, Guam.
None.
G07 Grade 7 students Department of Defense Overseas, American Samoa, Department of Defense Domestic, Guam.
None.
G08 Grade 8 students Department of Defense Overseas, American Samoa, Department of Defense Domestic, Guam.
None.
G09 Grade 9 students Department of Defense Overseas, American Samoa, Department of Defense Domestic, Guam.
None.
G10 Grade 10 students Department of Defense Overseas, American Samoa, Department of Defense Domestic, Guam.
None.
G11 Grade 11 students Department of Defense Overseas, American Samoa, Department of Defense Domestic, Guam.
None.
See notes at end of table.
D-18
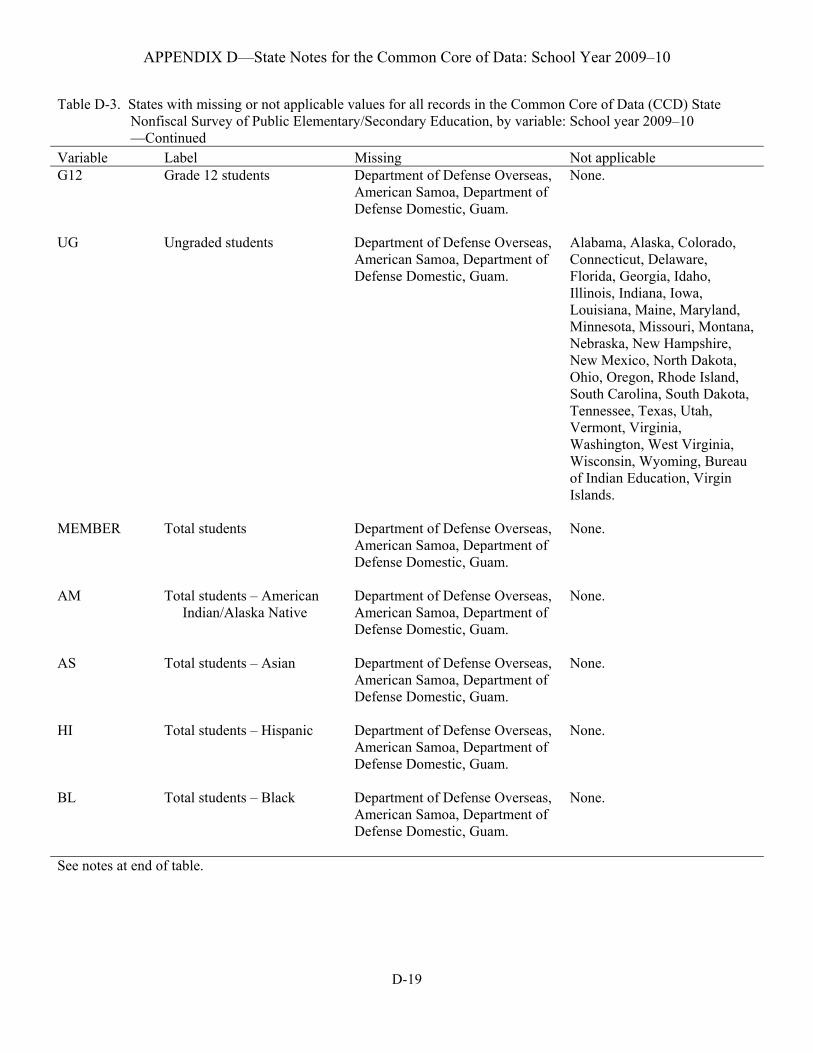
APPENDIX D—State Notes for the Common Core of Data: School Year 2009–10
Table D-3. States with missing or not applicable values for all records in the Common Core of Data (CCD) State Nonfiscal Survey of Public Elementary/Secondary Education, by variable: School year 2009–10 —Continued Variable Label Missing Not applicable G12 Grade 12 students Department of Defense Overseas,
American Samoa, Department of Defense Domestic, Guam.
None.
UG Ungraded students Department of Defense Overseas, American Samoa, Department of Defense Domestic, Guam.
Alabama, Alaska, Colorado, Connecticut, Delaware, Florida, Georgia, Idaho, Illinois, Indiana, Iowa, Louisiana, Maine, Maryland, Minnesota, Missouri, Montana, Nebraska, New Hampshire, New Mexico, North Dakota, Ohio, Oregon, Rhode Island, South Carolina, South Dakota, Tennessee, Texas, Utah, Vermont, Virginia, Washington, West Virginia, Wisconsin, Wyoming, Bureau of Indian Education, Virgin Islands.
MEMBER Total students Department of Defense Overseas, American Samoa, Department of Defense Domestic, Guam.
None.
AM Total students – American Indian/Alaska Native
Department of Defense Overseas, American Samoa, Department of Defense Domestic, Guam.
None.
AS Total students – Asian Department of Defense Overseas, American Samoa, Department of Defense Domestic, Guam.
None.
HI Total students – Hispanic Department of Defense Overseas, American Samoa, Department of Defense Domestic, Guam.
None.
BL Total students – Black Department of Defense Overseas, American Samoa, Department of Defense Domestic, Guam.
None.
See notes at end of table.
D-19
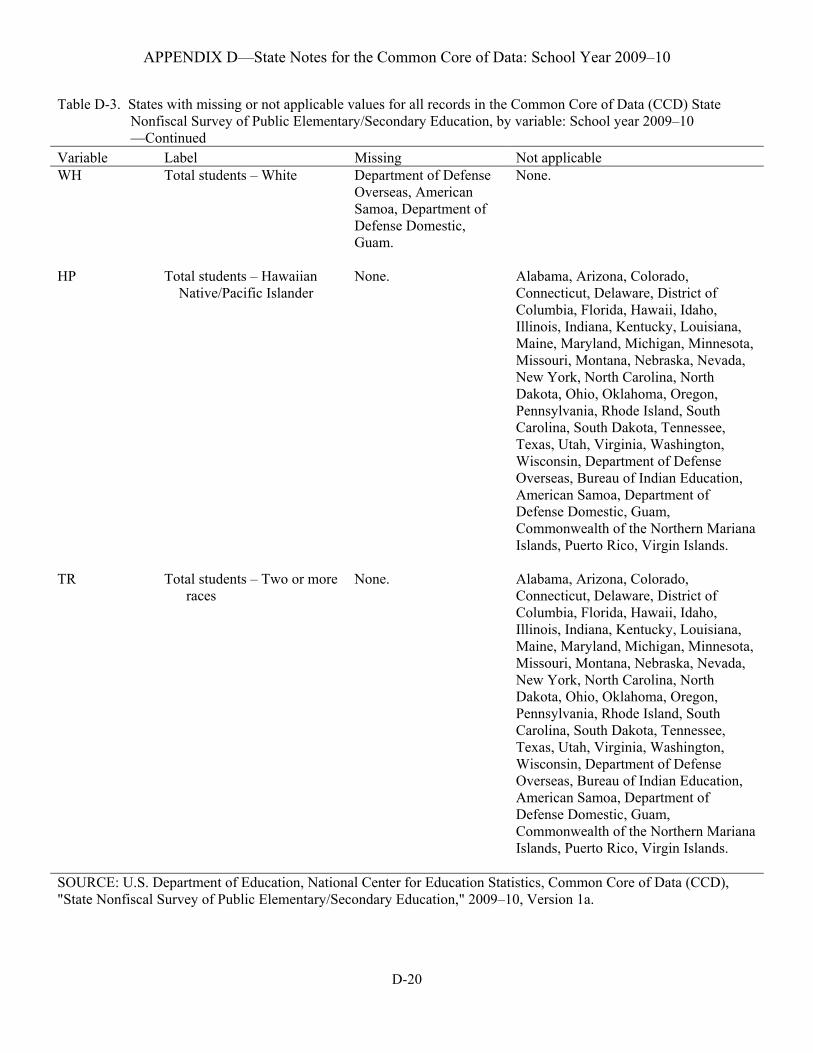
APPENDIX D—State Notes for the Common Core of Data: School Year 2009–10
Table D-3. States with missing or not applicable values for all records in the Common Core of Data (CCD) State Nonfiscal Survey of Public Elementary/Secondary Education, by variable: School year 2009–10 —Continued Variable Label Missing Not applicable WH Total students – White Department of Defense
Overseas, American Samoa, Department of Defense Domestic, Guam.
None.
HP Total students – Hawaiian Native/Pacific Islander
None. Alabama, Arizona, Colorado, Connecticut, Delaware, District of Columbia, Florida, Hawaii, Idaho, Illinois, Indiana, Kentucky, Louisiana, Maine, Maryland, Michigan, Minnesota, Missouri, Montana, Nebraska, Nevada, New York, North Carolina, North Dakota, Ohio, Oklahoma, Oregon, Pennsylvania, Rhode Island, South Carolina, South Dakota, Tennessee, Texas, Utah, Virginia, Washington, Wisconsin, Department of Defense Overseas, Bureau of Indian Education, American Samoa, Department of Defense Domestic, Guam, Commonwealth of the Northern Mariana Islands, Puerto Rico, Virgin Islands.
TR Total students – Two or more races
None. Alabama, Arizona, Colorado, Connecticut, Delaware, District of Columbia, Florida, Hawaii, Idaho, Illinois, Indiana, Kentucky, Louisiana, Maine, Maryland, Michigan, Minnesota, Missouri, Montana, Nebraska, Nevada, New York, North Carolina, North Dakota, Ohio, Oklahoma, Oregon, Pennsylvania, Rhode Island, South Carolina, South Dakota, Tennessee, Texas, Utah, Virginia, Washington, Wisconsin, Department of Defense Overseas, Bureau of Indian Education, American Samoa, Department of Defense Domestic, Guam, Commonwealth of the Northern Mariana Islands, Puerto Rico, Virgin Islands.
SOURCE: U.S. Department of Education, National Center for Education Statistics, Common Core of Data (CCD), "State Nonfiscal Survey of Public Elementary/Secondary Education," 2009–10, Version 1a.
D-20
APPENDIX D—State Notes for the Common Core of Data: School Year 2009–10
The following text provides information on known anomalies and comments for data users for individual states. Alabama None. Alaska None. Arizona Arizona only includes the preschool students who are fundable through the state in their counts of prekindergarten (PK) students. Arkansas None. California There are 35 schools and 2 local education agencies (LEAs) with a value of “M” (Missing) for ULOCAL09, CDCCODE09, CONAME09, CONUM09 because the state reported those schools and LEAs after the CCD files had undergone geocode processing. Colorado State reported special education student counts at the administrative units that are responsible for federal Individuals with Disabilities Education Act (IDEA) funds. Connecticut None. Delaware None. District of Columbia None. Florida None.
Georgia None. Hawaii None. Idaho There are four schools with a value of “M” (Missing) for ULOCAL09, CDCCODE09, CONAME09, CONUM09 because state reported changes in directory information for those schools after the CCD files had undergone geocode processing.
D-21
APPENDIX D—State Notes for the Common Core of Data: School Year 2009–10
Illinois There is one school with a value of “M” (Missing) for ULOCAL09, CDCCODE09, CONAME09, CONUM09 because state reported changes in directory information for that school after the CCD files had undergone geocode processing. Illinois has a substantial decrease in the number of instructional coordinators from the prior year. The state explained that some school-level staff could have been inadvertently report in the prior year and districts have cut back on these district-level instructional coordinator/supervisor position due to lack of funding. Indiana None. Iowa None.
Kansas Kansas re-mapped some of the staff data in their data system and this resulted in data fluctuations in the counts of instructional coordinators, student/other support staff, and administrative support staff compared to the prior year. Kentucky The reporting of PK students is not mandatory in Kentucky. Because of this, there are fluctuations in the state’s count of PK students from year to year. Louisiana None. Maine None.
Maryland None.
Massachusetts None. Michigan There are 37 schools with a value of “M” (Missing) for ULOCAL09, CDCCODE09, CONAME09, CONUM09 because state reported changes in directory information for those schools after the CCD files had undergone geocode processing. Minnesota None. Mississippi None. Missouri None.
D-22
APPENDIX D—State Notes for the Common Core of Data: School Year 2009–10
Montana None. Nebraska None.
Nevada None. New Hampshire None. New Jersey None. New Mexico None. New York New York City Public Schools—The New York City Public Schools agency has been assigned a supervisory union number and its component sub-districts are identified as components of the supervisory union. The supervisory union component number can be used in aggregating data to a single observation for the New York City Public Schools district.
D-23
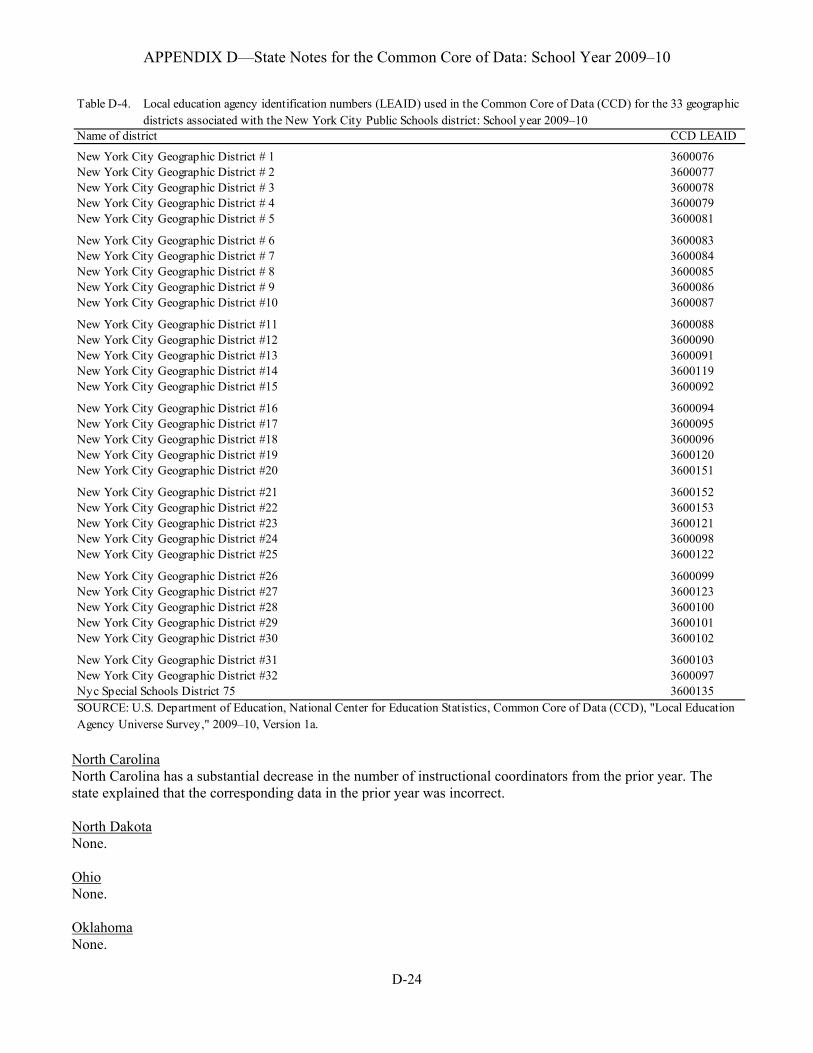
APPENDIX D—State Notes for the Common Core of Data: School Year 2009–10
Table D-4.—Local education agency identification numbers (LEAID) used in the Common Core of Data (CCD) for the 33 geographic Table D-4.—districts associated with the New York City Public Schools district: School year 2009–10Name of district CCD LEAID
New York City Geographic District # 1New York City Geographic District # 2New York City Geographic District # 3New York City Geographic District # 4New York City Geographic District # 5
New York City Geographic District # 6New York City Geographic District # 7New York City Geographic District # 8New York City Geographic District # 9New York City Geographic District #10
New York City Geographic District #11New York City Geographic District #12New York City Geographic District #13New York City Geographic District #14New York City Geographic District #15
New York City Geographic District #16New York City Geographic District #17New York City Geographic District #18New York City Geographic District #19New York City Geographic District #20
New York City Geographic District #21New York City Geographic District #22New York City Geographic District #23New York City Geographic District #24New York City Geographic District #25
New York City Geographic District #26New York City Geographic District #27New York City Geographic District #28New York City Geographic District #29New York City Geographic District #30
New York City Geographic District #31New York City Geographic District #32Nyc Special Schools District 75
36000763600077360007836000793600081
36000833600084360008536000863600087
36000883600090360009136001193600092
36000943600095360009636001203600151
36001523600153360012136000983600122
36000993600123360010036001013600102
360010336000973600135
SOURCE: U.S. Department of Education, National Center for Education Statistics, Common Core of Data (CCD), "Local Education Agency Universe Survey," 2009–10, Version 1a.
North Carolina North Carolina has a substantial decrease in the number of instructional coordinators from the prior year. The state explained that the corresponding data in the prior year was incorrect. North Dakota None. Ohio None.
Oklahoma None.
D-24
APPENDIX D—State Notes for the Common Core of Data: School Year 2009–10
Oregon The total student membership on the school level file is 5.2 percent less than the total student membership on the state level file. The discrepancy is due to the missing data in prekindergarten count on the school level file. Pennsylvania There are 5 schools with a value of “M” (Missing) for ULOCAL09, CDCCODE09, CONAME09, CONUM09 because state reported changes in directory information for those schools after the CCD files had undergone geocode processing. Rhode Island None. South Carolina None. South Dakota None. Tennessee None.
Texas None. Utah None. Vermont State reported four private schools/LEAs in prior year data files and those schools/LEAs were removed from 2009–10 data files. The removal resulted in a decrease in student membership from 90,106 (school year 2008–09) to 86,137 (school year 2009–10). The total student membership on the school level file is 7.3 percent less than the total student membership on the LEA and state level files. The discrepancies are due to 1) state reported a student membership in the school the student attends, but reported a student’s membership in the LEA that is financially responsible for the student, and 2) some supervisory unions ran prekindergarten programs so students were reported in the supervisory unions that only appear on the LEA file. Virginia None. Washington None. West Virginia None.
Wisconsin None.
D-25
APPENDIX D—State Notes for the Common Core of Data: School Year 2009–10
D-26
Wyoming None. Bureau of Indian Education (BIE) None. Department of Defense Dependents (overseas) Schools Department of Defense Dependents (overseas) Schools did not submit data for the 2009–10 school year. Department of Defense Dependents (domestic) Schools Department of Defense Dependents (domestic) Schools did not submit data for the 2009–10 school year. American Samoa American Samoa did not submit data for the 2009–10 school year. Guam Guam did not submit data for the 2009–10 school year. Commonwealth of the Northern Mariana Islands None.
Puerto Rico None. U.S. Virgin Islands None.