Embed Size (px)
Citation preview

Documento de Trabajo - 2016/03
Like Mother, Like Father?
Gender Assortative Transmission Of Child Overweight*
Joan Costa-Font**
Department of Social Policy, London School of Economics and Political Science, London, UK
Mireia Jofre-Bonet
Department of Economics, City University London, UK
* Este trabajo ha sido realizado en el marco de la Cátedra CaixaBank de investigación
sobre “Economía de la Salud y Hábitos de Vida”. Las opiniones y análisis que en él
aparecen son responsabilidad de los autores y no coinciden necesariamente con los de
CaixaBank.
** Contact: Joan Costa-Font, London School of Economics, Houghton Street WC2A 2AE. E-
mail: [email protected]
fedea

1
Like Mother, Like Father?
Gender Assortative Transmission
Of Child Overweight
Joan Costa-Fonta and Mireia Jofre-Bonetb
a Department of Health Policy, London School of Economics and Political Science, London,
UK
b Department of Economics; City, University of London, UK.
Contact: Joan Costa-Font, London School of Economics, Houghton Street WC2A 2AE. E-mail: [email protected]

2
Abstract
We study the association between parental overweight and that of their offspring
and explore whether parental influence on their children is gender assortative
(e.g., maternal effect is more important for daughters). We take advantage of a
unique dataset, the Health Survey for England, containing records of clinically
measured weight and height of a representative sample of English children and
their parents for the period 1996-2009. Our findings are consistent with the
existence of strong intergenerational transmission of overweight and obesity
from parents to their offspring. The effects are stronger among white children
and older parents. However, we only find evidence of gender assortative
transmission under some restrictive conditions, namely, we find an increased
likelihood of overweight among girls when the mother is obese, and especially
when girls are either at school or teenage age.
Keywords: Gender Assortative Parental Transmission, Child Obesity, Child
Overweight, Role Models, Inter-generational Transmission.

3
1. Introduction
The share of overweight children is a growing health and socio-economic concern with
far reaching consequences. Estimates from the International Association for the Study of
Obesity (EASO) indicate that the rates of overweight (including obesity) children aged 5-
17 years in the United Kingdom (UK) are among the highest in Europe. Figure 1
displays an increase in child overweight in England, one of the world countries where
child obesity has risen at a faster pace, though we find that the trend tails off around
2005. In addition, Figure 1 shows a higher obesity rate increase between children 11-15
than those of younger though overall trends are comparable.
[Insert Figure 1 about here]
Provided that genetics are unlikely to have changed dramatically over the past thirty
years (see Herrera et al, 2011 for a review), changes in overweight are likely the result of
environmental changes that are still not well understood. Given that children do not make
autonomous health and food related choices, one of the most pressing hypotheses
underpinning the obesity epidemic lies in the existence of shifts in the intergeneration
transmission of overweight. That is, if the correlation between parents and children’s
overweight has changed over time, then it is likely that child specific family environment
is responsible for such a change (Anderson et al, 2007). Children’s caloric intake, dietary
habits and level of physical activity are associated with that of their parents’ social norms
and culture (Anderson and Butcher, 2006). By the time children are three or four years of
age, their eating patterns are already sensitive to environmental cues about food intake
(Nicklas et al, 2001) and role modelling (Richtie et al, 2005). However, we still have
limited knowledge about how the child specific family environment is transmitted. One
of the main hypothesis is whether transmission is assortative by gender.

4
The main purpose of this paper is to empirically establish the existence of an
intergenerational transmission of overweight. We specifically examine the presence of
differential maternal and paternal overweight influence across different children’s age
groups and especially, the presence of some gender assortative transmission. Our main
focus in on natural children, and similarly as other studies (Classen and Hokayem 2005,
Classen, 2010 and Costa-Font and Gil, 2013), we examine the presence of
intergenerational transmission, but for a longer period of time, we can distinguish the
specific effects of both parents alongside differential effects across the child’s age. Other
studies drawing on smaller samples of adopted children find evidence of cultural
transmission (Costa-Font et al, 2015), but mainly due to sample size restrictions, cannot
evaluate age specific effects. Other studies focusing on biological relatives do not find
evidence of a strong shared environmental effect, but focus on BMI and do not
distinguish the effect of overweight and obesity Cawley and Meyerhoefer, 2012).
We find evidence of gender assortative transmission of both parents overweight among
girls, driven primarily by girls in their teens, and some evidence of child age specific
gender assortative transmission. We in turn examine a number of mechanisms
underlying the associations which can explain the presence of different effects across the
child’s age such as the child being a single child, the age of the mother or the ethnicity.
The remainder of the paper is as follows: next section provides the background literature.
Section three reports the data and empirical strategy. Section four provides the results
and section five contains our conclusion and discussion.

5
2. Intergenerational and gender associative transmission
A literature spanning several decades provides some evidence that indicates that the
probability of an adolescent to be obese increases when one of the parents becomes
obese, and the effect is strengthened when both parents are obese (Coate, 1983; Currie et
al, 2007; Hebebrand et al., 2000, Martin 2008; Anderson et al., 2007; Classen and
Hokayem (2005). Intergenerational correlations estimate typically range between 0.15
and 0.38 (Ahlburg, 1998, Classen 2010). However, the mechanisms are still largely
ignored, and the datasets are limited either by the way they measure overweight (self-
reported vs clinically measured), the sample size and time span as well as the information
available for both parents.
Central to our explanation is the role modelling effects parents exert (the ‘like begets
likes’) which could be driven by effects on eating behaviours (e.g., size portions, time of
sugar intakes, regularity of fat intake etc) and fitness behaviour. However, both parents
play a potentially different ‘gender roles’, which paves the way to some form of ‘gender
assortative’ transmission. Consistently, some work points to a stronger maternal effect
(Pareo et al, 2013). However, part of that effect might be driven the presence of
assortative mating. That is, individuals with similar genotypes and/or phenotypes (e.g.,
body size, cognitive abilities, age, education etc) being more likely to mate (Silventonen
et al, 2003)1. Similarly, nutrition responsibility is still predominately a female dominated
domain, with a considerably higher proportion of women responsible for food shopping
and preparation compared with men (Caraher et al, 1999, Lake et al, 2006). Thus, if
parents exhibit similar characteristics and their food is determined by maternal choice, it
might be challenging to distinguish maternal and paternal effects. One strategy to
1 For instance, studies have reported correlations in spousal BMI values ranging from 0.10 to 0.15 (Allison et al., 1996).
6
identify some of such effects is to examine how such effect vary across parental and
children age (cohort) groups.
In identifying the sources of intergenerational transmission is important to identify
household heterogeneity, including children’s attitudes towards food (Nicklas et al,
2001). There is some evidence of a significant parent-child association on fruit and
vegetable intake (Bere et al, 2004). However, even when parents do not impose strict
behavioural rules, children, consciously or unconsciously observe and model their
behaviour after their parents, especially about fitness and food consumption which are
largely gender specific (Pérez-Pastor et al, 2015).
There is limited consensus on the existence of a gender assortative transmission of
intergenerational transmission. A study using Danish data the intergenerational
transmission of overweight remains quite stable in terms of mother to child, whereas the
father to child BMI correlation increased (Ajslev et al, 2014, Ajslev et al, 2015). In
contrast, a study using Finish data for children born at the onset of the obesity epidemic,
revealed that paternal and maternal effects were stronger for daughters than for sons
(Jääskeläinen et al, 2011). Similarly, Whitaker et al, (2010) finds that mother–child’s
weight association is higher than father-child’s one (Whitaker et al, 2010). However,
other recent research suggests there is an increasing correlation of father and children’s
obesity and a reduction of the maternal link (Ajslev et al, 2014). Nonetheless, such
evidence usually is based on small periods of time and, unlike our study, does not
distinguish gender specific transmission effects and does not include as many relevant
socio-economic controls.
In addition to direct parental transmission, confounding factors such as poverty, low
income or female employment may play a role in the parents-children correlation of

7
overweight (Classen, 2010, Costa-Font and Gil, 2013, Cavaco et al 2014), even when
including only adopted children (Hruschka and Brewis, 2013). However, the effects may
not be necessarily linear. Baum II and Ruhm (2007) find that an additional year of
maternal education reduces obesity by an average of 0.2 kg/m2. Apouey and Geoffard
(2016) find evidence that the effect of education follows an inverted U-shape across
childhood, with a widening effect up until age 8, and narrowing afterwards. Finally,
maternal employment may decrease maternal time available for overseeing children’s
activities, which generally results in increased sedentary activities as opposed to
activities that have the positive effect of spending calories. Indeed, Anderson et al.
(2003) suggest that there is a causal linkage of maternal employment on child’s weight,
especially for mothers working long hours although they did not focus on the
intergenerational transmission of obesity and overweight. An exception is Costa-Font
and Gil (2013) who find that after accounting for the intergenerational transmission of
mother’s labour market participation only explains obesity among boys but not among
girls. Similarly, some evidence suggests that socially disadvantaged people have less
access and ability to choose healthy behaviours (Wickrama et al, 1999).
3. Data and Methods
3.1 Data
We exploit the Health Survey for England (HSE). This cross-sectional survey started in
1991 and has been carried out annually since then. The HSE is a representative survey
that contains detailed health and health-related behaviours, including weight and height,
Body Mass Index (BMI) alongside a long list of variables such as fruit and vegetable
consumption, alcohol intake and smoking in adults and children living in private
households in England. The measurements of height and weight in the HSE are
validated by a nurse, overcoming the problem of measurement error of these values
present in other surveys containing children (Cawley et al 2015). The survey also

8
contains the socio-economic status of the household and core information on all its
members, including their relationship. Our pooled cross-section panel dataset results
from merging information contained the thirteen waves that span from 1997 to 2009.
The HSE contains records from adults aged 16 and over, since 1995 has also includes
children aged 2-15, and since 2002 infants under 2 have been included. The information
on children younger than 13 years is reported by their parents. During an interview with
each person in the household, a nurse clinically measures the height and weight of survey
participants alongside other variables.
[Insert Table 1 about here]
Table 1 reports the descriptive statistics if the variables that we employ in the study. Our
two dependent variables are described in the top panel, namely the prevalence of obesity
and overweight of children. We divide the children in three groups: pre-school, primary
schooled children and teenagers. The prevalence of obesity and overweight increases
from pre-school to school-aged children. Parental overweight and obesity also increases
from when children are pre-schoolers to when they are teenagers, possibly partly due to
the aging process of the parents but also possibly partially reflecting the so-called obesity
epidemic. Our data contains also information on parental health, full time education of
both father and mother. Other control variables are age, gender, two measures of health
long standing illness, passive smoking, and ethnicity. Based on the literature review, we
include maternal and paternal education, alongside income, flat ownership, the rural
nature of the neighbourhood and family size. In one of our specifications we also use
whether the child is a single child in order to test if that plays a role in the transmission.
3.2 Empirical Strategy
Our empirical strategy is based on a linearized health production function in which the
latent overweight of a child is explained by non-genetic factors (age of the parents, their

9
education and employment statuses, household’s income, type of dwelling, and, being
exposed to passive smoke); the child’s own characteristics (age, gender, ethnic group);
and, mutually exclusive indicator variables that take value 1 if both parents are
overweight (obese); if only the mother is overweight (obese); or if only the father is
overweight (obese). Assuming linearity, our main equation of interest is as follows:
𝑜!"∗ = 𝛿! + 𝛿!𝑜!"! + 𝛿!𝑜!"! + 𝛿!𝑜!"! + 𝜃𝑋!" + 𝛽𝑍! + 𝑣!" , (1)
where 𝑜!"∗ indicates the latent overweight (obese) of child i in household j; 𝑜!"! is an
indicator variable for both parents of child i in household j being overweight (obese); 𝑜!"!
takes value one if only the mother of child i in household j is overweight (obese); 𝑜!"!
takes value one if only the father of child i in household j is overweight (obese); Xij a
vector of the child’s characteristics including gender; Zj is a vector with the parents’
characteristics and and vij is the error term. Assuming normality of the error term, 𝑣!" , the
probability of observing that a child i in our sample is overweight or obese (𝑜!" = 1) is
the probability that the corresponding latent variable is positive. Therefore, in this
framework, coefficients 𝛿! , 𝛿! , and 𝛿! will be estimates of the association between both
parents, only the mother or only the father being overweight (obese) with the likelihood a
child being overweight (obese).
Unlike previous literature which did not focus on gender assortative transmission, we
aim to examine if the degree of transmission changes with children’s age and gender.
Thus, we estimate a number models that measure the magnitude and significance of the
correlation between father and mother’s overweight (obesity) and that of their children
by age group and gender using a full set of interactions. We also test whether there are
significant differences between the associations obtained by age groups, by gender, and
by age and gender combinations. We include time trends both linear, quadratic and cubic
10
but as the type of trend did not exert a major difference in the results, we report those
obtained using a quadratic trend.
In the next section, we describe our benchmark results, followed by a number of
extensions and robustness checks including testing if the mother being over 30, the child
being a single child or ethnicity affect our benchmark findings.
4. Results
Our results are reported in Tables 2 to 6. In each we present estimates for three
different parent-children combinations. The first panel of each table presents the results
for the association between parents and child being overweight; the second panel relates
parents’ obesity and child’s overweight; finally, the third panel presents the association
of parents and children’s obesity. Tables 2 and 5 contain three different specifications for
each parents-child overweight (obesity). The first specification does not include controls,
only the overweight (obesity) of the parents and a control for the child’s gender; the
second one incorporates whether the child is in school or is a teenager; and the third one
adds a full set of controls such as household size; the child having a long illness; being
exposed to passive smoking; the child’s ethnicity; whether the mother works full time;
whether the parents are natural parents; whether the mother has mental health or health
problems; whether the father has mental health or health problems; the parents’
education; if the household lives in a rural dwelling; if they own their home; and, the
logarithm of the household income. As the dependent variable in all these models is
discrete, taking values equal to 1 (when the child is overweight/obese) and to 0
(otherwise), we estimate our models using probit specifications with robust standard
errors and clustered by household (as we have several children in some of the
households).
Baseline results

11
Table 2 presents the coefficients when both girls and boys are included in the sample
and gender (girl) is included as a control. Table 3 presents the t-tests statistics and
corresponding p-values of a battery of tests of equality of the coefficients presented in
Table 2.
[Insert Table 2 about here]
Results in Table 2 are consistent with the existence of a strong transmission of
overweight and obesity when both parents are overweight or obese, the association is
positive and significant for both boys (main effect) and even larger for girls (interaction).
The second column of each panel, which does not decompose the effect by age-
gender groups, shows that the likelihood of a pre-school boy (the omitted category) to be
overweight is 19.8pp larger when both parents are overweight and 26.7pp when both
parent are obese.
If only one parent is overweight there is also an increase in the chances that a pre-
school boy of is overweight (6.6pp because of the mother only, 7.1pp because of the
father) or obese (12.9pp for mothers, 9.6pp for fathers). When the child is a girl her
likelihood of being overweight is 6.6pp higher when both parents are overweight and
9.3pp higher when they are both obese; if only her mother is overweight (obese) the
likelihood of the girl being overweight is increased by 5.7pp (by 5.9pp). This is
consistent with previous evidence from Britain suggesting that girls exercise less and
spend more time at home compared to boys of equivalent age.
Independently of the parental overweight, if the boy is in school age instead of a pre-
schooler, his likelihood of being overweight is increased by 4.5pp and of being obese by
4.5pp. If the boy is a teen instead, the likelihood increases are 3.9pp and 4.2pp,
respectively.
12
The results in the second column of the third panel indicates that having obese
parents increases the likelihood of having an obese pre-school boy (11.8pp), and even
more, if she happens to be a girl (adding 5.6pp). Having an obese mother alone increases
the likelihood of the pre-school boy being obese (by 4.7pp) but this does not change
statistically significantly if the offspring is a girl instead. Similarly, if only the father is
obese, the likelihood of the pre-school boy being obese increases (by 3.3pp) but again
being a girl does not have an additional statistically significant effect. Nevertheless, if
only either the father or the mother are obese, their school-aged or teenager sons have a
smaller chance of being overweight or obese.
Independently of the parents’ overweight, being in school age instead of a pre-
schooler increases the chances of the boy being obese by 0.9pp but being a teenager does
not affect the likelihood of obesity significantly.
When we examine the specific effect of transmission by age groups in the third
column of each panel in Table 2, we uncover that boys in their teens with both parents
overweight or obese face an increased probability of being overweight (by 10.1pp and
17.0pp, respectively). If only their father is overweight and they are in school instead,
they have an increased probability of being overweight (by 4.4pp) but have lower
chances of being obese than a pre-schooler boy (by 3.4pp). School-age girls with an
overweight or obese mother have an increased likelihood of being overweight (by 11.8pp
and 14.3pp, respectively) or obese (7.2pp). If the girl is in their teens and her mother is
obese, she has an increased chance of being overweight (by 16.6pp) or obese (by 8.6pp).
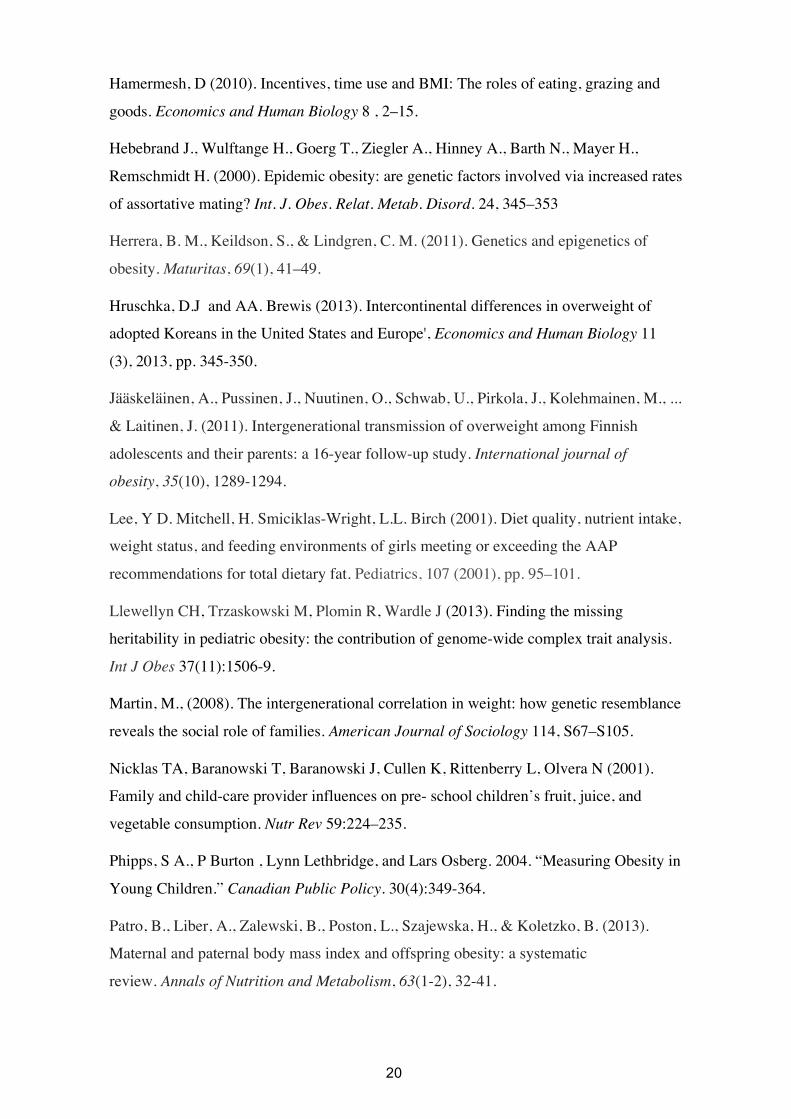
[Insert Table 3 about here]
Tests in Table 3 are useful to establish if the transmission is gender-assortative by
answering the questions listed in the first column of Table 3. Each question is associated
to a null hypothesis on equality of coefficients. The questions are: “Is the association of

13
the father being overweight (obese) with the overweight (obesity) of his son different
than with that of the daughter?”; “Is the association of the mother being overweight
(obese) with the overweight (obesity) of his son different than with that of the
daughter?”; “Is the association of both parents being overweight (obese) with the
overweight (obesity) of his son different than with that of the daughter?”; “Is the father’s
overweight (obesity) association with the overweight (obesity) of their male (female)
offspring statistically different than that of the mother’s?”; “Is the association of both
parents being overweight (obese) with that of their male (female) offspring differ by
child’s age?”; “‘Is the association of the father being overweight (obese) with that of
their male (female) offspring differ by child’s age?”; and, finally, “Is the association of
the mother being overweight (obese) with that of their male (female) offspring differ by
child’s age?”.
When we estimate all ages pooled together (results corresponding to first column of
each panel in Table 3), boys seem to be affected differently than girls by both parents or
one of them alone being obese. However, when one parent alone is overweight, the effect
of the father is different than that of the mother for girls.
When we analyse the transmission by age group (results corresponding to the second
column of each panel in Table 3) we observe that maternal obesity influences differently
the likelihood of sons and daughters being obese, especially when they are pre-schoolers.
Father’s obesity is also transmitted differently to boys than to girls when they are in pre-
school, and father’s overweight is transmitted different to boys than to girls when they
are in school.
When both parents are overweight, school-age and teenage girls’ chances of being
overweight or obese are affected differently than that of boys in the same age group.
When both parents are obese, the likelihood of their teenage daughters being obese is
statistically different than that of their sons but this is not the case for children in school-

14
age. These results are important and deviate from previous findings that suggest stronger
maternal obesity transmission mainly affected schoolgirls. Instead, we find a stronger
effect when both parents are obese, especially among teenage children.
When we look if the transmission when both parents are (or just one of them is)
overweight or obese by age group, a more detailed picture appears:
Both parents being overweight affects different school-boys than pre-schooler boys,
and the transmission of overweight is different for school-aged boys than for teenage
boys. For girls, both parents being overweight affects differently each age group except
for pre-school and school-aged girls. When both are obese, the likelihood of daughters
being overweight is different for each age group. The transmission of obesity when both
parents are obese seems to be similar by age groups for both boys and girls.
When the father is overweight, the transmission of overweight to sons is similar for
all ages, i.e. we do not reject the null that the transmission is the same. For girls, we find
the same result. When the father is obese, though, the increased likelihood of being
overweight or obese is different for preschool boys than for school and teen boys. For
girls, the null that the effect by age groups is the same cannot be ruled out.
When the mother is overweight, the increased likelihood of being overweight for
teenage and pre-school boys is different, but not for the rest of pairwise age-group
comparisons. Instead, when the mother is obese, both pre-school boys and pre-school
girl’s chances of being overweight and obese are differently affected than those of
school-aged boys and school aged-girls.
Single child heterogeneity
One potential mechanism underlying the above results could be that there is a single child
in the family. Single children are more likely to attract their parents’ undivided attention
and thus potentially receive more food than they need. Table 4 discards this hypothesis. As
shown in this table, we do not find evidence that being a single child has a statistically

15
significant effect on the intensity of the intergenerational transmission of overweight. The
only exception is when both parents are obese, in which case a single child the probability
of a single child being overweight increases by 8.6pp.
[Insert Table 4 about here]
Parental age effects
Table 5 shows the gender specific association between parents and children overweight
allowing a heterogeneous effect by parental age. In the first panel of Table 5, the measure of
parental age is whether the mother was above the age of 30 when giving birth to the child,
which we interact with both parents, the mother or the father being overweight (obese). We
find that whilst mothers that were above 30 at the time of birth are less likely to have
overweight and obese children, if they are obese, they are more likely to have an overweight
child (by 4.8pp). Mothers over the age of 30 at birth living in a household in which the
father is overweight or obese are more likely to have overweight (by 5.0pp and 8.9pp,
respectively) and obese boys (by 3.1pp) consistent with assortative transmission effects,
although if the offspring is a girl, these likelihoods are reduced.
When we look at the distance in age between the mother and the child, in the second panel
in Table 5, or the distance in age between the father and the child, in the third panel, we
observe that, in general, the age distance has a negative effect on the likelihood of the child
being obese. But, when both parents or just the father are obese, the likelihood of the
offspring being overweight or obese increases with the age distance. This association is
intensified when the offspring is a girl.
[Insert Table 5 about here]

16
Ethnicity effects
Finally, Table 6 contains the estimates of ethnicity specific association between parents’ and
children overweight and obesity. The main finding is that while being white reduces the
chances of a boy being obese, when both parents or only the father are obese, the chances of
their offspring being overweight are increased, the chances of being obese is only affected
by both parents being obese but not the father or the mother alone.
[Insert Table 6 about here]
5. Conclusion
We have intergenerational transmission of overweight, and specifically the hypothesis of
gender assortative transmission of overweight from parents to offspring and whether
such transmission alters by the age group of the child. We use unique data that pools
together thirteen waves of the Health Survey for England to explore the existence of
associations between parental obesity and overweight and those of their children and
investigate different variations that could explain the associations such as being a single
child, having older parents or the ethnicity.
Consistently with previous studies, we document evidence of an intergenerational
transmission of overweight, mainly when both parents are overweight. Our preferred
interpretation is that when both parents are overweight it has a reinforcing effect on their
household members, especially under the presence of assortative mating. That is, the
child ‘obesogenic environment’ is stronger when both parents are obese or overweight,
especially under restrictive role modelling or gender specific effects, as we discuss
below.
Our results are heterogeneous by gender, by age group and by both gender and age
group. We find some restrictive evidence of assortative transmission, namely the effect
of fathers’ overweight and obesity is different than that of mothers for girls (especially by

17
raising their chances of being overweight). When the mother is obese, the transmission of
overweight and obesity to pre-school boys is different than that to girls. The transmission
of overweight if the father is overweight to school-age children varies by gender. If
instead he is obese, gender differences only apply to pre-school children.
Teenagers appear to be more receptive to parental transmission of both parents
overweight but not maternal or paternal specific effects which is consistent with the fact
that, at that age, children are more sensitive to social cues (Fehr et al, 2008) although this
is due also possibly to a cumulative pattern in the transmission of health behaviours from
parents to their children. Other findings suggest some evidence of a specific effect of
dad’s and among boys, and fathers overweight on boys when paternal age exceed 30
years of age. Specifically, mothers over the age of 30 in household with fathers
overweight or obese are more likely to have overweight boys. Finally, transmission of
stronger among white children.
We also obtain interesting results suggestive of a heterogeneous transmission by age
group for boys and girls separately. Mainly, both parents being overweight increases the
chances of their sons being overweight differently by age group. When only one parent is
overweight or obese, the differences by age apply when the father is obese on overweight
sons and when the mother is obese on both boys and girls.
The implications of the study are that policies aimed at reducing children’s obesity
should especially focus on families where both parents are obese or overweight as they
are likely to influence their children up and above the obvious genetic influence. Second,
our findings suggest that the effects are stronger among certain age groups, the latter
might well result from the fact that environmental pressures are both gender and age
specific. That is, parentsl effects affect boys (teenage age) and girls (school age) at
different ages.

18
References
Ahlburg, D., 1998. Intergenerational transmission of health. The American Economic
Review Papers and Proceedings 88 (2), 265–270.
Ajslev TA, Ängquist L, Silventoinen K, Baker JL, Sørensen TIA (2014) Trends in
Parent-Child Correlations of Childhood Body Mass Index during the Development of the
Obesity Epidemic. PLoS ONE 9(10): e109932
Ajslev, T. A., Ängquist, L., Silventoinen, K., Baker, J. L., & Sørensen, T. I. (2015).
Stable intergenerational associations of childhood overweight during the development of
the obesity epidemic. Obesity, 23(6), 1279-1287
Anderson, P, Butcher, K and Levine, P (2003). Maternal Employment and Overweight
Children. Journal of Health Economics, 22(3): 477-504.
Anderson, P., Butcher, K., Schanzenbach, D. (2007). Childhood disadvantage and
obesity: is nature trumping nurture? NBER Working Paper No. 13479.
Anderson, PM and Butcher, KF (2006). Childhood obesity: trends and potential causes.
The Future of Children, 16(1): 19-45.
Amelia A. Lake, Robert M. Hyland, John C. Mathers, Andrew J. Rugg-Gunn, Charlotte
E. Wood, Ashley J. Adamson, (2006) "Food shopping and preparation among the 30-
somethings: whose job is it? (The ASH30 study)", British Food Journal, Vol. 108 Iss: 6,
pp.475 – 486
Apouey, B. H., & Geoffard, P. Y. (2016). Parents’ education and child body weight in
France: The trajectory of the gradient in the early years. Economics & Human
Biology, 20, 70-89.
Baranowsky, T D.K. Rassin, J.A. Harrison, J.C. Henske (1990). Ethnicity, infant-feeding
practices and childhood adiposity. J Dev Behav Pediatr, 11 (1990), pp. 234–239
Bere, E and K.I. Klepp (2004). Correlates of fruit and vegetable intake among
Norwegian schoolchildren: parental and self-reports. Public Health Nutr, 7 (8) (2004),
pp. 991–998.
Cavaco, S., Eriksson, T., & Skalli, A. (2014). Life cycle development of obesity and its
determinants in six European countries. Economics & Human Biology, 14, 62-78.
Cawley, J., Maclean, J. C., Hammer, M., & Wintfeld, N. (2015). Reporting error in
weight and its implications for bias in economic models. Economics & Human

19
Biology, 19, 27-44.
Chia, Yee Fei. (2008). “Maternal labour supply and childhood obesity in Canada:
evidence from the NLSCY” Canadian Journal of Economics, 41(1):217-242.
Classen, T., Hokayem, C., (2005). Childhood influences on youth obesity. Economics
and Human Biology 3(2), 165–187.
Classen, Y (2010). Measures of the intergenerational transmission of body mass index
between mothers and their children in the United States, 1981–2004. Economics and
Human Biology 8 30-43.
Coate, D (1983). The relationship between diet, parent’s fatness and obesity in children
and adolescence. NBER Working Paper, 1072.
Costa-Font, Joan , Jofre-Bonet, M and Legrand, J (2016) Vertical Transmission of
Overweight: Evidence from English Adoptees, working paper.
Costa-Font, Joan and Gil, Joan (2013) Intergenerational and socioeconomic gradients of
child obesity Social Science and Medicine, 93. 29-37.
Cawley, J., & Meyerhoefer, C. (2012). The medical care costs of obesity: an instrumental
variables approach. Journal of health economics, 31(1), 219-230.
Currie J and Moretti E (2007) ‘Biology as Destiny? Short- and Long-Run Determinants
of Intergenerational Transmission of Birth Weight’ Journal of Labour Economics, Vol
25 No. 2, pp 231–264.
Davey Smith G, Steer C, Leary S, Ness A (2007). Is there an intrauterine influence on
obesity? Evidence from parent child associations in the Avon Longitudinal Study of
Parents and Children (ALSPAC). Arch Dis Child 2007;92:876–80.
Emanuel I, Filakti H, Alberman E, Evans SJ.(1992) Intergenerational studies of human
birthweight from the 1958 birth cohort. 1. Evidence for a multigenerational effect. Br J
Obstet Gynaecol 1992;99:67–74.
Fehr, Ernst, Helen Bernhard, and Bettina Rockenbach. "Egalitarianism in young
children." Nature 454, no. 7208 (2008): 1079-1083.
Goode, A., Mavromaras, K. G. and Smith, M. (2008). Intergenerational Transmission of
Healthy Eating Behaviour and The Role of Household Income, IZA Discussion Paper
No. 3535
20
Hamermesh, D (2010). Incentives, time use and BMI: The roles of eating, grazing and
goods. Economics and Human Biology 8 , 2–15.
Hebebrand J., Wulftange H., Goerg T., Ziegler A., Hinney A., Barth N., Mayer H.,
Remschmidt H. (2000). Epidemic obesity: are genetic factors involved via increased rates
of assortative mating? Int. J. Obes. Relat. Metab. Disord. 24, 345–353
Herrera, B. M., Keildson, S., & Lindgren, C. M. (2011). Genetics and epigenetics of
obesity. Maturitas, 69(1), 41–49.
Hruschka, D.J and AA. Brewis (2013). Intercontinental differences in overweight of
adopted Koreans in the United States and Europe', Economics and Human Biology 11
(3), 2013, pp. 345-350.
Jääskeläinen, A., Pussinen, J., Nuutinen, O., Schwab, U., Pirkola, J., Kolehmainen, M., ...
& Laitinen, J. (2011). Intergenerational transmission of overweight among Finnish
adolescents and their parents: a 16-year follow-up study. International journal of
obesity, 35(10), 1289-1294.
Lee, Y D. Mitchell, H. Smiciklas-Wright, L.L. Birch (2001). Diet quality, nutrient intake,
weight status, and feeding environments of girls meeting or exceeding the AAP
recommendations for total dietary fat. Pediatrics, 107 (2001), pp. 95–101.
Llewellyn CH, Trzaskowski M, Plomin R, Wardle J (2013). Finding the missing
heritability in pediatric obesity: the contribution of genome-wide complex trait analysis.
Int J Obes 37(11):1506-9.
Martin, M., (2008). The intergenerational correlation in weight: how genetic resemblance
reveals the social role of families. American Journal of Sociology 114, S67–S105.
Nicklas TA, Baranowski T, Baranowski J, Cullen K, Rittenberry L, Olvera N (2001).
Family and child-care provider influences on pre- school children’s fruit, juice, and
vegetable consumption. Nutr Rev 59:224–235.
Phipps, S A., P Burton , Lynn Lethbridge, and Lars Osberg. 2004. “Measuring Obesity in
Young Children.” Canadian Public Policy. 30(4):349-364.
Patro, B., Liber, A., Zalewski, B., Poston, L., Szajewska, H., & Koletzko, B. (2013).
Maternal and paternal body mass index and offspring obesity: a systematic
review. Annals of Nutrition and Metabolism, 63(1-2), 32-41.

21
Silventoinen K., Kaprio J., Lahelma E., Viken R. J., Rose R. J. (2003). Assortative
mating by body height and BMI: Finnish twins and their spouses. Am. J. Hum. Biol. 15,
620–627.
Sorensen, T, I.A , Price, RA, Stunkard, AJ and Schulsinger, F (1989). Genetics of obesity
in adult adopted and their biological siblings. BMJ, 298, 87-90.
Schulsinger (1986). An adoption study of human obesity, NEJM, 314, 193-8.
Stunkard, AJ J R. Harris, N L. Pedersen, and GE. McClearn(1990). The Body-Mass
Index of Twins Who Have Been Reared Apart. N Engl J Med 1990; 322:1483-1487
Townsend N (2009) Obesity and Overweight Surveillance in England: what is measured
and where are the gaps? Oxford: National Obesity Observatory, 2009
Thomson, O (2014). Genetic mechanisms in the intergenerational transmission of health.
Journal of Health Economics, 35: 132-145.
Wardle J., Carnell S., Haworth C.M.A, Farooqi I.S., O'Rahilly S., and Plomin R. (2008),
“Obesity associated genetic variation in FTO is associated with diminished satiety,”
Journal of Clinical Endocrinology and Metabolism, vol. 93, no. 9, pp. 3640–3643.
Whitaker, R., Wright, J., Pepe, M., Seidel, K., Dietz, W., (1997). Predicting obesity in
young adulthood from childhood and parental obesity. The New England Journal of
Medicine 337 (13), 869–873
WHO (1999). Definition, diagnosis and classification of diabetes mellitus and its
complications: Report of the WHO consultation. Geneva, World Health Organization
(WHO), 1999.
Wickrama, KAS Rand D. Conger, Lora Ebert Wallace, Glen H. Elder, Jr (1999). The
Intergenerational Transmission of Health-Risk Behaviours: Adolescent Lifestyles and
Gender Moderating Effects. Journal of Health and Social Behaviour, 40(3): 258-272.
Wilcox-Gok, V (1983). The Determination of Child Health: An Application of Sibling
and Adoption Data. Review of Economics and Statistics, 65(2): 266-73
Whitaker, K. L., Jarvis, M. J., Beeken, R. J., Boniface, D., & Wardle, J. (2010).
Comparing maternal and paternal intergenerational transmission of obesity risk in a large
population-based sample. The American journal of clinical nutrition, 91(6), 1560-1567.

22
Figures and Tables
Figure 1. Patterns of child obesity in England 1995- 20011 by age group
Source: Public Health England, 2013 http://www.noo.org.uk/NOO_about_obesity/child_obesity/UK_prevalence

23
Pre-School Child Teenager Total
Number of observations (2907) (7423) (4071) (14401)
Overweight Obese (%) 4.9 6.1 5.8 5.8
Overweight (%) 19.3 24.8 24.8 23.7
Age Mean number of years 4.02 9.01 14.46 9.55
Standard Deviation number of
years (0.80) (1.98) (1.10) (3.95)
Gender Girl (%) 50.2 49.3 48.4 49.2
Boy (%) 49.8 50.7 51.6 50.8
Health Long Standing Illness (%) 18.1 19.4 21.5 19.7
Passive Smoking (%) 21.5 25.5 27.9 25.4
Ethnicity White (%) 78.1 79.2 79.4 79
Black (%) 5 4.2 3.6 4.2
Ind/Pak/Bang (%) 4.1 3.9 3.8 3.9
Other (%) 12.8 12.6 13.2 12.8
Parents Mother Obese (%) 18 21.8 24.4 21.8
Dad Obese (%) 20.4 22.9 25.2 23
Mum Overweight (%) 48.5 53 59 53.8
Dad Overweight (%) 68.4 71.7 74.6 71.9
Parents’ Mental Health Mother (%) 2.8 2.6 3 2.8
Dad (%) 1.8 1.7 2.3 1.9
Parents’ Full Time Mother Works Full Time (%) 59 70.8 77.4 70.3
Dad Works Full Time 90.57 90.04 89.04 89.86
Parents’ Education MumEd:NA 9.6 13.2 17.1 13.6
MumEd:Nvq5-HE 33.1 29.6 27.5 29.7
MumEd:A/O Level 48.8 49.4 46.7 48.5
MumEd:CSE 6.5 6 6.3 6.2
MumEd:Foreign 1.9 1.8 2.3 2
Dad˙Ed:NA 12.3 14.5 19.5 15.5
DadEd:Nvq5-HE 42.1 40.1 38.7 40.1
DadEd:A/O Level 38.4 38.7 35.2 37.7
DadEd:CSE 6.1 5.5 5.1 5.5
DadEd:Foreign 1.1 1.2 1.4 1.2
Nuclear Family Family of 3 14.1 8.8 13.6 11.2
Rural Living in Rural Area 19.7 22.1 23 21.9
Dwelling Own the flat 77.9 81 83.1 81
Income Mean 34,906.63£ 36,462.20£ 35,361.18£ 35,836.94£ Standard Deviation (41459.61) (43,203.12) (48,846.61) (41,459.61)
Summary statistics of main variables by children’s age group.
Source: Health Survey for England.
Child Type
Table 1: Summary Statistics for the Full Sample and by Age Group

24
(1) (2) (3) (4) (5) (6) (7) (8) (9)
Parents: Overweight Overweight Overweight Obese Obese Obese Obese Obese Obese
Child: Overweight Overweight Overweight Overweight Overweight Overweight Obese Obese Obese
Both Ob/Ov 0.201*** 0.198*** 0.146*** 0.266*** 0.267*** 0.150*** 0.122*** 0.118*** 0.065**
(0.013) (0.013) (0.026) (0.024) (0.024) (0.050) (0.016) (0.016) (0.032)
Both Ob/Ov - Girl 0.071*** 0.066*** 0.076** 0.098*** 0.093*** 0.220*** 0.051** 0.056** 0.093*
(0.018) (0.019) (0.033) (0.033) (0.034) (0.075) (0.025) (0.026) (0.056)
Only Mum Ob/Ov 0.071*** 0.062*** 0.059* 0.132*** 0.129*** 0.126*** 0.050*** 0.047*** 0.046***
(0.016) (0.016) (0.031) (0.016) (0.016) (0.016) (0.009) (0.009) (0.009)
Mum Ob/Ov - Girl 0.058** 0.057** -0.008 0.064*** 0.059*** -0.066* 0.019 0.020 -0.044**
(0.023) (0.024) (0.041) (0.022) (0.023) (0.038) (0.014) (0.014) (0.020)
Only Dad Ob/Ov 0.070*** 0.071*** 0.038* 0.099*** 0.096*** 0.095*** 0.032*** 0.033*** 0.032***
(0.013) (0.013) (0.023) (0.015) (0.015) (0.015) (0.008) (0.008) (0.008)
Dad Ob/Ov - Girl 0.015 0.014 0.035 0.051** 0.051** 0.016 -0.004 -0.006 -0.014
(0.018) (0.018) (0.028) (0.021) (0.022) (0.037) (0.011) (0.011) (0.019)
Girl 0.011 0.015 0.014 0.029*** 0.031*** 0.030*** 0.013*** 0.015*** 0.015***
(0.013) (0.014) (0.014) (0.008) (0.008) (0.008) (0.004) (0.004) (0.004)
School Child 0.045*** 0.012 0.045*** 0.048*** 0.009* 0.014**
(0.009) (0.017) (0.009) (0.011) (0.005) (0.006)
Teen 0.039*** -0.011 0.042*** 0.049*** 0.001 -0.001
(0.011) (0.020) (0.011) (0.014) (0.006) (0.007)
Both Ob/Ov - School 0.048* 0.093 0.036
(0.029) (0.057) (0.039)
Both Ob/Ov - School Girl 0.006 -0.103 -0.020
(0.034) (0.084) (0.067)
Both Ob/Ov - Teen 0.101*** 0.170*** 0.084*
(0.033) (0.066) (0.044)
Both Ob/Ov - Teen Girl -0.038 -0.233** -0.084
(0.038) (0.094) (0.070)
Mum Ob/Ov - School -0.015 -0.049*** -0.024***
(0.036) (0.016) (0.009)
Mum Ob/Ov - School Girl 0.118** 0.143*** 0.072***
(0.047) (0.041) (0.023)
Mum Ob/Ov - Teen 0.045 -0.067*** -0.036***
(0.043) (0.022) (0.010)
Mum Ob/Ov - Teen Girl 0.017 0.166*** 0.086***
(0.054) (0.047) (0.027)
Dad Ob/Ov - Teen 0.041 -0.055*** -0.012
(0.030) (0.016) (0.008)
Dad Ob/Ov - Teen Girl -0.013 0.050 0.026
(0.034) (0.046) (0.024)
Dad Ob/Ov - School 0.044* -0.034*** -0.025***
(0.026) (0.012) (0.006)
Dad Ob/Ov - School Girl -0.033 0.042 0.003
(0.029) (0.039) (0.020)
˙cons 0.099*** 0.116 0.150 0.158*** 0.105 0.117 0.027*** -0.015 -0.010
(0.009) (0.098) (0.099) (0.006) (0.097) (0.097) (0.002) (0.059) (0.059)
Observations 14277 13592 13592 14277 13592 13592 13592 13592 13592
Note: Robust Standard Errors in Parentheses
Table 2 General: All OLS Models Obese to Overweight
25
Some
controlsAll controls
Some
controlsAll controls
Some
controls
All
controlsBoth effect: Girls different to
boys?All 0.13 (0.02) 0.17 (0.05) 0.06 (0.0370
pre No No No
sch 0.11 (0.03) 0.12 (0.07) No
teen 0.20 (0.04) 0.33 (0.09) 0.14 (0.07)Dad’s effect: Girls different to
boys?All
0.05
(0.028)No 0.26 (0.02)
pre No 0.079 (0.04) 0.04 (0.02)
sch 0.07 (0.03) No No
teen No No NoMum’s effect: Girls different to
boys?All No 0.06 (0.03) No
pre No 0.19 (0.04) 0.08 (0.02)
sch No No No
teen No No NoDad’s effect different than Mum’s
for boys?all No No No
pre No No No
sch -0.038 (0.02) No No
teen No No NoDad’s effect different than Mum’s
for girls?all
0.34
(0.017)
0.040
(0.022)
0.041
(0.013)pre No
-0.080
(0.11)No
sch 0.069 (0.024)0.085
(0.123)
0.053
(0.019)teen No
0.098
(0.121)NO
Both effect different by age for
boys?pre-sch 0.09 (0.05) No No
pre-teen No No No
teen-sch 0.05 (0.02) No NoBoth effect different by age for
girls?pre-sch No 0.32 (0.15) NO
pre-teen 0.11 (0.06) 0.45 (0.15) NO
teen-sch -0.04 (0.03)-0.013
(0.073)NO
Dad’s effect different by age for
boys?pre-sch No
0.129
(0.019)
0.057
(0.010)pre-teen No 0.149 (0.02)
0.044
(0.011)teen-sch No No NoDad’s effect different by age for
girls?pre-sch No No No
pre-teen No No No
teen-sch No No NoMum’s effect different by age for
boys?pre-sch No 0.17 (0.02)
0.070
(0.013)pre-teen No 0.19 (0.02)
0.081
(0.012)teen-sch 0.06 (0.03) No NoMum’s effect different by age for
girls?pre-sch No -0.20 (0.07)
-0.11
(0.03)pre-teen No -0.23 (0.03)
-0.12
(0.04)teen-sch -0.01 (0.047) No No
Table 3: Test of Equality of Coefficients
Note: This table shows the T-test statistics and corresponding p-values for the statistically significant results of
corresponding tests of equality of coefficients in columns 2 and 3 of each panel in Table 2. Null hypotheses for
each question is yes. We apply lincom in Stata 14.0 to test equality of coefficients. We report NO when the null
of equality (no difference) is rejected. See notes in Table 2.
Overweight Parents to
Overweight Children
Obese Parents to
Overweight Children
Obese Parents to
Obese Children

26

27
(1) (2) (3)
Parents: Overweight Obese Obese
Child: Overweight Overweight Obese
Single Child 0.052 -0.004 0.009
(0.039) (0.038) (0.020)
Girl 0.013 0.036*** 0.016***
(0.014) (0.009) (0.004)
Single Child and Girl 0.000 -0.022 0.010
(0.051) (0.050) (0.029)
Both Ob/Ov 0.201*** 0.264*** 0.114***
(0.014) (0.025) (0.017)
Both Ob/Ov and Girl 0.074*** 0.093*** 0.057**
(0.020) (0.034) (0.026)
Both Ob/Ov and Single Child -0.017 0.086* 0.042
(0.047) (0.046) (0.026)
Both Ob/Ov Single Girl -0.046 -0.004 -0.019
(0.065) (0.063) (0.039)
Only Mum Ob/Ov 0.062*** 0.128*** 0.046***
(0.017) (0.016) (0.009)
Mum ObOv and Girl 0.056** 0.057** 0.017
(0.025) (0.023) (0.014)
Mum Ob/Ov and Single Child -0.002 0.018 -0.036
(0.059) (0.057) (0.025)
Mum Ob/Ov Single Girl 0.027 0.033 0.064
(0.085) (0.082) (0.048)
Only Dad Ob/Ov 0.070*** 0.094*** 0.031***
(0.014) (0.015) (0.008)
Dad Ob/Ov and Girl 0.022 0.053** -0.003
(0.019) (0.022) (0.011)
Dad Ob/Ov and Single Child 0.008 0.056 0.009
(0.048) (0.046) (0.024)
Dad Ob/Ov Single Girl -0.070 -0.069 -0.063*
(0.066) (0.063) (0.033)
Intercept 0.154* 0.150* -0.009
(0.091) (0.090) (0.053)
Observations 13592 13592 13592
Note: Robust Standard Errors in Parentheses
Table 4 All OLS Models Obese to Overweight - Single Child

28


![Our family Sounds and words [Λ]-mother, brother, another [a:]-father, grandfather [ә]- father, mother, brother, sister [ð]- father, mother,](https://img.pdfslide.net/doc/110x75/56649ee95503460f94bfb1ab/our-family-sounds-and-words-mother-brother-another-a-father.jpg)