Embed Size (px)
Citation preview
DOCUMENTS DE TREBALL
DE LA FACULTAT D’ECONOMIA I EMPRESA
Col.lecció d’Economia
E12/270
Intraregional trade in South America, 1913-50. Economic linkages
before institutional agreements
José Peres Cajías, Marc Badia-Miró and Anna Carreras-Marín
Address for correspondence: Departament d’Història i Institucions Econòmiques Facultat d’Economia i Empresa Edifici Principal, Torre 2 - 4a planta Av. Diagonal, 690 - 08034 Barcelona Tel: (+34) 934 021 929 Fax: (+34) 934 024 594 Email: [email protected]
Acknowledgements: We acknowledge support from the Spanish Innovation and Science Ministry (research project ECO2009-13331-C02-02 led by Alfonso Herranz), and project 2009SGR153 (Antoni de Campany Centre of Economy and Economic History). The paper was presented at a conference in CLADHE-II (Mexico), the Encuentro de la AEHE (Madrid), the Fresh Meeting (Madrid), the XI Congreso de la AEHE (Carmona) and the EHES Conference (Dublin). We would like to thank participants for their comments, particularly V. Pinilla, A. Herranz, A. Tena, H. Willebald and C. Yañez.
Abstract: With the exception of the North American Free Trade Agreement (NAFTA), trade integration is still modest in Latin America, at around 20% of total trade. Surprisingly, these levels were higher in 1945, when the figure for imports stood at 25.6%. Paradoxically, this result shows that trade integration reached its peak before trade integration agreements were signed. To understand the reasons for this, we examine intraregional trade throughout the interwar period (1913-1950). We analyze five national cases: Argentina, Bolivia, Brazil, Chile and Peru. As far as we know, this is the first paper in the literature on intraregional trade during the interwar period. There are other papers on intraregional trade in Latin America, but they focus on the period after the 1960s. The analysis of intraregional trade in the interwar period is also useful to the Latin American industrialization debate. Given the disruption in world trade flows and the existence of some industrial capacity, the paper looks at any possible increase in intra-industry trade. There are two main conclusions: a) with the exception of the World War periods, intraregional trade has been low since 1913; b) in general, intraregional trade reflects the overall trade specialization: there is a high concentration of low value added products. Resumen: Dejando de lado NAFTA, la integración comercial en América Latina sigue siendo muy moderada hoy en día, representando alrededor del 20% del comercio total. Lo sorprendente es que estos valores eran más altos en 1945. Esto constituye un hecho paradoxal: la integración comercial alcanzó su récord antes de la firma de acuerdos de integración comercial. En el presente trabajo se estudia el comercio intrarregional a lo largo del período de entreguerras (1913-1950) a través del análisis de cinco casos: Argentina, Bolivia, Brasil, Chile y Peru. El análisis de la integración comercial en este período representa una novedad en la literatura, ya que los trabajos sobre América Latina, específicos de comercio intraregional, se centran en el período a partir de la década de 1960. El documento destaca dos conclusiones principales: a) con la excepción de los períodos de las guerras mundiales, el comercio intraregional ha sido muy modesto desde 1913 hasta la actualidad, b) en general, el comercio intrarregional repitió la especialización del comercio mundial: una alta concentración en productos de bajo valor añadido. JEL codes: N46, N76, F15. Key words: regional integration, international trade, Latin American economic history, trade agreements, the World Wars, the Great Depression.
3
Introduction Over time, the political objectives that guide South American regional integration have
changed. During the first wave of trade agreements in the 1960s, the main goal was
import substitution. Under a cepalian vision, the idea was to encourage the internal
industrialization process. However, the relative failure of these agreements and the
impact of the 1980s debt crisis determined a strong change in the regionalization
objectives. Hence, in the 1990s, the main idea became export substitution, based on the
experience of the Asiatic “tigers”.
In relation to this, Bulmer-Thomas talks about two Latin-American kinds of
regionalism: the “old” one from the 1960s, which was based on import substitution
industrialization (ISI); and the “new” one from the 1990s, based on manufacture
exportation.1 He focused on the impact of trade integration agreements throughout the
1990s and stated that MERCOSUR was the main leader of this process, as it reached
around 20% of total trade. The Central American Trade Agreement (CACM) had
around 15%, the Andean Community 10% and CARICOM less than 5%. It is true that
NAFTA reached even higher levels of intraregional trade (40%). However, this success
was driven by the United States’ important role as a trade partner. In general terms,
intraregional trade peaked in around 1999, when it accounted for 20% of total Latin
American trade. This level then decreased as a result of the Asiatic crisis and only
recently reached the peak of 1999 again.2 Thus, aside from NAFTA, it is clear that Latin
America trade integration is still too modest.
Surprisingly, these figures do not exceed those of the Second World War. Latin
American integration was first encouraged during this period, as traditional imports
from the USA and Europe were interrupted. Given the increase in commodity exports,
Latin American countries could satisfy internal demand by buying from neighboring
1 Victor Bulmer-Thomas, Debate: Regional Integration in the Latin America and the Caribbean, Bulletin of Latin American Research 20, no. 3 (2001). 2 CEPAL, Latin America and the Caribbean in the World Economy 2009 - 2010. A Crisis Generated in the Centre and a Recovery Driven by the Emerging Economies, Santiago de Chile, Chile, United Nations Publications, 2010.
4
countries. Thus, by 1945, 25.6% of all Latin American imports were intraregional,
while intraregional export levels reached 16.6% of total exports.3
Paradoxically, trade integration reached its peak before trade integration agreements had
been signed. To understand this fact, the present paper examines intraregional trade
throughout the interwar period (1913-1950). Specifically, we analyze five cases:
Argentina, Bolivia, Brazil, Chile and Peru. As far as we know, this is the first paper to
address this topic. Other papers examine Latin American intraregional trade, but they
focus on the post 1960s period.4
Furthermore, the analysis of intraregional trade in the interwar period is useful to the
Latin American industrialization debate.5 The interwar period can be considered a good
context for fostering industrial growth in Latin America. On one hand, war and world
trade disruptions could have signified de facto protection against competition from the
more industrialized economies. On the other hand, the interwar period offered to Latin
America what Williamson calls “Dutch health”.6 Of course, disruptions in international
trade could also have had negative effects on Latin America industries and reduced the
availability of key inputs. Nonetheless, this last limitation could have been overcome by
an increase in intra-industrial trade among Latin American countries. Hence, given the
disruption in world trade flows and the existence of some industrial capacity, the paper
looks at whether intraregional trade specialization was different from the overall trade
specialization: trade based on manufactures instead of commodities or low value added
products.7
3 Victor Bulmer-Thomas, Regional Integration in Latin America before the Debt Crisis: LAFTA, CACM and the Andean Pact, in Economic Integration Worldwide, ed. A.M. El-Agraa (London: MacMillan Press Ltd, 1997). 4 Calderón, Chong, and Stein, Trade Intensity and Business Cycle Synchronization: are Developing Countries any Different?. 5 Haber, The Political Economy of Latin American Industrialization. and Williamson, Industrial Catching up in the Poor Periphery 1870-1975. 6 While it is true that the trade worsening between 1870 and 1930 affected export purchasing power, at the same time it raised the relative price of manufactured goods in the local market. That is, trade worsening gave an incentive to local industries. Williamson, Industrial Catching up in the Poor Periphery 1870-1975. 7 For a detailed survey of WWI’s impact on Latin American industrialization see B. Albert, South America and the First World War: The Impact of the War on Brazil, Argentina, Peru and Chile, vol. 6, Cambridge Latin American Studies, Cambridge University Press, 1988.
5
The paper is organized as follows. First, the database and the sample are presented.
Second, we analyze the overall trade development. Third, we focus on bilateral trade
intensity rates. This initial approach allows us to compare the results for 1913-1950
with the post 1960s. Fourth, we present the intraregional trade percentages for each one
of the countries considered. These figures allow us to compare the results from the
interwar period with those of the 1960s and the 1990s. As a result, we can evaluate the
impact on integration of the several trade agreements made since the 1960s. Fifth, we
analyze the composition of the most relevant intraregional trade flows. The final section
presents the main conclusions.
The database
The use of historic trade statistics is not always straightforward. They may be
inaccurate, difficult to compare, and have limited temporal coverage. Consequently,
trade statistics have frequently been reconstructed using official sources from the main
exporters in the world, i.e. the United States, the United Kingdom and Germany (or the
G3) for the study period. This has been done partly for reasons of reliability. For
example, Federico and Tena (1991) and Tena (1991, 1992) found a positive correlation
between economic development and statistical reliability. 8 This methodology assures
the use of homogenous classifications. It also enables us to extend the temporal and
geographical coverage. Furthermore, it is a convenient strategy, as statistical sources
from different countries do not need to be checked.
Instead of the main exporters’ trade statistics, the paper is based on Latin American
sources. There was no choice in this matter, as we are interested in intraregional trade
and these flows are not covered by G3 statistics. In fact, the reconstruction of Latin
American trade using data from its main trade partners is one of the main reasons why
intraregional trade has been neglected in literature on the region’s economic history
before the 1960s. In contrast, the temporal and spatial coverage of Latin America’s own
statistics has increased significantly since the early twentieth century. Furthermore,
8 Giovanni Federico and Antonio Tena, On the Accuracy of Foreign Trade Statistics (1909-1935): Morgenstern Revisited, Explorations in Economic History 28, no. 3, 1991; Antonio Tena, Las Estadísticas Históricas del Comercio Internacional (1890-1960): Fiabilidad y Comparabilidad Universidad de Alcalá de Henares, 1991; Antonio Tena, Las Estadísticas Históricas del Comercio Internacional: Fiabilidad y Comparabilidad, Servicio de Estudios, Estudios de Historia Económica, Banco de España 24 (1992).
6
Latin American official statistics have been qualified as reasonably good in previous
papers9 and have recently been found to be more accurate for most countries in the
study period.10
The paper analyses intraregional trade in five South American countries: Argentina,
Bolivia, Brazil, Chile and Peru. Although Latin American statistics have reasonable
levels of statistical accuracy, not all countries have the same reliability level, as
mentioned before.11 The present paper has prioritized Chilean official statistics for two
main reasons. First, Chilean sources are widely recognized as highly accurate in the
Latin American context. Second, they report exports and imports in f.o.b prices, which
means we can use both sides of trade as useful data for this study. Therefore, all
bilateral flows in which Chile is considered have been reconstructed using Chilean
information. We also used Bolivian statistics for all the bilateral flows in which Bolivia
is considered, except the Bolivian-Chilean flows. We also analyzed Peruvian and
Brazilian statistics. Due to problems with the value system of its official statistics, we
totally reconstructed Argentinean trade flows using its trade partners’ statistics. In sum,
the database is composed of 1,480 bilateral trade flows. Exports and imports have been
considered separately. To compare the data among different countries and to calculate
aggregate figures for the whole region, all the information is expressed in constant
dollars.
There are several reasons for selecting the above country sample. On one hand, it was
chosen to take into account historical trade relations. We considered the
historiographical tradition in Latin America, which emphasizes the existence of a dense
trade network between southern Peru, northern Chile, northern Argentina and Bolivia
9 Anna Carreras-Marín and Marc Badia-Miró, La Fiabilidad de la Asignación Geográfica en las Estadísticas de Comercio Exterior: América Latina y el Caribe (1908–1930)" Revista de Historia Económica (Second Series) 26, no. 03 (2008). 10 Antonio Tena-Junguito and Henry Willebald, What Do We Know About the International Trade Integration of the American Continent between 1820 and 1940?, in CLADHE II (Mexico DF, Mexico.: 2010). 11 The prioritization of the Latin American trade statistics was based on José Peres Cajías, Marc Badia-Miró, and Anna Carreras-Marín, Comercio Intraregional en la América Latina de Entreguerras. ¿Una Oportunidad Perdida? Los Casos de Argentina, Bolivia, Brasil, Chile y Perú, in X Congreso Internacional de la AEHE. Sesión 15: América Latina ante la globalización, Carmona,Spain: 2011.
7
since colonial times.12 According to this literature, intraregional trade was also
significant during post-independence13 and even during the First Globalization.14 The
sample was also chosen to reflect the present situation. We wanted to explore the trade
relations between Brazil and Argentina before trade agreements were signed.15 Finally,
Bolivia was introduced to include greater variation in transport costs.16 Although the
term “South America” is used to characterize the country sample throughout this paper,
two important countries are lacking: Paraguay and Uruguay. These countries were
excluded from the sample due to lack of trade information in the first case, and accuracy
problems caused by transit trade in the second case.
Development of total trade (1913-50)
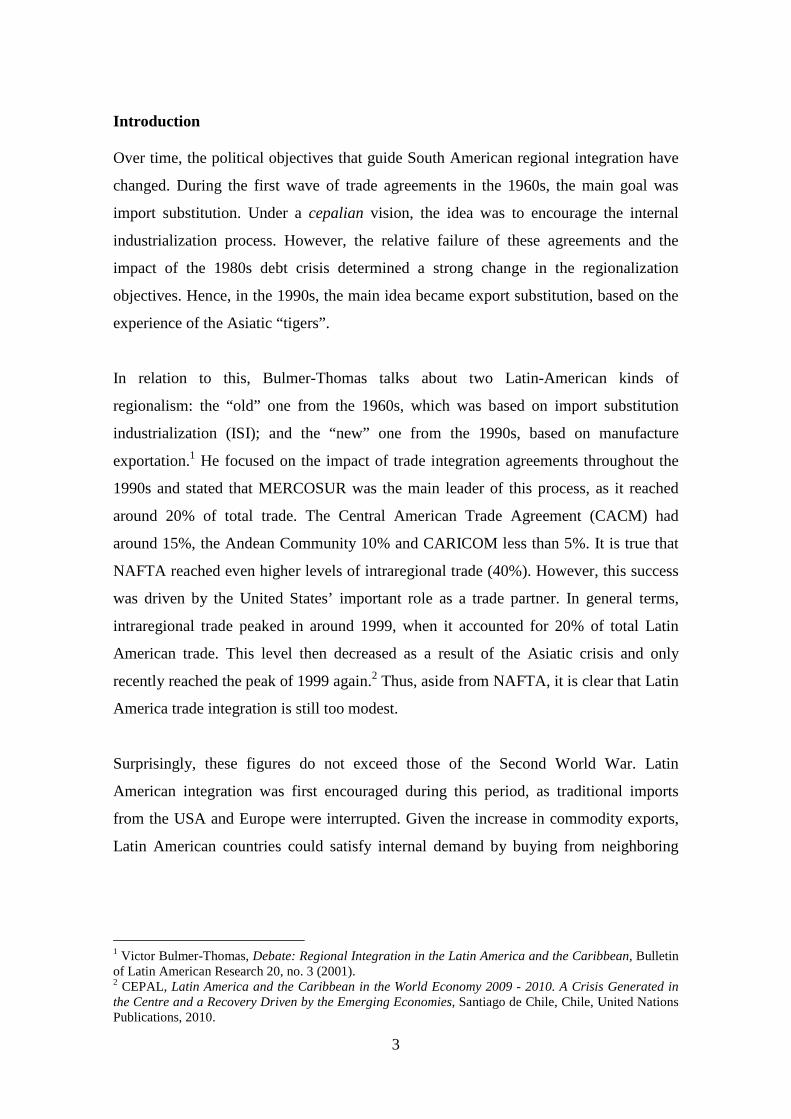
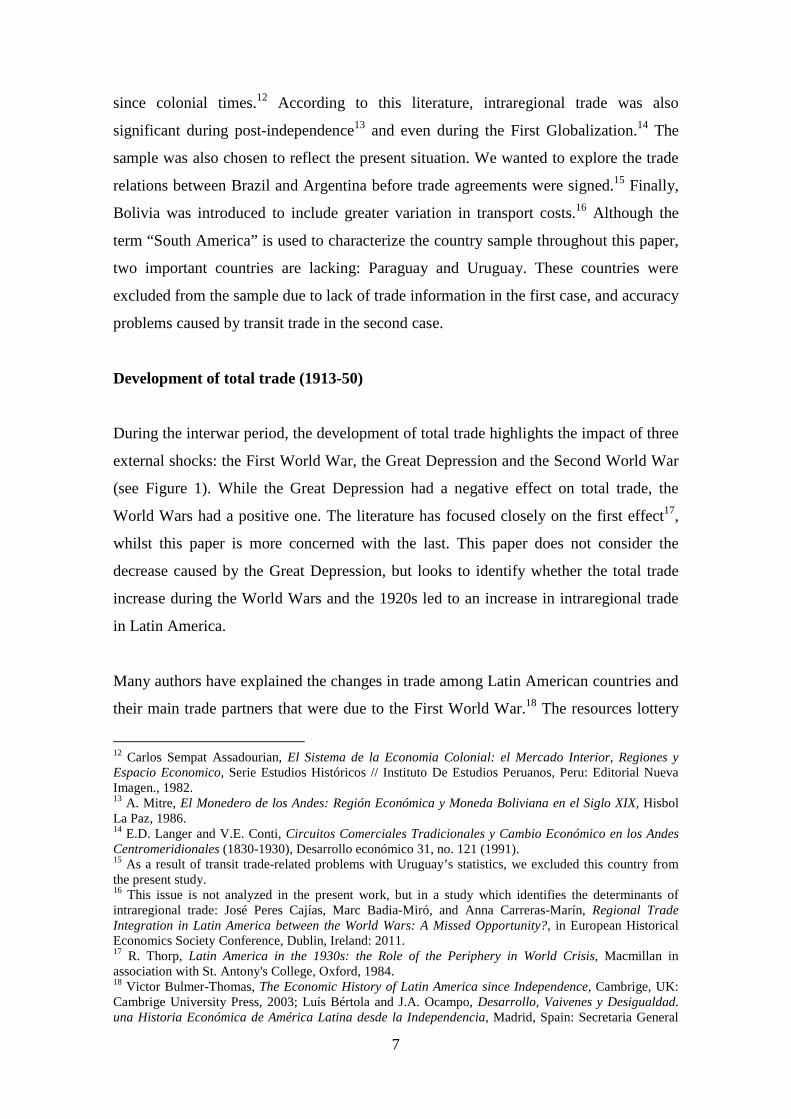
During the interwar period, the development of total trade highlights the impact of three
external shocks: the First World War, the Great Depression and the Second World War
(see Figure 1). While the Great Depression had a negative effect on total trade, the
World Wars had a positive one. The literature has focused closely on the first effect17,
whilst this paper is more concerned with the last. This paper does not consider the
decrease caused by the Great Depression, but looks to identify whether the total trade
increase during the World Wars and the 1920s led to an increase in intraregional trade
in Latin America.
Many authors have explained the changes in trade among Latin American countries and
their main trade partners that were due to the First World War.18 The resources lottery
12 Carlos Sempat Assadourian, El Sistema de la Economia Colonial: el Mercado Interior, Regiones y Espacio Economico, Serie Estudios Históricos // Instituto De Estudios Peruanos, Peru: Editorial Nueva Imagen., 1982. 13 A. Mitre, El Monedero de los Andes: Región Económica y Moneda Boliviana en el Siglo XIX, Hisbol La Paz, 1986. 14 E.D. Langer and V.E. Conti, Circuitos Comerciales Tradicionales y Cambio Económico en los Andes Centromeridionales (1830-1930), Desarrollo económico 31, no. 121 (1991). 15 As a result of transit trade-related problems with Uruguay’s statistics, we excluded this country from the present study. 16 This issue is not analyzed in the present work, but in a study which identifies the determinants of intraregional trade: José Peres Cajías, Marc Badia-Miró, and Anna Carreras-Marín, Regional Trade Integration in Latin America between the World Wars: A Missed Opportunity?, in European Historical Economics Society Conference, Dublin, Ireland: 2011. 17 R. Thorp, Latin America in the 1930s: the Role of the Periphery in World Crisis, Macmillan in association with St. Antony's College, Oxford, 1984. 18 Victor Bulmer-Thomas, The Economic History of Latin America since Independence, Cambrige, UK: Cambrige University Press, 2003; Luís Bértola and J.A. Ocampo, Desarrollo, Vaivenes y Desigualdad. una Historia Económica de América Latina desde la Independencia, Madrid, Spain: Secretaria General
8
drove the performance of the export sector in South American countries during the war
and the 1920s.19 At the same time, the Net Barter Trade Terms (NBTT) started to
decline in favor of export countries.20 However, as long as our focus is on intraregional
trade, one question arises: what happened to the trade terms among Latin American
countries? This is an unresolved problem. The importance of non-manufactured
products in trade forces us to make a deeper analysis in the future.
Despite the decline in NBTT between Latin America and its developed partners, the
share of some commodity exports increased during the 1920s (except in Brazil), partly
due to the increase in intraregional trade. This reinforced the export-led model.
However, the changes in commodity prices determined the real impact of this expansion
on the economy. At the same time, financial instability due to the collapse of the gold
standard affected the balance of payments and the equilibrium of the public sector
budget.21
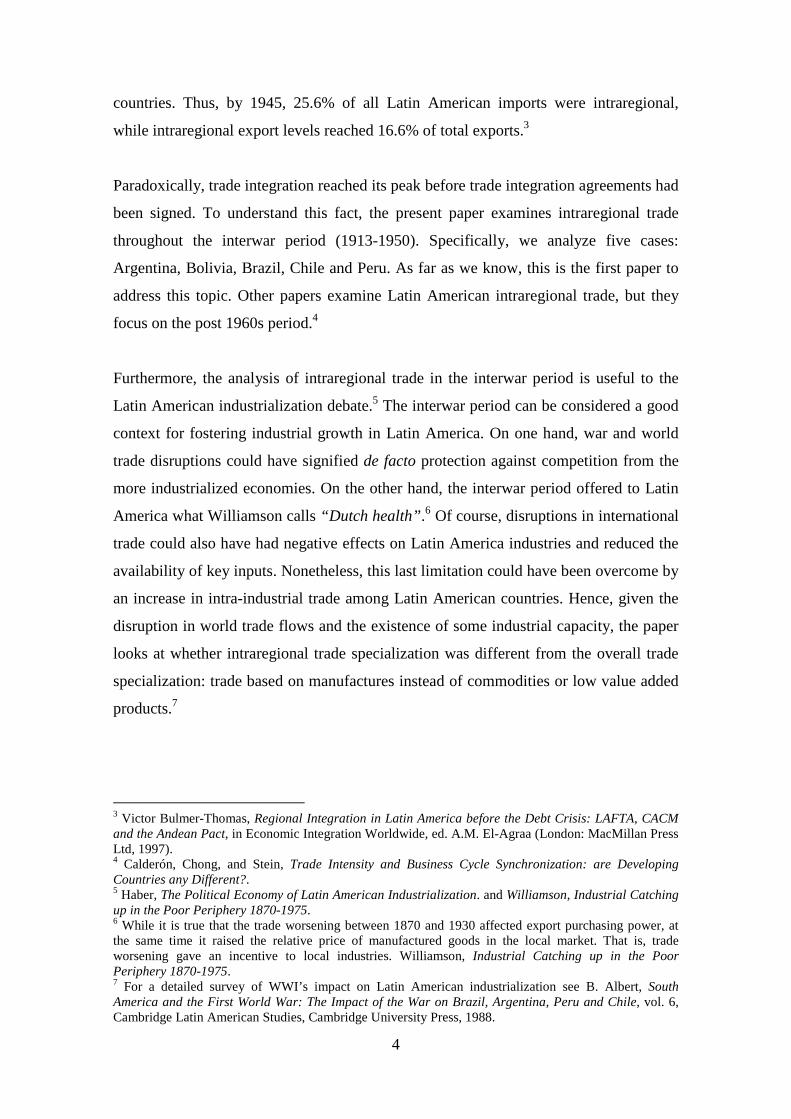
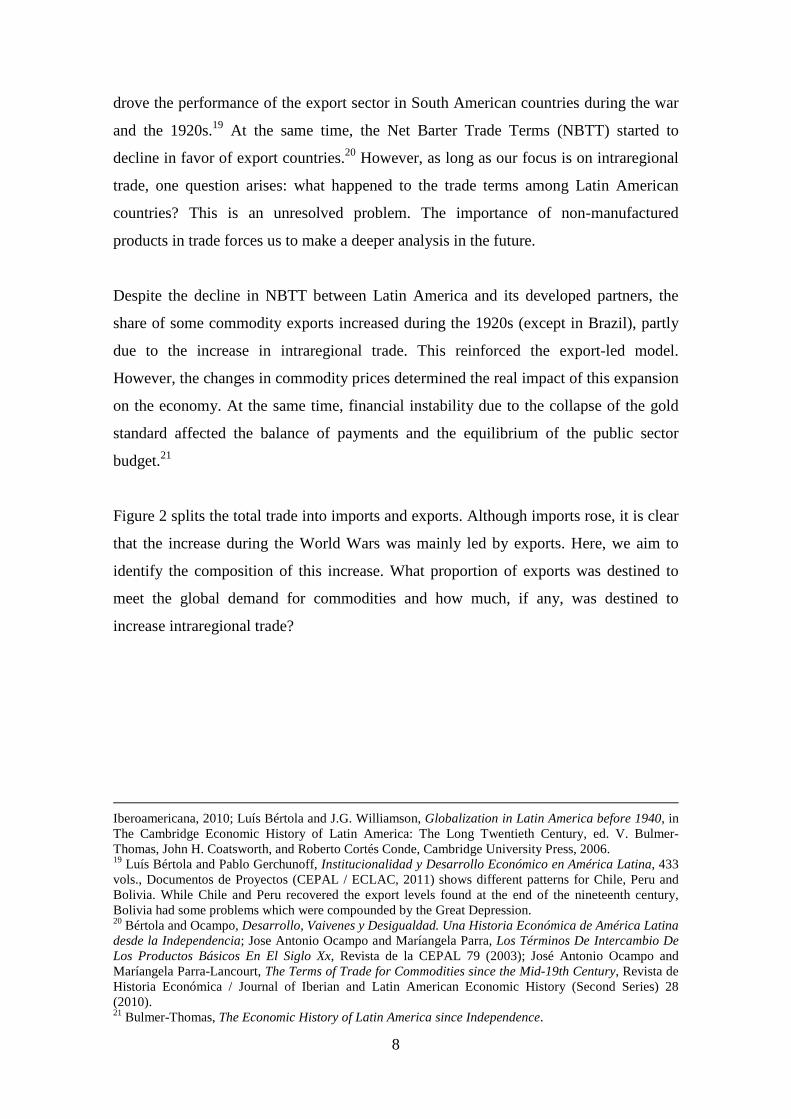
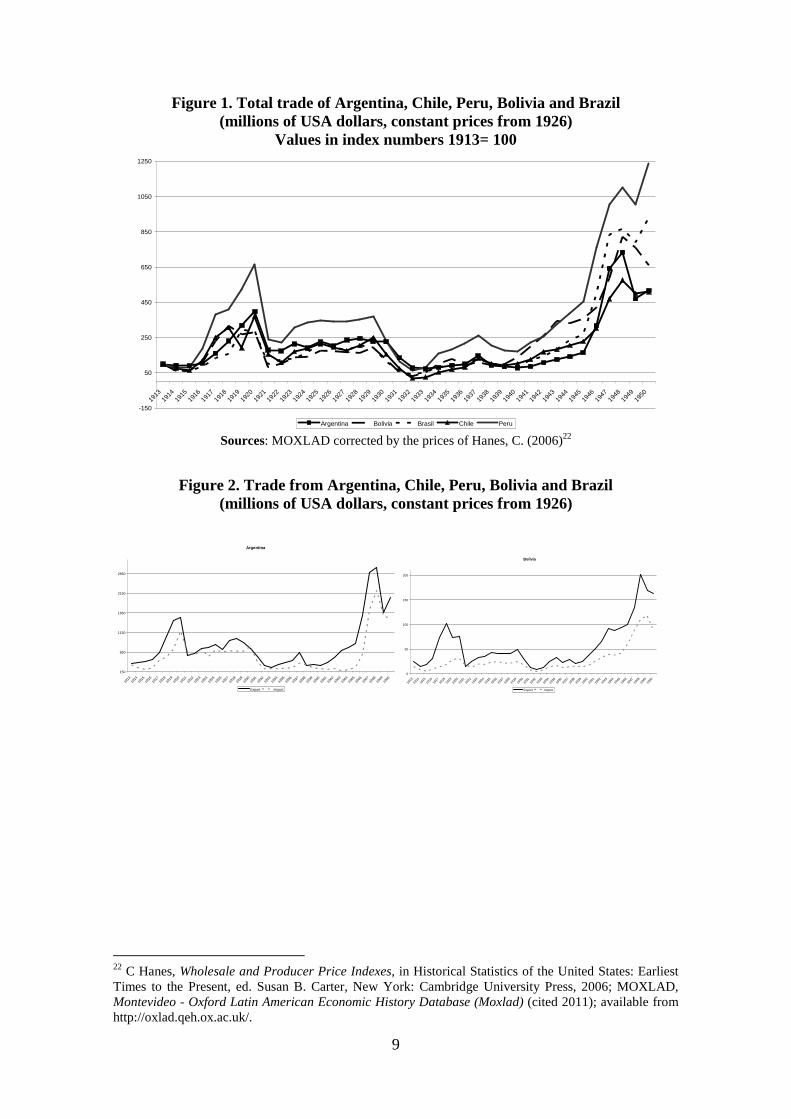
Figure 2 splits the total trade into imports and exports. Although imports rose, it is clear
that the increase during the World Wars was mainly led by exports. Here, we aim to
identify the composition of this increase. What proportion of exports was destined to
meet the global demand for commodities and how much, if any, was destined to
increase intraregional trade?
Iberoamericana, 2010; Luís Bértola and J.G. Williamson, Globalization in Latin America before 1940, in The Cambridge Economic History of Latin America: The Long Twentieth Century, ed. V. Bulmer-Thomas, John H. Coatsworth, and Roberto Cortés Conde, Cambridge University Press, 2006. 19 Luís Bértola and Pablo Gerchunoff, Institucionalidad y Desarrollo Económico en América Latina, 433 vols., Documentos de Proyectos (CEPAL / ECLAC, 2011) shows different patterns for Chile, Peru and Bolivia. While Chile and Peru recovered the export levels found at the end of the nineteenth century, Bolivia had some problems which were compounded by the Great Depression. 20 Bértola and Ocampo, Desarrollo, Vaivenes y Desigualdad. Una Historia Económica de América Latina desde la Independencia; Jose Antonio Ocampo and Maríangela Parra, Los Términos De Intercambio De Los Productos Básicos En El Siglo Xx, Revista de la CEPAL 79 (2003); José Antonio Ocampo and Maríangela Parra-Lancourt, The Terms of Trade for Commodities since the Mid-19th Century, Revista de Historia Económica / Journal of Iberian and Latin American Economic History (Second Series) 28 (2010). 21 Bulmer-Thomas, The Economic History of Latin America since Independence.
9
Figure 1. Total trade of Argentina, Chile, Peru, Bolivia and Brazil (millions of USA dollars, constant prices from 1926)
Values in index numbers 1913= 100
Sources: MOXLAD corrected by the prices of Hanes, C. (2006)22
Figure 2. Trade from Argentina, Chile, Peru, Bolivia and Brazil (millions of USA dollars, constant prices from 1926)
22 C Hanes, Wholesale and Producer Price Indexes, in Historical Statistics of the United States: Earliest Times to the Present, ed. Susan B. Carter, New York: Cambridge University Press, 2006; MOXLAD, Montevideo - Oxford Latin American Economic History Database (Moxlad) (cited 2011); available from http://oxlad.qeh.ox.ac.uk/.
-150
50
250
450
650
850
1050
1250
1913
1914
1915
1916
1917
1918
1919
1920
1921
1922
1923
1924
1925
1926
1927
1928
1929
1930
1931
1932
1933
1934
1935
1936
1937
1938
1939
1940
1941
1942
1943
1944
1945
1946
1947
1948
1949
1950
Argentina Bolivia Brasil Chile Peru
Argentina
150
650
1150
1650
2150
2650
1913
1914
1915
1916
1917
1918
1919
1920
1921
1922
1923
1924
1925
1926
1927
1928
1929
1930
1931
1932
1933
1934
1935
1936
1937
1938
1939
1940
1941
1942
1943
1944
1945
1946
1947
1948
1949
1950
Export Import
Bolivia
0
50
100
150
200
1913
1914
1915
1916
1917
1918
1919
1920
1921
1922
1923
1924
1925
1926
1927
1928
1929
1930
1931
1932
1933
1934
1935
1936
1937
1938
1939
1940
1941
1942
1943
1944
1945
1946
1947
1948
1949
1950
Export Import
10
Sources: MOXLAD corrected by the prices of Hanes, C. (2006)23
An analysis of total trade development in these South American countries reveals the
following. During the two wars, trade increased everywhere. However, total trade
during WWII was twice that in WWI in Argentina, Bolivia and Brazil. Furthermore, the
collapse in trade due to the Great Depression was widespread, but was greater in
Argentina, Chile and Peru, partially due to the positive development of trade during the
1920s.
As mentioned in the introduction, one of the aims of this paper is to check whether
intraregional trade was of a different nature to total trade. In relation to this issue, there
is some degree of consensus about the stages of industrial consolidation in Latin
America.24 However, there is less agreement about the strength of each of these stages
and the driving forces behind them. While some authors claim that industry was
consolidated in several countries before the First World War25 or the Second World
23 Hanes, Wholesale and Producer Price Indexes, MOXLAD, Montevideo - Oxford Latin American Economic History Database (MOXLAD) (cited). 24 In general terms, four stages have been proposed. The first one was the result of export expansion and market integration during the first globalization. The second was the response to the collapse of the world market during the interwar period. The third started in the late 1940s and was characterized by the rise of explicit state programs on import substitution. Finally, the “mature” stage began in the early 1960s. Enrique Cardenas, Jose Antonio Ocampo, and Rosemary Thorp, An Economic History of Twentieth-Century Latin America. 3. Industrialization and the State in Latin America: The Postwar Years, vol. 3, New York: Palgrave, 2000. 25 Williamson, "Industrial Catching up in the Poor Periphery 1870-1975."
Brazil
0
500
1000
1500
2000
2500
1913
1914
1915
1916
1917
1918
1919
1920
1921
1922
1923
1924
1925
1926
1927
1928
1929
1930
1931
1932
1933
1934
1935
1936
1937
1938
1939
1940
1941
1942
1943
1944
1945
1946
1947
1948
1949
1950
Export Import
Chile
0
100
200
300
400
500
600
700
1913
1914
1915
1916
1917
1918
1919
1920
1921
1922
1923
1924
1925
1926
1927
1928
1929
1930
1931
1932
1933
1934
1935
1936
1937
1938
1939
1940
1941
1942
1943
1944
1945
1946
1947
1948
1949
1950
Export Import
Peru
0
50
100
150
200
250
300
350
400
1913
1914
1915
1916
1917
1918
1919
1920
1921
1922
1923
1924
1925
1926
1927
1928
1929
1930
1931
1932
1933
1934
1935
1936
1937
1938
1939
1940
1941
1942
1943
1944
1945
1946
1947
1948
1949
1950
Export Import
11
War26, others warn that industrial growth must not be confused with industrialization.27
This is a lively debate in regional and national terms. For example, in the Chilean case,
some authors claim that industrialization took off during the interwar period.28
However, recent evidence casts doubt on this claim.29 The identification of any relevant
trade flow based on manufactured goods could be used as key input in this debate.
Whatever the controversies, it is critical to prove that intraregional trade can be based
on manufactured goods. Consequently, data on industrial development must be checked.
In the 1960s, it was claimed that industrial growth during the interwar period was
considerable in Argentina, Brazil and Chile.30 This was confirmed by Bulmer-Thomas,
who stated that in the Second World War, these countries, together with Colombia and
Mexico, had a modern industrial base that could lead to an import substitution process
for manufactured goods.31 It has been suggested that Peru also had a relatively mature
industrial base.32
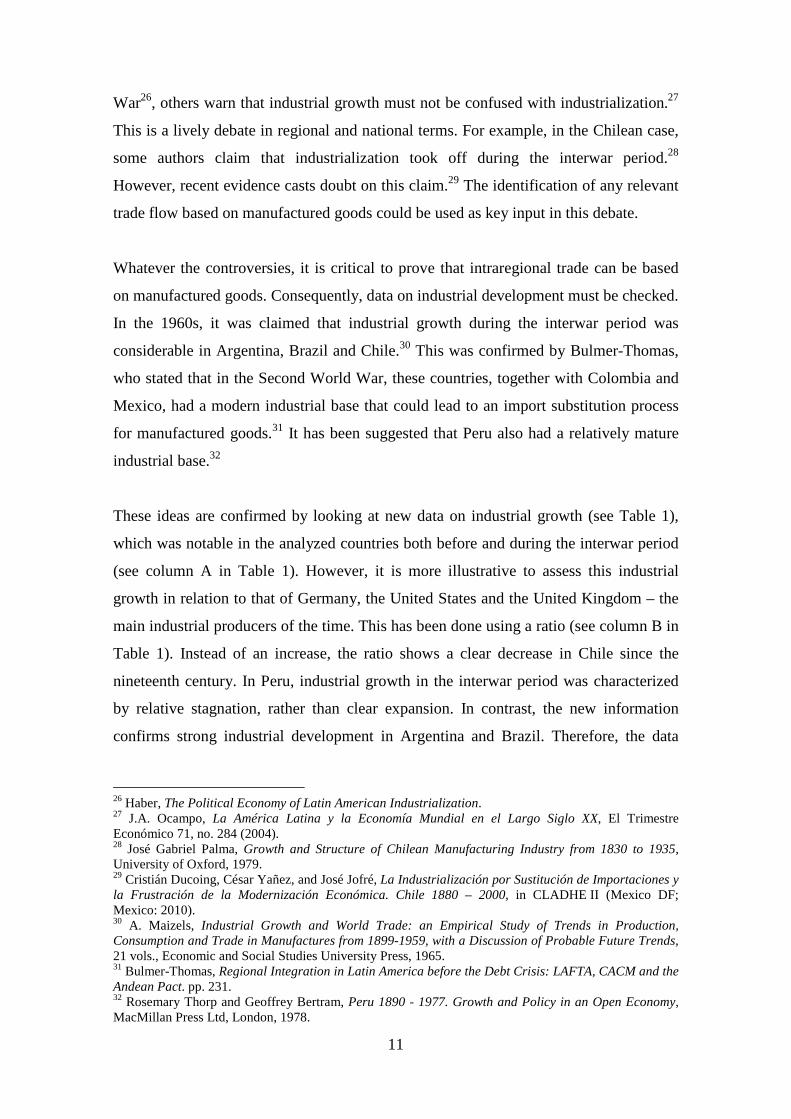
These ideas are confirmed by looking at new data on industrial growth (see Table 1),
which was notable in the analyzed countries both before and during the interwar period
(see column A in Table 1). However, it is more illustrative to assess this industrial
growth in relation to that of Germany, the United States and the United Kingdom – the
main industrial producers of the time. This has been done using a ratio (see column B in
Table 1). Instead of an increase, the ratio shows a clear decrease in Chile since the
nineteenth century. In Peru, industrial growth in the interwar period was characterized
by relative stagnation, rather than clear expansion. In contrast, the new information
confirms strong industrial development in Argentina and Brazil. Therefore, the data
26 Haber, The Political Economy of Latin American Industrialization. 27 J.A. Ocampo, La América Latina y la Economía Mundial en el Largo Siglo XX, El Trimestre Económico 71, no. 284 (2004). 28 José Gabriel Palma, Growth and Structure of Chilean Manufacturing Industry from 1830 to 1935, University of Oxford, 1979. 29 Cristián Ducoing, César Yañez, and José Jofré, La Industrialización por Sustitución de Importaciones y la Frustración de la Modernización Económica. Chile 1880 – 2000, in CLADHE II (Mexico DF; Mexico: 2010). 30 A. Maizels, Industrial Growth and World Trade: an Empirical Study of Trends in Production, Consumption and Trade in Manufactures from 1899-1959, with a Discussion of Probable Future Trends, 21 vols., Economic and Social Studies University Press, 1965. 31 Bulmer-Thomas, Regional Integration in Latin America before the Debt Crisis: LAFTA, CACM and the Andean Pact. pp. 231. 32 Rosemary Thorp and Geoffrey Bertram, Peru 1890 - 1977. Growth and Policy in an Open Economy, MacMillan Press Ltd, London, 1978.
12
again suggest that intra-industry trade was an economic possibility throughout the
interwar period, at least in some countries.33
Table 1. Industrial Growth in South America, 1870-1975
A. Industrial Output Growth (% per annum)
B. Industrial Output Growth relative to leaders (% per annum)
1870-1890
1890-1913
1920-1939
1950-1975
1870-1890
1890-1913
1920-1939
1950-1975
Argentina 6.55 8.91 5.56 1.8 3.06 5.07 2.39 -2.79
Brazil n.a.. 5.75 5.65 4.38 n.a. 1.91 2.84 -0.21
Chile 7.09 1.74 2.83 1.57 3.6 -2.1 -0.34 -3.02
Peru n.a. 6.19 3.65 7.77 n.a. 2.35 0.48 3.18
Sources: Williamson (2011: 47, 50)34
The next sections explore these issues. First, we evaluate intraregional trade
development during the interwar period in two ways: we look at the development of
trade intensity ratios in the long term (1913-1990); and we measure the weight of
intraregional trade out of total trade for all the countries analyzed in this paper. Then,
we explore the intraregional trade composition. Taking certain years as benchmarks, the
study of trade composition can be used to assess the existence of a different trade
pattern within South America and between South America and developed partners.
Trade intensity rates throughout the twentieth century: a story of stagnation
Calculations of bilateral trade intensity rates can be used to analyze long-term
intraregional commerce. Different formulas are suitable for these calculations. In the
present paper, the following expression was used:
++
= ∑t tjti
tjiFji FF
f
TT
,,
,,,,
11lnτ
where the bilateral trade intensity between country i and country j is calculated as a ten-
year average (T = 10 years), f is the trade flow among the countries (exports plus
imports in USA dollars) and F represents the total trade for each country. 33 It is true that industrial development in Bolivia was minor in relation to the other countries. However, industry still grew considerably during this period (Herranz and Peres Cajías, 2011). 34 Jeffrey G. Williamson, When, Where, and Why? Early Industrialization in the Poor Periphery 1870-1940, NBER Working paper series 16344, 2011.
13
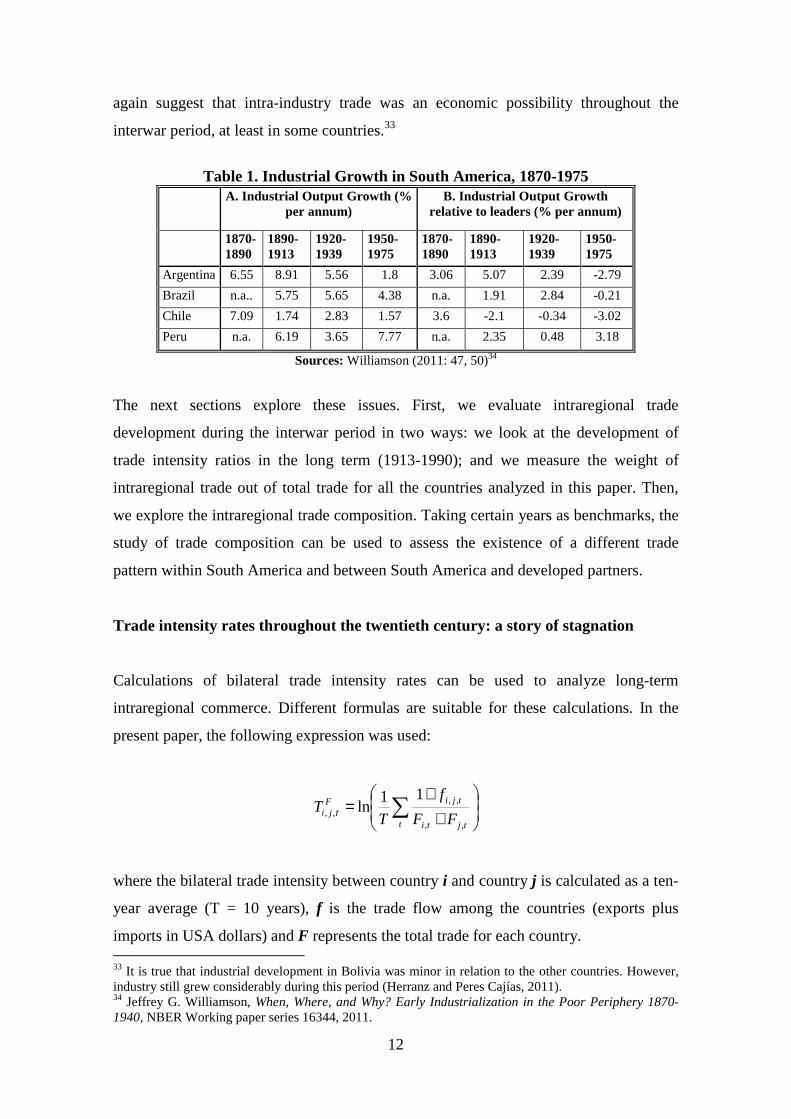
The use of this index for the interwar period allows us to analyze the development of
intraregional trade from 1913 to 1990 (see Figure 3), by comparing our data with that of
Calderon et al.35 This long-term approach shows high stability in the levels of many of
the intensity trade rates that were analyzed (Argentina-Peru, Bolivia-Brazil and Peru-
Brazil). In other cases, a moderate tendency to increase can be identified (Argentina-
Chile, Argentina-Bolivia, Bolivia-Chile and Chile-Brazil). Similarly, the ratios for
Brazil and Argentina were highest during the interwar period and after the 1960s.
During the Second World War, bilateral trade between Argentina and Brazil was
favored by a regional economic cooperation plan (the Pinedo Plan). Although this plan
was not fully implemented, it did lead to a significant reduction in bilateral custom duty
prices. It also reveals the importance of preferential trade agreements between these two
countries long before the regional trade integration efforts of the 1960s. This plan helps
us to understand the increase in this particular bilateral flow,36 and includes an
institutional framework in our discussion. Although we argue that intraregional trade in
South America peaked well before institutional arrangements for regional integration
were made, we cannot completely deny the institutional forces behind this phenomenon.
More precisely, we conceive institutional efforts to increase regional integration as
multilateral agreements that complemented the previous bilateral preferential treaties.
However, our information shows that trade between Argentina and Brazil was high even
before the Pinedo Plan. The long-term bilateral relation between Peru and Chile was a
bigger surprise, particularly as intensity trade ratios decreased considerably from the
interwar to the post-1960s period. The strong trade relations between Argentina and
Brazil have been a constant and growing feature of the regional integration process. In
contrast, the high Peruvian-Chilean trade in the interwar period was specific to that
time.
Figure 3. Trade intensity rates. A comparison of 1910-50 and 1960-90
35 Calderón, Chong, and Stein, Trade Intensity and Business Cycle Synchronization: are Developing Countries any Different? tried to explain the relation between trade integration and economic cycle synchronization in different countries around the world. Their study emphasizes that, although the correlation between these variables is real and positive, it is lower in developing countries than in developed ones. This is explained by the fact that the intra-industrial weight of bilateral trade is lower between developing countries. 36 Bulmer-Thomas, Regional Integration in Latin America before the Debt Crisis: LAFTA, CACM and the Andean Pact. pp. 232.
14
Sources: own calculations for 1910-1950 based on each country’s official trade statistics.
Calderon et al. (2007) for 1960-90.
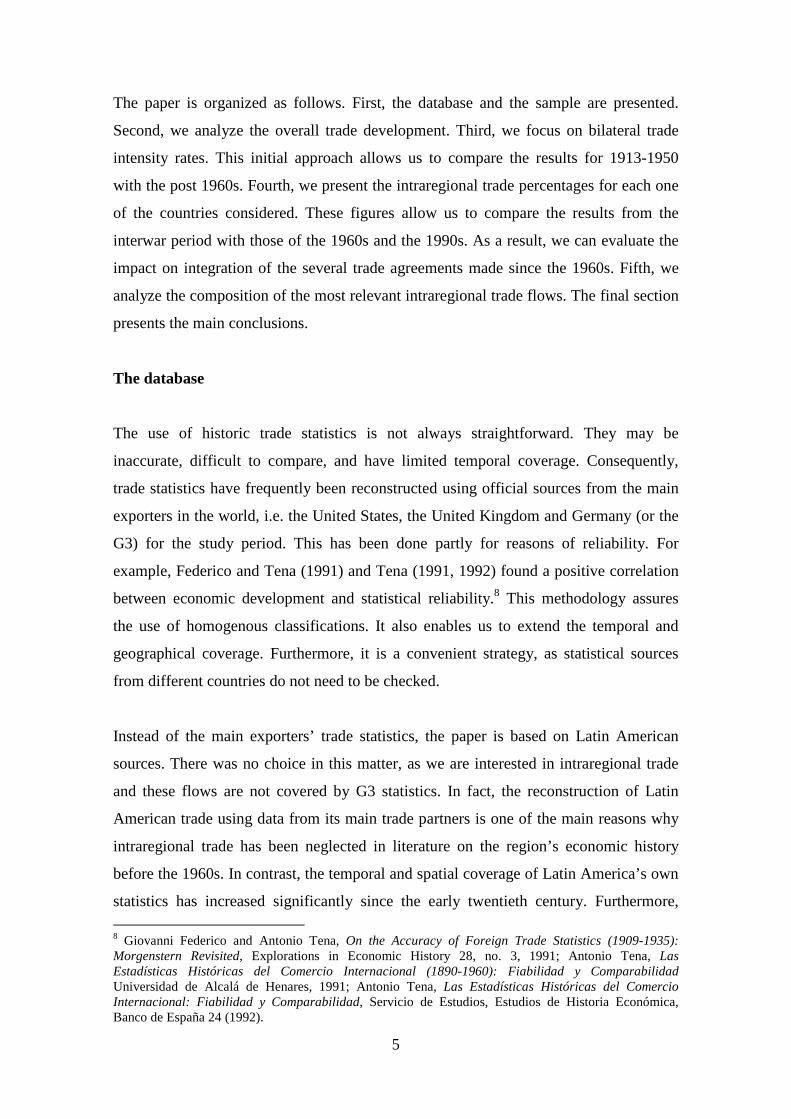
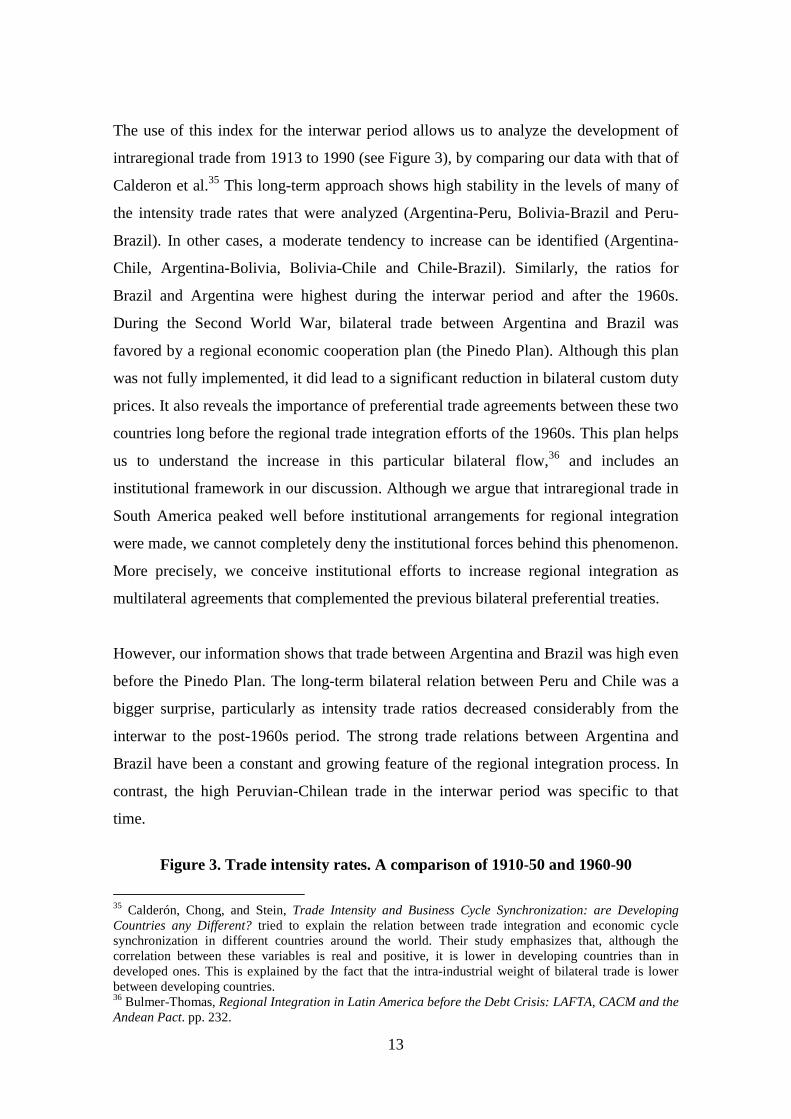
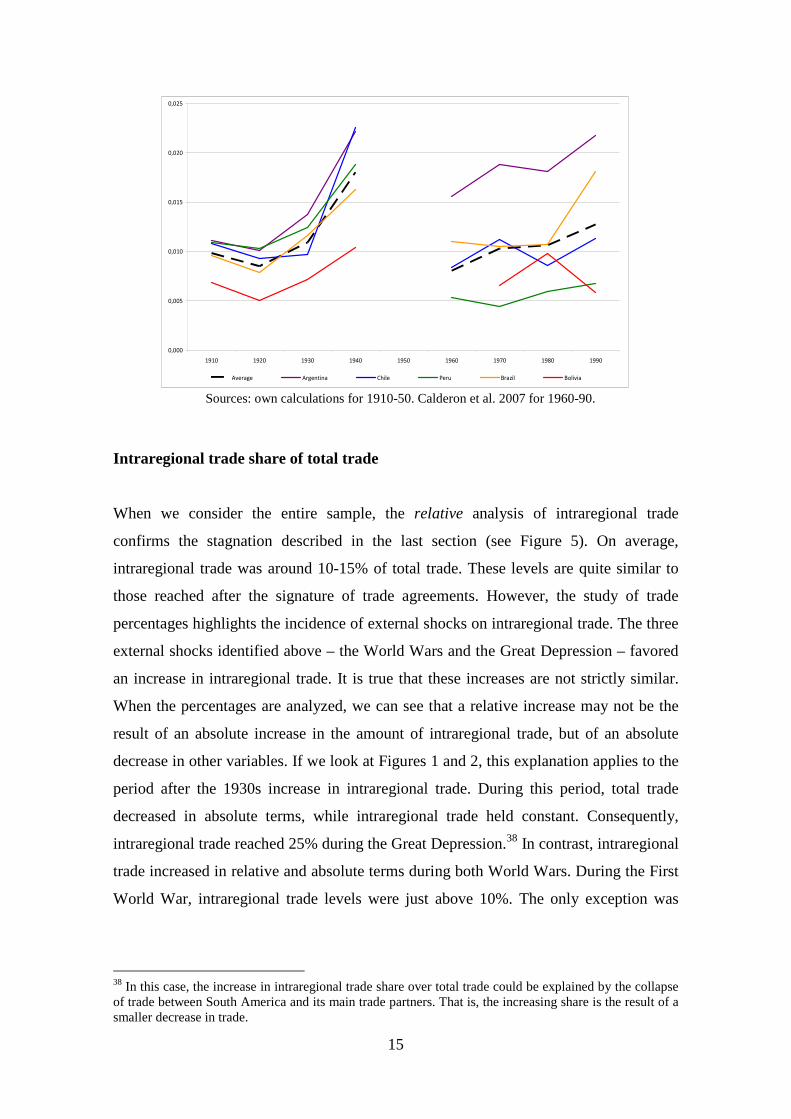
Another way to visualize the development of intraregional trade is to look at the trade
intensity rate averages for each country (see Figure 4). This calculation allows us to
identify intraregional trade trends, beyond each particular bilateral trade flow.
Intraregional trade stagnation is more evident when we use this approach. In general
terms, the level in the 1990s was slightly higher than that of the 1910s, similar to the
1920s and 1930s, but lower than the 1940s. This general pattern is also evident in
Bolivia and Chile, but is somewhat different in Argentina and Brazil – the 1990s levels
are lower than those of the 1940s. However, the most remarkable fact is again the
decrease in the Peruvian case.
Bilateral trade intensity ratios allow us to analyze the long-term development of
intraregional trade. However, they do not enable us to understand and measure the
weight of intraregional trade over total trade. Consequently, the following section
presents alternative intraregional calculations based on total trade percentages. 37
Figure 4. Trade intensity rates, 1910-50 versus 1960-90, country averages
37 Transit trade data is not included in this calculation, to ensure the accuracy of our results.
0,000
0,010
0,020
0,030
0,040
0,050
0,060
1910 1920 1930 1940 1950 1960 1970 1980 1990
Argentina - Chile
Argentina - Bolívia
Argentina - Perú
Argentina - Brasil
Bolivia - Chile
Bolivia - Perú
Bolivia - Brasil
Chile - Perú
Chile - Brasil
Perú - Brasil
15
Sources: own calculations for 1910-50. Calderon et al. 2007 for 1960-90.
Intraregional trade share of total trade
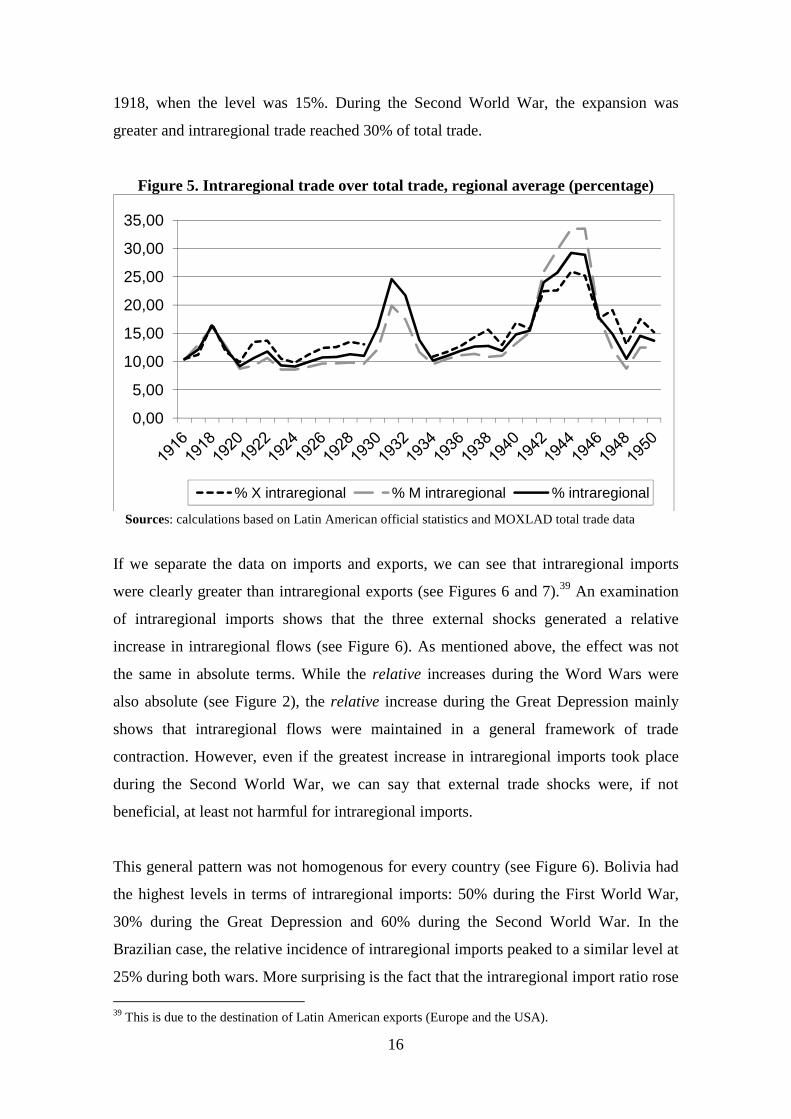
When we consider the entire sample, the relative analysis of intraregional trade
confirms the stagnation described in the last section (see Figure 5). On average,
intraregional trade was around 10-15% of total trade. These levels are quite similar to
those reached after the signature of trade agreements. However, the study of trade
percentages highlights the incidence of external shocks on intraregional trade. The three
external shocks identified above – the World Wars and the Great Depression – favored
an increase in intraregional trade. It is true that these increases are not strictly similar.
When the percentages are analyzed, we can see that a relative increase may not be the
result of an absolute increase in the amount of intraregional trade, but of an absolute
decrease in other variables. If we look at Figures 1 and 2, this explanation applies to the
period after the 1930s increase in intraregional trade. During this period, total trade
decreased in absolute terms, while intraregional trade held constant. Consequently,
intraregional trade reached 25% during the Great Depression.38 In contrast, intraregional
trade increased in relative and absolute terms during both World Wars. During the First
World War, intraregional trade levels were just above 10%. The only exception was
38 In this case, the increase in intraregional trade share over total trade could be explained by the collapse of trade between South America and its main trade partners. That is, the increasing share is the result of a smaller decrease in trade.
0,000
0,005
0,010
0,015
0,020
0,025
1910 1920 1930 1940 1950 1960 1970 1980 1990
Average Argentina Chile Peru Brazil Bolivia
16
1918, when the level was 15%. During the Second World War, the expansion was
greater and intraregional trade reached 30% of total trade.
Figure 5. Intraregional trade over total trade, regional average (percentage)
Sources: calculations based on Latin American official statistics and MOXLAD total trade data
If we separate the data on imports and exports, we can see that intraregional imports
were clearly greater than intraregional exports (see Figures 6 and 7).39 An examination
of intraregional imports shows that the three external shocks generated a relative
increase in intraregional flows (see Figure 6). As mentioned above, the effect was not
the same in absolute terms. While the relative increases during the Word Wars were
also absolute (see Figure 2), the relative increase during the Great Depression mainly
shows that intraregional flows were maintained in a general framework of trade
contraction. However, even if the greatest increase in intraregional imports took place
during the Second World War, we can say that external trade shocks were, if not
beneficial, at least not harmful for intraregional imports.
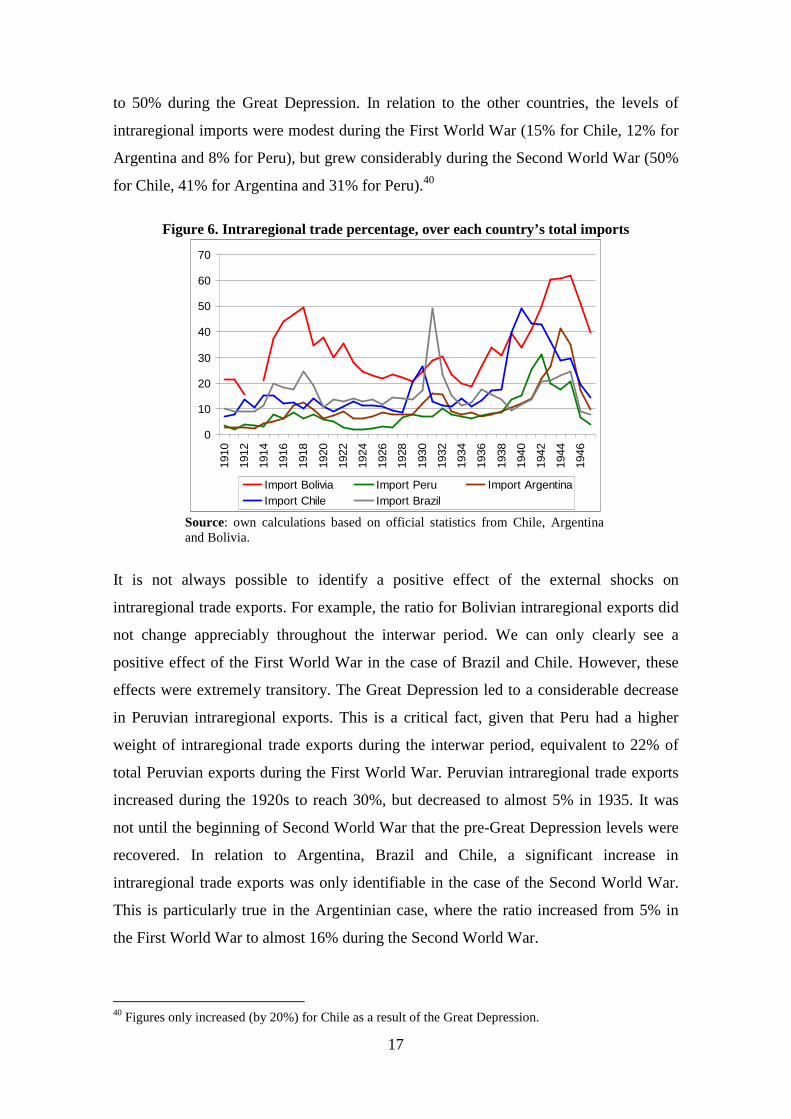
This general pattern was not homogenous for every country (see Figure 6). Bolivia had
the highest levels in terms of intraregional imports: 50% during the First World War,
30% during the Great Depression and 60% during the Second World War. In the
Brazilian case, the relative incidence of intraregional imports peaked to a similar level at
25% during both wars. More surprising is the fact that the intraregional import ratio rose
39 This is due to the destination of Latin American exports (Europe and the USA).
0,00
5,00
10,00
15,00
20,00
25,00
30,00
35,00
% X intraregional % M intraregional % intraregional
17
to 50% during the Great Depression. In relation to the other countries, the levels of
intraregional imports were modest during the First World War (15% for Chile, 12% for
Argentina and 8% for Peru), but grew considerably during the Second World War (50%
for Chile, 41% for Argentina and 31% for Peru).40
Figure 6. Intraregional trade percentage, over each country’s total imports
Source: own calculations based on official statistics from Chile, Argentina and Bolivia.
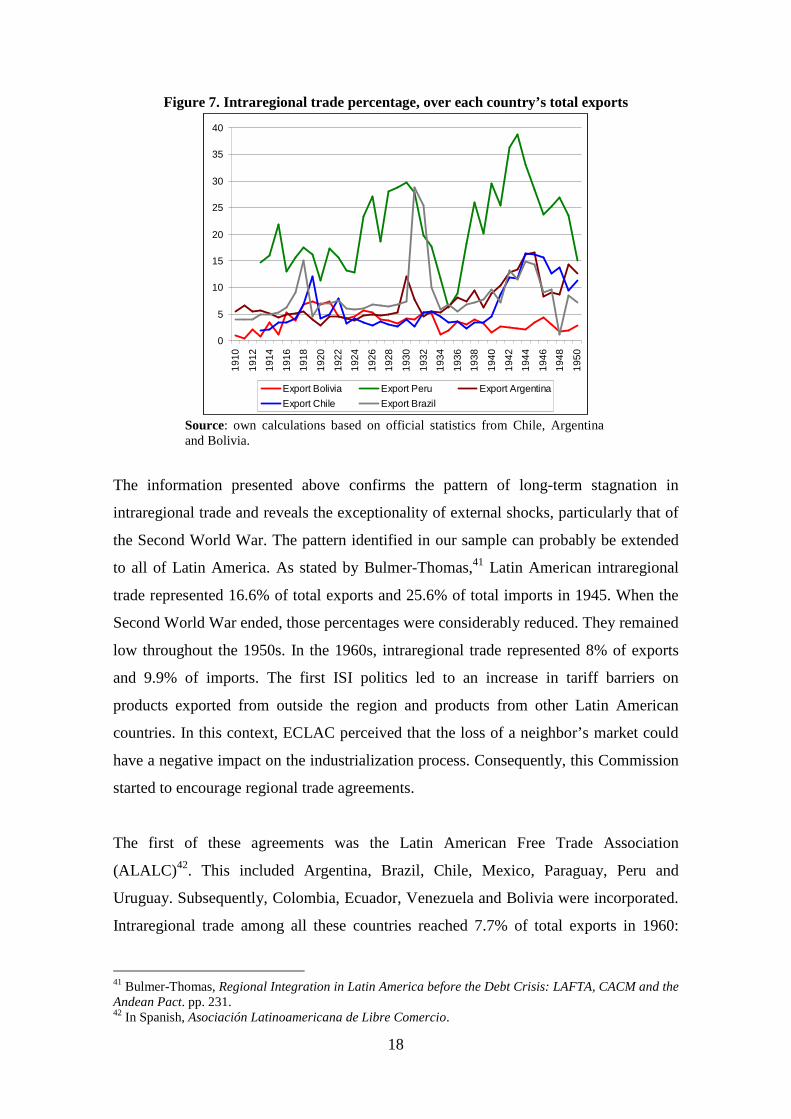
It is not always possible to identify a positive effect of the external shocks on
intraregional trade exports. For example, the ratio for Bolivian intraregional exports did
not change appreciably throughout the interwar period. We can only clearly see a
positive effect of the First World War in the case of Brazil and Chile. However, these
effects were extremely transitory. The Great Depression led to a considerable decrease
in Peruvian intraregional exports. This is a critical fact, given that Peru had a higher
weight of intraregional trade exports during the interwar period, equivalent to 22% of
total Peruvian exports during the First World War. Peruvian intraregional trade exports
increased during the 1920s to reach 30%, but decreased to almost 5% in 1935. It was
not until the beginning of Second World War that the pre-Great Depression levels were
recovered. In relation to Argentina, Brazil and Chile, a significant increase in
intraregional trade exports was only identifiable in the case of the Second World War.
This is particularly true in the Argentinian case, where the ratio increased from 5% in
the First World War to almost 16% during the Second World War.
40 Figures only increased (by 20%) for Chile as a result of the Great Depression.
0
10
20
30
40
50
60
70
1910
1912
1914
1916
1918
1920
1922
1924
1926
1928
1930
1932
1934
1936
1938
1940
1942
1944
1946
Import Bolivia Import Peru Import ArgentinaImport Chile Import Brazil
18
Figure 7. Intraregional trade percentage, over each country’s total exports
Source: own calculations based on official statistics from Chile, Argentina and Bolivia.
The information presented above confirms the pattern of long-term stagnation in
intraregional trade and reveals the exceptionality of external shocks, particularly that of
the Second World War. The pattern identified in our sample can probably be extended
to all of Latin America. As stated by Bulmer-Thomas,41 Latin American intraregional
trade represented 16.6% of total exports and 25.6% of total imports in 1945. When the
Second World War ended, those percentages were considerably reduced. They remained
low throughout the 1950s. In the 1960s, intraregional trade represented 8% of exports
and 9.9% of imports. The first ISI politics led to an increase in tariff barriers on
products exported from outside the region and products from other Latin American
countries. In this context, ECLAC perceived that the loss of a neighbor’s market could
have a negative impact on the industrialization process. Consequently, this Commission
started to encourage regional trade agreements.
The first of these agreements was the Latin American Free Trade Association
(ALALC) 42. This included Argentina, Brazil, Chile, Mexico, Paraguay, Peru and
Uruguay. Subsequently, Colombia, Ecuador, Venezuela and Bolivia were incorporated.
Intraregional trade among all these countries reached 7.7% of total exports in 1960:
41 Bulmer-Thomas, Regional Integration in Latin America before the Debt Crisis: LAFTA, CACM and the Andean Pact. pp. 231. 42 In Spanish, Asociación Latinoamericana de Libre Comercio.
0
5
10
15
20
25
30
35
40
1910
1912
1914
1916
1918
1920
1922
1924
1926
1928
1930
1932
1934
1936
1938
1940
1942
1944
1946
1948
1950
Export Bolivia Export Peru Export Argentina
Export Chile Export Brazil
19
9.9% in 1970, 13.6% in 1980. It then dropped to 8.3% in 1985. In the 1980s, the ALAC
was replaced by the Latin American Integration Association (ALADI)43, but this change
did not lead to greater economic integration. In sum, these levels can be qualified as
modest per se, but even more so if they are contrasted with those reached during the
interwar period.
In 1969, another integration organization was created in parallel to ALALC: the Andean
Pact44. Bolivia, Chile, Colombia, Ecuador and Peru were original members of this pact;
Venezuela joined at a later date. In 1976, Augusto Pinochet decided that Chile should
leave the pact. The results of intraregional trade in the case of the Andean Pact were
much more modest than those attained by ALALC. In 1970, 3.4% of exports were
intraregional, while in 1975 this figure rose to 5.5%. However, in 1980, the percentage
decreased to 3.7% and a few years later, in 1985, it went down even further to 3.2%.45
Throughout the 1990s, the Andean Pact trade flows were higher than in the 1980s, but
represented only 9.3% of the total trade of their member countries. At the beginning of
this decade, MERCOSUR46 (the South American Common Market) was created as a
result of bilateral trade agreements between Argentina and Brazil. Subsequently,
Paraguay and Uruguay were incorporated. The four nations signed an agreement in
1991. Three years later, their intraregional trade represented 18.6% of their exports.47
By 1995, MERCOSUR had two more members: Bolivia and Chile. The institutional
efforts to promote trade integration were evident and may have been partially
responsible for the substantial increase in regional trade percentages. Nevertheless, the
highest levels of intraregional trade as a percentage of total Latin American trade
reached 20%.48 These levels were similar to those reached during the First World War
and lower than those attained during the Second World War.
In comparison with the post 1960s, the interwar period could be appreciated as positive
in terms of regional integration. However, we must not forget the context of this period. 43 In Spanish, Asociación Latinoamericana de Integración. 44 In Spanish, Comunidad Andina. 45 Bulmer-Thomas, Regional Integration in Latin America before the Debt Crisis: LAFTA, CACM and the Andean Pact. pp. 245 46 In Spanish, Mercado Común del Sur. 47 Bulmer-Thomas, Regional Integration in Latin America before the Debt Crisis: LAFTA, CACM and the Andean Pact. pp. 258 48 Bulmer-Thomas, Debate: Regional Integration in Latin America and the Caribbean.

20
In the next section, an analysis of trade composition casts doubt on the achievements of
interwar integration.
Intraregional trade composition: was there any sustainable diversification?
Theoretically, all trade integration processes could have two effects: create new trade
flows or divert existing ones. The previous sections showed that intraregional trade
flows grew in response to external trade shocks. At first glance, this suggests that a
trade diversion process had occurred, at least during those years. In other words,
European trade importation was replaced by imports from South American neighbors.
However, the data availability does not allow us to confirm or reject any trade diversion
processes, using an econometric approach such as that applied in studies that use more
up-to-date trade data. However, an analysis of the composition of intraregional flows
can provide some evidence on this issue, with some clues from a qualitative approach.
The goal of this section is to check whether Latin American countries took advantage of
trade disruptions to global markets. The idea is to analyze whether the intraregional
trade pattern was different from the overall trade specialization. Throughout the
interwar period, South American trade was based on commodities exports. This was a
general pattern, in which there was some variation.49 For example, Bolivia was the least
diversified exporter, as tin exports made up 70% of its total exports. Chilean exports
were also highly concentrated on mining, mainly of copper and nitrates. Argentinian
and Brazilian exports were more diversified. Argentina sold wool, wheat, meat, linen
seeds and leather. Brazil exported agricultural products (sugar, cacao, cotton and
rubber) and mineral products (iron). Peru had the most diversified export sector, selling
different mining and agricultural products (cotton, sugar, wool, copper, rubber, lead, oil
and derivatives, zinc and silver). Therefore, the idea is to check whether intraregional
exports were only composed of these kinds of commodities or low-value added
products, or whether they contained a higher share of manufactures.
As mentioned above, this change in trade pattern was a real possibility in the region, not
only due to the special international context, but also to the relevant industrial
49 B. R. Mitchell, International Historical Statistics: the Americas, 1750-2005, 6th ed. New York: Palgrave Macmillan, 2007.
21
development. The expectations of a new trade pattern are even higher if some
historiographical precedents are considered. For example, in 1945, 11.9% of Brazilian
exports were destined to Argentina and 43% of them were manufactured products.50
While it is true that bilateral trade levels subsequently decreased, it was also verified
that a large proportion of bilateral trade was still composed of manufactured products
(26.7% in 1965; 41.7% in 1970 and 45.2% in 1975). Therefore, international
institutions, such as ECLAC, are promoting the growth of intraregional trade as it is
supposed to be composed of more value added goods.
Given these precedents, a trade composition analysis was carried out for all the
countries analyzed in this paper. The entire sample was considered to identify any
relevant process beyond the Brazilian and Argentinian cases. Likewise, the interwar
period was studied to test the sustainability of this hypothetical higher value added
trade. Two strategies were used to analyze the trade composition. First, a concentration
index was built under the assumption that product diversification could reveal a new
trade pattern. Then, in order to prove this change, a deeper product analysis was carried
out.
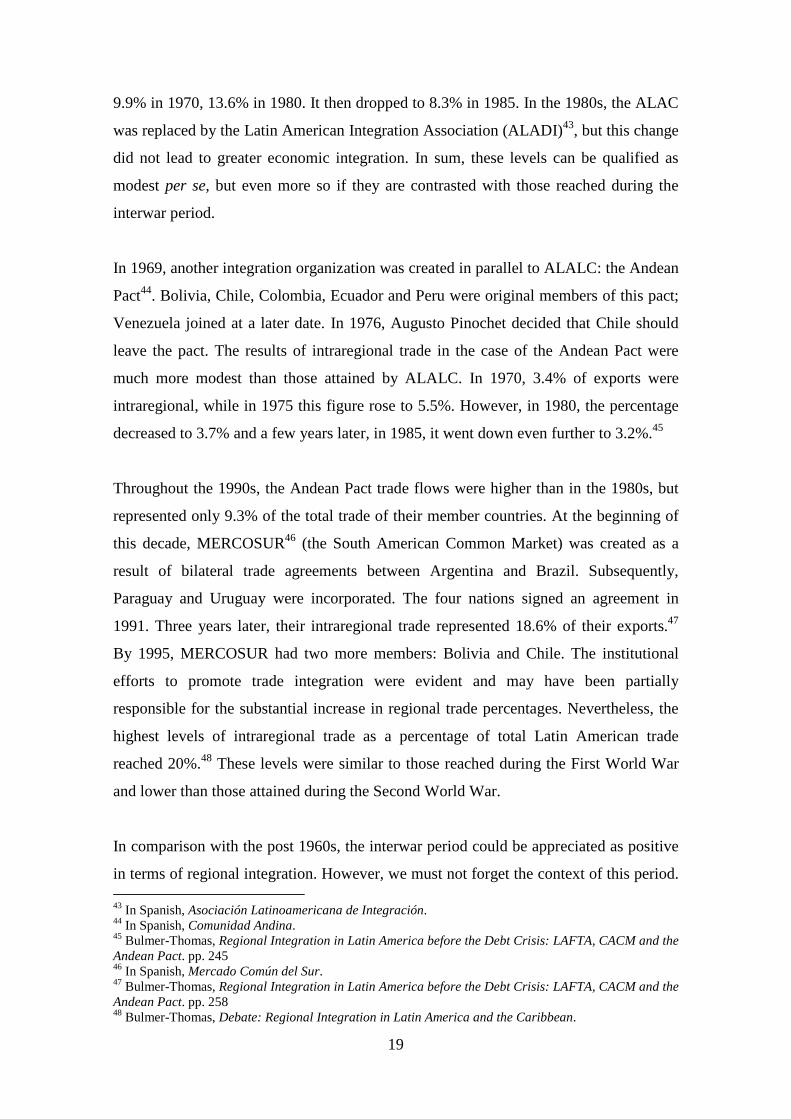
Chilean intraregional exports show a diversification trend (see Table 2).51 However, this
diversification process was not really the result of any new trade pattern. The product
analysis for 1944 helps to prove this.52 The main exports were: gold coins, iron and
copper to Argentina; copper, saltpeter and malt to Brazil; rice, malt and explosives to
Bolivia; rice, saltpeter and malt to Peru. Therefore, as in the case of the total exports,
Chilean intraregional exports were mainly composed of primary products from mining
and agriculture. In this context, the absence of any manufactured products questions the
possibility of any new trade pattern.
50 Bulmer-Thomas, Regional Integration in Latin America before the Debt Crisis: LAFTA, CACM and the Andean Pact. pp. 236-8. 51 While exports to Argentina and Brazil tended to involve higher diversification, exports to Peru and Bolivia remained highly concentrated. However, the former flows were greater than the latter. In 1915, Argentina absorbed 3% of Chilean exports; while this figure was lower than 1% in the other cases. In 1925 and 1935, the Argentinian ratio decreased to 1.5% and 1.4% and remained lower than 1% in the other cases. In 1944, the relative importance of each country increased (Argentina 8.25% of total exports; Brazil, 3.84%; Bolivia, 2.61%; and Peru, 8.25%). The relative importance of each country decreased once the war ended, but Argentina and Brazil remained the most important countries (both absorbing 4% of total exports, while exports to Bolivia and Peru were less than 1% of total exports). Therefore, given the relative importance of each flow, we can identify a general diversification trend. 52 This year is taken as a benchmark because of the greater relevance of South American markets for Chilean exports.
22
Table 2. Concentration of Chilean intraregional exports, with the first three products as a percentage of total flow
Destination 1915 1925 1935 1944 1949 Argentina 64.55 41.96 32.88 34.96 36.68
Brazil 92.62* 97.56 64.75 41.65 55.49 Peru 60.21 65.63 23.39 54.22 59.97
Bolivia 46.12 73.71 54.48 55.27 69.29 * Only two products: walnut and raisins
Sources: Chilean Official Trade Statistics
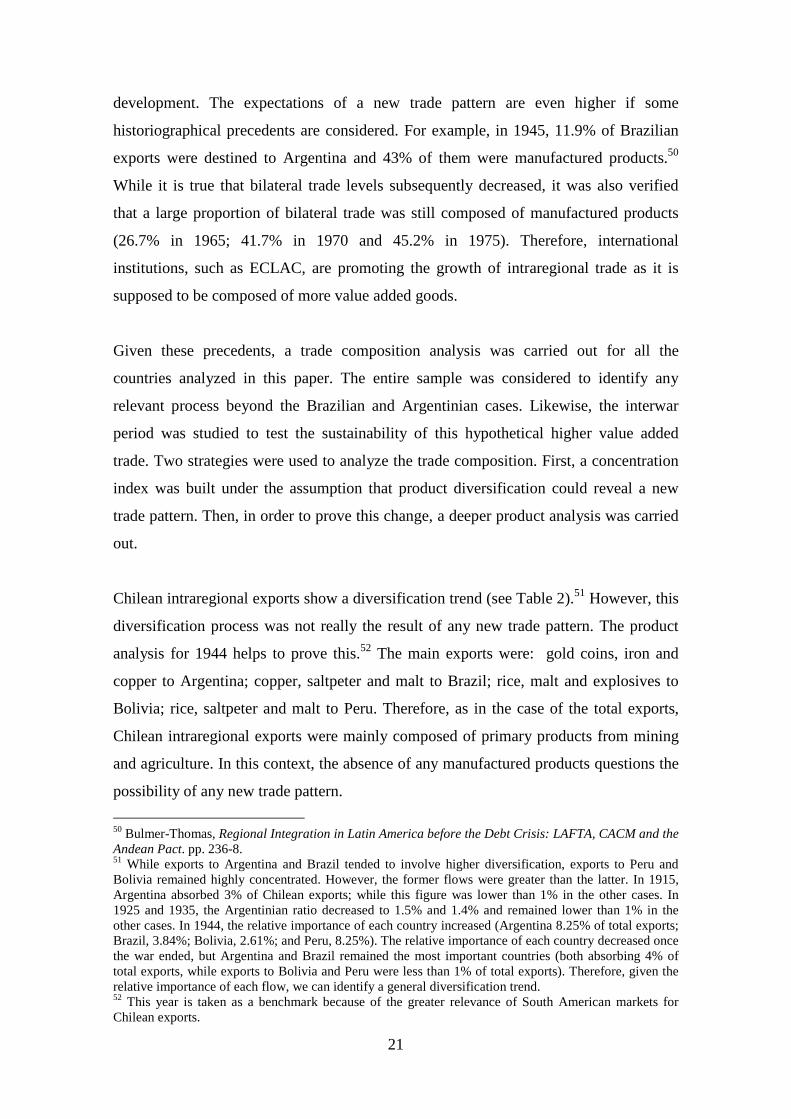
Chilean intraregional imports remained at more or less the same concentration level
throughout the interwar period (see Table 3). However, there were some changes in
product composition.53 In 1944, which was the most important year in terms of
intraregional trade levels and diversification, imports from Argentina were mainly
comprised of cows, sunflowers seeds and wool cloths. The most important imports from
Peru were sugar, oil and raw cotton. In the case of Bolivia, imports were minimal and
were mainly traditional minerals (tin and silver). However, imports to Brazil were more
complex and included cotton cloth.
Table 3. The concentration of Chilean intraregional imports, with the first three products as a percentage of total flow
Origin 1915 1925 1935 1944 1949 Argentina 63.65 52.32 47.46 41.32 74.08
Brazil 99.27 97.09 98.39 65.45 76.26 Peru 79.61 87.13 78.71 76.10 73.98
Bolivia 67.91 62.13 68.60 65.86 79.69 Sources: Chilean Official Trade Statistics
The inclusion of sugar, oil, raw cotton, cotton and wool cloth could be indicative of a
new trade pattern that was more dependent on manufactures. Sugar, which is a
manufacture, could be cited as an example of the strength of Peruvian industry. Oil and
raw cotton imports show that Chile’s industrial demand was supplied by a foreign
country. Finally, the export of cotton and wool cloth are an indicator of the
competitiveness of Argentinian and Brazilian industry, whose productivity level was
53 In 1915, the main South American imports came from Peru and were equivalent to 8.52% of total imports. This was followed by Argentina (4.39%), Brazil and Bolivia (which represented less than 1% of total imports). In 1925 and 1935, the importance of imports from Peru and Argentina decreased (7 and 3%), while imports from the other two countries remained under 1%. In 1944, the relative importance of each country except Bolivia increased (17.18% for Argentina; 16.61% for Peru; 9.25% for Brazil). Finally, in 1949, the relative importance decreased again (to 10.72% for Peru; 4.39% for Argentina; 4.25% for Brazil; and 0.06% for Bolivia).
23
high enough to enter markets that were traditionally supplied by the USA and European
countries.
How new and sustainable were these flows? In relation to Peruvian exports to Chile, it
is true that sugar is a manufacture, but it is also true that is not a very complex one.
Furthermore, sugar exports from Peru to Chile were not at all new. In fact, they had
been at a similarly high level since colonial times.54 Oil and raw cotton exports are
probably a better indicator of a new intraregional trade pattern. Raw cotton implied an
intra-industry trade relationship, and oil is a sign of the growing energy independence of
South America from US or European imports.55
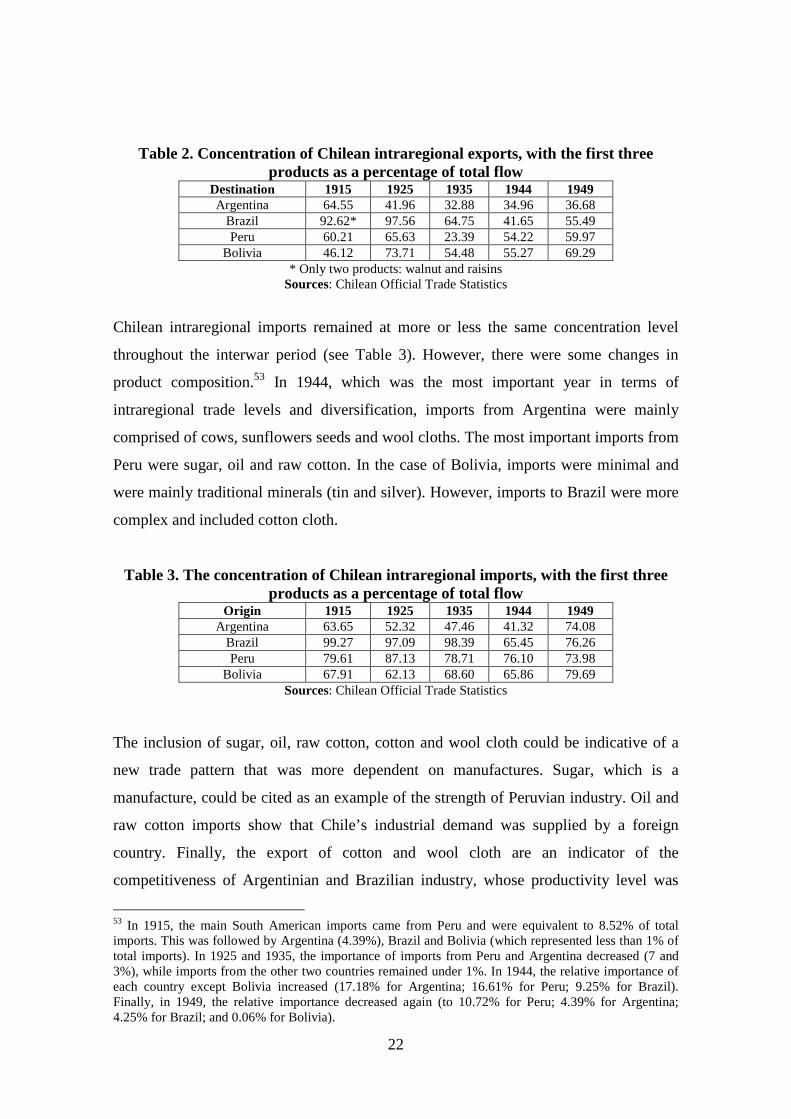
The study of Peruvian and Chilean exchanges is critical, given their regional relevance
(see Figures 3 and 7). To assess a new trade pattern in one of the most relevant regional
exchanges, we analyzed the product composition for these two countries in more depth
(see Table 4). This analysis confirmed the Chilean specialization in mining and
agricultural products. It also revealed the continuing importance of sugar exports from
Peru to Chile. However, it also showed the relevance of a new key input for industries
and modernization: oil. Oil, which makes up a considerable proportion of intraregional
trade between these two countries, supports the hypothesis of an emerging industrial
process in the region during the study period.
Table 4. Chilean and Peruvian bilateral trade composition, 1915 and 1944
Exports from 1915 1944 Chile to Peru Saltpeter (42.37%)
Barley (9.47%) Raisins (8.37%) Olives (4.33%) Horses (3.81%) Quillay (2.64%) Sheep (2.18%)
Rice (24.25%) Saltpeter (16.25%) Barley (13.71%) Crockery (5.20%) Raulí wood (4.96%) Pine wood (2.96%) Linghe wood (2.44%) Apples (2.20%) Oak wood (2.07%)
Peru to Chile Sugar (50.37%) Raw oil (16.88%) Cows (12.37%) Rice (4.60%) Cotton seeds (3.23%) White sugar (3.12%)
Sugar (44.86%) Raw oil (16.40%) Cotton (14.84%) Benzene (10.7%) Diesel (3.27%) Fuel oil (2.61%)
Sources: Chilean Official Trade Statistics
54 C. Contreras, El Aprendizaje del Capitalismo: Estudios de Historia Económica y Social del Perú Republicano, vol. 37, Instituto de Estudios Peruanos, 2004. 55 Mar Rubio et al., Energy as an Indicator of Modernization in Latin America, 1890–1925, The Economic History Review 63, no. 3 (2010).
24
Cloth exports from Brazil and Argentina to Chile are clearly a new trade feature.
However, neither the magnitude nor sustainability of this trade were high enough to
consider that it represented a new pattern.
The supply side of the Bolivian case does not provide us with any new information:
Bolivian intraregional exports were minimal and almost constant throughout the
interwar period. In contrast, the relevance of intraregional imports makes Bolivia
interesting as a case study. In this context, imports from Brazil were the most
diversified (see Table 4), but only made up a very small percentage of total trade with
Bolivia (3.5% in 1917; 1.07% in 1927; 0.7% in 1931; 9.05% in 1945; 2.07% in 1950).
The only exception was the Second World War, when Brazil exported some
manufactures (wool cloth, rubber tires and sugar). However, once the Second World
War had ended, these flows returned to their previous low levels.
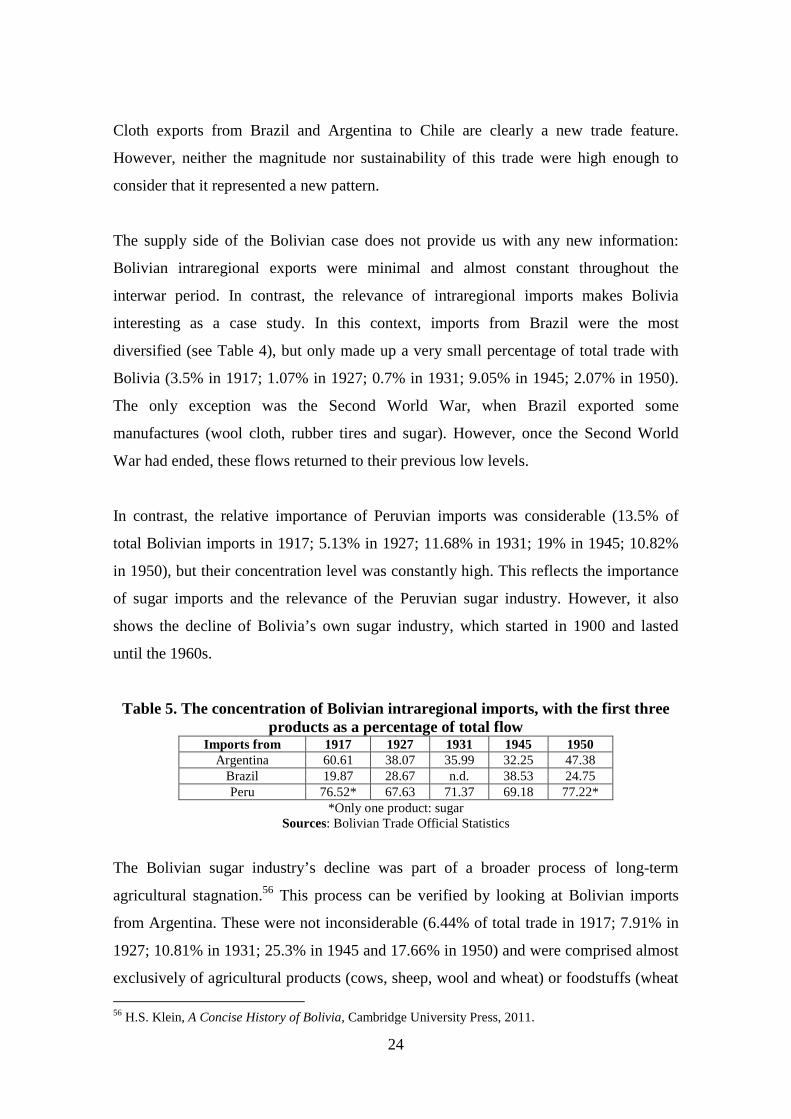
In contrast, the relative importance of Peruvian imports was considerable (13.5% of
total Bolivian imports in 1917; 5.13% in 1927; 11.68% in 1931; 19% in 1945; 10.82%
in 1950), but their concentration level was constantly high. This reflects the importance
of sugar imports and the relevance of the Peruvian sugar industry. However, it also
shows the decline of Bolivia’s own sugar industry, which started in 1900 and lasted
until the 1960s.
Table 5. The concentration of Bolivian intraregional imports, with the first three products as a percentage of total flow
Imports from 1917 1927 1931 1945 1950 Argentina 60.61 38.07 35.99 32.25 47.38
Brazil 19.87 28.67 n.d. 38.53 24.75 Peru 76.52* 67.63 71.37 69.18 77.22*
*Only one product: sugar Sources: Bolivian Trade Official Statistics
The Bolivian sugar industry’s decline was part of a broader process of long-term
agricultural stagnation.56 This process can be verified by looking at Bolivian imports
from Argentina. These were not inconsiderable (6.44% of total trade in 1917; 7.91% in
1927; 10.81% in 1931; 25.3% in 1945 and 17.66% in 1950) and were comprised almost
exclusively of agricultural products (cows, sheep, wool and wheat) or foodstuffs (wheat
56 H.S. Klein, A Concise History of Bolivia, Cambridge University Press, 2011.
25
flour). In this context, the relevance of Bolivian intraregional trade does not necessarily
prove a new trade pattern. In fact, it is probably a better indicator of the Bolivian
economy’s limitations. Specifically, it indicates some kind of Dutch Disease in terms of
agricultural production, i.e. the use of tin profits to buy foodstuffs in foreign markets.
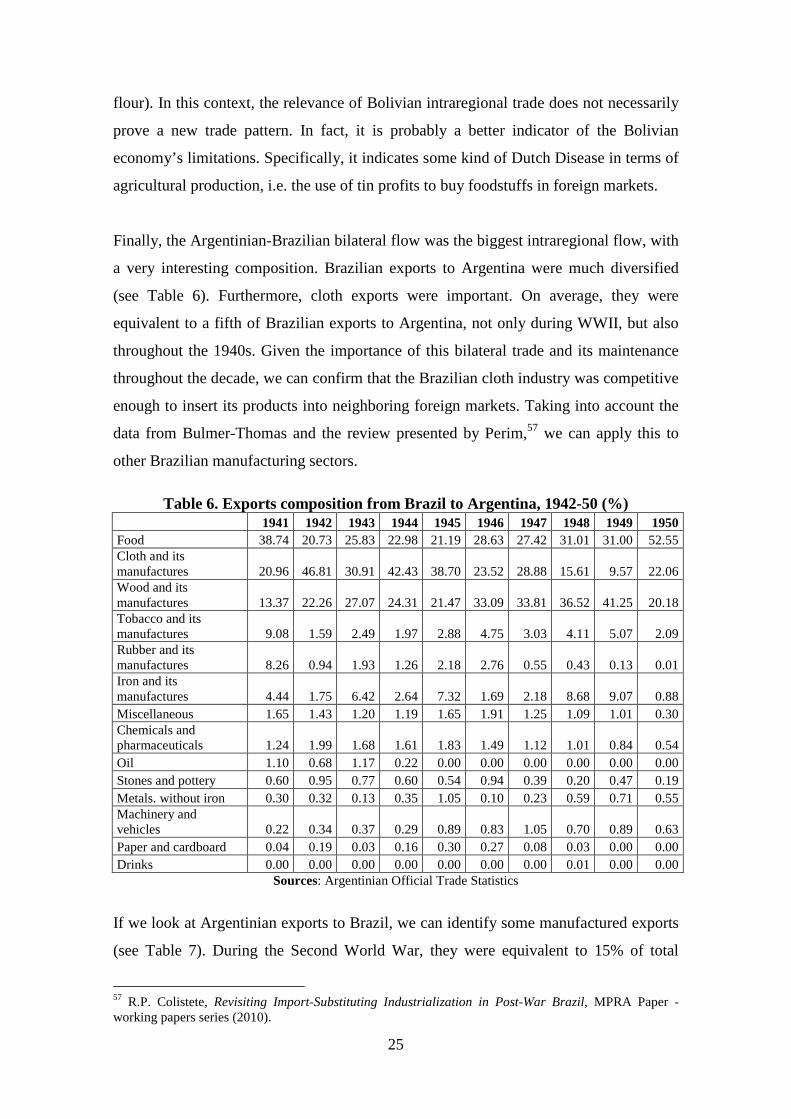
Finally, the Argentinian-Brazilian bilateral flow was the biggest intraregional flow, with
a very interesting composition. Brazilian exports to Argentina were much diversified
(see Table 6). Furthermore, cloth exports were important. On average, they were
equivalent to a fifth of Brazilian exports to Argentina, not only during WWII, but also
throughout the 1940s. Given the importance of this bilateral trade and its maintenance
throughout the decade, we can confirm that the Brazilian cloth industry was competitive
enough to insert its products into neighboring foreign markets. Taking into account the
data from Bulmer-Thomas and the review presented by Perim,57 we can apply this to
other Brazilian manufacturing sectors.
Table 6. Exports composition from Brazil to Argentina, 1942-50 (%)
1941 1942 1943 1944 1945 1946 1947 1948 1949 1950 Food 38.74 20.73 25.83 22.98 21.19 28.63 27.42 31.01 31.00 52.55 Cloth and its manufactures 20.96 46.81 30.91 42.43 38.70 23.52 28.88 15.61 9.57 22.06 Wood and its manufactures 13.37 22.26 27.07 24.31 21.47 33.09 33.81 36.52 41.25 20.18 Tobacco and its manufactures 9.08 1.59 2.49 1.97 2.88 4.75 3.03 4.11 5.07 2.09 Rubber and its manufactures 8.26 0.94 1.93 1.26 2.18 2.76 0.55 0.43 0.13 0.01 Iron and its manufactures 4.44 1.75 6.42 2.64 7.32 1.69 2.18 8.68 9.07 0.88 Miscellaneous 1.65 1.43 1.20 1.19 1.65 1.91 1.25 1.09 1.01 0.30 Chemicals and pharmaceuticals 1.24 1.99 1.68 1.61 1.83 1.49 1.12 1.01 0.84 0.54 Oil 1.10 0.68 1.17 0.22 0.00 0.00 0.00 0.00 0.00 0.00 Stones and pottery 0.60 0.95 0.77 0.60 0.54 0.94 0.39 0.20 0.47 0.19 Metals. without iron 0.30 0.32 0.13 0.35 1.05 0.10 0.23 0.59 0.71 0.55 Machinery and vehicles 0.22 0.34 0.37 0.29 0.89 0.83 1.05 0.70 0.89 0.63 Paper and cardboard 0.04 0.19 0.03 0.16 0.30 0.27 0.08 0.03 0.00 0.00 Drinks 0.00 0.00 0.00 0.00 0.00 0.00 0.00 0.01 0.00 0.00
Sources: Argentinian Official Trade Statistics
If we look at Argentinian exports to Brazil, we can identify some manufactured exports
(see Table 7). During the Second World War, they were equivalent to 15% of total
57 R.P. Colistete, Revisiting Import-Substituting Industrialization in Post-War Brazil, MPRA Paper - working papers series (2010).

26
Argentinian exports to Brazil. However, in contrast with the Brazilian case, they were
not maintained throughout the decade. Hence, in general terms, agricultural exports
were still by far the most important export from Argentina to Brazil.
Table 7. Composition of exports from Argentina to Brazil, 1942-50 (%)
1941 1942 1943 1944 1945 1946 1947 1948 1949 1950 Agriculture 84.45 78.83 70.14 70.27 79.38 57.34 89.80 93.17 93.77 83.65 Manufactures 12.88 15.52 12.77 10.47 10.03 31.18 5.97 3.27 2.60 11.39 Livestock 2.04 4.89 10.84 16.67 8.59 8.17 3.25 3.01 3.35 4.54 Mining 0.47 0.47 3.47 1.91 0.72 0.70 0.12 0.12 0.06 0.16 Forest 0.14 0.11 1.34 0.25 0.88 1.31 0.46 0.12 0.04 0.07 Hunting and fishing 0.03 0.18 1.45 0.43 0.41 1.30 0.40 0.31 0.18 0.17
Sources: Argentinian Official Trade Statistics
In sum, beyond some specific periods and some specific flows, it is difficult to say that
the nature of intraregional trade changed during the interwar period. The Second World
War years were the most important period in terms of new intraregional trade. However,
most of the flows were not sustainable. The only major exception was Brazil. Our data
as well as the historiographical evidence suggest that Brazil’s manufacturing sector was
able to introduce cloth products in foreign markets and to compete with US or European
manufactures beyond the extraordinary conditions of the World War years. Exports
from Peru could also be qualified as more complex. Peru’s oil exports could help to
foster economic modernization and economic growth in some South American
countries. Although sugar is clearly manufactured, its low value added nature and long-
term historic precedents prevent us from qualify this flow as really new.
The Argentinean and Chilean cases show a clear predominance of raw mining and
agricultural exports. This is surprising, given the last reappraisal of the Argentinean
manufactured sector. Finally, Bolivia emerges as an important case of intraregional
trade. However, it is mainly relevant as a result of its economic weakness and
dependence. Hence, in general terms, South American intraregional trade during the
interwar period was, if not always highly concentrated, at least based mainly on
traditional products that have been exchanged since colonial times or low value added
products such as raw mining and agricultural products. This was similar to total trade
during the same period. Could intraregional trade have changed this pattern at some
point? This question is still open today, as intraregional trade in the region is being
driven by raw materials and commodity exports to the growing Asian foreign markets.
27
Conclusions
The annual report of the commercial situation of Latin America and the Caribbean
carried out by ECLAC for 201058 indicates a remarkable recovery in regional trade,
driven by the growing demand for raw materials and natural resources in the Asian
market. However, ECLAC points out that low intraregional trade has been one of the
main obstacles to the development of the region, as it could increase the added value of
South American exports. Our paper makes two important contributions to this issue.
First, the limited role of intraregional trade in Latin America is also observed during the
interwar years, and only increased during the exceptional WWI and WWII years.
However, this apparent opportunity to change the region's trade composition and
diversify the growth model is only a mirage that is broken by a detailed analysis of the
nature of exchanged products with higher levels of disaggregation. The only exception
is the Brazilian textile industry, which represented a significant percentage of
intraregional trade. For all the other countries analyzed, tradable products were strongly
dependent on natural resources. The limited capacity of South American countries to
increase the weight of manufacturing in its export structure seems to have continued
over time. This long-term overview of the development of intraregional trade in South
America may help us to understand the persistent weaknesses of commercial integration
in the region.
58 CEPAL / ECLAC, Estudio Económico de América Latina y el Caribe 2010-2011, División De Desarrollo Económico, CEPAL, 2011.
28
Bibliography Albert, B., South America and the First World War: The Impact of the War on Brazil,
Argentina, Peru and Chile. Vol. 6, Cambridge Latin American Studies, 1988). Assadourian, C. S., El Sistema De La Economia Colonial : El Mercado Interior,
Regiones Y Espacio Economico., Serie Estudios Históricos // Instituto De Estudios Peruanos. (Peru, 1982).
Bulmer-Thomas, V. 'Regional Integration in Latin America before the Debt Crisis: Lafta, Cacm and the Andean Pact', in A. M. El-Agraa ed., Economic Integration Worldwide, (London, 1997), pp. 253-277.
———. 'Debate: Regional Integration in the Latin America and the Caribbean', Bulletin of Latin American Research 20, no. 3 (2001), pp. 360-369.
———, The Economic History of Latin America since Independence (Cambrige, UK, 2003).
Bértola, L. and Gerchunoff, P., Institucionalidad Y Desarrollo Económico En América Latina. 433 vols, Documentos De Proyectos, 2011).
Bértola, L. and Ocampo, J. A., Desarrollo, Vaivenes Y Desigualdad. Una Historia Económica De América Latina Desde La Independencia. (Madrid, Espanya., 2010).
Bértola, L. and Williamson, J. G. 'Globalization in Latin America before 1940', in V. Bulmer-Thomas, J. H. Coatsworth and R. Cortés Conde eds., The Cambridge Economic History of Latin America: The Long Twentieth Century, 2006).
Calderón, C., Chong, A. and Stein, E. 'Trade Intensity and Business Cycle Synchronization: Are Developing Countries Any Different?', Journal of International Economics 71, no. 1 (2007), pp. 2-21.
Cardenas, E., Ocampo, J. A. and Thorp, R., An Economic History of Twentieth-Century Latin America. 3. Industrialization and the State in Latin America: The Postwar Years. Vol. 3 (New York, 2000).
Carreras-Marín, A. and Badia-Miró, M. 'La Fiabilidad De La Asignación Geográfica En Las Estadísticas De Comercio Exterior: América Latina Y El Caribe (1908–1930)', Revista de Historia Económica (Second Series) 26, no. 03 (2008), pp. 355-373.
CEPAL, Latin America and the Caribbean in the World Economy 2009 - 2010. A Crisis Generated in the Centre and a Recovery Driven by the Emerging Economies (Santiago de Chile, Chile., 2010).
Colistete, R. P. 'Revisiting Import-Substituting Industrialization in Post-War Brazil', MPRA Paper - working papers series (2010).
Contreras, C., El Aprendizaje Del Capitalismo: Estudios De Historia Económica Y Social Del Perú Republicano. Vol. 37, 2004).
Ducoing, C., Yañez, C. and Jofré, J. 'La Industrialización Por Sustitución De Importaciones Y La Frustración De La Modernización Económica. Chile 1880 – 2000', in, CLADHE II, (México DF.; México, 2010).
ECLAC, C., Estudio Económico De América Latina Y El Caribe 2010-2011, División De Desarrollo Económico, Cepal, 2011).
Federico, G. and Tena, A. 'On the Accuracy of Foreign Trade Statistics (1909-1935): Morgenstern Revisited', Explorations in Economic History 28, no. 3 (1991), pp. 259-273.
Haber, S. 'The Political Economy of Latin American Industrialization', in V. Bulmer-Thomas, J. Coatsworth and R. Cortes Conde eds., The Cambridge Economic
29
History of Latin America: Volume 2, the Long Twentieth Century, 2006), pp. 537-584.
Hanes, C. 'Wholesale and Producer Price Indexes', in S. B. Carter ed., Historical Statistics of the United States: Earliest Times to the Present, (New York, 2006).
Klein, H. S., A Concise History of Bolivia, 2011). Langer, E. D. and Conti, V. E. 'Circuitos Comerciales Tradicionales Y Cambio
Económico En Los Andes Centromeridionales (1830-1930)', Desarrollo económico 31, no. 121 (1991), pp. 91-111.
Maizels, A., Industrial Growth and World Trade: An Empirical Study of Trends in Production, Consumption and Trade in Manufactures from 1899-1959, with a Discussion of Probable Future Trends. 21 vols, Economic and Social Studies, 1965).
Mitchell, B. R., International Historical Statistics : The Americas, 1750-2005 (New York, 6th edn, 2007).
Mitre, A., El Monedero De Los Andes: Región Económica Y Moneda Boliviana En El Siglo Xix, 1986).
MOXLAD. 2011. Montevideo - Oxford Latin American Economic History Database (Moxlad). In, http://oxlad.qeh.ox.ac.uk/. (accessed.
Ocampo, J. A. 'La América Latina Y La Economía Mundial En El Largo Siglo Xx', El Trimestre Económico 71, no. 284 (2004), pp. 725-786.
Ocampo, J. A. and Parra, M. 'Los Términos De Intercambio De Los Productos Básicos En El Siglo Xx', Revista de la CEPAL 79 (2003).
Ocampo, J. A. and Parra-Lancourt, M. 'The Terms of Trade for Commodities since the Mid-19th Century', Revista de Historia Económica / Journal of Iberian and Latin American Economic History (Second Series) 28 (2010), pp. 11-43.
Palma, J. G. 'Growth and Structure of Chilean Manufacturing Industry from 1830 to 1935', University of Oxford, 1979).
Peres Cajías, J., Badia-Miró, M. and Carreras-Marín, A. 'Comercio Intraregional En La América Latina De Entreguerras. ¿Una Oportunidad Perdida? Los Casos De Argentina, Bolivia, Brasil, Chile Y Perú', in, X Congreso Internacional de la AEHE. Sesión 15: América Latina ante la globalización., (Carmona, España., 2011).
———. 'Regional Trade Integration in Latin America between the World Wars: A Missed Opportunity?', in, European Historical Economics Society Conference, (Dublin, Ireland., 2011).
Rubio, M., Yáñez, C., Folchi, M. and Carreras, A. 'Energy as an Indicator of Modernization in Latin America, 1890–1925', The Economic History Review 63, no. 3 (2010), pp. 769-804.
Tena, A. 'Las Estadísticas Históricas Del Comercio Internacional (1890-1960): Fiabilidad Y Comparabilidad', Universidad de Alcalá de Henares, 1991).
———. 'Las Estadísticas Históricas Del Comercio Internacional: Fiabilidad Y Comparabilidad', Servicio de Estudios.Estudios de Historia Económica.Banco de España 24 (1992).
Tena-Junguito, A. and Willebald, H. 'What Do We Know About the International Trade Integration of the American Continent between 1820 and 1940?', in, CLADHE II , (México DF, México., 2010).
Thorp, R., Latin America in the 1930s: The Role of the Periphery in World Crisis, 1984).
Thorp, R. and Bertram, G., Peru 1890 - 1977. Growth and Policy in an Open Economy, 1978).

30
Williamson, J. G. 'Industrial Catching up in the Poor Periphery 1870-1975', NBER - Working Papers series 16809 (2011).
———. 'When, Where, and Why? Early Industrialization in the Poor Periphery 1870-1940', NBER Working paper series 16344 (2011).


![Facultat de Matem atiques i Inform atica Facultat d’Economia i …diposit.ub.edu/dspace/bitstream/2445/125728/2/memoria.pdf · Biograf a [22] John Forbes Nash naci o el 13 de Junio](https://img.pdfslide.net/doc/110x75/5fade54d9603b01eb0049618/facultat-de-matem-atiques-i-inform-atica-facultat-daeconomia-i-biograf-a-22.jpg)