Embed Size (px)
Citation preview

1 | Bioenergy Technologies Office
Waste-To-Energy Techno-Economic Analysis and Life-Cycle Analysis
March 24, 2015 Conversion
Ling Tao†, Jeongwoo Han* †National Renewable Energy Laboratory *Argonne National Laboratory
DOE Bioenergy Technologies Office (BETO) 2015 Project Peer Review
2 | Bioenergy Technologies Office
Goal Statement
• Conduct the techno-economic analysis (TEA) and life-cycle analysis (LCA) of Waste-To-Energy (WTE) pathways to evaluate their economic viability and environmental sustainability
– Strategic selection of pathway technologies and process alternatives (MSW, biosolids from WWTPs)
– Transparent TEA and LCA addressing uncertainties and variations in other studies
• Interactions with and outreach to WTE stakeholders – Generate TEA and LCA results to agencies, technology developers, and
other stakeholders to help identify research, development, and deployment opportunities
– Interact with researchers and industries to examine critical issues affecting WTE TEA and LCA results
– Provide TEA and LCA tools to the WTE community

3 | Bioenergy Technologies Office
Quad Chart Overview
• Started: January 2014 • End: Determined by BETO • 60% complete
• Barriers addressed – At-A: Comparable, Transparent, and
Reproducible Analyses – At-C: Data Availability across the
Supply Chain – Bt-K: Biological process integration – Bt-B: Biomass variation
Timeline
Budget
Barriers
• Partners o PNNL
• Outreach o Industry stakeholders (e.g., local
wastewater treatment plants operators)
o Research institutions and NGOs
Partners Total Costs FY 10 –FY 12
FY 13 Costs
FY 14 Costs Total Planned Funding (FY 15-Project End Date)
DOE Funded (NREL)
- - $250k $200k
DOE Funded (ANL)
- - $250k $150k

4 | Bioenergy Technologies Office
1. Project Overview • Waste is an emerging biomass resource
– WTE mitigates methane emissions from current waste treatment processes while recovering energy and producing fuels
– WTE can utilize existing collection/treatment infrastructure – Most of D3 RINs have been from biogas since EPA allowed it
• For high-impact, widespread deployment of WTE pathways, the development of alternative fuels with higher values than biogas, compatible with the current infrastructure, is essential – Economic and environmental benefits have yet to be addressed
• Transparent TEA and LCA will evaluate economic viability and environmental sustainability of alternative WTE pathways. – Strategically structure sensitivity and uncertainty analysis for data gaps
• Interact with stakeholders (researchers, agencies, industries) – Investigate potentials for improving both cost and sustainability by exploring
process alternatives, integration, and optimizations

5 | Bioenergy Technologies Office
2. WTE TEA and LCA Approach – Resource Assessment
• MSW and biosolids have potential to produce about 590 TBtu (equivalent to 5 billion gallons of gasoline) per year • 1/3 of current biofuel production or 1/7 of 2022 biofuel mandates by EISA
• Plant size assumptions MSW: 2,000 dry tonnes/day estimated on the basis of EPA and BioCycle
Biosolids: 500 dry tonnes/day estimated on the basis of EPA
– Key assumptions from literature: Sludge generation, and total and volatile
• Analyze application potentials of WTE technologies to existing facilities
6 | Bioenergy Technologies Office
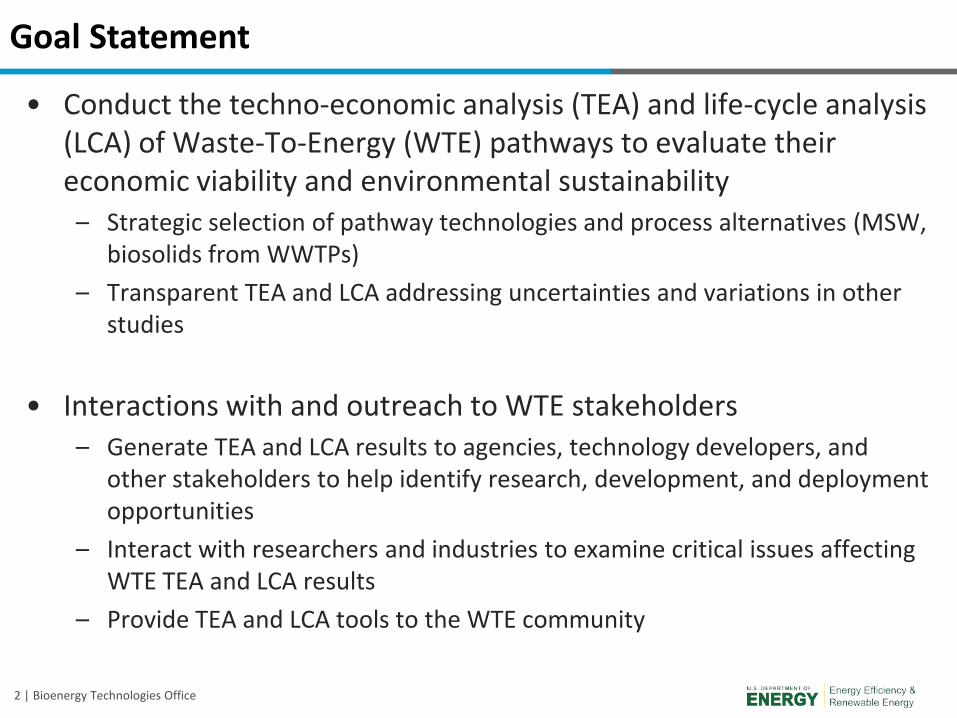
WTE LCA Technical Approach: System Boundary and Critical Issues
MSW/Wastewater Generation
MSW/Wastewater Collection/Transport
Sorting, Treatment and Preprocessing
MSW/Biosolid WTE
Recycled MSW/ Water discharge
System 1
System 2
System 3
Fuel Transportation
Fuel Combustion in End Use
Co-products
• System boundary: 3 cases
• Tracking carbon’s fate 1. Emissions from all carbon in waste
are treated as net zero CO2 emissions
2. Emissions from only carbon in biodegradable material are treated as net zero CO2 emissions
• Co-product methods in LCA – Allocation: mass, volume, market-
value – Displacement
• Data quality – Based on TEA results and a literature
review – Regional variations in collection
energy consumption, feedstock quality, etc.

7 | Bioenergy Technologies Office
WTE TEA Technical Approach
Feedstock Composition Operating Conditions
Conversion Yields
Process Model in Aspen Plus
Flow rates
Equipment Sizing/Costing and Raw Material
Accounting
Biogas Yield
Cost $ MMBTU
MGSP Minimum Biogas
Selling Price
TEA Approach • Modeling is rigorous and detailed with transparent assumptions • Discounted cash-flow rate of return on investment, equity payback, and taxes • Provide strategic, comparative cost analysis for various conversion technologies • Iterative analysis process among R&D, DOE goals, industry, LCA on key
technology targets
$(0.30) $(0.20) $(0.10) $- $0.10 $0.20 $0.30
PT xylan to furfural 3:5:8%
PT temperature 150:158:170C
PT % solids 40:30:25%
PT glucan to glucose 12:10:6%
FERM time 1:1.5:3 d
EH time 2:3.5:5 d
FERM arabinose to ethanol 85:85:0%
PT xylan to xylose 92:90:80%
FERM xylose to ethanol 90:85:75%
FERM contamination losses 0:3:6%
EH % solids 25:20:17.5%
PT acid loading 10:22:35 mg/g
EH cellulose to glucose 95:90:75%
EH enzyme loading 10:20:30 mg/g
TCI +/-25%
ΔMESP ($/gal)Base case $2.15
(a)

8 | Bioenergy Technologies Office
WTE TEA and LCA Management Approach • Project Management
Routine updates to BETO sponsors Quarterly progress reports and conference calls on an as-needed basis
Biweekly conference calls between the TEA and LCA teams Communication with stakeholders for data availability, representativeness, and reliability
• Challenges Large data sets in literatures and various WTE conversion pathways Provide credible and reliable TEA and LCA information to support decision-making at different level
• Critical Success Factors Collaboration and communications with industries to enhance credibility and quality Collaborative and iterative approach among R&D, DOE goals and existing industries using TEA and
LCA to evaluate the technologies strategic and to compare various pathways Provide strategic and comparative cost analysis for various conversion technologies
Conceptual Process Design
Environmental / Sustainability Analysis
R&D & Industrial Data
DOE Goals
Economic Analysis

9 | Bioenergy Technologies Office
3. WTE TEA and LCA: Accomplishment
• Performed resource assessment on municipal solid waste (MSW) and biosolids from WWTPs
• Established four TEA baseline models (2 feedstocks x 2 processes) – Hydrothermal liquefaction (HTL) – Anaerobic digestion (AD)
• Conducted LCA for the four WTE pathways
• Performed sensitivity and uncertainty analysis that has identified: – Plant scale impacts cost significantly so additional resource analysis is
necessary for WTE – Biogas yield for anaerobic digestion is key cost driver for improving biogas
selling prices – Case scenarios analysis implies various potentials of expanding existing
WWTP with AD with combination of pretreatment technologies to enhance yield and cost

10 | Bioenergy Technologies Office
WTE TEA: Biosolids Anaerobic Digestion (AD) Co-Located with WWTP
Pre-Dewatering
Mesophilic Digestion
35 ͦC HRT 20 days VS Loading 2.7 kg/m3/day Biogas 0.27 CH4 /kg VS
Gas Cleanup
Thermal Hydrolysis
165 ͦC, 20 min
Residual Solids 10,580 kg/h 90 MMBTU/h
Offgas (CO2, Sulfur) 3,094 kg/h 824 kg C/h
WWTP Biosolids 260,417 kg/h (92% water) 7,424 kg C/h 315 MMBTU/h
Biogas 6,395 kg/h 3,350 kg C/h 161 MMBTU/h
Liquid Fertilizer 125,140 kg/h (96.1% water) 954 kg C/h 49 MMBTU/h
Steam
Purchased Electricity 15 MMBTU/h
1 MMBTU/h
4 MMBTU/h
5 MMBTU/h
Total Heat Loss 7 MMBTU/h
Waste Water 161,055 kg/h (99.7% water) 205 kg C/h 8 MMBTU/h
WWTP
Purchased heat 62 MMBTU/h
Biogas Carbon
Efficiency 31-45% Energy
Efficiency 28-41%
5 MMBTU/h
• Co-location with 300 MGD WWTP with 500 dry ton per day biosolids • Biosolids is reduced 55% (dry basis) by AD coupled with thermal hydrolysis, and
cost can be further reduced if credit residual solids as EPA class A biosolids.
Biosolids AD process is presented as an example

11 | Bioenergy Technologies Office
WTE TEA: Biosolids AD Co-Located with WWTP without Thermal Hydrolysis
Mesophilic Digestion
35 ͦC HRT 25 days VS Loading 1.0 kg/m3/day Biogas 0.19 CH4 /kg VS
Gas Cleanup
Residual Solids 13,272 kg/h 3,055 kg C/h 131 MMBTU/h
Offgas (CO2, Sulfur) 2,128 kg/h 574 kg C/h
WWTP Biosolids 260,417 kg/h (92% water) 7,424 kg C/h 315 MMBTU/h
Biogas 4,504 kg/h 2,374 kg C/h 115 MMBTU/h
Liquid Fertilizer 240,181 kg/h (96.1% water) 1,324 kg C/h 62 MMBTU/h
3 MMBTU/h
Heat Loss 9 MMBTU/h
WWTP
Purchased Electricity 7 MMBTU/h
4 MMBTU/h
Purchased heat 9 MMBTU/h
Biogas Carbon
Efficiency 22-32% Energy
Efficiency 23-35%
• Biosolids is reduced 48% by AD. • Residual solids cannot be classified as EPA class A biosolids, so still need to be
landfilled with additional cost.

12 | Bioenergy Technologies Office
WTE TEA: Sensitivity analysis
Single point sensitivity analysis
• Identify key cost drivers
• Plant scale, capital expense and biogas yield have the most impacts on minimum biogas selling price
Economies of scale • Clear impact of
economies of scale until 700 – 800 dry metric tonnes per day where the cost begins to level off

13 | Bioenergy Technologies Office
WTE LCA: WTW GHG emissions are reduced by 77 – 97% relative to petroleum gasoline
• Major GHG emissions sources Biosolid AD: Electricity consumptions; Biosolid HTL: Process CH4 emissions
• HTL pathways have large GHG emissions credits from carbon in char • The remaining three pathways are also presented in addition to the example TEA pathway
(biosolids-AD) for comparison

14 | Bioenergy Technologies Office
WTE LCA: WTW GHG emissions are sensitive to LCA methodology rather than parametric assumptions

15 | Bioenergy Technologies Office
• WTE is an emerging technology area of national and BETO’s interest Mitigate CH4 emissions from current waste treatment while recovering energy Utilize existing collection/treatment infrastructure “Urban resource”: Short transportation and distribution if any Potential 5 billion gasoline equivalent gallons can fill a gap of the current BETO portfolio
(1/3 of current biofuel production or 1/7 of 2022 biofuel mandates by EISA) WTE (especially biogas) has a significant near-term market entry opportunity in the U.S.
as EPA allows RINs for WTE biogas
• Transparent WTE TEA and LCA can provide economic viability and environmental sustainability criteria, supporting decision-making at different levels (e.g., BETO, federal and state governments, industry, etc.) Investigate benefits from alternative pathways for high-impact transportation fuels Examine possibility to integrate waste feedstock with biomass Identify key drivers for TEA and LCA results
• Open, transparent TEA/LCA models from this task support BETO’s mission Provide consistent, reliable data across WTE pathways Help BETO communicate the benefits of WTE pathways with various stakeholders
4. Relevance of WTE TEA and LCA

16 | Bioenergy Technologies Office
5. Future Work • Investigate key TEA parameters
Calibrate TEA baselines with real-world examples Establish reasonable cost ranges due to uncertainties in the data available for WTE,
making it difficult to support a single economic target/potential Expand and enhance applications of studied process technologies to existing facilities
• Investigate key LCA assumptions/methodologies Fate of carbon in waste material Analysis on benefits/burdens of diverting waste from additional treatment, otherwise
necessary (e.g., landfill, incineration, etc.) CH4 emissions in AD
• Examine additional process alternatives to increase value proposition Upgrading process to transportation fuels, electricity or bio-products Process intensification or process optimization
• Produce updated TEA and LCA tools/results and peer review publications and communicate them with stakeholders Set as basis for R&D efforts with areas of great potentials Help DOE and industry in identifying near-term R&D opportunities, medium-term
economic and sustainability targets, and long-term market penetration goals

17 | Bioenergy Technologies Office
Summary • WTE technologies such as AD have significant near-term market entry
opportunity to deploy in the U.S. (e.g., biogas with D3 RIN)
• Established four TEA models (2 feedstocks x 2 processes) In addition to setup baseline models, performed sensitivity and uncertainty
analysis Established AD biosolids process alternatives under collaborative efforts with
LCA, DOE and inputs from industrial partners
• LCA showed that WTE pathways reduce WTW GHG emissions by 77 – 97% relative to petroleum gasoline WTW GHG emissions are sensitive to LCA methods Calibrated TEA results would provide more reliable, precise LCA results
• Outstanding TEA and LCA issues and additional process alternatives have yet to be fully investigated

18 | Bioenergy Technologies Office
Additional Slides

19 | Bioenergy Technologies Office
Acronym List
AD Anaerobic Digestion D3 RIN Cellulosic Biofuel EISA Energy Independence and
Security Act EPA Environmental Protection
Agency GHG Greenhouse Gas GREET Greenhouse Gases, Regulated
Emissions, and Energy Use in Transportation
HTL Hydrothermal Liquefaction LCA Life-Cycle Analysis MESP Minimum Energy Selling Price MGD Million Gallons per Day MGSP Minimum Biogas Selling Price
MSW Municipal Solid Waste RIN Renewable Identification
Number TEA Techno-Economic Analysis VS Volatile solid WTE Waste-To-Energy WTP Well-to-Pump WTW Well-to-Wheels WWTP Wastewater Treatment Plant

20 | Bioenergy Technologies Office
Quad Chart Overview (NREL)
• Started: January 2014 • End: Determined by BETO • 60% complete
• Barriers addressed – At-A: Lack of comparable, transparent, and
reproducible data – At-C: Inaccessibility and unavailability of
data – Bt-K: Biological Process Integration
Timeline
Budget
Barriers
• Partners o NREL (50%); ANL (50%)
• In-kind o Industry stakeholders (e.g., local
wastewater treatment plants operators)
o Research institutions and NGOs
Partners Total Costs FY 10 –FY 12
FY 13 Costs
FY 14 Costs Total Planned Funding (FY 15-Project End Date
DOE Funded - - $250k $200k

21 | Bioenergy Technologies Office
Quad Chart Overview (ANL)
• Started: January 2014 • End: Determined by BETO • 60% complete
• Barriers addressed – At-A: Lack of comparable, transparent, and
reproducible data – At-C: Inaccessibility and unavailability of
data
Timeline
Budget
Barriers
• Partners o NREL (50%); ANL (50%)
• In-kind o Industry stakeholders (e.g., local
wastewater treatment plants operators)
o Research institutions and NGOs
Partners Total Costs FY 10 –FY 12
FY 13 Costs
FY 14 Costs Total Planned Funding (FY 15-Project End Date
DOE Funded - - $250k $150k

22 | Bioenergy Technologies Office
Tracking Carbon’s Fate
22
• Low Bookend: All carbon emissions derived from waste feedstock are treated as net zero CO2 emissions
• High Bookend: Carbon emissions derived from only biodegradable materials are treated as net zero CO2 emissions – Carbon in non-biodegradable materials would stay in the form for a long
period of time if have not processed/combusted, which would release carbon much earlier.
– Thus, carbon emissions derived from only biodegradable materials are treated as net zero CO2 emissions
– Waste components in MSW • Biodegradable: Paper, textile, wood and other organics • Non-biodegradable: Glass, metal, plastics, leather/rubber and other materials
– All biosolids is assumed biodegradable.

23 | Bioenergy Technologies Office
MSW LCA System Boundary
MSW Generation
MSW Collection/Transport
MSW Sorting and Preprocessing
WTE
Recycled MSW
44% by wet tonne
56% by wet tonne
Electricity: 0.17 mmBtu/wet ton
Sulfuric Acid, Lime (for AD) Hydrogen, NG (for HTL)
Main Product: Biogas by AD
Hydrocarbon Fuel by HTL
Liquid Fertilizer (Displacing N Fertilizer) by AD Electricity
(Co-product)
Ash (Carbon Sequestration) by AD
Light Gases & Fuel Oil (Co-product) by HTL
Char (Carbon Sequestration) by HTL
Loading/Unloading1: 0.09 gal diesel/wet ton
(0.04 – 0.14)
Idling2: 0.16 gal diesel/wet ton
US DOT, 2009
• 1. Kosmicki, B., 1997. Transfer station process model. RTI International, Research Triangle Park, NC. • 2. RTI International, 2012. Municipal Solid Waste - Decision Support Tool [WWW Document].
URL https://mswdst.rti.org/ (accessed 6.30.14)

24 | Bioenergy Technologies Office
WWTP Biosolids LCA System Boundary
Wastewater Generation
Wastewater Collection/Pumping
Wastewater Treatment
WTE
Water Discharge
98.5% by wet tonne
1.5% by wet tonne
Electricity3: 1,250 kWh/MG (1,025 – 1,588)
Ammonia, Lime, Electricity for AD Hydrogen, Electricity for HTL
Main Product: Biogas by AD
Hydrocarbon Fuel by HTL
Information is not available.
Liquid Fertilizer (Displacing N Fertilizer) by AD
Ash (Carbon Sequestration) by AD
Light Gases & Fuel Oil (Co-product) by HTL
Char (Carbon Sequestration) by HTL
• 3. WEF, 2009. Energy Conservation in Water and Wastewater Facilities - MOP 32, 1 edition. ed. McGraw-Hill Professional, Alexandria, VA : New York

25 | Bioenergy Technologies Office
Anaerobic Digestion (AD)
25
Unit (Per mmBtu of Biogas)
MSW Biosolids (High yield)
Biosolids (Low yield)
Inputs Feedstock dry tonne 0.21 0.15 0.22
Sulfuric Acid kg 5.6 Lime kg 0.2 0.05 0.104
Electricity mmBtu 0.125 0.049 Outputs
Biogas mmBtu 1 1 1 Electricity (Excess) mmBtu 0.666‡
Liquid Fertilzer† wet tonne 0.26 0.05 0.07 Ash kg 2.6 41 61
Process Emissions CO g 20 7 10
NOx g 20 7 10 SOx g 12 3 6
† 0.1 – 0.2% of N contents ‡ Including the electricity used in the MSW sorting and preprocessing step

26 | Bioenergy Technologies Office
Hydrothermal Liquefaction (HTL)
26
Unit (Per mmBtu of hydrocarbon fuel,
light gases and fuel oil)
MSW Biosolids
Inputs Feedstock dry tonne 0.08 0.10 Hydrogen mmBtu 0.14 0.16
NG mmBtu 0.033 Electricity mmBtu 0.018
Outputs Hydrocarbon fuel mmBtu 0.747 0.810
Light Gases mmBtu 0.190 0.180 Fuel oil mmBtu 0.063 0.010
Electricity (Excess) mmBtu 0.055‡ Char† kg 3.0 2.3
Process Emissions VOC g 116
CO g 81 0.56 NOx g 14 912 SOx g 5 236 CH4 g 79 586
† With 67 – 68% of carbon contents, 80% of which is sequestrated ‡ Including the electricity used in the MSW sorting and preprocessing step

27 | Bioenergy Technologies Office
Biosolids Feedstock Composition and Characteristics Average Min Max ASPEN MODEL
Basic Characteristics Total Dry Solids (TS) 7.6% 0.8% 23.4% 8.0%
Volatile Solids (% of TS) 61.0% 60.0% 62.0% 61.0% Energy Content (BTU/dry lb) 9,273 6,540 12,500 6851
Component Composition Grease and Fats (% of TS) 17.7% 5.0% 65.0% 17.7%
Protein (% of TS) 29.2% 20.0% 41.0% 29.2% Carbohydrate (% of TS) 9.8% 2.5% 15.0% 11.4%
Ash (% of TS) 39.0% 38.0% 40.0% 39.0% Elemental Composition
Carbon (% of TS) 38.4% 36.0% 42.0% 35.6% Hydrogen (% of TS) 5.4% 4.9% 6.2% 5.0%
Oxygen (% of TS) 11.4% 8.3% 14.5% 14.8% Sulfur (% of TS) 0.4% 0.3% 0.5% 0.4%
Nitrogen (% of TS) 4.2% 3.6% 5.2% 5.2% Ash (% of TS) 39.0% 38.0% 40.0% 39.0%

28 | Bioenergy Technologies Office
MSW Feedstock Composition and Characteristics
Generated Recycled Non-Recycled
Landfilled
EISA MSW
All Convertible
MSW Metal 20 6 14 11 3 3 Glass 12 3 8 7 2 2 Plastics 32 3 29 24 7 24 Paper 69 44 24 20 6 20 Leather 5 0 5 4 4 4 Rubber 3 1 2 1 0 1 Textiles 14 2 12 10 10 10 Wood 16 2 13 11 11 11 Food 36 2 35 28 28 28 Yard Trimmings 34 20 14 12 12 12 Other 11 3 8 7 7 7 Total 325 108 218 179 121 163 Total Organics 98 49 50 41 27 41 Organic% (Paper, Textiles, Wood) 30% 46% 23% 23% 22% 25%
Moisture % 23% 19% 25% 25% 25% 25% Others % 47% 46% 23% 23% 22% 25%

29 | Bioenergy Technologies Office
Thermochemical HTL Pathway for MSW
• S. B. Jones, Y. Zhu, D. B. Anderson, R. Hallen, D. C. Elliott, A. J. Schmidt, et al., "Process Design and Economics for the Conversion of Algal Biomass to Hydrocarbons: Whole Algae Hydrothermal Liquefaction and Upgrading.," Pacific Northwest National Laboratory, Richland, WA PNNL-23227, 2014.
• Y. Zhu, M. J. Biddy, S. B. Jones, D. C. Elliott, and A. J. Schmidt, "Techno-economic analysis of liquid fuel production from woody biomass via hydrothermal liquefaction (HTL) and upgrading," Applied Energy, vol. 129, pp. 384-394, 9/15/ 2014.
• D. C. Elliott, T. R. Hart, A. J. Schmidt, G. G. Neuenschwander, L. J. Rotness, M. V. Olarte, et al., "Process development for hydrothermal liquefaction of algae feedstocks in a continuous-flow reactor," Algal Research, vol. 2, pp. 445-454, 10// 2013.
• J. Akhtar and N. A. S. Amin, "A review on process conditions for optimum bio-oil yield in hydrothermal liquefaction of biomass," Renewable and Sustainable Energy Reviews, vol. 15, pp. 1615-1624, 4// 2011. • S. S. Toor, L. Rosendahl, and A. Rudolf, "Hydrothermal liquefaction of biomass: A review of subcritical water technologies," Energy, vol. 36, pp. 2328-2342, May 2011.
30 | Bioenergy Technologies Office
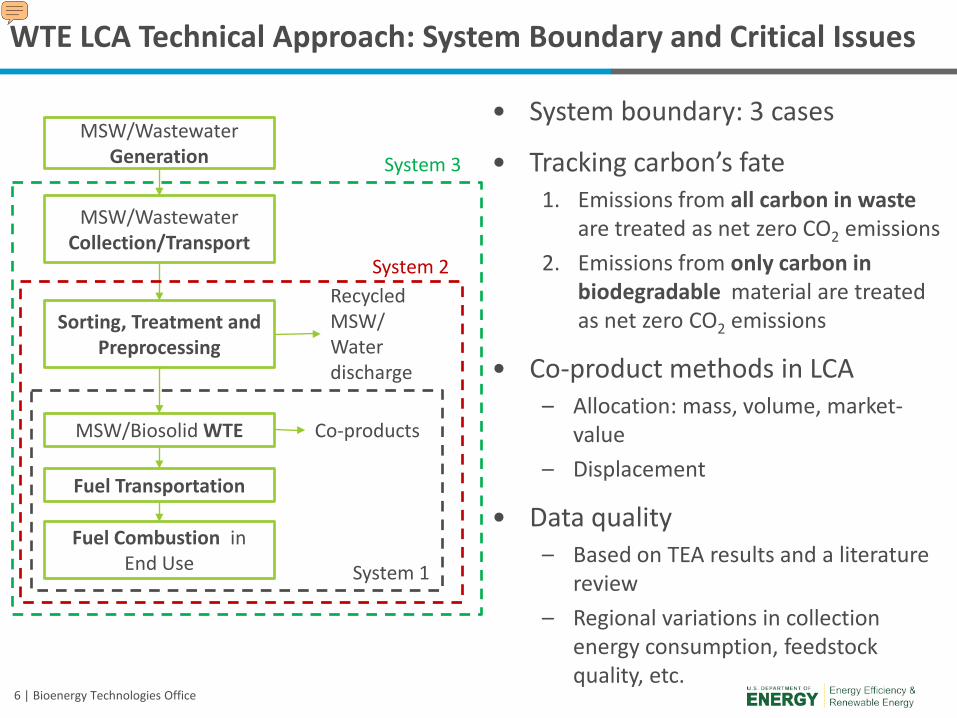
Biological Anaerobic Digestion Pathway for MSW