Embed Size (px)
Citation preview

Critical Materials Assessment
and Early Warning
Paul Telleen
U.S. Department of Energy
Office of Policy and International Affairs
November 13, 2012

Outline
• U.S. Department of Energy Critical Materials
Strategy
• An Approach to Early Warning Assessment
• Conclusions• Conclusions
2

DOE Critical Materials Strategy

Project Scope
Lighting
Vehicles
Solar PV
Wind

Demand Projections: Four Trajectories
Market
Penetration
Material
Intensity
Trajectory D High High
Trajectory C High Low
Trajectory B Low High
Trajectory A Low Low
Material Demand Factors
• Market Penetration = Deployment (total annual units of a clean energy
technology) X Market Share (% of units using materials analyzed)
• Material Intensity = Material demand per unit of the clean energy technology
Trajectory A Low Low

Dysprosium Oxide - Supply and Demand Projections
2011 Critical Materials Strategy
6,000
7,000
8,000
9,000
ton
ne
s/y
r
Dysprosium Oxide Future Supply and Demand2011 Update
Trajectory D
Trajectory C
Trajectory B
Trajectory A
Demand
Short Term Medium Term
6
0
1,000
2,000
3,000
4,000
5,000
2010 2015 2020 2025
ton
ne
s/y
r
Trajectory A
Non-Clean Energy Use
Supply
2015 Estimated Supply
Plus Mount Weld
Plus Mountain Pass Phase I
2010 Supply

• Criticality is a measure that combines
• Importance to clean energy technologies
• Clean Energy Demand (75%); Substitutability
Limitations (25%)
• Risk of supply disruption
• Basic Availability (40%); Competing Technology
DOE Criticality Assessments
• Basic Availability (40%); Competing Technology
Demand (10%); Political, Regulatory and Social
Factors (20%); Co-Dependence on Other Markets
(10%); Producer Diversity (20%)
• Time frames:
• Short-term (Present - 2015)
• Medium-term (2015 - 2025)

2011 Critical Materials Strategy Criticality Matrices
Medium-Term (2015-2025)Short-Term (present-2015)

Short-Term Comparison between 2010 CMS and 2011 CMS

Outline
• U.S. Department of Energy Critical Materials
Strategy
• An Approach to Early Warning Assessment
• Conclusions• Conclusions
10

Critical Material or Mineral -- Definition
• “A material or mineral is critical if it serves an
essential function in the manufacture of a
product – the absence of which would cause
economic or social consequences – and if its economic or social consequences – and if its
supply is vulnerable to disruption.”
-- United States National Science &
Technology Council
11

U.S. Interagency Critical Materials Coordination
White House Office of Science and
Technology Policy (OSTP) convenes three
work groups:
• Criticality Assessment and Early
WarningWarning
• Long Term R&D Options
• Information Transparency

Early Warning
• Why?– Provides for timely policy decisions and research
investments related to critical materials
– Addresses issues early to ensure optimal solutions and help prevent future problems
• What data and analytical characteristics are useful?– Timely data
– Rapid, repeatable preliminary analysis
– Focus on change
– More detailed analysis to understand systems effects
13

An Approach to Early Warning
• Preliminary Screening of Materials
• In Depth Analysis
– Importance Assessment
• Economic
• National Policy
–Supply Chain Analysis
• Interpretation and Recommendations
14

Possible Preliminary Screening Indicators
• Supply Risk– Concentration of supply, production � plus
concentration change
– Trade policies
– Coproduction/byproduction
• Demand pressure– Could signal emerging technology of importance
• Other– Market volatility
15

AntimonyBarite
Bauxite
Beryllium
Bismuth
Boron
Bromine
Cadmium
CobaltCopperFeldspar
Fluorspar
GoldIndium
Iodine
Iron and steel
Iron oreLead
Lithium
Magnesium Metal
Manganese
Mercury
Mg Compounds
Mica
Molybdenum
Monazite Nickel
PalladiumPhosphate
PlatinumRhenium
Selenium
Silicon
Silver
Strontium
SulfurTin
Yttrium
Zinc0%
10%
20%
30%
40%
3-Country Concentration Ratio 2009 and Growth in 3-Country Concentration Ratio 2004-2009
of Selected Mineral Commodities
Gro
wth
in C
on
cen
tra
tio
n R
ati
o 2
00
4-2
00
9Figure 1:
Ch
an
ge
in
Co
nce
ntr
ati
on
Ra
tio
20
04
-20
09
ChromiumGallium
Graphite
Monazite Nickel
Other PGMs
Potash
Rhenium
Tantalum
Tellurium
Tin
Titanium
Tungsten
Vanadium
Zirconium
-40%
-30%
-20%
-10%
10% 20% 30% 40% 50% 60% 70% 80% 90% 100%
Gro
wth
in C
on
cen
tra
tio
n R
ati
o 2
00
4
Concentration Ratio 2009
Source: USGS - "World production_diversity_revised_GM.XLSX" and "Processed revised_JJ.xlsx"
Ch
an
ge
in
Co
nce
ntr
ati
on
Ra
tio
20
04

OECD Analysis of Measures Restricting Raw Material Exports
• Analysis of OECD
database of trade
measures
• Includes trade • Includes trade
restrictions in
combination with trade
flow data on a material-
by-material basis
17

Co-Production, By-Production Illustration
C. Hagelüken and C. E. M. Meskers, 201018
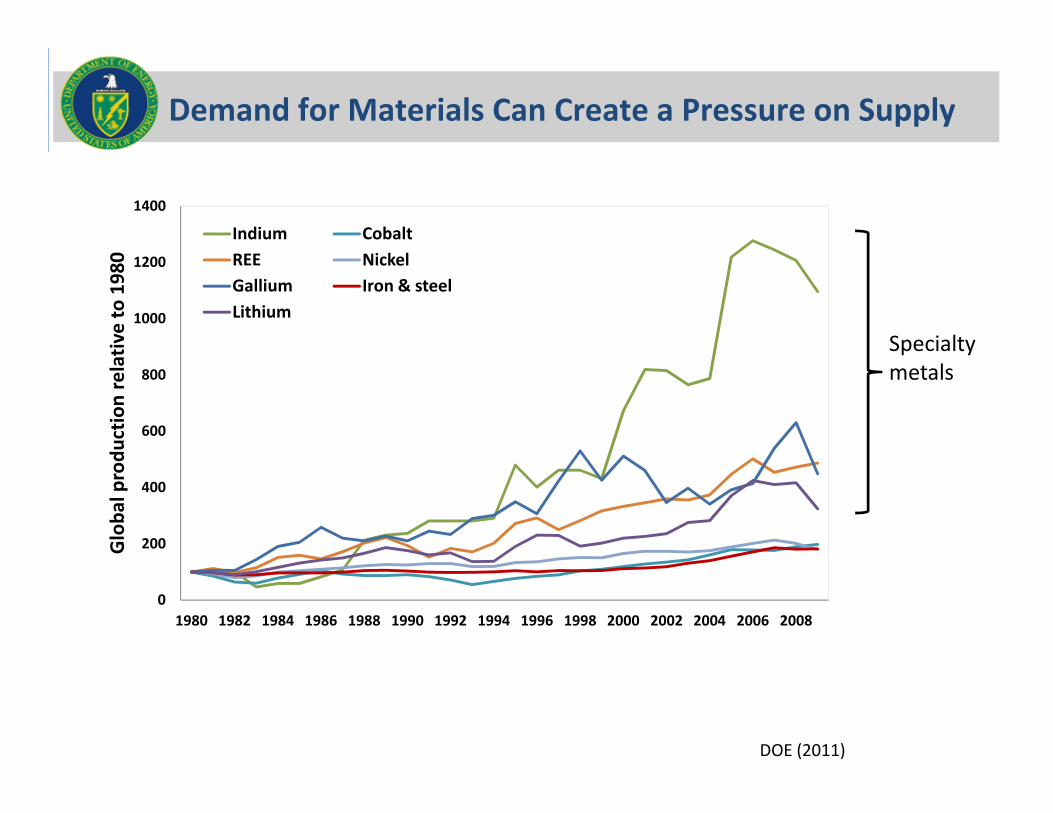
Demand for Materials Can Create a Pressure on Supply
Specialty
metals800
1000
1200
1400
Glo
ba
l p
rod
uct
ion
re
lati
ve
to
19
80
Indium Cobalt
REE Nickel
Gallium Iron & steel
Lithium
0
200
400
600
1980 1982 1984 1986 1988 1990 1992 1994 1996 1998 2000 2002 2004 2006 2008
Glo
ba
l p
rod
uct
ion
re
lati
ve
to
19
80
DOE (2011)

Possible Factors for In Depth Analysis
• Impact of Supply Disruption
– Economic Importance
– Importance to National PolicyNational Importance
– Importance to National Policy
• Supply Chain Analysis
20
Possible Indicators of National Importance
• Economic Importance
– Value of U.S. Consumption of Material’s Primary
Use – Growth Rate
– Value of U.S. Production of Material’s Primary Use
- Growth Rate- Growth Rate
• Importance to National Policy
– Statutory, Regulatory or Policy Goal
21

Example Qualitative Analysis of Rare Earth Magnet Supply
Chain
Mining/
Milling/
Concentration
Separation
(Oxides) Metal Making
Alloying/
Powder
Production
Magnet
Manufacturing
Motors and
Generators
Market
Concentration
(Low to High)
Moderate to HighModerate to
HighHigh High High Moderate
Market Opacity
(Low to High) High High Moderate Moderate Moderate Low
Capital
Requirements
(Low to High)
Moderate to High HighModerate to
HighModerate to High Moderate to High
Low to
Moderate
Knowledge/
Technical
Requirements
(Low to High)
Low to Moderate High High High High Moderate
Regulatory
Requirements
(Low to High)
High High High Moderate Low to Moderate Low
Time
Requirements:
Short <2 yrs;
Med 2–5 yrs;
Long > 5 yrs
LongMedium to
LongMedium Medium Medium
Short to
Medium
Intellectual
Property Entry
Barriers
(Low to High)
Low Low Moderate High High Low
(DOE, 2011)22
Outline
• U.S. Department of Energy Critical Materials
Strategy
• An Approach to Early Warning Assessment
• Conclusions• Conclusions
23

Conclusions
• DOE Critical Materials Strategy (CMS) offers a
snapshot of material criticality in the clean
energy economy
• CMS and other existing analyses can be built
upon to develop an early warning
methodology that captures changes to
criticality over time
24

Conclusions
• Both an initial rapid screening and an in-depth analysis can contribute to early warning
• Tracking change in indicators over time can • Tracking change in indicators over time can add insight
• A more dynamic approach to criticality can help policymakers make more proactive decisions in a timely manner
25