Embed Size (px)
Citation preview
DOE-HDBK-1019/2-93JANUARY 1993
DOE FUNDAMENTALS HANDBOOKNUCLEAR PHYSICS
AND REACTOR THEORY
Volume 2 of 2
U.S. Department of Energy FSC-6910
Washington, D.C. 20585
Distribution Statement A. Approved for public release; distribution is unlimited.
This document has been reproduced directly from the best available copy.
Available to DOE and DOE contractors from the Office of Scientific andTechnical Information, P.O. Box 62, Oak Ridge, TN 37831.
Available to the public from the National Technical Information Service, U.S.Department of Commerce, 5285 Port Royal., Springfield, VA 22161.
Order No. DE93012223
DOE-HDBK-1019/1-93NUCLEAR PHYSICS AND REACTOR THEORY
ABSTRACT
The Nuclear Physics and Reactor Theory Handbook was developed to assist nuclearfacility operating contractors in providing operators, maintenance personnel, and the technicalstaff with the necessary fundamentals training to ensure a basic understanding of nuclear physicsand reactor theory. The handbook includes information on atomic and nuclear physics; neutroncharacteristics; reactor theory and nuclear parameters; and the theory of reactor operation. Thisinformation will provide personnel with a foundation for understanding the scientific principlesthat are associated with various DOE nuclear facility operations and maintenance.
Key Words: Training Material, Atomic Physics, The Chart of the Nuclides, Radioactivity,Radioactive Decay, Neutron Interaction, Fission, Reactor Theory, Neutron Characteristics,Neutron Life Cycle, Reactor Kinetics
Rev. 0 NP


DOE-HDBK-1019/1-93NUCLEAR PHYSICS AND REACTOR THEORY
FOREWORD
The Department of Energy (DOE) Fundamentals Handbooks consist of ten academicsubjects, which include Mathematics; Classical Physics; Thermodynamics, Heat Transfer, andFluid Flow; Instrumentation and Control; Electrical Science; Material Science; MechanicalScience; Chemistry; Engineering Symbology, Prints, and Drawings; and Nuclear Physics andReactor Theory. The handbooks are provided as an aid to DOE nuclear facility contractors.
These handbooks were first published as Reactor Operator Fundamentals Manuals in 1985for use by DOE category A reactors. The subject areas, subject matter content, and level ofdetail of the Reactor Operator Fundamentals Manuals were determined from several sources.DOE Category A reactor training managers determined which materials should be included, andserved as a primary reference in the initial development phase. Training guidelines from thecommercial nuclear power industry, results of job and task analyses, and independent input fromcontractors and operations-oriented personnel were all considered and included to some degreein developing the text material and learning objectives.
The DOE Fundamentals Handbooks represent the needs of various DOE nuclear facilities'fundamental training requirements. To increase their applicability to nonreactor nuclear facilities,the Reactor Operator Fundamentals Manual learning objectives were distributed to the NuclearFacility Training Coordination Program Steering Committee for review and comment. To updatetheir reactor-specific content, DOE Category A reactor training managers also reviewed andcommented on the content. On the basis of feedback from these sources, information that appliedto two or more DOE nuclear facilities was considered generic and was included. The final draftof each of the handbooks was then reviewed by these two groups. This approach has resultedin revised modular handbooks that contain sufficient detail such that each facility may adjust thecontent to fit their specific needs.
Each handbook contains an abstract, a foreword, an overview, learning objectives, andtext material, and is divided into modules so that content and order may be modified byindividual DOE contractors to suit their specific training needs. Each handbook is supported bya separate examination bank with an answer key.
The DOE Fundamentals Handbooks have been prepared for the Assistant Secretary forNuclear Energy, Office of Nuclear Safety Policy and Standards, by the DOE TrainingCoordination Program. This program is managed by EG&G Idaho, Inc.
Rev. 0 NP

DOE-HDBK-1019/1-93NUCLEAR PHYSICS AND REACTOR THEORY
OVERVIEW
The Department of Energy Fundamentals Handbook entitled Nuclear Physics and ReactorTheory was prepared as an information resource for personnel who are responsible for theoperation of the Department's nuclear facilities. Almost all processes that take place in a nuclearfacility involves the transfer of some type of energy. A basic understanding of nuclear physicsand reactor theory is necessary for DOE nuclear facility operators, maintenance personnel, andthe technical staff to safely operate and maintain the facility and facility support systems. Theinformation in this handbook is presented to provide a foundation for applying engineeringconcepts to the job. This knowledge will help personnel understand the impact that their actionsmay have on the safe and reliable operation of facility components and systems.
The Nuclear Physics and Reactor Theory handbook consists of four modules that arecontained in two volumes. The following is a brief description of the information presented ineach module of the handbook.
Volume 1 of 2
Module 1 - Atomic and Nuclear Physics
Introduces concepts of atomic physics including the atomic nature of matter, thechart of the nuclides, radioactivity and radioactive decay, neutron interactions andfission, and the interaction of radiation with matter.
Module 2 - Reactor Theory (Nuclear Parameters)
Provides information on reactor theory and neutron characteristics. Includestopics such as neutron sources, neutron flux, neutron cross sections, reaction rates,neutron moderation, and prompt and delayed neutrons.
Rev. 0 NP

DOE-HDBK-1019/1-93NUCLEAR PHYSICS AND REACTOR THEORY
OVERVIEW (Cont.)
Volume 2 of 2
Module 3 - Reactor Theory (Nuclear Parameters)
Explains the nuclear parameters associated with reactor theory. Topics includethe neutron life cycle, reactivity and reactivity coefficients, neutron poisons, andcontrol rods.
Module 4 - Reactor Theory (Reactor Operations)
Introduces the reactor operations aspect of reactor theory. Topics includesubcritical multiplication, reactor kinetics, and reactor operation.
The information contained in this handbook is not all-encompassing. An attempt topresent the entire subject of nuclear physics and reactor theory would be impractical. However,the Nuclear Physics and Reactor Theory handbook presents enough information to provide thereader with the fundamental knowledge necessary to understand the advanced theoreticalconcepts presented in other subject areas, and to understand basic system and equipmentoperation.
Rev. 0 NP

Department of EnergyFundamentals Handbook
NUCLEAR PHYSICS AND REACTOR THEORY
Module 3Reactor Theory (Nuclear Parameters)

Reactor Theory (Nuclear Parameters) DOE-HDBK-1019/2-93 TABLE OF CONTENTS
TABLE OF CONTENTS
LIST OF FIGURES . . . . . . . . . . . . . . . . . . . . . . . . . . . . . . . . . . . . . . . . . . . . . . . . iii
LIST OF TABLES . . . . . . . . . . . . . . . . . . . . . . . . . . . . . . . . . . . . . . . . . . . . . . . . . iv
REFERENCES . . . . . . . . . . . . . . . . . . . . . . . . . . . . . . . . . . . . . . . . . . . . . . . . . . . v
OBJECTIVES . . . . . . . . . . . . . . . . . . . . . . . . . . . . . . . . . . . . . . . . . . . . . . . . . . . . vi
NEUTRON LIFE CYCLE . . . . . . . . . . . . . . . . . . . . . . . . . . . . . . . . . . . . . . . . . . . . 1
Infinite Multiplication Factor, k∞ . . . . . . . . . . . . . . . . . . . . . . . . . . . . . . . . . . . . 2Four Factor Formula. . . . . . . . . . . . . . . . . . . . . . . . . . . . . . . . . . . . . . . . . . . 2Fast Fission Factor, ( ) . . . . . . . . . . . . . . . . . . . . . . . . . . . . . . . . . . . . . . . . . 3Resonance Escape Probability, (p). . . . . . . . . . . . . . . . . . . . . . . . . . . . . . . . . 3Thermal Utilization Factor, (f). . . . . . . . . . . . . . . . . . . . . . . . . . . . . . . . . . . . 4Reproduction Factor, (η) . . . . . . . . . . . . . . . . . . . . . . . . . . . . . . . . . . . . . . . . 6Effective Multiplication Factor. . . . . . . . . . . . . . . . . . . . . . . . . . . . . . . . . . . . 8Fast Non-Leakage Probability ( f) . . . . . . . . . . . . . . . . . . . . . . . . . . . . . . . . . 9Thermal Non-Leakage Probability ( t) . . . . . . . . . . . . . . . . . . . . . . . . . . . . . . . 9Six Factor Formula. . . . . . . . . . . . . . . . . . . . . . . . . . . . . . . . . . . . . . . . . . . 10Neutron Life Cycle of a Fast Reactor. . . . . . . . . . . . . . . . . . . . . . . . . . . . . . 14Summary . . . . . . . . . . . . . . . . . . . . . . . . . . . . . . . . . . . . . . . . . . . . . . . . . 14
REACTIVITY . . . . . . . . . . . . . . . . . . . . . . . . . . . . . . . . . . . . . . . . . . . . . . . . . . . 17
Application of the Effective Multiplication Factor. . . . . . . . . . . . . . . . . . . . . . 17Reactivity . . . . . . . . . . . . . . . . . . . . . . . . . . . . . . . . . . . . . . . . . . . . . . . . . 18Units of Reactivity . . . . . . . . . . . . . . . . . . . . . . . . . . . . . . . . . . . . . . . . . . . 19Reactivity Coefficients and Reactivity Defects. . . . . . . . . . . . . . . . . . . . . . . . 21Summary . . . . . . . . . . . . . . . . . . . . . . . . . . . . . . . . . . . . . . . . . . . . . . . . . 22
REACTIVITY COEFFICIENTS . . . . . . . . . . . . . . . . . . . . . . . . . . . . . . . . . . . . . . . 23
Moderator Effects. . . . . . . . . . . . . . . . . . . . . . . . . . . . . . . . . . . . . . . . . . . . 24Moderator Temperature Coefficient. . . . . . . . . . . . . . . . . . . . . . . . . . . . . . . . 26Fuel Temperature Coefficient. . . . . . . . . . . . . . . . . . . . . . . . . . . . . . . . . . . . 26Pressure Coefficient. . . . . . . . . . . . . . . . . . . . . . . . . . . . . . . . . . . . . . . . . . 27Void Coefficient . . . . . . . . . . . . . . . . . . . . . . . . . . . . . . . . . . . . . . . . . . . . . 27Summary . . . . . . . . . . . . . . . . . . . . . . . . . . . . . . . . . . . . . . . . . . . . . . . . . 28
Rev. 0 Page i NP-03
TABLE OF CONTENTS DOE-HDBK-1019/2-93 Reactor Theory (Nuclear Parameters)
TABLE OF CONTENTS (Cont.)
NEUTRON POISONS . . . . . . . . . . . . . . . . . . . . . . . . . . . . . . . . . . . . . . . . . . . . . 30
Fixed Burnable Poisons. . . . . . . . . . . . . . . . . . . . . . . . . . . . . . . . . . . . . . . . 30Soluble Poisons. . . . . . . . . . . . . . . . . . . . . . . . . . . . . . . . . . . . . . . . . . . . . 31Non-Burnable Poisons. . . . . . . . . . . . . . . . . . . . . . . . . . . . . . . . . . . . . . . . . 32Summary . . . . . . . . . . . . . . . . . . . . . . . . . . . . . . . . . . . . . . . . . . . . . . . . . 33
XENON . . . . . . . . . . . . . . . . . . . . . . . . . . . . . . . . . . . . . . . . . . . . . . . . . . . . . . . 34
Fission Product Poisons. . . . . . . . . . . . . . . . . . . . . . . . . . . . . . . . . . . . . . . . 34Production and Removal of Xenon-135. . . . . . . . . . . . . . . . . . . . . . . . . . . . . 35Xenon-135 Response to Reactor Shutdown. . . . . . . . . . . . . . . . . . . . . . . . . . . 38Xenon-135 Oscillations. . . . . . . . . . . . . . . . . . . . . . . . . . . . . . . . . . . . . . . . 39Xenon-135 Response to Reactor Power Changes. . . . . . . . . . . . . . . . . . . . . . . 40Summary . . . . . . . . . . . . . . . . . . . . . . . . . . . . . . . . . . . . . . . . . . . . . . . . . 41
SAMARIUM AND OTHER FISSION PRODUCT POISONS. . . . . . . . . . . . . . . . . . . 43
Production and Removal of Samarium-149. . . . . . . . . . . . . . . . . . . . . . . . . . . 43Samarium-149 Response to Reactor Shutdown. . . . . . . . . . . . . . . . . . . . . . . . 45Other Neutron Poisons. . . . . . . . . . . . . . . . . . . . . . . . . . . . . . . . . . . . . . . . 46Summary . . . . . . . . . . . . . . . . . . . . . . . . . . . . . . . . . . . . . . . . . . . . . . . . . 47
CONTROL RODS . . . . . . . . . . . . . . . . . . . . . . . . . . . . . . . . . . . . . . . . . . . . . . . . 48
Selection of Control Rod Materials. . . . . . . . . . . . . . . . . . . . . . . . . . . . . . . . 48Types of Control Rods. . . . . . . . . . . . . . . . . . . . . . . . . . . . . . . . . . . . . . . . 49Control Rod Effectiveness. . . . . . . . . . . . . . . . . . . . . . . . . . . . . . . . . . . . . . 50Integral and Differential Control Rod Worth. . . . . . . . . . . . . . . . . . . . . . . . . . 51Rod Control Mechanisms. . . . . . . . . . . . . . . . . . . . . . . . . . . . . . . . . . . . . . 57Summary . . . . . . . . . . . . . . . . . . . . . . . . . . . . . . . . . . . . . . . . . . . . . . . . . 57
NP-03 Page ii Rev. 0
Reactor Theory (Nuclear Parameters) DOE-HDBK-1019/2-93 LIST OF FIGURES
LIST OF FIG URES
Figure 1 Neutron Life Cycle with keff = 1 . . . . . . . . . . . . . . . . . . . . . . . . . . . . . . . . 11
Figure 2 Effects of Over and Under Moderation on keff . . . . . . . . . . . . . . . . . . . . . . . 25
Figure 3 Effect of Fuel Temperature on Resonance Absorption Peaks. . . . . . . . . . . . . 27
Figure 4 Equilibrium Iodine-135 and Xenon-135 Concentrations Versus Neutron Flux . . 37
Figure 5 Xenon-135 Reactivity After Reactor Shutdown. . . . . . . . . . . . . . . . . . . . . . 38
Figure 6 Xenon-135 Variations During Power Changes. . . . . . . . . . . . . . . . . . . . . . . 40
Figure 7 Behavior of Samarium-149 in a Typical Light Water Reactor. . . . . . . . . . . . . 46
Figure 8 Effect of Control Rod on Radial Flux Distribution. . . . . . . . . . . . . . . . . . . . 50
Figure 9 Integral Control Rod Worth. . . . . . . . . . . . . . . . . . . . . . . . . . . . . . . . . . . 51
Figure 10 Differential Control Rod Worth. . . . . . . . . . . . . . . . . . . . . . . . . . . . . . . . . 52
Figure 11 Rod Worth Curves for Example Problems. . . . . . . . . . . . . . . . . . . . . . . . . 53
Figure 12 Rod Worth Curves From Example 3. . . . . . . . . . . . . . . . . . . . . . . . . . . . . 56
Rev. 0 Page iii NP-03
LIST OF TABLES DOE-HDBK-1019/2-93 Reactor Theory (Nuclear Parameters)
LIST OF TABLES
Table 1 Average Number of Neutrons Liberated in Fission. . . . . . . . . . . . . . . . . . . . . . 7
NP-03 Page iv Rev. 0
Reactor Theory (Nuclear Parameters) DOE-HDBK-1019/2-93 REFERENCES
REFERENCES
Foster, Arthur R. and Wright, Robert L. Jr., Basic Nuclear Engineering, 3rd Edition, Allynand Bacon, Inc., 1977.
Jacobs, A.M., Kline, D.E., and Remick, F.J., Basic Principles of Nuclear Science andReactors, Van Nostrand Company, Inc., 1960.
Kaplan, Irving, Nuclear Physics, 2nd Edition, Addison-Wesley Company, 1962.
Knief, Ronald Allen, Nuclear Energy Technology: Theory and Practice of CommercialNuclear Power, McGraw-Hill, 1981.
Lamarsh, John R., Introduction to Nuclear Engineering, Addison-Wesley Company, 1977.
Lamarsh, John R., Introduction to Nuclear Reactor Theory, Addison-Wesley Company,1972.
General Electric Company, Nuclides and Isotopes: Chart of the Nuclides, 14th Edition,General Electric Company, 1989.
Academic Program for Nuclear Power Plant Personnel, Volume III, Columbia, MD,General Physics Corporation, Library of Congress Card #A 326517, 1982.
Glasstone, Samuel, Sourcebook on Atomic Energy, Robert F. Krieger PublishingCompany, Inc., 1979.
Glasstone, Samuel and Sesonske, Alexander, Nuclear Reactor Engineering, 3rd Edition,Van Nostrand Reinhold Company, 1981.
Rev. 0 Page v NP-03
OBJECTIVES DOE-HDBK-1019/2-93 Reactor Theory (Nuclear Parameters)
TERMINAL OBJECTIVE
1.0 Using appropriate references, DESCRIBE the neutron life cycle discussed in thismodule.
ENABLING OBJECTIVES
1.1 DEFINE the following terms:
a. Infinite multiplication factor, k∞b. Effective multiplication factor, keff
c. Subcriticald. Criticale. Supercritical
1.2 DEFINE each term in the six factor formula using the ratio of the number of neutronspresent at different points in the neutron life cycle.
1.3 Given the macroscopic cross sections for various materials, CALCULATE the thermalutilization factor.
1.4 Given microscopic cross sections for absorption and fission, atom density, and ν,CALCULATE the reproduction factor.
1.5 Given the numbers of neutrons present at the start of a generation and values for eachfactor in the six factor formula, CALCULATE the number of neutrons that will bepresent at any point in the life cycle.
1.6 LIST physical changes in the reactor core that will have an effect on the thermalutilization factor, reproduction factor, or resonance escape probability.
1.7 EXPLAIN the effect that temperature changes will have on the following factors:
a. Thermal utilization factorb. Resonance escape probabilityc. Fast non-leakage probabilityd. Thermal non-leakage probability
1.8 Given the number of neutrons in a reactor core and the effective multiplication factor,CALCULATE the number of neutrons present after any number of generations.
NP-03 Page vi Rev. 0
Reactor Theory (Nuclear Parameters) DOE-HDBK-1019/2-93 OBJECTIVES
ENABLING OBJECTIVES (Cont.)
1.9 DEFINE the term reactivity.
1.10 CONVERT between reactivity and the associated value of keff.
1.11 CONVERT measures of reactivity between the following units:
a. ∆k/k c. 10-4 ∆k/kb. %∆k/k d. Percent millirho (pcm)
1.12 EXPLAIN the relationship between reactivity coefficients and reactivity defects.
Rev. 0 Page vii NP-03
OBJECTIVES DOE-HDBK-1019/2-93 Reactor Theory (Nuclear Parameters)
TERMINAL OBJECTIVE
2.0 From memory, EXPLAIN how reactivity varies with the thermodynamic properties ofthe moderator and the fuel.
ENABLING OBJECTIVES
2.1 EXPLAIN the conditions of over moderation and under moderation.
2.2 EXPLAIN why many reactors are designed to be operated in an under moderatedcondition.
2.3 STATE the effect that a change in moderator temperature will have on the moderator tofuel ratio.
2.4 DEFINE the temperature coefficient of reactivity.
2.5 EXPLAIN why a negative temperature coefficient of reactivity is desirable.
2.6 EXPLAIN why the fuel temperature coefficient is more effective than the moderatortemperature coefficient in terminating a rapid power rise.
2.7 EXPLAIN the concept of Doppler broadening of resonance absorption peaks.
2.8 LIST two nuclides that are present in some types of reactor fuel assemblies that havesignificant resonance absorption peaks.
2.9 DEFINE the pressure coefficient of reactivity.
2.10 EXPLAIN why the pressure coefficient of reactivity is usually negligible in a reactorcooled and moderated by a subcooled liquid.
2.11 DEFINE the void coefficient of reactivity.
2.12 IDENTIFY the moderator conditions under which the void coefficient of reactivitybecomes significant.
NP-03 Page viii Rev. 0
Reactor Theory (Nuclear Parameters) DOE-HDBK-1019/2-93 OBJECTIVES
TERMINAL OBJECTIVE
3.0 Without references, DESCRIBE the use of neutron poisons.
ENABLING OBJECTIVES
3.1 DEFINE the following terms:
a. Burnable poisonb. Non-burnable poisonc. Chemical shim
3.2 EXPLAIN the use of burnable neutron poisons in a reactor core.
3.3 LIST the advantages and disadvantages of chemical shim over fixed burnable poisons.
3.4 STATE two reasons why fixed non-burnable neutron poisons are used in reactor cores.
3.5 STATE an example of a material used as a fixed non-burnable neutron poison.
Rev. 0 Page ix NP-03

OBJECTIVES DOE-HDBK-1019/2-93 Reactor Theory (Nuclear Parameters)
TERMINAL OBJECTIVE
4.0 Without references, DESCRIBE the effects of fission product poisons on a reactor.
ENABLING OBJECTIVES
4.1 LIST two methods of production and two methods of removal for xenon-135 duringreactor operation.
4.2 STATE the equation for equilibrium xenon-135 concentration.
4.3 DESCRIBE how equilibrium xenon-135 concentration varies with reactor power level.
4.4 DESCRIBE the causes and effects of a xenon oscillation.
4.5 DESCRIBE how xenon-135 concentration changes following a reactor shutdown fromsteady-state conditions.
4.6 EXPLAIN the effect that pre-shutdown power levels have on the xenon-135concentration after shutdown.
4.7 STATE the approximate time following a reactor shutdown at which the reactor can beconsidered "xenon free."
4.8 EXPLAIN what is meant by the following terms:
a. Xenon precluded startupb. Xenon dead time
4.9 DESCRIBE how xenon-135 concentration changes following an increase or a decreasein the power level of a reactor.
4.10 DESCRIBE how samarium-149 is produced and removed from the reactor core duringreactor operation.
4.11 STATE the equation for equilibrium samarium-149 concentration.
4.12 DESCRIBE how equilibrium samarium-149 concentration varies with reactor powerlevel.
NP-03 Page x Rev. 0
Reactor Theory (Nuclear Parameters) DOE-HDBK-1019/2-93 OBJECTIVES
ENABLING OBJECTIVES (Cont.)
4.13 DESCRIBE how samarium-149 concentration changes following a reactorshutdown from steady-state conditions.
4.14 DESCRIBE how samarium-149 concentration changes following a reactor startup.
4.15 STATE the conditions under which helium-3 will have a significant effect on thereactivity of a reactor.
Rev. 0 Page xi NP-03
OBJECTIVES DOE-HDBK-1019/2-93 Reactor Theory (Nuclear Parameters)
TERMINAL OBJECTIVE
5.0 Without references, DESCRIBE how control rods affect the reactor core.
ENABLING OBJECTIVES
5.1 DESCRIBE the difference between a "grey" neutron absorbing material and a "black"neutron absorbing material.
5.2 EXPLAIN why a "grey" neutron absorbing material may be preferable to a "black"neutron absorbing material for use in control rods.
5.3 EXPLAIN why resonance absorbers are sometimes preferred over thermal absorbers asa control rod material.
5.4 DEFINE the following terms:
a. Integral control rod worthb. Differential control rod worth
5.5 DESCRIBE the shape of a typical differential control rod worth curve and explain thereason for the shape.
5.6 DESCRIBE the shape of a typical integral control rod worth curve and explain the reasonfor the shape.
5.7 Given an integral or differential control rod worth curve, CALCULATE the reactivitychange due to a control rod movement between two positions.
5.8 Given differential control rod worth data, PLOT differential and integral control rodworth curves.
NP-03 Page xii Rev. 0
Reactor Theory (Nuclear Parameters) DOE-HDBK-1019/2-93 NEUTRON LIFE CYCLE
NEUTRON LIFE CYCLE
Some number of the fast neutrons produced by fission in one generation willeventually cause fission in the next generation. The series of steps that fissionneutrons go through as they slow to thermal energies and are absorbed in thereactor is referred to as the neutron life cycle. The neutron life cycle is markedlydifferent between fast reactors and thermal reactors. This chapter presents theneutron life cycle for thermal reactors.
EO 1.1 DEFINE the following terms:
a. Infinite multiplication factor, k ∞∞ d. Criticalb. Effective multiplication factor, k eff e. Supercriticalc. Subcritical
EO 1.2 DEFINE each term in the six factor formula using the ratio ofthe number of neutrons present at different points in theneutron life cycle.
EO 1.3 Given the macroscopic cross sections for various materials,CALCULATE the thermal utilization factor.
EO 1.4 Given microscopic cross sections for absorption and fission,atom density, and νν, CALCULATE the reproduction factor.
EO 1.5 Given the numbers of neutrons present at the start of a generationand values for each factor in the six factor formula, CALCULATE thenumber of neutrons that will be present at any point in the lifecycle.
EO 1.6 LIST physical changes in the reactor core that will have an effecton the thermal utilization factor, reproduction factor, orresonance escape probability.
EO 1.7 EXPLAIN the effect that temperature changes will have on thefollowing factors:
a. Thermal utilization factorb. Resonance escape probabilityc. Fast non-leakage probabilityd. Thermal non-leakage probability
Rev. 0 NP-03Page 1
NEUTRON LIFE CYCLE DOE-HDBK-1019/2-93 Reactor Theory (Nuclear Parameters)
I nfinite Mu ltiplic ation Factor , k ∞∞
Not all of the neutrons produced by fission will have the opportunity to cause new fissionsbecause some neutrons will be absorbed by non-fissionable material. Some will be absorbedparasitically in fissionable material and will not cause fission, and others will leak out of thereactor. For the maintenance of a self-sustaining chain reaction, however, it is not necessarythat every neutron produced in fission initiate another fission. The minimum condition is foreach nucleus undergoing fission to produce, on the average, at least one neutron that causesfission of another nucleus. This condition is conveniently expressed in terms of a multiplicationfactor.
The number of neutrons absorbed or leaking out of the reactor will determine the value of thismultiplication factor, and will also determine whether a new generation of neutrons is larger,smaller, or the same size as the preceding generation. Any reactor of a finite size will haveneutrons leak out of it. Generally, the larger the reactor, the lower the fraction of neutronleakage. For simplicity, we will first consider a reactor that is infinitely large, and thereforehas no neutron leakage. A measure of the increase or decrease in neutron flux in an infinitereactor is the infinite multiplication factor, k∞. The infinite multiplication factor is the ratio ofthe neutrons produced by fission in one generation to the number of neutrons lost throughabsorption in the preceding generation. This can be expressed mathematically as shown below.
k∞ neutron production from fission in one generationneutron absorption in the preceding generation
Four Factor For mula
A group of fast neutrons produced by fission can enter into several reactions. Some of thesereactions reduce the size of the neutron group while other reactions allow the group to increasein size or produce a second generation. There are four factors that are completely independentof the size and shape of the reactor that give the inherent multiplication ability of the fuel andmoderator materials without regard to leakage. This four factor formula accurately represents theinfinite multiplication factor as shown in the equation below.
k∞ = p f η
where:
= fast fission factorp = resonance escape probabilityf = thermal utilization factorη = reproduction factor
Each of these four factors, which are explained in the following subsections, represents a process thatadds to or subtracts from the initial neutron group produced in a generation by fission.
NP-03 Rev. 0Page 2
Reactor Theory (Nuclear Parameters) DOE-HDBK-1019/2-93 NEUTRON LIFE CYCLE
Fast Fission Factor , ( )
The first process that the neutrons of one generation may undergo is fast fission. Fast fissionis fission caused by neutrons that are in the fast energy range. Fast fission results in the netincrease in the fast neutron population of the reactor core. The cross section for fast fission inuranium-235 or uranium-238 is small; therefore, only a small number of fast neutrons causefission. The fast neutron population in one generation is therefore increased by a factor calledthe fast fission factor. The fast fission factor ( ) is defined as the ratio of the net number of fastneutrons produced by all fissions to the number of fast neutrons produced by thermal fissions.The mathematical expression of this ratio is shown below.
number of fast neutrons produced by all fissionsnumber of fast neutrons produced by thermal fissions
In order for a neutron to be absorbed by a fuel nucleus as a fast neutron, it must pass closeenough to a fuel nucleus while it is a fast neutron. The value of will be affected by thearrangement and concentrations of the fuel and the moderator. The value of is essentially 1.00for a homogenous reactor where the fuel atoms are surrounded by moderator atoms. However,in a heterogeneous reactor, all the fuel atoms are packed closely together in elements such aspins, rods, or pellets. Neutrons emitted from the fission of one fuel atom have a very goodchance of passing near another fuel atom before slowing down significantly. The arrangementof the core elements results in a value of about 1.03 for in most heterogeneous reactors. Thevalue of is not significantly affected by variables such as temperature, pressure, enrichment,or neutron poison concentrations. Poisons are non-fuel materials that easily absorb neutrons andwill be discussed in more detail later.
Resonance Escape Pr obability, (p)
After increasing in number as a result of some fast fissions, the neutrons continue to diffusethrough the reactor. As the neutrons move they collide with nuclei of fuel and non-fuel materialand moderator in the reactor losing part of their energy in each collision and slowing down.While they are slowing down through the resonance region of uranium-238, which extends fromabout 6 eV to 200 eV, there is a chance that some neutrons will be captured. The probabilitythat a neutron will not be absorbed by a resonance peak is called the resonance escapeprobability. The resonance escape probability (p) is defined as the ratio of the number ofneutrons that reach thermal energies to the number of fast neutrons that start to slow down. Thisratio is shown below.
p number of neutrons that reach thermal energynumber of fast neutrons that start to slow down
Rev. 0 NP-03Page 3
NEUTRON LIFE CYCLE DOE-HDBK-1019/2-93 Reactor Theory (Nuclear Parameters)
The value of the resonance escape probability is determined largely by the fuel-moderatorarrangement and the amount of enrichment of uranium-235 (if any is used). To undergoresonance absorption, a neutron must pass close enough to a uranium-238 nucleus to be absorbedwhile slowing down. In a homogeneous reactor the neutron does its slowing down in the regionof the fuel nuclei, and this condition is easily met. This means that a neutron has a highprobability of being absorbed by uranium-238 while slowing down; therefore, its escapeprobability is lower. In a heterogeneous reactor, however, the neutron slows down in themoderator where there are no atoms of uranium-238 present. Therefore, it has a low probabilityof undergoing resonance absorption, and its escape probability is higher.
The value of the resonance escape probability is not significantly affected by pressure or poisonconcentration. In water moderated, low uranium-235 enrichment reactors, raising thetemperature of the fuel will raise the resonance absorption in uranium-238 due to the dopplereffect (an apparent broadening of the normally narrow resonance peaks due to thermal motionof nuclei). The increase in resonance absorption lowers the resonance escape probability, andthe fuel temperature coefficient for resonance escape is negative (explained in detail later). Thetemperature coefficient of resonance escape probability for the moderator temperature is alsonegative. As water temperature increases, water density decreases. The decrease in water densityallows more resonance energy neutrons to enter the fuel and be absorbed. The value of theresonance escape probability is always slightly less than one (normally 0.95 to 0.99).
The product of the fast fission factor and the resonance escape probability ( p) is the ratio ofthe number of fast neutrons that survive slowing down (thermalization) compared to the numberof fast neutrons originally starting the generation.
Ther mal Utiliz ation Factor , (f)
Once thermalized, the neutrons continue to diffuse throughout the reactor and are subject toabsorption by other materials in the reactor as well as the fuel. The thermal utilization factordescribes how effectively thermal neutrons are absorbed by the fuel, or how well they areutilized within the reactor. The thermal utilization factor (f) is defined as the ratio of thenumber of thermal neutrons absorbed in the fuel to the number of thermal neutrons absorbed inany reactor material. This ratio is shown below.
f number of thermal neutrons absorbed in the fuelnumber of thermal neutrons absorbed in all reactor materials
The thermal utilization factor will always be less than one because some of the thermal neutronsabsorbed within the reactor will be absorbed by atoms of non-fuel materials.
NP-03 Rev. 0Page 4
Reactor Theory (Nuclear Parameters) DOE-HDBK-1019/2-93 NEUTRON LIFE CYCLE
An equation can be developed for the thermal utilization factor in terms of reaction rates asfollows.
f rate of absorption of thermal neutrons by the fuelrate of absorption of thermal neutrons by all reactor materials
f ΣUa φU V U
ΣUa φU V U Σm
a φm V m Σpa φp V p
The superscripts U, m, and p refer to uranium, moderator, and poison, respectively. In aheterogeneous reactor, the flux will be different in the fuel region than in the moderator regiondue to the high absorption rate by the fuel. Also, the volumes of fuel, moderator, and poisonswill be different. Although not shown in the above equation, other non-fuel materials, such ascore construction materials, may absorb neutrons in a heterogeneous reactor. These othermaterials are often lumped together with the superscript designation OS, for "other stuff." Tobe completely accurate, the above equation for the thermal utilization factor should include allneutron-absorbing reactor materials when dealing with heterogeneous reactors. However, for thepurposes of this text, the above equation is satisfactory.
In a homogeneous reactor the neutron flux seen by the fuel, moderator, and poisons will be thesame. Also, since they are spread throughout the reactor, they all occupy the same volume. Thisallows the previous equation to be rewritten as shown below.
(3-1)f ΣUa
ΣUa Σm
a Σpa
Equation (3-1) gives an approximation for a heterogeneous reactor if the fuel and moderator arecomposed of small elements distributed uniformly throughout the reactor.
Since absorption cross sections vary with temperature, it would appear that the thermalutilization factor would vary with a temperature change. But, substitution of the temperaturecorrection formulas (see Module 2) in the above equation will reveal that all terms change bythe same amount, and the ratio remains the same. In heterogeneous water-moderated reactors,there is another important factor. When the temperature rises, the water moderator expands, anda significant amount of it will be forced out of the reactor core. This means that Nm, the numberof moderator atoms per cm3, will be reduced, making it less likely for a neutron to be absorbedby a moderator atom. This reduction in Nm results in an increase in thermal utilization asmoderator temperature increases because a neutron now has a better chance of hitting a fuel atom.Because of this effect, the temperature coefficient for the thermal utilization factor is positive.The amount of enrichment of uranium-235 and the poison concentration will affect the thermalutilization factor in a similar manner as can be seen from the equation above.
Rev. 0 NP-03Page 5
NEUTRON LIFE CYCLE DOE-HDBK-1019/2-93 Reactor Theory (Nuclear Parameters)
Example:
Calculate the thermal utilization factor for a homogeneous reactor. The macroscopicabsorption cross section of the fuel is 0.3020 cm-1, the macroscopic absorption crosssection of the moderator is 0.0104 cm-1, and the macroscopic absorption cross section ofthe poison is 0.0118 cm-1.
Solution:
f ΣUa
ΣUa Σm
a Σpa
0.3020 cm 1
0.3020 cm 1 0. 0104cm 1 0. 0118cm 1
0. 932
Reproduction Factor , (ηη)
Most of the neutrons absorbed in the fuel cause fission, but some do not. The reproduction factor(η) is defined as the ratio of the number of fast neurtons produces by thermal fission to the numberof themal neutrons absorbed in the fuel. The reproduction factor is shown below.
η number of fast neutrons produced by thermal fissionnumber of thermal neutrons absorbed in the fuel
The reproduction factor can also be stated as a ratio of rates as shown below.
η rate of production of fast neutrons by thermal fissionrate of absorption of thermal neutrons by the fuel
The rate of production of fast neutrons by thermal fission can be determined by the product of thefission reaction rate (Σf
uφu) and the average number of neutrons produced per fission (ν). Theaverage number of neutrons released in thermal fission of uranium-235 is 2.42. The rate ofabsorption of thermal neutrons by the fuel is Σa
uφu. Substituting these terms into the equationabove results in the following equation.
η ΣUf φU ν
ΣUa φU
Table 1 lists values of ν and η for fission of several different materials by thermal neutrons andfast neutrons.
NP-03 Rev. 0Page 6
Reactor Theory (Nuclear Parameters) DOE-HDBK-1019/2-93 NEUTRON LIFE CYCLE
TABLE 1Average Number of Neutrons Liberated in Fission
Fissile Nucleus Thermal Neutrons Fast Neutrons
ν η ν η
Uranium-233 2.49 2.29 2.58 2.40
Uranium-235 2.42 2.07 2.51 2.35
Plutonium-239 2.93 2.15 3.04 2.90
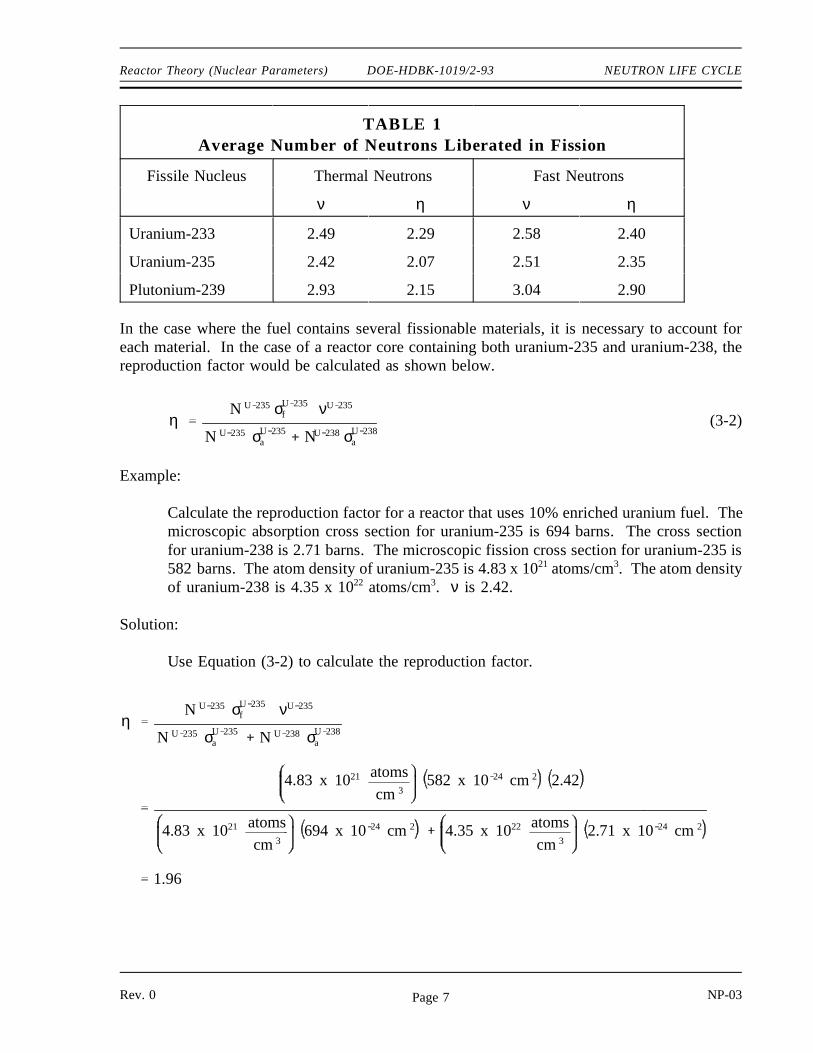
In the case where the fuel contains several fissionable materials, it is necessary to account foreach material. In the case of a reactor core containing both uranium-235 and uranium-238, thereproduction factor would be calculated as shown below.
(3-2)η N U 235 σU 235f νU 235
N U 235 σU 235a NU 238 σU 238
a
Example:
Calculate the reproduction factor for a reactor that uses 10% enriched uranium fuel. Themicroscopic absorption cross section for uranium-235 is 694 barns. The cross sectionfor uranium-238 is 2.71 barns. The microscopic fission cross section for uranium-235 is582 barns. The atom density of uranium-235 is 4.83 x 10²¹ atoms/cm3. The atom densityof uranium-238 is 4.35 x 10²² atoms/cm3. ν is 2.42.
Solution:
Use Equation (3-2) to calculate the reproduction factor.
η N U 235 σU 235f νU 235
N U 235 σU 235a N U 238 σU 238
a
4.83 x 10²¹ atoms
cm3 582 x 10 24 cm2 2.42
4.83 x 10²¹ atoms
cm3 694 x 10 24 cm2
4.35 x 10²² atoms
cm3 2.71 x 10 24 cm2
1.96
Rev. 0 NP-03Page 7
NEUTRON LIFE CYCLE DOE-HDBK-1019/2-93 Reactor Theory (Nuclear Parameters)
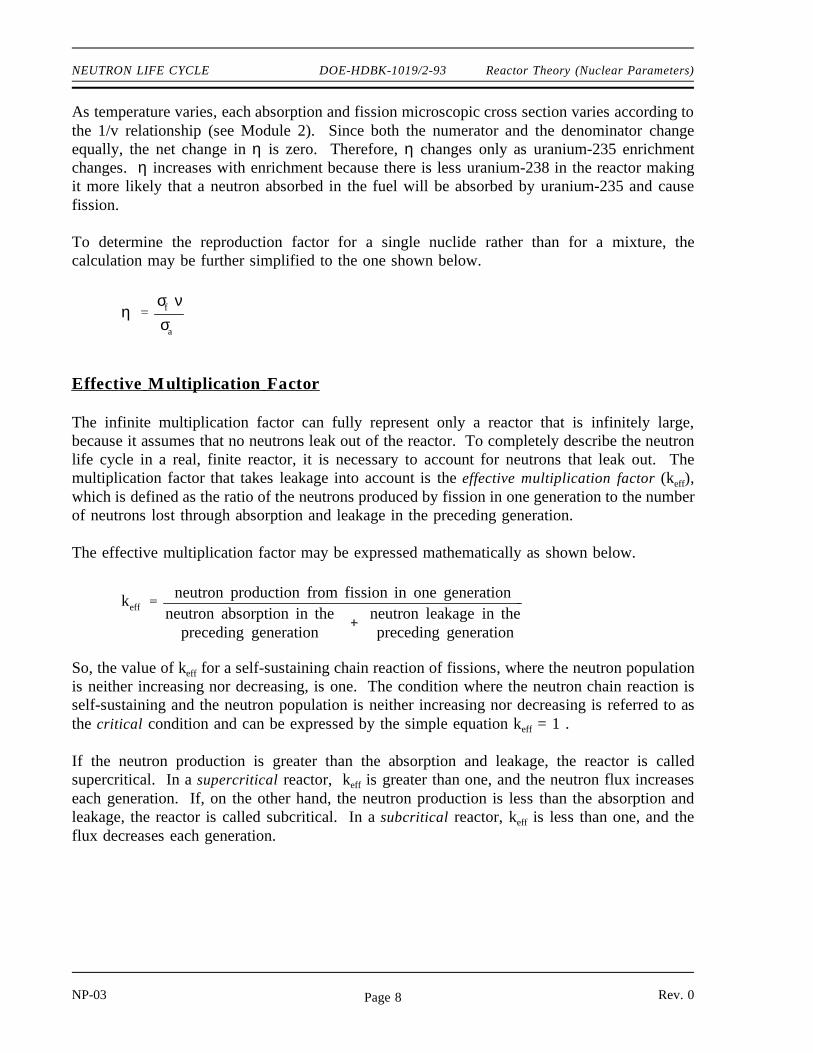
As temperature varies, each absorption and fission microscopic cross section varies according tothe 1/v relationship (see Module 2). Since both the numerator and the denominator changeequally, the net change in η is zero. Therefore, η changes only as uranium-235 enrichmentchanges. η increases with enrichment because there is less uranium-238 in the reactor makingit more likely that a neutron absorbed in the fuel will be absorbed by uranium-235 and causefission.
To determine the reproduction factor for a single nuclide rather than for a mixture, thecalculation may be further simplified to the one shown below.
η σf νσa
Effective Mu ltiplic ation Factor
The infinite multiplication factor can fully represent only a reactor that is infinitely large,because it assumes that no neutrons leak out of the reactor. To completely describe the neutronlife cycle in a real, finite reactor, it is necessary to account for neutrons that leak out. Themultiplication factor that takes leakage into account is the effective multiplication factor (keff),which is defined as the ratio of the neutrons produced by fission in one generation to the numberof neutrons lost through absorption and leakage in the preceding generation.
The effective multiplication factor may be expressed mathematically as shown below.
keff neutron production from fission in one generationneutron absorption in the
preceding generation neutron leakage in the
preceding generation
So, the value of keff for a self-sustaining chain reaction of fissions, where the neutron populationis neither increasing nor decreasing, is one. The condition where the neutron chain reaction isself-sustaining and the neutron population is neither increasing nor decreasing is referred to asthe critical condition and can be expressed by the simple equation keff = 1 .
If the neutron production is greater than the absorption and leakage, the reactor is calledsupercritical. In a supercritical reactor, keff is greater than one, and the neutron flux increaseseach generation. If, on the other hand, the neutron production is less than the absorption andleakage, the reactor is called subcritical. In a subcritical reactor, keff is less than one, and theflux decreases each generation.
NP-03 Rev. 0Page 8
Reactor Theory (Nuclear Parameters) DOE-HDBK-1019/2-93 NEUTRON LIFE CYCLE
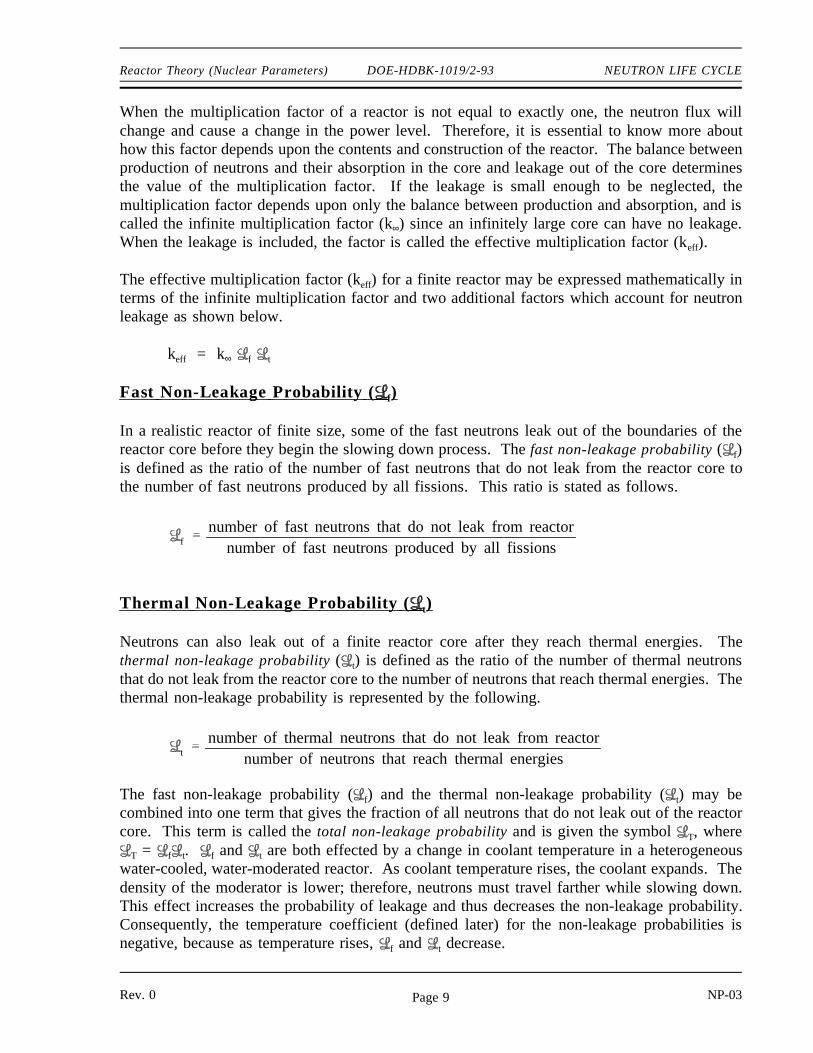
When the multiplication factor of a reactor is not equal to exactly one, the neutron flux willchange and cause a change in the power level. Therefore, it is essential to know more abouthow this factor depends upon the contents and construction of the reactor. The balance betweenproduction of neutrons and their absorption in the core and leakage out of the core determinesthe value of the multiplication factor. If the leakage is small enough to be neglected, themultiplication factor depends upon only the balance between production and absorption, and iscalled the infinite multiplication factor (k∞) since an infinitely large core can have no leakage.When the leakage is included, the factor is called the effective multiplication factor (keff).
The effective multiplication factor (keff) for a finite reactor may be expressed mathematically interms of the infinite multiplication factor and two additional factors which account for neutronleakage as shown below.
keff = k∞ f t
Fast Non-Leakage Pr obability ( f)
In a realistic reactor of finite size, some of the fast neutrons leak out of the boundaries of thereactor core before they begin the slowing down process. The fast non-leakage probability ( f)is defined as the ratio of the number of fast neutrons that do not leak from the reactor core tothe number of fast neutrons produced by all fissions. This ratio is stated as follows.
f number of fast neutrons that do not leak from reactornumber of fast neutrons produced by all fissions
Ther mal Non-Leakage Pr obability ( t)
Neutrons can also leak out of a finite reactor core after they reach thermal energies. Thethermal non-leakage probability ( t) is defined as the ratio of the number of thermal neutronsthat do not leak from the reactor core to the number of neutrons that reach thermal energies. Thethermal non-leakage probability is represented by the following.
t number of thermal neutrons that do not leak from reactornumber of neutrons that reach thermal energies
The fast non-leakage probability ( f) and the thermal non-leakage probability ( t) may becombined into one term that gives the fraction of all neutrons that do not leak out of the reactorcore. This term is called the total non-leakage probability and is given the symbol T, where T = f t. f and t are both effected by a change in coolant temperature in a heterogeneouswater-cooled, water-moderated reactor. As coolant temperature rises, the coolant expands. Thedensity of the moderator is lower; therefore, neutrons must travel farther while slowing down.This effect increases the probability of leakage and thus decreases the non-leakage probability.Consequently, the temperature coefficient (defined later) for the non-leakage probabilities isnegative, because as temperature rises, f and t decrease.
Rev. 0 NP-03Page 9
NEUTRON LIFE CYCLE DOE-HDBK-1019/2-93 Reactor Theory (Nuclear Parameters)
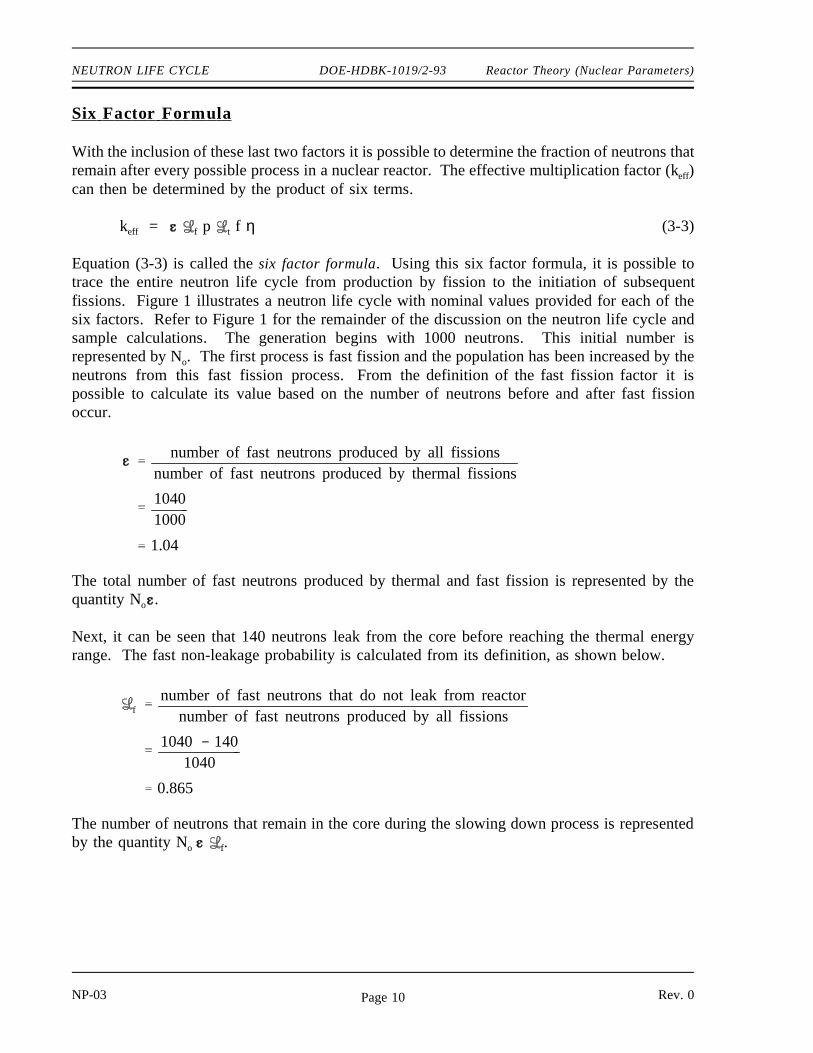
Six Factor For mula
With the inclusion of these last two factors it is possible to determine the fraction of neutrons thatremain after every possible process in a nuclear reactor. The effective multiplication factor (keff)can then be determined by the product of six terms.
keff = f p t f η (3-3)
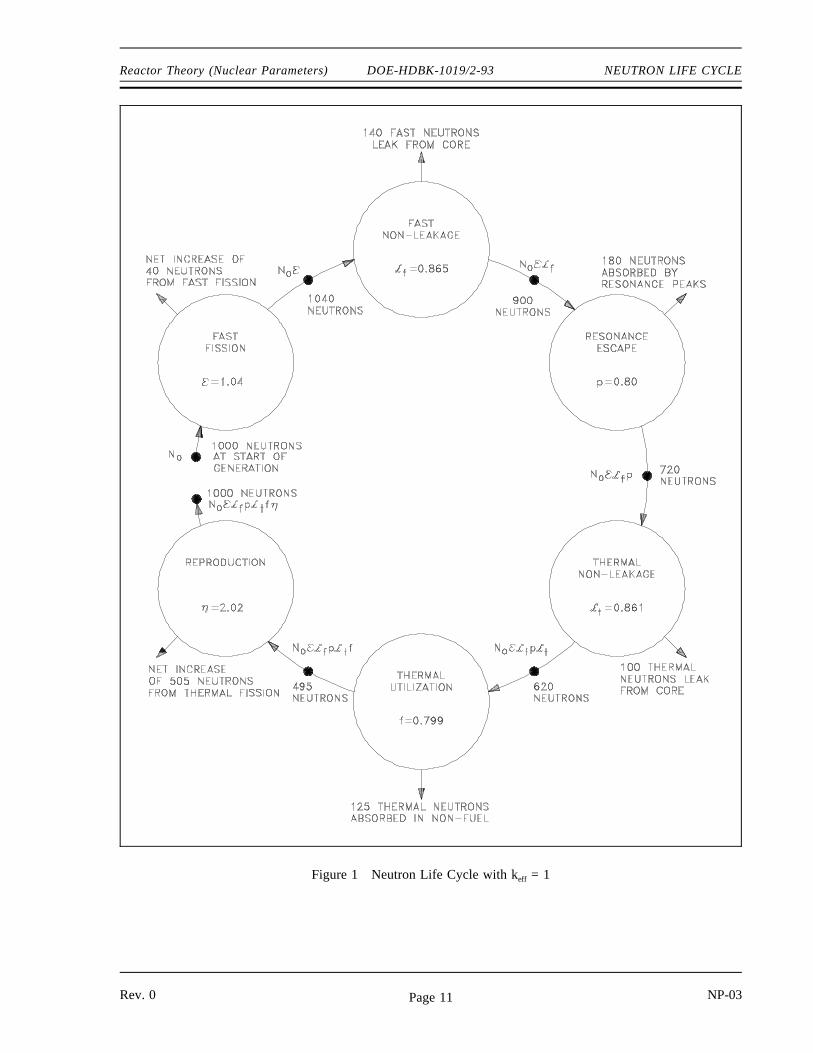
Equation (3-3) is called the six factor formula. Using this six factor formula, it is possible totrace the entire neutron life cycle from production by fission to the initiation of subsequentfissions. Figure 1 illustrates a neutron life cycle with nominal values provided for each of thesix factors. Refer to Figure 1 for the remainder of the discussion on the neutron life cycle andsample calculations. The generation begins with 1000 neutrons. This initial number isrepresented by No. The first process is fast fission and the population has been increased by theneutrons from this fast fission process. From the definition of the fast fission factor it ispossible to calculate its value based on the number of neutrons before and after fast fissionoccur.
number of fast neutrons produced by all fissionsnumber of fast neutrons produced by thermal fissions
10401000
1.04
The total number of fast neutrons produced by thermal and fast fission is represented by thequantity No .
Next, it can be seen that 140 neutrons leak from the core before reaching the thermal energyrange. The fast non-leakage probability is calculated from its definition, as shown below.
f number of fast neutrons that do not leak from reactornumber of fast neutrons produced by all fissions
1040 1401040
0.865
The number of neutrons that remain in the core during the slowing down process is representedby the quantity No f.
NP-03 Rev. 0Page 10
Reactor Theory (Nuclear Parameters) DOE-HDBK-1019/2-93 NEUTRON LIFE CYCLE
Figure 1 Neutron Life Cycle with keff = 1
Rev. 0 NP-03Page 11
NEUTRON LIFE CYCLE DOE-HDBK-1019/2-93 Reactor Theory (Nuclear Parameters)
The next step in the analysis is to consider the number of neutrons that are absorbed in theintermediate energy level. The probability of escaping this resonance absorption (p) is statedas follows.
p number of neutrons that reach thermal energynumber of fast neutrons that start to slow down
720900
0.80
The number of neutrons entering the thermal energy range is now represented by the quantityNo f p.
After reaching thermal energies, 100 neutrons leak from the core. The value for t can becalculated by substitution of the known values in the definition as shown below.
t number of thermal neutrons that do not leak from reactornumber of neutrons that reach thermal energies
620720
0.861
The number of thermal neutrons available for absorption anywhere in the core is represented bythe quantity No f p t.
Figure 1 indicates that 125 neutrons were absorbed in non-fuel materials. Since a total of 620thermal neutrons were absorbed, the number absorbed by the fuel equals 620 - 125 = 495.Therefore, the thermal utilization factor can be calculated as follows.
f number of thermal neutrons absorbed in the fuelnumber of thermal neutrons absorbed in any reactor material
495620
0.799
NP-03 Rev. 0Page 12
Reactor Theory (Nuclear Parameters) DOE-HDBK-1019/2-93 NEUTRON LIFE CYCLE
The final factor numerically describes the production of fission neutrons resulting from thermalneutrons being absorbed in the fuel. This factor is called the reproduction factor (η). The valuefor the reproduction factor can be determined as shown below.
η number of fast neutrons produced by thermal fissionnumber of thermal neutrons absorbed in the fuel
1000495
2.02
The number of fission neutrons that exist at the end of the life cycle which are available to starta new generation and cycle is represented by the quantity No f p t f η.
In the example illustrated in Figure 1, keff is equal to one. Therefore, 1000 neutrons areavailable to start the next generation.
Example:
10,000 neutrons exist at the beginning of a generation. The values for each factor of thesix factor formula are listed below. Calculate the number of neutrons that exist at thepoints in the neutron life cycle listed below.
1) Number of neutrons that exist after fast fission.2) Number of neutrons that start to slow down in the reactor.3) Number of neutrons that reach thermal energies.4) Number of thermal neutrons that are absorbed in the reactor.5) Number of thermal neutrons absorbed in the fuel.6) Number of neutrons produced from thermal fission.
= 1.031 f = 0.889 f = 0.751p = 0.803 t = 0.905 η = 2.012
Solution:
1) N = No = 10,3102) N = No f = 9,1663) N = No f p = 7,3604) N = No f p t = 6,6615) N = No f p t f = 5,0026) N = No f p t f η = 10,065
Rev. 0 NP-03Page 13
NEUTRON LIFE CYCLE DOE-HDBK-1019/2-93 Reactor Theory (Nuclear Parameters)
Neutr on L ife Cycle of a Fast Reactor
The neutron life cycle in a fast reactor is markedly different than that for a thermal reactor. Ina fast reactor, care is taken during the reactor design to minimize thermalization of neutrons.Virtually all fissions taking place in a fast reactor are caused by fast neutrons. Due to this, manyfactors that are taken into account by the thermal reactor neutron life cycle are irrelevant to thefast reactor neutron life cycle. The resonance escape probability is not significant because veryfew neutrons exist at energies where resonance absorption is significant. The thermalnon-leakage probability does not exist because the reactor is designed to avoid the thermalizationof neutrons. A separate term to deal with fast fission is not necessary because all fission is fastfission and is handled by the reproduction factor.
The thermal utilization factor is modified to describe the utilization of fast neutrons instead ofthermal neutrons. The reproduction factor is similarly modified to account for fast fissioninstead of thermal fission.
Summary
The important information in this chapter is summarized on the following pages.
NP-03 Rev. 0Page 14
Reactor Theory (Nuclear Parameters) DOE-HDBK-1019/2-93 NEUTRON LIFE CYCLE
Neutron Life Cycle Summary
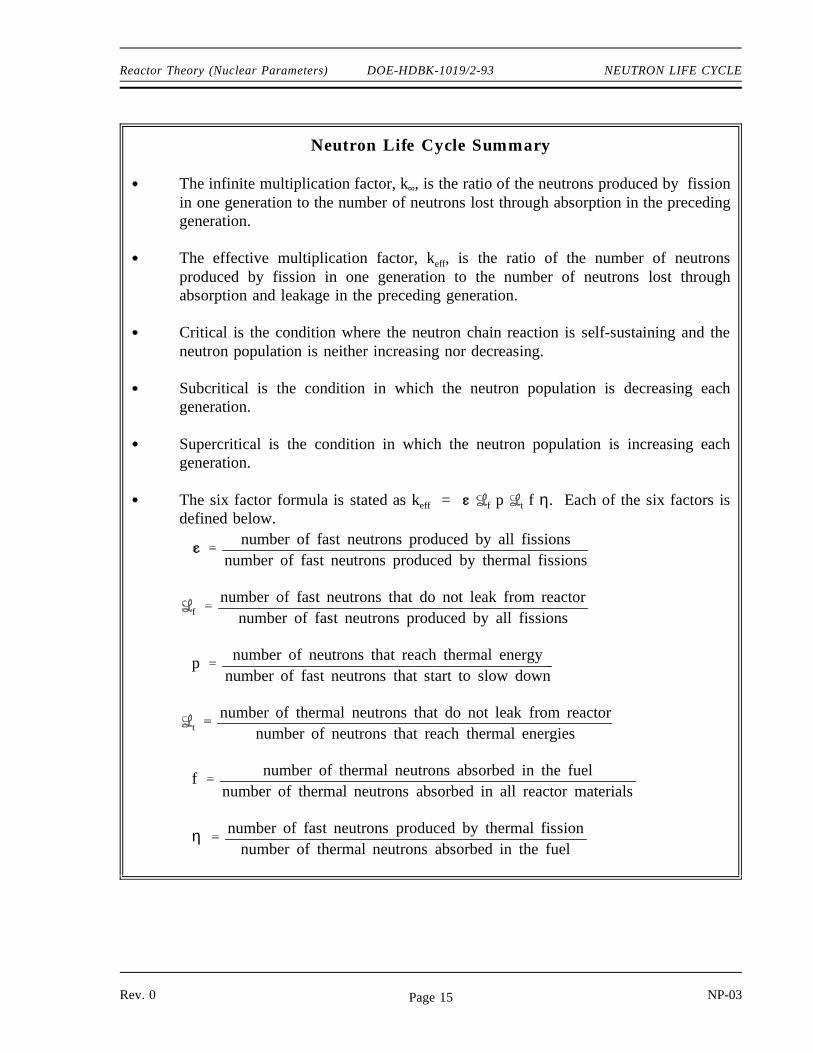
The infinite multiplication factor, k∞, is the ratio of the neutrons produced by fissionin one generation to the number of neutrons lost through absorption in the precedinggeneration.
The effective multiplication factor, keff, is the ratio of the number of neutronsproduced by fission in one generation to the number of neutrons lost throughabsorption and leakage in the preceding generation.
Critical is the condition where the neutron chain reaction is self-sustaining and theneutron population is neither increasing nor decreasing.
Subcritical is the condition in which the neutron population is decreasing eachgeneration.
Supercritical is the condition in which the neutron population is increasing eachgeneration.
The six factor formula is stated as keff = f p t f η. Each of the six factors isdefined below.
number of fast neutrons produced by all fissionsnumber of fast neutrons produced by thermal fissions
f number of fast neutrons that do not leak from reactornumber of fast neutrons produced by all fissions
p number of neutrons that reach thermal energynumber of fast neutrons that start to slow down
t number of thermal neutrons that do not leak from reactornumber of neutrons that reach thermal energies
f number of thermal neutrons absorbed in the fuelnumber of thermal neutrons absorbed in all reactor materials
η number of fast neutrons produced by thermal fissionnumber of thermal neutrons absorbed in the fuel
Rev. 0 NP-03Page 15
NEUTRON LIFE CYCLE DOE-HDBK-1019/2-93 Reactor Theory (Nuclear Parameters)
Neutron Life Cycle Summary (Cont.)
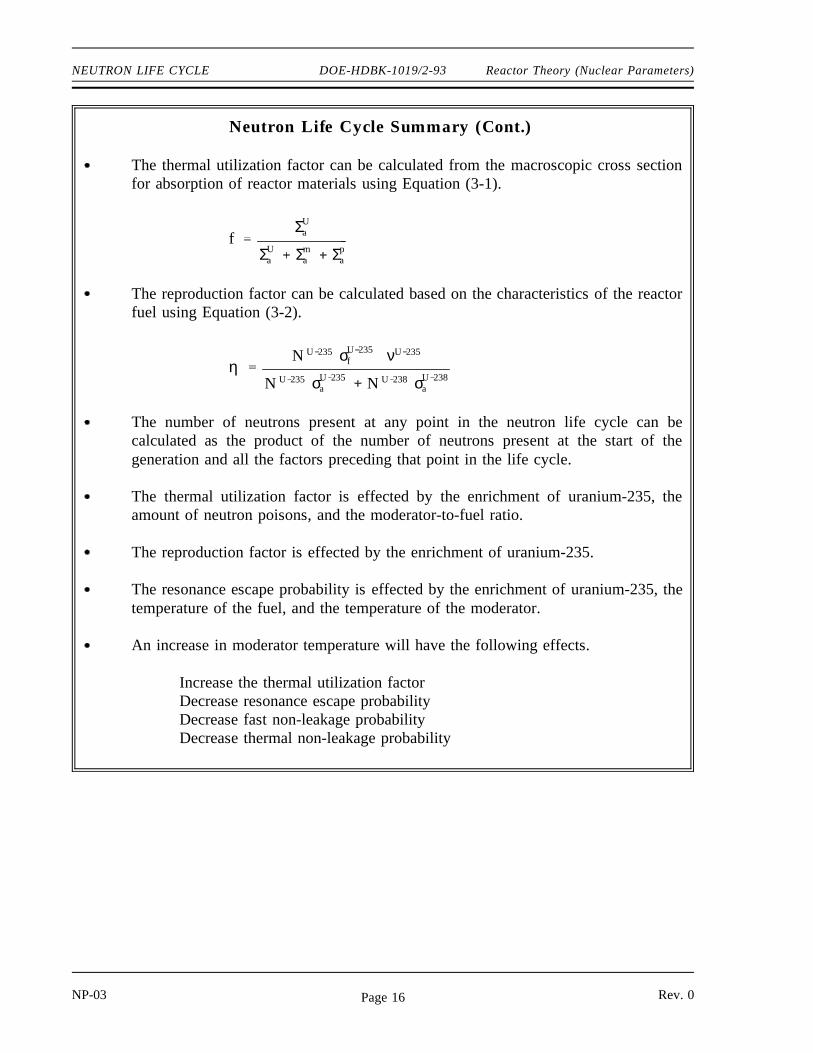
The thermal utilization factor can be calculated from the macroscopic cross sectionfor absorption of reactor materials using Equation (3-1).
f ΣUa
ΣUa Σm
a Σpa
The reproduction factor can be calculated based on the characteristics of the reactorfuel using Equation (3-2).
η N U 235 σU 235f νU 235
N U 235 σU 235a N U 238 σU 238
a
The number of neutrons present at any point in the neutron life cycle can becalculated as the product of the number of neutrons present at the start of thegeneration and all the factors preceding that point in the life cycle.
The thermal utilization factor is effected by the enrichment of uranium-235, theamount of neutron poisons, and the moderator-to-fuel ratio.
The reproduction factor is effected by the enrichment of uranium-235.
The resonance escape probability is effected by the enrichment of uranium-235, thetemperature of the fuel, and the temperature of the moderator.
An increase in moderator temperature will have the following effects.
Increase the thermal utilization factorDecrease resonance escape probabilityDecrease fast non-leakage probabilityDecrease thermal non-leakage probability
NP-03 Rev. 0Page 16
Reactor Theory (Nuclear Parameters) DOE-HDBK-1019/2-93 REACTIVITY
REACTIVITY
Reactivity is a measure of the departure of a reactor from criticality. Thereactivity is related to the value of keff . Reactivity is a useful concept to predicthow the neutron population of a reactor will change over time.
EO 1.8 Given the number of neutrons in a reactor core and theeffective multiplication factor, CALCULATE the number ofneutrons present after any number of generations.
EO 1.9 DEFINE the term reactivity.
EO 1.10 CONVERT between reactivity and the associated value of keff.
EO 1.11 CONVERT measures of reactivity between the following units:
a. ∆∆k/k c. 10-4 ∆∆k/kb. % ∆∆k/k d. Percent millirho (pcm)
EO 1.12 EXPLAIN the relationship between reactivity coefficients andreactivity defects.
Application of the Effective Mu ltiplic ation Factor
When keff remains constant from generation to generation, it is possible to determine the numberof neutrons beginning any particular generation by knowing only the value of keff and the numberof neutrons starting the first generation. If No neutrons start the first generation, then No(keff)neutrons start the second generation. Equation (3-4) can be used to calculate the number ofneutrons after the completion of "n" generations.
(3-4)Nn No keffn
Rev. 0 NP-03Page 17
REACTIVITY DOE-HDBK-1019/2-93 Reactor Theory (Nuclear Parameters)
Example:
The number of neutrons in the core at time zero is 1000 and keff = 1.002. Calculate thenumber of neutrons after 50 generations.
Solution:
Use Equation (3-4) to calculate the number of neutrons.
Nn No keffn
N50 1000 neutrons 1.00250
1105 neutrons
Reactivity
If there are No neutrons in the preceding generation, then there are No(keff) neutrons in thepresent generation. The numerical change in neutron population is (Nokeff - No). The gain orloss in neutron population (Nokeff - No), expressed as a fraction of the present generation (Nokeff),is shown below.
No keff No
No keff
This relationship represents the fractional change in neutron population per generation and isreferred to as reactivity (ρ). Cancelling out the term No from the numerator and denominator,the reactivity is determined as shown in the equation below.
(3-5)ρ keff 1
keff
From Equation (3-5) it may be seen that ρ may be positive, zero, or negative, depending uponthe value of keff. The larger the absolute value of reactivity in the reactor core, the further thereactor is from criticality. It may be convenient to think of reactivity as a measure of a reactor'sdeparture from criticality.
NP-03 Rev. 0Page 18
Reactor Theory (Nuclear Parameters) DOE-HDBK-1019/2-93 REACTIVITY
Example:
Calculate the reactivity in the reactor core when keff is equal to 1.002 and 0.998.
Solution:
The reactivity for each case is determined by substituting the value of keff into Equation (3-5).
ρ keff 1
keff
1.002 11.002
0.001996
ρ keff 1
keff
0.998 10.998
0.0020
Units of Reactivity
Reactivity is a dimensionless number. It does not have dimensions of time, length, mass, or anycombination of these dimensions. It is simply a ratio of two quantities that are dimensionless.As shown in the calculation in the previous example, the value of reactivity is often a smalldecimal value. In order to make this value easier to express, artificial units are defined.
By definition, the value for reactivity that results directly from the calculation of Equation (3-5)is in units of ∆k/k. Alternative units for reactivity are %∆k/k and pcm (percent millirho). Theconversions between these units of reactivity are shown below.
1% ∆ kk
0.01 ∆ kk
1 pcm 0.00001 ∆ kk
Another unit of reactivity that is used at some reactors is equivalent to 10-4 ∆k/k. This unit ofreactivity does not have a unique name. Special units for reactivity that do have unique namesare dollars and cents. These units and their applications will be described in a later chapter.
Rev. 0 NP-03Page 19
REACTIVITY DOE-HDBK-1019/2-93 Reactor Theory (Nuclear Parameters)
Example:
Convert the values of reactivity listed below to the indicated units.
a. 0.000421 ∆k/k = pcmb. 0.0085 ∆k/k = % ∆k/kc. 16 x 10-4 ∆k/k = ∆k/k
Solution:
a. 42.1 pcmb. 0.85% ∆k/kc. 0.0016 ∆k/k
If the reactivity is known, the effective multiplication factor can be determined by solvingEquation (3-5) for keff in terms of the reactivity. This results in the following relationship.
(3-6)keff 11 ρ
Reactivity must be in units of ∆k/k for use in Equation (3-6).
Example:
Given a reactivity of -20.0 x 10⁻⁴ ∆k/k, calculate keff.
Solution:
keff 11 ρ
1
1 ( 20.0 x 10 4)
0. 998
NP-03 Rev. 0Page 20
Reactor Theory (Nuclear Parameters) DOE-HDBK-1019/2-93 REACTIVITY
Reactivity Coefficients and Reactivity Defects
The amount of reactivity (ρ) in a reactor core determines what the neutron population, andconsequently the reactor power, are doing at any given time. The reactivity can be effected bymany factors (for example, fuel depletion, temperature, pressure, or poisons). The next severalchapters discuss the factors affecting reactivity and how they are used to control or predictreactor behavior.
To quantify the effect that a variation in parameter (that is, increase in temperature, control rodinsertion, increase in neutron poison) will have on the reactivity of the core, reactivitycoefficients are used. Reactivity coefficients are the amount that the reactivity will change fora given change in the parameter. For instance, an increase in moderator temperature will causea decrease in the reactivity of the core. The amount of reactivity change per degree change inthe moderator temperature is the moderator temperature coefficient. Typical units for themoderator temperature coefficient are pcm/oF. Reactivity coefficients are generally symbolizedby αx, where x represents some variable reactor parameter that affects reactivity. The definitionof a reactivity coefficient in equation format is shown below.
αx ∆ ρ∆ x
If the parameter x increases and positive reactivity is added, then αx is positive. If the parameterx increases and negative reactivity is added, then αx is negative.
Reactivity defects (∆ρ) are the total reactivity change caused by a variation in a parameter.Reactivity defects can be determined by multiplying the change in the parameter by the averagevalue of the reactivity coefficient for that parameter. The equation below shows the generalmethod for relating reactivity coefficients to reactivity defects.
∆ρ = αx ∆x
Example:
The moderator temperature coefficient for a reactor is -8.2 pcm/oF. Calculate thereactivity defect that results from a temperature decrease of 5oF.
Solution:∆ ρ αT ∆ T
8.2 pcm°F
5 °F
41 pcm
The reactivity addition due to the temperature decrease was positive because of thenegative temperature coefficient.
Rev. 0 NP-03Page 21
REACTIVITY DOE-HDBK-1019/2-93 Reactor Theory (Nuclear Parameters)
Summary
The important information in this chapter is summarized below.
Reactivity Summary
The number of neutrons present in the core after a given number of generations iscalculated using Equation (3-4).
Nn No keffn
Reactivity is the fractional change in neutron population per generation.
Reactivity and keff are represented in Equation (3-5) and Equation (3-6),respectively.
ρ keff 1
keff
keff 11 ρ
The relationship between units of reactivity are listed below.
1% ∆ kk
0.01 ∆ kk
1 pcm 0.00001 ∆ kk
A reactivity coefficient is the amount of change in reactivity per unit change in theparameter. A reactivity defect is the total reactivity change caused by a change inthe parameter. The reactivity defect is the product of the reactivity coefficient andthe magnitude of the parameter change.
NP-03 Rev. 0Page 22
Reactor Theory (Nuclear Parameters) DOE-HDBK-1019/2-93 REACTIVITY COEFFICIENTS
REACTIVITY COEFFICIENTS
Changes in the physical properties of the materials in the reactor will result inchanges in the reactivity. Reactivity coefficients are useful in quantifying thereactivity change that will occur due to the change in a physical property such asthe temperature of the moderator or fuel.
EO 2.1 EXPLAIN the conditions of over moderation and undermoderation.
EO 2.2 EXPLAIN why many reactors are designed to be operated inan under moderated condition.
EO 2.3 STATE the effect that a change in moderator temperature willhave on the moderator to fuel ratio.
EO 2.4 DEFINE the temperature coefficient of reactivity.
EO 2.5 EXPLAIN why a negative temperature coefficient of reactivityis desirable.
EO 2.6 EXPLAIN why the fuel temperature coefficient is moreeffective than the moderator temperature coefficient interminating a rapid power rise.
EO 2.7 EXPLAIN the concept of Doppler broadening of resonanceabsorption peaks.
EO 2.8 LIST two nuclides that are present in some types of reactorfuel assemblies that have significant resonance absorptionpeaks.
EO 2.9 DEFINE the pressure coefficient of reactivity.
EO 2.10 EXPLAIN why the pressure coefficient of reactivity is usuallynegligible in a reactor cooled and moderated by a subcooledliquid.
EO 2.11 DEFINE the void coefficient of reactivity.
EO 2.12 IDENTIFY the moderator conditions under which the voidcoefficient of reactivity becomes significant.
Rev. 0 NP-03Page 23
REACTIVITY COEFFICIENTS DOE-HDBK-1019/2-93 Reactor Theory (Nuclear Parameters)
Moder ator Effects
As discussed in the previous module, a moderator possesses specific desirable characteristics.
(a) large neutron scattering cross section (b) low neutron absorption cross section (c) large neutron energy loss per collision
With the exception of the Liquid Metal Fast Breeder Reactor (LMFBR), the remaining majorreactor types that are currently employed use moderating materials to reduce fission neutronenergies to the thermal range. Light moderators (composed of light nuclei) are found to be moreeffective than heavy moderators because the light moderator removes more energy per collisionthan a heavy moderator. Therefore, the neutrons reach thermal energy more rapidly and they areless likely to be lost through resonance absorption.
As discussed in a previous module, the ability of a given material to slow down neutrons isreferred to as the macroscopic slowing down power (MSDP) and is defined as the product ofthe logarithmic energy decrement per collision (ξ) times the macroscopic scattering cross sectionfor neutrons as follows.
MSDP ξ Σs
Macroscopic slowing down power indicates how rapidly slowing down occurs in the materialin question, but it does not completely define the effectiveness of the material as a moderator.An element such as boron has a high logarithmic energy decrement and a good slowing downpower, but is a poor moderator. It is a poor moderator because of its high probability ofabsorbing neutrons, and may be accounted for by dividing the macroscopic slowing down powerby the macroscopic absorption cross section. This relationship is called the moderating ratio(MR).
MR ξ Σs
Σa
The moderating ratio is merely the ratio of slowing down power to the macroscopic absorptioncross section. The higher the moderating ratio, the more effectively the material performs as amoderator.
Another ratio, the moderator-to-fuel ratio (Nm/Nu), is very important in the discussion ofmoderators. As the reactor designer increases the amount of moderator in the core (that is,Nm/Nu increases), neutron leakage decreases. Neutron absorption in the moderator (Σm
a ) increasesand causes a decrease in the thermal utilization factor. Having insufficient moderator in the core(that is, Nm/Nu decreases) causes an increase in slowing down time and results in a greater lossof neutrons by resonance absorption. This also causes an increase in neutron leakage. Theeffects of varying the moderator-to-fuel ratio on the thermal utilization factor and the resonanceprobability are shown in Figure 2.
NP-03 Rev. 0Page 24
Reactor Theory (Nuclear Parameters) DOE-HDBK-1019/2-93 REACTIVITY COEFFICIENTS
Because the moderator-to-fuel ratio affects the thermal utilization factor and the resonance escape
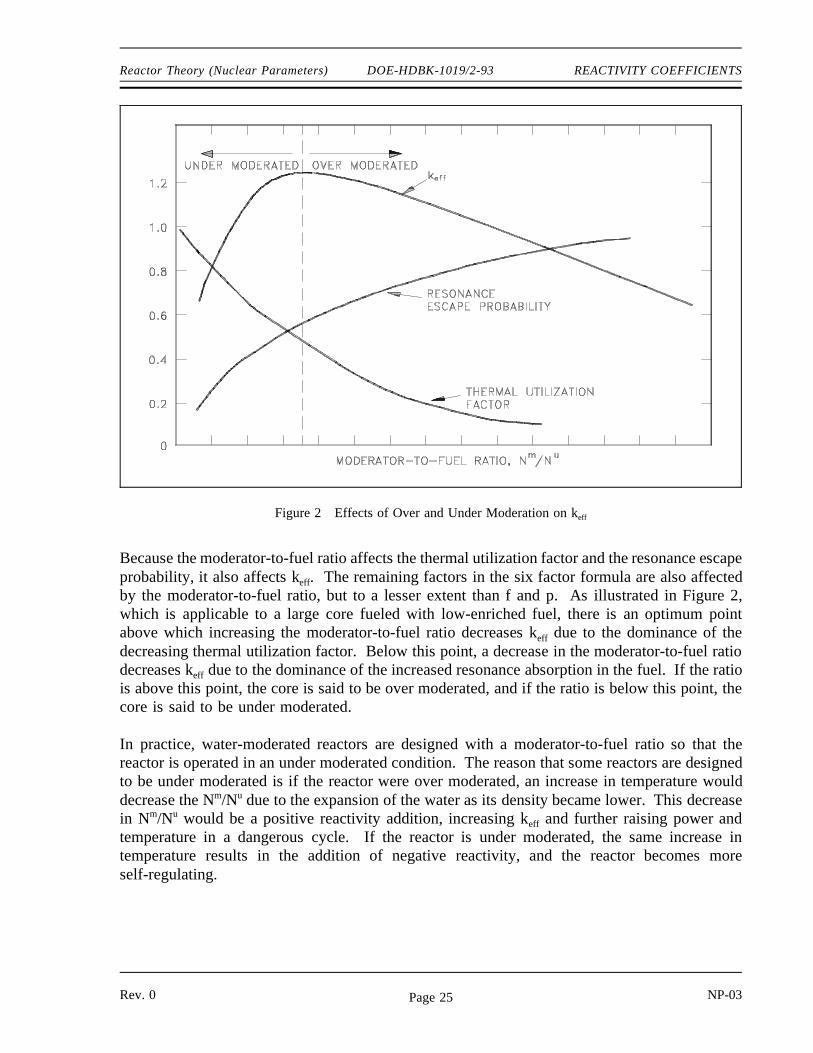
Figure 2 Effects of Over and Under Moderation on keff
probability, it also affects keff. The remaining factors in the six factor formula are also affectedby the moderator-to-fuel ratio, but to a lesser extent than f and p. As illustrated in Figure 2,which is applicable to a large core fueled with low-enriched fuel, there is an optimum pointabove which increasing the moderator-to-fuel ratio decreases keff due to the dominance of thedecreasing thermal utilization factor. Below this point, a decrease in the moderator-to-fuel ratiodecreases keff due to the dominance of the increased resonance absorption in the fuel. If the ratiois above this point, the core is said to be over moderated, and if the ratio is below this point, thecore is said to be under moderated.
In practice, water-moderated reactors are designed with a moderator-to-fuel ratio so that thereactor is operated in an under moderated condition. The reason that some reactors are designedto be under moderated is if the reactor were over moderated, an increase in temperature woulddecrease the Nm/Nu due to the expansion of the water as its density became lower. This decreasein Nm/Nu would be a positive reactivity addition, increasing keff and further raising power andtemperature in a dangerous cycle. If the reactor is under moderated, the same increase intemperature results in the addition of negative reactivity, and the reactor becomes moreself-regulating.
Rev. 0 NP-03Page 25
REACTIVITY COEFFICIENTS DOE-HDBK-1019/2-93 Reactor Theory (Nuclear Parameters)
Moder ator Temper atur e Coefficient
The change in reactivity per degree change in temperature is called the temperature coefficientof reactivity. Because different materials in the reactor have different reactivity changes withtemperature and the various materials are at different temperatures during reactor operation,several different temperature coefficients are used. Usually, the two dominant temperaturecoefficients are the moderator temperature coefficient and the fuel temperature coefficient.
The change in reactivity per degree change in moderator temperature is called the moderatortemperature coefficient of reactivity. The magnitude and sign (+ or -) of the moderatortemperature coefficient is primarily a function of the moderator-to-fuel ratio. If a reactor isunder moderated, it will have a negative moderator temperature coefficient. If a reactor is overmoderated, it will have a positive moderator temperature coefficient. A negative moderatortemperature coefficient is desirable because of its self-regulating effect. For example, anincrease in reactivity causes the reactor to produce more power. This raises the temperature ofthe core and adds negative reactivity, which slows down, or turns, the power rise.
Fuel Temper atur e Coefficient
Another temperature coefficient of reactivity, the fuel temperature coefficient, has a greater effectthan the moderator temperature coefficient for some reactors. The fuel temperature coefficientis the change in reactivity per degree change in fuel temperature. This coefficient is also calledthe "prompt" temperature coefficient because an increase in reactor power causes an immediatechange in fuel temperature. A negative fuel temperature coefficient is generally considered tobe even more important than a negative moderator temperature coefficient because fueltemperature immediately increases following an increase in reactor power. The time for heat tobe transferred to the moderator is measured in seconds. In the event of a large positive reactivityinsertion, the moderator temperature cannot turn the power rise for several seconds, whereas thefuel temperature coefficient starts adding negative reactivity immediately.
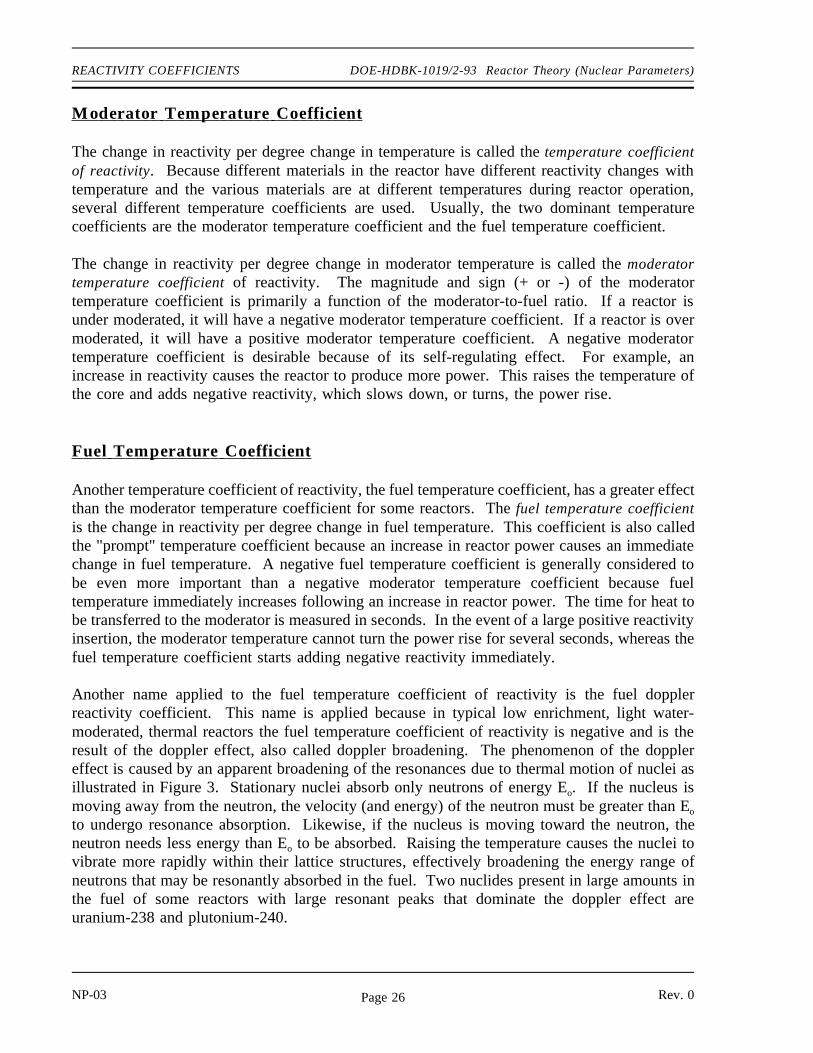
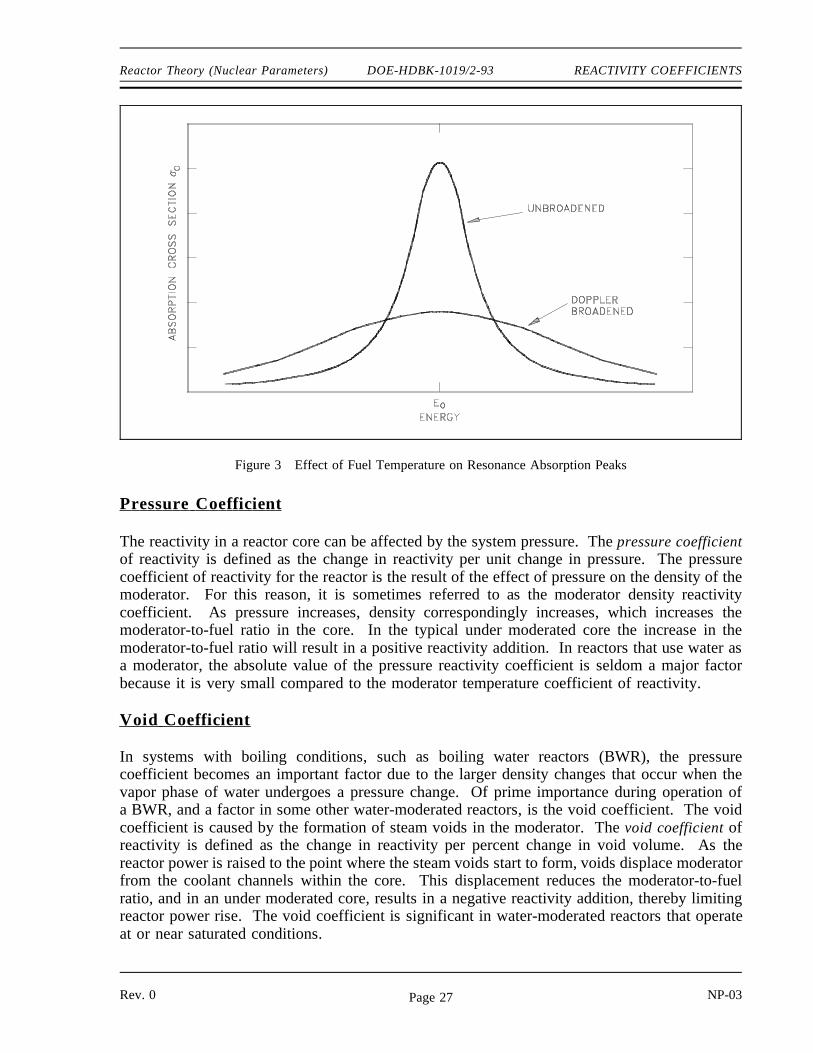
Another name applied to the fuel temperature coefficient of reactivity is the fuel dopplerreactivity coefficient. This name is applied because in typical low enrichment, light water-moderated, thermal reactors the fuel temperature coefficient of reactivity is negative and is theresult of the doppler effect, also called doppler broadening. The phenomenon of the dopplereffect is caused by an apparent broadening of the resonances due to thermal motion of nuclei asillustrated in Figure 3. Stationary nuclei absorb only neutrons of energy Eo. If the nucleus ismoving away from the neutron, the velocity (and energy) of the neutron must be greater than Eo
to undergo resonance absorption. Likewise, if the nucleus is moving toward the neutron, theneutron needs less energy than Eo to be absorbed. Raising the temperature causes the nuclei tovibrate more rapidly within their lattice structures, effectively broadening the energy range ofneutrons that may be resonantly absorbed in the fuel. Two nuclides present in large amounts inthe fuel of some reactors with large resonant peaks that dominate the doppler effect areuranium-238 and plutonium-240.
NP-03 Rev. 0Page 26
Reactor Theory (Nuclear Parameters) DOE-HDBK-1019/2-93 REACTIVITY COEFFICIENTS
Pr essur e Coefficient
Figure 3 Effect of Fuel Temperature on Resonance Absorption Peaks
The reactivity in a reactor core can be affected by the system pressure. The pressure coefficientof reactivity is defined as the change in reactivity per unit change in pressure. The pressurecoefficient of reactivity for the reactor is the result of the effect of pressure on the density of themoderator. For this reason, it is sometimes referred to as the moderator density reactivitycoefficient. As pressure increases, density correspondingly increases, which increases themoderator-to-fuel ratio in the core. In the typical under moderated core the increase in themoderator-to-fuel ratio will result in a positive reactivity addition. In reactors that use water asa moderator, the absolute value of the pressure reactivity coefficient is seldom a major factorbecause it is very small compared to the moderator temperature coefficient of reactivity.
Void Coefficient
In systems with boiling conditions, such as boiling water reactors (BWR), the pressurecoefficient becomes an important factor due to the larger density changes that occur when thevapor phase of water undergoes a pressure change. Of prime importance during operation ofa BWR, and a factor in some other water-moderated reactors, is the void coefficient. The voidcoefficient is caused by the formation of steam voids in the moderator. The void coefficient ofreactivity is defined as the change in reactivity per percent change in void volume. As thereactor power is raised to the point where the steam voids start to form, voids displace moderatorfrom the coolant channels within the core. This displacement reduces the moderator-to-fuelratio, and in an under moderated core, results in a negative reactivity addition, thereby limitingreactor power rise. The void coefficient is significant in water-moderated reactors that operateat or near saturated conditions.
Rev. 0 NP-03Page 27
REACTIVITY COEFFICIENTS DOE-HDBK-1019/2-93 Reactor Theory (Nuclear Parameters)
Summary
The important information in this chapter is summarized below.
Reactivity Coefficients Summary
The temperature coefficient of reactivity is the change in reactivity per degreechange in temperature.
A reactor is under moderated when a decrease in the moderator-to-fuel ratiodecreases keff due to the increased resonance absorption. A reactor is overmoderated when an increase in the moderator-to-fuel ratio decreases keff due tothe decrease in the thermal utilization factor.
Reactors are usually designed to operate in an under moderated condition so thatthe moderator temperature coefficient of reactivity is negative.
Increasing the moderator temperature will decrease the moderator-to-fuel ratio.Decreasing the moderator temperature will increase the moderator-to-fuel ratio.
A negative temperature coefficient of reactivity is desirable because it makes thereactor more self-regulating. An increase in power, resulting in an increase intemperature, results in negative reactivity addition due to the temperaturecoefficient. The negative reactivity addition due to the temperature increase willslow or stop the power increase.
The fuel temperature coefficient is more effective than the moderator temperaturecoefficient in terminating a rapid power rise because the fuel temperatureimmediately increases following a power increase, while the moderatortemperature does not increase for several seconds.
The Doppler broadening of resonance peaks occurs because the nuclei may bemoving either toward or away from the neutron at the time of interaction.Therefore, the neutron may actually have either slightly more or slightly less thanthe resonant energy, but still appear to be at resonant energy relative to thenucleus.
Uranium-238 and plutonium-240 are two nuclides present in some reactor fuelsthat have large resonance absorption peaks.
NP-03 Rev. 0Page 28
Reactor Theory (Nuclear Parameters) DOE-HDBK-1019/2-93 REACTIVITY COEFFICIENTS
Reactivity Coefficients Summary (Cont.)
The pressure coefficient of reactivity is the change in reactivity per unit changein pressure.
The pressure coefficient of reactivity is usually negligible in reactors moderatedby subcooled liquids because the density of the liquid does not changesignificantly within the operating pressure range.
The void coefficient of reactivity is the change in reactivity per unit change invoid volume.
The void coefficient of reactivity becomes significant in a reactor in which themoderator is at or near saturated conditions.
Rev. 0 NP-03Page 29
NEUTRON POISONS DOE-HDBK-1019/2-93 Reactor Theory (Nuclear Parameters)
NEUTRON POISONS
In some reactors, neutron-absorbing materials called poisons are intentionallydesigned into the reactor for specific purposes. Some of these poisons deplete asthey absorb neutrons during reactor operation, and others remain relativelyconstant.
EO 3.1 DEFINE the following terms:
a. Burnable poisonb. Non-burnable poisonc. Chemical shim
EO 3.2 EXPLAIN the use of burnable neutron poisons in a reactorcore.
EO 3.3 LIST the advantages and disadvantages of chemical shim overfixed burnable poisons.
EO 3.4 STATE two reasons why fixed non-burnable neutron poisonsare used in reactor cores.
EO 3.5 STATE an example of a material used as a fixed non-burnableneutron poison.
Fixed Bur nable Poisons
During operation of a reactor the amount of fuel contained in the core constantly decreases. Ifthe reactor is to operate for a long period of time, fuel in excess of that needed for exactcriticality must be added when the reactor is built. The positive reactivity due to the excess fuelmust be balanced with negative reactivity from neutron-absorbing material. Moveable controlrods containing neutron-absorbing material are one method used to offset the excess fuel. Controlrods will be discussed in detail in a later chapter. Using control rods alone to balance the excessreactivity may be undesirable or impractical for several reasons. One reason for a particular coredesign may be that there is physically insufficient room for the control rods and their largemechanisms.
NP-03 Rev. 0Page 30

Reactor Theory (Nuclear Parameters) DOE-HDBK-1019/2-93 NEUTRON POISONS
To control large amounts of excess fuel without adding additional control rods, burnable poisonsare loaded into the core. Burnable poisons are materials that have a high neutron absorptioncross section that are converted into materials of relatively low absorption cross section as theresult of neutron absorption. Due to the burnup of the poison material, the negative reactivityof the burnable poison decreases over core life. Ideally, these poisons should decrease theirnegative reactivity at the same rate the fuel's excess positive reactivity is depleted. Fixedburnable poisons are generally used in the form of compounds of boron or gadolinium that areshaped into separate lattice pins or plates, or introduced as additives to the fuel. Since they canusually be distributed more uniformly than control rods, these poisons are less disruptive to thecore power distribution.
Soluble Poisons
Soluble poisons, also called chemical shim, produce a spatially uniform neutron absorption whendissolved in the water coolant. The most common soluble poison in commercial pressurizedwater reactors (PWR) is boric acid, which is often referred to as "soluble boron," or simply"solbor." The boric acid in the coolant decreases the thermal utilization factor, causing adecrease in reactivity. By varying the concentration of boric acid in the coolant (a processreferred to as boration and dilution), the reactivity of the core can be easily varied. If the boronconcentration is increased, the coolant/moderator absorbs more neutrons, adding negativereactivity. If the boron concentration is reduced (dilution), positive reactivity is added. Thechanging of boron concentration in a PWR is a slow process and is used primarily to compensatefor fuel burnout or poison buildup. The variation in boron concentration allows control rod useto be minimized, which results in a flatter flux profile over the core than can be produced byrod insertion. The flatter flux profile is due to the fact that there are no regions of depressedflux like those that would be produced in the vicinity of inserted control rods.
DOE reactors typically do not use soluble neutron poisons during normal operation. Some DOEreactors do, however, include emergency shutdown systems that inject solutions containingneutron poisons into the system that circulates reactor coolant. Various solutions, includingsodium polyborate and gadolinium nitrate, are used.
Fixed burnable poisons possess some advantages over chemical shim. Fixed burnable poisonsmay be discretely loaded in specific locations in order to shape or control flux profiles in thecore. Also, fixed burnable poisons do not make the moderator temperature reactivity coefficientless negative as chemical shim does. With chemical shim, as temperature rises and themoderator expands, some moderator is pushed out of the active core area. Boron is also movedout, and this has a positive effect on reactivity. This property of chemical shim limits theallowable boron concentration because any greater concentration makes the moderatortemperature coefficient of reactivity positive.
Rev. 0 NP-03Page 31
NEUTRON POISONS DOE-HDBK-1019/2-93 Reactor Theory (Nuclear Parameters)
Non-Bur nable Poisons
A non-burnable poison is one that maintains a constant negative reactivity worth over the lifeof the core. While no neutron poison is strictly non-burnable, certain materials can be treatedas non-burnable poisons under certain conditions. One example is hafnium. The removal (byabsorption of neutrons) of one isotope of hafnium leads to the production of another neutronabsorber, and continues through a chain of five absorbers. This absorption chain results in along-lived burnable poison which approximates non-burnable characteristics. Absorbers with lowneutron absorption cross sections can also be treated as non-burnable under most conditions.
It is possible to make the reactivity of a poison material that is usually a burnable poison moreuniform over core life through the use of self-shielding. In self-shielding, the poison materialis thick enough that only the outer layer of the poison is exposed to the neutron flux. Theabsorptions that take place in the outer layers reduce the number of neutrons that penetrate to theinner material. As the outer layers of poison absorb neutrons and are converted to non-poisonmaterials, the inner layers begin absorbing more neutrons, and the negative reactivity of thepoison is fairly uniform.
The normal use of fixed non-burnable poisons is in power shaping, or to prevent excessive fluxand power peaking near moderator regions of the reactor.
NP-03 Rev. 0Page 32
Reactor Theory (Nuclear Parameters) DOE-HDBK-1019/2-93 NEUTRON POISONS
Summary
The important information in this chapter is summarized below.
Neutron Poisons Summary
A burnable neutron poison is a material that has a high neutron absorption crosssection that is converted into a material of relatively low absorption cross sectionas the result of neutron absorption.
A non-burnable neutron poison is a material that has relatively constant neutronabsorption characteristics over core life. The absorption of a neutron by one isotopein the material produces another isotope that also has a high absorption crosssection.
Chemical shim is a soluble neutron poison that is circulated in the coolant duringnormal operation.
Burnable neutron poisons are used in reactor cores to compensate for the excesspositive reactivity of the fuel when the reactor is initially started up.
Chemical shim has several advantages over fixed burnable poisons.Has a spatially uniform effectPossible to increase or decrease amount of poison in the core duringreactor operation
Fixed burnable poisons have several advantages over chemical shim. Can be used to shape flux profilesDo not have an adverse effect on moderator temperature coefficient
Two reasons for using non-burnable neutron poisons in reactor cores are to shape powerand to prevent excessive flux and power peaking near moderator regions.
An example of a material that is used as a fixed non-burnable neutron poison ishafnium.
Rev. 0 NP-03Page 33
XENON DOE-HDBK-1019/2-93 Reactor Theory (Nuclear Parameters)
XENON
Xenon-135 has a tremendous impact on the operation of a nuclear reactor. It isimportant to understand the mechanisms that produce and remove xenon from thereactor to predict how the reactor will respond following changes in power level.
EO 4.1 LIST two methods of production and two methods of removalfor xenon-135 during reactor operation.
EO 4.2 STATE the equation for equilibrium xenon-135 concentration.
EO 4.3 DESCRIBE how equilibrium xenon-135 concentration varieswith reactor power level.
EO 4.4 DESCRIBE the causes and effects of a xenon oscillation.
EO 4.5 DESCRIBE how xenon-135 concentration changes following areactor shutdown from steady-state conditions.
EO 4.6 EXPLAIN the effect that pre-shutdown power levels have onthe xenon-135 concentration after shutdown.
EO 4.7 STATE the approximate time following a reactor shutdown atwhich the reactor can be considered "xenon free."
EO 4.8 EXPLAIN what is meant by the following terms:
a. Xenon precluded startupb. Xenon dead time
EO 4.9 DESCRIBE how xenon-135 concentration changes following anincrease or a decrease in the power level of a reactor.
Fission Pr oduct Poisons
Fission fragments generated at the time of fission decay to produce a variety of fission products.Fission products are of concern in reactors primarily because they become parasitic absorbers ofneutrons and result in long term sources of heat. Although several fission products havesignificant neutron absorption cross sections, xenon-135 and samarium-149 have the mostsubstantial impact on reactor design and operation. Because these two fission product poisonsremove neutrons from the reactor, they will have an impact on the thermal utilization factor and thus keff and reactivity.
NP-03 Rev. 0NP-03 Rev. 0Page 34
Reactor Theory (Nuclear Parameters) DOE-HDBK-1019/2-93 XENON
Pr oduction and Removal of Xenon-135
Xenon-135 has a 2.6 x 10⁶ barns neutron absorption cross section. It is produced directly bysome fissions, but is more commonly a product of the tellurium-135 decay chain shown below.The fission yield (γ) for xenon-135 is about 0.3%, while γ for tellurium-135 is about 6%.
135
52Te
β
→19.0 sec
135
53I
β
→6.57 hr
135
54Xe
β
→9.10 hr
135
55Cs
β
→2.3x10⁶ yr
135
56Ba (stable)
The half-life for tellurium-135 is so short compared to the other half-lives that it can be assumedthat iodine-135 is produced directly from fission. Iodine-135 is not a strong neutron absorber,but decays to form the neutron poison xenon-135. Ninety-five percent of all the xenon-135produced comes from the decay of iodine-135. Therefore, the half-life of iodine-135 plays animportant role in the amount of xenon-135 present.
The rate of change of iodine concentration is equal to the rate of production minus the rate ofremoval. This can be expressed in the equation below.
rate of change of iodine concentration = yield from fission - decay rate - burnup rateor
dNI
dt γ I Σfuel
f φ λ I NI σIa NI φ
where:NI = 135I concentration
γI = fission yield of 135I
Σff uel = macroscopic fission cross section fuel
φ = thermal neutron flux
λI = decay constant for 135I
= microscopic absorption cross section 135IσIa
Since the is very small, the burn up rate term may be ignored, and the expression for the rateσIa
of change of iodine concentration is modified as shown below.
dNI
dt γ I Σfuel
f φ λ I NI
When the rate of production of iodine equals the rate of removal of iodine, equilibrium exists.The iodine concentration remains constant and is designated NI(eq). The following equation forthe equilibrium concentration of iodine can be determined from the preceding equation by settingthe two terms equal to each other and solving for NI(eq).
NP-03 Rev. 0Page 35
XENON DOE-HDBK-1019/2-93 Reactor Theory (Nuclear Parameters)
NI(eq) γ I Σfuelf φ
λ I
Since the equilibrium iodine concentration is proportional to the fission reaction rate, it is alsoproportional to reactor power level.
The rate of change of the xenon concentration is equal to the rate of production minus the rateof removal. Recall that 5% of xenon comes directly from fission and 95% comes from the decayof iodine. The rate of change of xenon concentration is expressed by the following equations.
rate of change ofxenon 135 concentration
xenon 135 yieldfrom fission
iodine 135
decay xenon 135
decay xenon 135
burnup
dNXe
dt γ Xe Σfuel
f φ λ I NI λXe NXe σXea NXe φ
where:NXe = 135Xe concentration
γXe = fission yield of 135Xe
Σff uel = macroscopic fission cross section of the fuel
φ = thermal neutron flux
λI = decay constant for 135I
NI = 135I concentration
λXe = decay constant for 135Xe
= microscopic absorption cross section135XeσXea
The xenon burnup term above refers to neutron absorption by xenon-135 by the followingreaction.
135
54Xe
1
0n →
136
54Xe γ
Xenon-136 is not a significant neutron absorber; therefore, the neutron absorption by xenon-135constitutes removal of poison from the reactor. The burnup rate of xenon-135 is dependent uponthe neutron flux and the xenon-135 concentration.
The equilibrium concentration of xenon-135 is designated NXe(eq), and is represented as shownbelow.
NXe (eq) γ Xe Σfuelf φ λ I NI
λXe σXea φ
NP-03 Rev. 0NP-03 Rev. 0Page 36
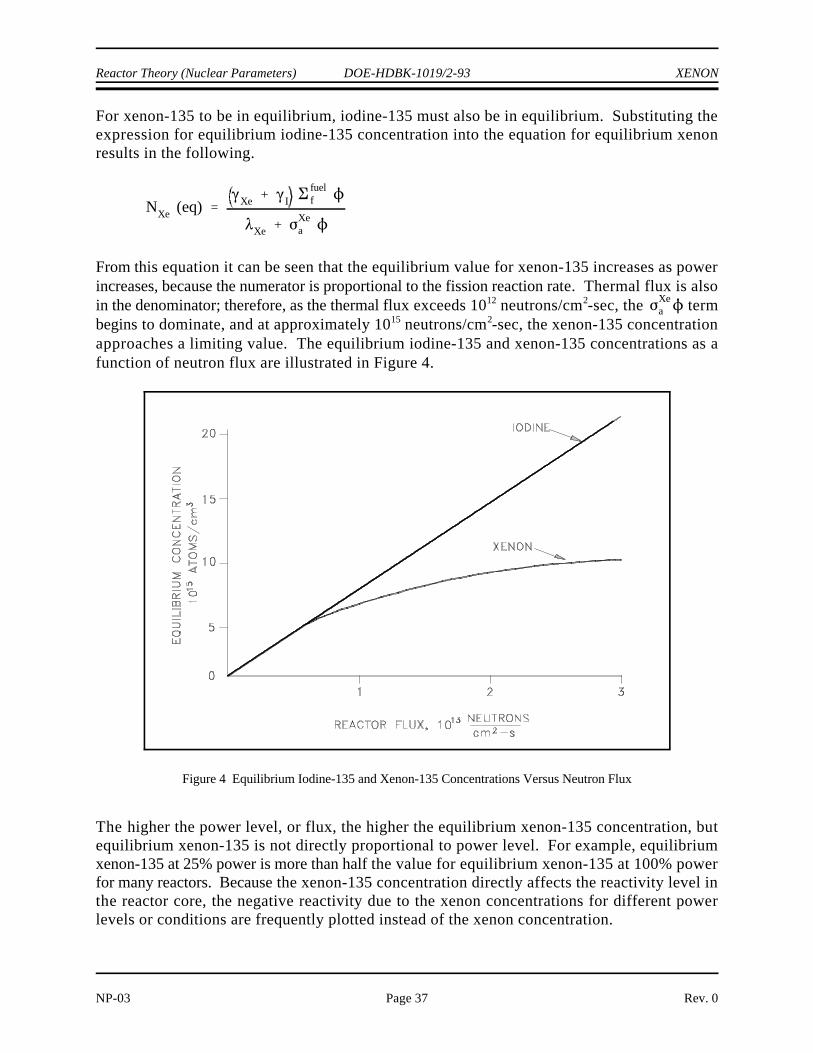
NXe (eq) Xe Ifuelf
XeXea
Xea
Reactor Theory (Nuclear Parameters) DOE-HDBK-1019/2-93 XENON
NP-03 Page 37 Rev. 0
Figure 4 Equilibrium Iodine-135 and Xenon-135 Concentrations Versus Neutron Flux
For xenon-135 to be in equilibrium, iodine-135 must also be in equilibrium. Substituting theexpression for equilibrium iodine-135 concentration into the equation for equilibrium xenonresults in the following.
From this equation it can be seen that the equilibrium value for xenon-135 increases as powerincreases, because the numerator is proportional to the fission reaction rate. Thermal flux is alsoin the denominator; therefore, as the thermal flux exceeds 10 neutrons/cm -sec, the term12 2
begins to dominate, and at approximately 10 neutrons/cm -sec, the xenon-135 concentration15 2
approaches a limiting value. The equilibrium iodine-135 and xenon-135 concentrations as afunction of neutron flux are illustrated in Figure 4.
The higher the power level, or flux, the higher the equilibrium xenon-135 concentration, butequilibrium xenon-135 is not directly proportional to power level. For example, equilibriumxenon-135 at 25% power is more than half the value for equilibrium xenon-135 at 100% powerfor many reactors. Because the xenon-135 concentration directly affects the reactivity level inthe reactor core, the negative reactivity due to the xenon concentrations for different powerlevels or conditions are frequently plotted instead of the xenon concentration.
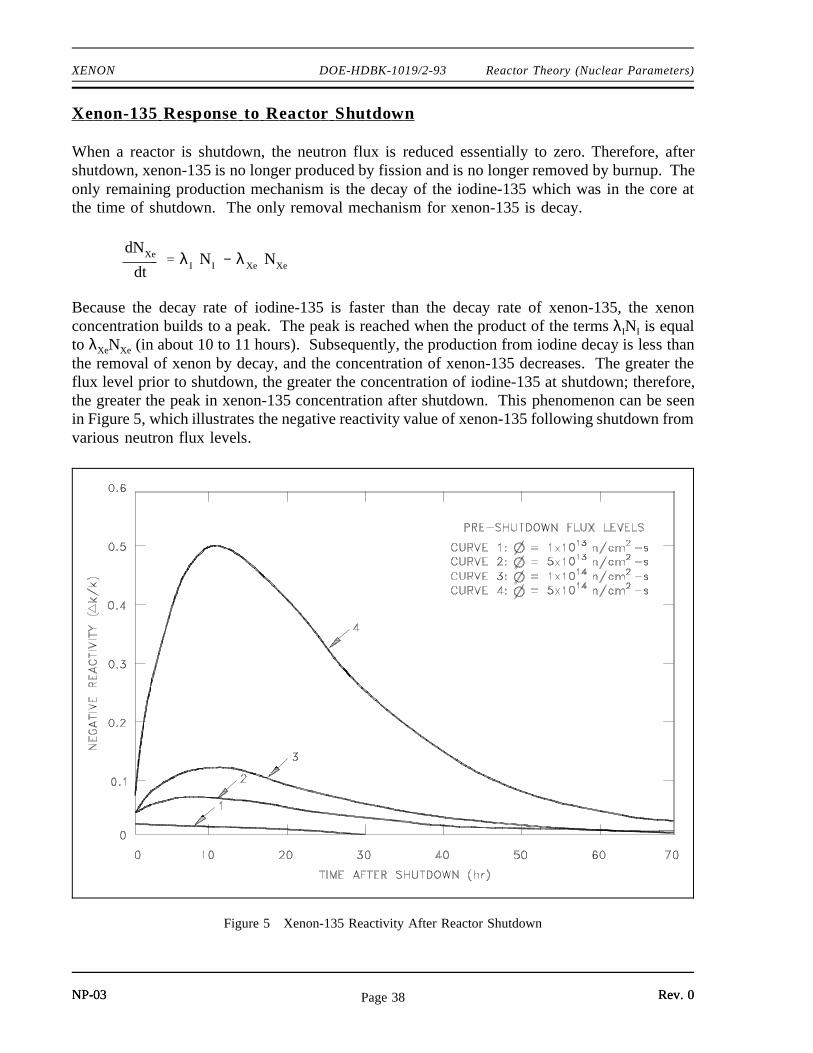
XENON DOE-HDBK-1019/2-93 Reactor Theory (Nuclear Parameters)
Xenon-135 Response to Reactor Shutdown
When a reactor is shutdown, the neutron flux is reduced essentially to zero. Therefore, aftershutdown, xenon-135 is no longer produced by fission and is no longer removed by burnup. Theonly remaining production mechanism is the decay of the iodine-135 which was in the core atthe time of shutdown. The only removal mechanism for xenon-135 is decay.
dNXe
dt λ I NI λXe NXe
Because the decay rate of iodine-135 is faster than the decay rate of xenon-135, the xenonconcentration builds to a peak. The peak is reached when the product of the terms λINI is equalto λXeNXe (in about 10 to 11 hours). Subsequently, the production from iodine decay is less thanthe removal of xenon by decay, and the concentration of xenon-135 decreases. The greater theflux level prior to shutdown, the greater the concentration of iodine-135 at shutdown; therefore,the greater the peak in xenon-135 concentration after shutdown. This phenomenon can be seenin Figure 5, which illustrates the negative reactivity value of xenon-135 following shutdown fromvarious neutron flux levels.
Figure 5 Xenon-135 Reactivity After Reactor Shutdown
NP-03 Rev. 0NP-03 Rev. 0Page 38
Reactor Theory (Nuclear Parameters) DOE-HDBK-1019/2-93 XENON
Negative xenon reactivity, also called xenon poisoning, may provide sufficient negative reactivityto make the reactor inoperable because there is insufficient positive reactivity available fromcontrol rod removal or chemical shim dilution (if used) to counteract it. The inability of thereactor to be started due to the effects of xenon is sometimes referred to as a xenon precludedstartup. The period of time where the reactor is unable to "override" the effects of xenon iscalled xenon dead time. Because the amount of excess core reactivity available to override thenegative reactivity of the xenon is usually less than 10% ∆k/k, thermal power reactors arenormally limited to flux levels of about 5 x 10¹³ neutrons/cm2-sec so that timely restart can beensured after shutdown. For reactors with very low thermal flux levels (~5 x 10¹² neutrons/cm2-secor less), most xenon is removed by decay as opposed to neutron absorption. For these cases,reactor shutdown does not cause any xenon-135 peaking effect.
Following the peak in xenon-135 concentration about 10 hours after shutdown, the xenon-135concentration will decrease at a rate controlled by the decay of iodine-135 into xenon-135 andthe decay rate of xenon-135. For some reactors, the xenon-135 concentration about 20 hoursafter shutdown from full power will be the same as the equilibrium xenon-135 concentration atfull power. About 3 days after shutdown, the xenon-135 concentration will have decreased toa small percentage of its pre-shutdown level, and the reactor can be assumed to be xenon freewithout a significant error introduced into reactivity calculations.
Xenon-135 Oscillatio ns
Large thermal reactors with little flux coupling between regions may experience spatial poweroscillations because of the non-uniform presence of xenon-135. The mechanism is described inthe following four steps.
(1) An initial lack of symmetry in the core power distribution (for example, individual controlrod movement or misalignment) causes an imbalance in fission rates within the reactorcore, and therefore, in the iodine-135 buildup and the xenon-135 absorption.
(2) In the high-flux region, xenon-135 burnout allows the flux to increase further, while inthe low-flux region, the increase in xenon-135 causes a further reduction in flux. Theiodine concentration increases where the flux is high and decreases where the flux is low.
(3) As soon as the iodine-135 levels build up sufficiently, decay to xenon reverses the initialsituation. Flux decreases in this area, and the former low-flux region increases in power.
(4) Repetition of these patterns can lead to xenon oscillations moving about the core withperiods on the order of about 15 hours.
With little change in overall power level, these oscillations can change the local power levels bya factor of three or more. In a reactor system with strongly negative temperature coefficients,the xenon-135 oscillations are damped quite readily. This is one reason for designing reactorsto have negative moderator-temperature coefficients.
NP-03 Rev. 0Page 39
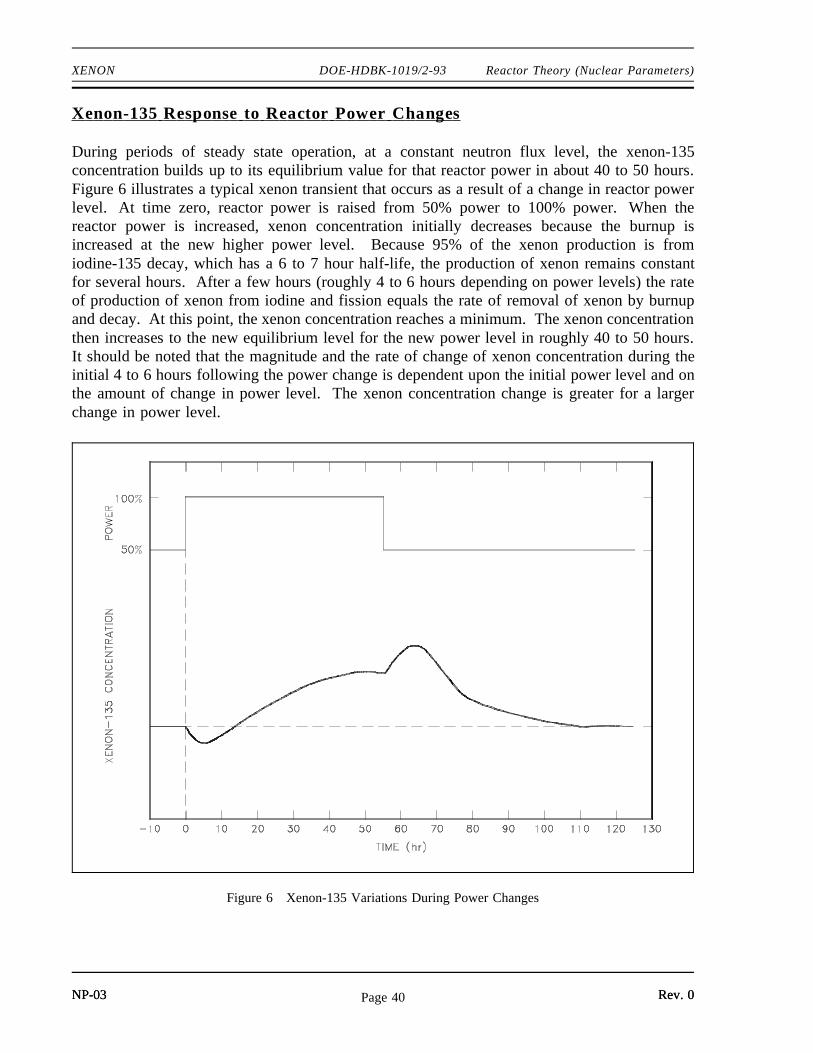
XENON DOE-HDBK-1019/2-93 Reactor Theory (Nuclear Parameters)
Xenon-135 Response to Reactor Power Changes
During periods of steady state operation, at a constant neutron flux level, the xenon-135concentration builds up to its equilibrium value for that reactor power in about 40 to 50 hours.Figure 6 illustrates a typical xenon transient that occurs as a result of a change in reactor powerlevel. At time zero, reactor power is raised from 50% power to 100% power. When thereactor power is increased, xenon concentration initially decreases because the burnup isincreased at the new higher power level. Because 95% of the xenon production is fromiodine-135 decay, which has a 6 to 7 hour half-life, the production of xenon remains constantfor several hours. After a few hours (roughly 4 to 6 hours depending on power levels) the rateof production of xenon from iodine and fission equals the rate of removal of xenon by burnupand decay. At this point, the xenon concentration reaches a minimum. The xenon concentrationthen increases to the new equilibrium level for the new power level in roughly 40 to 50 hours.It should be noted that the magnitude and the rate of change of xenon concentration during theinitial 4 to 6 hours following the power change is dependent upon the initial power level and onthe amount of change in power level. The xenon concentration change is greater for a largerchange in power level.
Figure 6 Xenon-135 Variations During Power Changes
NP-03 Rev. 0NP-03 Rev. 0Page 40
Reactor Theory (Nuclear Parameters) DOE-HDBK-1019/2-93 XENON
When reactor power is decreased from 100% to 50% power (t = 55 hours), the process isreversed. There is an immediate decrease in xenon burnup, which results in an increase inxenon-135 concentration. The iodine-135 concentration is still at the higher equilibrium levelfor 100% power and is therefore still producing xenon-135 at the higher rate. The xenon-135concentration continues to rise until the rate of production of xenon-135 becomes equal to therate of removal (roughly 7 to 8 hours after the initial reduction in power level). The xenon-135concentration then gradually decreases to the new equilibrium level in about 50 to 60 hours. Themagnitude of the xenon peak is greatest if the initial power level is very high.
Maximum peak xenon occurs when a reactor that is operating at 100% equilibrium xenonconcentration is suddenly shut down. The most rapid possible burnout of xenon occurs whena reactor is started up and operated at full power while this maximum peak xenon conditionexists.
Summary
The important information in this chapter is summarized below.
Xenon Summary
Xenon-135 is produced directly as a fission product and by the decay of iodine-135during reactor operation. Xenon-135 is removed from the core by radioactivedecay and by neutron absorption during reactor operation.
The equilibrium concentration for xenon-135 is determined by the followingequation.
or NXe (eq) γ Xe Σfuelf φ λ I NI
λXe σXea φ
NXe (eq) γ Xe γ I Σfuelf φ
λXe σXea φ
The xenon-135 concentration increases with increasing power level in a non-linearmanner. Equilibrium xenon-135 concentration reaches a maximum at a flux ofabout 1015 neutrons/cm2-sec.
After a power increase, xenon-135 concentration will initially decrease due to theincreased removal by burnout. Xenon-135 will reach a minimum about 5 hoursafter the power increase and then increase to a new, higher equilibrium value as theproduction from iodine decay increases.
NP-03 Rev. 0Page 41
XENON DOE-HDBK-1019/2-93 Reactor Theory (Nuclear Parameters)
Xenon Summary (Cont.)
A xenon-135 oscillation may be caused by a rapid perturbation in the core powerdistribution. The xenon-135 oscillation can change local power levels in the coreby a factor of three or more.
Following a reactor shutdown, xenon-135 concentration will increase due to thedecay of the iodine inventory of the core. Xenon-135 will peak approximately10 hours after the shutdown (from 100%) and then decrease as xenon-135 decaybecomes greater than the iodine-135 decay.
The greater the pre-shutdown power level, the greater the peak value of xenon.
The core can be considered xenon-free about 3 days after shutdown.
A xenon precluded startup occurs when there is insufficient reactivity in the controlrods to overcome the negative reactivity of xenon-135.
Xenon dead time is the period of time where the reactor is unable to override theeffects of xenon.
After a power decrease, xenon-135 concentration will initially increase due toproduction by iodine decay being greater than the burnout. Xenon-135 will reach amaximum about 8 hours after the power decrease and then decrease to a new,lower equilibrium value.
NP-03 Rev. 0NP-03 Rev. 0Page 42
DOE-HDBK-1019/2-93Reactor Theory (Nuclear Parameters) SAMARIUM AND OTHER FISSION PRODUCT POISONS
SAMARIUM AND OTHER FISSION PRODUCT POISONS
The fission product poison that has the most significant effect on reactoroperations other than xenon-135 is samarium-149. Samarium-149 behavessignificantly different from xenon-135 due to its different nuclear properties.
EO 4.10 DESCRIBE how samarium-149 is produced and removed fromthe reactor core during reactor operation.
EO 4.11 STATE the equation for equilibrium samarium-149concentration.
EO 4.12 DESCRIBE how equilibrium samarium-149 concentrationvaries with reactor power level.
EO 4.13 DESCRIBE how samarium-149 concentration changes followinga reactor shutdown from steady-state conditions.
EO 4.14 DESCRIBE how samarium-149 concentration changes followinga reactor startup.
EO 4.15 STATE the conditions under which helium-3 will have asignificant effect on the reactivity of a reactor.
Pr oduction and Removal of Samarium-149
Samarium-149 is the second most important fission-product poison because of its high thermalneutron absorption cross section of 4.1 x 10⁴ barns. Samarium-149 is produced from the decayof the neodymium-149 fission fragment as shown in the decay chain below.
149
60Nd
β
→1.72 hr
149
61Pm
β
→53.1 hr
149
62Sm (stable)
Rev. 0 NP-03Page 43
DOE-HDBK-1019/2-93SAMARIUM AND OTHER FISSION PRODUCT POISONS Reactor Theory (Nuclear Parameters)
For the purpose of examining the behavior of samarium-149, the 1.73 hour half-life ofneodymium-149 is sufficiently shorter than the 53.1 hour value for promethium-149 that thepromethium-149 may be considered as if it were formed directly from fission. This assumption,and neglecting the small amount of promethium burnup, allows the situation to be described asfollows.
Rate of change of 149Pm = yield from fission - decay 149Pm concentration
therefore:
dNPm
dt γ Pm Σfuel
f φ λPm NPm
where:NPm = 149Pm concentration
γPm = 149Pm fission yield
λPm = decay constant for 149Pm
Solving for the equilibrium value of promethium-149 gives the following.
NPm(eq) γ Pm Σfuelf φ
λPm
The rate of samarium-149 formation is described as follows.
Rate of change of 149Sm = yield from fission + 149Pm decay - 149Sm burnup
therefore:
dNSm
dt γ Sm Σfuel
f φ λPm NPm NSm σSma φ
where:NSm = 149Sm concentration
γSm = 149Sm fission yield
σaSm = microscopic absorption cross section of 149Sm
NP-03 Rev. 0Page 44
DOE-HDBK-1019/2-93Reactor Theory (Nuclear Parameters) SAMARIUM AND OTHER FISSION PRODUCT POISONS
The fission yield of samarium-149, however, is nearly zero; therefore, the equation becomes thefollowing.
dNSm
dt λPm NPm NSm σSm
a φ
Solving this equation for the equilibrium concentration of samarium-149 and substituting γPmΣf
f uel φ / λPm for NPm(eq) yields the following.
NSm(eq) γ Pm Σfuelf
σSma
This expression for equilibrium samarium-149 concentration during reactor operation illustratesthat equilibrium samarium-149 concentration is independent of neutron flux and power level. Thesamarium concentration will undergo a transient following a power level change, but it will returnto its original value.
Samarium-149 Response to Reactor Shutdown
Since the neutron flux drops to essentially zero after reactor shutdown, the rate of samarium-149production becomes the following.
dNSm
dt λPm NPm
Because samarium-149 is not radioactive and is not removed by decay, it presents problemssomewhat different from those encountered with xenon-135, as illustrated in Figure 7. Theequilibrium concentration and the poisoning effect build to an equilibrium value during reactoroperation. This equilibrium is reached in approximately 20 days (500 hours), and sincesamarium-149 is stable, the concentration remains essentially constant during reactor operation.When the reactor is shutdown, the samarium-149 concentration builds up as a result of the decayof the accumulated promethium-149. The buildup of samarium-149 after shutdown dependsupon the power level before shutdown. Samarium-149 does not peak as xenon-135 does, butincreases slowly to a maximum value as shown in Figure 7. After shutdown, if the reactor isthen operated at power, samarium-149 is burned up and its concentration returns to theequilibrium value. Samarium poisoning is minor when compared to xenon poisoning. Althoughsamarium-149 has a constant poisoning effect during long-term sustained operation, its behaviorduring initial startup and during post-shutdown and restart periods requires special considerationsin reactor design.
Rev. 0 NP-03Page 45
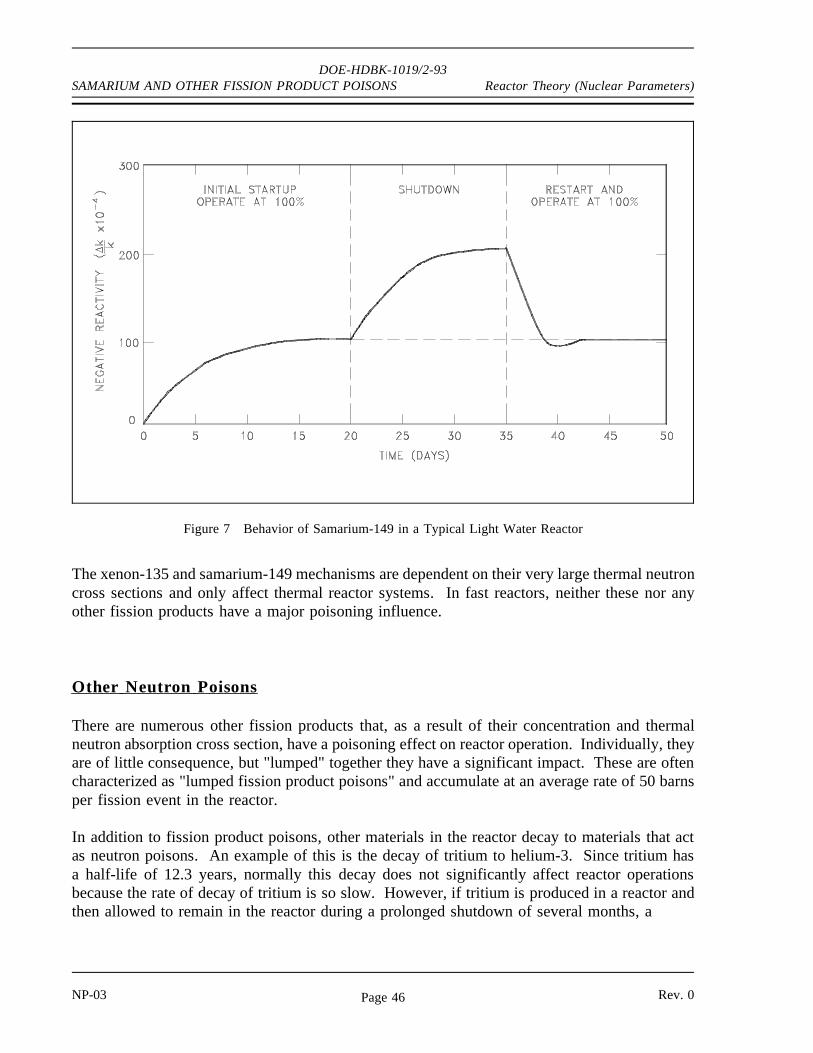
DOE-HDBK-1019/2-93SAMARIUM AND OTHER FISSION PRODUCT POISONS Reactor Theory (Nuclear Parameters)
The xenon-135 and samarium-149 mechanisms are dependent on their very large thermal neutron
Figure 7 Behavior of Samarium-149 in a Typical Light Water Reactor
cross sections and only affect thermal reactor systems. In fast reactors, neither these nor anyother fission products have a major poisoning influence.
Other Neutr on Poisons
There are numerous other fission products that, as a result of their concentration and thermalneutron absorption cross section, have a poisoning effect on reactor operation. Individually, theyare of little consequence, but "lumped" together they have a significant impact. These are oftencharacterized as "lumped fission product poisons" and accumulate at an average rate of 50 barnsper fission event in the reactor.
In addition to fission product poisons, other materials in the reactor decay to materials that actas neutron poisons. An example of this is the decay of tritium to helium-3. Since tritium hasa half-life of 12.3 years, normally this decay does not significantly affect reactor operationsbecause the rate of decay of tritium is so slow. However, if tritium is produced in a reactor andthen allowed to remain in the reactor during a prolonged shutdown of several months, a
NP-03 Rev. 0Page 46
DOE-HDBK-1019/2-93Reactor Theory (Nuclear Parameters) SAMARIUM AND OTHER FISSION PRODUCT POISONS
sufficient amount of tritium may decay to helium-3 to add a significant amount of negativereactivity. Any helium-3 produced in the reactor during a shutdown period will be removedduring subsequent operation by a neutron-proton reaction.
Summary
The important information in this chapter is summarized below.
Samarium and Other Fission Product Poisons Summary
Samarium-149 is produced directly from fission and from the decay ofpromethium-149 during reactor operation. Samarium-149 is removed from the core by neutron absorption.
The equation for equilibrium samarium-149 concentration is stated below.
NSm(eq) γ Pm Σfuelf
σSma
The equilibrium samarium-149 concentration is independent of power level.
Following a reactor shutdown, the samarium-149 concentration increases due to thedecay of the promethium-149 inventory of the core and the loss of the burnupfactor.
If the reactor is restarted following a shutdown, the samarium-149 concentrationdecreases as samarium is burned up and returns to its equilibrium operating value.
Helium-3 will become a significant neutron poison if significant amounts of tritiumare left in a reactor during a shutdown period that lasts longer than several months.
Rev. 0 NP-03Page 47
CONTROL RODS DOE-HDBK-1019/2-93 Reactor Theory (Nuclear Parameters)
CONTROL RODS
Most reactors contain control rods made of neutron absorbing materials that areused to adjust the reactivity of the core. Control rods can be designed and usedfor coarse control, fine control, or fast shutdowns.
EO 5.1 DESCRIBE the difference between a "grey" neutron absorbingmaterial and a "black" neutron absorbing material.
EO 5.2 EXPLAIN why a "grey" neutron absorbing material may bepreferable to a "black" neutron absorbing material for use incontrol rods.
EO 5.3 EXPLAIN why resonance absorbers are sometimes preferredover thermal absorbers as a control rod material.
EO 5.4 DEFINE the following terms:
a. Integral control rod worthb. Differential control rod worth
EO 5.5 DESCRIBE the shape of a typical differential control rodworth curve and explain the reason for the shape.
EO 5.6 DESCRIBE the shape of a typical integral control rod worthcurve and explain the reason for the shape.
EO 5.7 Given an integral or differential control rod worth curve,CALCULATE the reactivity change due to a control rodmovement between two positions.
EO 5.8 Given differential control rod worth data, PLOT differentialand integral control rod worth curves.
Selection of Contr ol Rod Mater ials
Rods of neutron-absorbing material are installed in most reactors to provide precise, adjustablecontrol of reactivity. These rods are able to be moved into or out of the reactor core andtypically contain elements such as silver, indium, cadmium, boron, or hafnium.
NP-03 Rev. 0Page 48
Reactor Theory (Nuclear Parameters) DOE-HDBK-1019/2-93 CONTROL RODS
The material used for the control rods varies depending on reactor design. Generally, thematerial selected should have a good absorption cross section for neutrons and have a longlifetime as an absorber (not burn out rapidly). The ability of a control rod to absorb neutronscan be adjusted during manufacture. A control rod that is referred to as a "black" absorberabsorbs essentially all incident neutrons. A "grey" absorber absorbs only a part of them. Whileit takes more grey rods than black rods for a given reactivity effect, the grey rods are oftenpreferred because they cause smaller depressions in the neutron flux and power in the vicinityof the rod. This leads to a flatter neutron flux profile and more even power distribution in thecore.
If grey rods are desired, the amount of material with a high absorption cross section that isloaded in the rod is limited. Material with a very high absorption cross section may not bedesired for use in a control rod, because it will burn out rapidly due to its high absorption crosssection. The same amount of reactivity worth can be achieved by manufacturing the control rodfrom material with a slightly lower cross section and by loading more of the material. This alsoresults in a rod that does not burn out as rapidly.
Another factor in control rod material selection is that materials that resonantly absorb neutronsare often preferred to those that merely have high thermal neutron absorption cross sections.Resonance neutron absorbers absorb neutrons in the epithermal energy range. The path lengthtraveled by the epithermal neutrons in a reactor is greater than the path length traveled bythermal neutrons. Therefore, a resonance absorber absorbs neutrons that have their last collisionfarther (on the average) from the control rod than a thermal absorber. This has the effect ofmaking the area of influence around a resonance absorber larger than around a thermal absorberand is useful in maintaining a flatter flux profile.
Types of Contr ol Rods
There are several ways to classify the types of control rods. One classification method is by thepurpose of the control rods. Three purposes of control rods are listed below.
Shim rods - used for coarse control and/or to remove reactivity in relatively largeamounts.
Regulating rods - used for fine adjustments and to maintain desired power or temperature.
Safety rods - provide a means for very fast shutdown in the event of an unsafe condition.Addition of a large amount of negative reactivity by rapidly inserting thesafety rods is referred to as a "scram" or "trip."
Rev. 0 NP-03Page 49
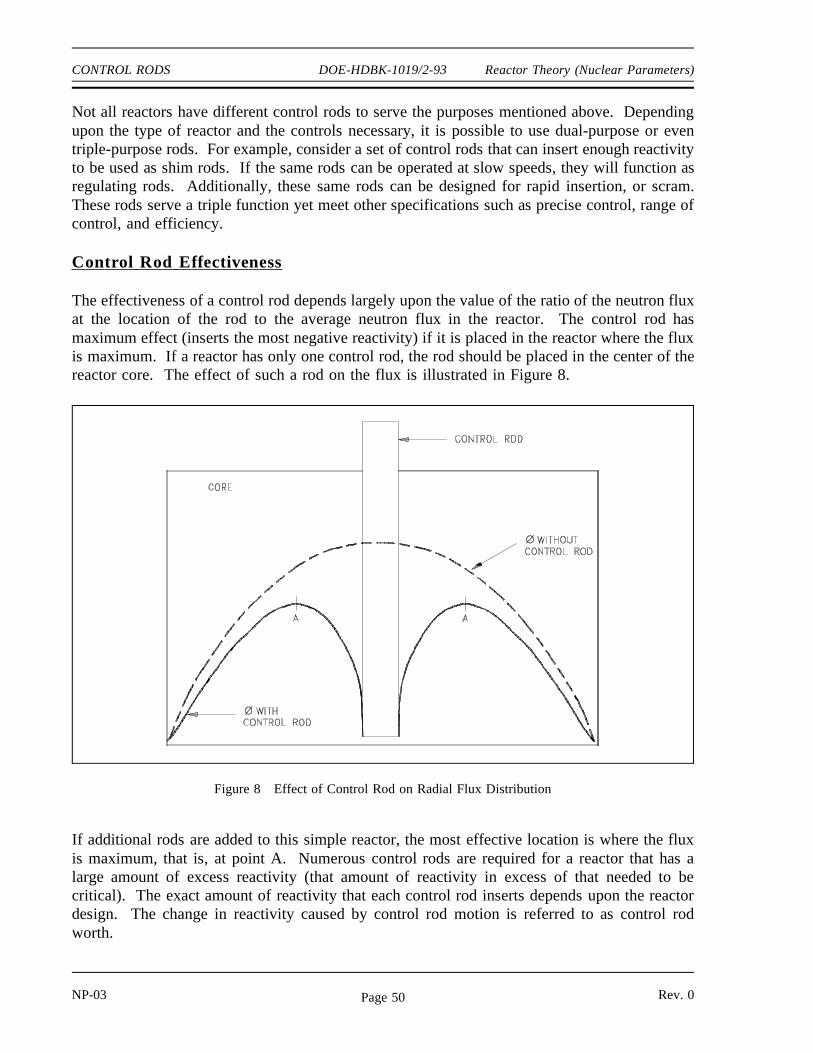
CONTROL RODS DOE-HDBK-1019/2-93 Reactor Theory (Nuclear Parameters)
Not all reactors have different control rods to serve the purposes mentioned above. Dependingupon the type of reactor and the controls necessary, it is possible to use dual-purpose or eventriple-purpose rods. For example, consider a set of control rods that can insert enough reactivityto be used as shim rods. If the same rods can be operated at slow speeds, they will function asregulating rods. Additionally, these same rods can be designed for rapid insertion, or scram.These rods serve a triple function yet meet other specifications such as precise control, range ofcontrol, and efficiency.
Contr ol Rod Effectiveness
The effectiveness of a control rod depends largely upon the value of the ratio of the neutron fluxat the location of the rod to the average neutron flux in the reactor. The control rod hasmaximum effect (inserts the most negative reactivity) if it is placed in the reactor where the fluxis maximum. If a reactor has only one control rod, the rod should be placed in the center of thereactor core. The effect of such a rod on the flux is illustrated in Figure 8.
If additional rods are added to this simple reactor, the most effective location is where the flux
Figure 8 Effect of Control Rod on Radial Flux Distribution
is maximum, that is, at point A. Numerous control rods are required for a reactor that has alarge amount of excess reactivity (that amount of reactivity in excess of that needed to becritical). The exact amount of reactivity that each control rod inserts depends upon the reactordesign. The change in reactivity caused by control rod motion is referred to as control rodworth.
NP-03 Rev. 0Page 50

Reactor Theory (Nuclear Parameters) DOE-HDBK-1019/2-93 CONTROL RODS
I ntegral and Dif fer ential Contr ol Rod W or th
The exact effect of control rods on reactivity can be determined experimentally. For example,a control rod can be withdrawn in small increments, such as 0.5 inch, and the change inreactivity can be determined following each increment of withdrawal. By plotting the resultingreactivity versus the rod position, a graph similar to Figure 9 is obtained. The graph depictsintegral control rod worth over the full range of withdrawal. The integral control rod worth isthe total reactivity worth of the rod at that particular degree of withdrawal and is usually definedto be the greatest when the rod is fully withdrawn.
Figure 9 Integral Control Rod Worth
Rev. 0 NP-03Page 51
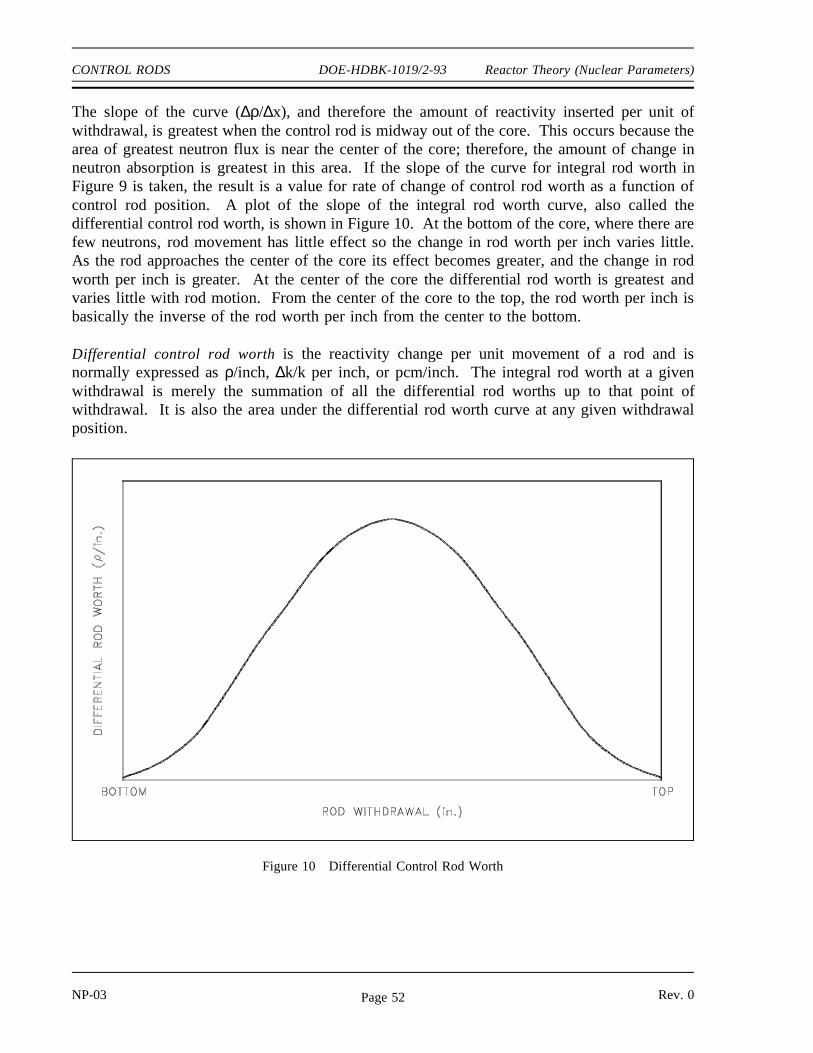
CONTROL RODS DOE-HDBK-1019/2-93 Reactor Theory (Nuclear Parameters)
The slope of the curve (∆ρ/∆x), and therefore the amount of reactivity inserted per unit ofwithdrawal, is greatest when the control rod is midway out of the core. This occurs because thearea of greatest neutron flux is near the center of the core; therefore, the amount of change inneutron absorption is greatest in this area. If the slope of the curve for integral rod worth inFigure 9 is taken, the result is a value for rate of change of control rod worth as a function ofcontrol rod position. A plot of the slope of the integral rod worth curve, also called thedifferential control rod worth, is shown in Figure 10. At the bottom of the core, where there arefew neutrons, rod movement has little effect so the change in rod worth per inch varies little.As the rod approaches the center of the core its effect becomes greater, and the change in rodworth per inch is greater. At the center of the core the differential rod worth is greatest andvaries little with rod motion. From the center of the core to the top, the rod worth per inch isbasically the inverse of the rod worth per inch from the center to the bottom.
Differential control rod worth is the reactivity change per unit movement of a rod and isnormally expressed as ρ/inch, ∆k/k per inch, or pcm/inch. The integral rod worth at a givenwithdrawal is merely the summation of all the differential rod worths up to that point ofwithdrawal. It is also the area under the differential rod worth curve at any given withdrawalposition.
Figure 10 Differential Control Rod Worth
NP-03 Rev. 0Page 52
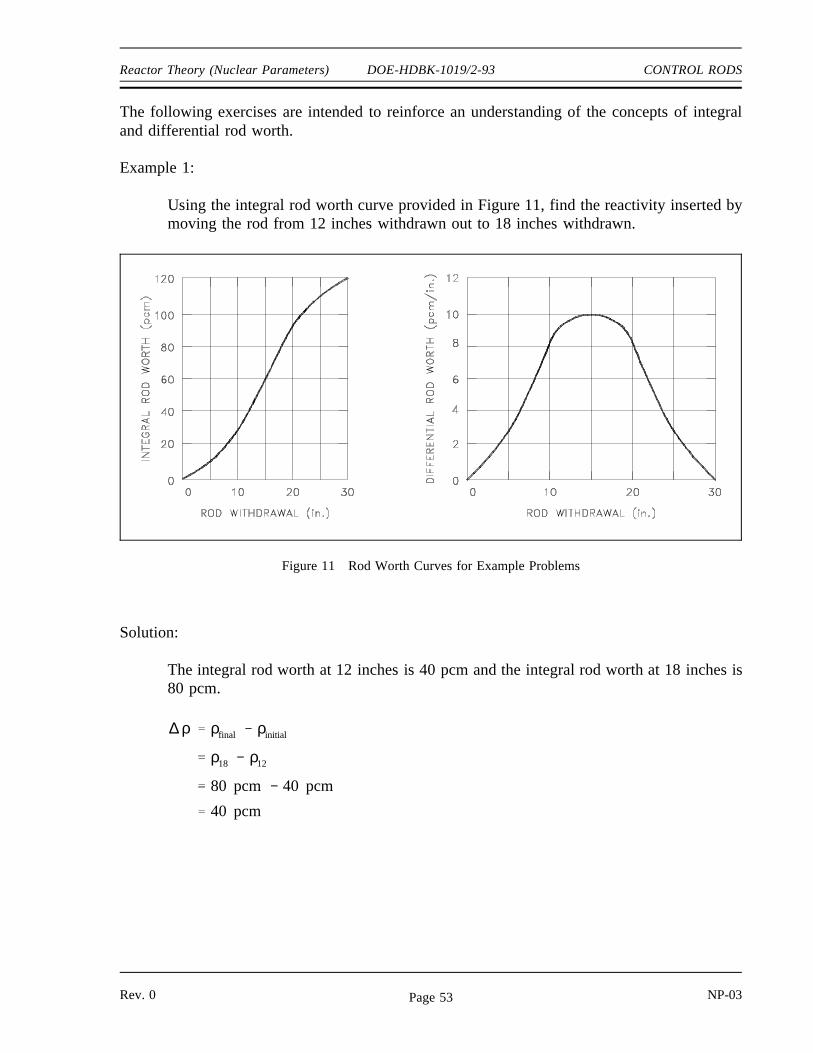
Reactor Theory (Nuclear Parameters) DOE-HDBK-1019/2-93 CONTROL RODS
The following exercises are intended to reinforce an understanding of the concepts of integraland differential rod worth.
Example 1:
Using the integral rod worth curve provided in Figure 11, find the reactivity inserted bymoving the rod from 12 inches withdrawn out to 18 inches withdrawn.
Figure 11 Rod Worth Curves for Example Problems
Solution:
The integral rod worth at 12 inches is 40 pcm and the integral rod worth at 18 inches is80 pcm.
∆ ρ ρfinal ρinitial
ρ18 ρ12
80 pcm 40 pcm
40 pcm
Rev. 0 NP-03Page 53
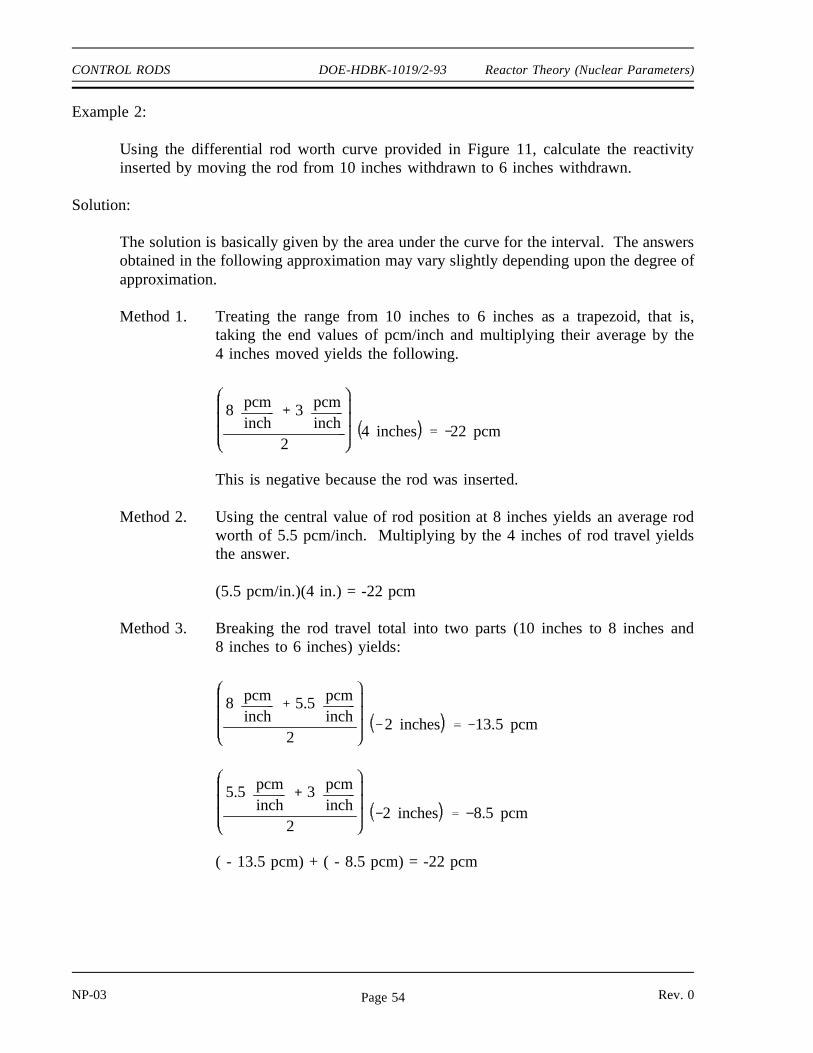
CONTROL RODS DOE-HDBK-1019/2-93 Reactor Theory (Nuclear Parameters)
Example 2:
Using the differential rod worth curve provided in Figure 11, calculate the reactivityinserted by moving the rod from 10 inches withdrawn to 6 inches withdrawn.
Solution:
The solution is basically given by the area under the curve for the interval. The answersobtained in the following approximation may vary slightly depending upon the degree ofapproximation.
Method 1. Treating the range from 10 inches to 6 inches as a trapezoid, that is,taking the end values of pcm/inch and multiplying their average by the4 inches moved yields the following.
8 pcm
inch 3 pcm
inch2
4 inches 22 pcm
This is negative because the rod was inserted.
Method 2. Using the central value of rod position at 8 inches yields an average rodworth of 5.5 pcm/inch. Multiplying by the 4 inches of rod travel yieldsthe answer.
(5.5 pcm/in.)(4 in.) = -22 pcm
Method 3. Breaking the rod travel total into two parts (10 inches to 8 inches and8 inches to 6 inches) yields:
8 pcm
inch 5.5 pcm
inch2
2 inches 13.5 pcm
5.5 pcm
inch 3 pcm
inch2
2 inches 8.5 pcm
( - 13.5 pcm) + ( - 8.5 pcm) = -22 pcm
NP-03 Rev. 0Page 54
Reactor Theory (Nuclear Parameters) DOE-HDBK-1019/2-93 CONTROL RODS
In this example the various approximations used did not cause any difference because theproblem deals with a section of the curve with an approximately constant slope. Toobtain the value over the interval between 8 inches and 20 inches, however, would requirethe use of several subintervals (as in the last approximation) to obtain an accurateanswer.
Example 3:
For the differential rod worth data given below, construct differential and integral rodworth curves.
Interval (inches) Reactivity Inserted (pcm)0 to 2 102 to 4 204 to 6 406 to 8 608 to 10 6010 to 12 4012 to 14 2014 to 16 10
Solution:
Differential rod worth:
For each interval, the number of pcm/inch must be determined. For example, inthe first interval (0 inches to 2 inches), 10 pcm is added. Therefore, thedifferential rod worth equals an average 5 pcm/inch. This value of differentialrod worth is plotted at the center of each interval. The center of the interval0 inches to 2 inches is 1 inch. The values of pcm/inch for each interval are thenlisted as shown below and plotted on Figure 12.
Interval Center pcm/inch1 53 105 207 309 3011 2013 1015 5
Rev. 0 NP-03Page 55
CONTROL RODS DOE-HDBK-1019/2-93 Reactor Theory (Nuclear Parameters)
Integral rod worth:
To plot the integral rod worth, merely develop a cumulative total of the reactivityadded after each interval and plot the summed reactivity insertion vs. rod positionas shown in Figure 12.
Interval Endpoint Summed Reactivity2 104 306 708 13010 19012 23014 25016 260
If an integral rod worth curve is supplied, a differential rod worth curve can be generated from
Figure 12 Rod Worth Curves From Example 3
the integral rod worth data. Merely select a convenient interval of rod withdrawal, such as1 inch or 2 inches. Then, determine from the curve the amount of reactivity added for eachconstant interval of rod withdrawal. A plot of this reactivity addition versus rod withdrawalrepresents differential rod worth.
NP-03 Rev. 0Page 56

Reactor Theory (Nuclear Parameters) DOE-HDBK-1019/2-93 CONTROL RODS
Rod Contr ol Mechanisms
The control rod insertion rates on a scram are designed to be sufficient to protect the reactoragainst damage in all transients that are expected to occur during the life of the reactor.
During normal rod motion, the control rods must be able to move rapidly enough to compensatefor the most rapid rate at which positive reactivity is expected to build within the reactor inorder to provide positive control. The transient that is normally considered when setting thisminimum rod speed is the burnout of maximum peak xenon while at full power. Xenon burnoutis usually the most rapid, non-accident transient expected. The maximum rod speed is normallylimited in order to reduce the severity of an accident involving the continuous withdrawal ofcontrol rods.
Summary
The important information in this chapter is summarized on the following page.
Rev. 0 NP-03Page 57
CONTROL RODS DOE-HDBK-1019/2-93 Reactor Theory (Nuclear Parameters)
Control Rods Summary
A black neutron-absorbing material absorbs essentially all incident neutrons. Agrey neutron-absorbing material absorbs only part of the incident neutrons.
A grey neutron-absorbing material may be preferable to a black neutron-absorbing material in the construction of control rods because the grey absorbercauses smaller depressions in neutron flux and power in the vicinity of the rod.
Resonance absorbers are sometimes preferred to thermal absorbers as control rod materials because they have a larger area of influence and result in a flatterflux profile.
Integral control rod worth is the total reactivity worth of the control rod at aparticular degree of withdrawal from the core.
Differential control rod worth is the reactivity change per unit movement of acontrol rod.
The typical differential control rod worth curve has a bell shape. It has verylow values at the top and bottom of the core and a maximum value at the centerof the core. The curve has this shape because rod worth is related to neutronflux, and flux is highest in the center of the core.
The typical integral control rod worth curve has an "S" shape. It has a relatively flat slope at the top and bottom of the core and a maximum slope atthe center of the core.
Integral or differential control rod worth curves can be used to determine thereactivity change due to a control rod movement between two positions.
Integral or differential control rod worth curves can be plotted based onmeasured control rod worth data.
NP-03 Rev. 0Page 58
Department of EnergyFundamentals Handbook
NUCLEAR PHYSICS AND REACTOR THEORY
Module 4Reactor Theory (Reactor Operations)

Reactor Theory (Reactor Operations) DOE-HDBK-1019/2-93 TABLE OF CONTENTS
TABLE OF CONTENTS
LIST OF FIGURES . . . . . . . . . . . . . . . . . . . . . . . . . . . . . . . . . . . . . . . . . . . . . . . . ii
LIST OF TABLES . . . . . . . . . . . . . . . . . . . . . . . . . . . . . . . . . . . . . . . . . . . . . . . . . iii
REFERENCES . . . . . . . . . . . . . . . . . . . . . . . . . . . . . . . . . . . . . . . . . . . . . . . . . . . iv
OBJECTIVES . . . . . . . . . . . . . . . . . . . . . . . . . . . . . . . . . . . . . . . . . . . . . . . . . . . . v
SUBCRITICAL MULTIPLICATION . . . . . . . . . . . . . . . . . . . . . . . . . . . . . . . . . . . . 1
Subcritical Multiplication Factor. . . . . . . . . . . . . . . . . . . . . . . . . . . . . . . . . . . 1Effect of Reactivity Changes on Subcritical Multiplication. . . . . . . . . . . . . . . . . 3Use of 1/M Plots . . . . . . . . . . . . . . . . . . . . . . . . . . . . . . . . . . . . . . . . . . . . . 6Summary . . . . . . . . . . . . . . . . . . . . . . . . . . . . . . . . . . . . . . . . . . . . . . . . . . 9
REACTOR KINETICS . . . . . . . . . . . . . . . . . . . . . . . . . . . . . . . . . . . . . . . . . . . . . 10
Reactor Period (τ) . . . . . . . . . . . . . . . . . . . . . . . . . . . . . . . . . . . . . . . . . . . 11Effective Delayed Neutron Fraction. . . . . . . . . . . . . . . . . . . . . . . . . . . . . . . . 11Effective Delayed Neutron Precursor Decay Constant. . . . . . . . . . . . . . . . . . . 13Prompt Criticality . . . . . . . . . . . . . . . . . . . . . . . . . . . . . . . . . . . . . . . . . . . . 15Stable Period Equation. . . . . . . . . . . . . . . . . . . . . . . . . . . . . . . . . . . . . . . . 16Reactor Startup Rate (SUR). . . . . . . . . . . . . . . . . . . . . . . . . . . . . . . . . . . . . 17Doubling Time. . . . . . . . . . . . . . . . . . . . . . . . . . . . . . . . . . . . . . . . . . . . . . 17Summary . . . . . . . . . . . . . . . . . . . . . . . . . . . . . . . . . . . . . . . . . . . . . . . . . 21
REACTOR OPERATION . . . . . . . . . . . . . . . . . . . . . . . . . . . . . . . . . . . . . . . . . . . 23
Startup . . . . . . . . . . . . . . . . . . . . . . . . . . . . . . . . . . . . . . . . . . . . . . . . . . . 24Estimated Critical Position. . . . . . . . . . . . . . . . . . . . . . . . . . . . . . . . . . . . . . 24Core Power Distribution. . . . . . . . . . . . . . . . . . . . . . . . . . . . . . . . . . . . . . . 25Power Tilt . . . . . . . . . . . . . . . . . . . . . . . . . . . . . . . . . . . . . . . . . . . . . . . . . 27Shutdown Margin. . . . . . . . . . . . . . . . . . . . . . . . . . . . . . . . . . . . . . . . . . . . 28Operation . . . . . . . . . . . . . . . . . . . . . . . . . . . . . . . . . . . . . . . . . . . . . . . . . 28Temperature . . . . . . . . . . . . . . . . . . . . . . . . . . . . . . . . . . . . . . . . . . . . . . . 28Pressure . . . . . . . . . . . . . . . . . . . . . . . . . . . . . . . . . . . . . . . . . . . . . . . . . . 29Power Level . . . . . . . . . . . . . . . . . . . . . . . . . . . . . . . . . . . . . . . . . . . . . . . 29Flow . . . . . . . . . . . . . . . . . . . . . . . . . . . . . . . . . . . . . . . . . . . . . . . . . . . . . 30Core Burnup . . . . . . . . . . . . . . . . . . . . . . . . . . . . . . . . . . . . . . . . . . . . . . . 30Shutdown . . . . . . . . . . . . . . . . . . . . . . . . . . . . . . . . . . . . . . . . . . . . . . . . . 31Decay Heat . . . . . . . . . . . . . . . . . . . . . . . . . . . . . . . . . . . . . . . . . . . . . . . . 33Summary . . . . . . . . . . . . . . . . . . . . . . . . . . . . . . . . . . . . . . . . . . . . . . . . . 33
Rev. 0 NP-04Page i
LIST OF FIGURES DOE-HDBK-1019/2-93 Reactor Theory (Reactor Operations)
LIST OF FIGURES
Figure 1 1/M Plot vs. Rod Withdrawal. . . . . . . . . . . . . . . . . . . . . . . . . . . . . . . . . . . . 8
Figure 2 Reactor Power Response to Positive Reactivity Addition. . . . . . . . . . . . . . . . 14
Figure 3 Reactor Power Response to Negative Reactivity Addition. . . . . . . . . . . . . . . . 15
Figure 4 Neutron Radial Flux Shapes for Bare and Reflected Cores . . . . . . . . . . . . . . . 26
Figure 5 Effect of Non-Uniform Enrichment on Radial Flux Shape. . . . . . . . . . . . . . . 26
Figure 6 Effect of Control Rod Position on Axial Flux Distribution. . . . . . . . . . . . . . . 27
NP-04 Rev. 0Page ii
Reactor Theory (Reactor Operations) DOE-HDBK-1019/2-93 LIST OF TABLES
LIST OF TABLES
Table 1 Delayed Neutron Fractions for Various Fuels. . . . . . . . . . . . . . . . . . . . . . . . 12
Rev. 0 NP-04Page iii
REFERENCES DOE-HDBK-1019/2-93 Reactor Theory (Reactor Operations)
REFERENCES
Foster, Arthur R. and Wright, Robert L. Jr., Basic Nuclear Engineering, 3rd Edition, Allynand Bacon, Inc., 1977.
Jacobs, A.M., Kline, D.E., and Remick, F.J., Basic Principles of Nuclear Science andReactors, Van Nostrand Company, Inc., 1960.
Kaplan, Irving, Nuclear Physics, 2nd Edition, Addison-Wesley Company, 1962.
Knief, Ronald Allen, Nuclear Energy Technology: Theory and Practice of CommercialNuclear Power, McGraw-Hill, 1981.
Lamarsh, John R., Introduction to Nuclear Engineering, Addison-Wesley Company, 1977.
Lamarsh, John R., Introduction to Nuclear Reactor Theory, Addison-Wesley Company,1972.
General Electric Company, Nuclides and Isotopes: Chart of the Nuclides, 14th Edition,General Electric Company, 1989.
Academic Program for Nuclear Power Plant Personnel, Volume III, Columbia, MD,General Physics Corporation, Library of Congress Card #A 326517, 1982.
Glasstone, Samuel, Sourcebook on Atomic Energy, Robert F. Krieger PublishingCompany, Inc., 1979.
Glasstone, Samuel and Sesonske, Alexander, Nuclear Reactor Engineering, 3rd Edition,Van Nostrand Reinhold Company, 1981.
NP-04 Rev. 0Page iv
Reactor Theory (Reactor Operations) DOE-HDBK-1019/2-93 OBJECTIVES
TERMINAL OBJECTIVE
1.0 Given the necessary information and equations, EXPLAIN how subcritical multiplicationoccurs.
ENABLING OBJECTIVES
1.1 DEFINE the following terms:
a. Subcritical multiplicationb. Subcritical multiplication factor
1.2 Given a neutron source strength and a subcritical system of known keff, CALCULATEthe steady-state neutron level.
1.3 Given an initial count rate and keff, CALCULATE the final count rate that will resultfrom the addition of a known amount of reactivity.
1.4 Given count rates vs. the parameter being adjusted, ESTIMATE the value of theparameter at which the reactor will become critical through the use of a 1/M plot.
Rev. 0 NP-04Page v
OBJECTIVES DOE-HDBK-1019/2-93 Reactor Theory (Reactor Operations)
TERMINAL OBJECTIVE
2.0 Given the necessary information and equations, DESCRIBE how power changes in areactor that is near criticality.
ENABLING OBJECTIVES
2.1 DEFINE the following terms:
a. Reactor periodb. Doubling timec. Reactor startup rate
2.2 DESCRIBE the relationship between the delayed neutron fraction, average delayedneutron fraction, and effective delayed neutron fraction.
2.3 WRITE the period equation and IDENTIFY each symbol.
2.4 Given the reactivity of the core and values for the effective average delayed neutronfraction and decay constant, CALCULATE the reactor period and the startup rate.
2.5 Given the initial power level and either the doubling or halving time, CALCULATE thepower at any later time.
2.6 Given the initial power level and the reactor period, CALCULATE the power at anylater time.
2.7 EXPLAIN what is meant by the terms prompt drop and prompt jump.
2.8 DEFINE the term prompt critical.
2.9 DESCRIBE reactor behavior during the prompt critical condition.
2.10 EXPLAIN the use of measuring reactivity in units of dollars.
NP-04 Rev. 0Page vi
Reactor Theory (Reactor Operations) DOE-HDBK-1019/2-93 OBJECTIVES
TERMINAL OBJECTIVE
3.0 Without references, EXPLAIN the concepts concerning reactor startup, operation, andshutdown.
ENABLING OBJECTIVES
3.1 EXPLAIN why a startup neutron source may be required for a reactor.
3.2 LIST four variables typically involved in a reactivity balance.
3.3 EXPLAIN how a reactivity balance may be used to predict the conditions under whichthe reactor will become critical.
3.4 LIST three methods used to shape or flatten the core power distribution.
3.5 DESCRIBE the concept of power tilt.
3.6 DEFINE the term shutdown margin.
3.7 EXPLAIN the rationale behind the one stuck rod criterion.
3.8 IDENTIFY five changes that will occur during and after a reactor shutdown that willaffect the reactivity of the core.
3.9 EXPLAIN why decay heat is present following reactor operation.
3.10 LIST three variables that will affect the amount of decay heat present following reactorshutdown.
3.11 ESTIMATE the approximate amount of decay heat that will exist one hour after ashutdown from steady state conditions.
Rev. 0 NP-04Page vii

OBJECTIVES DOE-HDBK-1019/2-93 Reactor Theory (Reactor Operations)
Intentionally Left Blank
NP-04 Rev. 0Page viii
Reactor Theory (Reactor Operations) DOE-HDBK-1019/2-93 SUBCRITICAL MULTIPLICATION
SUBCRITICAL MULTIPLICATION
Subcritical multiplication is the phenomenon that accounts for the changes inneutron flux that takes place in a subcritical reactor due to reactivity changes.It is important to understand subcritical multiplication in order to understandreactor response to changes in conditions.
EO 1.1 DEFINE the following terms:
a. Subcritical multiplicationb. Subcritical multiplication factor
EO 1.2 Given a neutron source strength and a subcritical system ofknown keff, CALCULATE the steady-state neutron level.
EO 1.3 Given an initial count rate and keff, CALCULATE the finalcount rate that will result from the addition of a known amountof reactivity.
EO 1.4 Given count rates vs. the parameter being adjusted,ESTIMATE the value of the parameter at which the reactorwill become critical through the use of a 1/M plot.
Subcr itical Mu ltiplic ation Factor
When a reactor is in a shutdown condition, neutrons are still present to interact with the fuel.These source neutrons are produced by a variety of methods that were discussed in Module 2.If neutrons and fissionable material are present in the reactor, fission will take place. Therefore,a reactor will always be producing a small number of fissions even when it is shutdown.
Consider a reactor in which keff is 0.6. If 100 neutrons are suddenly introduced into the reactor,these 100 neutrons that start the current generation will produce 60 neutrons (100 x 0.6) fromfission to start the next generation. The 60 neutrons that start the second generation willproduce 36 neutrons (60 x 0.6) to start the third generation. The number of neutrons producedby fission in subsequent generations due to the introduction of 100 source neutrons into thereactor is shown below.
Generation 1st 2nd 3rd 4th 5th 6th 7th 8th 9th 10th 11th 12th
Neutrons 100 60 36 22 13 8 5 3 2 1 0 0
Rev. 0 NP-04Page 1
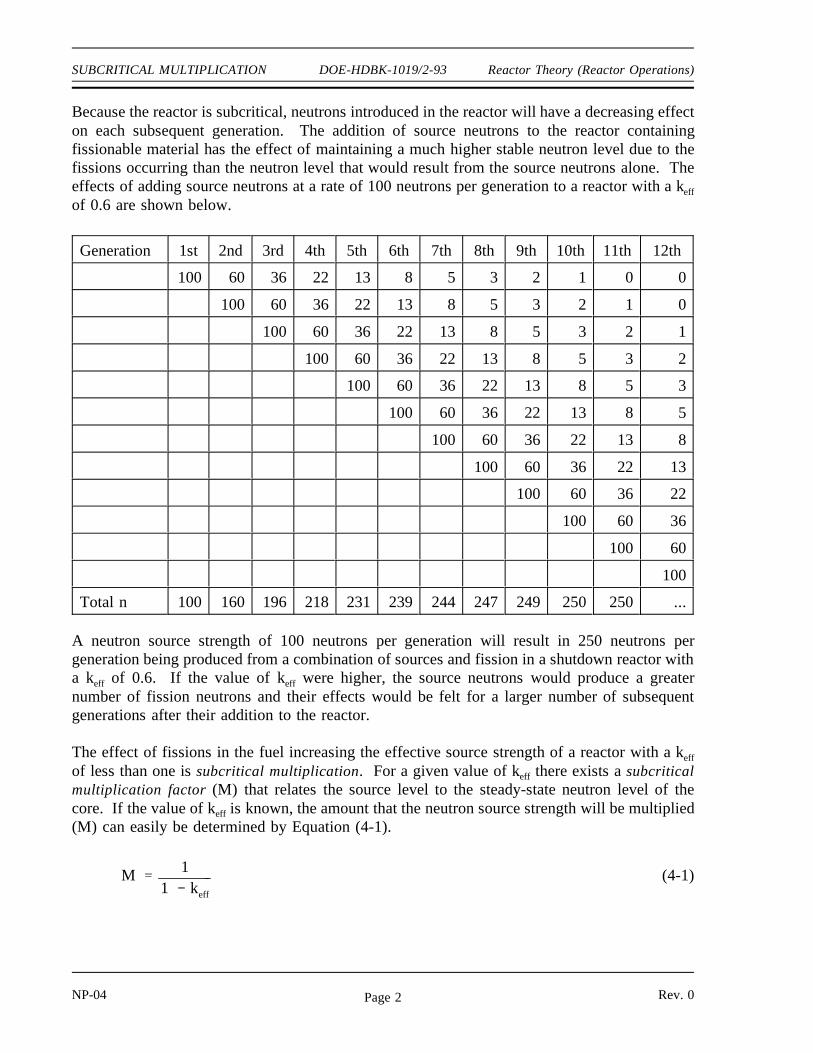
SUBCRITICAL MULTIPLICATION DOE-HDBK-1019/2-93 Reactor Theory (Reactor Operations)
Because the reactor is subcritical, neutrons introduced in the reactor will have a decreasing effecton each subsequent generation. The addition of source neutrons to the reactor containingfissionable material has the effect of maintaining a much higher stable neutron level due to thefissions occurring than the neutron level that would result from the source neutrons alone. Theeffects of adding source neutrons at a rate of 100 neutrons per generation to a reactor with a keff
of 0.6 are shown below.
Generation 1st 2nd 3rd 4th 5th 6th 7th 8th 9th 10th 11th 12th
100 60 36 22 13 8 5 3 2 1 0 0
100 60 36 22 13 8 5 3 2 1 0
100 60 36 22 13 8 5 3 2 1
100 60 36 22 13 8 5 3 2
100 60 36 22 13 8 5 3
100 60 36 22 13 8 5
100 60 36 22 13 8
100 60 36 22 13
100 60 36 22
100 60 36
100 60
100
Total n 100 160 196 218 231 239 244 247 249 250 250 ...
A neutron source strength of 100 neutrons per generation will result in 250 neutrons pergeneration being produced from a combination of sources and fission in a shutdown reactor witha keff of 0.6. If the value of keff were higher, the source neutrons would produce a greaternumber of fission neutrons and their effects would be felt for a larger number of subsequentgenerations after their addition to the reactor.
The effect of fissions in the fuel increasing the effective source strength of a reactor with a keff
of less than one is subcritical multiplication. For a given value of keff there exists a subcriticalmultiplication factor (M) that relates the source level to the steady-state neutron level of thecore. If the value of keff is known, the amount that the neutron source strength will be multiplied(M) can easily be determined by Equation (4-1).
(4-1)M 11 keff
NP-04 Rev. 0Page 2
Reactor Theory (Reactor Operations) DOE-HDBK-1019/2-93 SUBCRITICAL MULTIPLICATION
Example:
Calculate the subcritical multiplication factors for the following values of keff.
1) keff = 0.62) keff = 0.986
Solution:
1)
M 11 keff
11 0.6
2.5
2)
M 11 keff
11 0.986
71.4
The example above illustrates that the subcritical multiplication factor will increase as positivereactivity is added to a shutdown reactor, increasing the value of keff. If the source strength ofthis reactor were 1000 neutrons/sec, the neutron level would increase from 2500 neutrons/secondat a keff of 0.6 to a neutron level of 71,400 neutrons/sec at a keff of 0.986.
Effect of Reactivity Changes on Subcr itical Mu ltiplic ation
In a subcritical reactor, the neutron level is related to the source strength by Equation (4-2).
(4-2)N (S) (M)
where:
N = neutron levelS = neutron source strengthM = subcritical multiplication factor
Rev. 0 NP-04Page 3
SUBCRITICAL MULTIPLICATION DOE-HDBK-1019/2-93 Reactor Theory (Reactor Operations)
If the term M in Equation (4-2) is replaced by the expression 1/1-keff from Equation (4-1), thefollowing expression results.
(4-3)N S
11 keff
Example:
A reactor contains a neutron source that produces 110,000 neutrons per second. Thereactor has a keff of 0.986. Calculate the stable total neutron production rate in thereactor.
Solution:
The neutron production rate is calculated using Equation (4-3).
N S
11 keff
110,000 neutronssecond
11 0.986
7.86 x 10⁶ neutronssecond
To this point it has been necessary to know the neutron source strength of the reactor in orderto use the concept of subcritical multiplication. In most reactors the actual strength of theneutron sources is difficult, if not impossible, to determine. Even though the actual sourcestrength may not be known, it is still possible to relate the change in reactivity to a change inneutron level.
Consider a reactor at two different times when keff is two different values, k1 and k2. Theneutron level at each time can be determined based on the neutron source strength and thesubcritical multiplication factor using Equation (4-3).
N1 S
11 k1
N2 S
11 k2
NP-04 Rev. 0Page 4
Reactor Theory (Reactor Operations) DOE-HDBK-1019/2-93 SUBCRITICAL MULTIPLICATION
The equation for N1 can be divided by the equation for N2.
N1
N2
S
11 k1
S
11 k2
N1
N2
1 k2
1 k1
Because the source strength appears in both the numerator and denominator, it cancels out ofthe equation. Therefore, the neutron level at any time can be determined based on the neutronlevel present at any other time provided the values of keff or reactivity for both times are known.
The neutron level in a shutdown reactor is typically monitored using instruments that measurethe neutron leakage out of the reactor. The neutron leakage is proportional to the neutron levelin the reactor. Typical units for displaying the instrument reading are counts per second (cps).Because the instrument count rate is proportional to the neutron level, the above equation canbe restated as shown in Equation (4-4).
(4-4) CR1
CR2
1 k2
1 k1
where:
CR1 = count rate at time 1CR2 = count rate at time 2k1 = keff at time 1k2 = keff at time 2
Equation (4-4) is very useful during the shutdown operation of a reactor. Before adding positivereactivity to a reactor, it is possible to predict the effect the reactivity addition will have on theneutron level.
Example:
A reactor that has a reactivity of -1000 pcm has a count rate of 42 counts per second(cps) on the neutron monitoring instrumentation. Calculate what the neutron level shouldbe after a positive reactivity insertion of 500 pcm from the withdrawal of control rods.
Rev. 0 NP-04Page 5
SUBCRITICAL MULTIPLICATION DOE-HDBK-1019/2-93 Reactor Theory (Reactor Operations)
Solution:
Step 1: Determine the initial value of keff for the core.
k1 11 ρ1
11 ( 0.01000)
0.9901
Step 2: Determine the final value of keff for the core. The final value of reactivitywill be -500 pcm (-1000 + 500).
k2 11 ρ2
11 ( 0.00500)
0.9950
Step 3: Use Equation (4-4) to determine the final count rate.
CR1
CR2
1 k2
1 k1
CR2 CR1
1 k1
1 k2
42 cps
1 0.99011 0.9950
83 cps
Notice from this example that the count rate doubled as the reactivity was halved (e.g., reactivitywas changed from -1000 pcm to -500 pcm).
Use of 1/M Plots
Because the subcritical multiplication factor is related to the value of keff, it is possible tomonitor the approach to criticality through the use of the subcritical multiplication factor. Aspositive reactivity is added to a subcritical reactor, keff will get nearer to one. As keff gets nearerto one, the subcritical multiplication factor (M) gets larger. The closer the reactor is tocriticality, the faster M will increase for equal step insertions of positive reactivity. When thereactor becomes critical, M will be infinitely large. For this reason, monitoring and plotting Mduring an approach to criticality is impractical because there is no value of M at which thereactor clearly becomes critical.
NP-04 Rev. 0Page 6
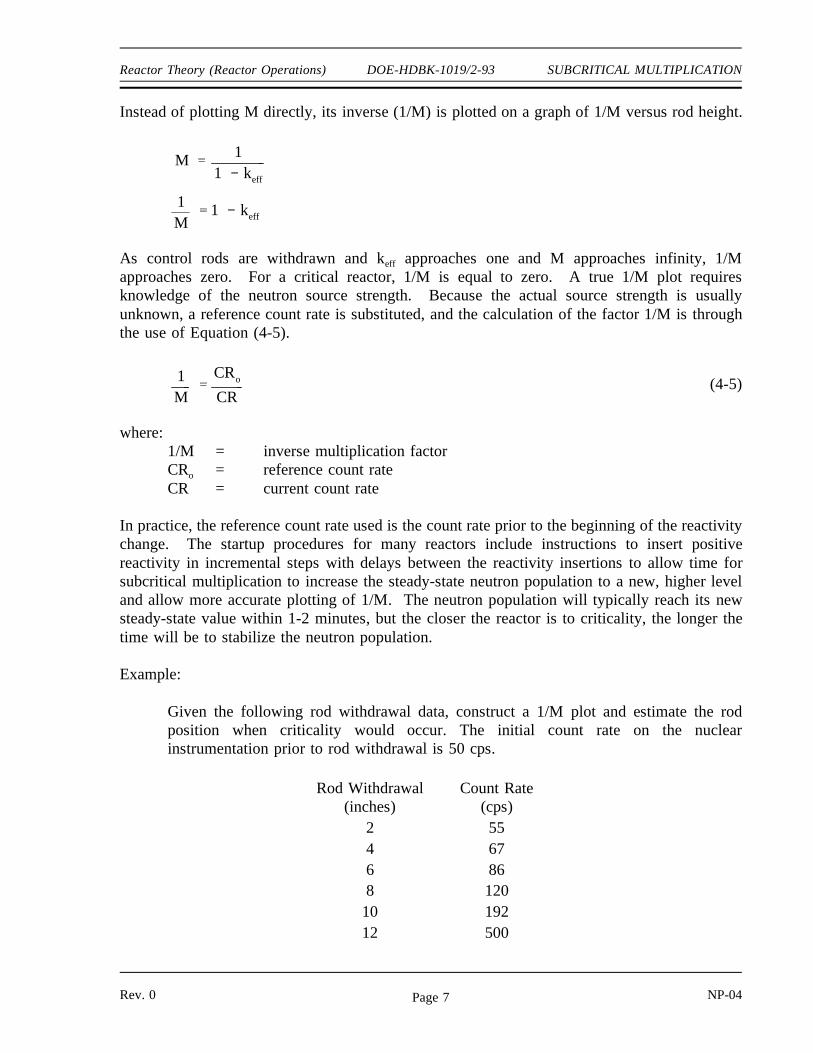
Reactor Theory (Reactor Operations) DOE-HDBK-1019/2-93 SUBCRITICAL MULTIPLICATION
Instead of plotting M directly, its inverse (1/M) is plotted on a graph of 1/M versus rod height.
M 11 keff
1M
1 keff
As control rods are withdrawn and keff approaches one and M approaches infinity, 1/Mapproaches zero. For a critical reactor, 1/M is equal to zero. A true 1/M plot requiresknowledge of the neutron source strength. Because the actual source strength is usuallyunknown, a reference count rate is substituted, and the calculation of the factor 1/M is throughthe use of Equation (4-5).
(4-5) 1M
CRo
CR
where:1/M = inverse multiplication factorCRo = reference count rateCR = current count rate
In practice, the reference count rate used is the count rate prior to the beginning of the reactivitychange. The startup procedures for many reactors include instructions to insert positivereactivity in incremental steps with delays between the reactivity insertions to allow time forsubcritical multiplication to increase the steady-state neutron population to a new, higher leveland allow more accurate plotting of 1/M. The neutron population will typically reach its newsteady-state value within 1-2 minutes, but the closer the reactor is to criticality, the longer thetime will be to stabilize the neutron population.
Example:
Given the following rod withdrawal data, construct a 1/M plot and estimate the rodposition when criticality would occur. The initial count rate on the nuclearinstrumentation prior to rod withdrawal is 50 cps.
Rod Withdrawal(inches)
Count Rate(cps)
2 554 676 868 12010 19212 500
Rev. 0 NP-04Page 7
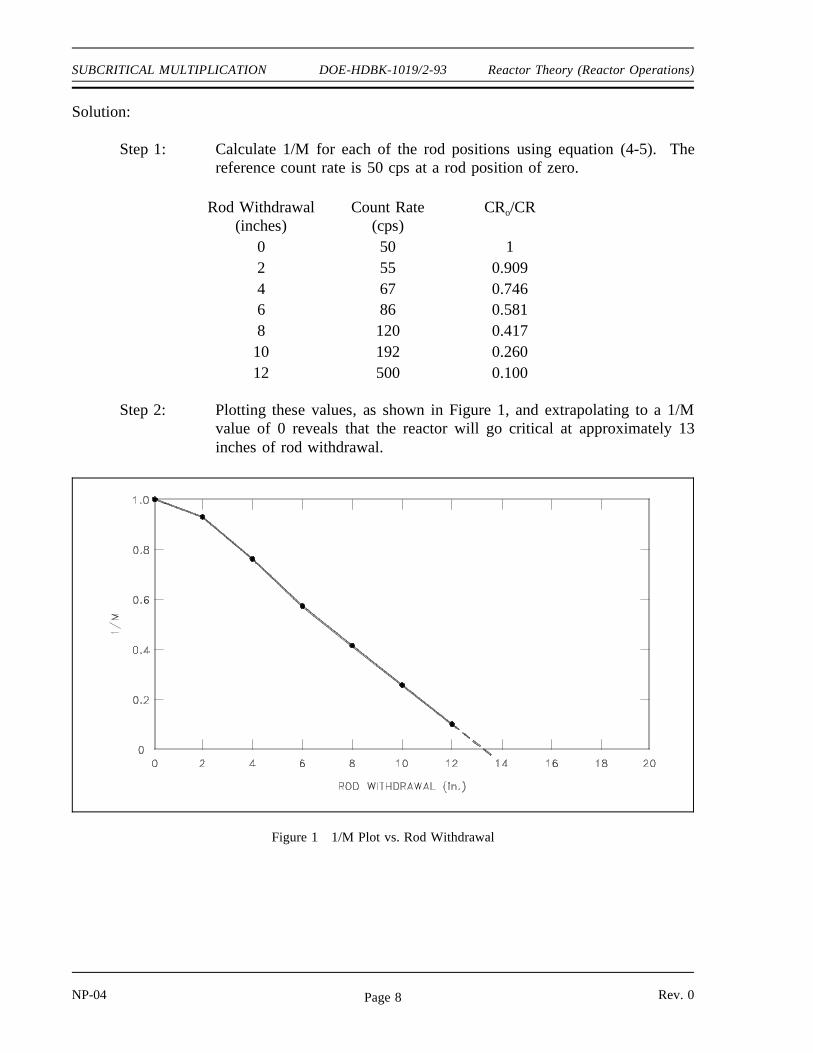
SUBCRITICAL MULTIPLICATION DOE-HDBK-1019/2-93 Reactor Theory (Reactor Operations)
Solution:
Step 1: Calculate 1/M for each of the rod positions using equation (4-5). Thereference count rate is 50 cps at a rod position of zero.
Rod Withdrawal(inches)
Count Rate(cps)
CRo/CR
0 50 12 55 0.9094 67 0.7466 86 0.5818 120 0.41710 192 0.26012 500 0.100
Step 2: Plotting these values, as shown in Figure 1, and extrapolating to a 1/Mvalue of 0 reveals that the reactor will go critical at approximately 13inches of rod withdrawal.
Figure 1 1/M Plot vs. Rod Withdrawal
NP-04 Rev. 0Page 8
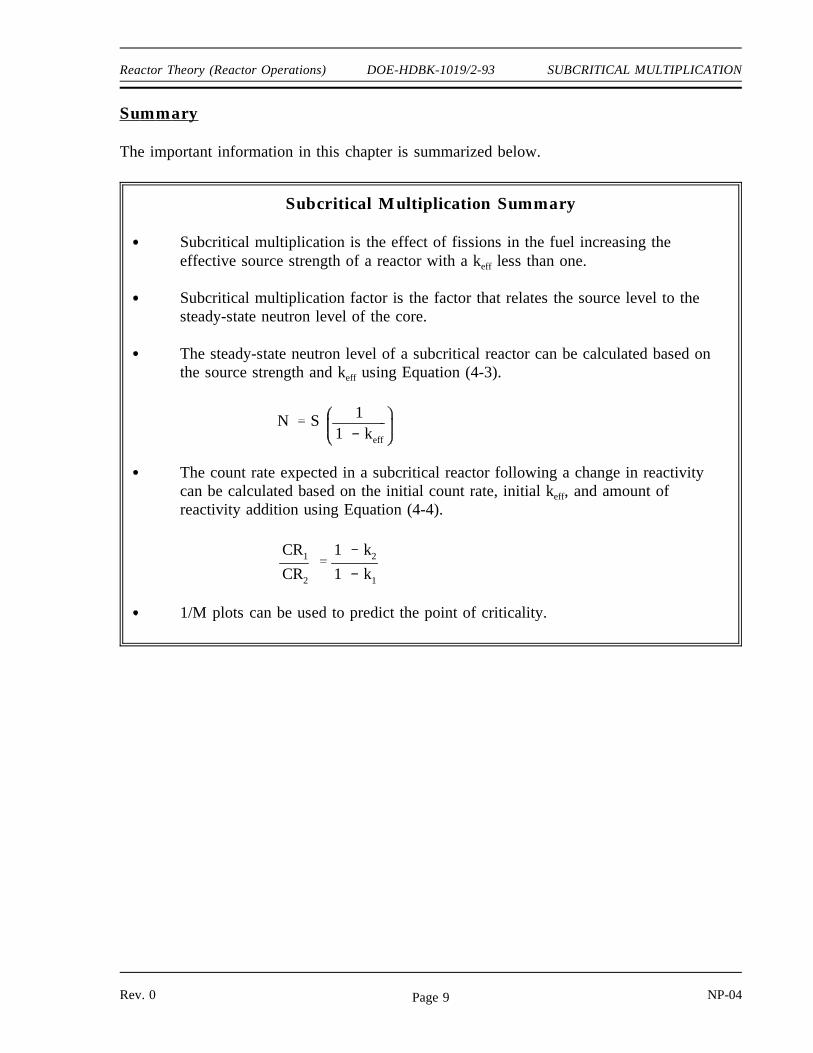
Reactor Theory (Reactor Operations) DOE-HDBK-1019/2-93 SUBCRITICAL MULTIPLICATION
Summary
The important information in this chapter is summarized below.
Subcritical Multiplication Summary
Subcritical multiplication is the effect of fissions in the fuel increasing the effective source strength of a reactor with a keff less than one.
Subcritical multiplication factor is the factor that relates the source level to thesteady-state neutron level of the core.
The steady-state neutron level of a subcritical reactor can be calculated based onthe source strength and keff using Equation (4-3).
N S
11 keff
The count rate expected in a subcritical reactor following a change in reactivitycan be calculated based on the initial count rate, initial keff, and amount ofreactivity addition using Equation (4-4).
CR1
CR2
1 k2
1 k1
1/M plots can be used to predict the point of criticality.
Rev. 0 NP-04Page 9
REACTOR KINETICS DOE-HDBK-1019/2-93 Reactor Theory (Reactor Operations)
NP-04 Rev. 0Page 10
REACTOR KINETICS
The response of neutron flux and reactor power to changes in reactivity is muchdifferent in a critical reactor than in a subcritical reactor. The reliance of the chainreaction on delayed neutrons makes the rate of change of reactor powercontrollable.
EO 2.1 DEFINE the following terms:
a. Reactor periodb. Doubling timec. Reactor startup rate
EO 2.2 DESCRIBE the relationship between the delayed neutronfraction, average delayed neutron fraction, and effective delayedneutron fraction.
EO 2.3 WRITE the period equation and IDENTIFY each symbol.
EO 2.4 Given the reactivity of the core and values for the effectiveaverage delayed neutron fraction and decay constant,CALCULATE the reactor period and the startup rate.
EO 2.5 Given the initial power level and either the doubling or halvingtime, CALCULATE the power at any later time.
EO 2.6 Given the initial power level and the reactor period,CALCULATE the power at any later time.
EO 2.7 EXPLAIN what is meant by the terms prompt drop and prompt jump.
EO 2.8 DEFINE the term prompt critical.
EO 2.9 DESCRIBE reactor behavior during the prompt criticalcondition.
EO 2.10 EXPLAIN the use of measuring reactivity in units of dollars.

P Po e t /
¯eff
eff
¯eff
Reactor Theory (Reactor Operations) DOE-HDBK-1019/2-93 REACTOR KINETICS
Rev. 0 NP-04Page 11
Reactor Period ( )
The reactor period is defined as the time required for reactor power to change by a factor of"e," where "e" is the base of the natural logarithm and is equal to about 2.718. The reactorperiod is usually expressed in units of seconds. From the definition of reactor period, it ispossible to develop the relationship between reactor power and reactor period that is expressedby Equation (4-6).
(4-6)
where:
P = transient reactor powerP = initial reactor powero
= reactor period (seconds)t = time during the reactor transient (seconds)
The smaller the value of , the more rapid the change in reactor power. If the reactor period ispositive, reactor power is increasing. If the reactor period is negative, reactor power isdecreasing.
There are numerous equations used to express reactor period, but Equation (4-7) shown below,or portions of it, will be useful in most situations. The first term in Equation (4-7) is the promptterm and the second term is the delayed term.
(4-7)
where:* = prompt generation lifetime
= effective delayed neutron fraction
= reactivity= effective delayed neutron precursor decay constanteff
= rate of change of reactivity
Effective Delayed Neutron Fraction
Recall that , the delayed neutron fraction, is the fraction of all fission neutrons that are bornas delayed neutrons. The value of depends upon the actual nuclear fuel used. As discussedin Module 1, the delayed neutron precursors for a given type of fuel are grouped on the basisof half-life. The following table lists the fractional neutron yields for each delayed neutrongroup of three common types of fuel.
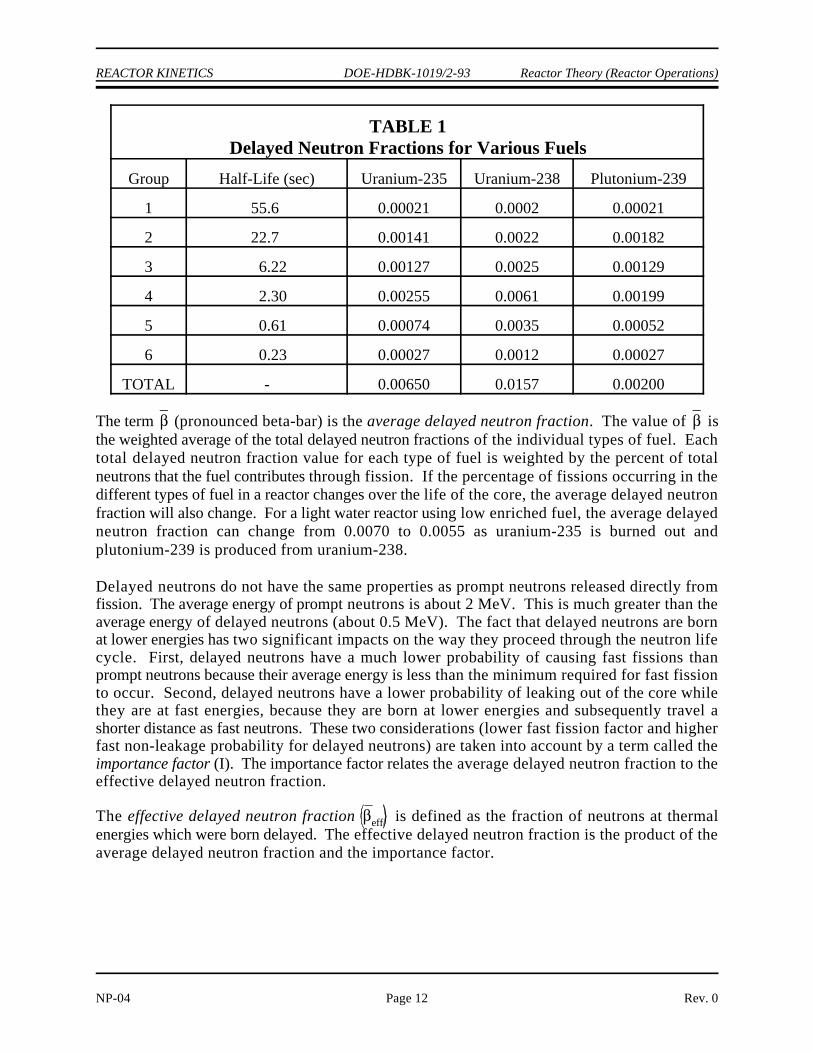
¯ ¯
¯eff
REACTOR KINETICS DOE-HDBK-1019/2-93 Reactor Theory (Reactor Operations)
NP-04 Rev. 0Page 12
TABLE 1Delayed Neutron Fractions for Various Fuels
Group Half-Life (sec) Uranium-235 Uranium-238 Plutonium-239
1 55.6 0.00021 0.0002 0.00021
2 22.7 0.00141 0.0022 0.00182
3 6.22 0.00127 0.0025 0.00129
4 2.30 0.00255 0.0061 0.00199
5 0.61 0.00074 0.0035 0.00052
6 0.23 0.00027 0.0012 0.00027
TOTAL - 0.00650 0.0157 0.00200
The term (pronounced beta-bar) is the average delayed neutron fraction. The value of isthe weighted average of the total delayed neutron fractions of the individual types of fuel. Eachtotal delayed neutron fraction value for each type of fuel is weighted by the percent of totalneutrons that the fuel contributes through fission. If the percentage of fissions occurring in thedifferent types of fuel in a reactor changes over the life of the core, the average delayed neutronfraction will also change. For a light water reactor using low enriched fuel, the average delayedneutron fraction can change from 0.0070 to 0.0055 as uranium-235 is burned out andplutonium-239 is produced from uranium-238.
Delayed neutrons do not have the same properties as prompt neutrons released directly fromfission. The average energy of prompt neutrons is about 2 MeV. This is much greater than theaverage energy of delayed neutrons (about 0.5 MeV). The fact that delayed neutrons are bornat lower energies has two significant impacts on the way they proceed through the neutron lifecycle. First, delayed neutrons have a much lower probability of causing fast fissions thanprompt neutrons because their average energy is less than the minimum required for fast fissionto occur. Second, delayed neutrons have a lower probability of leaking out of the core whilethey are at fast energies, because they are born at lower energies and subsequently travel ashorter distance as fast neutrons. These two considerations (lower fast fission factor and higherfast non-leakage probability for delayed neutrons) are taken into account by a term called theimportance factor (I). The importance factor relates the average delayed neutron fraction to theeffective delayed neutron fraction.
The effective delayed neutron fraction is defined as the fraction of neutrons at thermalenergies which were born delayed. The effective delayed neutron fraction is the product of theaverage delayed neutron fraction and the importance factor.
¯eff
¯ I
¯eff
¯
Reactor Theory (Reactor Operations) DOE-HDBK-1019/2-93 REACTOR KINETICS
Rev. 0 NP-04Page 13
where:
= effective delayed neutron fraction
= average delayed neutron fractionI = importance factor
In a small reactor with highly enriched fuel, the increase in fast non-leakage probability willdominate the decrease in the fast fission factor, and the importance factor will be greater thanone. In a large reactor with low enriched fuel, the decrease in the fast fission factor willdominate the increase in the fast non-leakage probability and the importance factor will be lessthan one (about 0.97 for a commercial PWR).
Effective Delayed Neutron Precursor Decay Constant
Another new term has been introduced in the reactor period ( ) equation. That term is eff
(pronounced lambda effective), the effective delayed neutron precursor decay constant. Thedecay rate for a given delayed neutron precursor can be expressed as the product of precursorconcentration and the decay constant ( ) of that precursor. The decay constant of a precursoris simply the fraction of an initial number of the precursor atoms that decays in a given unittime. A decay constant of 0.1 sec , for example, implies that one-tenth, or ten percent, of a-1
sample of precursor atoms decays within one second. The value for the effective delayedneutron precursor decay constant, , varies depending upon the balance existing between theeff
concentrations of the precursor groups and the nuclide(s) being used as the fuel.
If the reactor is operating at a constant power, all the precursor groups reach an equilibriumvalue. During an up-power transient, however, the shorter-lived precursors decaying at anygiven instant were born at a higher power level (or flux level) than the longer-lived precursorsdecaying at the same instant. There is, therefore, proportionately more of the shorter-lived andfewer of the longer-lived precursors decaying at that given instant than there are at constantpower. The value of is closer to that of the shorter-lived precursors.eff
During a down-power transient the longer-lived precursors become more significant. Thelonger-lived precursors decaying at a given instant were born at a higher power level (or fluxlevel) than the shorter-lived precursors decaying at that instant. Therefore, proportionatelymore of the longer-lived precursors are decaying at that instant, and the value of approacheseff
the values of the longer-lived precursors.
Approximate values for are 0.08 sec for steady-state operation, 0.1 sec for a powereff-1 -1
increase, and 0.05 sec for a power decrease. The exact values will depend upon the materials-1
used for fuel and the value of the reactivity of the reactor core.
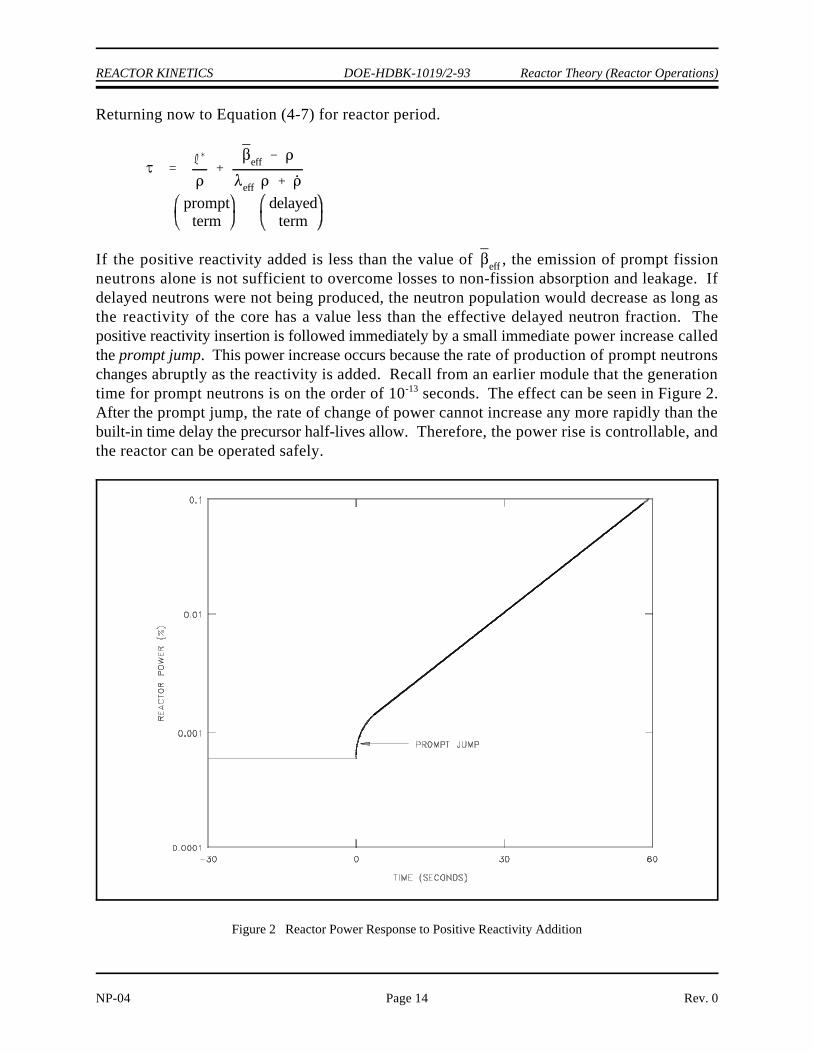
¯eff
eff
promptterm
delayedterm
¯eff
REACTOR KINETICS DOE-HDBK-1019/2-93 Reactor Theory (Reactor Operations)
NP-04 Rev. 0Page 14
Figure 2 Reactor Power Response to Positive Reactivity Addition
Returning now to Equation (4-7) for reactor period.
If the positive reactivity added is less than the value of , the emission of prompt fissionneutrons alone is not sufficient to overcome losses to non-fission absorption and leakage. Ifdelayed neutrons were not being produced, the neutron population would decrease as long asthe reactivity of the core has a value less than the effective delayed neutron fraction. Thepositive reactivity insertion is followed immediately by a small immediate power increase calledthe prompt jump. This power increase occurs because the rate of production of prompt neutronschanges abruptly as the reactivity is added. Recall from an earlier module that the generationtime for prompt neutrons is on the order of 10 seconds. The effect can be seen in Figure 2.-13
After the prompt jump, the rate of change of power cannot increase any more rapidly than thebuilt-in time delay the precursor half-lives allow. Therefore, the power rise is controllable, andthe reactor can be operated safely.
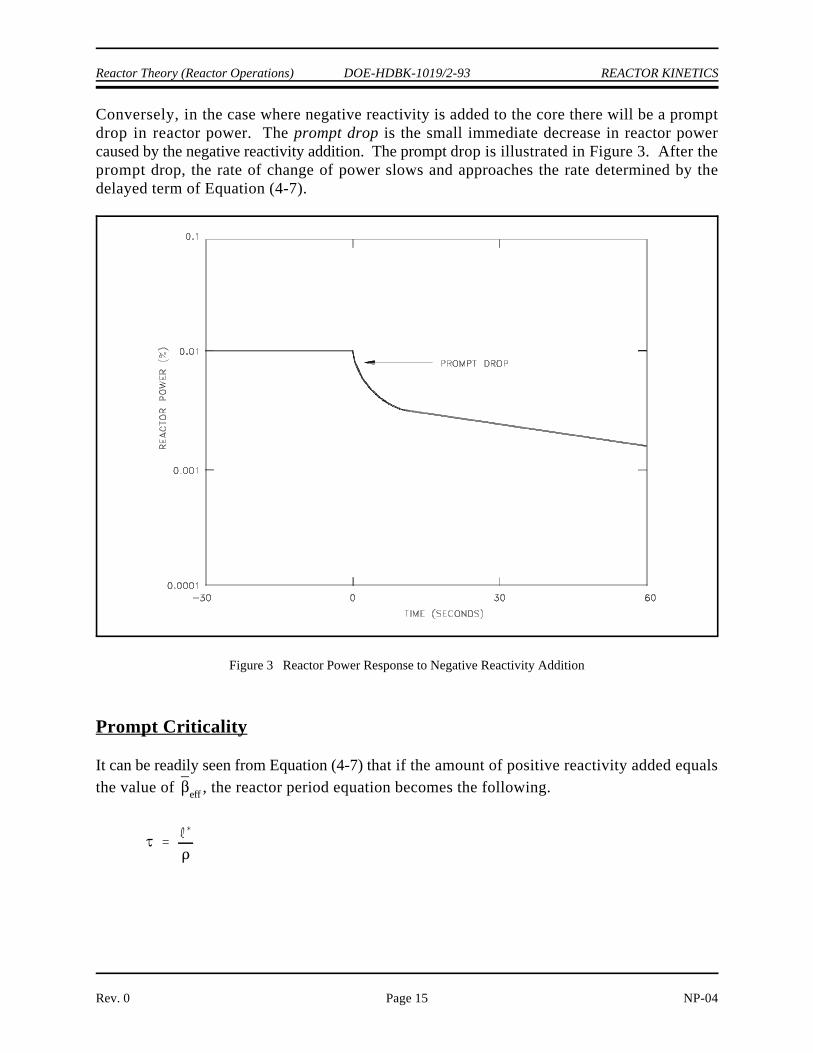
¯eff
Reactor Theory (Reactor Operations) DOE-HDBK-1019/2-93 REACTOR KINETICS
Rev. 0 NP-04Page 15
Figure 3 Reactor Power Response to Negative Reactivity Addition
Conversely, in the case where negative reactivity is added to the core there will be a promptdrop in reactor power. The prompt drop is the small immediate decrease in reactor powercaused by the negative reactivity addition. The prompt drop is illustrated in Figure 3. After theprompt drop, the rate of change of power slows and approaches the rate determined by thedelayed term of Equation (4-7).
Prompt Criticality
It can be readily seen from Equation (4-7) that if the amount of positive reactivity added equalsthe value of , the reactor period equation becomes the following.
¯eff
¯eff
eff
0
¯eff
eff
REACTOR KINETICS DOE-HDBK-1019/2-93 Reactor Theory (Reactor Operations)
NP-04 Rev. 0Page 16
In this case, the production of prompt neutrons alone is enough to balance neutron losses andincrease the neutron population. The condition where the reactor is critical on prompt neutrons,and the neutron population increases as rapidly as the prompt neutron generation lifetime allowsis known as prompt critical. The prompt critical condition does not signal a dramatic changein neutron behavior. The reactor period changes in a regular manner between reactivities aboveand below this reference. Prompt critical is, however, a convenient condition for marking thetransition from delayed neutron to prompt neutron time scales. A reactor whose reactivity evenapproaches prompt critical is likely to suffer damage due to the rapid rise in power to a veryhigh level. For example, a reactor which has gone prompt critical could experience a severalthousand percent power increase in less than one second.
Because the prompt critical condition is so important, a specific unit of reactivity has beendefined that relates to it. The unit of reactivity is the dollar ($), where one dollar of reactivityis equivalent to the effective delayed neutron fraction . A reactivity unit related to thedollar is the cent, where one cent is one-hundredth of a dollar. If the reactivity of the core is onedollar, the reactor is prompt critical. Because the effective delayed neutron fraction isdependent upon the nuclides used as fuel, the value of the dollar is also dependent on thenuclides used as fuel.
Stable Period Equation
For normal reactor operating conditions, the value of positive reactivity in the reactor is neverpermitted to approach the effective delayed neutron fraction, and the reactor period equation isnormally written as follows.
(4-8)
Equation (4-8) is referred to as the transient period equation since it incorporates the termto account for the changing amount of reactivity in the core. The */ term (prompt period) isnormally negligible with respect to the remainder of the equation and is often not included.
For conditions when the amount of reactivity in the core is constant ( ), and the reactorperiod is unchanging, Equation (4-8) can be simplified further to Equation (4-9) which is knownas the stable period equation.
(4-9)
P Po 10 SUR (t)
P Po e t / P Po 10 SUR (t)
PPo
e t / 10 SUR (t)
e t (sec)/ e 2.303 SUR (t (min))
t (sec) 2.303 SUR(t (min))
60 2.303 SUR
SUR 26.06
Reactor Theory (Reactor Operations) DOE-HDBK-1019/2-93 REACTOR KINETICS
Rev. 0 NP-04Page 17
Reactor Startup Rate (SUR)
The reactor startup rate (SUR) is defined as the number of factors of ten that power changesin one minute. The units of SUR are powers of ten per minute, or decades per minute (DPM).Equation (4-10) shows the relationship between reactor power and startup rate.
(4-10)
where:
SUR = reactor startup rate (DPM)t = time during reactor transient (minutes)
The relationship between reactor period and startup rate can be developed by considering Equations (4-6) and (4-10).
and
Changing the base of the exponential term on the right side to "e" (10 = e ) and solving the2.303
result yields the following.
(4-11)
Doubling Time
Sometimes it is useful to discuss the rate of change of reactor power in terms similar to thoseused in radioactive decay calculations. Doubling or halving time are terms that relate to theamount of time it takes reactor power to double or be reduced to one-half the initial power level.If the stable reactor period is known, doubling time can be determined as follows.
P Po 2t /DT
keff 1
keff
1.0025 11.0025
0.00249 k/k
¯eff
eff
0.0070 0.002490.10 sec 1 0.00249
18.1 sec
REACTOR KINETICS DOE-HDBK-1019/2-93 Reactor Theory (Reactor Operations)
NP-04 Rev. 0Page 18
Doubling time (DT) = (ln 2)
where:= stable reactor period
ln 2 = natural logarithm of 2
When the doubling time is known, the power level change from P is given by the followingo
equation.
(4-12)
where:t = time interval of transientDT = doubling time
The following example problems reinforce the concepts of period and startup rate.
Example 1:
A reactor has a of 0.10 sec and an effective delayed neutron fraction of 0.0070. Ifeff-1
k is equal to 1.0025, what is the stable reactor period and the SUR?eff
Solution:
Step 1: First solve for reactivity using Equation (3-5).
Step 2: Use this value of reactivity in Equation (4-9) to calculate reactor period.
SUR 26.06
26.0618.1 sec
1.44 DPM
¯eff
eff
0.0068 ( 0.00130)0.05 sec 1 ( 0.00130)
124.6 sec
SUR 26.06
26.06124.6 sec
0.2091 DPM
P Po e t /
100 W e (120 s/ 124.6 s)
38.2 W
P Po 10 SUR (t)
(100 W) 10( 0.2091 DPM) (2 min)
38.2 W
Reactor Theory (Reactor Operations) DOE-HDBK-1019/2-93 REACTOR KINETICS
Rev. 0 NP-04Page 19
Step 3: The startup rate can be calculated from the reactor period using Equation (4-11).
Example 2:
130 pcm of negative reactivity is added to a reactor that is initially critical at a power of100 watts. for the reactor is 0.05 sec and the effective delayed neutron fraction iseff
-1
0.0068. Calculate the steady state period and startup rate. Also calculate the powerlevel 2 minutes after the reactivity insertion.
Solution:
Step 1: Use Equation (4-9) to calculate the reactor period.
Step 2: The startup rate can be calculated from the reactor period using Equation (4-11).
Step 3: Use either Equation (4-1) or Equation (4-10) to calculate the reactorpower two minutes after the reactivity insertion.
P Po (2)t /DT
(1,000 W) (2)10 min/2 min
32,000 W
REACTOR KINETICS DOE-HDBK-1019/2-93 Reactor Theory (Reactor Operations)
NP-04 Rev. 0Page 20
Example 3:
A reactor has a power level of 1000 watts and a doubling time of 2 minutes. What is thereactor power level 10 minutes later?
Solution:
Use Equation (4-12) to calculate the final power level.

¯
¯eff
¯eff
eff
promptterm
delayedterm
¯eff
Reactor Theory (Reactor Operations) DOE-HDBK-1019/2-93 REACTOR KINETICS
Rev. 0 NP-04Page 21
Summary
The important information in this chapter is summarized below.
Reactor Kinetics Summary
Reactor period is the time required for reactor power to change by a factor of e(2.718).
Doubling time is the time required for reactor power to double.
Reactor startup rate is the number of factors of ten that reactor power changes inone minute.
The delayed neutron fraction ( ) is the fraction of all fission neutrons that areborn as delayed neutrons for a particular type of fuel (that is, uranium-235 andplutonium-239).
The average delayed neutron fraction ( ) is the weighted average of the totaldelayed neutron fractions of the different types of fuel used in a particular reactor.
The effective delayed neutron fraction ( ) is the average delayed neutronfraction multiplied by an Importance Factor which accounts for the fact thatdelayed neutrons are born at lower average energies than fast neutrons.
The reactor period equation is stated below.
where:
= reactor period* = prompt generation lifetime
= effective delayed neutron fraction = reactivity
= effective delayed neutron precursor decay constanteff
= rate of change of reactivity
¯eff
eff
SUR 26.06
P Po 2t /DT
P Po e t / P Po 10 SUR (t)
REACTOR KINETICS DOE-HDBK-1019/2-93 Reactor Theory (Reactor Operations)
NP-04 Rev. 0Page 22
Reactor Kinetics Summary (Cont.)
Equations (4-9) and (4-11) can be used to calculate the stable reactor period andstartup rate.
The concept of doubling time can be used in a similar manner to reactor period tocalculate changes in reactor power using Equation (4-12).
The reactor period or the startup rate can be used to determine the reactor powerusing Equations (4-6) and (4-10).
Prompt jump is the small, immediate power increase that follows a positivereactivity insertion related to an increase in the prompt neutron population.
Prompt drop is the small, immediate power decrease that follows a negativereactivity insertion related to a decrease in the prompt neutron population.
Prompt critical is the condition when the reactor is critical on prompt neutronsalone.
When a reactor is prompt critical, the neutron population, and hence power, canincrease as quickly as the prompt neutron generation time allows.
Measuring reactivity in units of dollars is useful when determining if a reactor isprompt critical. A reactor that contains one dollar of positive reactivity is promptcritical since one dollar of reactivity is equivalent to .eff
Reactor Theory (Reactor Operations) DOE-HDBK-1019/2-93 REACTOR OPERATION
REACTOR OPERATION
It is important to understand the principles that determine how a reactor respondsduring all modes of operation. Special measures must be taken during the startupof a reactor to ensure that expected responses are occurring. During poweroperation, control of the flux shape is necessary to ensure operation within limitsand maximum core performance. Even when a reactor is shut down, the fact thatthe fission products created by the fission process continue to generate heatresults in a need to monitor support systems to ensure adequate cooling of thecore.
EO 3.1 EXPLAIN why a startup neutron source may be required fora reactor.
EO 3.2 LIST four variables typically involved in a reactivity balance.
EO 3.3 EXPLAIN how a reactivity balance may be used to predict theconditions under which the reactor will become critical.
EO 3.4 LIST three methods used to shape or flatten the core powerdistribution.
EO 3.5 DESCRIBE the concept of power tilt.
EO 3.6 DEFINE the term shutdown margin.
EO 3.7 EXPLAIN the rationale behind the one stuck rod criterion.
EO 3.8 IDENTIFY five changes that will occur during and after areactor shutdown that will affect the reactivity of the core.
EO 3.9 EXPLAIN why decay heat is present following reactoroperation.
EO 3.10 LIST three variables that will a ffect the amount of decay heatpresent following reactor shutdown.
EO 3.11 ESTIMATE the approximate amount of decay heat that willexist one hour after a shutdown from steady state conditions.
Rev. 0 NP-04Page 23
REACTOR OPERATION DOE-HDBK-1019/2-93 Reactor Theory (Reactor Operations)
Startup
When a reactor is started up with unirradiated fuel, or on those occasions when the reactor isrestarted following a long shutdown period, the source neutron population will be very low. Insome reactors, the neutron population is frequently low enough that it cannot be detected by thenuclear instrumentation during the approach to criticality. Installed neutron sources, such asthose discussed in Module 2, are frequently used to provide a safe, easily monitored reactorstartup. The neutron source, together with the subcritical multiplication process, provides asufficiently large neutron population to allow monitoring by the nuclear instruments throughoutthe startup procedure. Without the installed source, it may be possible to withdraw the controlrods to the point of criticality, and then continue withdrawal without detecting criticality becausethe reactor goes critical below the indicating range. Continued withdrawal of control rods at thispoint could cause reactor power to rise at an uncontrollable rate before neutron level firstbecomes visible on the nuclear instruments.
An alternative to using a startup source is to limit the rate of rod withdrawal, or require waitingperiods between rod withdrawal increments. By waiting between rod withdrawal increments,the neutron population is allowed to increase through subcritical multiplication. Subcriticalmultiplication is the process where source neutrons are used to sustain the chain reaction in areactor with a multiplication factor (keff) of less than one. The chain reaction is not"self-sustaining," but if the neutron source is of sufficient magnitude, it compensates for theneutrons lost through absorption and leakage. This process can result in a constant, orincreasing, neutron population even though keff is less than one.
Estimated Cr itical Position
In the first chapter of this module, 1/M plots were discussed. These plots were useful formonitoring the approach to criticality and predicting when criticality will occur based onindications received while the startup is actually in progress. Before the reactor startup isinitiated, the operator calculates an estimate of the amount of rod withdrawal that will benecessary to achieve criticality. This process provides an added margin of safety because a largediscrepancy between actual and estimated critical rod positions would indicate that the core wasnot performing as designed. Depending upon a reactor's design or age, the buildup of xenonwithin the first several hours following a reactor shutdown may introduce enough negativereactivity to cause the reactor to remain shutdown even with the control rods fully withdrawn.In this situation it is important to be able to predict whether criticality can be achieved, and ifcriticality cannot be achieved, the startup should not be attempted.
For a given set of conditions (such as time since shutdown, temperature, pressure, fuel burnup,samarium and xenon poisoning) there is only one position of the control rods (and boronconcentrations for a reactor with chemical shim) that results in criticality, using the normal rodwithdrawal sequence. Identification of these conditions allows accurate calculation of controlrod position at criticality. The calculation of an estimated critical position (ECP) is simply amathematical procedure that takes into account all of the changes in factors that significantlyaffect reactivity that have occurred between the time of reactor shutdown and the time that thereactor is brought critical again.
NP-04 Rev. 0Page 24
Reactor Theory (Reactor Operations) DOE-HDBK-1019/2-93 REACTOR OPERATION
For most reactor designs, the only factors that change significantly after the reactor is shut downare the average reactor temperature and the concentration of fission product poisons. Thereactivities normally considered when calculating an ECP include the following.
Basic Reactivity of the Core- The reactivity associated with the critical control rodposition for a xenon-free core at normal operatingtemperature. This reactivity varies with the age of the core(amount of fuel burnup).
Direct Xenon Reactivity - The reactivity related to the xenon that was actually presentin the core at the time it was shutdown. This reactivity iscorrected to allow for xenon decay.
Indirect Xenon Reactivity - The reactivity related to the xenon produced by the decayof iodine that was present in the core at the time ofshutdown.
Temperature Reactivity - The reactivity related to the difference between the actualreactor temperature during startup and the normal operatingtemperature.
To arrive at an ECP of the control rods, the basic reactivity, direct and indirect xenon reactivity,and temperature reactivity are combined algebraically to determine the amount of positive controlrod reactivity that must be added by withdrawing control rods to attain criticality. A graph ofcontrol rod worth versus rod position is used to determine the estimated critical position.
Cor e Power Distr ibution
In order to ensure predictable temperatures and uniform depletion of the fuel installed in areactor, numerous measures are taken to provide an even distribution of flux throughout thepower producing section of the reactor. This shaping, or flattening, of the neutron flux isnormally achieved through the use of reflectors that affect the flux profile across the core, orby the installation of poisons to suppress the neutron flux where desired. The last method,although effective at shaping the flux, is the least desirable since it reduces neutron economy byabsorbing the neutrons.
A reactor core is frequently surrounded by a "reflecting" material to reduce the ratio of peakflux to the flux at the edge of the core fuel area. Reflector materials are normally notfissionable, have a high scattering cross section, and have a low absorption cross section.Essentially, for thermal reactors a good moderator is a good reflector. Water, heavy water,beryllium, zirconium, or graphite are commonly used as reflectors. In fast reactor systems,reflectors are not composed of moderating materials because it is desired to keep neutron energyhigh. The reflector functions by scattering some of the neutrons, which would have leaked froma bare (unreflected) core, back into the fuel to produce additional fissions.
Rev. 0 NP-04Page 25
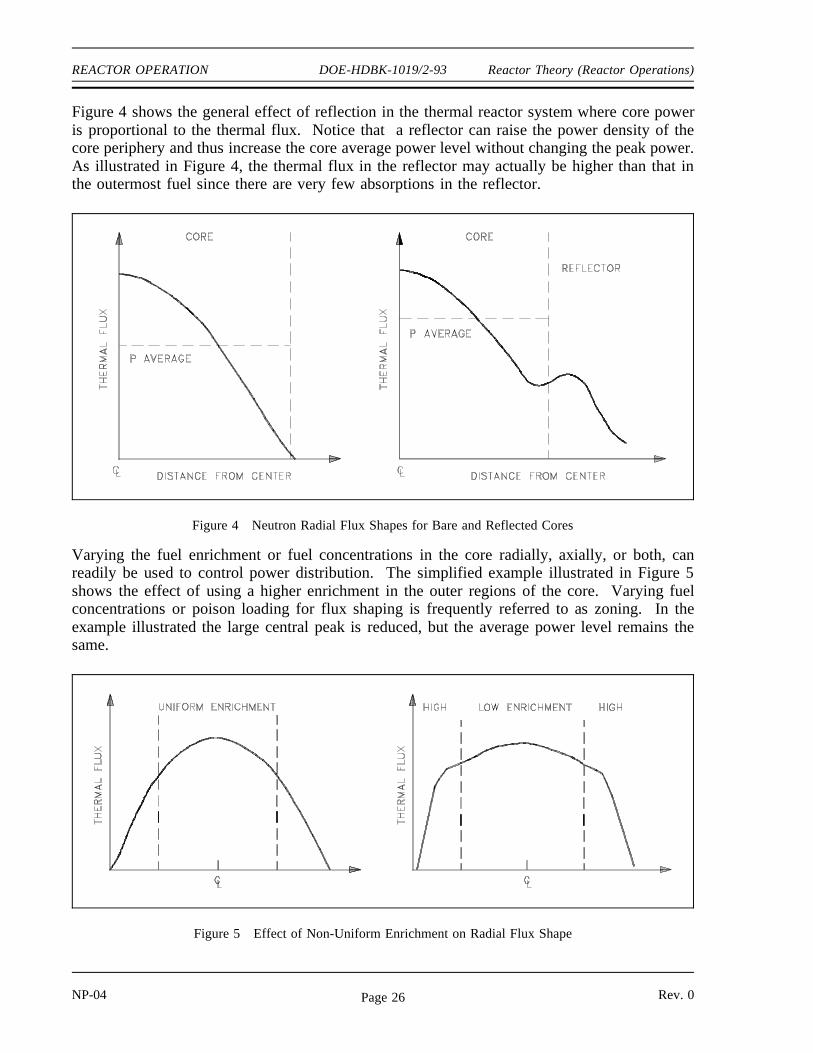
REACTOR OPERATION DOE-HDBK-1019/2-93 Reactor Theory (Reactor Operations)
Figure 4 shows the general effect of reflection in the thermal reactor system where core poweris proportional to the thermal flux. Notice that a reflector can raise the power density of thecore periphery and thus increase the core average power level without changing the peak power.As illustrated in Figure 4, the thermal flux in the reflector may actually be higher than that inthe outermost fuel since there are very few absorptions in the reflector.
Varying the fuel enrichment or fuel concentrations in the core radially, axially, or both, can
Figure 4 Neutron Radial Flux Shapes for Bare and Reflected Cores
readily be used to control power distribution. The simplified example illustrated in Figure 5shows the effect of using a higher enrichment in the outer regions of the core. Varying fuelconcentrations or poison loading for flux shaping is frequently referred to as zoning. In theexample illustrated the large central peak is reduced, but the average power level remains thesame.
Figure 5 Effect of Non-Uniform Enrichment on Radial Flux Shape
NP-04 Rev. 0Page 26
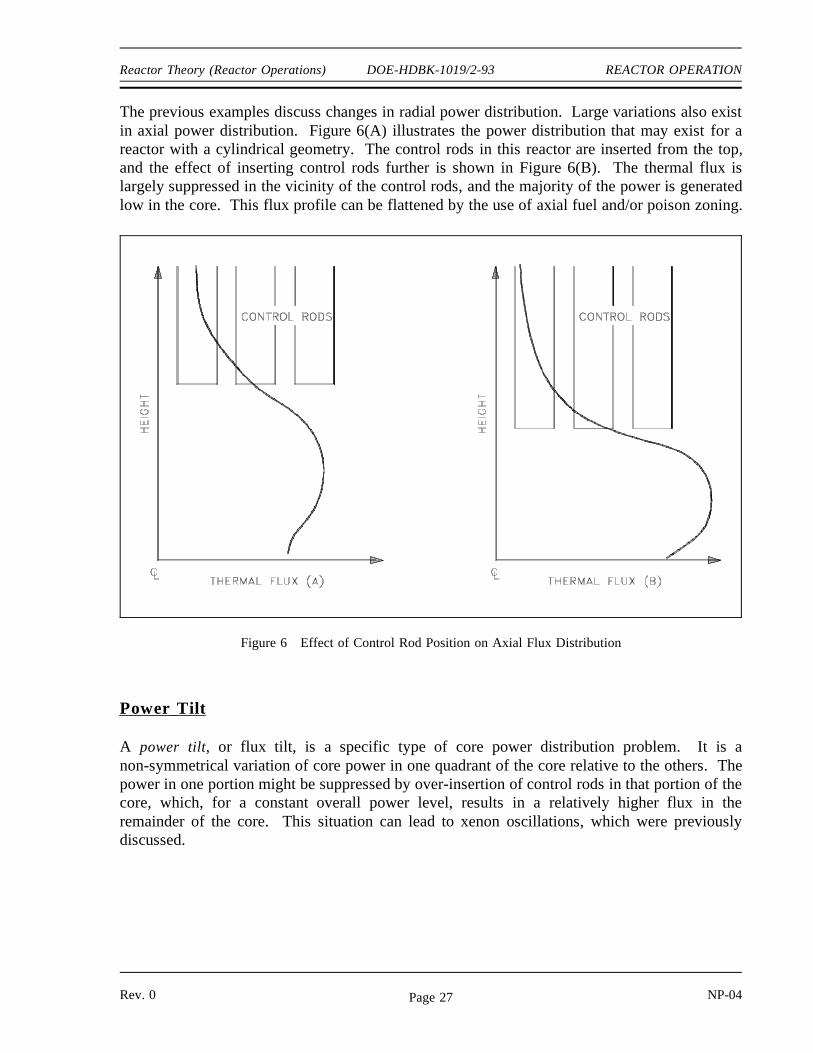
Reactor Theory (Reactor Operations) DOE-HDBK-1019/2-93 REACTOR OPERATION
The previous examples discuss changes in radial power distribution. Large variations also existin axial power distribution. Figure 6(A) illustrates the power distribution that may exist for areactor with a cylindrical geometry. The control rods in this reactor are inserted from the top,and the effect of inserting control rods further is shown in Figure 6(B). The thermal flux islargely suppressed in the vicinity of the control rods, and the majority of the power is generatedlow in the core. This flux profile can be flattened by the use of axial fuel and/or poison zoning.
Figure 6 Effect of Control Rod Position on Axial Flux Distribution
Power T ilt
A power tilt, or flux tilt, is a specific type of core power distribution problem. It is anon-symmetrical variation of core power in one quadrant of the core relative to the others. Thepower in one portion might be suppressed by over-insertion of control rods in that portion of thecore, which, for a constant overall power level, results in a relatively higher flux in theremainder of the core. This situation can lead to xenon oscillations, which were previouslydiscussed.
Rev. 0 NP-04Page 27
REACTOR OPERATION DOE-HDBK-1019/2-93 Reactor Theory (Reactor Operations)
Shutdown Mar gin
Shutdown margin is the instantaneous amount of reactivity by which a reactor is subcritical orwould be subcritical from its present condition assuming all control rods are fully inserted exceptfor the single rod with the highest integral worth, which is assumed to be fully withdrawn.Shutdown margin is required to exist at all times, even when the reactor is critical. It isimportant that there be enough negative reactivity capable of being inserted by the control rodsto ensure complete shutdown at all times during the core lifetime. A shutdown margin in therange of one to five percent reactivity is typically required.
The stuck rod criterion refers to the fact that the shutdown margin does not take credit for theinsertion of the highest worth control rod. The application of the stuck rod criterion ensures thatthe failure of a single control rod will not prevent the control rod system from shutting downthe reactor.
Oper ation
During reactor operation, numerous parameters such as temperature, pressure, power level, andflow are continuously monitored and controlled to ensure safe and stable operation of the reactor.The specific effects of variations in these parameters vary greatly depending upon reactor design,but generally the effects for thermal reactors are as follows.
Temper atur e
The most significant effect of a variation in temperature upon reactor operation is the additionof positive or negative reactivity. As previously discussed, reactors are generally designed withnegative temperature coefficients of reactivity (moderator and fuel temperature coefficients) asa self-limiting safety feature. A rise in reactor temperature results in the addition of negativereactivity. If the rise in temperature is caused by an increase in reactor power, the negativereactivity addition slows, and eventually turns the increase in reactor power. This is a highlydesirable effect because it provides a negative feedback in the event of an undesired powerexcursion.
Negative temperature coefficients can also be utilized in water cooled and moderated powerreactors to allow reactor power to automatically follow energy demands that are placed upon thesystem. For example, consider a reactor operating at a stable power level with the heatproduced being transferred to a heat exchanger for use in an external closed cycle system. Ifthe energy demand in the external system increases, more energy is removed from reactor systemcausing the temperature of the reactor coolant to decrease. As the reactor temperaturedecreases, positive reactivity is added and a corresponding increase in reactor power levelresults.
NP-04 Rev. 0Page 28
Reactor Theory (Reactor Operations) DOE-HDBK-1019/2-93 REACTOR OPERATION
As reactor power increases to a level above the level of the new energy demand, the temperatureof the moderator and fuel increases, adding negative reactivity and decreasing reactor powerlevel to near the new level required to maintain system temperature. Some slight oscillationsabove and below the new power level occur before steady state conditions are achieved. Thefinal result is that the average temperature of the reactor system is essentially the same as theinitial temperature, and the reactor is operating at the new higher required power level. Thesame inherent stability can be observed as the energy demand on the system is decreased.
If the secondary system providing cooling to the reactor heat exchanger is operated as an opensystem with once-through cooling, the above discussion is not applicable. In these reactors, thetemperature of the reactor is proportional to the power level, and it is impossible for the reactorto be at a higher power level and the same temperature.
Pr essur e
The pressure applied to the reactor system can also affect reactor operation by causing changesin reactivity. The reactivity changes result from changes in the density of the moderator inresponse to the pressure changes. For example, as the system pressure rises, the moderatordensity increases and results in greater moderation, less neutron leakage, and therefore theinsertion of positive reactivity. A reduction in system pressure results in the addition of negativereactivity. Typically, in pressurized water reactors (PWR), the magnitude of this effect isconsiderably less than that of a change in temperature. In two-phase systems such as boilingwater reactors (BWR), however, the effects of pressure changes are more noticeable becausethere is a greater change in moderator density for a given change in system pressure.
Power L evel
A change in reactor power level can result in a change in reactivity if the power level changeresults in a change in system temperature.
The power level at which the reactor is producing enough energy to make up for the energy lostto ambient is commonly referred to as the point of adding heat. If a reactor is operating wellbelow the point of adding heat, then variations in power level produce no measurable variationsin temperature. At power levels above the point of adding heat, temperature varies with powerlevel, and the reactivity changes will follow the convention previously described for temperaturevariations.
The inherent stability and power turning ability of a negative temperature coefficient areineffective below the point of adding heat. If a power excursion is initiated from a very lowpower level, power will continue to rise unchecked until the point of adding heat is reached, andthe subsequent temperature rise adds negative reactivity to slow, and turn, the rise of reactorpower. In this region, reactor safety is provided by automatic reactor shutdown systems andoperator action.
Rev. 0 NP-04Page 29
REACTOR OPERATION DOE-HDBK-1019/2-93 Reactor Theory (Reactor Operations)
Flow
At low reactor power levels, changing the flow rate of the coolant through the reactor does notresult in a measurable reactivity change because fuel and moderator temperatures and the fractionof steam voids occurring in the core are not changed appreciably.
When the flow rate is varied, however, the change in temperature that occurs across the core(outlet versus inlet temperature) will vary inversely with the flow rate. At higher power levels,on liquid cooled systems, increasing flow will lower fuel and coolant temperatures slightly,resulting in a small positive reactivity insertion. A positive reactivity addition also occurs whenflow is increased in a two-phase (steam-water) cooled system. Increasing the flow rate decreasesthe fraction of steam voids in the coolant and results in a positive reactivity addition. Thisproperty of the moderator in a two-phase system is used extensively in commercial BWRs.Normal power variations required to follow load changes on BWRs are achieved by varying thecoolant/moderator flow rate.
Cor e Bur nup
As a reactor is operated, atoms of fuel are constantly consumed, resulting in the slow depletionof the fuel frequently referred to as core burnup. There are several major effects of this fueldepletion. The first, and most obvious, effect of the fuel burnup is that the control rods mustbe withdrawn or chemical shim concentration reduced to compensate for the negative reactivityeffect of this burnup.
Some reactor designs incorporate the use of supplemental burnable poisons in addition to thecontrol rods to compensate for the reactivity associated with excess fuel in a new core. Thesefixed burnable poisons burn out at a rate that approximates the burnout of the fuel and theyreduce the amount of control rod movement necessary to compensate for fuel depletion early incore life.
As control rods are withdrawn to compensate for fuel depletion, the effective size of the reactoris increased. By increasing the effective size of the reactor, the probability that a neutron slowsdown and is absorbed while it is still in the reactor is also increased. Therefore, neutron leakagedecreases as the effective reactor size is increased. The magnitude of the moderator negativetemperature coefficient is determined in part by the change in neutron leakage that occurs as theresult of a change in moderator temperature. Since the fraction of neutrons leaking out is lesswith the larger core, a given temperature change will have less of an effect on the leakage.Therefore, the magnitude of the moderator negative temperature coefficient decreases with fuelburnup.
NP-04 Rev. 0Page 30
Reactor Theory (Reactor Operations) DOE-HDBK-1019/2-93 REACTOR OPERATION
There is also another effect that is a consideration only on reactors that use dissolved boron inthe moderator (chemical shim). As the fuel is burned up, the dissolved boron in the moderatoris slowly removed (concentration diluted) to compensate for the negative reactivity effects of fuelburnup. This action results in a larger (more negative) moderator temperature coefficient ofreactivity in a reactor using chemical shim. This is due to the fact that when water density isdecreased by rising moderator temperature in a reactor with a negative temperature coefficient,it results in a negative reactivity addition because some moderator is forced out of the core.With a coolant containing dissolved poison, this density decrease also results in some poisonbeing forced out of the core, which is a positive reactivity addition, thereby reducing themagnitude of the negative reactivity added by the temperature increase. Because as fuel burnupincreases the concentration of boron is slowly lowered, the positive reactivity added by the abovepoison removal process is lessened, and this results in a larger negative temperature coefficientof reactivity.
The following effect of fuel burnup is most predominant in a reactor with a large concentrationof uranium-238. As the fission process occurs in a thermal reactor with low or mediumenrichment, there is some conversion of uranium-238 into plutonium-239. Near the end of corelife in certain reactors, the power contribution from the fission of plutonium-239 may becomparable to that from the fission of uranium-235. The value of the delayed neutron fraction(β) for uranium-235 is 0.0064 and for plutonium-239 is 0.0021. Consequently, as core burnupprogresses, the effective delayed neutron fraction for the fuel decreases appreciably. It followsthen that the amount of reactivity insertion needed to produce a given reactor period decreaseswith burnup of the fuel.
Shutdown
A reactor is considered to be shut down when it is subcritical and sufficient shutdown reactivityexists so there is no immediate probability of regaining criticality. Shutdown is normallyaccomplished by insertion of some (or all) of the control rods, or by introduction of solubleneutron poison into the reactor coolant.
The rate at which the reactor fission rate decays immediately following shutdown is similar forall reactors provided a large amount of negative reactivity is inserted. After a large negativereactivity addition the neutron level undergoes a rapid decrease of about two decades (promptdrop) until it is at the level of production of delayed neutrons. Then the neutron level slowlydrops off as the delayed neutron precursors decay, and in a short while only the longest-livedprecursor remains in any significant amount. This precursor determines the final rate ofdecrease in reactor power until the neutron flux reaches the steady state level corresponding tothe subcritical multiplication of the neutron source.
Rev. 0 NP-04Page 31
REACTOR OPERATION DOE-HDBK-1019/2-93 Reactor Theory (Reactor Operations)
The half-life of the longest lived delayed neutron precursor results in a reactor period of around-80 seconds or a startup rate of -1/3 DPM for most reactors after a reactor shutdown. Onenoticeable exception to this is a heavy water reactor. In a heavy water reactor, the photo-neutron source is extremely large after shutdown due to the amount of deuterium in themoderator and the large number of high energy gammas from short-lived fission product decay.The photo-neutron source is large enough to have a significant impact on neutron populationimmediately after shutdown. The photo-neutron source has the result of flux levels decreasingmore slowly so that a heavy water reactor will have a significantly larger negative reactor periodafter a shutdown.
Throughout the process of reactor shutdown the nuclear instrumentation is closely monitored toobserve that reactor neutron population is decreasing as expected, and that the instrumentationis functioning properly to provide continuous indication of neutron population. Instrumentationis observed for proper overlap between ranges, comparable indication between multipleinstrument channels, and proper decay rate of neutron population.
A distinction should be made between indicated reactor power level after shutdown and theactual thermal power level. The indicated reactor power level is the power produced directlyfrom fission in the reactor core, but the actual thermal power drops more slowly due to decayheat production as previously discussed. Decay heat, although approximately 5 to 6% of thesteady state reactor power prior to shutdown, diminishes to less than 1% of the pre-shutdownpower level after about one hour.
After a reactor is shutdown, provisions are provided for the removal of decay heat. If thereactor is to be shut down for only a short time, operating temperature is normally maintained.If the shutdown period will be lengthy or involves functions requiring cooldown of the reactor,the reactor temperature can be lowered by a number of methods. The methods for actuallyconducting cooldown of the reactor vary depending on plant design, but in all cases limitationsare imposed on the maximum rate at which the reactor systems may be cooled. These limits areprovided to reduce the stress applied to system materials, thereby reducing the possibility of stressinduced failure.
Although a reactor is shut down, it must be continuously monitored to ensure the safety of thereactor. Automatic monitoring systems are employed to continuously collect and assess the dataprovided by remote sensors. It is ultimately the operator who must ensure the safety of thereactor.
NP-04 Rev. 0Page 32
Reactor Theory (Reactor Operations) DOE-HDBK-1019/2-93 REACTOR OPERATION
Decay Heat
About 7 percent of the 200 MeV produced by an average fission is released at some time afterthe instant of fission. This energy comes from the decay of the fission products. When areactor is shut down, fission essentially ceases, but decay energy is still being produced. Theenergy produced after shutdown is referred to as decay heat. The amount of decay heatproduction after shutdown is directly influenced by the power history of the reactor prior toshutdown. A reactor operated at full power for 3 to 4 days prior to shutdown has much higherdecay heat generation than a reactor operated at low power for the same period. The decay heatproduced by a reactor shutdown from full power is initially equivalent to about 5 to 6% of thethermal rating of the reactor. This decay heat generation rate diminishes to less than 1%approximately one hour after shutdown. However, even at these low levels, the amount of heatgenerated requires the continued removal of heat for an appreciable time after shutdown. Decayheat is a long-term consideration and impacts spent fuel handling, reprocessing, wastemanagement, and reactor safety.
Summary
The important information in this chapter is summarized below.
Reactor Operation Summary
An installed neutron source, together with the subcritical multiplication process,may be needed to increase the neutron population to a level where it can bemonitored throughout the startup procedure.
Reactivity balances, such as Estimated Critical Position calculations, typicallyconsider the basic reactivity of the core and the reactivity effects of temperature,direct xenon, and indirect xenon.
A reactivity balance called an Estimated Critical Position is used to predict theposition of the control rods at which criticality will be achieved during a startup.To arrive at an ECP of the control rods, the basic reactivity, direct and indirectxenon reactivity, and temperature reactivity are added together to determine theamount of positive reactivity that must be added by withdrawing control rods toattain criticality. A graph of control rod worth versus rod position is used todetermine the estimated critical position.
Rev. 0 NP-04Page 33
REACTOR OPERATION DOE-HDBK-1019/2-93 Reactor Theory (Reactor Operations)
Reactor Operation Summary (Cont.)
Three methods are used to shape or flatten the core power distribution.Use of reflectorsInstallation of neutron poisonsAxial or radial variation of fuel enrichment
Power tilt is a non-symmetrical variation of core power in one quadrant of thecore relative to the other quadrants.
Shutdown margin is the instantaneous amount of reactivity by which a reactoris subcritical or would be subcritical from its present condition assuming allcontrol rods are fully inserted except for the single rod with the highest integralworth, which is assumed to be fully withdrawn.
The stuck rod criterion is applied to the shutdown margin to ensure that thefailure of a single control rod will not prevent the control rod system fromshutting down the reactor.
Several factors may change during and after the shutdown of the reactor thataffect the reactivity of the core.
Control rod positionSoluble neutron poison concentrationTemperature of the fuel and coolantXenonSamarium
Decay heat is always present following reactor operation due to energy resultingfrom the decay of fission products.
The amount of decay heat present in the reactor is dependent on three factors.The pre-shutdown power levelHow long the reactor operatedThe amount of time since reactor shutdown
Decay heat immediately after shutdown is approximately 5-6% of the pre-shutdown power level. Decay heat will decrease to approximately 1% of thepre-shutdown power level within one hour of reactor shutdown.
NP-04 Rev. 0Page 34
Reactor Theory (Reactor Operations) DOE-HDBK-1019/2-93 REACTOR OPERATION
end of text.
CONCLUDING MATERIAL
Review activities:
DOE - ANL-W, BNL, EG&G Idaho,EG&G Mound, EG&G Rocky Flats,LLNL, LANL, MMES, ORAU, REECo,WHC, WINCO, WEMCO, and WSRC.
Preparing activity:
DOE - NE-73Project Number 6910-0025
Rev. 0 NP-04Page 35

REACTOR OPERATION DOE-HDBK-1019/2-93 Reactor Theory (Reactor Operations)
Intentionally Left Blank
NP-04 Rev. 0Page 36