Embed Size (px)
Citation preview
DOES CAPITAL ACCOUNT LIBERALISATION LEAD TOINVESTMENT BOOMS IN CARIBBEAN ECONOMIES
DANIEL BOAMAH, ROLAND CRAIGWELL, DARRIN DOWNES ANDTRAVIS MITCHELL
FOR PRESENTATION AT THE
CARRIBEAN CENTREFOR
MONETARY STUDIES
XXXVII ANUUAL CONFERENCE
1-4 NOVEMBER 2005
CENTRAL BANK OF BARBADOS Research Department
Does Capital Account Liberalisation Lead To Investment Booms in CaribbeanEconomies?
The authors welcome any comments on thispaper. Citations should refer to a Central Bankof Barbados Working Paper. The viewsexpressed are those of the authors and do notnecessarily represent those of the Central Bankof Barbados
Abstract
It is often argued that capital account liberalisation has provided the main impetus for thesignificant surge in cross border capital flows over the past two decades. At the sametime, the literature attests to the fact that capital account liberalisation entails a great dealof risks to developing countries because opening up the capital account can bedestabilising, to the extent that it can increase the vulnerability of these countries toexternal shocks through sharp changes in foreign exchange reserves. This paper attemptsto empirically examine whether capital account liberalisation stimulates higher capitaland financial inflows in Caribbean countries, using data for Barbados, Guyana, Jamaicaand Trinidad and Tobago. It also seeks to investigate the extent to which these inflowshave translated into increased investment. The results from the ARDL co-integrationmethodology does not give definitive support to the hypothesis that liberalising thecapital account leads to increased private capital inflows. However, it provides someevidence that capital flows are significant in explaining the movements in privateinvestment.
2
Does Capital Account Liberalisation Lead To Investment Booms in CaribbeanEconomies?
Introduction
It is often argued that capital account liberalisation has provided the main impetus for the
considerable surge in cross border capital flows over the past two decades. At the same
time, the literature attests to the fact that capital account liberalisation entails a great deal
of risks to developing countries because opening up the capital account can be
destabilising, to the extent that it can increase the vulnerability of these countries to
external shocks through sharp changes in foreign exchange reserves.
The case in favour of capital account liberalisation is largely based on efficiency grounds.
For instance, it is argued that capital account convertibility reduces domestic financial
transaction costs, stimulates innovation and introduces competition in the financial
industry both locally and from abroad. Moreover, for countries with limited access to
private external finance, it is suggested that an open capital account may facilitate the
flow of urgently needed foreign savings, thereby increasing investment and growth.
Additionally, liberalisation provides domestic investors with more opportunities to
diversify their portfolios and decrease the concentration of exposure to domestic market
risks. However, country experiences imply that the perceived benefits work best largely
for countries with sound macroeconomic fundamentals, with well-developed financial
markets, effective regulatory and prudential structures and with exchange rate policy that
allows adequate flexibility.
Macroeconomic management following capital account liberalisation in most developing
countries lacks effectiveness because of the limited range and potency of available
instruments. Financial institutions are exposed to more risks and hence there is a need for
stronger regulations and supervision and most importantly, the private sector needs to
develop appropriate instruments to manage the increasing risks in an open economy. The
attainment of such sound macroeconomic systems, including strengthening the financial
system through adequate prudential regulations, is a process that develops over time.
3

Thus, many developing countries, in various stages of development, often impose
controls on capital account transactions in an effort to shield themselves from costs
associated with fluctuations in international capital flows.
Mathienson and Rojas-Suarez (1993) cites a number of grounds by which countries
justify the use of capital controls. These include, among others, management of balance
of payments crises or unstable exchange rates generated by excessively volatile short run
capital flows, limiting foreign ownership of domestic factors of production, maintaining
the authorities ability to tax domestic financial activities, income and wealth, ensuring
that domestic savings are used to finance domestic investment, and preventing capital
flows from disrupting stabilization and structural reform programmes. However, in the
Caribbean, capital controls have been largely used to: retain domestic savings to finance
domestic investment; support a fixed exchange rate system by ensuring the availability of
adequate reserves to meet normal balance of payments transactions, and; insulate the
domestic economy from external shocks. For instance, cushioning the exchange rate as
far as possible from the destabilising effect of sudden capital movements.
The general hypothesis that appears to be emerging from the literature suggests that, on
average, not enough savings are generated domestically so foreign savings plays a major
role in closing the savings-investment gaps. Many analysts have argued that opening the
capital account usually leads to inflows of foreign capital that, in turn, should cause
noticeable jumps in the investment-GDP ratios. What is the evidence in the Caribbean?
As is the case with many developing countries in other regions, the countries in the
Caribbean have also had to contend with challenges arising from periodic bouts of
internal and external imbalances, some of which could be traced to external shocks
arising largely from the energy crisis of the 1970s and the effects of the associated
measures that were put in place to deal with these shocks. Standard demand management
policies along with varying degrees of stabilisation and structural reforms were adopted
as countries sought to adjust their economies to deal with these shocks. As small open,
mostly fixed exchange rate regimes that depend heavily on international trade, measures
4
to address balance of payment imbalances featured prominently in these adjustment
efforts. More often than not restrictions were imposed on external current and capital
transactions in the pre-1990 period.
Since the beginning of the 1990s, Guyana, Jamaica and Trinidad and Tobago have
liberalised their economies, removing exchange controls and opening up their capital
accounts. With the experience of between 12 to 15 years, there should be enough
evidence to support or reject the view that capital account liberalisation facilitates
significantly a discernable increase in private capital inflows.
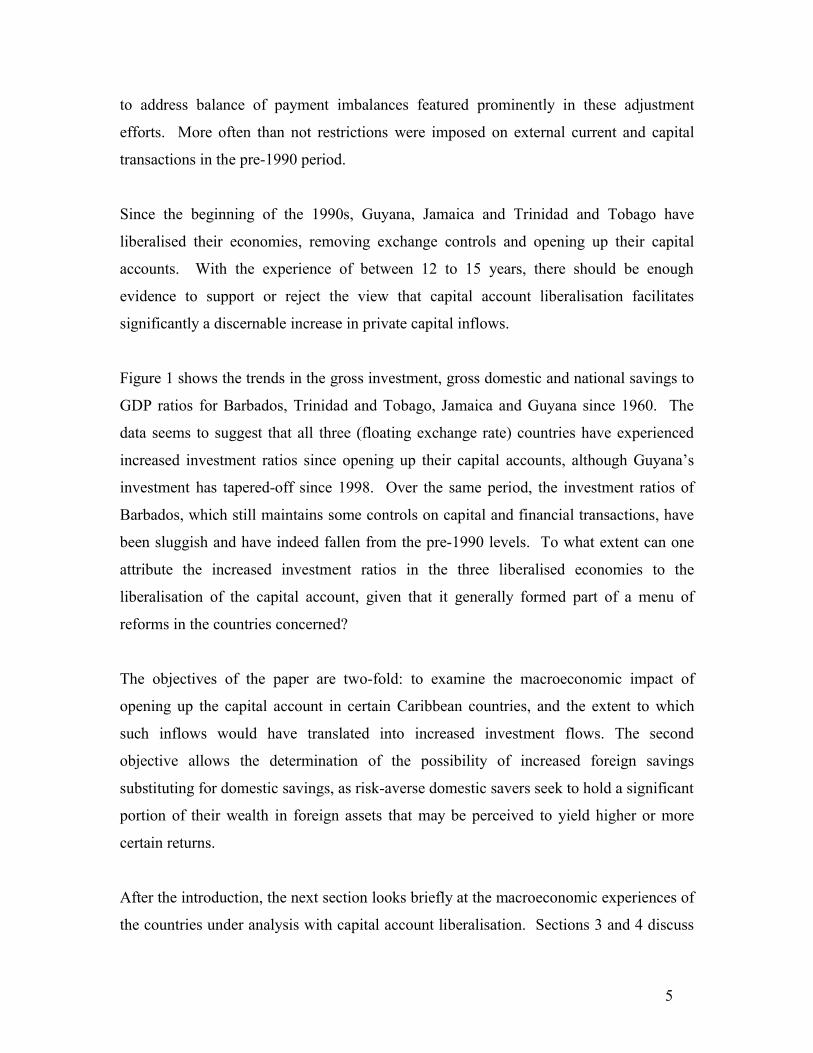
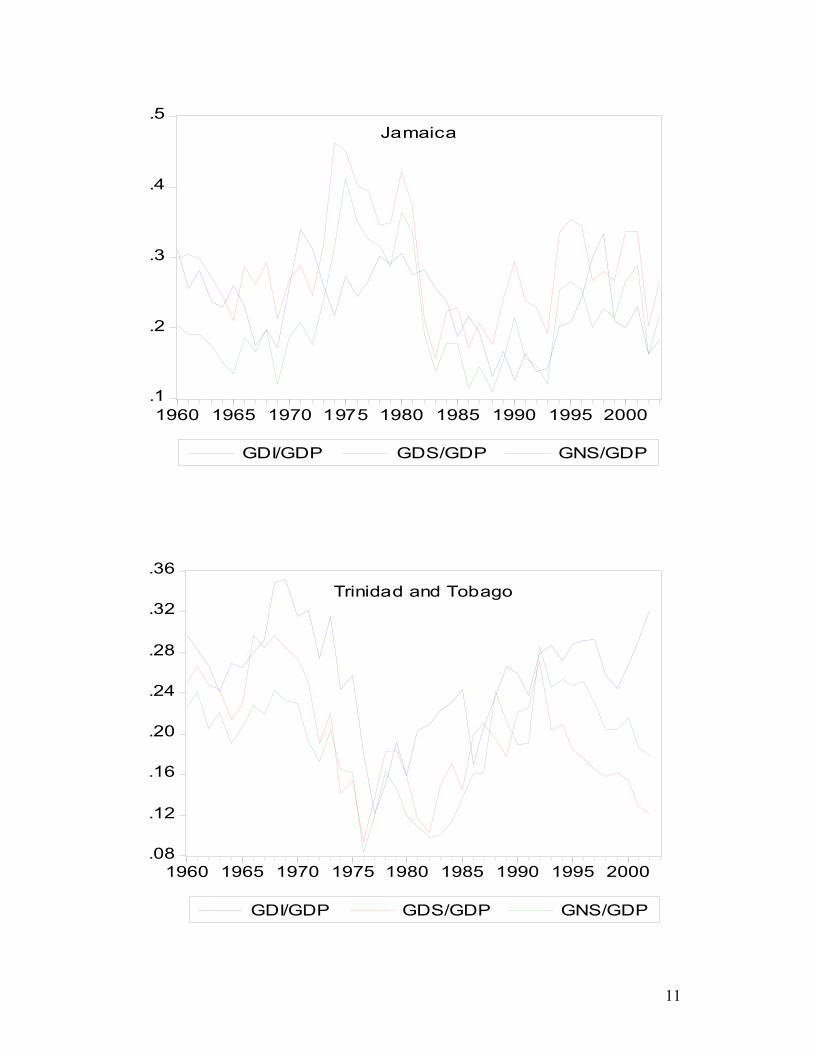
Figure 1 shows the trends in the gross investment, gross domestic and national savings to
GDP ratios for Barbados, Trinidad and Tobago, Jamaica and Guyana since 1960. The
data seems to suggest that all three (floating exchange rate) countries have experienced
increased investment ratios since opening up their capital accounts, although Guyana’s
investment has tapered-off since 1998. Over the same period, the investment ratios of
Barbados, which still maintains some controls on capital and financial transactions, have
been sluggish and have indeed fallen from the pre-1990 levels. To what extent can one
attribute the increased investment ratios in the three liberalised economies to the
liberalisation of the capital account, given that it generally formed part of a menu of
reforms in the countries concerned?
The objectives of the paper are two-fold: to examine the macroeconomic impact of
opening up the capital account in certain Caribbean countries, and the extent to which
such inflows would have translated into increased investment flows. The second
objective allows the determination of the possibility of increased foreign savings
substituting for domestic savings, as risk-averse domestic savers seek to hold a significant
portion of their wealth in foreign assets that may be perceived to yield higher or more
certain returns.
After the introduction, the next section looks briefly at the macroeconomic experiences of
the countries under analysis with capital account liberalisation. Sections 3 and 4 discuss
5

the theoretical approaches and empirical evidence of capital account liberalisation in
private capital inflows. Section 5 outlines the empirical model, econometric
methodology and data. The results are presented in section 6 and the final section
concludes.
2. Selected Country Experiences Since Capital Account Liberalisation
During the 1970s and 1980s Caribbean economies were characterised by highly
restrictive trade and financial regimes: credit was largely directed to priority sectors at
preferential interest rates, restrictions on current and capital accounts were extensively
used, and market interest rates were administratively set by the authorities. These
policies, while well intentioned, insulated the domestic economy, but at the same time
were ineffective in a changing global environment. To bring about some measure of
efficiency in the allocation and mobilisation of resources, Caribbean economies began the
process of liberalising their financial systems as part of an overall package of economic
reforms. With trade reforms and a gradual move towards more outward-oriented
development strategies in the 1990s many of the countries in the Caribbean removed
restrictions on external account and capital accounts. In particular, this aspect has been
the most emphasised component of the financial liberalisation process in the Caribbean,
as it is critical to the proper functioning of the Single Market and Economy, which
envisages, inter alia, the free movement of capital across regional borders.
Guyana, Jamaica and Trinidad removed all capital restrictions on both the current and
capital accounts during the early 1990s. Jamaica liberalised its foreign exchange market
substantially, opting for the simultaneous liberalisation of the current and the capital and
financial accounts. The number of dealers increased in 1994 and there was the
establishment of numerous cambios and merchant banks. Guyana opted for a more
gradual process, liberalising over a period of five years, starting with current account
transactions and then the capital account. The liberalisation process in Trinidad and
Tobago occurred over a period of three years. After a period of achieving
macroeconomic stabilisation, the sequence of reforms followed were trade and tax reform
and afterwards the dismantling of the regime of exchange controls, which was followed
6
by the floating of the exchange rate in 1993. In the immediate period after the floatation,
the central bank, in collaboration with the commercial banks, introduced several
measures to engender stability in the foreign exchange market. These measures included
a code of conduct for market participants, a sharing agreement and an agreed minute.
According to Forde (2003), these arrangements contributed to the stability and the
reduction in volatility in the foreign exchange market. In addition, the central bank
intervenes when necessary in the foreign exchange market to smooth out swings in
liquidity and to keep the exchange rate inline with the macroeconomic environment.
Barbados has adopted a more gradualist approach to financial liberalisation and reform,
with the liberalisation agenda focussing primarily on removing restrictions to current
account transactions, with delegated authority granted to commercial banks to
authenticate numerous transactions, except for cash gifts, (undocumented) merchandise
imports, travel and foreign currency accounts. In particular, most current account
transactions with the OECS countries are fully liberalised, with the exception of
transactions in real estate and government securities1. Indeed, Barbados’ fixed exchange
rate regime underscores a more cautious approach with respect to capital account
liberalisation, on account of the inextricable link between the maintenance of sufficient
foreign reserves and the preservation of the fixed exchange rate. A major concern is that
opening up even within CARICOM could be tantamount to opening up to the rest of the
world, since countries like Jamaica, Trinidad and Guyana, which have fully liberalised
regimes, could act as conduits for capital outflows to the rest of the world. The
liberalisation process was boosted during the period 2000-01 with Government
borrowings of $300 million, specifically to buttress the foreign reserves against the
adverse effects from the liberalisation of trade and the expected liberalisation of exchange
controls. The liberalisation initiatives that followed included increased delegated
authority to commercial banks for current account transactions and pension funds were
permitted to increase their investments abroad and the regime for foreign currency
accounts was also liberalised.
1 The thinking here is that these transactions tend to be very large and could lead to volatility in the financialmarket and hence should be approached with caution.
7
Table 1 presents average comparative macroeconomic and balance of payments indicators
for the countries under analysis since the mid-1980s. With the exception of Barbados, all
the countries were more liberal in the second period and this period was associated with
higher capital and financial inflows. Indeed, the impact of higher capital and financial
inflows on economic performance was mixed. In the case of Trinidad and Tobago, this
period saw an increase in domestic investment, a rebound in economic growth, lower
inflation and a significant improvement of the public finances. In addition, there was
general improvement in the balance of payments accounts: the external current account
balance improved considerably and there were large inflows of capital, particularly direct
investment. In the latter period, this category almost doubled to US$812.8 million, most
likely for investment in the petroleum sector. In Jamaica and Guyana the stories are
different. Despite a substantial increase in direct investment during the 1990s, Jamaica
appeared to be negatively affected by the liberalisation process, as real output growth
declined and inflation almost doubled. However, there was a steady rise in domestic
investment. With regard to Guyana, the evidence points to external current account
deficits, worsening fiscal balances and a falloff in the average rate of domestic investment
and real economic growth. In Barbados, the undertaking of a more liberal trading
arrangement resulted in persistent current account deficits, since the late 1990s, which is
clearly evident in the latter period. The inflows of private capital during this period were
primarily for investment in tourism and utility production, while the Government
received inflows from privatisation and borrowings on the international capital market.
More recently, cross-border portfolio investment in CARICOM has increased
significantly and this has challenged reserve accumulation. In addition the average rate
of expansion in domestic investment and economic growth declined.
8

Table 1: Averages of Selected Macroeconomic and Balance of Payments Indicators
Barbados Trinidad and Tobago Jamaica Guyana1985-90 1991-00 2001-04 1985-90 1991-00 2001-02 1985-90 1991-00 2001-03 1985-90 1991-00 2001-04
Selected MacroeconomicIndicatorsReal GDP Growth 2.1 1.3 1.2 -2.2 4.6 7.7 3.4 1.4 1.6 3.6 5.0 1.1Inflation 3.8 2.8 1.4 9.4 6.0 4.3 15.3 26.0 9.51 n.a. 6.92 4.7Investment to GDP 0.17 0.16 0.16 0.17 0.21 0.19 0.23 0.27 0.29 0.30 0.31 0.183
Domestic Savings to GDP 0.19 0.17 0.14 0.22 0.30 0.27 0.19 0.19 0.11 0.20 0.17 0.063
Fiscal Balance to GDP -5.8 -1.6 -3.7 -4.6 -0.1 0.2 -0.9 1.6 -5.7 n.a. -4.22 -5.2
Balance of Payments
(US Millions)Current Account 16.3 2.2 -196.2 -59.0 18.2 246.2 -160.84 -192.5 -864.8 n.a. -112.74 -111.85
Capital and FinancialAccount
41.1 47.3 239.9 -173.3 83.2 359.4 162.8 307.9 946.6 n.a. 97.24 113.65
Of which: Direct Investment 5.2 13.6 20.5 56.8 495.0 812.8 37.1 228.8 605.2 n.a. 74.04 41.95
Portfolio Investment 3.5 0.3 0.4 0.0 -27.3 -138.2 0.0 2.8 348.4 n.a. 2.84 3.25
Other Investment 13.8 51.9 89.9 -230.2 -411.9 -467.2 145.2 188.2 827.5 n.a. -19.34 -21.35
Sources: The international Financial Statistics CD Rom, International Monetary FundVarious issues of the Annual Statistical Digest, central Bank of Barbados
Notes: 1data for the period 2001-04.2 data for the period 1995-2000.3 data for the period 2001-02.4 data for the period 1992-2000.5 data for the period 2001-03.n.a means not available
Figure 1: Trends in Investment and Savings To GDP Ratios
.00
.05
.10
.15
.20
.25
.30
.35
1960 1965 1970 1975 1980 1985 1990 1995 2000
GDI/GDP GDS/GDP GNS/GDP
Barbados
-.2
-.1
.0
.1
.2
.3
.4
.5
1960 1965 1970 1975 1980 1985 1990 1995 2000
GDI/GDP GDS/GDP GNS/GDP
Guyana
.1
.2
.3
.4
.5
1960 1965 1970 1975 1980 1985 1990 1995 2000
GDI/GDP GDS/GDP GNS/GDP
Jamaica
.08
.12
.16
.20
.24
.28
.32
.36
1960 1965 1970 1975 1980 1985 1990 1995 2000
GDI/GDP GDS/GDP GNS/GDP
Trinidad and Tobago
11
3. Theoretical Approaches to the Determination of Private Capital Flows
According to Johnston and Ryan (1994), there are two main theoretical approaches to
explaining private capital flows: the portfolio balance approach, based on Branson’s
(1968) extension of the Markowitz-Tobin portfolio selection model, and the monetary
approach to the balance of payments, following Johnson (1971) and Kouri and Porter
(1974). The former focuses on the role of risk-adjusted returns, that is, the relative real
returns on domestic and foreign assets, as well as the change in wealth. The latter relies
on the role of monetary disequilibrium in explaining capital movements, that is, the
difference between the demand for money and the money supply in the domestic market.
As a result, variables that determine the demand for money and the supply of money
become relevant to influencing capital flows.
Fernandez-Arias and Montiel (1994) develop a useful analytical framework that brings
together aspects of these two types of approaches. They decompose the influence on
private capital flows into domestic and external factors. Suppose capital flows occur in
the form of transactions in various types of assets, indexed by s, where s = 1(s)n. The
domestic returns on asset s is decomposed into a “project” expected returns D, and a
“country creditworthiness” adjustment factor, C, which lies between zero and one. D
depends inversely on the vector F of net flows to projects of all types, while C is a
negative function of the end-of-period stocks of liabilities of all types, denoted
( )FSS += −1 . Voluntary capital flows (components of the vector F) are determined by the
arbitrage condition:
[ ] [ ] [ ]FSwWFScCFdD wsss _,,, 11 +=+ −− (1)
where Ws is the opportunity cost of funds of type s in the world economy, taken to depend
on S to reflect portfolio considerations for external creditors. The shift factors d, c and w
are associated with the domestic economic climate, country creditworthiness, and any
creditor country financial conditions relevant for developing country investment (for
example, financial returns and capital-market regulations). Specifically, d would include,

among other things, any variable that increase the expected rate of return and/or reduce
the perceived risk as in the portfolio balance approach mentioned above. In addition, it
would capture the removal of capital controls and liberalisation of restrictions on foreign
direct investment. c would depend on some current measure of available resources like
wealth in the portfolio balance approach as well on foreign returns. Finally, w would
include factors like foreign interest rates and/or recession abroad.
Equation 1 defines F implicitly, hence capital flows will be determined by d, c, w and S-1,
that is, by domestic factors operating both at the project and country levels, as well as
factors pertaining to the external environment. The component vector F, capital flows,
are assumed to be increasing in d and c, but decreasing in w and S-1.
4. A Review of the Empirical Evidence of Capital Account Liberalisation(Controls) on Private Capital Flows
The macroeconometric literature on the impact of capital account liberalisation has
focused on economic growth with mixed results (for excellent surveys of this literature,
see Eichengreen (2001), Edison, Klein, Ricci and Sloek (2002), or Prasad, Rogoff, Wei
and Ayhan Kose (2003)). Also, a number of studies have drawn conclusions about
capital mobility from examining economic variables, like domestic interest rates or
saving and investment (see Frankel, 1989). However, the literature on the direct impact
of capital controls on private capital flows has been scant.
The first study that has empirically examined directly the effect of capital controls on
private capital flows is Johnston and Ryan (1994). Using panel data from 52 developed
and developing countries for the period 1985-1992, they found that exchange controls
significantly alter the structure of industrial countries’ capital accounts, especially by
restricting outflows of recorded direct and portfolio investment. However, for developing
countries capital controls do not effectively prevent the outflows, and misinvoicing may
be used to circumvent the exchange control.
13
Since this panel data study, time series investigations have been done on countries in
Latin America, Asia as well as Europe. Soto (1997) and De Gregorio, Edwards and
Valdes (2000), using the Vector Autoregression (VAR) approach on monthly data to
analyse Chile’s unrenumerated revenue requirement on capital flows, found that the
composition of private capital flows tilted towards long-term maturities, with the tax on
capital movements discouraging short-term flows.
Valdes-Prieto and Soto (1998), employing a different methodology, a non-linear
specification, reached a similar conclusion that capital controls discouraged short-term
flows in Chile. Overall, these studies on Chile suggested that the reduction in short-term
flows were fully compensated by increases in long-term capital flows, resulting in
aggregate capital moving into Chile being unaltered by the controls.
In the case of Colombia, Cardenas and Berrera (1997) also found a relative inability of
controls to reduce the level of capital, and non-remunerated deposits success in inducing
a recomposition of foreign liabilities in favour of long-term maturities. Reinhart and
Smith (1996) results for a group of Asia, Eastern European and Latin America countries
are consistent with the proceeding findings. On the other hand, Buch and Hanschel
(1999) assessed the unremunerated reserve requirement in Slovenia for the period 1992 to
1998 and found that the unremunerated reserve requirement was ineffective in reducing
overall inflow of foreign capital.
Cardoso and Goldfajn (1998) study the case of Brazil, by accounting for the endogeneity
of capital controls (both on outflows and inflows) by considering a government that set
controls in response to capital inflows. They found that the government reacts strongly to
capital flows by increasing controls on inflows during booms and relaxing them during
times of distress. Using a VAR framework, they also showed that controls temporarily
alter the level and composition of capital flows within a six-month period, but have no
sustained effects in the long run.
Using a similar VAR approach to Cardoso and Goldfajn (1998), Goh (2005) found
similar results for Malaysia, that is, control policies that had temporary effects on capital
flows and controls that have reduced short term flows but to some extent may have
decreased private long term flows, namely, foreign direct investment.
4. Empirical Model, Methodology and Data
The model used in this study is very similar to that developed by Johnston and Ryan
(1994) as is defined as follows:
NC = α 0 + α 1 Y + α 2 i + α 3 GB + α 4 (i-φ ) + α 5 (i*-φ *) + α 6 c + ε (2)
The dependent variable NC is a measure of capital and c is an explanatory variable
representing the controls on capital movements. The remaining variables: Y, i, GB, (i-φ )
and (i*-φ *) are other factors influencing the movement in capital flows. The relative
returns on domestic (1-φ ) and foreign assets (1*-φ *), and the change in wealth-measured
by national income Y-are thought to be largely related to portfolio investment decisions.
In addition, the nominal interest rate, i, and the government balance, GB, which are
functions of the demand and supply of money, act as a measure of confidence to investors
and thus they too play a role in determining capital inflows. A priori, it is anticipated that
1α , 4α >0; 2α , 3α , 5α < 0. The error ε satisfies the classical least squares regression
properties.
Co-integration analysis is applied to derive estimates for the long run and short run.
Considering the small sample size of 25 observations and 6 explanatory variables the
Engle and Granger (1987) two step-procedure and the Vector Autoregressive (VEC)
method developed by Johansen (1988) and Johansen and Juselius (1990) are
contemplated but not pursued. Instead, the Autoregressive Distributed Lag (ADRL)
approach popularised by Pesaran and Pesaran (1997) and later by Pesaran et al. (2000) is
employed to conduct the empirical investigation. This methodology has several
15

advantages: (a) unlike the Engle and Granger two-step procedure and the Johansen and
Juselius VEC approach, the ARDL method does not require a priori knowledge of the
integration properties of the variables in order to examine the presence of cointegration;
(b) the ARDL-based estimates of the long-run coefficients are super consistent in small
sample sizes and the model takes sufficient lags to capture the data generating process in
a general-to-specific modeling framework; (c) a dynamic error correction (ECM) can be
derived from the ARDL model through a simple linear transformation, and; (d) the
ARDL approach avoids the problems encountered when using non-stationary time series
data.
After transformation of Equation 1, the ARDL error correction model takes the form:
∇ yt = α 0 + β ii
k
=∑
1
∇ −xkt i + δ ii
k
=∑
1zkt 1− +ut (3)
where yt is a nx1 vector of endogenous variables, xkt i− is a nxn vector containing the
exogenous variables, and zkt 1− is a nx1 vector comprising both endogenous and
exogenous variables. α 0 is a nx1 vector of constant terms, while β i and δ i are nxk
vectors of parameters containing information about the short and long-run, respectively.
ui is a kx1 vector of error terms. The first step of the ARDL model testing procedure is to
conduct a bound test for the presence of a long-run relationship among the variables.
This is done by carrying out a joint significance test on Equation 2, with the null
hypothesis of no cointegration ( H0 : δ i =0). The procedure is based on the F or Wald-
statistic, but in this case, since the F statistic has a non-standard distribution the
calculated F-statistic is compared to two sets of critical values computed by Pesaran et al.
(2001) for various significance levels and sample sizes. One set of critical values posits
that all variables are I (0) and the other assumes that all are I (1). If it is known that all
variables are I(0) acceptance or rejection of the null hypothesis depends on the lower
bound. Similarly, if all variables are I(1) the decision is made based on the upper bound.
However, if the calculated F-statistic lies between the lower and upper critical values, the
result is said to be inconclusive. The ARDL method estimates (m+1) k regressions in
order to obtain the optimal lag length for each variable, where m is the maximum number
of lags chosen by the user and k is the number of variables in the original equation
including the constant term. The most appropriate ARDL model is selected using a
model selection criterion like, Schwartz Bayesian (SBC). This completes stage one of the
ARDL procedure.
In stage two, if cointegration is detected the long-run coefficient estimates are derived
from the chosen ARDL model from stage 1, and transformed into an ECM of the form:
∇ yt = α 0 + β ii
k
=∑
1
∇ −xkt i + 1−tiεϕ + u t (4)
ε i . provides information about the speed of adjustment to long-run equilibrium. Finally,
various diagnostic tests are used to check the adequacy of the ARDL model. .
The model is estimated using annual data for Barbados, Guyana, Jamaica and Trinidad
and Tobago for the period 1979 to 2003. The capital flow variable (NC) is represented by
net private capital inflows and it is estimated by summing portfolio investment liabilities,
direct investments and other commercial bank investment liabilities. Capital controls (c)
are captured by a capital account liberalization index developed by Quinn (1997) and
extended by Greenidge (2005). The index is based on a coding system, which is applied
to information taken from the IMF’s annual publication on Exchange Arrangements and
Exchange Restrictions (AREAER). This publication contains detailed reports on each
member country’s exchange arrangement, administration of controls, prescription of
currency, regulations on import and import payments etc. To code the extent of a
country’s restrictions on capital flows, Quinn adopted a graduating scale (0,0.5, 1, 1.5 and
2) for each dimension of each restriction to create an additive measure of a country’s
overall financial openness. In each case receipts and payments are scored separately,
while a country’s ability to restrict exchange and capital flows under its international
agreements are also coded. The analyis results in an indicator for capital account
openness that ranges from 0 to 4. Thus, it provides information on the intensity of
controls and also covers controls on nonresidents as well as residents. Greenidge uses the
same procedure but his index is supplemented by additional information from the
respective central banks. His argument is that the IMF’s AREREA is updated annually
17
with information provided by the individual country’s central banks and in many cases
such information is sent in summary, but there is usually more detail and explanations
housed at the central banks. In addition, Greenidge modifies Quinn’s coding rules to
better reflect practices within the Caribbean region. The real domestic interest rate (i-φ )
and the real foreign interest rate (i*-φ *) for each country is derived by subtracting the
annual inflation rate (φ ) from the average discount rate on treasury bills. The U.S.
treasury bill and inflation rates are used to represent the foreign domestic interest rate (i*)
and the foreign inflation rate (φ *). The REER for Barbados and Jamaica is sourced from
Moore and Skeete (2003) and is defined as a consumer price index of a country’s main
trading partners relative to that of the domestic currency.
Data for the Government or fiscal balance (GB) and real GDP (Y) were taken from the
IMF’s International Financial Statistics September 2005 CD ROM. The treasury-bill
discount rates, the consumer price indices and the REER for Guyana and Trinidad and
Tobago are extracted from this same database. In some cases data for Y, i and GB were
also gathered from the Barbados Annual Statistical Digest, the Central Bank of Guyana
Statistical Bulletin as well as the Central Bank of Guyana annual report. Most of the data
for the GB of Trinidad and Tobago was obtained from their central bank’s website.
5. Preliminary Results
The empirical results are computed using the Microfit version 4.0 econometric software
developed by Pesaran and Pesaran (1997). The ARDL estimation procedure discussed
previously is performed on Equation 1 using data for the four Caribbean countries. To
determine the optimal lag structure for each model the SBC is chosen and a maximum lag
length of 1 is assumed due to the small sample size. According to the statistic, the
selected ARDL models for Barbados, Guyana, Jamaica and Trinidad and Tobago are
ARDL1. (0,0,0,0,0,0), ARDL2.(1,0,0,1,0,0,0) ARDL3.(1,1,0,0,0,0,0,0) and ARDL4.
(0,0,0,0,0,0,0). However these models appear to be misspecified judging by the rejection
of the Pesaran co-integration F- statistics and the exploding error correcting terms (results
available from authors). Attempts to correct this misspecification by changing regressors,
lag structures, sample periods, model selection criteria and even using the alternative
Engle – Granger two step co-integration methodology proved futile. The only
consolation is that most of the estimated long run coefficients have the a priori signs (see
Tables A1-A4 in the Appendix). For all countries, except Jamaica, the coefficient on the
variable of interest, that is, the capital liberalisation index, c, is positive, suggesting that
liberalisation in these three countries would lead (in the case of Barbados) and have led
(in the case of Trinidad and Tobago and Guyana) to an increase in total private capital
flows. For the case of Jamaica, the model implies that the movement towards
liberalisation has reduced that country’s private capital inflows. These results are in
harmony with the stylised facts given in Section 2 above.
In summary, from a statistical point a view the capital liberalisation index is not
significant to private capital inflows and this may be due, among other things, to the lack
of variability in the capital liberalisation index and the possibility that capital
liberalisation may be working indirectly through the real exchange rate and/or the real
interest rate differential. From an economic point of view, the sign indicate that for all
countries, except Jamaica, private capital flows were associated with capital account
liberalisation.
The next hypothesis to be tested is whether private capital flows complement or substitute
for private investment, that is, does private capital flows lead to investment booms? To
examine this issue a modification of the investment model derived by Acosta and Loza
(2004) is used. The same ARDL cointegration approach described in the Section 4 and
applied in Section 5 is utilized to estimate this model for Barbados and Guyana only,
mainly due to the unavailability of data for the other two countries. The model is defined
as follows:
tμtprivcaptgdptcredittextdebtctprivinv +++++= 4321 αααα
where privinv is private investment, extdebt is external debt, credit is private sector credit,
gdp is gross domestic product at market prices and privcap is private capital inflows. The
19

a priori expectations are 0;0,, 14321 <> αααα and the data is sourced from the IMF’s
International Financial Statistics September 2005 CD ROM, the Barbados Annual
Statistical Digest 2004 and the Central Bank of Guyana Annual Report 2004.
To maximise degrees of freedom a maximum lag length of one is set. The SBC selects
the ARDL model (1,0,0,0) for Barbados and (1,0,1,1,1) for Guyana. These investment
models appear to be better specified than the capital flows equations above with co-
integration being accepted by the Pesaran co-integration F- statistics and the negative and
non-exploding error correcting terms. Also the diagnostic tests reveals that there is no
evidence of significant serial correlation, heteroscedasticity, non-normality or parameter
instability. The long run coefficients are presented in Table A5 in the Appendix. For
Guyana, most of the variables are significant and of reasonable sign. The variable of
interest, privcap, implies a complementary relationship with private domestic investment,
that is, an increase in capital inflows generates higher levels of private investment.
In the case of Barbados, despite acceptable diagnostics and reasonable signs on most of
the right hand side variables, all of the regressors are statistically insignificant (Table A6
in the Appendix). However, like Guyana, private capital inflows complement private
investment.
6. Conclusion
This paper examines the impact of capital account liberalisation on private capital inflows
in the Caribbean, using data for Barbados, Guyana, Jamaica and Trinidad and Tobago. It
also investigates the extent to which these inflows have translated into increased private
sector investment.
Looking at the stylised facts on these Caribbean countries there is a clear upward shift in
capital flows after capital liberalisation and a consequent rise in investment levels.
However, the empirical model does not support a significant statistical relationship
between private capital flows and capital liberalization, although it gives credence to the

general positive direction of these two variables. It appears that the model suffers from
misspecification errors, probably due to the sample size and the construction of the data,
notably the capital liberalisation index, which may have too little variation to be useful
for regression analysis.
However, on the second hypothesis there seems to be some evidence to support the facts
observed in the data that private capital flows complements private investment. Guyana
gives a telling example in this situation.
In summary, it could be argued that private capital flows in the Caribbean are on the rise
but it is not certain whether this is due to capital liberalisation forces. However, it seems
that the expansion in private capital inflows could be a significant catalyst for investment
booms in the region.
21
References
Acosta, Pablo and Andres Loza, 2004, “Short and Long Run Dterminants of PrivateInvestment in Argentina, Mimeo, University of Illinois at Urbana-Champaign
Buch, C. and Hanschel, E. (1999) The Effectiveness of Capital Controls – The Case ofSlovenia, Keil Working Paper No. 933.
Branson , W. (1968) Financial Capital Flows in the U.S. Balance of PaymentsAmsterdam: North-Holland Publishing Co.
Cárdenas, Mauricio and Felipe Barrera (1997), "On the Effectiveness ofCapital Controls: The Experience of Colombia During the 1990s", Journalof Development Economics, vol. 54.
Cardoso, E. and Goldfajn, I. (1997) Capital Flows to Brazil: The Endogeneity of CapitalControls, IFM Working Paper, International Monetary Fund, Washington, D.C.
De Gregorio, José, Sebastian Edwards, and Rodrigo Valdés, “Controls on CapitalInflows: Do they Work?” Journal of Development Economics, Vol. 3 No. 1,2000, 59-83.
Engle, R. and Granger, C. (1987) “Co-integration and Error Correction: Representation,Estimation and Testing”, Econometrica, 55,(2):251-257.
Edison, Hali, Michael Klein, Licca Ricci, and Torsten Slok, “Capital AccountLiberalization and Economic Performance: Survey and Synthesis”, InternationalMonetary Fund Working Paper 02/120, July 2002.
Eichengreen, Barry (2001). “Capital Account Liberalization: What Do Cross-CountryStudies Tell Us?” The World Bank Economic Review 15 (3): 341-65.
Fernandez-Arias, Eduardo, and Peter J. Montiel, 1995, The Surge in Capital Inflows toDeveloping Countries: Prospects and Policy Response, Policy Research WorkingPaper No. 1473, June (Washington: World Bank).
Forde, Penelope, 2003, Adjustment and Growth in Trinidad and Tobago in the Aftermathof First Generation Reforms: 1994-2000, Mimeo, Central Bank of Trinidad andTobago.
Frankel, Jeffrey 1989, “Quantifying International Capital Mobility in the 1980s”, NBERWorking Paper No. 2856.

Johnston, Barry and Chris Ryan, 1994. “The Impact of Controls on Capital Movementson the Private Capital Accounts of Countries’ Balance of Payments: EmpiricalEstimates and Policy Implications”, IMF working Paper, WP/94/78.
Johnson, H. G., 1971, “The Monetary Approach to the Balance of Payments Theory”,Unpublished monograph
Johansen,S. (1988), "Statistical Analysis of Cointegrating Vectors", Journal of EconomicDynamics and Control 12, 231-254
Johansen,S. and K.Juselius (1990), "Maximum Likelihood Estimation and Inference onCointegration, with Applications to the Demand for Money", Oxford Bulletin ofEconomics and Statistics 52, 169-210
Mathieson, Donald and Rojas-Suarez, Liliana, 1993. “Liberalisation of the CapitalAccount: Experiences and Issues”, International Monetary Fund, OccasionalPaper No. 103, March.
Kouri, J. K, and Penti, and M. Porter, 1974. “International Capital Flows and PortfolioEquilibrium”, Journal of Political Economy, Vol. 82, May/June.
Pesaran, M. Hansem and Bahram Pesaran, 1997. Working with Microfit 4.0: InterativeEconometric Analysis. Oxford, Oxford University Press.
Pesaran et al 2001. “Bounds Testing Approaches to the Analysis of Level Relationships.” Journal of Applied Econometrics, Vol. 16 No. 3: 289-326.
Prasad, Eswar, Kenneth Rogoff, Shang-Jin Wei, and M. Ayhan Kose (2003). “Effects ofFinancial Globalisation on Developing Countries: Some Empirical Evidence.”International Monetary Fund Occasional Paper #220.
Reinhart, Carmen and Todd smith, “Temporary Controls on Capital Inflows”, Journal ofInternational Economics, Vol. 57 No. 2, December 2002, 327-351.
Soto, M. (1997) Controles a los Movimientos de Capital: Evidence Empirica del CasoChileno, Mineo, Banco Central de Chile.
23
Appendix.
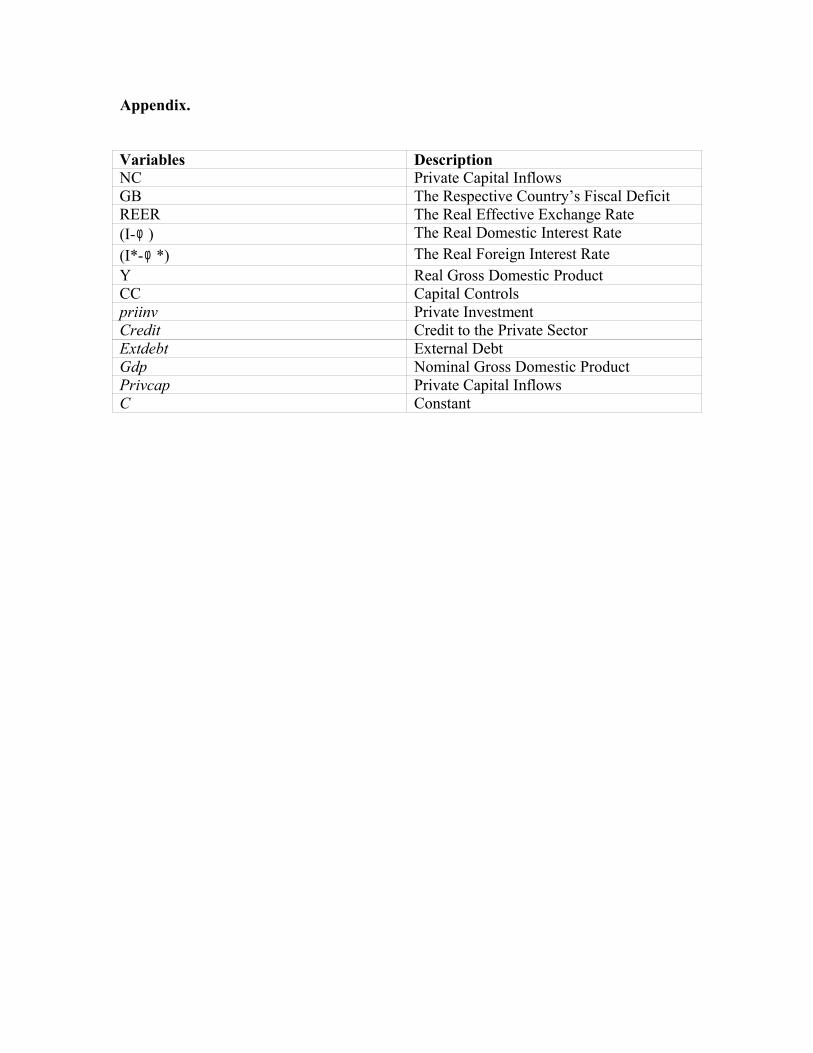
Variables DescriptionNC Private Capital InflowsGB The Respective Country’s Fiscal DeficitREER The Real Effective Exchange Rate(I-φ ) The Real Domestic Interest Rate(I*-φ *) The Real Foreign Interest RateY Real Gross Domestic ProductCC Capital Controlspriinv Private InvestmentCredit Credit to the Private SectorExtdebt External DebtGdp Nominal Gross Domestic ProductPrivcap Private Capital InflowsC Constant

Long Run Estimates For Selected ARDL ModelsDependent Variable-NC
Table A1.
ARDL Model (0,0,0,0,0,0,0)
Note: * indicates significance at the 5% level.
Table A2.
ARDL Model (1,0,0,1,0,0,0)GuyanaRegressors Coefficient Standard Error T-StatisticGB -0.7824000 0.4017000 -1.9475REER 0.0085377 0.0081608 1.0462(I-φ ) 0.22725 0.32660 0.69579(I*-φ *) 1.1651 0.69618 1.6736Y 0.0017599 0.0037855 0.46490CC 0.04636 0.079091 0.58712C -25.4765 17.1486 -1.4856Note: * indicates significance at the 5% level.
Table A3.
BarbadosRegressors Coefficient Standard Error T-StatisticGB 0.44146 0.16671 2.64808*REER -1.2054 0.53645 -2.2470(I-φ ) 1.4859 5.9295 0.25059(I*-φ *) 1.7061 6.2318 0.27377Y 4.7184 3.0275 1.5585CC 0.60709 2.3744 0.25568C -370.4912 258.6429 -1.4324
25
ARDL Model (1,1,0,0,0,0,0)Note: * indicates significance at the 5% level.
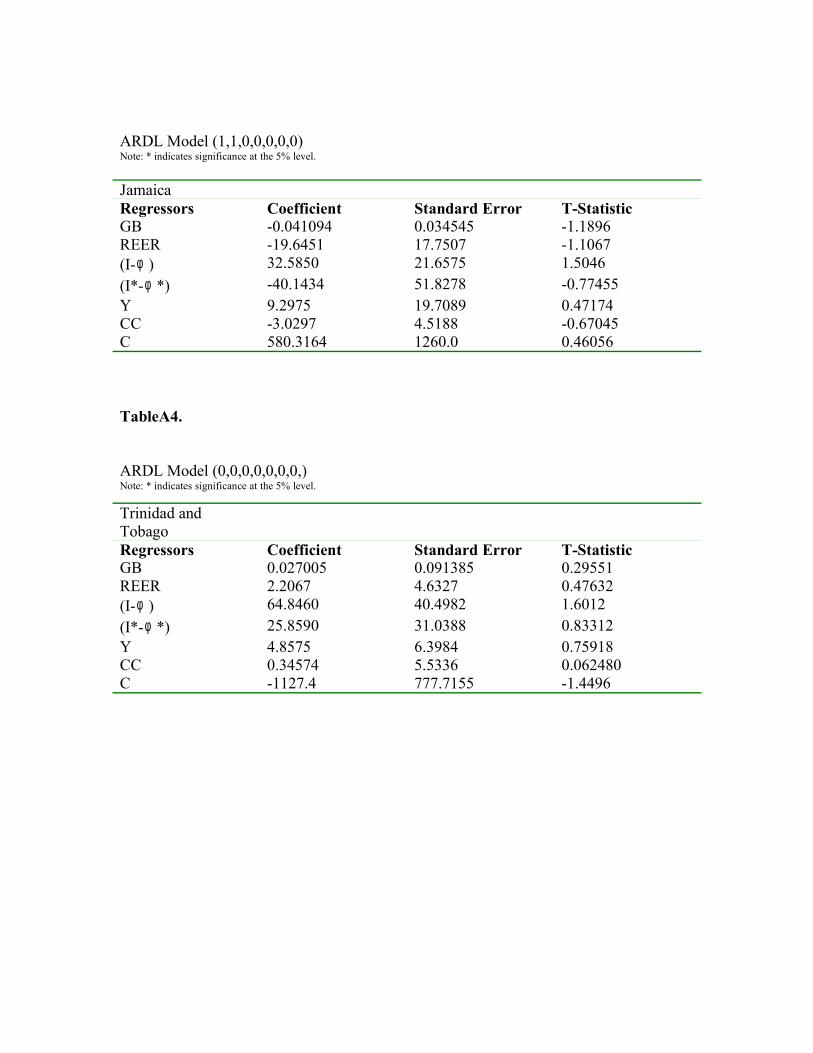
TableA4.
ARDL Model (0,0,0,0,0,0,0,)Note: * indicates significance at the 5% level.
JamaicaRegressors Coefficient Standard Error T-StatisticGB -0.041094 0.034545 -1.1896REER -19.6451 17.7507 -1.1067(I-φ ) 32.5850 21.6575 1.5046(I*-φ *) -40.1434 51.8278 -0.77455Y 9.2975 19.7089 0.47174CC -3.0297 4.5188 -0.67045C 580.3164 1260.0 0.46056
Trinidad andTobagoRegressors Coefficient Standard Error T-StatisticGB 0.027005 0.091385 0.29551REER 2.2067 4.6327 0.47632(I-φ ) 64.8460 40.4982 1.6012(I*-φ *) 25.8590 31.0388 0.83312Y 4.8575 6.3984 0.75918CC 0.34574 5.5336 0.062480C -1127.4 777.7155 -1.4496
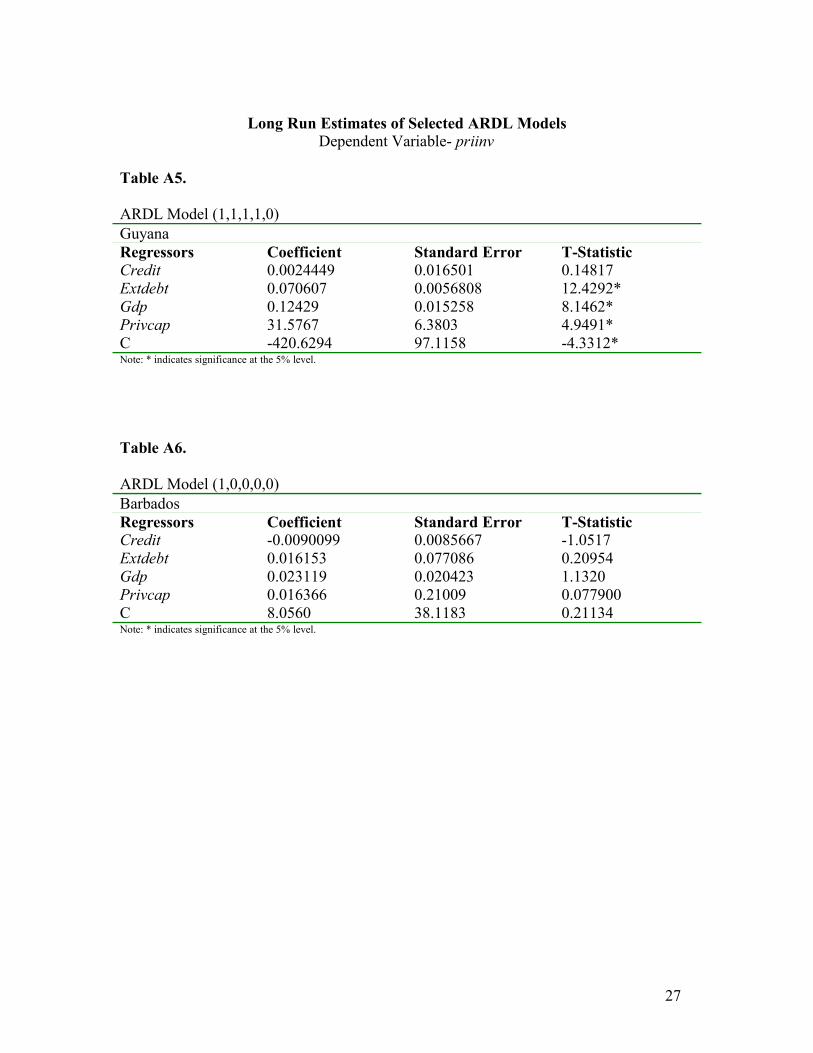
Long Run Estimates of Selected ARDL ModelsDependent Variable- priinv
Table A5.
ARDL Model (1,1,1,1,0)GuyanaRegressors Coefficient Standard Error T-StatisticCredit 0.0024449 0.016501 0.14817Extdebt 0.070607 0.0056808 12.4292*Gdp 0.12429 0.015258 8.1462*Privcap 31.5767 6.3803 4.9491*C -420.6294 97.1158 -4.3312*Note: * indicates significance at the 5% level.
Table A6.
ARDL Model (1,0,0,0,0)BarbadosRegressors Coefficient Standard Error T-StatisticCredit -0.0090099 0.0085667 -1.0517Extdebt 0.016153 0.077086 0.20954Gdp 0.023119 0.020423 1.1320Privcap 0.016366 0.21009 0.077900C 8.0560 38.1183 0.21134Note: * indicates significance at the 5% level.
27