Embed Size (px)
Citation preview
Does Country Regulation and Culture Explain International
Managers’ Metric Use in Marketing Mix Decisions?
Ofer Mintz
Imran S. Currim
July 2013
Ofer Mintz ([email protected]) is Assistant Professor of Marketing, E. J. Ourso College of
Business, Louisiana State University, Baton Rouge, LA 70803. Imran S. Currim
([email protected]) is Chancellor’s Professor at the Paul Merage School of Business, University
of California, Irvine, CA 92697. The authors would like to thank Mike Hanssens (UCLA),
Donna Hoffman (George Washington), John Hulland (Univ. of Georgia), and Ivan Jeliazkov,
Robin Keller, and Connie Pechmann (all of UCI) for their support and feedback throughout the
paper’s development and participants at the 2012 Theory + Practice in Marketing Conference at
the Harvard Business School and the 2013 Marketing Science Conference in Istanbul for their
comments. This research was supported by the Dean’s office of the Paul Merage School of
Business.

1
Does Country Regulation and Culture Explain International
Managers’ Metric Use in Marketing Mix Decisions?
Abstract
This paper extends Mintz and Currim’s (2013) conceptual framework on drivers of U.S.
managers’ metric use in marketing decisions by asking two unique questions. First, does country-level
regulation and culture, i.e., uncertainty avoidance, power distance, individualism, and long-term
orientation, explain differences in international managers’ metric use? Analysis of 1,704 marketing
decisions by 571 managers residing in 31 countries suggests managers in countries with increased
disclosure regulatory requirements, and greater uncertainty avoidant and long-term cultures, employ less
metrics. Second, are these country-level effects on metric use uniform across different managerial and
firm settings? Exploratory moderation analyses reveal marketing managers residing in less power distant
cultures employ less metrics in goods and market oriented firms lacking CMOs; while managers residing
in less individualistic cultures employ less metrics in B2C and goods oriented firms. Results allow
conditional expectation based assessments of managerial metric use for efficient targeting of metric
training and compensation programs.
Keywords: Metric Use; Marketing Decision Making; Culture; Survey; Multiple Regression

2
1. Introduction
There has been considerable concern about marketing’s decreasing influence in the firm (Rust et al.
2004), in the boardroom (Webster, Malter, and Ganesan 2005), and at the corporate strategy level
(McGovern et al. 2004). Marketing is increasingly viewed as a cost and not as an investment (Morgan and
Rego 2009). Strategically important aspects of marketing have moved to other functions in the
organization (Sheth and Sisodia 2005). Roles of financial managers have become more important than
marketing managers (Nath and Mahajan 2008), and the tenure of chief marketing officers only averages
22.9 months (Hyde, Landry, and Tipping 2004). One main reason identified for this decline in
marketing’s influence is its lack of accountability (Verhoef and Leeflang 2009). Further, global
competition, recession, and stock market pressures have only increased the demands for marketing
accountability (Lehmann and Reibstein 2006).
In response, marketing scholars have developed metrics for a variety of marketing mix decisions
(Ambler 2003, Farris et al. 2010, Lehmann and Reibstein 2006) and linked marketing mix efforts and
assets to financial metrics (see Srinivasan and Hanssens 2009 for a review). Despite valuable efforts,
there is no understanding of what drives managers residing in various countries to use metrics in their
marketing mix decisions. To the best of our knowledge, Mintz and Currim (2013) (henceforth MC) is the
only study to propose a conceptual model on drivers of managers’ metric use in marketing mix decisions1.
Their model focuses on U.S. managers and links managerial, firm, and environmental characteristics and
types of marketing mix decisions to metric use, but does not consider managers residing outside the U.S.
Consequently, no study, including MC (2013), has assessed (a) whether country level variables such as
regulation and culture drive international2 managers’ use of metrics and (b) whether the effects of
regulation and culture on managerial metric use are moderated by firm and managerial characteristics
(Figure 1).
1 The reader is referred to MC (2013) for a review of research on metrics for marketing mix decisions.
2 The words international and residing in various countries are used synonymously in this work.

3
Firms are increasingly expecting a larger proportion (on average a 20% increase) of their sales
from international markets (Moorman 2012), and there is a general expectation among top executives at
headquarters that all managers residing in different countries who make marketing decisions should
employ metrics regardless of the setting (country or firm) in which they operate, and the characteristics of
managers making marketing mix decisions (Farris et al. 2010). Hence, it is important for marketing
scholars and managers to ascertain whether country-level variables such as regulatory disclosure
requirements (La Porta, Lopez-de-Silanes, and Shleifer 2006) and culture (Hofstede, Hofstede, and
Minkov 2010) affect metric use and whether the effects of country-level variables on metric use are
moderated by firm and managerial characteristics. While there is evidence of the effects of regulatory
disclosure requirements and culture on general management decisions (Tung and van Witteloostuijn
2008), there is little if any evidence on whether regulatory and cultural variables explain international
managers’ metric use in marketing mix decisions.
Consequently, this study asks two unique questions, each offering theoretical contributions. First,
we ask whether five country-level variables, regulatory disclosure requirements, and cultural variables
such as uncertainty avoidance, power distance, individualism, and long-term orientation, explain
differences in metric use of managers residing in different countries. We propose a conceptual model and
hypotheses, based on (i) an interdisciplinary review of the marketing, finance, strategy, accounting,
organizational behavior, and international business literatures and (ii) interviews with 22 executives,
which incorporates the five aforementioned country-level variables and controls for the managerial, firm,
environmental, and type of marketing mix decision based variables advanced in MC (2013). We
empirically test the extended framework employing GLS-SUR estimation on 1,704 marketing mix
decisions as reported on by 571 managers in 31 countries. Results of the main effects proposed in our
conceptual model indicate that managers residing in countries with increased disclosure regulatory
requirements and greater uncertainty avoidant and long-term cultures, employ less metrics; while power
distance and individualism are not found to effect metric use. The model including the five country-level
regulatory disclosure and cultural variables outperforms its nested counterpart which excludes country-

4
level variables enabling a theoretical contribution to the understanding of metric use by managers
operating in different countries.
Second, we ask whether these country-level effects on metric use are uniform across managerial
and firm settings and conduct exploratory analyses to determine whether the effects of regulatory and
cultural variables on metric use are moderated by firm and managerial characteristics. We conduct
exploratory analyses rather than develop 25 additional hypotheses (5 country-level variables X 5
managerial and firm characteristics) since the literature on managerial metric use, although developing
recently, is currently sparse. Results of the exploratory moderation analyses reveal the importance of
power distance and individualism not found in the analysis of main effects. Specifically, we find
marketing managers residing in countries with lower power distant cultures employ less metrics in goods
and market oriented firms that lack chief marketing officers; while managers residing in countries with
lower individualistic cultures employ less metrics in B2C and goods oriented firms. Taken together these
new results clearly establish that metric use is not invariant to country-level variables such as regulation
and culture as has been assumed heretofore.
Our managerial contribution is that we are able to identify country based conditions such as
regulation and culture in which metric use by certain types of managers operating in particular types of
firms is likely to be lower (higher), which has not been accomplished heretofore. Such a conditional
assessment of managerial metric use provides basic understanding of why some managers residing in
certain countries and working in certain types of firms may employ fewer metrics than other managers in
different settings. Importantly, our model allows executives to compute the expected use of metrics by a
specific manager operating in a certain country and firm, when making a particular marketing mix
decision. If the actual metric use is lower (higher) than what is expected, such a difference enables a
diagnostic that the specific manager is found to be under (over) utilizing metrics, relative to the setting
(country, firm, type of manager, etc.) in which the manager operates. Such diagnostics can be (a) useful
for the efficient targeting of metric based training and compensation programs aimed at influencing
managerial metric use; and (b) important because the alternative option of expecting uniform metric use
5
by the firm’s managers operating in different countries myopically disregards differences due to
regulation, culture, and managerial characteristics shown to drive metric use.
Corporate initiatives created at headquarters and promoted worldwide run the risk of conflicting
with unreceptive national cultures. In particular, management practices that are favored in the U.S., such
as individual responsibility, merit-based rewards, and a short-term approach, are likely to be unwise in
some other countries that are culturally unlike the U.S., resulting in a mismatch between management
practices and national culture which is likely to reduce performance (Newman and Nollen 1996). In
contrast, the alignment between key characteristics of the external environment (national culture in this
case) and management practices (regarding metrics and rewards) can generate competitive advantage
(Burns and Stalker 1994, Powell 1992). Since metrics are about accountability, if metric use is found to
be culturally based, our theoretical and managerial contributions described above are important steps in
responding to the continuous calls from the Marketing Science Institute (e.g., see MSI Research Priorities
1998, 2000, 2002, 2004, 2006, 2008, 2012) and the Institute for the Study of Business Markets (e.g., see
ISBM B-To-B Marketing Trend Reports 2008, 2010, 2012) for research on metrics to improve
marketing’s accountability, particularly in a global context.
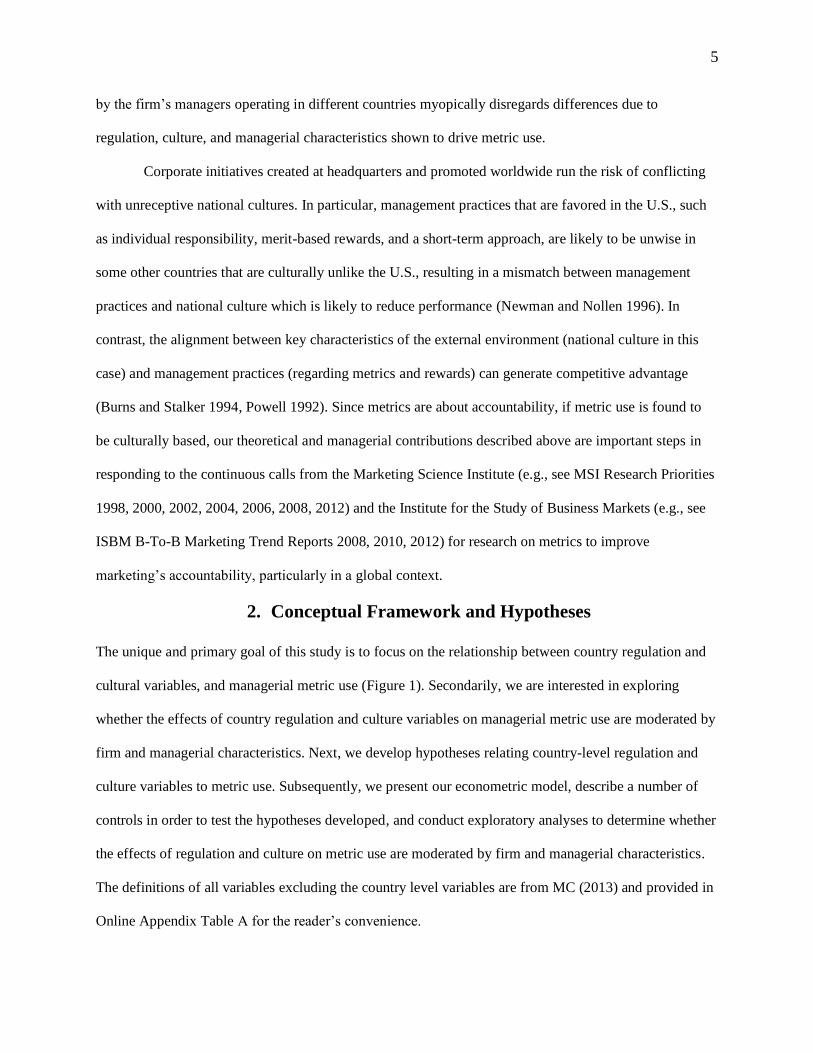
2. Conceptual Framework and Hypotheses
The unique and primary goal of this study is to focus on the relationship between country regulation and
cultural variables, and managerial metric use (Figure 1). Secondarily, we are interested in exploring
whether the effects of country regulation and culture variables on managerial metric use are moderated by
firm and managerial characteristics. Next, we develop hypotheses relating country-level regulation and
culture variables to metric use. Subsequently, we present our econometric model, describe a number of
controls in order to test the hypotheses developed, and conduct exploratory analyses to determine whether
the effects of regulation and culture on metric use are moderated by firm and managerial characteristics.
The definitions of all variables excluding the country level variables are from MC (2013) and provided in
Online Appendix Table A for the reader’s convenience.

6
2.1. Country Regulatory Disclosure Requirements
Country regulatory disclosure requirements are defined as laws mandating firms listed in a country’s
stock exchange to disclose particular information such as profitability, transactions, ownership structure,
and contracts irregular in the prospectus to investors (La Porta, Lopez-de-Silanes, and Shleifer 2006).
Regulatory disclosures are reflective of transparency, designed to keep owners (stockholders/ investors)
informed of the decisions and outcomes of managers to whom they delegate their duties, which can
impact managerial decision making.
Information asymmetry theory suggests that greater country regulatory disclosure requirements
leads firms to have more interactions with regulators and less interactions with investors and other agents,
with such reduced interactions leading to less transparency and less informed and involved investors and
agents (La Porta, Lopez-de-Silanes, and Shleifer 2006, Leuz, Nanda, and Wysocki 2003). Involved
investors, who often hold considerable long-term debt and equity in the firm, are able to obtain access to
undisclosed firm information and assert a role in firm decisions (Ball, Kothari, and Robin 2000).
Consequently, first, the value relevance, or the power of information required for regulatory security
disclosures, and the need for firms to publish financial statements to disclose firm information to involved
investors and agents is reduced (Ball, Kothari, and Robin 2000). Second, the need for managers to justify
their decisions to less involved investors and agents through use of additional metrics is decreased
because less involved investors believe that managers are complying with greater levels of regulatory
disclosure requirements (Ali and Hwang 2000). Hence, an increase in regulatory disclosure requirements
inhibits managers from focusing on, employing, and providing additional information and metrics to
investors and other agents of the firm, since managers are more likely focusing on employing, and
providing information and metrics to regulators. Consequently, we expect:
H1. Managers in countries with greater regulatory disclosure requirements will employ fewer
metrics in their marketing mix decisions.

7
2.2. Country Culture
Research on managerial decision making finds cultural variables such as uncertainty and ambiguity
norms, motivational techniques, and levels of group consensus and long-term orientation to impact
managerial decisions (e.g., Hewitt, Money, and Sharma 2006, Tan et al. 1998, Tse et al. 1988). Hence, we
expect country culture to also potentially impact managerial metric use in marketing decisions and
consider four of five cultural dimensions from Hofstede, Hofstede, and Minkov (2010); uncertainty
avoidance, power distance, individualism vs. collectivism, and short- vs. long-term orientation.3
2.2.1. Uncertainty Avoidance. Uncertainty avoidance is defined as a society's tolerance for
uncertainty and ambiguity. Managers residing in cultures that avoid uncertainty adopt strict codes of
behavior that are resistant to change from established patterns (Steenkamp, ter Hofstede, and Wedel
1999), and exhibit a greater herding mentality towards making decisions that align with the norm
(Deleersnyder et al. 2009). While managerial decision making in cultures that avoid uncertainty focuses
on risk avoidance and reduction (Roth 1995, Steenkamp, ter Hofstede, and Wedel 1999), we expect that
in cultures resistant to change, aligning with the norm in an organization is likely to be more powerful in
reducing uncertainty and risk than use of metrics. Since past managerial behavior in marketing is
characterized by less metric use (Lehmann and Reibstein 2006), resistance to change and aligning with
the norm implies continuing lower levels of metrics use. Further, managers operating in higher
uncertainty avoidant cultures and seeking to align with the norm may engage in less innovative marketing
mix approaches because of the risk assessed with such experimentation (Kanagaretnam, Lim, and Lobo
2011). Consequently, there may be less need for managers to employ metrics to demonstrate the value of
their innovative experiments. Therefore, we expect:
H2. Managers in countries with greater uncertainty avoidant cultures will employ fewer metrics
in their marketing mix decisions.
3 The fifth dimension, masculinity vs. femininity is excluded because of the absence of a clear rationale linking the
dimension to managerial metric use, hence we only include in our conceptual model the four cultural distance
dimensions that can be reasonably expected to affect metric use or ex post managerial behavior (Tung and Verbeke
2010).

8
2.2.2. Power Distance. Power distance is defined as the extent to which power in a society is
distributed in organizations and uneven power is accepted by less powerful members of organizations.
Greater power distance implies that final decisions are centralized and made by top executives; thus lower
level managers could face increasingly bureaucratic environments which require greater amounts of
approval from top executives necessitating greater justification of decisions (Hofstede, Hofstede, and
Minkov 2010). Metrics not only serve as decision aids, i.e., for considering, benchmarking, and
monitoring marketing mix decisions, but can also be employed to justify such decisions (Pauwels et al.
2009). Hence, we expect managers in greater power distance cultures to employ more metrics in order to
provide greater justification for marketing mix decisions. Consequently, we expect:
H3. Managers in countries with greater power distant cultures will employ more metrics in their
marketing mix decisions.
2.2.3. Individualism versus Collectivism. Individualism vs. collectivism is defined as the degree
to which people in a society engage in individualistic vs. cohesive group-based behavior. In contrast to
collectivist cultures, in individualistic cultures decision making is largely the result of independent
decision making processes which involves less group-based consensus (Roth 1995, Steenkamp, ter
Hofstede, and Wedel 1999). Managers in such cultures are more likely to be empowered to make
decisions independently because they are individually held responsible for the results of their decisions,
with such responsibility requiring managers to demonstrate the results of their decisions (Newman and
Nollen 1996) through metric use. In addition, managers in cultures which are more individualistic (vs.
collectivist) could also face greater objections to their decisions from other managers who are not
involved in the decision making process but compete for firm resources (Tan et al. 1998). Consequently,
managers making decisions in individualistic cultures will face more pressure to provide support and
justification for their decisions through metric use. In contrast, in collectivist cultures, managers will face
less pressure to provide support and justification because decisions are made based on consensus between
group members. Therefore, we expect:
H4. Managers in countries with greater individualistic cultures will employ more metrics in their
marketing mix decisions.

9
2.2.4. Short- versus Long-Term Orientation. Long-term orientation is defined as the extent to
which the society focuses on long- vs. short-term term results. In short-term oriented cultures, firms and
managers are most interested in the “bottom-line” in the current period (Deleersnyder et al. 2009), which
leads managers in such cultures to be constantly judged by control systems and metrics designed by their
firms to evaluate such bottom-line results (Hofstede, Hofstede, and Minkov 2010). In addition, because
the focus of firms and managers making marketing mix decisions in long-term oriented cultures is on the
“long-term” (Hofstede, Hofstede, and Minkov 2010) and long-term outcomes are more removed from the
current decision-making period, managers in such cultures could be less reliant on metrics observable in
the current period. Managers residing in longer-term oriented cultures are also less likely to pursue “quick
fixes” (Newman and Nollen 1996), and hence less likely be required to use metrics to demonstrate the
value of quick fixes. Consequently, we expect:
H5. Managers in countries with greater short-term orientation cultures will employ more metrics
in their marketing mix decisions.
3. Model
Following the conceptual framework in Figure 1, we begin the model discussion by describing the
notation of two sub-models. In the first sub-model (equation 1), which is specified to test the hypotheses
developed above, our main dependent variable is the total number of metrics employed in a specific
marketing mix decision4 and the main independent variables are the five country-level variables
hypothesized to influence total metric use. In addition, we include managerial, firm, environmental, and
marketing mix effort based control variables advanced in MC (2013) in order to determine the effect of
the main country-level variables on total metric use. Subsequently, we conduct exploratory analyses with
this model to ascertain whether the main effects of regulation and culture on metric use are moderated by
firm and managerial characteristics. In the second sub-model (equation 2), the dependent variable is the
4 In addition to the total number of metrics employed, later, we consider the type of metrics employed (e.g.,
marketing vs. financial).
10
perceived performance of the marketing mix decision5 based on scale items proposed by Jaworski and
Kohli (1993), Moorman and Rust (1999), and Verhoef and Leeflang (2009), and the independent variable
is total metrics employed when making the marketing mix decision6.
3.1. Primary Analyses Model Specification
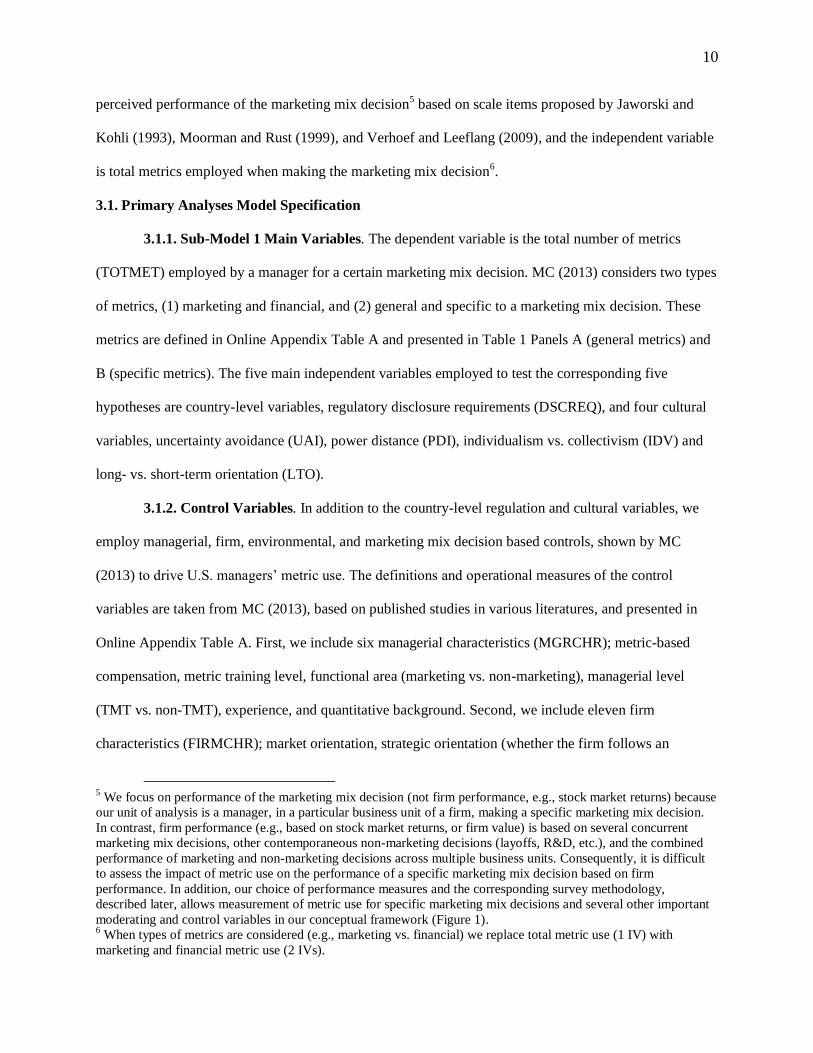
3.1.1. Sub-Model 1 Main Variables. The dependent variable is the total number of metrics
(TOTMET) employed by a manager for a certain marketing mix decision. MC (2013) considers two types
of metrics, (1) marketing and financial, and (2) general and specific to a marketing mix decision. These
metrics are defined in Online Appendix Table A and presented in Table 1 Panels A (general metrics) and
B (specific metrics). The five main independent variables employed to test the corresponding five
hypotheses are country-level variables, regulatory disclosure requirements (DSCREQ), and four cultural
variables, uncertainty avoidance (UAI), power distance (PDI), individualism vs. collectivism (IDV) and
long- vs. short-term orientation (LTO).
3.1.2. Control Variables. In addition to the country-level regulation and cultural variables, we
employ managerial, firm, environmental, and marketing mix decision based controls, shown by MC
(2013) to drive U.S. managers’ metric use. The definitions and operational measures of the control
variables are taken from MC (2013), based on published studies in various literatures, and presented in
Online Appendix Table A. First, we include six managerial characteristics (MGRCHR); metric-based
compensation, metric training level, functional area (marketing vs. non-marketing), managerial level
(TMT vs. non-TMT), experience, and quantitative background. Second, we include eleven firm
characteristics (FIRMCHR); market orientation, strategic orientation (whether the firm follows an
5 We focus on performance of the marketing mix decision (not firm performance, e.g., stock market returns) because
our unit of analysis is a manager, in a particular business unit of a firm, making a specific marketing mix decision.
In contrast, firm performance (e.g., based on stock market returns, or firm value) is based on several concurrent
marketing mix decisions, other contemporaneous non-marketing decisions (layoffs, R&D, etc.), and the combined
performance of marketing and non-marketing decisions across multiple business units. Consequently, it is difficult
to assess the impact of metric use on the performance of a specific marketing mix decision based on firm
performance. In addition, our choice of performance measures and the corresponding survey methodology,
described later, allows measurement of metric use for specific marketing mix decisions and several other important
moderating and control variables in our conceptual framework (Figure 1). 6 When types of metrics are considered (e.g., marketing vs. financial) we replace total metric use (1 IV) with
marketing and financial metric use (2 IVs).

11
analyzer, low-cost defender, or differentiated defender strategy, relative to a prospector strategy),
organizational involvement in the decision, and other firm characteristics such as firm size, type of
ownership (public vs. private), CMO presence, recent business performance, and B2C (vs. B2B) and
services (vs. goods) orientations. Since recent business performance is included as a firm characteristic,
endogeneity concerns between performance and metric use are controlled for. Third, we include four
environmental characteristics (ENVCHR); product life cycle (maturity/declining vs. introduction/growth),
industry concentration, and market growth and turbulence. Finally, we consider nine marketing mix
decisions (MKTMIX); traditional advertising, internet advertising, direct to consumer, social media, price
promotions, pricing, new product development, sales force, and distribution, all relative to public relations
(PR) / sponsorship decisions.
3.1.3. Sub-Model 2. We link the total number of metrics employed by a manager for a specific
marketing mix decision (TOTMET - the IV) to the perceived performance of that marketing mix decision
(PERFMKTMIX – the DV). Perceived performance of a marketing mix decision is defined based on a
firm’s stated marketing (customer satisfaction, loyalty, market share), financial (sales, profitability, ROI),
and overall outcomes, relative to the firm’s stated objectives and to similar prior activities or decisions
(Jaworski and Kohli 1993, Moorman and Rust 1999, Verhoef and Leeflang 2009).
3.1.4. Determining Whether a Manager is Underutilizing Metrics. An additional value of the
model is that an executive at company headquarters can compute the expected (or predicted) total metric
use (TOTMET) of a specific manager (MGRCHR) operating in a certain country (based on the country
scores for DSCREQ, UAI, PDI, IDV, and LTO), firm (based on FIRMCHR), and environment
(ENVCHR), when making a particular marketing mix decision (MKTMIX). The expected value can be
compared to the actual number of metrics employed by the specific manager in that country, firm,
environmental, and marketing mix decision setting to determine whether the manager is underutilizing
metrics, an important input into efficient managerial targeting and implementation of metric based
programs.
12
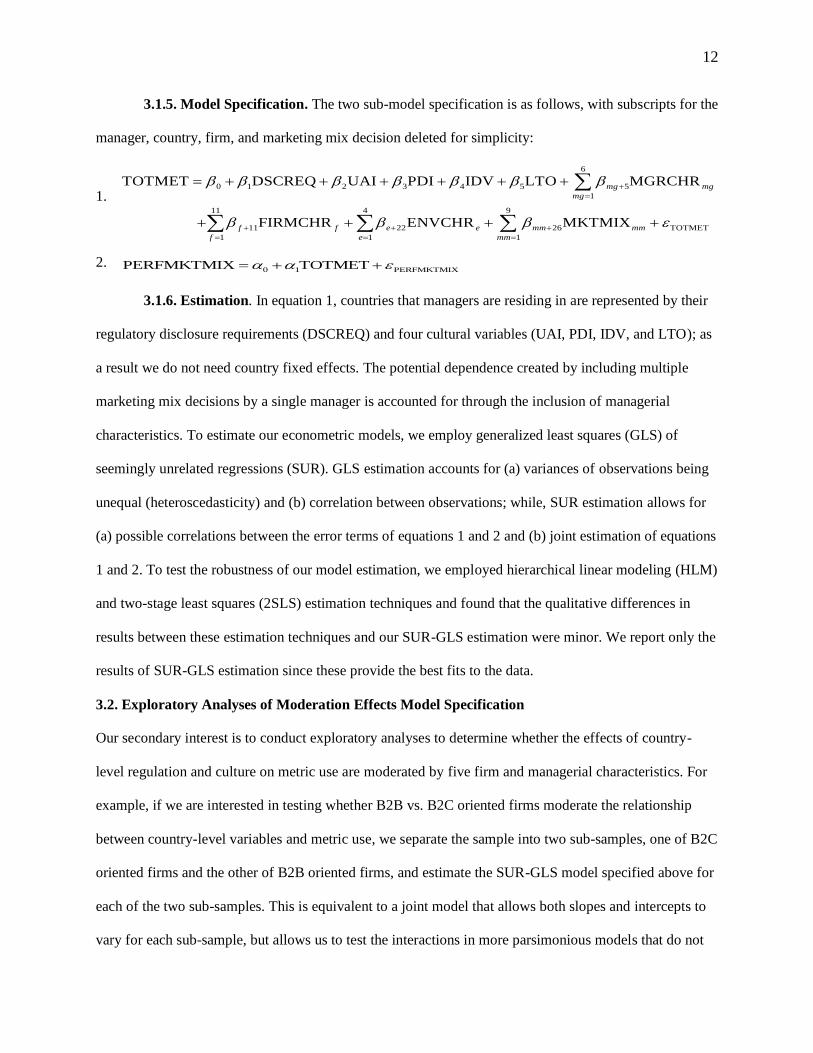
3.1.5. Model Specification. The two sub-model specification is as follows, with subscripts for the
manager, country, firm, and marketing mix decision deleted for simplicity:
1.
6
0 1 2 3 4 5 5
1
11 4 9
11 22 26 TOTMET
1 1 1
TOTMET DSCREQ UAI PDI IDV LTO MGRCHR
FIRMCHR ENVCHR MKTMIX
mg mg
mg
f f e e mm mm
f e mm
2. 0 1 PERFMKTMIXPERFMKTMIX TOTMET
3.1.6. Estimation. In equation 1, countries that managers are residing in are represented by their
regulatory disclosure requirements (DSCREQ) and four cultural variables (UAI, PDI, IDV, and LTO); as
a result we do not need country fixed effects. The potential dependence created by including multiple
marketing mix decisions by a single manager is accounted for through the inclusion of managerial
characteristics. To estimate our econometric models, we employ generalized least squares (GLS) of
seemingly unrelated regressions (SUR). GLS estimation accounts for (a) variances of observations being
unequal (heteroscedasticity) and (b) correlation between observations; while, SUR estimation allows for
(a) possible correlations between the error terms of equations 1 and 2 and (b) joint estimation of equations
1 and 2. To test the robustness of our model estimation, we employed hierarchical linear modeling (HLM)
and two-stage least squares (2SLS) estimation techniques and found that the qualitative differences in
results between these estimation techniques and our SUR-GLS estimation were minor. We report only the
results of SUR-GLS estimation since these provide the best fits to the data.
3.2. Exploratory Analyses of Moderation Effects Model Specification
Our secondary interest is to conduct exploratory analyses to determine whether the effects of country-
level regulation and culture on metric use are moderated by five firm and managerial characteristics. For
example, if we are interested in testing whether B2B vs. B2C oriented firms moderate the relationship
between country-level variables and metric use, we separate the sample into two sub-samples, one of B2C
oriented firms and the other of B2B oriented firms, and estimate the SUR-GLS model specified above for
each of the two sub-samples. This is equivalent to a joint model that allows both slopes and intercepts to
vary for each sub-sample, but allows us to test the interactions in more parsimonious models that do not

13
include 25 interaction terms (5 country level x 5 managerial and firm variables). Further, this approach
allows us to conduct exploratory testing of whether the main effects of country-level variables identified
(not identified) in model 1 are found in each sub-sample.
4. Empirical Test
4.1. Sampling
Our sampling scheme needs to satisfy three criteria. First, in order to establish the main effect of each of
the five country-level variables on metric use, we need to maximize the variation on each of the five
country-level variables. Data on our first main independent country-level variable, regulatory disclosure
requirements (DSCREQ) are published by La Porta, Lopez-de-Silanes, and Shleifer (2006) in the Journal
of Finance. Data on our second through fifth main independent country-level or cultural variables,
uncertainty avoidance (UAI), power distance (PDI), individualism vs. collectivism (IDV) and long- vs.
short-term orientation (LTO) are published in Hofstede, Hofstede, and Minkov's (2010) book on Cultures
and Organizations. These data are found in the first 5 columns of Table 2. Second, in order to conduct
exploratory testing of the potential moderation effects of firm and managerial characteristics, we need
good variation on firm and managerial characteristics. Third, in order to ensure that we control for other
characteristics such as environmental and marketing mix decision shown by MC (2013) to drive
marketing metric use, we need good variation on environmental and marketing mix characteristics.
One sampling option is to focus on the countries which have the highest and lowest scores on
each of the five country-level variables, resulting in 10 countries. However, we were concerned that
limiting the data collection to 10 countries may not (a) give us a sufficient sample size to test model 1
since it has a large number of independent variables and controls; and (b) achieve the second and third
objectives outlined above (Cavusgil and Das 1997). Consequently, we did not place any restrictions on
the countries from which we collected our sample observations (Franke and Richey 2010). In addition,
the 3 top and 3 bottom countries, or 6 countries, on each of the 5 country-level variables listed in Table 2
are quite different. Hence, not placing restrictions on the 30 additional countries from which we sample

14
has the potential of achieving the first in addition to the second and third criteria. Following the three
criteria, we collected a new sample of 132 managers residing in 30 additional countries reporting on 471
marketing mix decisions. This new sample was merged with the MC (2013) sample of 439 U.S. managers
reporting on 1,287 marketing mix decisions, resulting in a total sample of 571 managers reporting on
1,704 marketing mix decisions7. Our sample of managerial decisions per country is small. This would be
a problem if the goal of the study were to compare metric use by managers residing in different countries,
which is not the goal. In contrast, the goal is to establish the main effects of country-level regulatory and
cultural variables and the moderation effects of firm and managerial characteristics; consequently, we
need to maximize the variation of the country level, firm, managerial, and other control variables (the
three sampling criteria outlined above). Of course, if our sampling scheme is inadequate, we will not be
able to establish the main and moderation effects we seek to establish. It is relatively easy for subsequent
studies that seek to compare managers from certain countries (e.g., U.S. and India) to restrict their
sampling to the countries of interest.
4.2. Questionnaire Design and Sampling Frames
In order to pool the new and previous data sets, we employed the same questionnaire, incentives,
sampling frames, and reminder communications as MC (2013). Briefly, the manager begins the
questionnaire by identifying 1-10 particular marketing mix decisions from a list of 10 different types of
marketing mix decisions. Next, for each type of marketing mix decision identified, the manager indicate
which marketing and financial metrics they employed prior to or while making the decision from a list of
12 general marketing and 12 general financial metrics common to all marketing mix decisions, and 3
specific marketing and 3 specific financial metrics related to the particular marketing mix decision (see
Table 1 Panels A [general metrics] and B [specific metrics]). Managers could view the definition of each
included metric, indicate any other metric employed, or select a no metric employed option. This was
followed by 8 measures of marketing mix activity performance observed after the decision was made;
consequently, simultaneity or endogeneity concerns are minimized. Subsequently, managers indicated the
7 We run hypotheses testing without the U.S. sample and find similar results as the full sample.
15
level of organizational involvement for each activity, and provided information on managerial, firm and
environmental characteristics. To obtain subjects, we collaborated with several marketing professional
organizations such as Marketing Executives Group, Marketing Executives Network Group, Society of
Marketing Professional Services, and VP’s of Sales/Marketing, who posted announcements to their
respective members on LinkedIn with a request to participate.
4.3. Descriptive Statistics
Table 1 Panels A and B report the full set of metrics considered in the study and the reported percentage
use of each metric in countries that were above versus below the mean on each of the five country-level
variables. On average, awareness, target volume, and return on investment are general metrics employed
most often; however there are differences in how often awareness and target volume are employed across
settings which are above or below the mean on some of the county-level variables. Similarly, click though
rate, strength of channel relationships, and hits/page views are specific metrics employed most often for
specific marketing mix decisions; however there are differences in how often click through rate, strength
of channel relationships, and hits/page views are employed across settings which are above or below the
mean on some of the county-level variables. Panels A and B of Table 1 will be useful for academicians
and practitioners who wish to assess the types of metrics expected to be employed in marketing mix
decisions in settings which are higher or lower than the mean of each one of the five country-level
variables.
In Table 3, we present sample descriptive statistics on our dependent variables, TOTMET and
PERFMKTMIX, and independent control variables, MGRCHR, FIRMCHR, ENVCHR, and MKTMIX.
The sample consists of a good mix of regulatory disclosure requirements (mean = 0.93, s.d. = 0.16),
uncertainty avoidance (mean = 49.5, s.d. = 11.8), power distance (mean = 42.8, s.d. = 10.8), collectivism
vs. individualism (mean = 84.9, s.d. = 14.2), and short vs. long-term orientation (mean = 30.7, s.d., =
11.8). Consequently, the first sampling goal outlined above is achieved.
The sample also consists of a good mix of TMT vs. non-TMT managers (54% vs. 46%),
managers in prospector (32%), analyzer (25%), differentiated defender (32%) and low-cost defender

16
(11%) organizations, companies in introductory/growth (47%) vs. maturity/decline (53%) stages of the
product life cycle, and in concentrated (44%) vs. fragmented (56%) industries. The average number of
employees in a manager’s firm is 9,425 and the median is 120 employees, and more managers work in
privately held vs. publicly traded companies (77% vs. 23%) and in firms without vs. with a CMO (68%
vs. 32%), which indicates a good mix of large and small firms. The mix of privately held vs. publicly
traded companies is 77% vs. 23%, close but higher than the 2007 US Census of 67% vs. 33% and firms
without vs. with a CMO is 68% vs. 32%, also close to Nath and Mahajan (2008) modalities of 75% vs.
25%. The sample also consists of good variance on metric-based compensation (mean = 5.0, s.d.= 1.5
where 1= not important and 7 = extremely important), metric training (mean = 4.5, s.d.= 1.7 where 1=
much less than average and 7 = much more than average), B2B and B2C oriented companies (mean = 2.9,
s.d. = 2.2 where 1= mostly B2B, 7 = mostly B2C), and goods and service oriented firms (mean = 4.6, s.d.
= 2.4 where 1= mostly goods, 7 = mostly services). Consequently, the second and third goals for
sampling goals outlined above are achieved.
4.4. Testing for Collinearity, and Non-Response, Self-Selection, and Common Method Biases
Almost all, 1356 of 1369 (99.1%), of the pairwise correlations calculated in Appendix A are below 0.4
(Leeflang et al. 2000). However, as expected from the international literature, some correlations between
country-level variables are greater than 0.4. For these variables and the other variables comprising the 3
additional pairwise correlations greater than 0.4, variance inflation factor scores are calculated, all of
which are well below 6, indicating no multicollinearity problems for estimation of the models (Hair et al.
1998). Further, we do not detect non-response bias in our sample based on the Armstrong and Overton
(1977) test in which late and early respondents scores are compared on the included constructs (both new
and previous samples p>.05).
To help mitigate a priori common method and self-selection biases (i.e., where managers only
participate or will only report decisions in which they employ large amounts of metrics), we adapted the
Fredrickson and Mitchell (1984) instructions and stated in our cover letter posted online and in the
introduction to the questionnaire that we were interested in responses from managers who do and do not

17
employ metrics in their decisions and that their answers would remain anonymous (Chang, van
Witteloostuign and Eden 2010). Out of the 1,704 marketing mix decisions reported in the total sample,
115 (7%) decisions did not involve any metrics and 303 (18%) decisions involved 1-3 metrics, evidence
that managers were not reluctant to describe decisions in which no metrics or a very small number of
metrics were involved. Lastly, we do not find evidence of common-method bias based on Harman’s one-
factor test (Rubera, Ordanini and Griffith 2011) and Lindell and Whitney (2001) post hoc tests. We
employed White's (1980) test to check for heteroscedasticity and found that the null hypothesis on the
variance of residuals being homogenous cannot be rejected in any of our models, indicating no
heteroscedasticity.
5. Results
5.1. Primary Analyses
5.1.1. Hypothesis Testing. In Table 4, we present the SUR-GLS estimation results. We find
greater country regulatory disclosures requirements, uncertainty avoidance, and long-term orientation to
inhibit metric use, resulting in H1, H2, and H5 being supported (each p<.01); while power distance and
individualism do not drive metric use, resulting in H3 and H4 not being supported. A nested model-based
F test which compares the full model, i.e., country-level and control variables, to a model with only the
control variables is found to provide a statistically significant additional explanation of international
managers’ metric use (p<.05). We find similar results for both the hypotheses testing and the nested
model-based F test comparing the full model to the model with only the control variables when only
analyzing non-U.S. managers.
5.1.2. Controls. In Table 4, we also present the SUR-GLS estimation results for the control
variables. First, for managerial characteristics, we find managers to employ more metrics when they have
greater metric-based compensation and training (both p<.01). Second, for firm and environmental
characteristics, we find managers employ more metrics when their firms have greater market orientation,
follow an analyzer and low-cost defender strategic orientation (each relative to a prospector strategic

18
orientation), have greater recent business performance, are more B2C and goods oriented, and in more
(vs. less) concentrated industries (each p<.01). Third, for type of marketing mix activity, we find
managers employ more metrics when making internet advertising, direct to consumer, pricing, new
product development, and sales force decisions, each relative to making PR / sponsorship decisions (each
p<.01). Fourth, we find increased metric use to associate with improved marketing mix performance
(p<.01). Fifth, when a squared metric use term is added to sub-model 2, metric use is found to result in
decreasing returns to scale (p<.01), but still is positively associated with marketing mix performance in
the range of metric use reported by managers.
5.1.3. Determining Whether a Manager is Underutilizing Metrics. In Table 2, we provide an
example of how an executive at headquarters can employ our model to calculate an expectation of metric
use for a specific manager (e.g., belonging to the TMT, with an average metric-based compensation,
training, and quantitative background), operating in a certain country (as represented by the five country-
level regulatory and cultural variables), firm (e.g., public, prospector, with a CMO, average market
orientation, firm size, B2B [vs. B2C] and goods [vs. services] orientations, and organizational
involvement in marketing mix decisions), and environment (e.g., intro/growth PLC stage, and fragmented
industry), when making a particular marketing mix decision (e.g., PR/sponsorship). This expectation can
be compared to the actual use of metrics by the manager in that setting to determine whether s/he is under
(over) utilizing metrics. For example, suppose the headquarter-based executive is assessing metric use by
a manager in Finland, France, and the U.S. Table 2 indicates that the manager in Finland is expected to
employ the most metrics, while managers in France and the U.S. are expected to employ less metrics. If
the actual metric use by the managers in Finland and the U.S. are found to meet expectations but the
French manager is not found to meet the expectation, the headquarter-based executive could use such a
diagnostic to identify managers who are meeting or not meeting metric use expectations relative to other
managers operating in similar settings.

19
5.2. Exploratory Secondary Analyses
5.2.1. Type of Metrics. While the results of hypothesis testing above relate to the total metrics
employed, next, we investigate the effects of country-level regulatory and cultural variables on the types
of metrics employed, i.e., marketing and financial. We employ the following version of sub-models 1 and
2 wherein marketing and financial metrics take the place of total metrics.
3.
6
0 1 2 3 4 5 5
1
11 4 9
11 22 26 MKTMET
1 1 1
MKTMET DSCREQ UAI PDI IDV LTO MGRCHR
FIRMCHR ENVCHR MKTMIX
mg mg
mg
f f e e mm mm
f e mm
4.
6
0 1 2 3 4 5 5
1
11 4 9
11 22 26 FINMET
1 1 1
FINMET DSCREQ UAI PDI IDV LTO MGRCHR
FIRMCHR ENVCHR MKTMIX
mg mg
mg
f f e e mm mm
f e mm
5. 0 1 2 PERFMKTMIXPERFMKTMIX MKTMET FINMET '
The effect of (i) country regulatory disclosure requirements on metric use observed earlier for our
full sample (H1) is observed for marketing and financial metrics (each p<.05); (ii) uncertainty avoidance
observed earlier (H2) is observed for financial (p<.05) and marginally for marketing metrics (p<.1); and
(iii) long-term orientation observed earlier (H5) is observed for marketing and financial metric use (each
p<.05)8. We also find increased marketing and financial metric use to associate with improved marketing
mix performance (each p<.01).
5.2.2. Moderation Effects. Next, we explore whether the effects of country-level regulation and
culture on metric use are moderated by firm and managerial characteristics by splitting our original
sample into two sub-samples based on each of four firm and one managerial characteristics, resulting in
the following ten sub-samples; (1) B2B (n=1095) vs. B2C (n=609) oriented firms; (2) goods (n=606) vs.
8 In addition, we find firm characteristics to largely influence marketing (7 of 11) and financial (7 of 11) metric use,
type of marketing mix activity to largely influence financial (7 of 9) and only somewhat influence marketing (3 of 9)
metric use, and environmental (2 of 4 for marketing metrics; 1 of 4 for financial metrics) and managerial
characteristics (2 of 6 for marketing metrics; 3 of 6 for financial metrics) to somewhat influence marketing and
financial metric use. Unlike the full sample estimation, managers with greater quantitative backgrounds (p<.01), in
firms with CMO presence (p<.01), and making price promotions decisions in comparison to PR/sponsorship
decisions (p<.05) employ more financial metrics, while managers operating in introductory/growth life cycles also
employ more marketing metrics (p<.05).
20
services (n=1098) oriented firms; (3) above (n=852) vs. below (n=852) average market oriented firms; (4)
firms with (n=547) vs. without (n=1157) a CMO; and (5) marketing (n=922) vs. non-marketing (n=782)
managers.9 Our model and estimation technique is the same as originally specified in sub-models 1 and 2.
The results of the moderation analyses are summarized in Table 5. The effect of (i) country
regulatory disclosure requirements on metric use observed earlier for our full sample (H1) is similarly
observed in the samples of B2B (p<.05), services (p<.05), above average market oriented (p<.01) firms,
firms without a CMO (p<.01), and marketing managers (p<.01); (ii) uncertainty avoidance observed
earlier (H2) is similarly observed in the samples of services and above average market oriented firms,
firms without a CMO (each p<.01), and marketing managers; and (iii) long-term orientation observed
earlier (H5) is similarly observed in the samples of B2B (p<.01), B2C (p<.01), goods (p<.01), and above
(p<.01) and below (p<.05) average market oriented firms, firms without a CMO (p<.01), and marketing
(p<.01) and non-marketing (p<.05) managers. Interestingly, when we now conduct moderation analyses,
the analyses reveal that power distance significantly affects metric use (H3) for goods (p<.01) oriented
and above average market oriented (p<.05) firms, firms without a CMO (p<.01), and marketing managers
(p<.05); effects not observed for our full sample based analysis reported earlier. Consequently, H3 is now
supported for these relationships. And, the moderation analyses reveal that individualism significantly
affects metric use (H4) for B2C and goods oriented firms (both p<.01); effects not observed for our full
sample based analysis reported earlier. Consequently, H4 is now supported for B2C and goods oriented
firms.
In summary, the effects of country-level regulation (H1) and long-term oriented culture (H5) on
metric use are found to be moderated by all 5 firm and managerial variables considered; uncertainty
avoidant (H2) and power distant (H3) cultures on metric use are found to be moderated by all firm and
9 B2C vs. B2B and goods vs. services firms are split based on managers indicating the neutral, middle point on the
7-point scale asking them the extent to which their sales came from B2B or B2C and goods or services markets;
high vs. low market orientation is split at the median for our sample, and CMO presence and marketing managers
are discrete choices managers indicated in the questionnaire.

21
managerial characteristics assessed except B2B vs. B2C oriented firms; and individualism on metric use
(H4) is found to be moderated by B2B vs. B2C and goods vs. services oriented firms.
5.2.3. Additional Analyses. To conduct further exploratory analyses aimed at gaining insight into
the effects of country-level regulatory and cultural variables on metric use, we further decomposed our
dataset by two country economic and legal characteristics; (i) more vs. less economically developed
countries, since market research information and data to evaluate marketing actions are harder to obtain in
less developed countries (Cateora, Gilly, and Graham 2013), which may influence metric use; and (ii)
common vs. other types of legal systems, since legal traditions that influence corporate law and investor
protection (La Porta et al. 1997) may affect managerial metric use. For (i) we employed the International
Monetary Fund's (IMF) 2010 list of developed countries to classify the countries that managers reside.
We find the effects of country regulatory disclosure requirements (H1) and long-term orientation (H5) on
metric use observed earlier for our full sample are similarly observed for managers making marketing
decisions in developed countries. Interestingly, when we now only analyze managers residing in
developed countries, we also find individualism (H4) to significantly affect metric use (p<.01), which was
not observed in our full sample. Consequently, H4 is now supported when only considering managers that
reside in economically developed countries.
For (ii) we employed the Central Intelligence Agency's (CIA) 2012 World Factbook list of
countries to classify the countries that managers reside in as common or another type of legal system. The
English common law tradition, adopted by former and current English colonies including the US, is
shaped by the decisions of judges ruling on specific issues more than other legal traditions (Guler and
Guillén 2009). We find the effect of country regulatory disclosure requirements (H1) observed earlier for
our full sample is similarly observed for managers operating in common law countries. Interestingly,
when we now only analyze managers operating in common law countries, we also find power distance
(H3) (p<.01) and individualism (H4) (p<.05) to significantly affect metric use, which were not observed
in our full sample results reported earlier. Hence, H3 and H4 are now supported for managers residing in
common law countries.
22
6. Discussion
Prior research demonstrates that marketing enhances its stature within the firm when it increases the
accountability of its actions (O’Sullivan and Abela 2007, Verhoef and Leeflang 2009). Increased global
competition, regulations, and stock market pressures have only increased demands for greater marketing
accountability and metric use (Lehmann and Reibstein 2006). While progress has been made on
continuous calls from MSI and ISBM to encourage research on metrics and marketing decisions, no study
has investigated (i) whether metric use by managers residing in a variety of countries is driven by
country-level regulatory or cultural variables or (ii) whether the effects of country-level regulatory and
cultural variables on metric use are moderated by firm and managerial characteristics. The two questions
are important because the alternative expectation that managers residing in different countries should be
equally predisposed to employing metrics for marketing mix decisions may not be tenable. And if such an
expectation turns out, as demonstrated in this paper, corporate initiatives on metric use created at
headquarters and promoted uniformly worldwide run the risk of conflicting with unreceptive national
cultures (Newman and Nollen 1996). In contrast, the alignment between cultural aspects and management
practices regarding metrics and rewards can generate competitive advantage (Powell 1992).
Hence, this paper builds on related literature in three important ways, each offering theoretical,
empirical, and managerial contributions. First and foremost, the previous literature has focused on U.S.
managers’ metric use, while this paper focuses on metric use of managers residing in a variety of
countries. This difference in focus permits us to hypothesize and investigate whether five country-level
regulatory and cultural variables drive differences in metric use by managers operating in a variety of
countries. Analysis of a sample of 1,704 decisions made by 571 managers operating in 31 countries
reveals that increased country disclosure regulatory requirements (H1), uncertainty avoidance (H2), and
long-term orientation (H5) decrease total metric use, while power distance (H3) and individualism (H4)
are not associated with total metric use. Importantly, a model that incorporates these country-level
regulatory and cultural variables is found to be significantly better at explaining total metric use than a
23
restricted version of the model based on managerial, firm, environmental, and marketing mix decision
based controls from the related literature, enabling a theoretical contribution towards understanding
drivers of metric use by managers operating in various countries. Specifically, regulatory and cultural
theories are found to significantly explain managerial metric use in marketing mix decisions over and at
least equal to alternatives such as the decision maker perspective (managerial characteristics), resource
based theory of the firm (firm characteristics), contingency theory (environmental characteristics) and
value-chain theory (marketing mix characteristics). Similarly, we reach largely the same conclusions
when we investigate the types of metrics employed, i.e., marketing and financial metrics, with the full
sample of decisions (managers and countries).
Second, we explore whether the effects of country-level regulatory and cultural variables on total
metric use are moderated by firm and managerial characteristics, also not accomplished in the literature
heretofore. The results of the moderation analyses are important because (i) they reveal the effects of
power distance (H3) and individualism (H4) on metric use not revealed in the analysis of main effects
described in the earlier paragraph; (ii) they provide insight into the conditions under which power
distance and individualism affect total metric use; and (iii) they confirm the effects of country-level
regulation (H1) and cultural variables such as uncertainty avoidance (H2), and long-term orientation (H5)
revealed in the analysis of main effects, and more importantly, reveal the conditions under which the
effects of regulatory (H1), uncertainty avoidance (H2), and long term orientation (H5) on metric use are
more likely to hold.
For example, on (iii), we find that the effects of regulation, uncertainty avoidance, and long term
orientation are more prevalent for marketing (vs. non-marketing) managers, operating in firms with
higher (vs. lower) market orientation and without (vs. with) a CMO. One possibility is that when the firm
has a high market orientation, marketing decisions are ideologically-based (on a strong market
orientation), and as a result there may be less need for data-based metrics to determine the effectiveness
of marketing mix decisions. Another possibility is that when there is no CMO in the firm, there is less
pressure on managers to employ metrics to demonstrate the longer-term effects of marketing mix

24
decisions. And, for example, on (ii), we find that that the effects of power distance on metric use are more
likely for marketing managers in goods and market oriented firms without a CMO; while the effects of
individualism on metric use are more likely for managers operating in B2C and goods oriented firms. One
possibility is that the value of metrics is greater in goods oriented or B2C firms because customers are
further removed from the firm than in service or B2B oriented firms. The new support for power distance
(H3) and individualism (H4), in addition to the conditional results for all five hypotheses are important
empirical findings because they can lead to future theorizing about moderation effects that contributes to
a conditional theory of managerial metric use for marketing mix decisions.
Third, and finally, the proposed model permits an executive at headquarters to form expectations
of metric use by a specific manager (with certain managerial characteristics), operating in a certain
country (with certain regulatory and cultural characteristics), firm, and environment, while making a
particular marketing mix decision. If the manager’s actual use of metrics falls short of expectations, such
an individual-level diagnostic could prove useful in follow-up efforts regarding metric use which enable
managerial contributions. This permits the executive at headquarters to employ a cultural basis for
assessing metric use in contrast to assuming that metric use should be expected to be uniform across
managers operating in various countries.
This study has its limitations. For example, our main goal in this paper is to propose, test, and
establish the main effects of five country-level regulation and cultural variables on metric use, while our
analysis of the moderation of such effects is secondary and exploratory. Because the literature on metric
use is sparse and only recently developing, we do not propose hypotheses for each of the five moderator
variables explored for each of the five hypotheses developed and tested. However, we hope that future
research will employ our findings to develop such hypotheses followed by formal confirmatory testing of
interaction effects in sub-model 1. In addition, there are avenues for future research. For example, while
the primary focus of this work is to assess the effects of country-level variables on metric use and how
these effects may be moderated by firm and managerial characteristics, future research could focus
primarily on the relationship between metric use and performance of marketing mix decisions and how

25
that relationship may be moderated by firm and managerial characteristics. We hope that future research
will build on our efforts in some of these directions.

26
References
Ali, A., L.-S. Hwang. 2000. Country-specific factors related to financial reporting and the value relevance
of accounting data. J. Account. Res. 38(1) 1–21.
Ambler, T. 2003. Marketing and the bottom line: The marketing metrics to pump up cash flow 2nd ed.
London, FT Prentice Hall.
Armstrong, J. S., T. S. Overton. 1977. Estimating nonresponse bias in mail surveys. J. Mark. Res. 14(3)
396–402.
Ball, R., S. P. Kothari, A. Robin. 2000. The effect of international institutional factors on properties of
accounting earnings. J. Account. Econ. 29(1) 1–51.
Burns, T., G. M. Stalker. 1994. The management of innovation Revised edition. Oxford University Press,
USA.
Cateora, P. R., M. C. Gilly, J. L. Graham. 2013. International marketing 16th ed. Chicago, Illinois,
McGraw-Hill/Irwin.
Cavusgil, S. T., A. Das. 1997. Methodological issues in empirical cross-cultural research: A survey of the
management literature and a framework. Manag. Int. Rev. 37(1) 71–96.
Central Intelligence Agency. 2012. Central Intelligence Agency world factbook. Available at:
https://www.cia.gov/library/publications/the-world-factbook/ [Accessed April 2, 2012].
Chang, S.-J., A. van Witteloostuijn, L. Eden. 2010. From the editors: Common method variance in
international business research. J. Int. Bus. Stud. 41(2) 178–184.
Deleersnyder, B., M. G. Dekimpe, J.-B. E. M. Steenkamp, P. S. H. Leeflang. 2009. The role of national
culture in advertising’s sensitivity to business cycles: An investigation across continents. J. Mark.
Res. 46(5) 623–636.
Farris, P. W., N. T. Bendle, P. E. Pfeifer, D. J. Reibstein. 2010. Marketing metrics: The definitive guide to
measuring marketing performance 2nd ed. Upper Saddle River, New Jersey, Wharton School
Publishing.
Franke, G. R., R. G. Richey. 2010. Improving generalizations from multi-country comparisons in
international business research. J. Int. Bus. Stud. 41(8) 1275–1293.
Fredrickson, J., T. Mitchell. 1984. Strategic decision processes: Comprehensiveness and performance in
an industry with an unstable environment. Acad. Manage. J. 27(2) 399–423.
Guler, I., M. F. Guillén. 2009. Institutions and the internationalization of US venture capital firms. J. Int.
Bus. Stud. 41(2) 185–205.
Hair, J. F., R. E. Anderson, R. L. Tatham, W. C. Black. 1998. Multivariate data analysis. Upper Saddle
River, New Jersey, Prentice Hall.
Hewitt, K., R. B. Money, S. Sharma. 2006. National culture and industrial buyer-seller relationships in
the United States and Latin America. J. Acad. Mark. Sci. 34(3) 386–402.
27
Hofstede, G., G. J. Hofstede, M. Minkov. 2010. Cultures and organizations: Software of the mind 3rd ed.
New York, McGraw-Hill.
Hyde, P., E. Landry, A. Tipping. 2004. Making the perfect marketer: A study from the Association of
National Advertisers and Booz Allen Hamilton suggests five ways to make marketing more
relevant than ever. Strat. Bus. 37(Winter) 36–43.
International Monetary Fund. 2010. International Monetary Fund world economic outlook database.
World Econ. Outlook Database. Available at:
http://www.imf.org/external/pubs/ft/weo/2010/01/weodata/index.aspx [Accessed April 2, 2012].
Jaworski, B. J., A. K. Kohli. 1993. Market orientation: Antecedents and consequences. J. Mark. 57(3) 53–
70.
Kanagaretnam, K., C. Y. Lim, G. J. Lobo. 2011. Effects of national culture on earnings quality of banks.
J. Int. Bus. Stud. 42(6) 853–874.
La Porta, R., F. Lopez-De-Silanes, A. Shleifer. 2006. What works in securities laws? J. Finance 61(1) 1–
32.
La Porta, R., F. Lopez-De-Silanes, A. Shleifer, R. W. Vishny. 1997. Legal determinants of external
finance. J. Finance 52(3) 1131–1150.
Leeflang, P. S. H., D. R. Wittink, M. Wedel, P. A. Naert. 2000. Building models for marketing decisions.
Dordrecht, Kluwer Academic Publishers.
Lehmann, D. R., D. J. Reibstein. 2006. Marketing metrics and financial performance. Cambridge,
Massachusetts, Marketing Science Institute.
Leuz, C., D. Nanda, P. D. Wysocki. 2003. Earnings management and investor protection: An international
comparison. J. Financ. Econ. 69(3) 505–527.
Lindell, M. K., D. J. Whitney. 2001. Accounting for common method variance in cross-selectional
research designs. J. Appl. Psychol. 86(1) 114–121.
Marketing Science Institute. 1998, 2000, 2002, 2004, 2006, 2008, 2012. Research priorities: A guide to
MSI research programs and procedures. Cambridge, Massachusetts.
McGovern, G. J., D. Court, J. A. Quelch, B. Crawford. 2004. Bringing customers into the boardroom.
Harv. Bus. Rev. 82(11) 70–80.
Mintz, O., I. S. Currim. 2013. What drives managerial use of marketing and financial metrics and does
metric use affect performance of marketing-mix activities? J. Mark. 77(2) 17–40.
Moorman, C. 2012. The CMO Survey: Highlights and insights February 2012. Fuqua School of Business,
Duke University. Available at:
http://cmosurvey.org/files/2012/03/The_CMO_Survey_Highlights_and_Insights_Feb-
2012_Final.pdf.
Moorman, C., R. T. Rust. 1999. The role of marketing. J. Mark. 63(4) 180–197.
Morgan, N. A., L. L. Rego. 2009. Brand portfolio strategy and firm performance. J. Mark. 73(1) 59–74.

28
Nath, P., V. Mahajan. 2008. Chief marketing officers: A study of their presence in firms’ top management
teams. J. Mark. 72(1) 65–81.
Newman, K. L., S. D. Nollen. 1996. Culture and congruence: The fit between management practices and
national culture. J. Int. Bus. Stud. 27(4) 753–779.
O’Sullivan, D., A. V. Abela. 2007. Marketing performance measurement ability and firm performance. J.
Mark. 71(2) 79–93.
Pauwels, K., T. Ambler, B. H. Clark, P. LaPointe, D. J. Reibstein, B. Skiera, B. Wierenga, and T. Wiesel.
2009. Dashboards as a service: Why, what, how, and what research is needed? J. Serv. Res. 12(2)
175–189.
Powell, T. C. 1992. Organizational alignment as competitive advantage. Strat. Manag. J. 13(2) 119–134.
Roth, M. S. 1995. The effects of culture and socioeconomics on the performance of global brand image
strategies. J. Mark. Res. 32(2) 163–175.
Rubera, G., A. Ordanini, D. A. Griffith. 2011. Incorporating cultural values for understanding the
influence of perceived product creativity on intention to buy: An examination in Italy and the US.
J. Int. Bus. Stud. 42(4) 459–476.
Rust, R. T., T. Ambler, G. S. Carpenter, V. Kumar, R. K. Srivastava. 2004. Measuring marketing
productivity: Current knowledge and future directions. J. Mark. 68(4) 76–89.
Sheth, J. N., R. S. Sisodia. 2005. A dangerous divergence: Marketing and society. J. Public Policy Mark.
24(1) 160–162.
Srinivasan, S., D. M. Hanssens. 2009. Marketing and firm value: Metrics, methods, findings, and future
directions. J. Mark. Res. 46(3) 293–312.
Steenkamp, J.-B. E. M., F. ter Hofstede, M. Wedel. 1999. A cross-national investigation into the
individual and national cultural antecedents of consumer innovativeness. J. Mark. 63(2) 55–69.
Tan, B. C. Y., K. Wei, R. T. Watson, D. L. Clapper, E. R. Mclean. 1998. Computer-Mediated
communication and majority influence: Assessing the impact in an individualistic and a
collectivistic culture. Manag. Sci. 44(9) 1263–1278.
The Institute for the Study of Business Markets. 2008, 2010, 2012. B-to-B marketing trends. University
Park, Pennsylvania.
Tse, D. K., K. Lee, Ii. Vertinsky, D. A. Wehrung. 1988. Does culture matter? A cross-cultural study of
executives’ choice, decisiveness, and risk adjustment in international marketing. J. Mark. 52(4)
81–95.
Tung, R. L., A. Verbeke. 2010. Beyond Hofstede and GLOBE: Improving the quality of cross-cultural
research. J. Int. Bus. Stud. 41(8) 1259–1274.
Tung, R. L., A. van Witteloostuijn. 2008. From the editors: what makes a study sufficiently international?
J. Int. Bus. Stud. 39(2) 180–183.

29
Verhoef, P. C., P. S. H. Leeflang. 2009. Understanding the marketing department’s influence within the
firm. J. Mark. 73(2) 14–37.
Webster Jr., F. E., A. J. Malter, S. Ganesan. 2005. The decline and dispersion of marketing competence.
MIT Sloan Manag. Rev. 46(4) 35–43.
White, H. 1980. A heteroskedasticity-consistent covariance matrix estimator and a direct test for
heteroskedasticity. Econometrica 48(4) 817–838.

30
Figure 1. Conceptual Model
Marketing Mix
Performance
Managerial
Metric Use
Country-Level Variables Regulatory Disclosure
Requirements (-)
Culture
o Uncertainty Avoidance (-)
o Power Distance (+)
o Individualism (+)
o Long-Term Orientation (-)
Exploratory Analyses
Moderator Variables Managerial
Characteristics
Firm Characteristics
Control Variables Managerial Characteristics
Firm Characteristics
Environmental Characteristics
Type of Marketing Mix Decision
Mintz and Currim (2013)
This paper

31
Table 1. Panel A. Reported Percentage Use of General Metrics
Over
all
Low
DS
CR
EQ
Hig
h
DS
CR
EQ
Low
UA
I
Hig
h
UA
I
Low
PD
I
Hig
h
PD
I
Low
IDV
Hig
h
IDV
Low
LT
O
Hig
h
LT
O
Average Number of
Metrics Used 6.95 7.41 6.81 6.85 7.58 6.92 7.18 7.17 6.89 6.99 6.81
Average Number of
Mkt. Metrics Used 3.72 3.99 3.64 3.66 4.12 3.68 3.98 3.83 3.69 3.75 3.60
Average Number of
Fin. Metrics Used 3.23 3.42 3.17 3.19 3.46 3.23 3.20 3.34 3.20 3.23 3.21
Percent Using
No Metrics 7% 4% 8% 7% 3% 7% 5% 5% 7% 7% 5%
Marketing Metrics
Awareness
(Product or Brand) 41% 37% 43% 42% 37% 42% 36% 35% 43% 43% 34%
Consideration Set 4% 5% 4% 4% 4% 4% 5% 5% 4% 4% 5%
Likeability
(Product or Brand) 15% 14% 15% 15% 16% 15% 15% 13% 16% 16% 10%
Loyalty
(Product or Brand) 21% 22% 20% 21% 20% 21% 20% 22% 20% 21% 21%
Market Share
(Units or Dollars) 28% 33% 26% 26% 38% 27% 31% 31% 27% 27% 31%
Perceived Product
Quality 21% 21% 21% 20% 26% 21% 24% 20% 22% 22% 17%
Preference
(Product or Brand) 19% 23% 17% 17% 28% 18% 23% 21% 18% 19% 17%
Satisfaction
(Product or Brand) 21% 23% 20% 20% 25% 21% 22% 20% 21% 22% 18%
Share of Voice 10% 14% 9% 10% 12% 9% 14% 14% 9% 9% 12%
Share of Customer
Wallet 13% 15% 12% 12% 14% 12% 15% 14% 12% 12% 13%
Total Customers 36% 38% 35% 35% 40% 35% 41% 39% 35% 35% 38%
Willingness to
Recommend
(Product or Brand)
22% 22% 22% 22% 21% 23% 19% 18% 23% 24% 17%
Other Mkt. Metric 5% 4% 5% 5% 3% 5% 6% 4% 5% 5% 5%
Financial Metrics
CLV 12% 12% 11% 12% 10% 12% 11% 13% 11% 11% 12%
Customer Segment
Profitability 17% 17% 17% 17% 16% 18% 13% 15% 18% 17% 16%
EVA 4% 5% 4% 4% 5% 4% 4% 4% 4% 4% 4%
Marketing
Expenditures (%
specifically on Brand
Building Activities)
21% 18% 22% 21% 21% 22% 17% 16% 22% 23% 16%
NPV 8% 8% 8% 7% 11% 8% 8% 9% 8% 8% 6%
Net Profit 24% 23% 24% 23% 30% 24% 23% 23% 24% 26% 19%
ROI 38% 39% 38% 38% 39% 38% 39% 37% 39% 39% 36%
ROMI 21% 25% 20% 21% 24% 21% 27% 24% 21% 21% 23%
ROS 18% 22% 17% 16% 27% 17% 25% 23% 17% 17% 20%
Stock Prices /
Stock Returns 1% 2% 1% 1% 2% 1% 2% 2% 1% 1% 2%
Target Volume
(Units or Sales) 39% 44% 38% 39% 43% 39% 40% 44% 38% 39% 41%
Tobin’s q 0% 0% 0% 0% 0% 0% 0% 0% 0% 0% 0%
Other Fin. Metric 3% 3% 3% 3% 3% 3% 2% 3% 3% 3% 3%

32
Table 1. Panel B. Reported Percentage Use of Specific Metrics
Over
all
Low
DS
CR
EQ
Hig
h
DS
CR
EQ
Low
UA
I
Hig
h
UA
I
Low
PD
I
Hig
h
PD
I
Low
IDV
Hig
h
IDV
Low
LT
O
Hig
h
LT
O
Marketing Metrics
Channel Margins 9 60% 56% 61% 64% 33% 61% 50% 58% 60% 59% 62%
Conversion Rate 2,3 52% 59% 49% 50% 61% 52% 51% 57% 50% 49% 60%
Cost per Click 2 63% 57% 64% 63% 63% 64% 54% 58% 64% 63% 60%
Cost per Customer
Acquired 3 37% 39% 37% 39% 29% 38% 35% 39% 37% 35% 45%
CPM 1 32% 33% 31% 32% 27% 33% 25% 34% 31% 31% 32%
Cost per Exposure 4,10 37% 49% 33% 36% 48% 36% 48% 49% 34% 35% 45%
Expected Margin % 7 50% 38% 54% 53% 34% 53% 32% 40% 53% 53% 39%
IRR 1,2,5,7 8% 7% 10% 10% 8% 9% 12% 9% 10% 10% 7%
Lead Generation1,3,4,10 36% 47% 43% 45% 40% 45% 35% 44% 44% 43% 49%
Level of
Cannibalization 7 28% 27% 28% 28% 28% 29% 23% 28% 28% 29% 24%
Optimal Price 6 36% 48% 32% 34% 48% 33% 56% 45% 33% 35% 39%
Price Elasticity 6 40% 36% 42% 42% 29% 41% 31% 29% 44% 44% 25%
Promotional Sales /
Incremental Lift 5 58% 63% 56% 59% 50% 58% 56% 64% 55% 57% 60%
Redemption Rates 5 24% 22% 25% 24% 25% 23% 28% 20% 26% 26% 20%
Sales Force
Productivity 8 56% 63% 54% 56% 58% 55% 65% 64% 54% 54% 64%
Sales Funnel 8 58% 63% 56% 57% 63% 58% 61% 62% 57% 56% 64%
Sales per Store /
SKUS 9 26% 31% 24% 25% 33% 24% 38% 42% 22% 24% 31%
Sales Potential
Forecast 8 54% 59% 53% 56% 46% 55% 48% 54% 55% 54% 56%
Total Costs 4,10 27% 29% 26% 27% 24% 27% 22% 28% 26% 27% 26%
Total Inventory /
Total Distributors 9 40% 44% 39% 42% 33% 41% 38% 50% 38% 39% 46%
Unit Margin 6 49% 55% 47% 48% 52% 49% 50% 55% 47% 47% 57%
Financial Metrics
Attitude toward
Product / Brand 7 38% 44% 36% 37% 41% 37% 45% 45% 36% 36% 45%
Belief in New
Product Concept 7 44% 44% 44% 45% 38% 46% 27% 43% 44% 45% 42%
Click-through Rate 2 75% 72% 75% 76% 67% 78% 57% 68% 77% 75% 73%
Expected Annual
Growth Rate 7 34% 19% 39% 37% 17% 36% 18% 18% 38% 37% 18%
Hits/Page Views 2,4 65% 61% 66% 65% 60% 66% 57% 60% 66% 65% 61%
Impressions 1,2,5 39% 35% 40% 39% 38% 40% 33% 37% 39% 39% 37%
New Customer
Retention Rate 3,8 31% 46% 27% 29% 46% 30% 40% 44% 28% 27% 47%
# of Followers4 60% 58% 60% 61% 54% 60% 57% 58% 60% 61% 55%
# of Responses by
Campaign 3,8 51% 57% 49% 51% 54% 51% 50% 55% 50% 50% 56%
Out of Stock Percent9 23% 19% 24% 23% 22% 22% 25% 25% 22% 24% 15%
Price Premium 6 42% 58% 37% 37% 67% 39% 63% 58% 37% 39% 54%
PCV 9 19% 19% 20% 17% 33% 19% 25% 25% 18% 20% 15%
Reach 1,3,5,7,10 33% 35% 32% 33% 32% 32% 40% 37% 32% 33% 31%
Recall 1,10 17% 27% 14% 15% 35% 15% 33% 25% 15% 16% 20%
Relative Price 6 42% 45% 41% 40% 52% 39% 63% 45% 41% 42% 39%
Reservation Price 6 10% 9% 10% 9% 14% 9% 19% 10% 10% 10% 11%
Strength of Channel
Relationships 9 66% 75% 63% 64% 78% 65% 75% 67% 66% 65% 69%
Trial / Repeat
Volume (or Ratio) 5 26% 37% 22% 25% 30% 23% 39% 40% 22% 23% 36%
Volume of
Coverage4,10 30% 43% 26% 28% 42% 27% 46% 39% 27% 27% 39%
Specific metrics corresponds to the following marketing mix decisions: 1=Traditional Advertising, 2=Internet Advertising, 3=Direct to
Consumer, 4=Social Media, 5=Price Promotions, 6=Pricing, 7=New Product Development, 8=Sales Force, 9=Distribution, 10=PR/Sponsorship

33
Table 2. Country-level Data and Predictions of Managerial Metric Use*
Country DSCREQ UAI PDI IDV LTO Predicted
Metric
Use**
Argentina 0.50 86 49 46 20 6.17
Australia 0.75 51 36 90 21 6.37
Austria 0.25 70 11 55 60 5.34
Belgium 0.42 94 65 75 82 3.71
Brazil 0.25 76 69 38 44 6.99
Canada 0.92 48 39 80 36 4.61
Chile 0.58 86 63 23 31 5.08
Denmark 0.58 23 18 74 35 7.03
Finland 0.50 59 33 63 38 6.12
France 0.75 86 68 71 63 3.17
Germany 0.42 65 35 67 83 4.00
Greece 0.33 112 60 35 45 4.87
India 0.92 40 77 48 51 4.45
Ireland 0.67 35 28 70 24 6.81
Israel 0.67 81 13 54 38 3.75
Italy 0.67 75 50 76 61 3.84
Japan 0.75 92 54 46 88 0.91
Mexico 0.58 82 81 30 24 6.10
Netherlands 0.50 53 38 80 67 5.12
Pakistan 0.58 70 55 14 50 4.34
Philippines 0.83 44 94 32 27 6.25
Portugal 0.42 104 63 27 28 5.53
Slovenia 1.00 51 104 52 49 4.32
South Africa 0.83 49 49 65 34 5.20
Spain 0.50 86 57 51 48 4.89
Sweden 0.58 29 31 71 53 6.05
Switzerland 0.67 58 34 68 74 3.31
Thailand 0.92 64 64 20 32 3.88
Turkey 0.50 85 66 37 46 5.02
United Kingdom 0.83 35 35 89 51 4.85
United States 1.00 46 40 91 26 4.96 * DSCREQ is Disclosure Regulatory Requirements; UAI is Uncertainty Avoidance; PDI is Power Distance; IDV is
Individualism/Collectivism; LTO is Long-term/Short-term Orientation. **
Predicted total metric use is the expectation of total metric use for a specific manager (e.g., belonging to the TMT,
with an average metric based compensation, training, and quantitative background), operating in a certain country,
firm (e.g., public, prospector, with a CMO, average market orientation, firm size, B2B (vs. B2C) and goods (vs.
services) orientations, and organizational involvement in marketing mix decisions), environment (e.g., intro/growth
PLC stage, and fragmented industry), making a particular marketing mix decision (e.g., PR/Sponsorship).

34
Table 3. Sample Descriptive Statistics
Variable Mean / % St. Dev. / n
Total Metrics Used 6.95 4.61
Marketing mix Performance 4.94 1.20
Country Regulatory Disclosure Requirements 0.93 0.16
Country Culture
Uncertainty Avoidance 49.53 11.81
Power Distance 42.84 10.77
Individualism 84.94 14.20
Long-Term Orientation 30.71 11.80
Managerial Characteristics
Metric-Based Compensation 4.99 1.45
Metric Training Level 4.45 1.65
Functional Area (Marketing) 54% 922
Managerial Level (TMT) 54% 926
Managerial Experience 9.20 5.33
Quantitative Background 4.32 1.10
Firm Characteristics
Market Orientation 5.06 1.14
Prospectors 32% 540
Analyzers 25% 429
Low-Cost Defenders 11% 190
Differentiated Defenders 32% 545
Organizational Involvement 3.88 1.69
Firm Size (employees) 9425.11 (Median = 120)
Type of Ownership (Public) 23% 394
CMO Presence 32% 547
Recent Business Performance 5.32 1.31
B2C 2.94 2.23
Services 4.64 2.43
Environmental Characteristics
Product Life Cycle Stage (Mat./Dec.) 53% 897
Industry Concentration 44% 743
Market Growth 5.43 1.88
Market Turbulence 4.33 1.12
Marketing mix Activity
Traditional Advertising 10% 177
Internet Advertising 12% 198
Direct to Consumer 16% 279
Social Media 11% 191
Price Promotions 6% 139
Pricing 8% 197
New Product Development 11% 193
Sales Force 10% 169
Distribution 4% 62
PR / Sponsorships 12% 197
Number of Managers 571
Number of Marketing Decisions 1704

35
Table 4. SUR-GLS Estimation Results of Restricted and Full Estimation Variable/Estimation Restricted Full
Antecedents of Metric Use
Intercept -5.19*** 1.05
Country Regulatory Disclosure Requirements ----- -5.73***
Country Culture
Uncertainty Avoidance ----- -0.04***
Power Distance ----- 0.02
Individualism ----- 0.01
Long-Term Orientation ----- -0.05***
Managerial Characteristics
Metric-Based Compensation 0.70*** 0.68***
Metric Training Level 0.46*** 0.44***
Functional Area (Marketing) -0.16 -0.19
Managerial Level (TMT) -0.27 -0.40
Managerial Experience 0.03 0.04*
Quantitative Background 0.14 0.15
Firm Characteristics 1
Market Orientation 0.42*** 0.49***
Analyzers 1.21*** 1.28***
Low-Cost Defenders 1.39*** 1.60***
Differentiated Defenders 0.46* 0.31
Organizational Involvement 0.26*** 0.26***
Firm Size -0.02 -0.01
Type of Ownership (Public) 0.22 0.12
CMO Presence 0.42* 0.41*
Recent Business Performance 0.29*** 0.31***
B2C 0.18*** 0.15***
Services -0.26*** -0.26***
Environmental Characteristics
PLC Stage (Mat./Dec.) -0.21 -0.22
Industry Concentration 0.74*** 0.66***
Market Growth -0.07 -0.08
Market Turbulence 0.04 0.11
Marketing mix Activity 2
Traditional Advertising 0.75* 0.79*
Internet Advertising 1.85*** 1.85***
Direct to Consumer 1.66*** 1.66***
Social Media 0.48 0.41
Price Promotions 0.12 0.19
Pricing 1.84*** 1.83***
New Product Development 2.18*** 2.20***
Sales Force 1.67*** 1.76***
Distribution 0.78 0.70
Relationship between Metric Use and Marketing mix Activity Performance
Intercept 4.39*** 4.38***
Metric Use 0.08*** 0.08***
Model Diagnostics for SUR-GLS System
System Weighted R-Square 0.20 0.22
System Weighted DoF 3375 3370
System Weighted MSE 0.99 0.99
Nested (Rest’d.) Model F-Test F = 7.44 (p < .05)
NOTES, *p<.10; **p<.05, ***p<.01; 1 Analyzers, low-cost defenders, and differentiated defenders are compared to
prospectors. 2 All marketing mix activities are compared to PR/sponsorships.
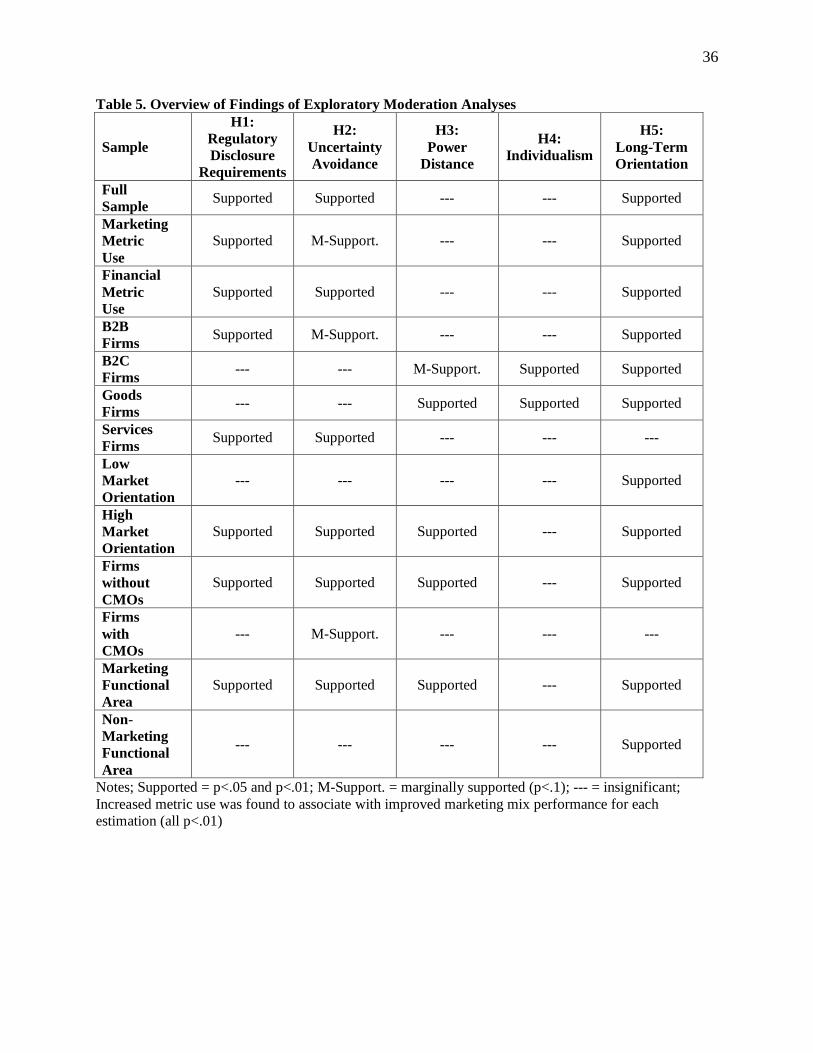
36
Table 5. Overview of Findings of Exploratory Moderation Analyses
Sample
H1:
Regulatory
Disclosure
Requirements
H2:
Uncertainty
Avoidance
H3:
Power
Distance
H4:
Individualism
H5:
Long-Term
Orientation
Full
Sample Supported Supported --- --- Supported
Marketing
Metric
Use
Supported M-Support. --- --- Supported
Financial
Metric
Use
Supported Supported --- --- Supported
B2B
Firms Supported M-Support. --- --- Supported
B2C
Firms --- --- M-Support. Supported Supported
Goods
Firms --- --- Supported Supported Supported
Services
Firms Supported Supported --- --- ---
Low
Market
Orientation
--- --- --- --- Supported
High
Market
Orientation
Supported Supported Supported --- Supported
Firms
without
CMOs
Supported Supported Supported --- Supported
Firms
with
CMOs
--- M-Support. --- --- ---
Marketing
Functional
Area
Supported Supported Supported --- Supported
Non-
Marketing
Functional
Area
--- --- --- --- Supported
Notes; Supported = p<.05 and p<.01; M-Support. = marginally supported (p<.1); --- = insignificant;
Increased metric use was found to associate with improved marketing mix performance for each
estimation (all p<.01)

37
Appendix A. Correlation Matrix
DS
CR
EQ
UA
I
PD
I
IDV
LT
O
Met
. C
om
p.
Met
. T
rain
.
Fun. A
rea
TM
T
Work
E
xp.
Quan
t.
Mrk
t. O
r.
Anal
yze
r
Low
-Cost
Dif
f. D
ef.
Org
. In
vol.
Fir
m S
ize
Ow
ner
.
CM
O
Rec
. B
us.
P
erf.
B2C
Ser
vic
es
PL
C
Sta
ge
Ind.
Conc.
Mrk
t.
Gro
wth
Mrk
t.
Turb
.
Tra
d.
Adv.
Int.
Ad
v.
D2C
Soc.
M
edia
Pri
ce
Pro
mo.
Pri
cing
NP
D
Sal
es
Forc
e
Dis
t.
Met
ric
Use
Per
form
-an
ce
DSCREQ 1
UAI -.74 1
PDI -.38 .56 1
IDV .74 -.64 -.73 1
LTO -.68 .56 .43 -.49 1
Met. Comp. -.11 .10 .13 -.10 .08 1
Met. Train. -.04 .01 .06 -.05 .01 .31 1
Fun. Area -.01 .04 .03 -.01 .00 -.06 -.01 1
TMT .12 -.08 -.11 .11 -.14 .10 .03 -.45 1
Work Exp. .09 -.05 -.08 .08 -.09 .08 -.01 -.28 .37 1
Quant. -.08 .09 .11 -.06 .04 .18 .35 -.06 .11 .02 1
Mrkt. Or. -.04 .09 .09 -.08 .04 .24 .16 -.05 .04 .08 .02 1
Analyzer -.05 .08 .05 -.06 .05 .08 .00 -.07 .08 .03 .15 .07 1
Low-Cost -.01 .05 .04 .03 .06 -.10 -.03 .03 -.15 -.03 .00 -.24 -.21 1
Diff. Def. .10 -.07 -.06 .09 -.12 -.12 -.09 .03 .02 .03 -.11 -.04 -.40 -.24 1
Org. Invol. -.08 .09 .09 -.10 .08 .26 .16 -.02 .08 .09 .09 .23 .09 -.09 -.09 1
Firm Size -.02 .03 .08 -.07 -.01 .02 .14 .29 -.24 -.12 .12 -.12 .02 -.05 .12 -.04 1
Owner. -.03 -.03 -.02 -.03 .03 .05 .15 .15 -.08 -.02 .10 -.13 .08 -.02 .01 .05 .63 1
CMO .01 .02 .01 .01 -.03 .03 .11 .13 -.08 -.10 .04 .30 .04 -.08 -.03 .02 .16 .01 1
Rec. Bus. Perf. -.08 .06 .11 -.08 .09 .06 .06 .07 .03 .09 .02 -.04 .09 -.03 -.03 .05 .26 .21 -.04 1
B2C -.06 .06 .05 -.05 -.02 .05 .02 .05 .01 .02 .05 .05 .01 .07 -.05 .06 .10 .01 -.03 .06 1
Services .01 -.01 -.03 .04 .00 -.13 -.07 .02 .04 .02 -.10 .10 .03 .06 .09 -.01 -.19 -.19 -.07 -.02 .02 1
PLC Stage .08 -.03 -.04 .07 -.09 -.11 -.01 .02 -.02 .16 .07 -.16 .06 .04 .19 -.09 .24 .15 -.09 .04 .05 -.01 1
Ind. Conc. -.01 -.04 -.01 .05 .01 .02 .06 .05 -.05 .01 .04 -.10 -.05 -.01 .00 -.05 .13 .13 .02 .07 -.05 -.19 -.02 1
Mrkt. Growth -.08 .03 .09 -.15 .08 .12 .05 .00 .01 -.15 .05 .06 -.03 -.02 -.13 .07 -.03 .02 .38 .01 -.06 -.16 -.31 .13 1
Mrkt. Turb. -.03 .03 -.06 -.01 .03 -.06 -.06 .07 -.02 -.03 -.12 -.07 -.11 .00 .06 -.02 .03 .05 -.02 .07 .04 .02 .02 .02 .01 1
Trad. Adv. .01 .00 .01 .01 .00 -.02 .01 .07 -.04 .00 .00 .00 .00 .03 .02 -.04 .04 -.03 .00 .01 .10 .01 .05 .00 -.07 .02 1
Int. Adv. .00 .01 .00 .01 -.01 -.02 -.02 .02 .01 -.03 .01 .00 .02 -.01 -.02 -.11 -.03 -.04 .03 -.01 .03 .02 -.02 -.02 .03 .02 -.12 1
D2C .01 -.01 .00 .01 -.01 -.01 -.03 .03 -.05 -.03 -.04 .02 -.02 .02 .01 -.01 -.02 -.03 -.03 -.04 .04 .09 -.01 -.05 -.05 .02 -.15 -.16 1
Soc. Media -.01 -.01 .01 -.02 .00 -.02 -.02 -.01 .02 -.02 -.02 .05 .00 -.02 -.02 -.04 -.11 -.11 .00 -.01 -.02 .09 -.05 -.03 -.02 .00 -.12 -.13 -.16 1
Price Promo. .00 .01 .00 -.01 .01 .03 .02 -.09 .00 .04 .02 -.03 -.01 -.01 -.01 .04 .03 .03 -.01 .02 -.07 -.01 -.01 .00 .04 -.03 -.11 -.12 -.15 -.12 1
Pricing -.03 .04 .04 -.03 .03 .02 .01 -.03 .03 -.02 .04 -.04 .00 -.01 .01 .02 .05 .04 -.01 .05 .03 -.11 .03 .03 .03 -.03 -.08 -.09 -.11 -.09 -.08 1
NPD -.01 .01 .00 .00 .02 .03 .04 -.01 .03 .01 .04 .00 .01 -.01 -.01 .04 .05 .08 .00 .02 -.01 -.09 .07 .04 .00 -.02 -.10 -.11 -.13 -.11 -.10 -.07 1
Sales Force. .01 .00 -.01 .01 .00 .02 .04 -.01 .04 .04 .04 -.04 .00 .03 -.05 .18 .04 .09 -.02 .00 -.04 -.10 .00 .06 .05 .02 -.12 -.13 -.16 -.13 -.12 -.09 -.11 1
Dist. -.01 -.01 .01 .00 .00 .06 .05 -.04 -.02 .03 .04 -.01 .04 -.01 -.01 -.02 .02 .08 .02 .01 -.02 -.10 .00 .05 .04 -.01 -.07 -.07 -.09 -.07 -.06 -.05 -.06 -.07 1
Metric Use -.06 .02 .03 -.05 -.02 .34 .28 -.02 .03 .05 .16 .17 .12 .03 -.13 .21 .07 .09 .09 .09 .09 -.17 -.04 .10 .06 -.02 .01 .04 .01 -.09 .03 -.03 .06 .11 .02 1
Performance -.04 .02 .06 -.08 .02 .17 .18 .01 -.05 -.01 .10 .22 .10 -.03 -.09 .30 .08 .06 .30 .03 .02 -.05 -.11 -.03 .16 .00 -.12 -.01 .01 .00 .05 -.02 .04 .05 .03 .24 1
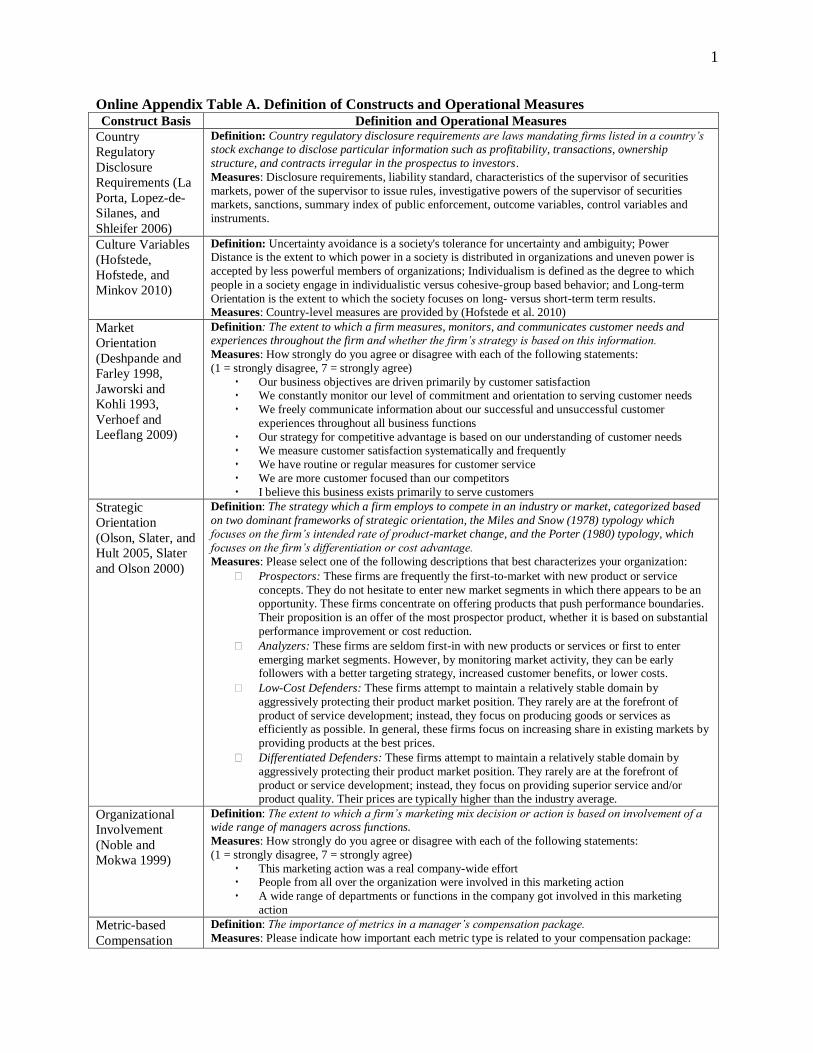
1
Online Appendix Table A. Definition of Constructs and Operational Measures Construct Basis Definition and Operational Measures
Country
Regulatory
Disclosure
Requirements (La
Porta, Lopez-de-
Silanes, and
Shleifer 2006)
Definition: Country regulatory disclosure requirements are laws mandating firms listed in a country’s stock exchange to disclose particular information such as profitability, transactions, ownership
structure, and contracts irregular in the prospectus to investors.
Measures: Disclosure requirements, liability standard, characteristics of the supervisor of securities
markets, power of the supervisor to issue rules, investigative powers of the supervisor of securities
markets, sanctions, summary index of public enforcement, outcome variables, control variables and
instruments.
Culture Variables
(Hofstede,
Hofstede, and
Minkov 2010)
Definition: Uncertainty avoidance is a society's tolerance for uncertainty and ambiguity; Power Distance is the extent to which power in a society is distributed in organizations and uneven power is
accepted by less powerful members of organizations; Individualism is defined as the degree to which
people in a society engage in individualistic versus cohesive-group based behavior; and Long-term
Orientation is the extent to which the society focuses on long- versus short-term term results. Measures: Country-level measures are provided by (Hofstede et al. 2010)
Market
Orientation
(Deshpande and
Farley 1998,
Jaworski and
Kohli 1993,
Verhoef and
Leeflang 2009)
Definition: The extent to which a firm measures, monitors, and communicates customer needs and experiences throughout the firm and whether the firm’s strategy is based on this information.
Measures: How strongly do you agree or disagree with each of the following statements:
(1 = strongly disagree, 7 = strongly agree)
Our business objectives are driven primarily by customer satisfaction We constantly monitor our level of commitment and orientation to serving customer needs
We freely communicate information about our successful and unsuccessful customer
experiences throughout all business functions
Our strategy for competitive advantage is based on our understanding of customer needs We measure customer satisfaction systematically and frequently
We have routine or regular measures for customer service
We are more customer focused than our competitors
I believe this business exists primarily to serve customers
Strategic
Orientation
(Olson, Slater, and
Hult 2005, Slater
and Olson 2000)
Definition: The strategy which a firm employs to compete in an industry or market, categorized based
on two dominant frameworks of strategic orientation, the Miles and Snow (1978) typology which focuses on the firm’s intended rate of product-market change, and the Porter (1980) typology, which
focuses on the firm’s differentiation or cost advantage.
Measures: Please select one of the following descriptions that best characterizes your organization:
Prospectors: These firms are frequently the first-to-market with new product or service
concepts. They do not hesitate to enter new market segments in which there appears to be an opportunity. These firms concentrate on offering products that push performance boundaries.
Their proposition is an offer of the most prospector product, whether it is based on substantial
performance improvement or cost reduction.
Analyzers: These firms are seldom first-in with new products or services or first to enter
emerging market segments. However, by monitoring market activity, they can be early followers with a better targeting strategy, increased customer benefits, or lower costs.
Low-Cost Defenders: These firms attempt to maintain a relatively stable domain by
aggressively protecting their product market position. They rarely are at the forefront of
product of service development; instead, they focus on producing goods or services as efficiently as possible. In general, these firms focus on increasing share in existing markets by
providing products at the best prices.
Differentiated Defenders: These firms attempt to maintain a relatively stable domain by
aggressively protecting their product market position. They rarely are at the forefront of
product or service development; instead, they focus on providing superior service and/or product quality. Their prices are typically higher than the industry average.
Organizational
Involvement
(Noble and
Mokwa 1999)
Definition: The extent to which a firm’s marketing mix decision or action is based on involvement of a wide range of managers across functions.
Measures: How strongly do you agree or disagree with each of the following statements:
(1 = strongly disagree, 7 = strongly agree)
This marketing action was a real company-wide effort People from all over the organization were involved in this marketing action
A wide range of departments or functions in the company got involved in this marketing
action
Metric-based
Compensation
Definition: The importance of metrics in a manager’s compensation package.
Measures: Please indicate how important each metric type is related to your compensation package:
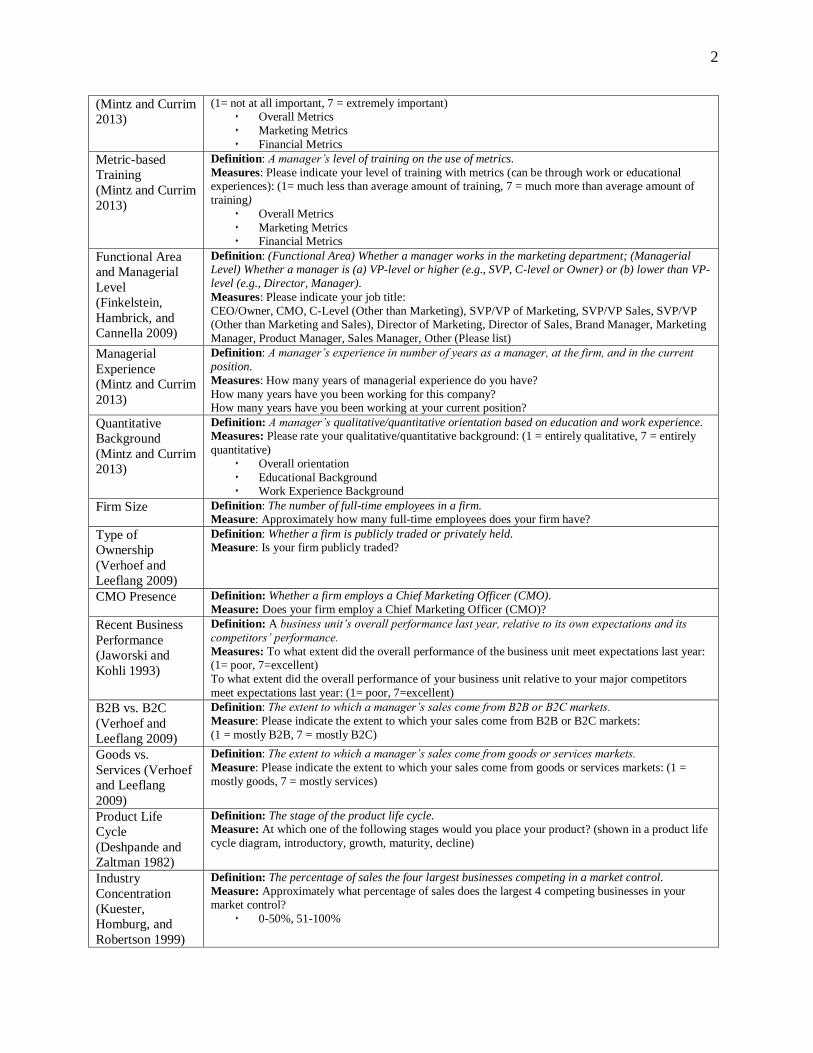
2
(Mintz and Currim
2013)
(1= not at all important, 7 = extremely important) Overall Metrics
Marketing Metrics
Financial Metrics
Metric-based
Training
(Mintz and Currim
2013)
Definition: A manager’s level of training on the use of metrics.
Measures: Please indicate your level of training with metrics (can be through work or educational experiences): (1= much less than average amount of training, 7 = much more than average amount of
training)
Overall Metrics
Marketing Metrics Financial Metrics
Functional Area
and Managerial
Level
(Finkelstein,
Hambrick, and
Cannella 2009)
Definition: (Functional Area) Whether a manager works in the marketing department; (Managerial Level) Whether a manager is (a) VP-level or higher (e.g., SVP, C-level or Owner) or (b) lower than VP-
level (e.g., Director, Manager).
Measures: Please indicate your job title:
CEO/Owner, CMO, C-Level (Other than Marketing), SVP/VP of Marketing, SVP/VP Sales, SVP/VP (Other than Marketing and Sales), Director of Marketing, Director of Sales, Brand Manager, Marketing
Manager, Product Manager, Sales Manager, Other (Please list)
Managerial
Experience
(Mintz and Currim
2013)
Definition: A manager’s experience in number of years as a manager, at the firm, and in the current
position.
Measures: How many years of managerial experience do you have?
How many years have you been working for this company? How many years have you been working at your current position?
Quantitative
Background
(Mintz and Currim
2013)
Definition: A manager’s qualitative/quantitative orientation based on education and work experience. Measures: Please rate your qualitative/quantitative background: (1 = entirely qualitative, 7 = entirely
quantitative)
Overall orientation
Educational Background Work Experience Background
Firm Size Definition: The number of full-time employees in a firm. Measure: Approximately how many full-time employees does your firm have?
Type of
Ownership
(Verhoef and
Leeflang 2009)
Definition: Whether a firm is publicly traded or privately held. Measure: Is your firm publicly traded?
CMO Presence Definition: Whether a firm employs a Chief Marketing Officer (CMO).
Measure: Does your firm employ a Chief Marketing Officer (CMO)?
Recent Business
Performance
(Jaworski and
Kohli 1993)
Definition: A business unit’s overall performance last year, relative to its own expectations and its
competitors’ performance.
Measures: To what extent did the overall performance of the business unit meet expectations last year: (1= poor, 7=excellent)
To what extent did the overall performance of your business unit relative to your major competitors
meet expectations last year: (1= poor, 7=excellent)
B2B vs. B2C
(Verhoef and
Leeflang 2009)
Definition: The extent to which a manager’s sales come from B2B or B2C markets.
Measure: Please indicate the extent to which your sales come from B2B or B2C markets:
(1 = mostly B2B, 7 = mostly B2C)
Goods vs.
Services (Verhoef
and Leeflang
2009)
Definition: The extent to which a manager’s sales come from goods or services markets.
Measure: Please indicate the extent to which your sales come from goods or services markets: (1 =
mostly goods, 7 = mostly services)
Product Life
Cycle
(Deshpande and
Zaltman 1982)
Definition: The stage of the product life cycle. Measure: At which one of the following stages would you place your product? (shown in a product life
cycle diagram, introductory, growth, maturity, decline)
Industry
Concentration
(Kuester,
Homburg, and
Robertson 1999)
Definition: The percentage of sales the four largest businesses competing in a market control.
Measure: Approximately what percentage of sales does the largest 4 competing businesses in your
market control?
0-50%, 51-100%

3
Market Growth
(Homburg,
Workman, and
Krohmer 1999)
Definition: The average annual growth or decline of the company and the industry over the last three years.
Measure: Over the last three years, what was the average annual market growth or decline for your
company? Over the last three years, what was the average annual market growth or decline for your industry?
Market
Turbulence
(Miller, Burke,
and Glick 1998)
Definition: The rate at which products or services become obsolete, the ease of forecasting consumer preferences, and how often a firm needs to change its marketing and production/service technology to
keep up with competitors and/or consumer preferences.
Measures: How strongly do you agree or disagree with each of the following statements
(1 = strongly disagree, 7 = strongly agree): ® = reverse scored Products/services become obsolete very slowly in your firm’s principal industry ®
Your firm seldom needs to change its marketing practices to keep up with competitors ®
Consumer demand and preferences are very easy to forecast in your firm’s principal industry
® Your firm must frequently change its production/service technology to keep up with
competitors and/or consumer preferences
Marketing mix
Decision (Menon
et al. 1999)
Definition: A major marketing mix decision undertaken not so recently that performance evaluation is
premature and not so long ago that memory of the decision and its performance is fuzzy.
Measures: Please indicate which types of major marketing decisions you have undertaken (or
implemented) that (1) were not so recent that performance evaluation is premature and (2) not so long ago that memory about the decision and performance is fuzzy:
Traditional Advertising (i.e., TV, Magazine, Radio, etc.), Internet Advertising (i.e., Banner
Ads, Display Ads, SEO, etc.), Direct to Consumer (i.e., Emails, CRM, Direct mail, etc.),
Social Media (i.e., Twitter, Facebook, MySpace, etc.), Price Promotions, Pricing, New Product Development, Sales Force, Distribution, PR/Sponsorships
Marketing and
Financial Metrics
Used (Ambler
2003, Ambler,
Kokkinaki, and
Puntoni 2004,
Barwise and
Farley 2004, Du,
Kamakura, and
Mela 2007, Farris
et al. 2010,
Hoffman and
Fodor 2010,
Lehmann and
Reibstein 2006,
Pauwels et al.
2009, Srinivasan,
Vanhuele, and
Pauwels 2010)
Marketing Metric Definition: Marketing metrics are based on a customer or marketing mind set. A metric is defined to be used in a marketing mix decision if a manager employed the metric as a decision
aid when making the marketing mix decision.
Financial Metric Definition: Financial metrics are either monetary based, based on financial ratios,
or readily converted to monetary outcomes. General Metric Definition: General metrics are defined as metrics suited to many marketing mix
decisions.
Specific Metric Definition: Specific metrics are defined as metrics largely suited to each of 10
marketing mix decisions considered. Measure: Please indicate if you used any of the following MARKETING or FINANCIAL metrics
when making your marketing mix decision:
See Online Appendix Table B for 12 general marketing and 12 general financial metrics which were
listed for each of 10 marketing mix decisions.
In addition, see Online Appendix Table B for 3 specific marketing metrics and 3 specific financial
metrics listed for each of 10 specific marketing mix decisions.
Marketing mix
Activity
Performance
(Jaworski and
Kohli 1993,
Moorman and
Rust 1999,
Verhoef and
Leeflang 2009)
Definition: The performance of a marketing mix activity is defined based on a firm’s stated marketing, financial, and overall outcomes, relative to a firm’s stated objectives and to similar prior decisions.
Measures: Relative to your firm’s stated objectives, how is the last major marketing activity undertaken
performing overall? (Jaworski and Kohli 1993)
(1=much worse, 7=much better) Relative to similar prior marketing activities you've undertaken, how is the last major marketing activity
undertaken performing? (Jaworski and Kohli 1993)
(1=much worse, 7=much better; N/A if unsure or never undertook activity)
Relative to your firm’s stated objectives, how is the last major marketing activity undertaken performing on: (1=much worse, and, 7=much better; N/A if unsure)
Customer satisfaction (Moorman and Rust 1999; Verhoef and Leeflang 2009)
Profitability (Moorman and Rust 1999; Verhoef and Leeflang 2009) Customer loyalty (Verhoef and Leeflang 2009)
Sales (Moorman and Rust 1999)
Market share (Moorman and Rust 1999; Verhoef and Leeflang 2009)
ROI (Moorman and Rust 1999)

4
Online Appendix Table B: Metrics Considered
Marketing
Mix Activity
Marketing Metrics Financial Metrics
General
Metrics
• Market Share (Units or Dollars)
• Awareness (Product or Brand)
• Satisfaction (Product or Brand)
• Likeability (Product or Brand)
• Preference (Product or Brand)
• Willingness to Recommend (Product
or Brand)
• Loyalty (Product or Brand)
• Perceived Product Quality
• Consideration Set
• Total Customers
• Share of Customer Wallet
• Share of Voice
• Net Profit
• Return on Investment (ROI)
• Return on Sales (ROS)
• Return on Marketing Investment (ROMI)
• Net Present Value (NPV)
• Economic Value Added (EVA)
• Marketing Expenditures (% specifically
on Brand Building Activities)
• Stock Prices / Stock Returns
• Tobin’s q
• Target Volume (Units or Sales)
• Customer Segment Profitability
• Customer Lifetime Value (CLV)
Traditional
Advertising
• Impressions
• Reach
• Recall
• Cost per Customer Acquired / Cost per
Thousand Impressions (CPM)
• Lead Generation
• Internal Rate of Return (IRR)
Internet
Advertising
• Impressions
• Hits/Visits/Page Views
• Click-through Rate
• Cost per Click
• Conversion Rate
• Internal Rate of Return (IRR)
Direct to
Consumer
• Reach
• Number of Responses by Campaign
• New Customer Retention Rate
• Cost per Customer Acquired
• Conversion Rate
• Lead Generation
Social Media
• Hits/Visits/Page Views
• Number of Followers / Tags
• Volume of Coverage by Media
• Lead Generation
• Cost per Exposure
• Total Costs
Price
Promotions
• Impressions
• Reach
• Trial / Repeat Volume (or Ratio)
• Promotional Sales / Incremental Lift
• Redemption Rates (coupons, etc.)
• Internal Rate of Return (IRR)
Pricing
• Price Premium
• Reservation Price
• Relative Price
• Unit Margin / Margin %
• Price Elasticity
• Optimal Price
New Product
Development
• Belief in New Product Concept
• Attitude toward Product / Brand
• Expected Annual Growth Rate
• Expected Margin %
• Level of Cannibalization /
Cannibalization Rate
• Internal Rate of Return (IRR)
Sales Force
• Reach
• Number of Responses by Campaign
• New Customer Retention Rate
• Sales Potential Forecast
• Sales Force Productivity
• Sales Funnel / Sales Pipeline
Distribution
• Out of Stock % / Availability
• Strength of Channel Relationships
• Product Category Volume (PCV)
• Total Inventory / Total Distributors
• Channel Margins
• Sales per Store / Stock-keeping units
(SKUS)
PR /
Sponsorship
• Volume of Coverage by Media
• Reach
• Recall
• Lead Generation
• Cost per Exposure
• Total Costs
5
Online Appendix References
Ambler, T. 2003. Marketing and the bottom line: The marketing metrics to pump up cash flow 2nd ed.
London, FT Prentice Hall.
Ambler, T., F. Kokkinaki, S. Puntoni. 2004. Assessing marketing performance: Reasons for metrics
selection. J. Mark. Manag. 20(3) 475–498.
Barwise, P., J. U. Farley. 2004. Marketing metrics: Status of six metrics in five countries. Eur. Manag. J.
22(3) 257–262.
Deshpande, R., J. U. Farley. 1998. Measuring market orientation: Generalization and synthesis. J. Mark.-
Focus. Manag. 2(3) 213–232.
Deshpande, R., G. Zaltman. 1982. Factors affecting the use of market research information: A path
analysis. J. Mark. Res. 19(1) 14–31.
Du, R. Y., W. A. Kamakura, C. F. Mela. 2007. Size and share of customer wallet. J. Mark. 71(2) 94–113.
Farris, P. W., N. T. Bendle, P. E. Pfeifer, D. J. Reibstein. 2010. Marketing metrics: The definitive guide to
measuring marketing performance 2nd ed. Upper Saddle River, New Jersey, Wharton School
Publishing.
Finkelstein, S., D. C. Hambrick, A. A. Cannella. 2009. Strategic leadership: Theory and research on
executives, top management teams, and boards. Oxford, UK, Oxford University Press.
Hoffman, D. L., M. Fodor. 2010. Can you measure the ROI of your social media marketing? MIT Sloan
Manag. Rev. 52(1) 41–49.
Hofstede, G., G. J. Hofstede, M. Minkov. 2010. Cultures and organizations: Software of the mind 3rd ed.
New York, McGraw-Hill.
Homburg, C., J. P. Workman Jr., H. Krohmer. 1999. Marketing’s influence within the firm. J. Mark.
63(2) 1–17.
Jaworski, B. J., A. K. Kohli. 1993. Market orientation: Antecedents and consequences. J. Mark. 57(3) 53–
70.
Kuester, S., C. Homburg, T. S. Robertson. 1999. Retaliatory behavior to new product entry. J. Mark.
63(4) 90–106.
La Porta, R., F. Lopez-De-Silanes, A. Shleifer. 2006. What works in securities laws? J. Finance 61(1) 1–
32.
Lehmann, D. R., D. J. Reibstein. 2006. Marketing metrics and financial performance. Cambridge,
Massachusetts, Marketing Science Institute.
Menon, A., S. G. Bharadwaj, P. T. Adidam, S. W. Edison. 1999. Antecedents and consequences of
marketing strategy making: A model and a test. J. Mark. 63(2) 18–40.

6
Miller, C. C., L. M. Burke, W. H. Glick. 1998. Cognitive diversity among upper-echelon executives:
Implications for strategic decision processes. Strat. Manag. J. 19(1) 39–58.
Moorman, C., R. T. Rust. 1999. The role of marketing. J. Mark. 63(4) 180–197.
Noble, C. H., M. P. Mokwa. 1999. Implementing marketing strategies: Developing and testing a
managerial theory. J. Mark. 63(4) 57–73.
Olson, E. M., S. F. Slater, G. T. M. Hult. 2005. The performance implications of fit among business
strategy, marketing organization structure, and strategic behavior. J. Mark. 69(3) 49–65.
Pauwels, K., T. Ambler, B. H. Clark, P. LaPointe, D. J. Reibstein, B. Skiera, B. Wierenga, and T. Wiesel.
2009. Dashboards as a service: Why, what, how, and what research is needed? J. Serv. Res. 12(2)
175–189.
Slater, S. F., E. M. Olson. 2000. Strategy type and performance: The influence of sales force
management. Strat. Manag. J. 21(8) 813–829.
Srinivasan, S., M. Vanhuele, K. Pauwels. 2010. Mind-Set metrics in market response models: An
integrative approach. J. Mark. Res. 47(4) 672–684.
Verhoef, P. C., P. S. H. Leeflang. 2009. Understanding the marketing department’s influence within the
firm. J. Mark. 73(2) 14–37.