Embed Size (px)
Citation preview
Does Direct to Consumer Advertising of
Antidepressants Affect Visits to Physicians?
Jonathan Cantor
Department of Policy Analysis & Management
Cornell University
Ithaca NY 14850, U.S.A
e-mail: [email protected]
May 2010
Cantor 2
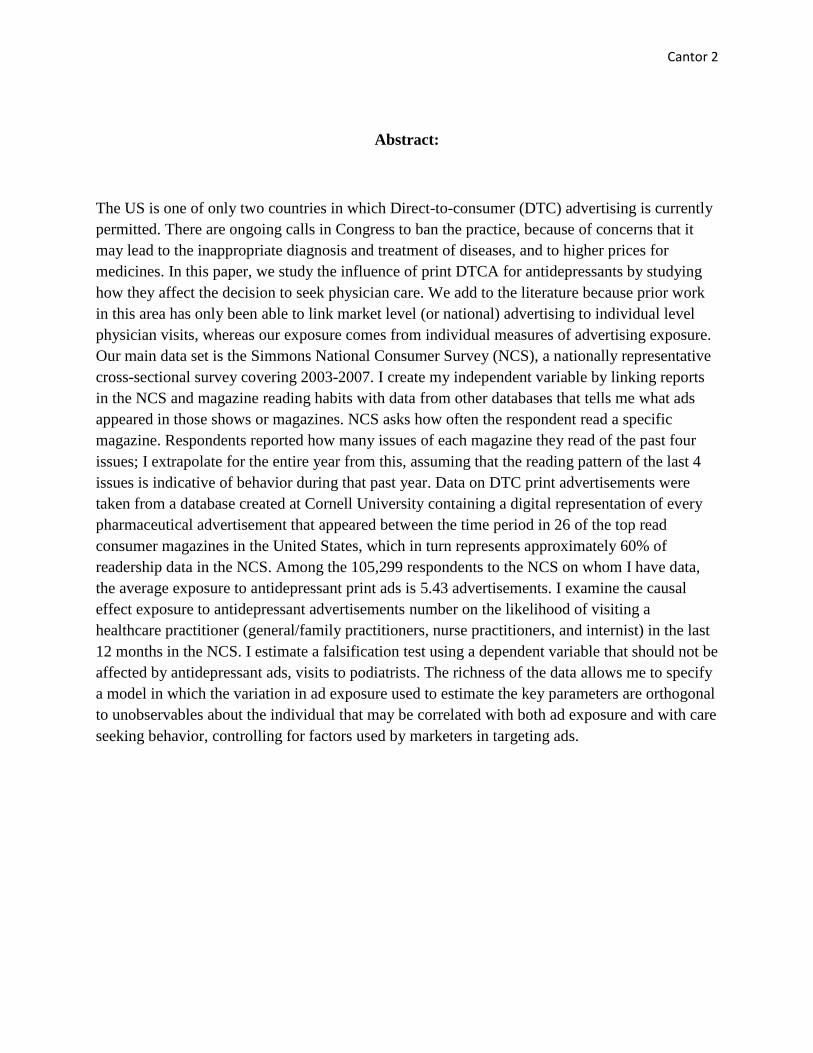
Abstract:
The US is one of only two countries in which Direct-to-consumer (DTC) advertising is currently
permitted. There are ongoing calls in Congress to ban the practice, because of concerns that it
may lead to the inappropriate diagnosis and treatment of diseases, and to higher prices for
medicines. In this paper, we study the influence of print DTCA for antidepressants by studying
how they affect the decision to seek physician care. We add to the literature because prior work
in this area has only been able to link market level (or national) advertising to individual level
physician visits, whereas our exposure comes from individual measures of advertising exposure.
Our main data set is the Simmons National Consumer Survey (NCS), a nationally representative
cross-sectional survey covering 2003-2007. I create my independent variable by linking reports
in the NCS and magazine reading habits with data from other databases that tells me what ads
appeared in those shows or magazines. NCS asks how often the respondent read a specific
magazine. Respondents reported how many issues of each magazine they read of the past four
issues; I extrapolate for the entire year from this, assuming that the reading pattern of the last 4
issues is indicative of behavior during that past year. Data on DTC print advertisements were
taken from a database created at Cornell University containing a digital representation of every
pharmaceutical advertisement that appeared between the time period in 26 of the top read
consumer magazines in the United States, which in turn represents approximately 60% of
readership data in the NCS. Among the 105,299 respondents to the NCS on whom I have data,
the average exposure to antidepressant print ads is 5.43 advertisements. I examine the causal
effect exposure to antidepressant advertisements number on the likelihood of visiting a
healthcare practitioner (general/family practitioners, nurse practitioners, and internist) in the last
12 months in the NCS. I estimate a falsification test using a dependent variable that should not be
affected by antidepressant ads, visits to podiatrists. The richness of the data allows me to specify
a model in which the variation in ad exposure used to estimate the key parameters are orthogonal
to unobservables about the individual that may be correlated with both ad exposure and with care
seeking behavior, controlling for factors used by marketers in targeting ads.
ACKNOWLEDGEMENTS
I thank Rosemary Avery for her excellent guidance and mentorship. I thank Kosali Simon
for her helpful assistance. Also, I thank Sharon Sassler for assistance in constructing this paper.
In addition I would like to thank Talia Barr for providing some direction and advice on this
paper. Lastly, I’d like to thank the undergraduate research team for their hard work and constant
support.
Contents Introduction ................................................................................................................................................... 1
Objective of the Study .................................................................................................................................. 2
Literature Review .......................................................................................................................................... 4
Data ............................................................................................................................................................. 21
Methods ...................................................................................................................................................... 23
Results ......................................................................................................................................................... 30
Summary ..................................................................................................................................................... 38
Cantor 1
Introduction
Direct-to-consumer (DTC) advertising is currently permitted in only two countries, the
United States and New Zealand. Recently Canada and the European Union have debated whether
to implement a system similar to that of the United States (Calfee 2002). There are several
reasons why there are few countries that actually allow DTC advertising. Two of the primary
reasons for the opposition is that DTC advertising may drive unnecessary physician visits and
may fuel unnecessary demand for expensive prescription drugs.
Within the past few months several members of Congress have requested a ban on DTC
advertising. Their concern rests on how the ads impact care seeking behavior. Individuals tend to
prefer to solve their health problems by taking a prescription drug because it is easier than
changing their lifestyle behaviors (Calfee 2007). Specifically, Representative Henry A. Waxman,
(D-CA), declared that he wanted to empower the FDA to prevent consumer advertising for
newly approved prescription drugs. This temporary ban would remain in effect until such time as
the FDA has time to approve each ad for a specific newly approved drug and the actual medical
experiences related to the drug can be documented. Representative Jerrold Nadler (D-NY) is
quoted as stating “You should not be diagnosed by a pitchman on TV who doesn’t know you
whatsoever (Singer 2009).” Such actions by congressional members are in reaction to the belief
that DTC advertisements may have a negative impact on the general public, convincing
consumers they may have illnesses they possibly do not have or to request drugs they may not
need.
Cantor 2
Objective of the Study
This study contributes to the research on DTC advertising by presenting to the best of my
knowledge the first empirical evidence using individual-level data on how DTC advertising
affects the likelihood of physician visits. The vast majority of studies that have investigated this
subject in the past have linked national or individual usage of a particular pharmaceutical product
with national spending for DTC advertising see Avery 2009 for a review of this literature. This
study is novel in that it will use measures at the individual level for both visits to a healthcare
practitioner as well as DTC advertising exposure measures. The market drug under study is
antidepressants. This is an important market because depression is one of the most underreported
diseases. Determining the effects of DTC advertising would be particularly valuable for this
market as a result. Prior work in this area by Iizuka and Jin (2005) suggests that increased
exposure to DTC advertisements for antidepressants enhanced the likelihood that an individual
visited a healthcare practitioner. The study provides evidence of a correlation between DTC ad
exposure at the individual level and an individual’s physician visits. Another study described
below reported 35% of physician visits may have been initiated by DTC advertising (Weisman,
Blumenthal, Silk, Zapert et al. 2003). One would assume DTC ads would increase sales since
the purpose of advertising is to stimulate demand in a market. However, markets for
pharmaceutical drugs operate differently. In this market, demand is regulated by a physician.
Accounting for this discrepancy, some of the literature referenced below notes that doctors are
willing to prescribe pharmaceuticals by succumbing to the demands of patients (Weisman 2004,
Kravitz, Epstein et al. 2005, Kravitz, Epstein et al. 2007). Therefore based on previous studies
one would hypothesize that DTC advertising for antidepressants would increase the likelihood of
an individual of going to a healthcare practitioner.
Cantor 3
An ideal dataset to study this question would contain several key elements. It would track
all DTC antidepressant advertisement an individual is exposed to in all media, randomize the
exposure, track physician visits for the purpose of diagnosis/treatment of depression, and track
scripts issued for antidepressant medications for the individual. With this data one could link
exposure to DTC antidepressant advertisements to both physician visits and prescriptions.
Though the data used in this study is not ideal, it does contain many of the key elements listed
above.
In the next section of the paper, I review past literature on the subjects of depression;
present information will be presented on what types of people consult physicians, the effects of
DTC advertising on product use, and the relationship between DTC advertising, the consumer
and their healthcare practitioner. Methods used to examine this issue will be described, and
thereafter empirical results will be reviewed. Finally, I will describe several implications of my
results as well as future research that I may want to investigate.
Cantor 4
Literature Review
Prevalence and Treatment of Depression:
Approximately 14.8 million Americans, 6.7 percent, of the U.S. population 18 or older,
have major depressive disorders in a given year according to the National Institute of Mental
Health (2008). Moreover; depression is currently the leading cause of disability in the United
States (Cross 2004). The World Health Organization (2001) reports that close to 20% of patients
who are examined by health care professionals suffer from at least one mental disorder. Likewise
the report states that one in four families is likely to have at least one member with a behavioral
or mental disorder. Finally, the report projects that based on current trends, by the year 2020
depression will be the second leading cause of disability adjusted life-years (DALYs).
It appears that depression imposes a significant cost on society from a business
perspective. Depression results in more absenteeism by employees than any other physical
disorder. It is estimated that the cost to employers located in the United States is more than $51
billion per year in lost productivity (Cross 2004). Likewise nearly 225 million workdays are lost
annually in the U.S. due to major depressive disorder (Kessler et al. 2006). More than half of all
individuals who stated they were suffering from mild depressive symptoms also reported they
had some difficulty in daily functioning due to their symptoms. These individuals reported it was
difficult for them to “work, get things done at home, or get along with other people” (Pratt, and
Brody 2008). Finally, one study postulates that employees with depression have an
unemployment rate that is approximately five times higher than those without depression. This
also leads to lower hourly earnings for those who are depressed after they find a new job (Lerner
et al. 2004).
Compared to women, men are almost half as likely to be diagnosed with a depressive
disorder after age 15 (National Institute of Mental Health 2006). Approximately 20 percent of
Cantor 5
women will be treated for depression in any given year, and one quarter of all women will
experience an episode of depression in their lifetime (Linsenmayer et al. 1999). Depression is
also considered the most common mental disorder for individuals 65 or older (American
Psychiatric 2007). Not only do depression rates differ by gender and age, they differ by race and
socioeconomic status. Low income individuals, uneducated individuals, and unemployed
individuals tend to be more depressed than their counterparts. Married women are reported to
have higher rates of depression than unmarried women. This is not true for men, as it appears
that unmarried men are more likely to be depressed than their married counterparts. Finally as
the number of children in the household increases, the risk of depression increases for women
(McGrath et al. 1990).
Olfson and Marcus (2009) found that in 1996 only 6 percent of the United States, 13
million people, used an antidepressant medication. That number more than doubled to 27 million
by 2005. In addition the authors determined that outpatient treatment for depression rose steadily
between 1987 and 2007. The rate increased from .73 per 100 persons to 2.33, a finding consistent
across socioeconomic and demographic groups. Moreover, individuals that were divorced,
separated or widowed had the highest rates of outpatient treatment for depression. Likewise the
authors found that in 2005, antidepressants surpassed antihypertensive agents as the most
prescribed class of medication in office-based and hospital-based medical practices. The rate of
antidepressant treatment increased for males and females of all ages, marital status, educational
achievement, insurance status and employment between 1996 and 2005. While the authors also
report significant increases in the mean number of antidepressant prescriptions issued in all
socioeconomic demographic groups except youths, young adults, older adults, Hispanics and
uninsured persons between 1996 and 2005. Finally there was a significant increase in the
Cantor 6
percentage of users treated with antipsychotic medications. According to IMS Health, in 2008
more than 164 million prescriptions were written, equivalent to nearly $9.6 billion in U.S. sales
of the drug (Barbara 2009).
The type of physicians who prescribes antidepressants, and the mean number of
antidepressant prescriptions an individual receives is also important to consider. Olfson and
Marcus (2009) report that among those prescribed antidepressants in 2005, 34.59 percent were
treated by psychiatrists and 7.46 percent were treated by non-psychiatric physicians. Finally, the
authors report that only a small minority of patients prescribed antidepressants were treated by a
psychiatric counselor or psychologist over the course of a single year, and a lower percentage
have undergone psychotherapy (Olfson and Marcus 2009). Overall the number of individuals
who have been diagnosed with depression and prescribed a medication for depression has
increased substantially over the past decade.
Pros and Cons of DTC Advertising:
Proponents:
In the literature there has been a growing debate surrounding DTC advertising. One
argument in support of DTC advertising is that they are used to inform consumers about health
conditions and treatments rather than dictate what they do at the doctor’s office. Since new
healthcare devices and techniques are developed almost daily and consumers rely on various
sources of information to keep them informed (Pines 1998). Calfee (2007) notes some potential
positive spillover effects generated by DTC advertising. For example, an individual may go to
their doctor to discuss their health status after being exposed to an advertisement. As a result of
Cantor 7
the advertisement, the doctor may be able to prescribe lifestyle changes for the patient, generally
seen as more effective alternatives then pharmaceuticals (Calfee 2007).
Proponents of DTC advertising also have stated that a large number of individuals go
undiagnosed for variety of ailments each year and that DTC advertising is a possible way to
reach this population and encourage them to seek treatment. According to Holmer (1999), only
one depressed individual out of 10 receives the appropriate medical treatment for their ailment.
In addition, one third of individuals who have major depression do not make an attempt to
receive help. This is due in large part to the fact that drugs treating depression require consumers
take the initiative to see a physician or psychiatrist. This set of stake holders argues that DTC
advertising offers the consumer the opportunity to become more active in their own healthcare
(Calfee 2002). In his article, Holmer offers the seminal argument in favor of DTC advertising:
“Pharmaceutical companies have both a right and a responsibility to inform
people about their products under the supervision of the FDA, which regulates
prescription drug advertising. Companies are committed to responsible
advertising that enhances the patient-physician relationship and encourages the
appropriate use of prescription drugs under a physician’s supervision. While such
advertising prompts more people to seek professional help, it does not dictate the
outcome of the physician visit or the kind of help patients (Holmer 1999: 381).”
Information provided in DTC advertising is intended to encourage the consumer to have a
conversation with a physician about different treatment options best suited to their needs and
preferences (Nair 2005).
Some proponents of DTC advertising feel that changes need to be made to the current
system in order to maximize the benefits of DTC advertising to society and consumers. Bell and
Kravitz (2007) warn that a ban on DTC advertising would be a direct violation of the First
Amendment. The authors state that DTC advertising serves society best when “(i) the advertised
Cantor 8
condition is serious, (ii) the condition is undertreated in the population, and (iii) the treatment is
highly efficacious and safe in comparison to the alternatives.” If DTC advertising is responsibly
undertaken, they argue it could make consumers aware of dangerous conditions and the
availability of possible treatments. Finally advertisements should specify therapies that don’t
involve pharmaceuticals, such as lifestyle changes (Kravitz and Bell 2007).
Opponents:
Those opposed to DTC advertising offer a plethora of arguments on the drawbacks of
DTC advertising in society and the multiple costs to social welfare. The American College of
Physicians, claim that DTC advertising leaves patients confused and misinformed, undermines
the physician/patient relationship and leads to unnecessary spending (Auton 2006). Other vocal
opponents include insurers and medical practitioners (Iizuka and Jin 2005). According to Naier
(2005), detractors oppose DTC advertising because two of its main goals clash and in opposition
with one another. One goal is to provide information to educate consumers, while the other goal
is to make a profit. Other opponents have stated that DTC advertising has a business-stealing
effect that misleads patients into demanding heavily advertised drugs over cheaper generic
alternatives, and to purchase unnecessary medications (Iizuka and Jin 2005).
Physicians offer a variety of perspectives on why DTC advertising should be banned. In a
recent survey, physicians reported feeling conflicted when a patient made a request for a specific
advertised drug. The physician did not want to alienate the patient but also didn’t want to
prescribe the wrong treatment. Other physicians feared that DTC advertising would extend the
Cantor 9
myth that there is a “pill for every ill,” amongst all consumers, which potentially could have a
negative influence on the consumer’s health in the long run (Findlay 2001).
In summary, the sentiments of both supporters and opponents of DTC advertising are
substantially different. Supporters view DTC as meeting the needs of consumers by using DTC
advertising. The opposition on the other hand worries how advertising will affect the perceptions
of what medicines can do, or express concerns over how it affects their professions.
Regulation of DTCA:
DTC advertising is regulated by the FDA, which serves as a policy watchdog by
examining drug advertisements to ensure the advertisement is not deceptive or misleading. In
1997 the FDA instituted several new rules for regulating DTC advertising. One of the more
prominent features of the 1997 rule change was that advertisers were required to present a
balance of drug benefits and risks, but not required to report all of the side effects of the drug or
even the major side effects (Davis 2000).
Particularly for print advertisements, the advertiser was required to provide a “brief
summary,” which listed side effects, contradictions and the drug’s effectiveness. In order to
comply with this requirement, the print advertiser tended to include the entire risk-related section
of their label. However, direct to consumer advertisements on broadcast television succumbed to
some different requirements. Broadcast ads had to include either a brief summary or an
“adequate provision,” for the dissemination of the drug’s product label which was already
approved by the FDA. In 1999 the FDA again changed their rules stating that broadcast DTC
would be able to meet the “adequate provision,” by including in their ads a reference for
consumers to a physician or pharmacist as well as more information on their product either
Cantor 10
available through a Web site, toll-free telephone number or a running DTC print advertisement.
Finally ads had to include language that consumers could understand especially when they
presented information in the major statement of adverse effects and contradictions described
above (Kaphingst and DeJong 2004).
Though the FDA was put in charge of regulating DTC advertising, there are serious
drawbacks to the current system. Stange (2007) argues it is time for America to ban DTC
advertising since FDA regulations are simply not working. He holds that a ban would improve
the public’s health and quality of care. To support this perspective, Stange cites several studies.
One study, “Creating Demand for Prescription Drugs: A Content Analysis of Television Direct-
to-Consumer Advertising,” coded content in television ads shown during evening news and
prime time hours. The authors coded factual claims made about the target condition, how the ad
attempted to appeal to consumers and how the ad portrayed the medication and lifestyle
behaviors in the lives of ad characters. Surprisingly, emotional appeals appeared in almost every
ad aired. The authors conclude that DTC advertising provided very limited information about the
causes of a disease or who is at risk. Rather the ads show characters that lost control over their
lives before the use of the medication across drug types. In addition the ads neglected the fact
that many of the illnesses could be shaped by lifestyle changes. Finally none of the ads actually
reported behavior change as an alternative to use of product (Frosch, Krueger, et al. 2007).
There have been many studies on DTC advertising, the vast majority of which have been
done at the aggregate level. In a recent study Block (2007) performed a cost-benefit analysis on
anti-depressant DTC advertisings. Costs were generated by multiplying the price of a single
antidepressant drug by the estimated number of doctor visits caused by DTC advertising. To
determine the number of DTC advertising related visits Block utilized existing literature and
Cantor 11
attempted to solve for the proportion of drugs requested by depressed and non-depressed
individuals. Benefits on the other hand were determined by looking at how many people are
helped by the use of antidepressants from the subsection of individuals who receive them; this
was determined to be approximately 6 percent of individuals at most. Likewise Only 6 percent
of doctor visits for depression were made by depressed individuals. In addition, Block found that
about 13 percent of those treated for depression actually received benefits from the treatment.
Though there were relatively few individuals who actually benefited from being exposed to DTC
advertisings Block concluded that the benefits of having DTC advertising outweighed the costs.
“DTC advertising improves social welfare even if the costs of all the potential physician visits
are included.” However public opinion on the subject does not correspond with the findings of
the above survey. On the subject of DTC advertising, 9 out of 10 respondents in a recent survey
of 2,500 US residents over the age of 18, reported it increased the costs of pharmaceuticals.
Likewise three fourths of the sample felt that the costs of DTC advertising outweighed the
benefits (Polen et al. 2009).
Regulatory practices for both print DTC advertising and television DTC advertising
differ. In addition it appears that the regulations for both have are relatively ineffective at
preventing pharmaceutical companies from describing their products accurately. Finally it is
important for us to determine how much advertising takes place and whether this necessarily
corresponds with an increase in the likelihood of doctor visits.
Cantor 12
Consumer Spending on Drugs:
Spending on direct-to-consumer advertising for pharmaceuticals has risen over the past
two decades. Between 1996 and 2000 total expenditures spent on DTC advertising increased by
212%. Rosenthal et al reported high levels of spending on drugs used to treat chronic conditions,
drugs with a low incidence of side effects and drugs close to approaching the end of their patent
protection (Rosenthal et al 2002). Between the years 2000 and 2006, DTC advertising spending
has increased and reached its peak in 2006. Since that year spending has declined steadily having
fallen from $5.4 billion at the end of 2006 to $4.7 billion at the end of 2008 and finally to $4.2
billion at the end of 2009 according to TNS Media Intelligence. One theory for the decline was
the recent economic downturn. A second theory postulated by one expert was, 2009 would not
offer any new blockbuster drugs that would help boost total DTC advertising spending (Mack).
Out-of-pocket expenditures for prescription drugs by consumers have decreased. Kaiser
reported that the share of prescription drug expenditures paid by private health insurance
increased from 26% in 1990 to 44% in 2006. This corresponds with consumers having to spend
less for prescription drugs. In sum, out-of-pocket expenditures by individuals fell from 24% in
2005 to 22% in 2006. This decline in out-of-pocket expenditures has been theorized to have
increased the probability of individuals filling more prescriptions for medicinal purposes (Kaiser
Family Foundation 2008).
With a decline in the amount of out-of-pocket expenditures made by consumers, there has
been an increase in the number of prescriptions that consumers purchase. Between 1997 and
2007, the number of prescriptions purchased increased an astounding 72%. This is roughly the
equivalent of 1.6 billion prescriptions. Likewise the number of prescriptions per capita also
Cantor 13
jumped from 8.9 to 12.6 (Kaiser Family Foundation 2008). According to the 2006 summary of
the National Ambulatory Medical Survey, drug therapy was reported for close to 636.7 million
doctor visits, approximately 70.6 percent of all visits (Cherry, Burt and Woodwell 2008).
The number of prescriptions issued differs by gender. Sayer and Britt find that females
are significantly more likely than males to receive prescriptions for a vast array of ailments even
after controlling for morbidity differences. Females were more likely to receive prescriptions for
hormones, psychological conditions, nutrition, and urogenital conditions. In addition, the authors
found that females requested medicinal care more often than males (Sayer and Britt 1997).
Spending on DTC advertising has increased for most of the past decade. It was not until
the past three years, in which spending began to decline steadily. This could most likely be
attributed to economic conditions. However, demand for antidepressants has increased steadily
as well over the past decade. While DTC advertising has been described as one of the reasons for
this trend, another reason is the recent decline in out-of-pocket expenditures for prescription
drugs by consumers. Insurance companies and the government are bearing a larger portion of the
cost than ever before and consumers may be taking advantage of this by purchasing more
prescription drugs.
Patterns in Physician Consultation:
Socio-demographic characteristics
There are very few studies that have looked at determinants of physician visits
(consultation rates). Although this is not the focus of my study, my results will contribute to what
is known in this area. Campbell and Roland (1996) in their paper have the best accumulation of
the literature on the subject. Physician consultation varies significantly by life stage. Children
Cantor 14
and the elderly tend to consult the doctor at very high rates, whereas those in life stages in the
middle of that spectrum visit physicians at much lower rates. This is because individuals are
much more susceptible to chronic diseases during these ages. Women consult doctors more often
than men. The difference between the two genders is largest between the ages 16-44 during
which females visit a physician almost twice as often as their male counterparts. Three ethnic
groups have higher consultation rates than Caucasians: Indians, Pakistanis, and Afro-Caribbeans.
Minority ethnic groups (except elderly Afro-Caribbeans) are less likely to consult for mental
illness. These discrepancies are argued to exist because there are several barriers that impede
minorities from visiting with a doctor (Campbell and Roland 1996).
There are numerous other factors that influence physician consultation. Unemployed
individuals are more likely to consult a physician than employed individuals (Campbell and
Roland 1996). It has been speculated that unemployed individuals in the past are more
susceptible to morbidity and mortality then their employed counterparts. In addition, employed
individuals have been reported to recover from illnesses quicker than the unemployed (Dorling
2009). Increases in consultation rates may be attributed to an increase in illness or an inability to
cope with symptoms that developed as a result of either psychological stress or problems within
the family resulting from the unemployment. Renters were more likely to consult a healthcare
practitioner than those who own their home. In addition house ownership was cited as a stronger
indicator of consulting with a doctor than social class. If a potential patient had a well developed
social network, they were less likely to consult with a doctor. Single and married adults did not
consult physicians as often as widowed or divorced adults. Stress also played a key role as to
whether or not an individual would consult a doctor (Campbell and Roland 1996).

Cantor 15
Psychological characteristics
Campbell and O’Roland argued that there were four key psychological characteristics
that determine whether an individual seeks help from a doctor or not: perceived severity,
vulnerability to illness, perceived costs of different types of health seeking behavior, and
perceived benefits of action. Perceived susceptibility is how healthy an individual believes
themselves to be. If the individual has a low perceived susceptibility they are less likely to go to
a physician because they perceive themselves to be healthy and less vulnerable to illness.
Individuals with high perceived susceptibility believe they are ill and are more vulnerable to
illness and therefore more likely to go to a healthcare practitioner. Perceived severity can include
how serious the symptom is, how frequent the symptoms occur and finally the probability of the
illness becoming more dangerous. Individuals are more likely to attend a general practitioner if
they fear that their symptoms are worsening. The perceived benefits and costs from seeking
medical care are important to consider as well. The benefits are gauged by how effective the
individual feels the treatment will be in comparison to the individual treating themselves. In
addition the costs that have to be considered include: prescription charges, transportation costs,
lost time from work, access to care, and side effects from medications. Individuals who believe
that the benefits of going to a healthcare practitioner outweigh the costs are more likely to
consult a healthcare practitioner (Campbell and Roland 1996).
Health Insurance Status
Insurance status has been found to have a significant impact on whether an individual
consults a healthcare practitioner. The uninsured are less likely to consult physicians and much
Cantor 16
less likely to seek care for life threatening symptoms. Hafner-Eaton (1993) performed a study
that determined the link between insurance status and physician consultations for three classes of
individuals: chronically ill, acutely ill, and healthy nonelderly. The author found that the
uninsured were less likely to attend a physician within the previous 12 months. In addition
utilization by the uninsured was influenced by health of the individual. Those who were
chronically ill and uninsured or healthy and uninsured were nearly half as likely to consult a
physician as individuals who were chronically ill and insured or healthy and insured. The larger
disparity between the groups was with the uninsured healthy and insured healthy. However the
author proceeds to conclude that more research must be done to determine whether this is a result
of individual choice.
To review, it appears as though there are wide arrays of factors that influence the
likelihood of an individual to visit a healthcare practitioner. These include but are not limited to
gender, race, age, income, marital status, and size of social networks. In addition it appears as
though healthcare status and other psychological characteristics play an important role on
consultation rates for an individual. I hope to shed some more light on the effects of these
characteristics in my paper. But it will also be vital to control for each of these characteristics
when determining the effect of DTC print advertising on doctor visits.
Impact of DTC Advertising on Antidepressant Use:
Public opinion on both potential causes and treatments for depression has changed
significantly from the early 1990s. In their study Marcus and Blumner (2009) found an increase
in beliefs that depression was caused biologically and that pharmaceutical treatments are
Cantor 17
available to fight the disease. Other studies have also made similar discoveries on this subject
(Mojitabi 2009). Marcus and Blumner (2009) conclude that DTC advertising may be a major
cause of why individuals have developed new opinions on the causes and treatments available
for depression. It has been specualated that the more antidepressant advertisements an individual
were exposed to the more prevalent the individual perceives the advertised disease to be (An
2008). Park and Grow (2008) conducted a study investigating whether or not exposure to print
forms of anti-depressant advertising led to inflated perceptions of the prevalence and lifetime
risk of depression and found a positive association with a perception of having a lifetime risk of
depression (Park and Grow 2008).
There are two potential ways DTC advertising for antidepressants can increase demand
for the product: 1) increase the likelihood an individual initiates treatment and 2) increase
utilization among individuals already taking antidepressants. Using the Medical Expenditure
Panel Survey (MEPS), Meyerhoefer and Zuvekas (2008) attempt to measure how advertising
affects an undiagnosed individual’s decision to visit a physician for a check-up. The authors
conclude that DTCA for antidepressants does increase the likelihood an individual initiate’s
treatment. Though there is an increase in the likelihood of initiating treatment, this does not
necessarily increase utilization for those who are already taking antidepressants. In all, the main
premise the authors stress is that the demand curve for individuals is shifted outward and rotated
counterclockwise as a result of antidepressant DTC advertising.
In a study to determine the impact of individual-level exposure to DTC advertising on the
use of antidepressants, Avery, et al. (2009) found the impact of ad exposure differed by gender.
The authors used exposure measures taken at the individual level and determined the likelihood
of an individual self diagnosing themselves with depression and use of medications. In addition
Cantor 18
the authors utilized both print and media exposure measures to test their hypothesis. They find
that females were more likely to identify themselves as being depressed than males. Secondly,
they find that DTC advertising exposure increased the probability of self diagnosis of depression
for both genders. Finally they find similar significant effect in both print and television DTC ad
exposure, although television effects were stronger. This suggests that antidepressant DTC
advertising has an influence on individual self diagnoses for depression (Avery et al. 2009). This
study uses the same datasets as Avery et al. (2009) to determine the influence of DTC
advertising for antidepressants on physician visits.
The impact of DTC advertising on physician visits:
The key relationship that I hope to identify in this study, is to understand the relationship
between individual exposure to DTC advertising and the likelihood of a visit to a healthcare
practitioners. Most previous studies measure DTC advertising at the market level. This study will
examine the exogenous effects of DTC advertising exposure at the individual level on the
likelihood of visiting a healthcare practitioner.
Compared to other predictors of physician visits, DTC advertising seems to have a
relatively large effect. In a study conducted by Weisman, Blumental, Silk, Zapert, et al. (2003)
the authors determined that nearly 35 percent of physician visits for their survey sample were
due to DTC advertising. The respondents also reported that they spoke to other sources to gauge
whether or not a certain health issue was serious enough to consult a physician about. These
influences included: friends and family (51%), broadcast media (40%), print media (34%),
pamphlets in doctors’ office (33%), another doctor (33%), the internet (16%), and pharmacists
Cantor 19
(17%). Of those who had been exposed to DTC advertising, nearly half of the respondents stated
that they were “highly influenced” by DTC advertising in discussing the medication with their
healthcare practitioner. Those who classified themselves in good health seemed to be highly
susceptible to DTC advertising and were more likely than others to have a discussion about
pharmaceutical treatments than about other health concerns. The authors classified a DTC
advertising visit as one in which the individual requested an advertised medication and was
prescribed the medication. For almost every individual who had a DTC advertising visit, there
was some sort of action taken by the healthcare practitioner.
It is also important to identify whether or not individuals who are exposed to DTC
advertising and go to a physician receive a prescription for the medication they are seeking.
Kravitz, Epstein et al. (2005) performed a randomized controlled study in which they measured
the effects of patients’ DTC advertising requests and their impact on a physicians’ initial
treatment decision for depression. Antidepressants were more likely to be prescribed for
individuals who displayed major depression compared to other disorders. More importantly, the
authors determined that if the patient verbalized a specific request for a particular drug the
physician was statistically more likely to prescribe that brand. Overall prescribing was higher
among patients who made a request for a particular brand or a general request for a
pharmaceutical. The authors investigated whether DTC advertising caused individuals with
trivial problems to receive prescribed medications without needing them. They found that this
was more often the case when the disorder the patient appeared to suffer from was ambiguous to
the doctor.
In a survey of a nationally representative sample of physicians regarding events
associated with DTC advertising visits, Weismann et al. (2004) found that physicians prescribed
Cantor 20
the requested advertised drug in 39% of visits. Within that sample of physicians, 46% stated that
the DTC advertised drug was the most effective. Likewise within the sample of physicians who
prescribed the requested drug, 48% stated that alternatives were as effective as the requested
medication, but prescribed that medication to meet the patient’s request. Over 70% of the
respondents stated they felt DTC advertising helped educate patients about possible treatments.
25% of DTC advertising visits eventually resulted in a new diagnosis. Depression was one of the
ten most common ailments diagnosed due to a DTC advertising visit. The most common reason
for not prescribing the requested pharmaceutical was that there was a cheaper alternative or a
more effective drug.
The paper most relevant to the current study was done by Iizuka and Jin (2005). The
authors employed TNS Media Intelligence/Competitive Media Reporting (CMR) monthly DTC
advertising data from 1995-2000 and the National Ambulatory Medical Care Survey (NAMCS).
In the study the authors determined how much DTC advertising influenced individuals to go to
the doctor by running a series of linear regressions. The authors eventually conclude that DTC
advertisement expenditures are linked with an increased number of doctor visits. When
quantified, a $28 increase in monthly DTC advertising spending corresponds to one patient visit
within 12 months. Likewise the authors concluded that the market-expanding effect that they
found was consistent across different demographic groups.
A more recent paper on this subject conducted by Hosken and Wendling (2009)
examined the effects of DTC advertising on the likelihood of an individual going for a medical
check-up. The authors utilized data from TNS and the MEPS. The authors found that drug
advertising has a statistically significant positive effect on the likelihood that consumers visited a
physician for a check-up. In fact if expenditures for DTC advertising were to increase by 10%,
Cantor 21
the authors conclude that this would increase the likelihood of visiting a physician for a check-up
by close to 7.5%. The groups that were most responsive to DTC advertising were women and the
highly educated. In addition whites and African-Americans were more likely to visit a physician,
while there appeared to be no effect on the Hispanic population. Finally insurance status
appeared to have no effect on the likelihood of men going for a check-up, but did for women.
Though the authors were able to control for individual characteristics and the likelihood of a
consultation, they still lack a link to individual exposure measures. In addition the authors also
lacked any form of an antitest to ensure that their results could be considered valid.
Data
Individual-level Data
To determine exposure to DTC advertisements this study will link reported individual
readership behavior to antidepressant and cholesterol advertisements appearing in magazines the
individual reports reading in the Simmons National Consumer Survey (NCS). The NCS uses a
nationally representative cross-sectional survey design. I will be using data from eight of the
waves of the survey spanning mid-2003 to mid- 2007. The NCS data contains demographic
characteristics that will be used as control variables in the regressions. The NCS asks
respondents several question regarding physician visits. The respondents are asked to check off
from a list the type of healthcare professionals they consulted with for any ailments in the last 12
months. Within that sub-sample the respondents were asked about several practitioners of note.
Did the respondent go to a general practitioner in the past 12 months; did the respondent go to a
nurse practitioner in the past 12 months; did the respondent go to a podiatrist in the past 12
months; and, did the respondent go to an internist in the past 12 months. The survey also asks
Cantor 22
how often the respondent reads each of a number of specific magazines. For descriptive statistics
for the entire sample of the NCS please refer to Table 1.
DTC Print Ads
Print advertisement data for antidepressants medications was taken from the Ithaca
Smoking Cessation Advertisements Database (SCADS). This databank is located at Cornell
University in Ithaca, New York. Within the dataset there is a digital representation for every
pharmaceutical advertisement that appeared in print between January 1995 and 2009 in 26 of the
top read consumer magazines in the United States, which in turn represents approximately 50%
of national U.S. readership.
Potential exposure over the past 12 months is measured by merging information on DTC
advertisements that appeared in specific issues of the 26 magazines the respondent reported
reading. Each respondent in the NCS reported how many issues of each magazine they read on
average out of the past four issues. I then calculate a fraction for the number of issues read for
each of the respondents and multiply that fraction by the number of DTC advertisements for
antidepressants that appeared in that magazine during the past year. Therefore this study assumes
that the individual maintains the readership intensity of each of these magazines for the entire
year that they did for the previous four issues.
The reader should keep in mind that the data presented here will only be from the 26
most popularly read magazines in the United States. In doing so I would assume that our findings
may underestimate actual total exposure if the individual reads more magazines other than those
in the SCADS dataset. However I may be overestimating our total exposure since I am unable to
Cantor 23
be sure that the individual actually viewed the advertisements in the magazine. Likewise as
specified above, I will be using information on what fraction of the last four issues of a magazine
the respondent reported reading as a proportion of the advertisements in that issue the respondent
was exposed to when all four issues were not read. In addition I would assume that there will be
some measurement error in our magazine exposure measure, but I also assume that this will not
be correlated with the likelihood of a doctor visit.
Another limitation of our study is that I measure potential, not actual DTC advertising
exposure. I am not able to determine whether the respondent actually saw the advertisements in
the magazine. I assume then that the exposure measure for print DTC advertising overestimates
the actual exposure. However this is a more objective measure of what the total number of
advertisements the respondent was exposed to, when compared to other subjective measures
used in other studies.
The key questions that I hope to answer in this study are:
Whether the effects of exposure are different for each healthcare practitioner I intend to
investigate. The two types are: general practitioner, and an other practitioner (includes both
internist and nurse practitioner).
Whether or not the effects of DTC advertising for antidepressants differ by gender. Similar
differential effects of DTC advertising have been found in past literature, most notably Avery et
al (2009). Likewise females are more likely to visit a healthcare practitioner and more likely to
suffer from depression.
Methods
Outcomes:
Cantor 24
The goal of this paper is to examine the relationship of DTC print advertisement
exposure on the likelihood of visiting a healthcare practitioner. The outcome variables I use are
whether the respondent has visited a general/family practitioner in the past 12 months, and
whether the individual has gone to some other practitioner. The other practitioner is a
combination of both internists and nurse practitioners. The interest of this paper is to look at the
effects for different types of healthcare practitioners who could provide a prescription for an
antidepressant. In this case both internist and nurse practitioners are able to do so, but they serve
as a better comparison to general practitioners after being combined rather than separate. In
addition I examine whether or not an individual has gone to a podiatrist in the past 12 months as
a reliability test for the print exposure measures. Visits to podiatrists presumably should not be
influenced by the number of print antidepressant advertisements an individual is exposed to.
A possible limitation of using these variables for our analysis is that the respondent may
have visited a physician for some other reason not related to depression in the last year, and the
variable may include doctor visits they went to with a spouse, child or acquaintance due to their
illness and that are not specifically related to the respondent’s health condition.
Explanatory Variables:
The key explanatory variables are the exposure measures. The antidepressant exposure
measures are available between the Spring of 2003 through the Spring of 2007. They will be
presented in the following manner. For the entire sample, the exposure measures will be
separated into three indicator variables for ease of presentation. The baseline comparison will be
individuals that were not exposed to any print exposure in the past year. We will compare this
Cantor 25
group using two separate variations of exposure. One defined by exposure to the mean number of
ads or less. The second indicator variable will be one represented by individuals who are exposed
to more than the mean number of ads. Since this study will examine the effects by gender, these
dummies will be presented for the entire sample, the male sample only, and the female sample
only. The results for the antidepressant exposure measures will be presented in the following
results section. Since the marginal effect of one ad does not necessarily notify me anything
specifically about DTC advertising. When compared to grouping the advertisements into dummy
variables I will be able to generate a better understanding of what the effect of DTC advertising
was on the likelihood of visiting a healthcare practitioner. The assumption that I am making with
the dummy is that people who are exposed to zero ads will have different effects than those who
were exposed to less than the mean as well as those who were exposed to more than the mean
number of advertisements.
I investigated two alternative specification of the exposure measure: first a log linear
specification; next a quadratic relationship. This is in order to examine whether the relationship
between our variables of interest and dependent variables is linear or some other function form.
Independent Variables
Demographic control variables:
The demographic variables used in the analysis include gender, age, race/ethnicity,
education, marital status, family size, employment status, insurance status, region, income, and
whether the individual reported suffering from any ailments, all factors that have been found to
be related to physicians visits in the literature. The reason why I need to include demographic
Cantor 26
variables as controls is to isolate the effects of my key explanatory variable, the exposure
measures.
Based on past literature, demographic factors are highly correlated with depressive
symptoms. Gender has been listed in the past as a predictor of depression. Females are
significantly more likely to suffer from depression, compared to their male counterparts
(National Institute of Mentcal Health 2006). If the individual is of low socio-economic-status
they are much more likely to suffer from depression. More than one out of seven poor Americans
suffer from depression (Pratt and Brody 2008). Individuals who were unemployed also were
more likely to be depressed (Kessler et al. 2003). Married females and single males are more
likely to suffer from depression (McGrath et al. 1990). The Centers for Disease Control and
Prevention (2009) reported that Non-Hispanic whites were more likely to have been diagnosed
with depression than any other ethnic groups. Hispanics are also more likely to suffer from
depression when compared to African-Americans. Finally it appears as though the likelihood of
depression decreases as the age of the individual increases (Blazer et al. 1994).
Controls for health conditions:
In this study the control for health condition was generated by creating a dummy variable
for whether the respondent of the survey suffered from any type of ailment. One limitation of
this model is that my indicator for health status will be presents in both my dependent variable as
well as an independent variable. Therefore the effect for this particular indicator will be
endogenous within the model. As a result models have been run that both include this control
and without this control separately. I would expect that there should be some more variation
explained in the model controlling for health conditions as opposed to the model that does not
Cantor 27
control for health conditions of the respondent. But regardless the any ailment variable should
have a positive effect in that if an individual suffers from some ailment, they are more likely to
visit a healthcare practitioner.
Controls for readership intensity:
In this study I control for readership intensity, by generating a variable for the total
number of magazines that the individual reported reading over the past year. Therefore I summed
the number of issues read across magazines to come up with a continuous variable for readership
intensity. This variable is an imperfect indicator of readership, because it only uses a subsample
of the number of issues that the respondent reported reading and extrapolates it over the past
year. However it is necessary to include this indicator in my model because it explains some
variation in my dependent variable. More importantly it allows me to look at the variation
between two individuals who looked at the same number of issues of magazines last year but
different magazines and therefore a different number of advertisements. I would expect however
that as the number of magazines the respondent looked at over the past year increases, the
likelihood of an individual visiting a healthcare practitioner will also increase.
Fixed effects for magazines read:
The magazine fixed effects were generated, by creating dummy variables for whether the
respondent looked at each of the magazines within our SCADS database over the past number of
issues. Therefore dummy variables were created for each of the magazines specified in the
dataset. If the individual read one of the past 4 issues then they were given a value of “1” for that
particular magazine and “0” otherwise. In addition I ran a with magazine category fixed effects
and without the magazine fixed effects. Here I would expect that more variation would be

Cantor 28
explained by looking at the magazine fixed effects as opposed to the magazine category fixed
effects. It may be beneficial to look at the magazine category fixed effects model because some
of the advertisers are targeting by using specific types of magazines and not just the magazine
itself. The magazine fixed effect model is a stronger model, but it will be nice to look at the
magazine fixed effects model as well as another indicator for targeting.
Empirical Model
The model I investigate is:
Prob(Vi) = α + βPi + δFi + φRIi + μWi + φ2ME + εi
Vi = a indicator variable for whether the respondent went to: 1 = general practitioner; 2 = nurse
practitioner or internist; 3 = podiatrist
P = vector of print advertising exposure measures
F = vector of demographic variables
RI = number of issues read of all magazines in the past year
W = NCS wave dummies
P = vector of print advertising exposure measures
ME = Magazine fixed effects
ε = idiosyncratic error term.
Cantor 29
This model contains the strongest controls for targeting that I have available. The
intention of this model is to observe the effects of the exposure measures while including
controls for the readership of specific magazines. I hope to determine whether the same
individuals who read the same number of issues of magazines but read different magazines or
different issues of the same magazine will reveal effects of antidepressant advertisements. The
variation in this model derives from which magazines the individual reads and the number of
advertisements within those specific magazines. With this model we expect to find our clearest
indication of the true effects of antidepressant advertisements on the likelihood of an individual
visiting a healthcare practitioner.
Model Estimation
I estimated the model using OLS, probit and logit algorithms. In the results section I will
present the marginal effects for the probit models that are easier for the reader to interpret than
logit estimates. In one of the research questions I explore the effects of exposure to DTC
advertising by gender. I run each of my models using specifications for the entire sample, the
male sample only, and the female sample only.
Reliability Tests
I ran one reliability tests for my exposure measures. The test determines whether or not
the antidepressant advertisements have an effect on the likelihood of visiting a healthcare
practitioner not associated with depression, a podiatrist.
Cantor 30
Results
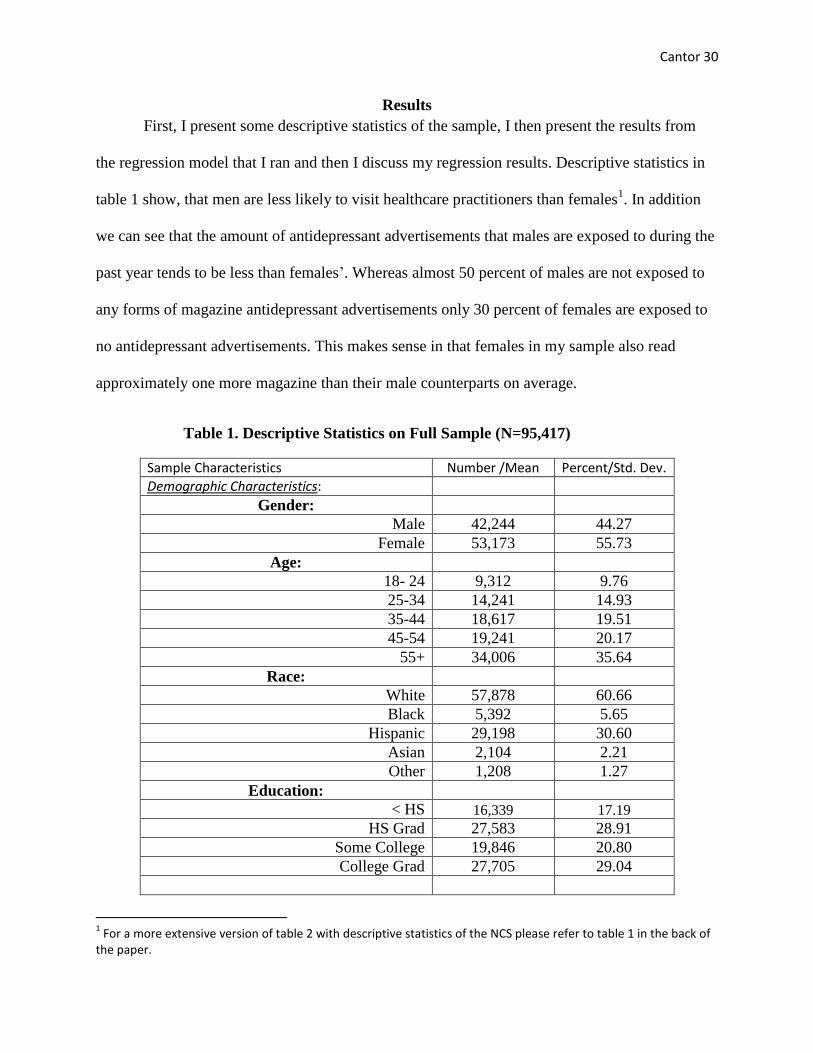
First, I present some descriptive statistics of the sample, I then present the results from
the regression model that I ran and then I discuss my regression results. Descriptive statistics in
table 1 show, that men are less likely to visit healthcare practitioners than females1. In addition
we can see that the amount of antidepressant advertisements that males are exposed to during the
past year tends to be less than females’. Whereas almost 50 percent of males are not exposed to
any forms of magazine antidepressant advertisements only 30 percent of females are exposed to
no antidepressant advertisements. This makes sense in that females in my sample also read
approximately one more magazine than their male counterparts on average.
Table 1. Descriptive Statistics on Full Sample (N=95,417)
Sample Characteristics Number /Mean Percent/Std. Dev.
Demographic Characteristics:
Gender:
Male 42,244 44.27
Female 53,173 55.73
Age:
18- 24 9,312 9.76
25-34 14,241 14.93
35-44 18,617 19.51
45-54 19,241 20.17
55+ 34,006 35.64
Race:
White 57,878 60.66
Black 5,392 5.65
Hispanic 29,198 30.60
Asian 2,104 2.21
Other 1,208 1.27
Education:
< HS 16,339 17.19
HS Grad 27,583 28.91
Some College 19,846 20.80
College Grad 27,705 29.04
1 For a more extensive version of table 2 with descriptive statistics of the NCS please refer to table 1 in the back of
the paper.
Cantor 31
Sample Characteristics Number /Mean Percent/Std. Dev.
Health Insurance:
No 24,706 25.89
Yes 70,711 74.11
Number in household: 3.563 1.900
Employment:
Not Employed 35,752 37.47
Employed 59,665 62.53
Marital status:
Single 12,105 12.69
Married 67,392 70.63
Separated 1,417 1.49
Divorced 7,780 8.15
Widowed 6,070 6.36
Region:
North 6,530 19.30
South 34,956 36.63
Midwest 21,335 22.36
West 20,091 21.06
Home Ownership:
Rent 24,337 25.51
Own 71,080 74.49
Self reported suffering from depression 7,419 7.78
Respondent suffers from some form of
ailment 63,443 66.49
Readership Characteristics:
Number of Issues Read 4.810 5.523
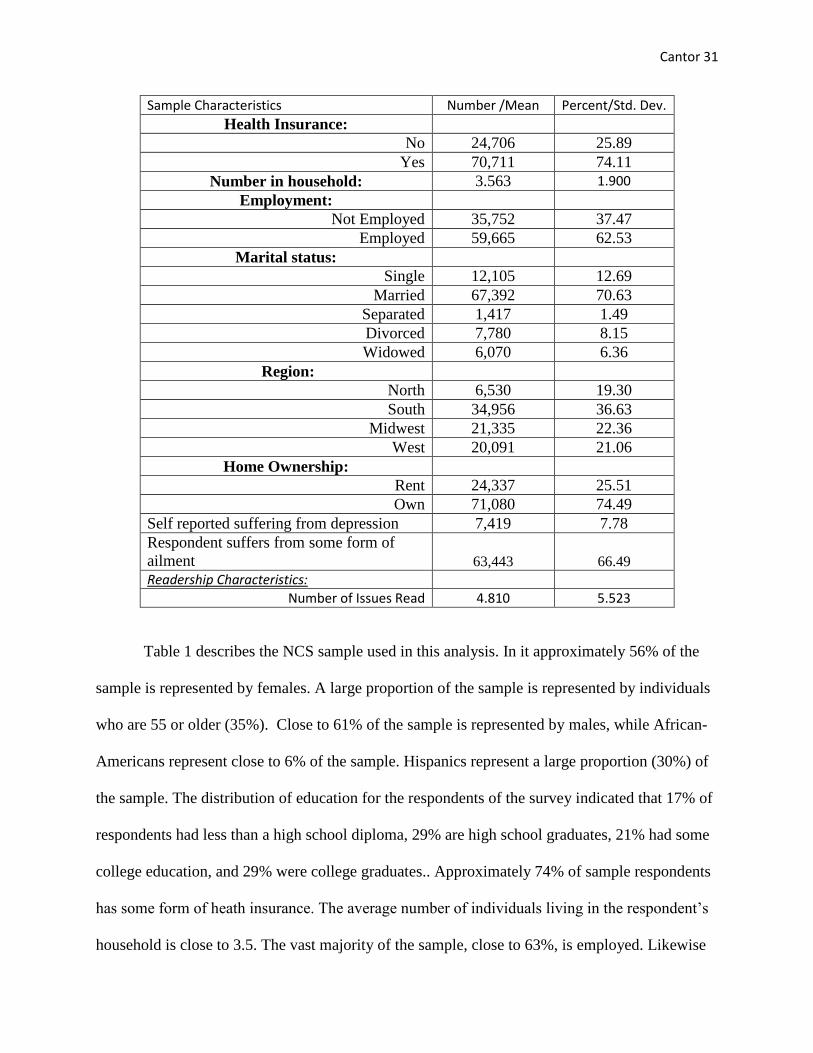
Table 1 describes the NCS sample used in this analysis. In it approximately 56% of the
sample is represented by females. A large proportion of the sample is represented by individuals
who are 55 or older (35%). Close to 61% of the sample is represented by males, while African-
Americans represent close to 6% of the sample. Hispanics represent a large proportion (30%) of
the sample. The distribution of education for the respondents of the survey indicated that 17% of
respondents had less than a high school diploma, 29% are high school graduates, 21% had some
college education, and 29% were college graduates.. Approximately 74% of sample respondents
has some form of heath insurance. The average number of individuals living in the respondent’s
household is close to 3.5. The vast majority of the sample, close to 63%, is employed. Likewise
Cantor 32
the majority of the sample is married (71%). Also of interest for this study is that close to 5% of
the sample have been treated for depression in the past 12 months. Approximately 8% of the
sample suffers from depression, whereas close to two thirds of the sample suffer from some
ailment reported in the NCS survey. Finally, the mean number of magazine issues that
respondents reported reading was close to 4.81 issues in the last year.
Table 2. Descriptive Statistics: Dependent variables and exposure measures
Dependent Variables:
Full Sample
(N=95,417)
Male Sample
(N=42,244)
Female Sample
(N=53,173)
Number Percent Number Percent Number Percent
Visit to general practitioner 35,733 37.45 14,631 34.63 21,102 39.69
Visit to practitioner 11,407 11.95 3,926 9.29 7,481 14.07
Visit to a podiatrist 3,712 3.89 1,265 2.99 2,447 4.60
Exposure Measures:
No exposure to DTC
antidepressant ads 36,876 38.65 21,652 51.25 15,224 28.63
Exposure to < mean number of
DTC antidepressant ads 31,573 33.09 9,928 23.50 21,374 40.20
Exposure to = or > mean number
DTC antidepressant ads 26,968 28.26 10,664 25.24 16,575 31.17
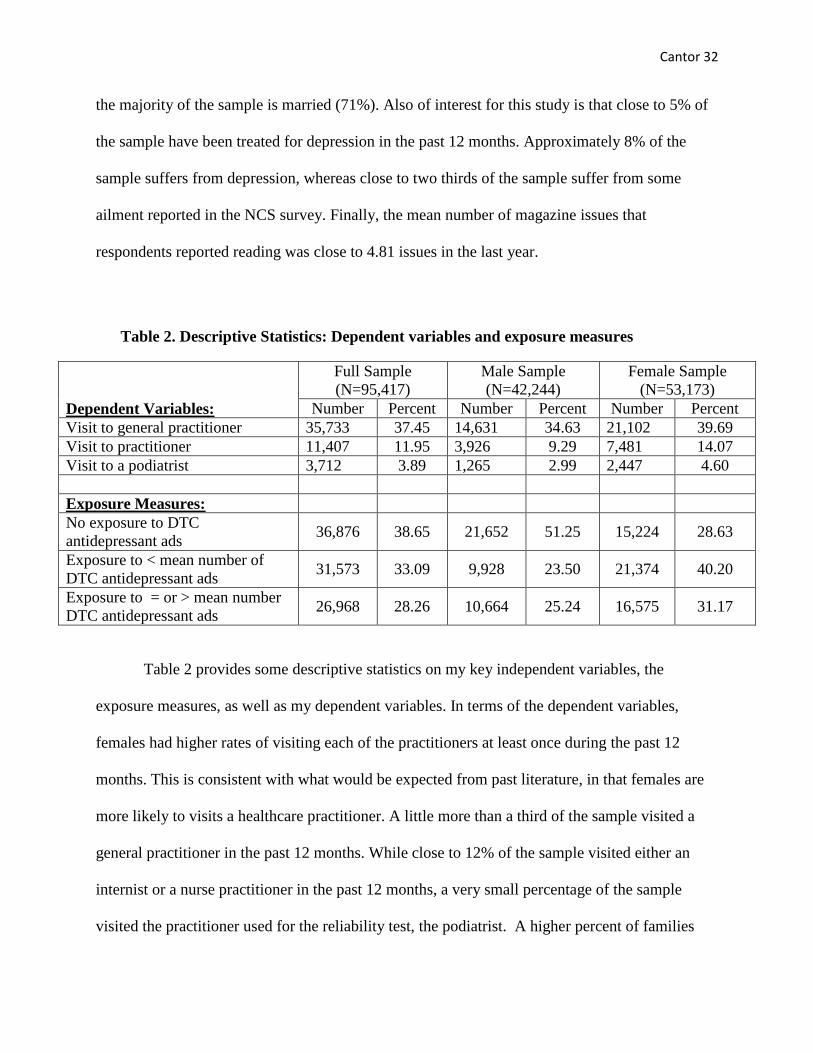
Table 2 provides some descriptive statistics on my key independent variables, the
exposure measures, as well as my dependent variables. In terms of the dependent variables,
females had higher rates of visiting each of the practitioners at least once during the past 12
months. This is consistent with what would be expected from past literature, in that females are
more likely to visits a healthcare practitioner. A little more than a third of the sample visited a
general practitioner in the past 12 months. While close to 12% of the sample visited either an
internist or a nurse practitioner in the past 12 months, a very small percentage of the sample
visited the practitioner used for the reliability test, the podiatrist. A higher percent of families
Cantor 33
reported visiting a doctor (40% general practitioner; 14% practitioner; 5% podiatrist)) than
males (35% general practitioner; 9% practitioner; 3% podiatrist)) in the sample,
Approximately 39% of the sample was not exposed to an antidepressant advertisement in
the past 12 months, while 61% were. Females in the sample (51%) were twice as likely to be
exposed to antidepressant advertisements as their male counterparts (29%). Less than half of the
male sample was exposed to a single DTC advertisement for antidepressants. In comparison,
more than half of the female sample was exposed to at least one antidepressant advertisement.
This could be due to targeting of the female population by the pharmaceutical companies
because females are more likely to be depressed, or because females the NCS sample read one
more magazine issue per month on average than their male counterparts.
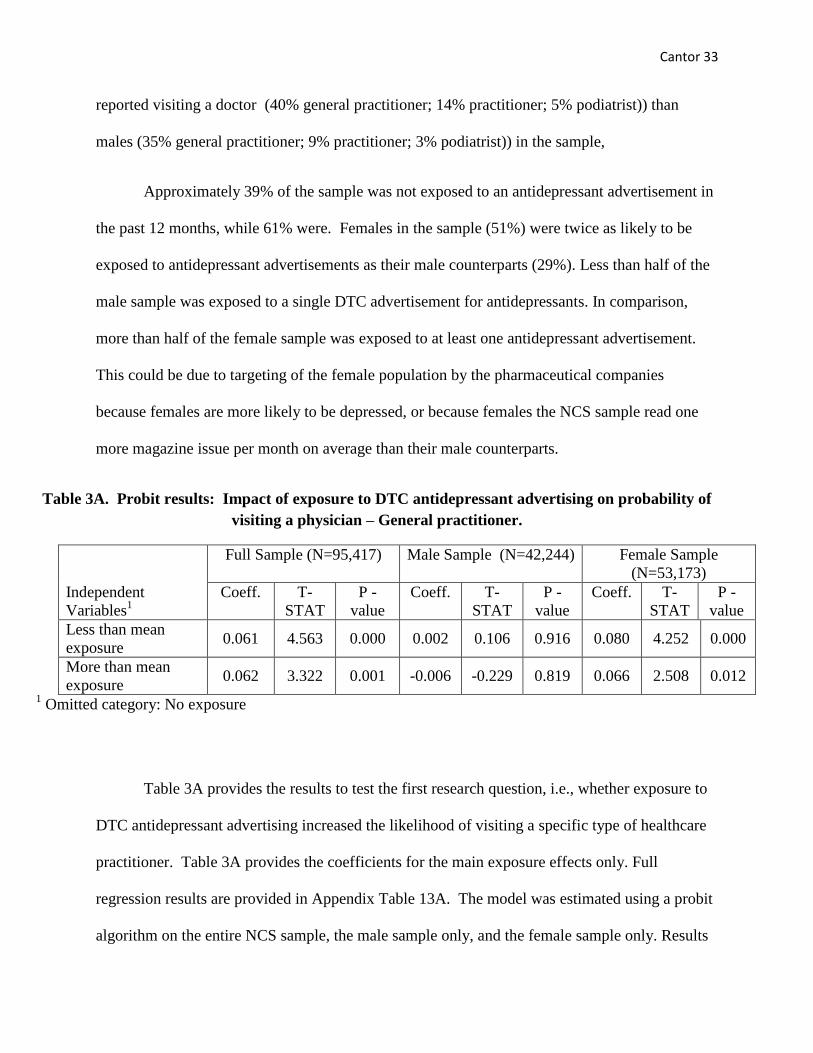
Table 3A. Probit results: Impact of exposure to DTC antidepressant advertising on probability of
visiting a physician – General practitioner.
Independent
Variables1
Full Sample (N=95,417) Male Sample (N=42,244) Female Sample
(N=53,173)
Coeff. T-
STAT
P -
value
Coeff. T-
STAT
P -
value
Coeff. T-
STAT
P -
value
Less than mean
exposure 0.061 4.563 0.000 0.002 0.106 0.916 0.080 4.252 0.000
More than mean
exposure 0.062 3.322 0.001 -0.006 -0.229 0.819 0.066 2.508 0.012
1 Omitted category: No exposure
Table 3A provides the results to test the first research question, i.e., whether exposure to
DTC antidepressant advertising increased the likelihood of visiting a specific type of healthcare
practitioner. Table 3A provides the coefficients for the main exposure effects only. Full
regression results are provided in Appendix Table 13A. The model was estimated using a probit
algorithm on the entire NCS sample, the male sample only, and the female sample only. Results
Cantor 34
indicate that the likelihood of visiting a general practitioner for the entire NCS sample increases
by 6.1% if the respondent was exposed to less than the mean exposure, when compared to an
individual who did not view any DTC advertisements for antidepressants. Likewise this
percentage goes up slightly for individuals who are exposed to greater than the mean number of
advertisements (6.2%). I conclude from these results that there is evidence to support the
hypothesis that, controlling for targeting, exposure to DTC antidepressant advertising does have
a modest impact on general practitioner visits. The data indicates no significant effects of
exposure to DTC advertisements for the male sample on the likelihood of visiting a general
practitioner. On the other hand females who are exposed to less than the mean number of ads are
significantly more likely (8%) to visit a general practitioner. Even more surprising is that the
magnitude of this effect is smaller (6.6%) if the female respondent is exposed to more than the
mean number of DTC advertisements. It appears as though the effects of DTC advertising on the
likelihood of visiting a general practitioner are indeed differentiated by gender.
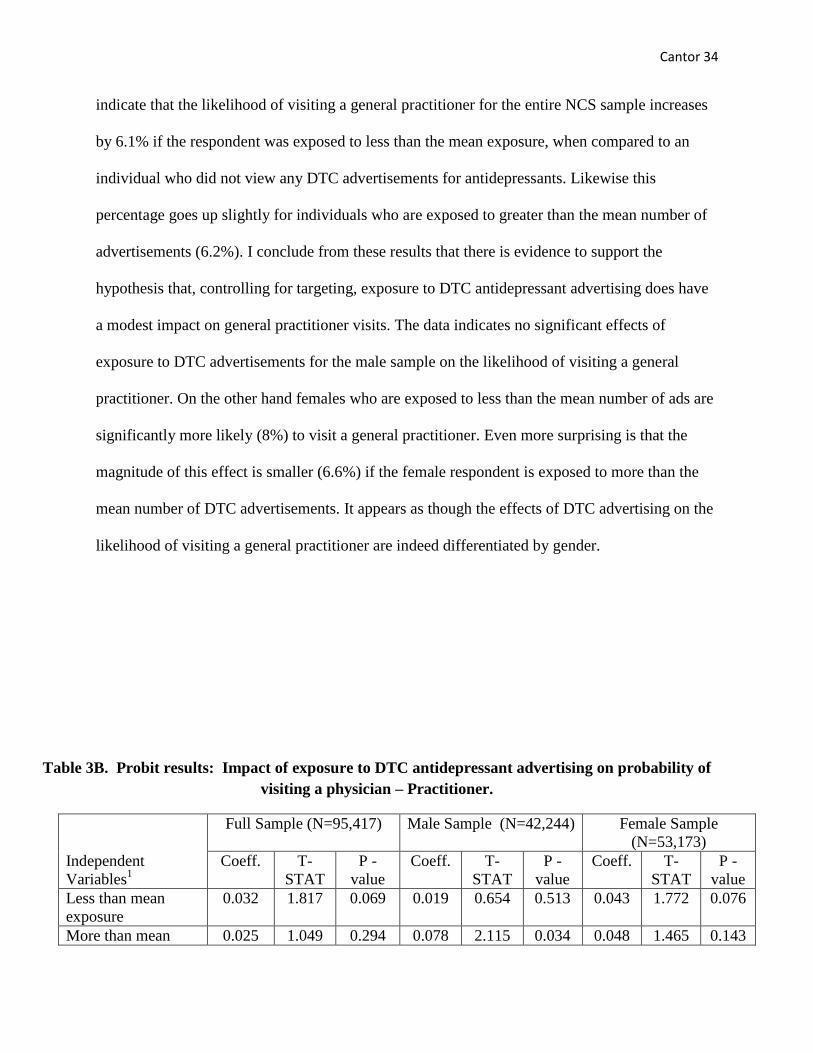
Table 3B. Probit results: Impact of exposure to DTC antidepressant advertising on probability of
visiting a physician – Practitioner.
Independent
Variables1
Full Sample (N=95,417) Male Sample (N=42,244) Female Sample
(N=53,173)
Coeff. T-
STAT
P -
value
Coeff. T-
STAT
P -
value
Coeff. T-
STAT
P -
value
Less than mean
exposure
0.032 1.817 0.069 0.019 0.654 0.513 0.043 1.772 0.076
More than mean 0.025 1.049 0.294 0.078 2.115 0.034 0.048 1.465 0.143
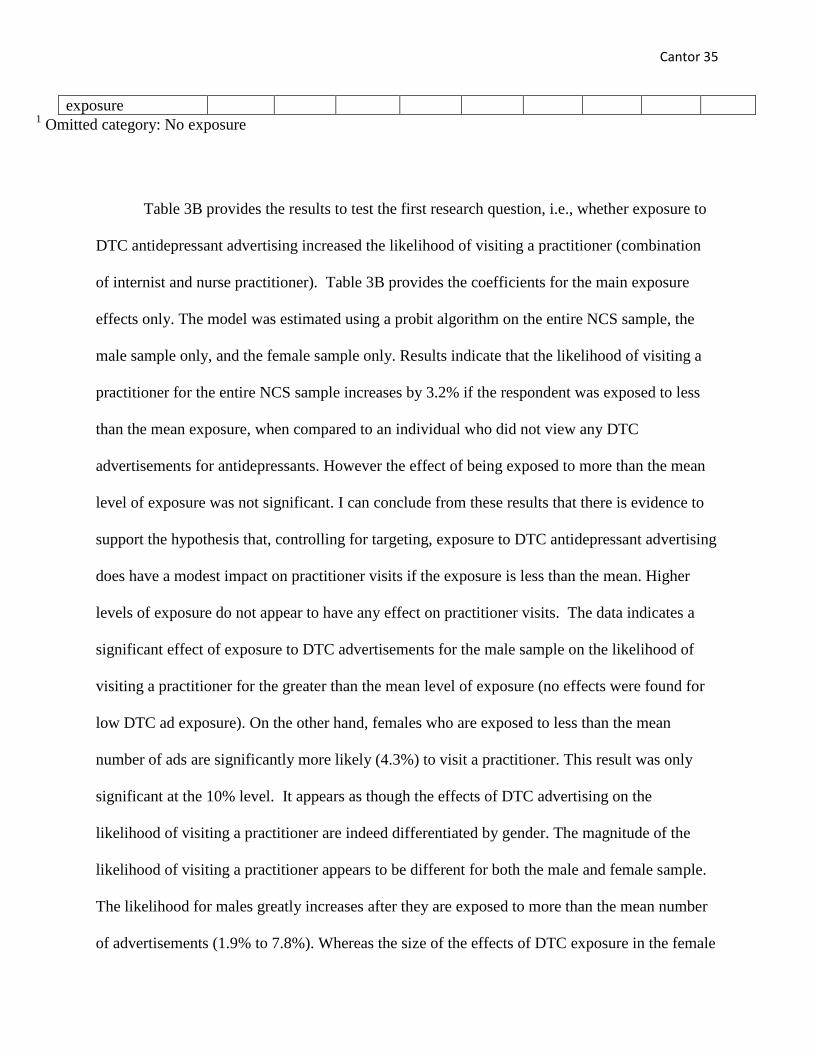
Cantor 35
exposure 1 Omitted category: No exposure
Table 3B provides the results to test the first research question, i.e., whether exposure to
DTC antidepressant advertising increased the likelihood of visiting a practitioner (combination
of internist and nurse practitioner). Table 3B provides the coefficients for the main exposure
effects only. The model was estimated using a probit algorithm on the entire NCS sample, the
male sample only, and the female sample only. Results indicate that the likelihood of visiting a
practitioner for the entire NCS sample increases by 3.2% if the respondent was exposed to less
than the mean exposure, when compared to an individual who did not view any DTC
advertisements for antidepressants. However the effect of being exposed to more than the mean
level of exposure was not significant. I can conclude from these results that there is evidence to
support the hypothesis that, controlling for targeting, exposure to DTC antidepressant advertising
does have a modest impact on practitioner visits if the exposure is less than the mean. Higher
levels of exposure do not appear to have any effect on practitioner visits. The data indicates a
significant effect of exposure to DTC advertisements for the male sample on the likelihood of
visiting a practitioner for the greater than the mean level of exposure (no effects were found for
low DTC ad exposure). On the other hand, females who are exposed to less than the mean
number of ads are significantly more likely (4.3%) to visit a practitioner. This result was only
significant at the 10% level. It appears as though the effects of DTC advertising on the
likelihood of visiting a practitioner are indeed differentiated by gender. The magnitude of the
likelihood of visiting a practitioner appears to be different for both the male and female sample.
The likelihood for males greatly increases after they are exposed to more than the mean number
of advertisements (1.9% to 7.8%). Whereas the size of the effects of DTC exposure in the female
Cantor 36
sample were the same for both low (4.3%) and high (4.8%) exposure, only low exposure was
moderately significant in the female sample.
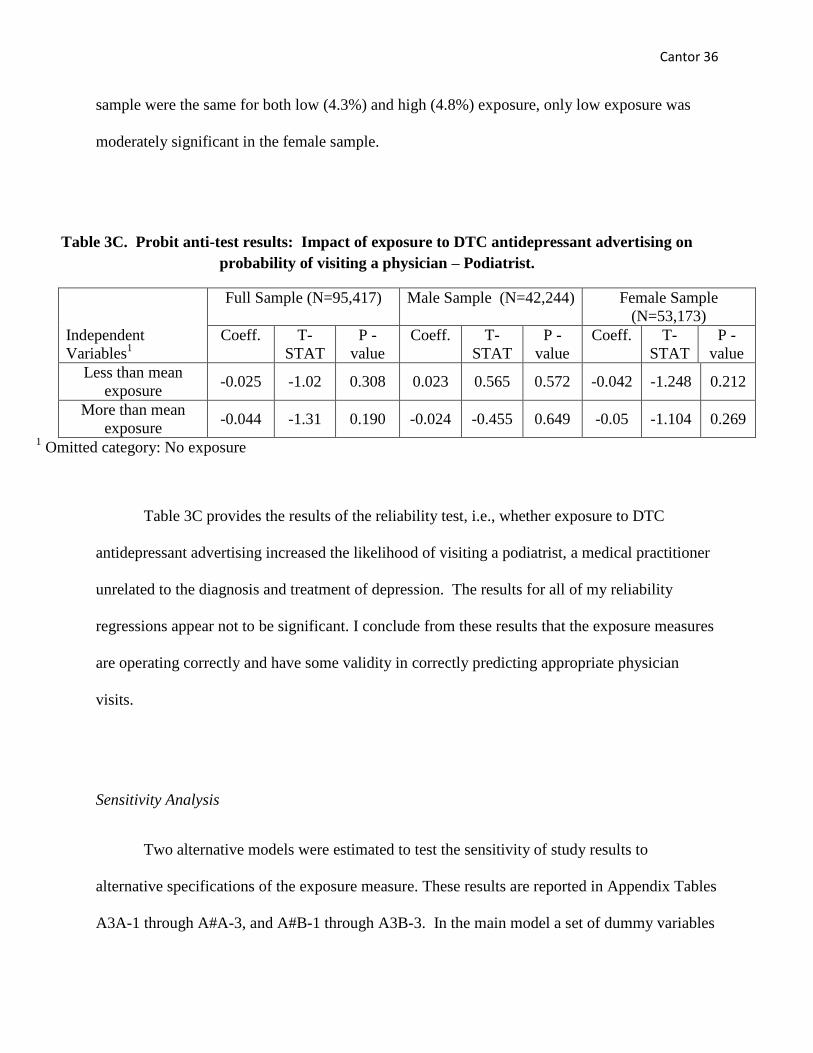
Table 3C. Probit anti-test results: Impact of exposure to DTC antidepressant advertising on
probability of visiting a physician – Podiatrist.
Independent
Variables1
Full Sample (N=95,417) Male Sample (N=42,244) Female Sample
(N=53,173)
Coeff. T-
STAT
P -
value
Coeff. T-
STAT
P -
value
Coeff. T-
STAT
P -
value
Less than mean
exposure -0.025 -1.02 0.308 0.023 0.565 0.572 -0.042 -1.248 0.212
More than mean
exposure -0.044 -1.31 0.190 -0.024 -0.455 0.649 -0.05 -1.104 0.269
1 Omitted category: No exposure
Table 3C provides the results of the reliability test, i.e., whether exposure to DTC
antidepressant advertising increased the likelihood of visiting a podiatrist, a medical practitioner
unrelated to the diagnosis and treatment of depression. The results for all of my reliability
regressions appear not to be significant. I conclude from these results that the exposure measures
are operating correctly and have some validity in correctly predicting appropriate physician
visits.
Sensitivity Analysis
Two alternative models were estimated to test the sensitivity of study results to
alternative specifications of the exposure measure. These results are reported in Appendix Tables
A3A-1 through A#A-3, and A#B-1 through A3B-3. In the main model a set of dummy variables
Cantor 37
was used to capture exposure effects. The use of dummy variables for no. low, and high
exposure allows the relationship between exposure and the probability of a doctor visit to be
parsed out at different intervals, and how it compares to not being exposed to any advertisements
over the past year. Here I was assuming that the difference between being exposed to one or two
advertisements may be relatively unimportant. But by grouping the number of ads into different
groups of high exposure and low exposure and comparing them both to the no exposure group, it
will be a better indicator of determining whether or not DTC advertising has an effect on the
likelihood of visiting a healthcare practitioner. In the second specification (Appendix Tables
A3A-1 through A3A-3) the continuous exposure measure was subjected to a log liner
transformation. This transformation allows the relationship between exposure and the
probability of doctors to have diminishing marginal effects. This would imply that the
distribution of the normal curve is positively skewed. In the third model (Appendix Tables A3B-
1 through A3B-3) I used a quadratic transformation. This transformation assumes the
relationship between exposure and the probability of a doctor visit to be one where the effects of
DTC advertisements will increase to a certain point and then begin to decline. I want to
determine if any of these particular effects are true in the case of DTC advertising exposure, and
that is why I intend to explore them.
Results indicate that the entire sample of the model for both the general practitioner and
podiatrist are responsive to a log linear transformation. Likewise it appears as though the male
sample is not sensitive whatsoever to this particular transformation. The female sample however
was sensitive for both the general practitioner as well as the podiatrist. Again similar to the
results above it appears as though exposure to DTC advertising for antidepressants has some
effect on the likelihood of visiting a general practitioner for both the entire sample as well as the
Cantor 38
female sample. There is no significant effect for the male sample. It is important to note however
that for the reliability test (the podiatrist), that the significant effects were negative, implying that
an increase in exposure to DTC advertisements for antidepressants decreased the likelihood of
visiting a healthcare practitioner If the effects were positive, I would be more concerned that the
exposure measures were not operating correctly. By using the log linear transformation and
generating significant effects, we see that there are some diminishing marginal effects, but it is
very small.
In terms of the quadratic sample, there are very small effects for the squared number of
advertisements exposed to on the likelihood of visiting a healthcare practitioner. However it does
appear as though the female sample was sensitive on the likelihood of visiting a podiatrist in that
it decreased the likelihood of visiting the podiatrist. If the opposite were the case and there was a
positive significant effect, that would be more disconcerting in regards to the exposure measures
not operating correctly. But since this is not the case I would be less concerned that the exposure
measures are operating incorrectly. The effect was also sensitive on the likelihood of visiting a
podiatrist for the entire sample as well. Finally the male sample appeared to be sensitive to this
transformation when it influenced the likelihood of visiting a practitioner. Like the log linear
transformation there is some significant variation explained by using this transformation, but the
effects are also relatively small.
Summary
In this work, I tested whether exposure to DTC advertising for antidepressant products
affects the probability of an individual visiting a particular type of healthcare practitioner. In
Cantor 39
addition I tested whether these effects were different for male and female populations. I also used
a reliability measures to test the validity, of my results and it appears as though the exposure
measures from my dataset are operating correctly. This study is novel in that it is the first to use
individual level data to detect the effects of DTC advertising. Primarily past research was done
utilizing market level data as opposed to individual level exposure measures. Whereas market
level data does not allow the investigator to draw a causal inference between DTC exposure and
whether an individual goes to a healthcare practitioner, our study is able to. It is important to
note that our study also has the ability to control for targeting by advertisers.
There are several important findings that I make as an attempt to build on existing
literature. It appears as though DTC advertising does have some influence on the likelihood of an
individual to visit a healthcare practitioner, specifically a general practitioner for females and a
practitioner for males. I am unable to tell with my data whether the outcome is socially desired or
not. For example, it could be that the ads led to visits by people for whom medication was
inappropriate or could have lead to diagnosis of other conditions. Another possibility is that
exposure will have an individual go to their general practitioner to discuss a health issue other
than depression. Secondly we find that the effects of DTC advertising are different for each
gender. Whereas DTC advertising appears to have little to no effect on the male population, it
does appear to have a large and significant effect on females even after using the strongest of
controls for targeting. This is consistent with findings in Avery et al (2009) that showed the
effect of DTCA on consumption of antidepressants also had larger impacts for females.
The findings of this study are important to consider in the policy arena. If DTC
advertising does have an influence on whether an individual goes to a healthcare practitioner, it
could become a powerful tool to encourage individuals to seek care. Depression is one of the
Cantor 40
most under diagnosed diseases in the world. It would be important for DTC advertising therefore
to be used on diseases that are under diagnosed. In addition DTC advertising could be targeted
towards populations that do not tend to visit healthcare practitioners often. This includes
minority populations. If officials can harness DTC advertising correctly it could be an extremely
valuable tool to ensure American’s either get healthy or remain healthy.
The contribution of my paper is the ability to use individual data to investigate the causal
impact of advertising exposure, on the likelihood of that individual visiting a healthcare
practitioner. I am able to do this by using two unique and distinct datasets that can generate
individual level exposure. By doing so I am able to look at individuals who are otherwise
completely the same that were exposed to a different number of print advertisements for
antidepressants during the past year. The key finding made is that individuals who are exposed
to DTC advertisements for antidepressants are more likely to visit certain types of healthcare
practitioners. However this effect appears to be primarily in females for the general practitioner
and primarily for the practitioner in males. It could be that females are more conscience of their
mental health or physical health status. Perhaps females are more susceptible to depression that
DTC advertising exposure convinces females to seek help for their affliction.
However due to the limitations of our data I am unable to fully conclude the effects of
DTC advertising. This is because I am unable to determine why the respondent went to their
general practitioner. In addition I lack the ability to determine the likelihood an individual goes
to visit a psychiatrist, since this form of practitioner is not present in my dataset. It is the hope of
this researcher that future research on this subject is able to improve on the causal link that we
have developed. More investigation should be done on the different effects DTC advertising has
on both male and female populations. This is the second study that has used individual level
Cantor 41
exposure to find effects differentiated by gender (Avery et al. 2009). Finally it would be the
recommendation of this researcher that this research be expanded to other pharmaceutical
categories. I hope to investigate other classes of pharmaceuticals in the future to determine
whether or not there are consistent effects across classes.
Works Cited
1. American Psychatric Association (2007), “Mental Health of Seniors” (accessed
March 4th
, 2010) [available at http://www.healthyminds.org]
2. An, Soontae. "Antidepressant Direct-to-Consumer Advertising and Social Perception
of the Prevalence of Depression: Application of the Availability Heuristic." Health
communication 23.6 (2008): 499-505
3. Anxiety and depression. in Centers for Disease Control and Prevention [database
online]. 2009 [cited December 1 2009]. Available from
http://www.cdc.gov/Features/dsBRFSSDepressionAnxiety/.
4. Auton, Frank. "Direct-to-Consumer Advertising (DTC advertising) of
Pharmaceuticals: An Updated Review of the Literature and Debate Since 2003."
Economic Affairs 26.3 (2006): 24-32.
5. Avery, Rosemary J., Donald S. Kenkel, Dean Lillard and Alan D. Mathios. 2007.
“Public profits and public health: does advertising smoking cessation products
encourage smokers to quit?” Journal of Political Economy, 115.3: 447-481.
6. Avery, Rosemary J., Matthew Eisenberg, and Kosali I. Simon. The Impact of DTC
Print and Television Advertising on Antidepressant Use. Working paper. 2009.
7. Barbara, Philip. “Antidepressant use doubles in US, study finds Thomas Reuters
Foundation. Web. <http://www.alertnet.org >.
8. Blazer, D. G., R. C. Kessler, K. A. Mcgonagle, and M. S. Swartz. “The prevalence
and distribution of major depression in a national community sample - the national
comorbidity survey.” American Journal of Psychiatry, 151.7 (1994): 979-86.
9. Block, Adam E. "Costs and Benefits of Direct-to-Consumer Advertising: The Case of
Depression." PharmacoEconomics, 25.6 (2007): 511-21.
10. Blumner, Kate H., and Steven C. Marcus. "Changing Perceptions of Depression: Ten-
Year Trends from the General Social Survey." Psychiatric Services, 60.3 (2009): 306-
12
11. Calfee, J. E. "An Assessment of Direct-to-Consumer Advertising of Prescription
Drugs." Clinical Pharmacology & Therapeutics, 82.4 (2007): 357-60.
12. Calfee, J.E. “Public Policy Issues in Direct-to-Consumer Advertising of Prescription
Drugs." Journal of Public Policy & Marketing 21.2 (2002): 174-93.
13. Campbell, Stephen M., and Martin O. Roland. "Why do People Consult the Doctor?"
Family practice 13.1 (1996): 75-83.
Cantor 42
14. Cross, Margaret. “Depression Programs Might Provide an Edge,” Managed Care
Magazine, 13.5 (2004), 52-53.
15. Davis, Joel J. "Riskier than we Think? The Relationship between Risk Statement
Completeness and Perceptions of Direct to Consumer Advertised Prescription
Drugs." Journal of Health Communication: International Perspectives 5.4 (2000):
349.
16. Dorling, D. 2009. Unemployment and health. BMJ (Clinical Research Ed.) 338, (Mar
10): b829.
17. Findlay, S. D. "Direct-to-Consumer Promotion of Prescription Drugs: Economic
Implications for Patients, Payers and Providers." PharmacoEconomics 19.2 (2001):
109-19.
18. Frosch, Dominick L., et al. "Creating Demand for Prescription Drugs: A Content
Analysis of Television Direct-to-Consumer Advertising." Annals of Family Medicine
5.1 (2007): 6-13.
19. Hafner-Eaton, C. "Physician Utilization Disparities between the Uninsured and
Insured - Comparisons of the Chronically Ill, Acutely Ill, and Well Nonelderly
Populations." Jama-Journal of the American Medical Association 269.6 (1993): 787-
92.
20. Holmer, Alan F. "Direct-to-Consumer Prescription Drug Advertising Builds Bridges
between Patients and Physicians." JAMA: Journal of the American Medical
Association 281.4 (1999): 380.
21. Iizuka, T., and G. Z. Jin. "The Effect of Prescription Drug Advertising on Doctor
Visits." Journal of Economics & Management Strategy 14.3 (2005): 701-27.
22. Prescription Drug Trends. Rep. no. 3057-07. Kaiser Family Foundation, 11 Sept.
2008. Web. 7 Sept. 2009. <http://www.kff.org>.
23. Lerner, Debra, David A. Adler, Hong Chang, Leueen Lapitsky, Maggie Y. Hood,
Carla Perissinotto, John Reed, Thomas J. McLaughlin, Ernst R. Berndt, and William
H. Rogers. “Unemployment, job retention, and productivity loss among employees
with depression.” Psychiatric Services 55.12 (2004): 1371-8.
24. Kaphingst, Kimberly A., and William DeJong. "The Educational Potential of Direct-
to-Consumer Prescription Drug Advertising." Health affairs 23.4 (2004): 143-50.
25. Kessler, Ronald C., Hagop S. Akiskal, Minnie Ames, Howard Birnbaum, Paul
Greenberg, Robert M. .A, Robert Jin, Kathleen R. Merikangas, Gregory E. Simon,
and Philip S. Wang. “Prevalence and effects of mood disorders on work performance
in a nationally representative sample of U.S. workers.” American Journal of
Psychiatry 163.9 (2006): 1561-8.
26. Kessler, Ronald C., Patricia Berglund, Olga Demler, Robert Jin, Doreen Koretz,
Kathleen R. Merikangas, A. John Rush, Ellen E. Walters, and Philip S. Wang. “The
epidemiology of major depressive disorder: Results from the national comorbidity
survey replication (NCS-R).” JAMA: The Journal of the American Medical
Association, 23 (2003): 3095-105.
27. Kravitz, R. L., and R. A. Bell. "Direct-to-Consumer Advertising of Prescription
Drugs: Balancing Benefits and Risks, and a Way Forward." Clinical Pharmacology &
Therapeutics 82.4 (2007): 360-2.
Cantor 43
28. Kravitz, Richard L., et al. "Influence of Patients' Requests for Direct-to-Consumer
Advertised Antidepressants: A Randomized Controlled Trial." JAMA: The Journal of
the American Medical Association.16 (2005): 1995-2002.
29. Linsenmayer, Mark, Matt Scheffrahn, Mary Elizabeth McLain and David Brenner.
“Frequency and Demographics of Depression: A Study of the UT-Austin GSLIS
Student Population.” (1999) Austin, TX: University of Texas-Austin.
30. Mack, John. DTC ad spending will decrease 9% in 2008 and 11% in 2009. in Pharma
Marketing News [database online]. [accessed March 17, 2010]. Available
from http://pharmamkting.blogspot.com.
31. Meyerhoefer, Chad D., and Samuel H. Zuvekas. “The shape of demand: What does it
tells us about direct-to-consumer marketing of antidepressants?” SSRN eLibrary.
32. McGrath, Ellen, Gwendolyn Puryear Keita, B. R. Stickland, and N. F. Russo (1990),
Women and Depression: Risk Factors and Treatment Issues. Washington, DC:
American Psychological Association.
33. Mental health: New understanding, new hope. 2001. Geneva: World Health
Organization, (accessed February 12, 2010).
34. Mojtabai, Ramin. "Americans' Attitudes Toward Psychiatric Medications: 1998-
2006." Psychiatric Services 60.8 (2009): 1015-23.
35. Morgan, Steven G. (2007), “Direct-to-consumer Advertising and Expenditures on
Prescription Drugs: A Comparison of Experiences in the United States and Canada,”
Open Medicine, 1(1), 37-45.
36. Murray, Elizabeth, et al. "Direct-to-Consumer Advertising: Public Perceptions of its
Effects on Health Behaviors, Health Care, and the Doctor-Patient Relationship." The
Journal of the American Board of Family Medicine 17.1 (2004): 6-18.
37. Nair, Radhika Anantharaman. "Evaluation of Factors Related to Prescription Drug
Expenditures, Prescribing Trends and Physician Visits: The Role of Direct-to-
Consumer Advertising Expenditures, Demographics, and Health Insurance
Coverage." Ph.D. The University of Texas at Austin, 2005.
38. National Institute of Mental Health (2006), “Depression,” (accessed November 14,
2009), <http://www.nimh.nih.gov/>.
39. National Institute of Mental Health (2008), “The Numbers Count: Mental Illness in
America,” (accessed November 14, 2009), [available at <http://www.nimh.nih.gov/ >.
40. Olfson, Mark, et al. "National Trends in the Outpatient Treatment of Depression."
JAMA: Journal of the American Medical Association 287.2 (2002): 203.
41. Olfson, Mark, and Steven C. Marcus. "National Patterns in Antidepressant
Medication Treatment." Archives of General Psychiatry 66.8 (2009): 848-56.
42. Park, J., and J. Grow. "The Social Reality of Depression: DTC Advertising of
Antidepressants and Perceptions of the Prevalence and Lifetime Risk of Depression."
Journal of Business Ethics 79.4 (2008): 379.
43. Pines, Wayne L. "Direct-to-Consumer Promotion: An Industry Perspective." Clinical
therapeutics 20.Supplement 3 (1998): C96-C103.
44. Polen, Hyla H., Nile M. Khanfar, and Kevin A. Clauson. "Impact of Direct-to-
Consumer Advertising (DTC advertising) on Patient Health-Related Behaviors and
Issues." Health marketing quarterly 26.1 (2009): 42-55.
Cantor 44
45. Pratt, Laura A., and Debra J. Brody. 2008. Depression in the United States household
population, 2005-2006. National Center for Health Statistics, 7 (accessed February
12, 2010).
46. Rosenthal, Meredith B., et al. "Promotion of Prescription Drugs to Consumers." The
New England journal of medicine 346.7 (2002): 498.
47. Sayer, Geoffrey P., and Helena Britt. "Sex Differences in Prescribed Medications:
Another Case of Discrimination in General Practice." Social science & medicine
45.10 (1997): 1581-7.
48. Simmons National Consumer Survey (2008), (accessed November 11, 2009),
[available at http://www.smrb.com/aspx/content.aspx?pid=5&page=Methodology].
49. Singer, Natasha. "Citing Risks, Lawmakers Seek to Curb Drug Commercials." New
York Times (2009): 1.
50. Thomas, Cindy Parks, Grant Ritter, and Stanley S. Wallack. "Growth in Prescription
Drug Spending among Insured Elders." Health affairs 20.5 (2001): 265.
51. Weissman, Joel S., et al. "Physicians Report on Patient Encounters Involving Direct-
to-Consumer Advertising." Health affairs (2004): W219.
52. Weissman, Joel S., et al. "Consumers' Reports on the Health Effects of Direct-to-
Consumer Drug Advertising." Health affairs (2003): W3_82
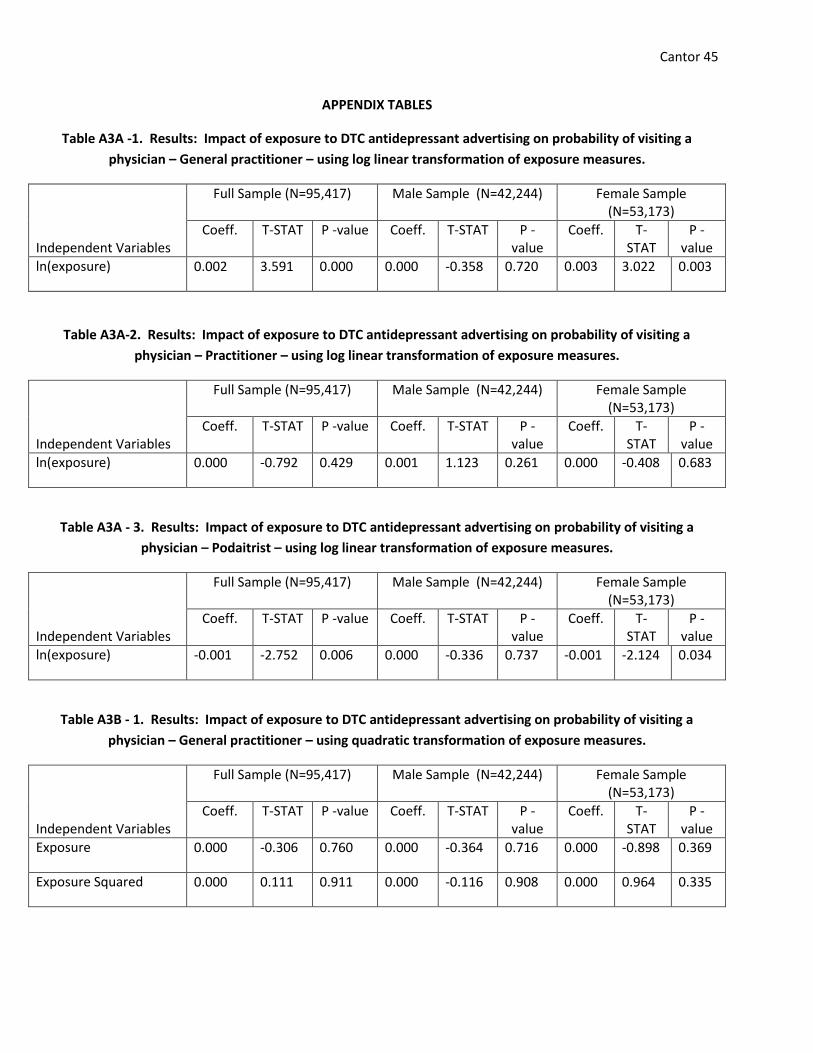
Cantor 45
APPENDIX TABLES
Table A3A -1. Results: Impact of exposure to DTC antidepressant advertising on probability of visiting a
physician – General practitioner – using log linear transformation of exposure measures.
Independent Variables
Full Sample (N=95,417) Male Sample (N=42,244) Female Sample (N=53,173)
Coeff. T-STAT P -value Coeff. T-STAT P -value
Coeff. T-STAT
P -value
ln(exposure) 0.002 3.591 0.000 0.000 -0.358 0.720 0.003 3.022 0.003
Table A3A-2. Results: Impact of exposure to DTC antidepressant advertising on probability of visiting a
physician – Practitioner – using log linear transformation of exposure measures.
Independent Variables
Full Sample (N=95,417) Male Sample (N=42,244) Female Sample (N=53,173)
Coeff. T-STAT P -value Coeff. T-STAT P -value
Coeff. T-STAT
P -value
ln(exposure) 0.000 -0.792 0.429 0.001 1.123 0.261 0.000 -0.408 0.683
Table A3A - 3. Results: Impact of exposure to DTC antidepressant advertising on probability of visiting a
physician – Podaitrist – using log linear transformation of exposure measures.
Independent Variables
Full Sample (N=95,417) Male Sample (N=42,244) Female Sample (N=53,173)
Coeff. T-STAT P -value Coeff. T-STAT P -value
Coeff. T-STAT
P -value
ln(exposure) -0.001 -2.752 0.006 0.000 -0.336 0.737 -0.001 -2.124 0.034
Table A3B - 1. Results: Impact of exposure to DTC antidepressant advertising on probability of visiting a
physician – General practitioner – using quadratic transformation of exposure measures.
Independent Variables
Full Sample (N=95,417) Male Sample (N=42,244) Female Sample (N=53,173)
Coeff. T-STAT P -value Coeff. T-STAT P -value
Coeff. T-STAT
P -value
Exposure 0.000 -0.306 0.760 0.000 -0.364 0.716 0.000 -0.898 0.369
Exposure Squared 0.000 0.111 0.911 0.000 -0.116 0.908 0.000 0.964 0.335

Cantor 46
Table A3B-2. Results: Impact of exposure to DTC antidepressant advertising on probability of visiting a
physician – Practitioner – using quadratic transformation of exposure measures.
Independent Variables
Full Sample (N=95,417) Male Sample (N=42,244) Female Sample (N=53,173)
Coeff. T-STAT P -value Coeff. T-STAT P -value
Coeff. T-STAT
P -value
Exposure 0.000 0.415 0.678 0.001 2.399 0.016 0.000 -0.839 0.402
Exposure Squared 0.000 0.247 0.805 0.000 -2.197 0.028 0.000 1.174 0.240
Table A3B-3. Results: Impact of exposure to DTC antidepressant advertising on probability of visiting a
physician – Podiatrist – using quadratic transformation of exposure measures.
Independent Variables
Full Sample (N=95,417) Male Sample (N=42,244) Female Sample (N=53,173)
Coeff. T-STAT P -value Coeff. T-STAT P -value
Coeff. T-STAT
P -value
Exposure 0.000 -1.621 0.105 0.000 0.794 0.427 -0.001 -2.258 0.024
Exposure Squared 0.000 1.820 0.069 0.000 -1.060 0.289 0.000 2.353 0.019