Embed Size (px)
Citation preview
Page 1 of 30
Does disagreement among oil price forecasters reflect future volatility? Evidence from the ECB Surveys
Tarek Atallah,1 Fred Joutz2 and Axel Pierru3
prepared for Research Program on Forecasting Brown Bag Seminar
Department of Economics, The George Washington University
March 6th 2013
This is new research and the first time any of it has been presented. Comments and suggestions welcome.
1 King Abdullah Petroleum Studies and Research Center (KAPSARC). 2 Scientific Visitor at KAPSARC & Department of Economics at The George Washington University. 3 King Abdullah Petroleum Studies and Research Center (KAPSARC).

Page 2 of 30
What information might we derive from crude oil price forecasts? Our Contribution:
1. We attempt to empirically address this issue using crude oil price forecasts from the European Central Bank’s Survey of Professional Forecasters (ECB SPF).
2. We suggest a simple method to measure the oil price volatility consistent with the
level of disagreement over the forecasted average price. Measuring disagreement among forecasters
1. Usually measured by the dispersion of point forecasts across the panel of respondents.
2. If the forecasters supply probabilities with point estimates so much the better.
Page 3 of 30
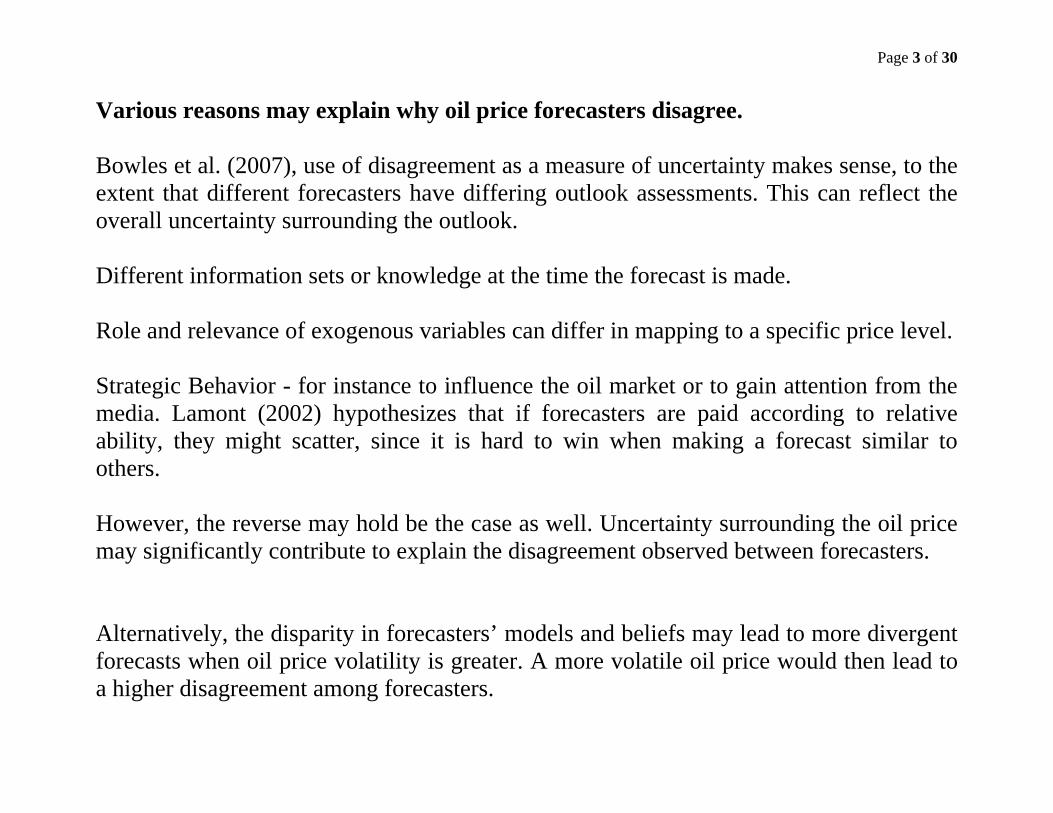
Various reasons may explain why oil price forecasters disagree. Bowles et al. (2007), use of disagreement as a measure of uncertainty makes sense, to the extent that different forecasters have differing outlook assessments. This can reflect the overall uncertainty surrounding the outlook. Different information sets or knowledge at the time the forecast is made. Role and relevance of exogenous variables can differ in mapping to a specific price level. Strategic Behavior - for instance to influence the oil market or to gain attention from the media. Lamont (2002) hypothesizes that if forecasters are paid according to relative ability, they might scatter, since it is hard to win when making a forecast similar to others. However, the reverse may hold be the case as well. Uncertainty surrounding the oil price may significantly contribute to explain the disagreement observed between forecasters. Alternatively, the disparity in forecasters’ models and beliefs may lead to more divergent forecasts when oil price volatility is greater. A more volatile oil price would then lead to a higher disagreement among forecasters.
Page 4 of 30
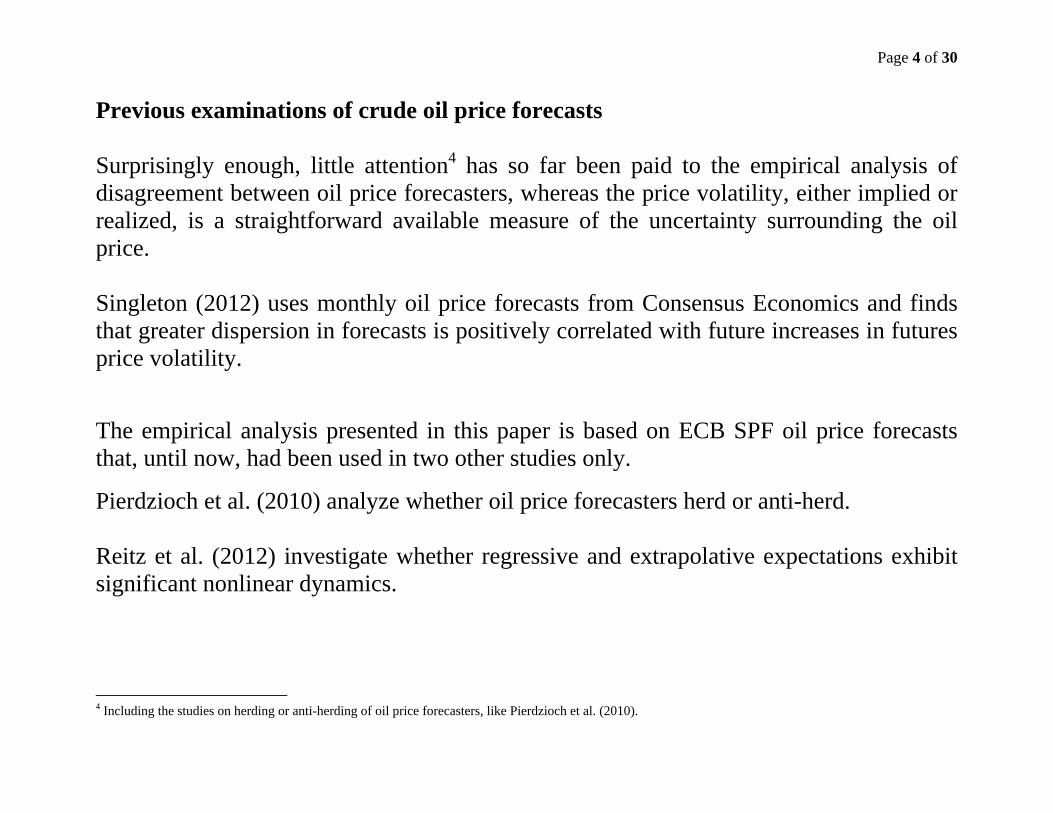
Previous examinations of crude oil price forecasts Surprisingly enough, little attention4 has so far been paid to the empirical analysis of disagreement between oil price forecasters, whereas the price volatility, either implied or realized, is a straightforward available measure of the uncertainty surrounding the oil price. Singleton (2012) uses monthly oil price forecasts from Consensus Economics and finds that greater dispersion in forecasts is positively correlated with future increases in futures price volatility.
The empirical analysis presented in this paper is based on ECB SPF oil price forecasts that, until now, had been used in two other studies only.
Pierdzioch et al. (2010) analyze whether oil price forecasters herd or anti-herd. Reitz et al. (2012) investigate whether regressive and extrapolative expectations exhibit significant nonlinear dynamics.
4 Including the studies on herding or anti-herding of oil price forecasters, like Pierdzioch et al. (2010).
Page 5 of 30
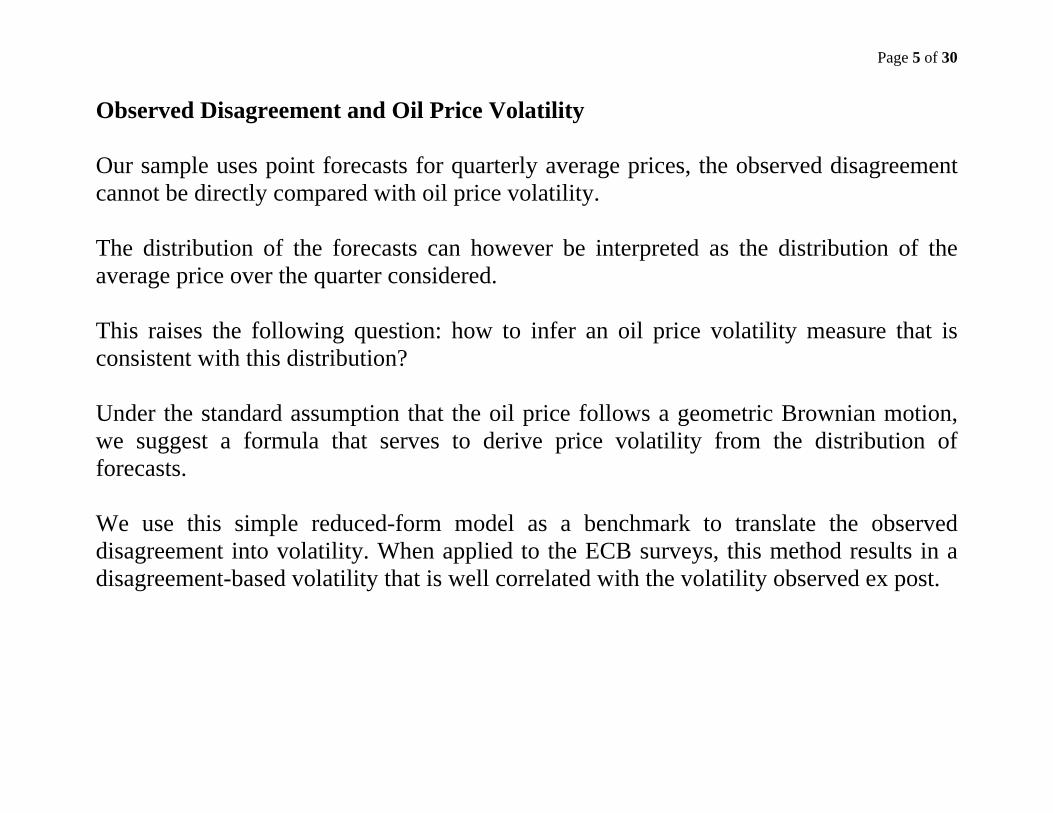
Observed Disagreement and Oil Price Volatility Our sample uses point forecasts for quarterly average prices, the observed disagreement cannot be directly compared with oil price volatility. The distribution of the forecasts can however be interpreted as the distribution of the average price over the quarter considered. This raises the following question: how to infer an oil price volatility measure that is consistent with this distribution? Under the standard assumption that the oil price follows a geometric Brownian motion, we suggest a formula that serves to derive price volatility from the distribution of forecasts. We use this simple reduced-form model as a benchmark to translate the observed disagreement into volatility. When applied to the ECB surveys, this method results in a disagreement-based volatility that is well correlated with the volatility observed ex post.
Page 6 of 30
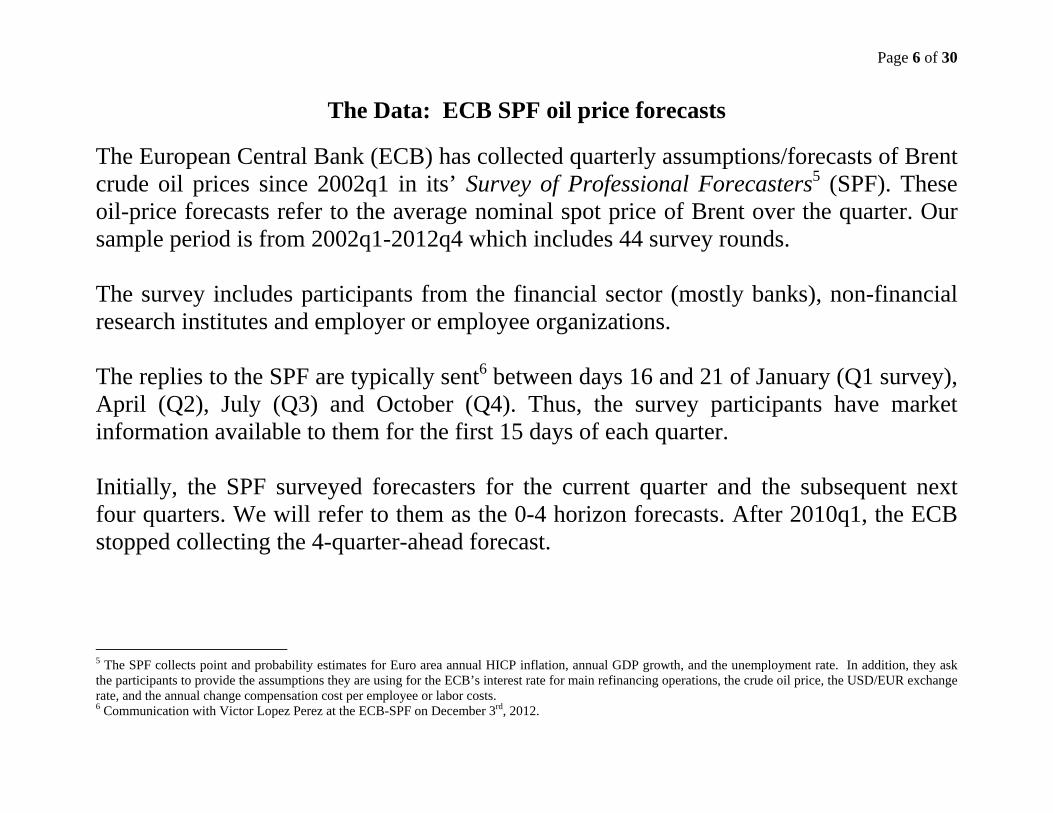
The Data: ECB SPF oil price forecasts The European Central Bank (ECB) has collected quarterly assumptions/forecasts of Brent crude oil prices since 2002q1 in its’ Survey of Professional Forecasters5 (SPF). These oil-price forecasts refer to the average nominal spot price of Brent over the quarter. Our sample period is from 2002q1-2012q4 which includes 44 survey rounds. The survey includes participants from the financial sector (mostly banks), non-financial research institutes and employer or employee organizations. The replies to the SPF are typically sent6 between days 16 and 21 of January (Q1 survey), April (Q2), July (Q3) and October (Q4). Thus, the survey participants have market information available to them for the first 15 days of each quarter. Initially, the SPF surveyed forecasters for the current quarter and the subsequent next four quarters. We will refer to them as the 0-4 horizon forecasts. After 2010q1, the ECB stopped collecting the 4-quarter-ahead forecast.
5 The SPF collects point and probability estimates for Euro area annual HICP inflation, annual GDP growth, and the unemployment rate. In addition, they ask the participants to provide the assumptions they are using for the ECB’s interest rate for main refinancing operations, the crude oil price, the USD/EUR exchange rate, and the annual change compensation cost per employee or labor costs. 6 Communication with Victor Lopez Perez at the ECB-SPF on December 3rd, 2012.
Page 7 of 30
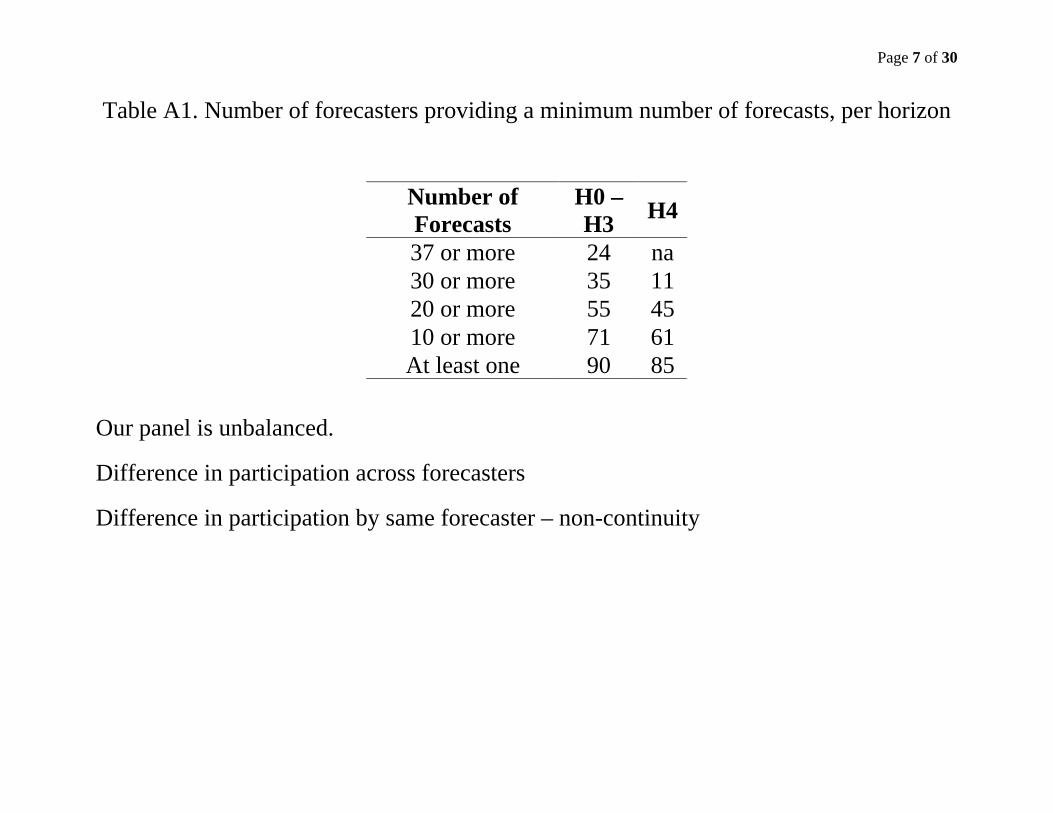
Table A1. Number of forecasters providing a minimum number of forecasts, per horizon
Number of Forecasts
H0 – H3 H4
37 or more 24 na 30 or more 35 11 20 or more 55 45 10 or more 71 61 At least one 90 85
Our panel is unbalanced.
Difference in participation across forecasters
Difference in participation by same forecaster – non-continuity
Page 8 of 30
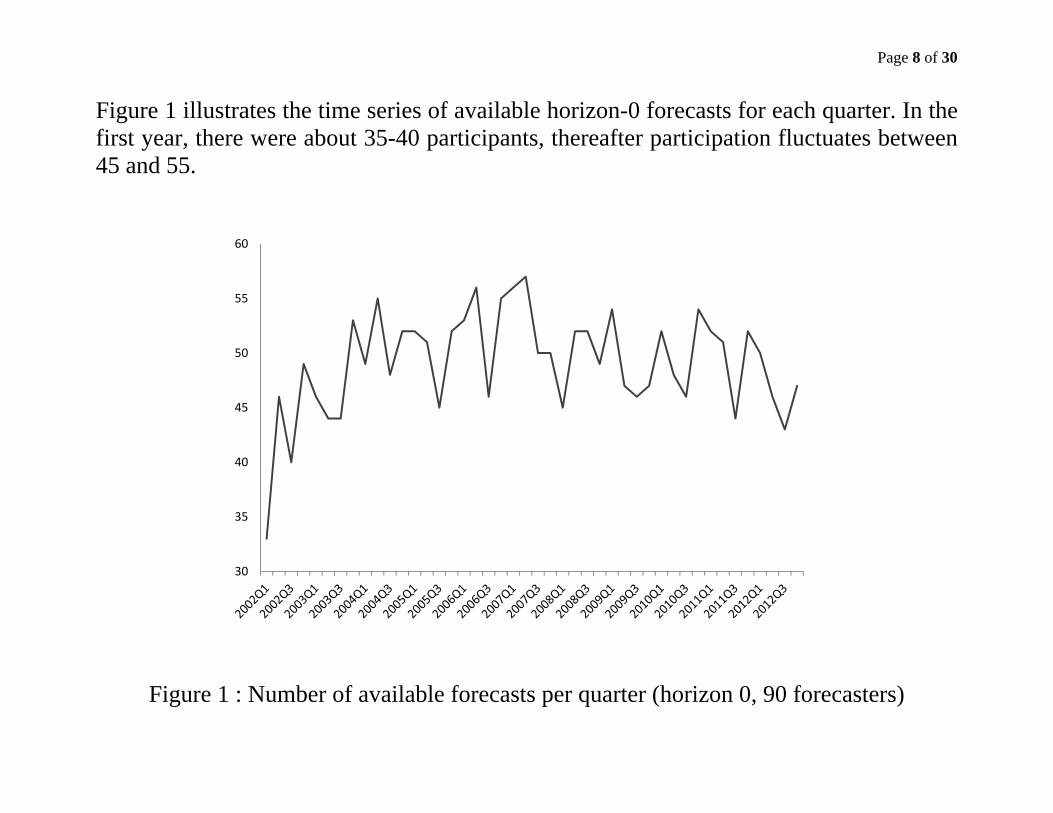
Figure 1 illustrates the time series of available horizon-0 forecasts for each quarter. In the first year, there were about 35-40 participants, thereafter participation fluctuates between 45 and 55.
Figure 1 : Number of available forecasts per quarter (horizon 0, 90 forecasters)
30
35
40
45
50
55
60
Page 9 of 30
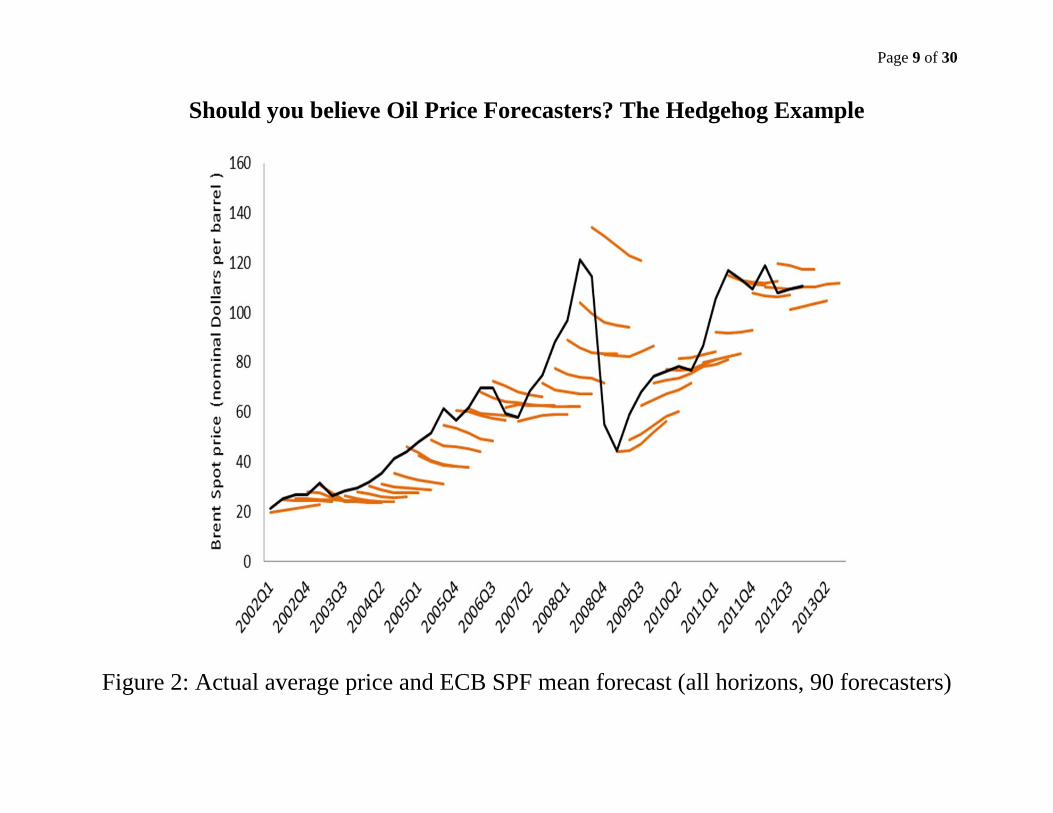
Should you believe Oil Price Forecasters? The Hedgehog Example
Figure 2: Actual average price and ECB SPF mean forecast (all horizons, 90 forecasters)
Page 10 of 30
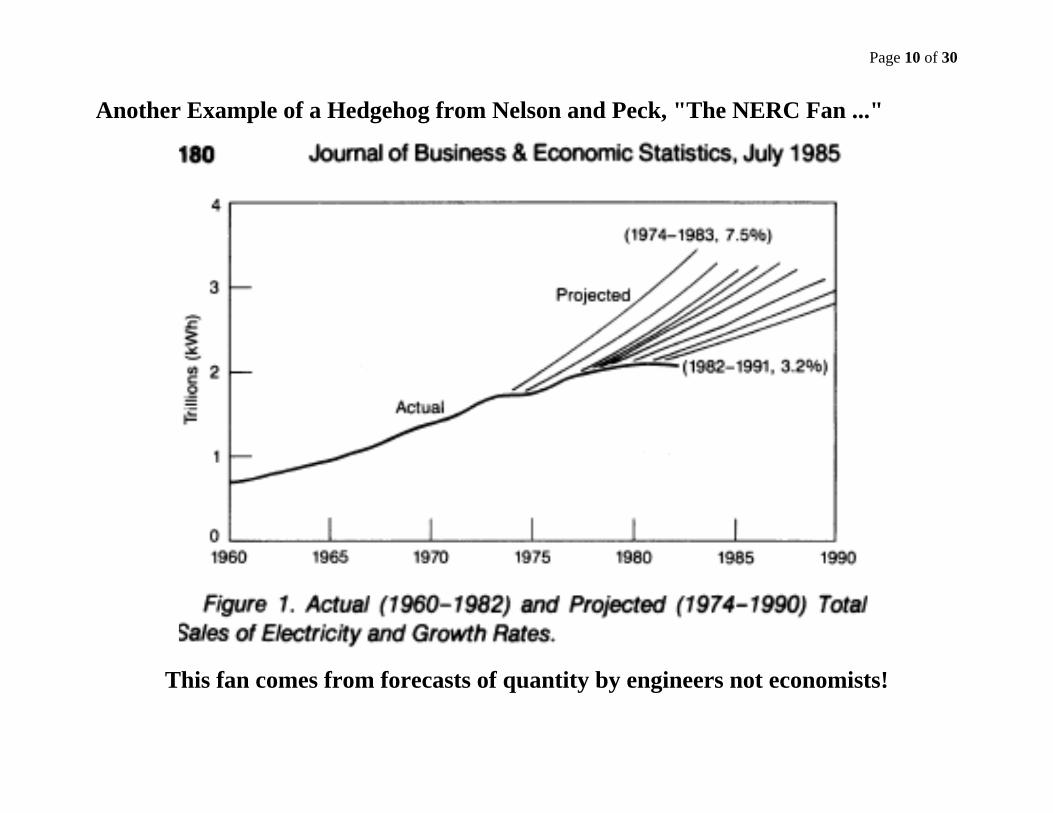
Another Example of a Hedgehog from Nelson and Peck, "The NERC Fan ..."
This fan comes from forecasts of quantity by engineers not economists!

Page 11 of 30
3. Dispersion of forecasts, disagreement index and forecast uncertainty
Let , be the number of forecasts made in quarter t for horizon h that are considered. The uth price forecast is denoted as , , . The dispersion of forecasts is captured by the standard deviation of forecasts , , with:
, ,
∑ , , ,, (1)
where , is the mean forecast value ∑ , ,
,
,.
Our measure7 of disagreement , in quarter t for horizon h is the ratio of the standard deviation of forecasts to the mean forecast:
, ,
, (2)
7 See for instance Siklos (2012) for alternative measures of forecast disagreement; note that the forecasters of the ECB professional survey only provide point estimates for the oil price, with no information on the underlying probability distributions.
Page 12 of 30
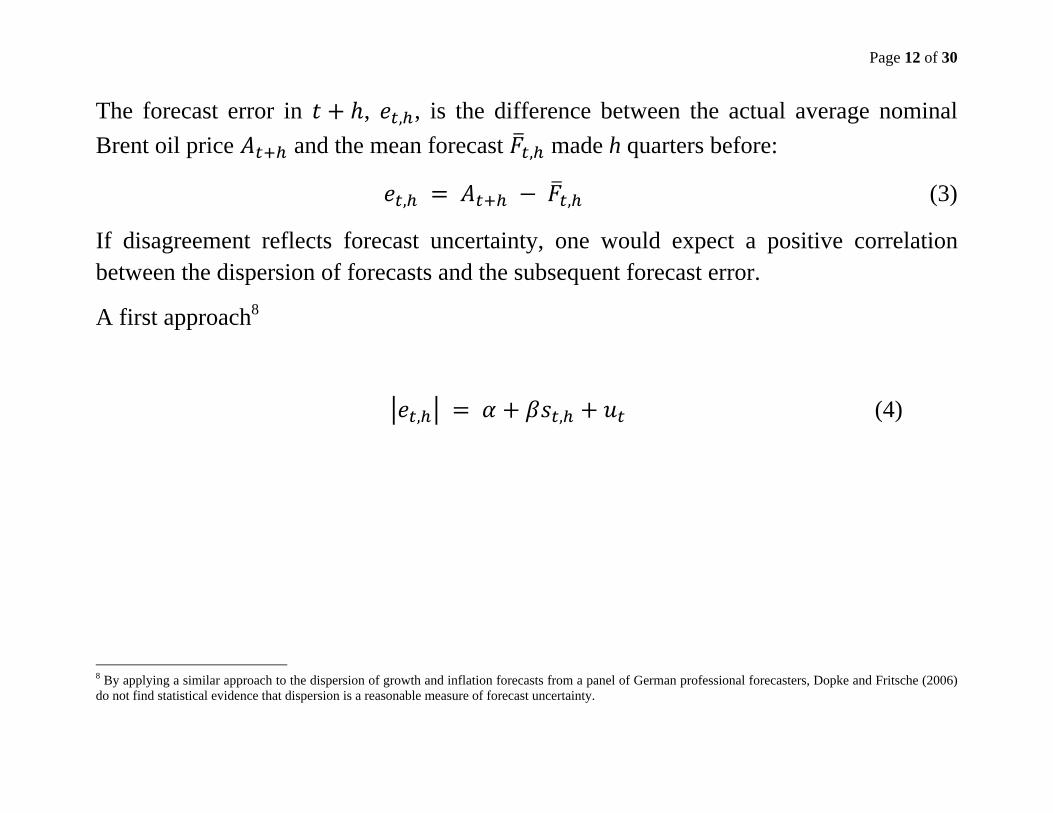
The forecast error in , , , is the difference between the actual average nominal Brent oil price and the mean forecast , made h quarters before:
, , (3)
If disagreement reflects forecast uncertainty, one would expect a positive correlation between the dispersion of forecasts and the subsequent forecast error.
A first approach8
, , (4)
8 By applying a similar approach to the dispersion of growth and inflation forecasts from a panel of German professional forecasters, Dopke and Fritsche (2006) do not find statistical evidence that dispersion is a reasonable measure of forecast uncertainty.
Page 13 of 30
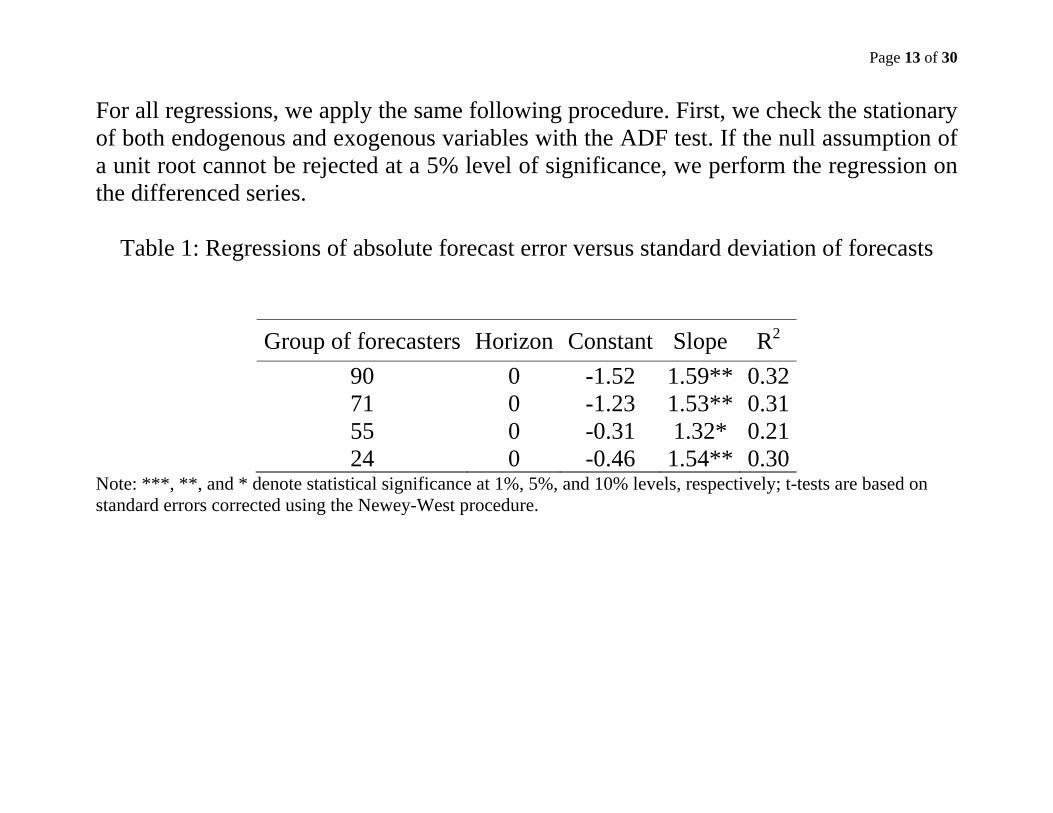
For all regressions, we apply the same following procedure. First, we check the stationary of both endogenous and exogenous variables with the ADF test. If the null assumption of a unit root cannot be rejected at a 5% level of significance, we perform the regression on the differenced series.
Table 1: Regressions of absolute forecast error versus standard deviation of forecasts
Group of forecasters Horizon Constant Slope R2 90 0 -1.52 1.59** 0.3271 0 -1.23 1.53** 0.3155 0 -0.31 1.32* 0.2124 0 -0.46 1.54** 0.30
Note: ***, **, and * denote statistical significance at 1%, 5%, and 10% levels, respectively; t-tests are based on standard errors corrected using the Newey-West procedure.
Page 14 of 30
4. Does ex-post realized volatility explain ex-ante disagreement?
First, we estimate the (realized) volatility observed ex-post. To do so, we use weekly prices, by considering the closing spot price of the last working day of every week in the quarter. The forecasts are assumed to be conditional upon all available information at the time the forecast is produced. Since we do not know the actual date of production of these forecasts, we consider two alternative assumptions: either the forecast is produced at the start of the quarter, or it is produced just before returning the questionnaire to the ECB. Let us consider any quarter t and let be the number of weekly prices observed from the start of quarter t until the end of the forecasted quarter at horizon h. We estimate the following two series of realized volatility, both computed as the standard deviation9 of price returns:
1. Full quarter volatility 2. Deadline adjusted volatility
9 See for instance Sadorsky (2006) and Matar et al. (2013); they do not adjust returns for convenience yield. When the price is assumed to follow a geometric Brownian motion as in Section 5, its volatility has to be estimated as the standard deviation of price returns.
Page 15 of 30
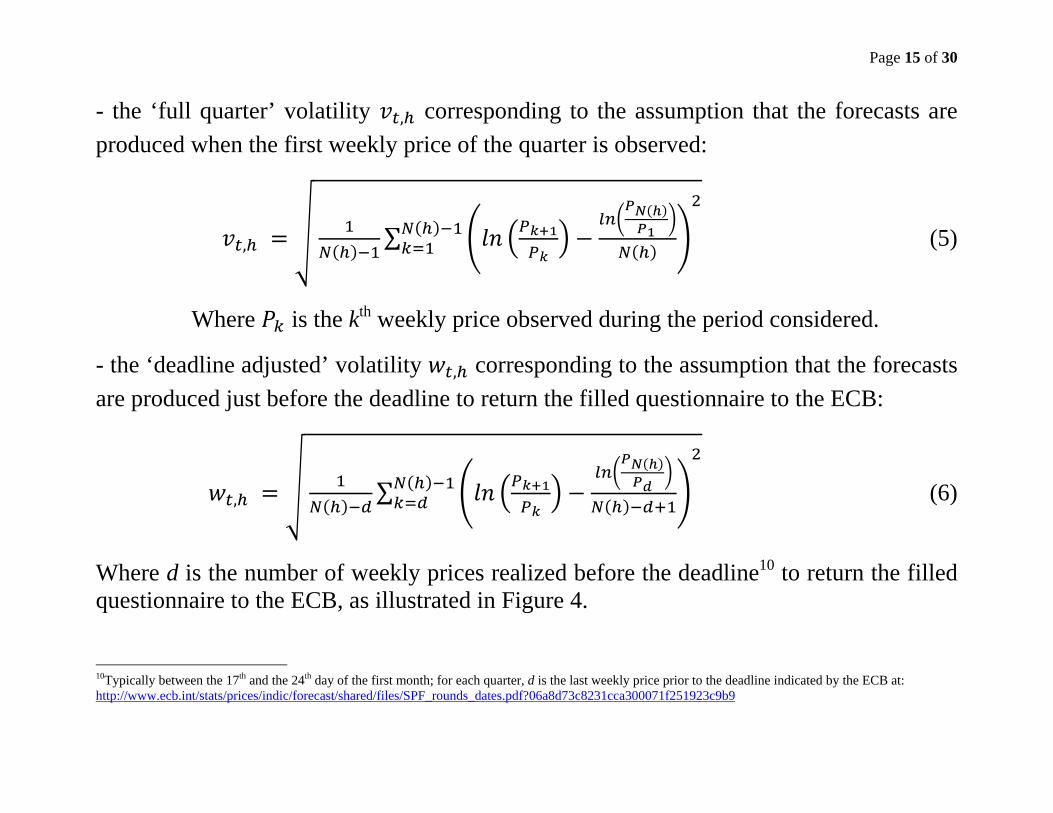
- the ‘full quarter’ volatility , corresponding to the assumption that the forecasts are produced when the first weekly price of the quarter is observed:
, ∑ (5)
Where is the kth weekly price observed during the period considered.
- the ‘deadline adjusted’ volatility , corresponding to the assumption that the forecasts are produced just before the deadline to return the filled questionnaire to the ECB:
, ∑ (6)
Where d is the number of weekly prices realized before the deadline10 to return the filled questionnaire to the ECB, as illustrated in Figure 4. 10Typically between the 17th and the 24th day of the first month; for each quarter, d is the last weekly price prior to the deadline indicated by the ECB at: http://www.ecb.int/stats/prices/indic/forecast/shared/files/SPF_rounds_dates.pdf?06a8d73c8231cca300071f251923c9b9

Page 16 of 30
Typically between the 17th and the 24th day of the first month; for each quarter, d is the last weekly price prior to the deadline indicated by the ECB at: http://www.ecb.int/stats/prices/indic/forecast/shared/files/SPF_rounds_dates.pdf?06a8d73c8231cca300071f251923c9b9
Figure 4: Full quarter volatility , and deadline adjusted volatility ,
1 N(h)
Start of quarter t
Deadline toreturn filled questionnaire End of forecasted quarter at horizon h
wt,h
vt,h
d
Page 17 of 30
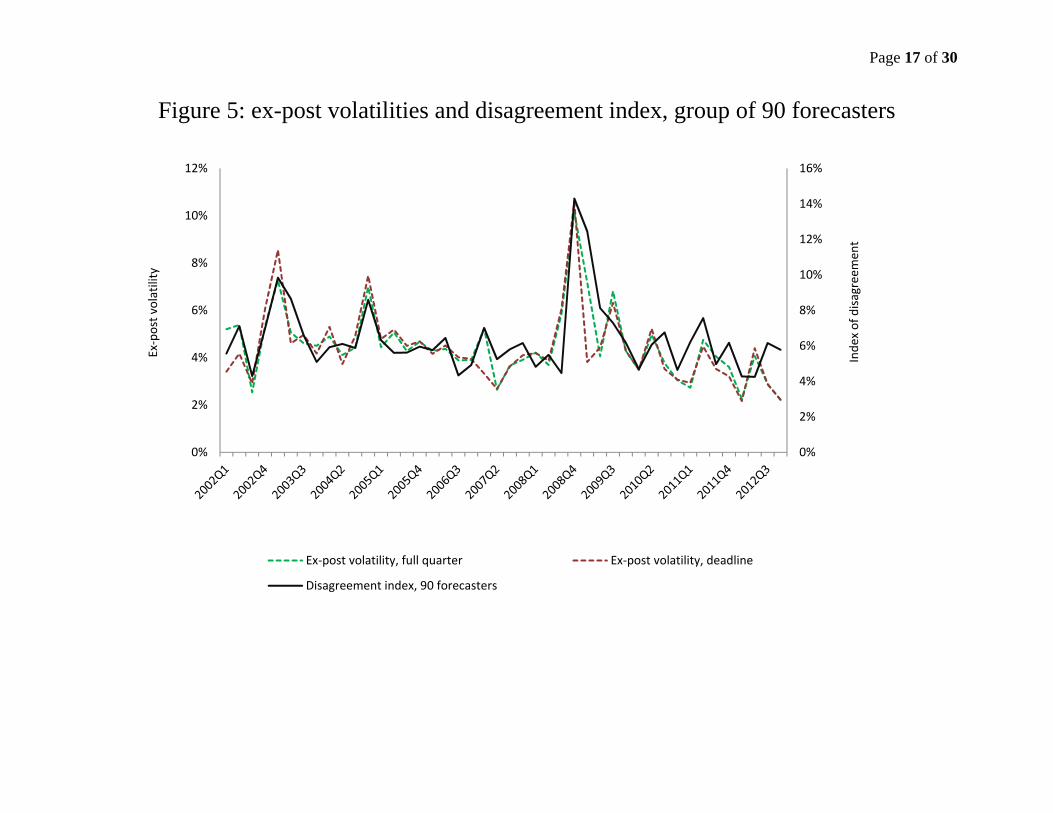
Figure 5: ex-post volatilities and disagreement index, group of 90 forecasters
0%
2%
4%
6%
8%
10%
12%
14%
16%
0%
2%
4%
6%
8%
10%
12%
Inde
x of disa
greemen
t
Ex‐post volatility
Ex‐post volatility, full quarter Ex‐post volatility, deadline
Disagreement index, 90 forecasters
Page 18 of 30
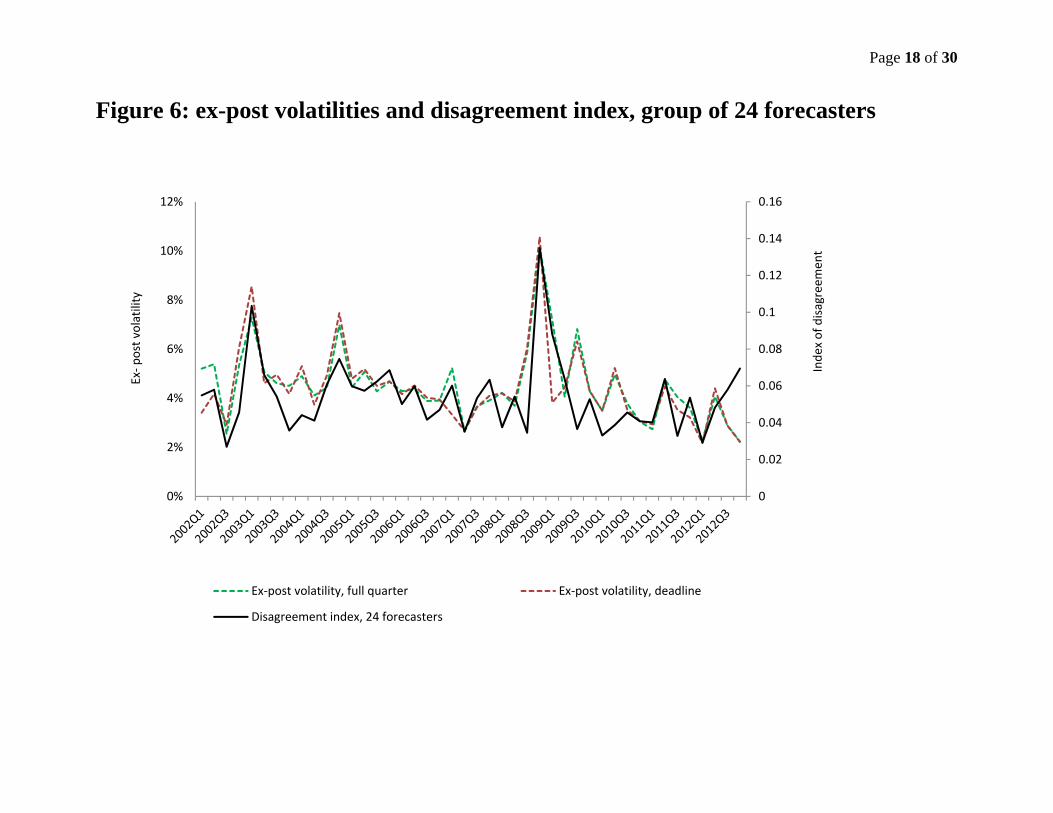
Figure 6: ex-post volatilities and disagreement index, group of 24 forecasters
0
0.02
0.04
0.06
0.08
0.1
0.12
0.14
0.16
0%
2%
4%
6%
8%
10%
12%
Inde
x of disa
greemen
t
Ex‐p
ost volatility
Ex‐post volatility, full quarter Ex‐post volatility, deadline
Disagreement index, 24 forecasters
Page 19 of 30
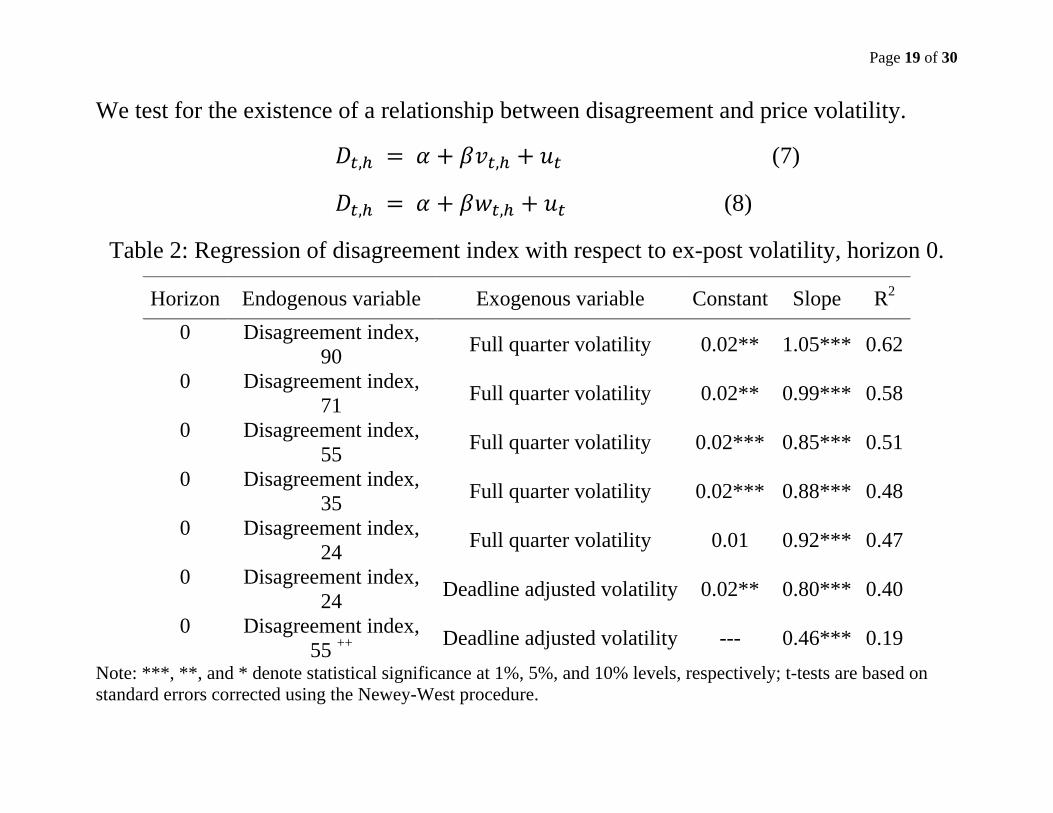
We test for the existence of a relationship between disagreement and price volatility.
, , (7)
, , (8)
Table 2: Regression of disagreement index with respect to ex-post volatility, horizon 0.
Horizon Endogenous variable Exogenous variable Constant Slope R2 0 Disagreement index,
90 Full quarter volatility 0.02** 1.05*** 0.62
0 Disagreement index, 71 Full quarter volatility 0.02** 0.99*** 0.58
0 Disagreement index, 55 Full quarter volatility 0.02*** 0.85*** 0.51
0 Disagreement index, 35 Full quarter volatility 0.02*** 0.88*** 0.48
0 Disagreement index, 24 Full quarter volatility 0.01 0.92*** 0.47
0 Disagreement index, 24 Deadline adjusted volatility 0.02** 0.80*** 0.40
0 Disagreement index, 55 ++ Deadline adjusted volatility --- 0.46*** 0.19
Note: ***, **, and * denote statistical significance at 1%, 5%, and 10% levels, respectively; t-tests are based on standard errors corrected using the Newey-West procedure.
Page 20 of 30
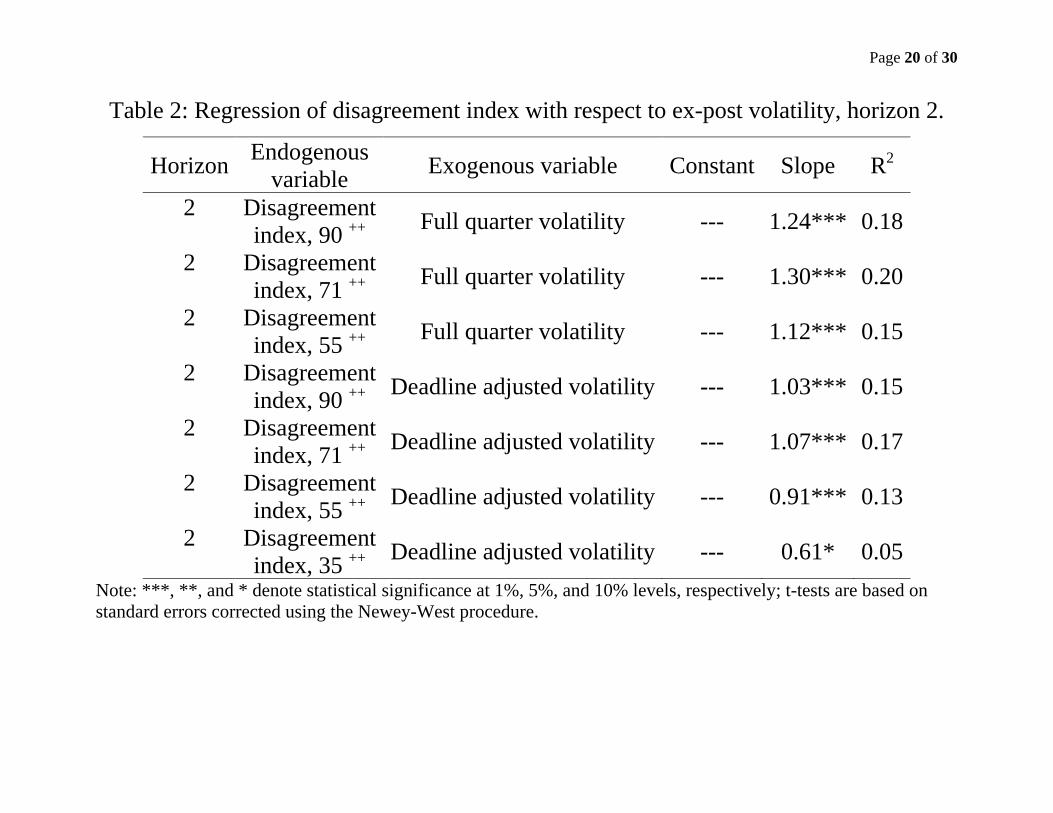
Table 2: Regression of disagreement index with respect to ex-post volatility, horizon 2.
Horizon Endogenous variable Exogenous variable Constant Slope R2
2 Disagreement index, 90 ++ Full quarter volatility --- 1.24*** 0.18
2 Disagreement index, 71 ++ Full quarter volatility --- 1.30*** 0.20
2 Disagreement index, 55 ++ Full quarter volatility --- 1.12*** 0.15
2 Disagreement index, 90 ++ Deadline adjusted volatility --- 1.03*** 0.15
2 Disagreement index, 71 ++ Deadline adjusted volatility --- 1.07*** 0.17
2 Disagreement index, 55 ++ Deadline adjusted volatility --- 0.91*** 0.13
2 Disagreement index, 35 ++ Deadline adjusted volatility --- 0.61* 0.05
Note: ***, **, and * denote statistical significance at 1%, 5%, and 10% levels, respectively; t-tests are based on standard errors corrected using the Newey-West procedure.
Page 21 of 30
Construction or Calibration of volatility based on disagreement
Since every forecast considered is a price averaged over a quarter, the observed disagreement is not directly comparable to oil price volatility.
Using a simple benchmark model for the oil price allows us to translate the observed disagreement into volatility.
The distribution of forecasts provided at a given date for a given horizon may be interpreted as the distribution of the average price over the corresponding period.
If we examine the standard deviation of the forecasts is equivalent to examining the standard deviation of the average price.
But, what is the relationship between the standard deviation of the average price and the volatility of the underlying price? Under the standard assumption that the oil price follows a geometric Brownian motion, we infer the price volatility implied by this distribution.
Page 22 of 30
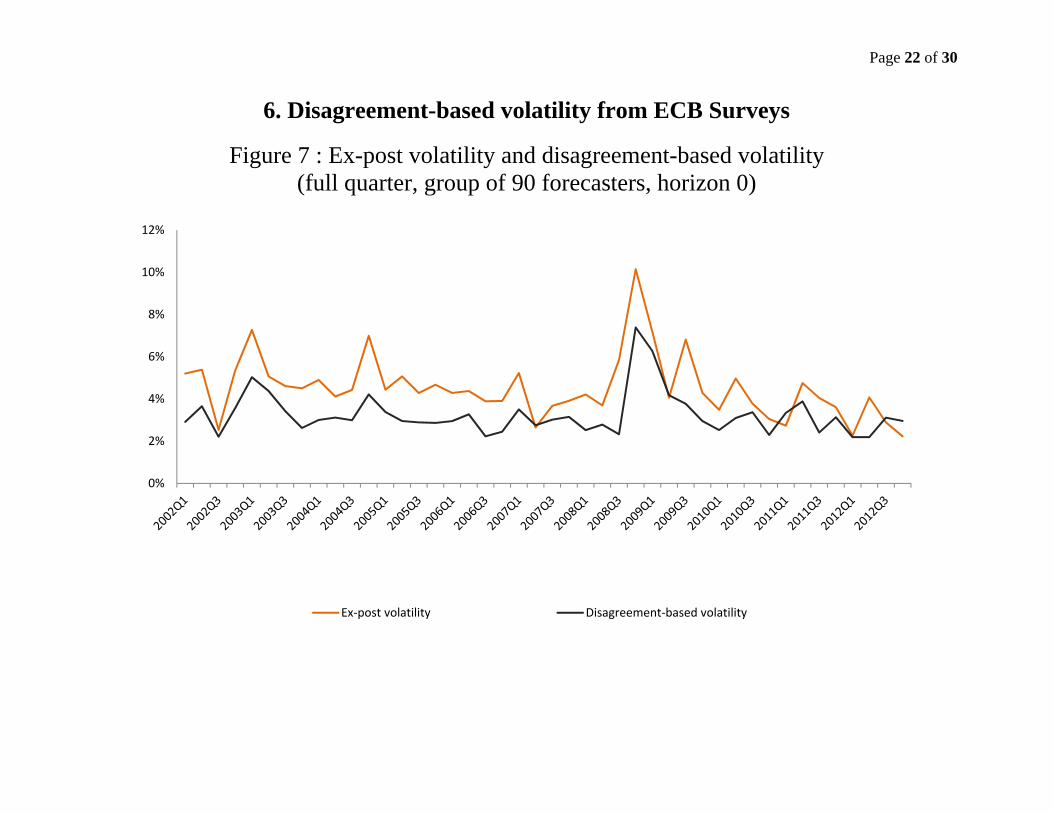
6. Disagreement-based volatility from ECB Surveys
Figure 7 : Ex-post volatility and disagreement-based volatility (full quarter, group of 90 forecasters, horizon 0)
0%
2%
4%
6%
8%
10%
12%
Ex‐post volatility Disagreement‐based volatility
Page 23 of 30
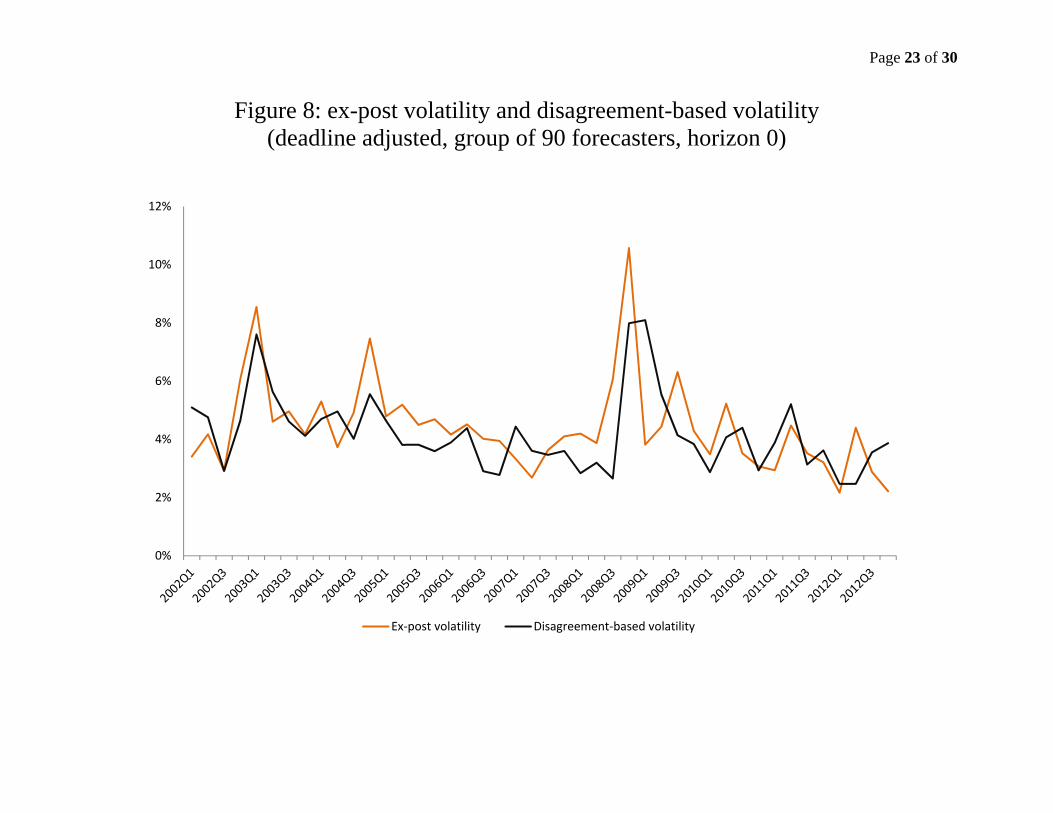
Figure 8: ex-post volatility and disagreement-based volatility (deadline adjusted, group of 90 forecasters, horizon 0)
0%
2%
4%
6%
8%
10%
12%
Ex‐post volatility Disagreement‐based volatility
Page 24 of 30
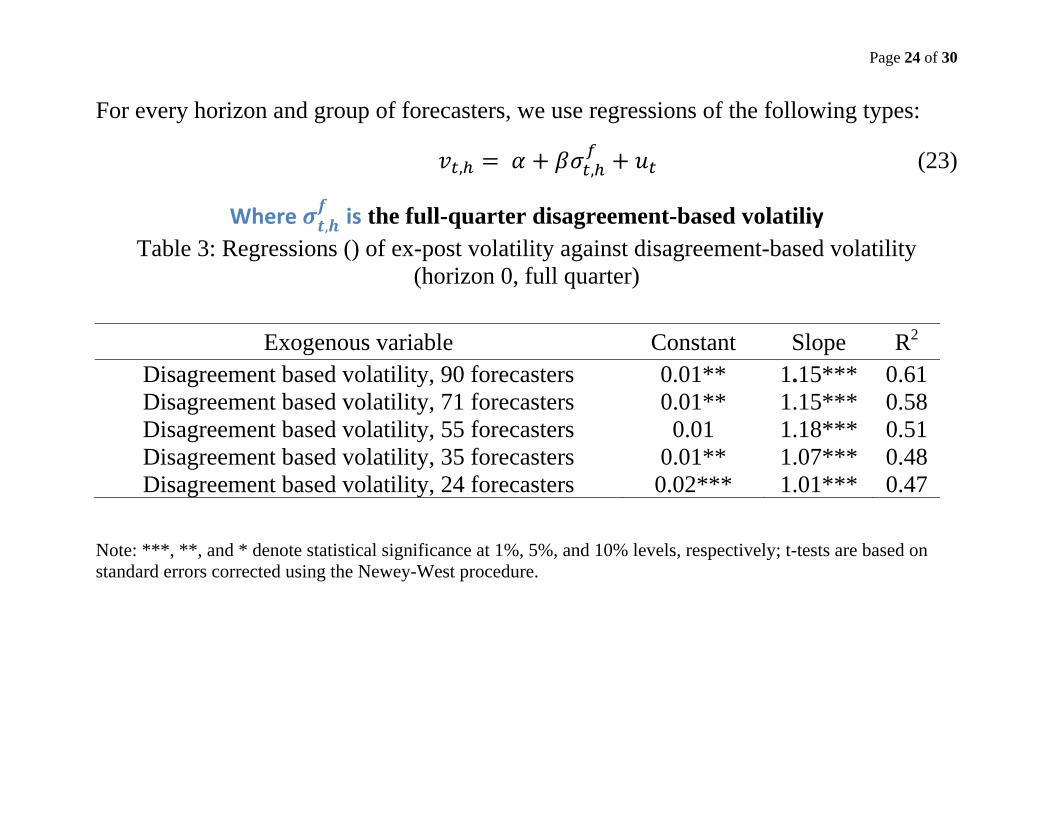
For every horizon and group of forecasters, we use regressions of the following types:
, , (23)
Where , is the full-quarter disagreement-based volatiliy Table 3: Regressions () of ex-post volatility against disagreement-based volatility
(horizon 0, full quarter)
Exogenous variable Constant Slope R2 Disagreement based volatility, 90 forecasters 0.01** 1.15*** 0.61 Disagreement based volatility, 71 forecasters 0.01** 1.15*** 0.58 Disagreement based volatility, 55 forecasters 0.01 1.18*** 0.51 Disagreement based volatility, 35 forecasters 0.01** 1.07*** 0.48 Disagreement based volatility, 24 forecasters 0.02*** 1.01*** 0.47
Note: ***, **, and * denote statistical significance at 1%, 5%, and 10% levels, respectively; t-tests are based on standard errors corrected using the Newey-West procedure.
Page 25 of 30
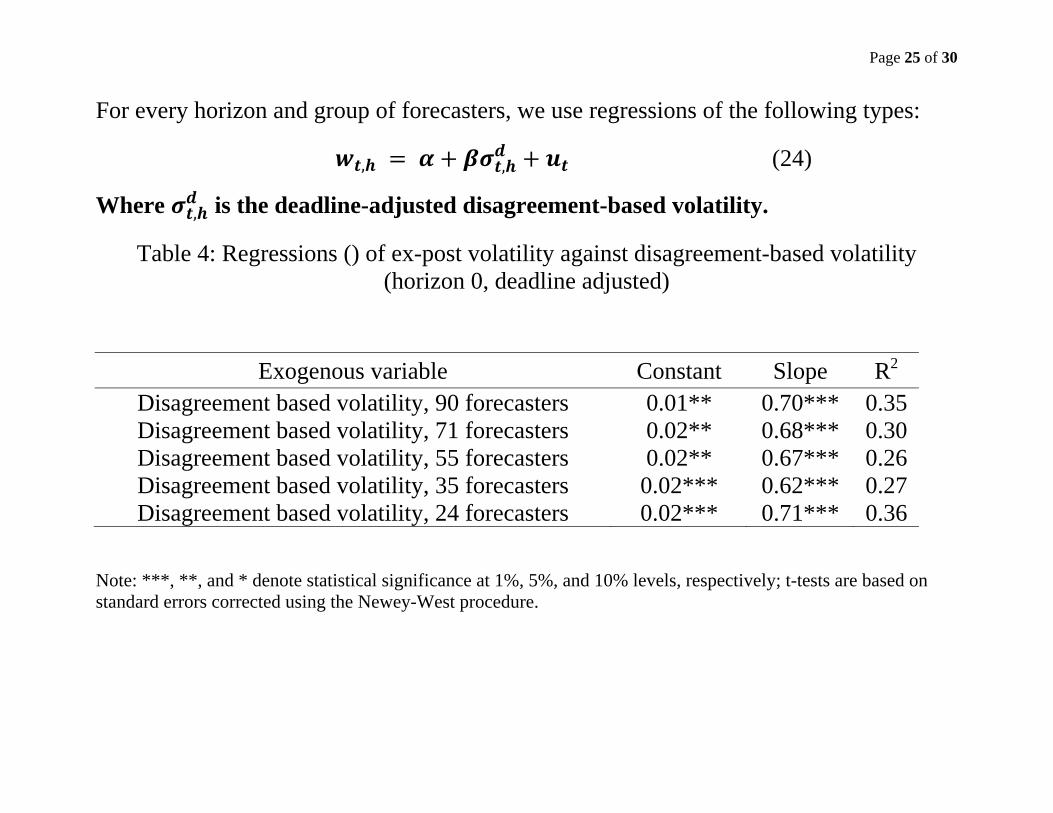
For every horizon and group of forecasters, we use regressions of the following types:
, , (24)
Where , is the deadline-adjusted disagreement-based volatility.
Table 4: Regressions () of ex-post volatility against disagreement-based volatility (horizon 0, deadline adjusted)
Exogenous variable Constant Slope R2 Disagreement based volatility, 90 forecasters 0.01** 0.70*** 0.35Disagreement based volatility, 71 forecasters 0.02** 0.68*** 0.30Disagreement based volatility, 55 forecasters 0.02** 0.67*** 0.26Disagreement based volatility, 35 forecasters 0.02*** 0.62*** 0.27Disagreement based volatility, 24 forecasters 0.02*** 0.71*** 0.36
Note: ***, **, and * denote statistical significance at 1%, 5%, and 10% levels, respectively; t-tests are based on standard errors corrected using the Newey-West procedure.
Page 26 of 30
7. Conclusion
For short forecast horizons, we find statistical evidence that the oil price volatility observed ex post explains ex-ante disagreement between oil price forecasters of the ECB’s professional survey. The results appear robust to size of panel. Since the forecasts considered are quarterly average prices, the observed disagreement is however not directly comparable to oil price volatility. We therefore use the geometric Brownian motion as a benchmark model to translate the observed disagreement into volatility. This may lead one to consider our disagreement index, or the disagreement-based volatility, as an informative index for future volatility in oil prices. In other words, could one of these indices be a good predictor of oil price volatility? In this respect, they can be tested against volatility implied from derivatives markets. An interesting issue would be to determine if the volatility derived from disagreement contains incremental information, relative to the volatility priced by option markets. One might suspect that the myriads of agents interacting on these markets should reveal more about volatility than the level of disagreement between ninety forecasters. To ascertain this is left for future research.
Page 27 of 30
Thank you
Comments and Suggestions Welcome