Embed Size (px)
Citation preview

1616 P St. NW Washington, DC 20036 202-328-5000 www.rff.org
August 2015 RFF DP 15-36
Does Eco-certification Stem Tropical Deforestation?
Forest Stewardship Council Certification in Mexico
Al l en Bl ackman, Leonar d Gof f , and
Mar iso l R i ver a P l an ter
DIS
CU
SS
ION
PA
PE
R

© 2015 Resources for the Future. All rights reserved. No portion of this paper may be reproduced without
permission of the authors.
Discussion papers are research materials circulated by their authors for purposes of information and discussion.
They have not necessarily undergone formal peer review.
Does Eco-certification Stem Tropical Deforestation?
Forest Stewardship Council Certification in Mexico
Allen Blackman, Leonard Goff, and Marisol Rivera Planter
Abstract
Since its creation more than two decades ago as a voluntary market-based approach to improving
forest management, forest certification has proliferated rapidly in developing countries. Yet we know
little about whether and under what conditions it affects deforestation. We use rich forest management
unit-level panel data—including information on deforestation, certification, regulatory permitting, and
geophysical and socioeconomic land characteristics—along with matched fixed effects models to identify
the effect of Forest Stewardship Council (FSC) certification on deforestation in Mexico, the country with
the third-highest number of FSC certifications in the developing world. We test for a variety of different
temporal and subgroup effects but are unable to reject the null hypothesis that certification does not affect
deforestation. Although these results do not indicate that FSC certification has no effect on forest
management, they do suggest that its impact on deforestation may be limited.
Key Words: eco-label, certification, forest cover change, Mexico
JEL Classification Numbers: Q23, Q56, Q57

Contents
1. Introduction ......................................................................................................................... 1
2. Literature ............................................................................................................................. 2
3. Background ......................................................................................................................... 5
3.1. Mexico’s Forests .......................................................................................................... 5
3.2. Forest Stewardship Council Certification .................................................................... 6
4. Empirical Approach ........................................................................................................... 8
4.1. Naïve Model................................................................................................................. 8
4.2. Fixed Effects ................................................................................................................ 9
4.3. Matching ...................................................................................................................... 9
4.4. Treated-Only Sample ................................................................................................. 10
5. Data .................................................................................................................................... 10
5.1. Sources ....................................................................................................................... 10
5.2. Sample........................................................................................................................ 12
5.3. Variables .................................................................................................................... 15
5.4. Summary Statistics..................................................................................................... 19
6. Results ................................................................................................................................ 21
6.1. Drivers of Certification .............................................................................................. 21
6.2. Specification Tests ..................................................................................................... 23
6.3. Certification Effects: Main Models ........................................................................... 23
6.4. Certification Effects: Robustness Checks .................................................................. 25
7. Discussion........................................................................................................................... 31
References .............................................................................................................................. 33
Appendix 1. ............................................................................................................................ 38
Appendix 2. ............................................................................................................................ 41

Resources for the Future Blackman, Goff, and Rivera Planter
1
Does Eco-certification Stem Tropical Deforestation?
Forest Stewardship Council Certification in Mexico
Allen Blackman, Leonard Goff, and Marisol Rivera Planter
1. Introduction
Since its creation more than two decades ago, forest certification has proliferated in
developing countries. Forest Stewardship Council (FSC), the leading forest eco-labeling
initiative in the tropics, now has certified more than 28 million hectares in 53 developing
countries (FSC 2014a). Although FSC standards cover a wide range of issues and have evolved
over time, environmental protection—and in particular stemming tropical deforestation—was an
important motive for founding the initiative and has remained a central theme (FSC 2012;
Cashore et al. 2006b; Humphreys 1996).
In principle, FSC and other types of forest certification can generate nonregulatory
incentives for sustainable forest management, thereby sidestepping the problems of weak
institutions and limited political will that often undermine conventional environmental policy
initiatives in developing countries (Auld and Gulbrandsen 2013; Cashore et al. 2006a; Meidinger
et al. 2003). According to advocates, the principal nonregulatory motivations are economic.
Certification allows consumers and creditors to select “green” producers and boycott others. That
selection, in turn, facilitates price premia and/or improved access to output and credit markets.
And those private economic benefits motivate producers to either improve their environmental
performance or—in the case of already-green producers—prevent it from slipping. In addition to
these private economic incentives, certification may help disseminate technical information
Blackman(corresponding author): Resources for the Future, 1616 P Street, NW, Washington, DC 20036;
[email protected]. Goff: Resources for the Future. Rivera Planter: Institutio Nacional de Ecología y Cambio
Climático, Secretaría del Medio Ambiente y Recursos Naturales.
Acknowledgements: Funding for this project was provided by the Tinker Foundation, the National Space and
Aeronautics Administration SERVIR Applied Sciences Team, and the Swedish Research Council, Formas, through
the Human Cooperation to Manage Natural Resources program. We are grateful to Alfredo Cinsneros, Elizabeth
Gallardo, Ana Malinosvskaya, Jimena Rico Staffon, Mavial Sarai Velazquez, and Juan Manuel Torres Rojo for help
assembling our permit data; Jessica Chu for GIS assistance; William Crosse, David Hughell, Adolfo Lemus, Deanna
Newsom, and Alicia Raimondi for assistance with certification data; Joyce Bond for editorial assistance; and Fred
Cubbage, Jack Putz, Claudia Romero, Roger Sedjo, Laura Villalobos, and seminar participants at Centro de
Investigación y Docencia Económias and the European Association of Environmental and Resources Economics
annual meetings for helpful comments and suggestions. Remaining errors are our own.

Resources for the Future Blackman, Goff, and Rivera Planter
2
about best management practices and mold private and public sector actors’ environmental
preferences and standards (Romero et al. 2013; Rickenbach and Overdevest 2006). On the basis
of such arguments, national governments, bilateral donors, and leading multilateral agencies,
such as the Global Environment Facility and World Bank, have devoted considerable resources
to promoting forest certification in developing countries and increasingly are interested in using
it for reducing greenhouse gas emissions from deforestation and forest degradation—that is, for
REDD (Brotto et al. 2010; FSC 2011).
Despite the increasing use of forest certification in developing countries, we still know
little about whether, under what conditions, and how it affects forest cover change (Romero et al.
2013; Milder et al. 2012; Miteva et al. 2012; Blackman and Rivera 2011). To help fill that gap,
we use fine-scale panel data on forest cover change along with empirical methods aimed at
controlling for self-selection bias (fixed effects and matching) to measure the effect of FSC
certification on deforestation in Mexico. We focus on Mexico because it is a critical location for
FSC certification. Historically, Mexico has had one of the highest deforestation rates in the
world, and it currently has 48 FSC-certified forests, the third-highest number in the developing
world (FAO 2011; FSC 2014a). As discussed below, to our knowledge, ours is among the first
econometric analyses of the environmental benefits of forest certification to use panel data
techniques to control for unobserved confounding factors and the first to focus on Mexico.
The remainder of the paper is organized as follows. The next section briefly reviews the
literature evaluating the effects of FSC forest certification on forest management and
environmental outcomes. The third section provides background on Mexico and FSC
certification. The fourth section describes our empirical methods. The fifth section discusses our
data. The sixth section presents our results. And the last section sums up and considers policy
implications.
2. Literature
Although forest certification has attracted considerable attention in the literature, rigorous
empirical evaluations are scarce (Romero et al. 2013; Miteva et al. 2012; Milder et al. 2012;
Blackman and Rivera 2011). At least three approaches have been used to shed light on the
environmental effects of forest certification: quantitative evaluations based on direct observation,
interviews with forest managers, and analyses of corrective action requests (CARs). Below, we
discuss each type in turn. In general, the literature is thin and findings are mixed. Studies that do
not control for self-selection effects (discussed below) and those that focus on the United States
generally reach more optimistic conclusions about certification’s benefits.

Resources for the Future Blackman, Goff, and Rivera Planter
3
Quantitative evaluations based on direct observation of environmental outcomes typically
measure the effect of certification by comparing average outcomes for samples of certified and
uncertified forest management units (FMUs). The main challenge is controlling for the tendency
of FMUs that already manage their forests sustainably to disproportionately obtain certification
because they need not make dramatic changes to production practices or on-the-ground
conditions to meet certification criteria. Studies that fail to control for this self-selection typically
generate overly optimistic conclusions: in effect, they attribute the superior average
environmental performance of certified producers to certification when it actually reflects their
preexisting characteristics.
To our knowledge, only six quantitative studies of the environmental effects of forest
certification—two published and four unpublished—attempt to control for selection effects.
However, all but one use cross-sectional data (along with regression or matching) and therefore
only purport to control for observable confounding factors, not unobserved ones. The exception
is Miteva et al. (2015). Using a matched difference-in-differences estimator along with three-
period deforestation data derived from MODIS satellite images, they find that FSC certification
in Kalimantan, Indonesia, reduces deforestation but increases forest perforation. As for the other
studies, relying on cross-sectional regulatory inspection data, Nordén et al. (2015) find that
neither FSC nor Programme for the Endorsement of Forest Certification (PEFEC) certification
reduces noncompliance with regulations governing high conservation value areas in Sweden.
Using matching along with cross-sectional deforestation derived from Landsat satellite images,
two recent master’s theses, by Rico Staffron (2015) and Panlasigui (2015), find that FSC
certification in Peru and Cameroon does not stem deforestation. Relying on regression,
Kukkonen et al. (2008) find that although FSC-certified forest plots in northern Honduras used
more environmentally friendly practices, tree regeneration was actually lower on certified plots
than on conventional ones. And finally, using matching, Barbosa de Lima et al. (2009) find that
FSC certification in the Brazilian Amazon has minor effects on a range of environmental
outcomes, which they attribute to the tendency of top-performing FMUs to obtain certification.
Not surprisingly, quantitative studies based on direct observation that do not control for
self-selection generate more optimistic results. For example, Simpson et al. (2005) find that in
the United States, implementation of best management practices was significantly higher when
the timber was delivered to a mill certified by the Sustainable Forestry Initiative (SFI). And
Hagan et al. (2005) find that landowners in the United States who were certified by either SFI or
FSC had stronger biodiversity practices than uncertified landowners.

Resources for the Future Blackman, Goff, and Rivera Planter
4
Interviews with forest managers and other stakeholders also have been used to assess the
environmental effects of forest certification. Ebeling and Yasue (2009) examine FSC
certification in Ecuador and Bolivia using semistructured interviews with certified and
uncertified timber companies and landowners (among others). They conclude that certification is
unlikely to have significant environmental benefits in developing countries that, like Ecuador,
have limited governance capacity in the forestry sector. By contrast, Moore et al. (2012) examine
FSC and SFI certification in the United States and Canada using email surveys of certified
FMUs. They conclude that certification prompted substantial changes in forest management
practices.
Finally, several papers have used CARs issued after third-party inspections of FSC-
certified FMUs to shed light on the environmental effects of FSC certification. CARs detail the
changes in procedures and on-the-ground conditions that land managers must make to either
obtain a new certification or retain an existing one. Therefore, they provide insight into how FSC
certification affects forest management. Nebel et al. (2005), Rametsteiner and Simula (2003),
and Blackman et al. (2014) are most equivocal about these effects. For example, Nebel et al.
(2005) find that most CARs issued to certified FMUs in Bolivia in the late 1990s and early 2000s
focused on minor noncompliance that was easily corrected—likely because certified FMUs were
top performers before certification—and as a result, certification probably generated “only small
direct improvement in management.” And Blackman et al. (2014) analyze more than 1,000
CARs issued to 35 Mexican FMUs. They find that most CARs addressed minor procedural
issues and focused on social, economic, and legal issues rather than on-the-ground environmental
changes.
Analyses of CARs by Newsom and Hewitt (2005), Newsom et al. (2006), and Peña-
Claros et al. (2009) paint a more optimistic picture of certification’s environmental effects. For
example, Newsom and Hewitt (2005) examine CARs from 129 randomly selected FSC-certified
FMUs in 21 countries in five regions (stratified by region) and find that most CARs required
substantive on-the-ground changes. As a result, they conclude that certification does change
behavior and is not simply a rubber stamp for already-green FMUs. And Peña-Claros et al.
(2009) examine CARs issued to 123 FMUs in 10 tropical Latin American and Caribbean
countries and find that the number of times a given issue was mentioned was lower in
recertification reports than in certification reports, suggesting an improvement in forest
management over time.

Resources for the Future Blackman, Goff, and Rivera Planter
5
3. Background
3.1. Mexico’s Forests
Mexico’s forests, more than half of which are primary, comprise 65 million hectares,
one-third of the national territory (FAO 2011). The majority are governed by more than 2,000
communal FMUs, a legacy of the agrarian reform that accompanied the Mexican revolution
(FAO 2011; Madrid et al. 2010; Bray et al. 2006). The two principle types of communal FMUs
are comunidades, which are indigenous communities with historical ties to land, and ejidos,
which are composed of peasants granted land through the reform process. Most of these
communal FMUs, particularly the smaller ones, lack the capacity for sustainable forest
management (Anta Fonseca 2006).
Historically, deforestation and forest degradation have been severe problems in Mexico.
Between 1990 and 2000, clearing of all types of forests averaged more than one-half of 1 percent
per year and caused the seventh-highest net annual forest loss of any country in the world (FAO
2011). During the same period, clearing of primary forests averaged more than 1 percent per year
(FAO 2011). Deforestation and forest degradation have contributed to a host of local and global
environmental problems, including soil erosion, aquifer depletion, diminished biodiversity, and
global warming (Cervigni and Brizzi 2001). Although deforestation at the national level has
slowed significantly since 2000, rapid forest cover loss continues to plague some regions
(Madrid et al. 2010).
As in many countries, Mexico’s system of forest regulation emphasizes permits and
management plans. To extract timber, FMUs, including comunidades and ejidos, are required to
obtain permits from state offices of the National Environment Ministry (Secretaría de Medio
Ambiente y Recursos Naturales, SEMARNAT). That, in turn, requires that they develop a forest
management plan, typically with the assistance of a consulting forester. Among other things,
permits specify the amount, type, and location of trees extracted each year, and the silvicultural
system used to do so. State offices of the National Environmental Attorney General
(Procuraduía Federal de Protección Ambiente, PROFEPA) have responsibility for monitoring
compliance with SEMARNAT permits. However, during our 2001–2012 study period,
particularly the early years, funding and manpower allocated to that task were insufficient
(OECD 2003)

Resources for the Future Blackman, Goff, and Rivera Planter
6
3.2. Forest Stewardship Council Certification
3.2.1. Forest Stewardship Council International
Founded in 1993, in the wake of the failure of participants in the 1992 Rio Earth Summit
to agree on an international convention to stem tropical deforestation, FSC International was
intended to provide a voluntary market-based approach to the problem (FSC 2014b). A nonprofit
association with a diverse set of member organizations, FSC states that its mission is to “promote
environmentally appropriate, socially beneficial, and economically viable management of the
world’s forests” (FSC 2014b).
At the heart of FSC initiative is a set of 10 International Principles along with dozens of
more detailed Criteria, to which FMUs and other institutions must adhere in order to obtain
certification (Appendix 1). FSC’s International Principles and Criteria have evolved since they
were first published in 1994. In its most recent incarnation, the 10 International Principles
concern the following:
i. Compliance with laws
ii. Workers’ rights and employment conditions
iii. Indigenous people’s rights
iv. Community relations
v. Benefits from forests
vi. Environmental values and impacts
vii. Management planning
viii. Monitoring and assessment
ix. High conservation value forests
x. Implementation of management activities
More than two dozen countries, including Mexico (2009), have developed national FSC
standards that provide locally appropriate indicators for each international criterion.
FSC does not accredit individual FMUs. Rather, independent certifying bodies do that.
Certifying bodies are themselves accredited to ensure they follow FSC rules and operating
procedures. Certifying bodies audit FMUs prior to certification to determine whether they
conform with FSC criteria. Certification is valid for five years. During that period, certifying

Resources for the Future Blackman, Goff, and Rivera Planter
7
bodies inspect FMUs each year to ensure continued conformance. Failure to correct
nonconformance expeditiously can result in revocation of certification.
FSC issues three main types of certification. Forest management certification is issued to
FMUs; chain of custody certification to manufacturers, processors, and traders; and controlled
wood certification to both sets of parties (to allow them to mix FSC-certified and certain types of
uncertified wood). Our analysis focuses only on forest management certification.
3.2.2. Forest Stewardship Council in Mexico
This subsection is drawn from Anta Fonseca (2006), which reviews the history of FSC
certification in Mexico. In Mexico, FSC certification began in the mid-1990s and was
spearheaded by two nongovernmental organizations that operated as certifying bodies: the
Mexican Civil Council for Sustainable Silviculture (Consejo Civil Mexicano para la Silvicultura
Sostenible, CCMSS), which focused on community forestry, and Rainforest Alliance’s
SmartWood program. Early certification efforts received considerable external support,
including from the World Bank, the Ford Foundation, the InterAmerican Foundation, and the
Packard Foundation. Early efforts to promote FSC certification in Mexico focused on FMUs
already exhibiting superior forest management and environmental performance, not those in
which serious forest management issues, including deforestation, biodiversity loss, and illegal
logging, were prevalent.
Two factors drove certification in the 1990s and early 2000s. One was a deliberate
campaign by regulatory agencies, specifically the Environment Ministry and, within that
ministry, the Forest Agency (Comissión Nacional Forestal, CONAFOR), which viewed FSC
certification as a strategy for compensating for chronic gaps in resources and capacity for
conventional command-and-control forest regulation. These institutions provided a variety of
economic and regulatory incentives for FMUs to obtain FSC certification. The geographic focus
of these efforts was southern Mexico, specifically Oaxaca and to a lesser extent Quintana Roo.
The second driver of certification was market pressure. FMUs in northern Mexico, specifically
Durango, were interested in FSC certification to access European markets. Since 1996 at least
100 Mexican FMUs obtained FSC forest management certifications. Most, however, have not
been maintained. As noted above, today Mexico has 48 active forest management FSC
certifications, the third-highest number in the developing world.

Resources for the Future Blackman, Goff, and Rivera Planter
8
4. Empirical Approach
The principle challenge to identifying the effect of FSC certification on deforestation is
controlling for the self-selection effects noted above. For example, as we shall see, compared
with uncertified FMUs in our sample, certified ones are more likely to have lower population
densities and to be farther from cities, observable characteristics typically negatively correlated
with deforestation. More importantly, certified FMUs in our sample are likely to be
disproportionately composed of those with unobserved features that affect deforestation,
including management skill and environmental attitudes. Failure to control for selection on such
observable and unobservable FMU characteristics risks conflating the causal effects of
certification with the effects of FMUs’ preexisting characteristics.
4.1. Naïve Model
To restate the identification challenge more formally, consider a naïve model of the effect
of certification in which the percentage of an FMU deforested in a given year—hereafter, an
“FMU-year”—depends on whether the FMU was certified in previous years and on a vector of
control variables. That is,
Yit = + D’it-z + X’it-zW’+ it (1)
where i indexes FMUs, t indexes years, z indexes temporal lags, Y is the percentage of the FMU
deforested, D is a vector of contemporaneous and lagged dichotomous dummy variables
indicating certification, X is a vector of time-varying control variables, W is a vector of time-
invariant control variables, α and are parameters or vectors of parameters to be estimated, and ε
is an error term. The parameters in purport to measure certification’s effect on forest cover
change—formally, the average treatment effect on the treated (ATT). However, they will be
biased if unobserved FMU characteristics affect both certification and deforestation.
We use three strategies to control for such endogeneity, some implemented
simultaneously and some separately: fixed effects, matching, and restricting our sample to FMUs
that at some point were FSC-certified. We discuss each strategy in more detail below. Section 6,
which discusses our results, presents results of specification tests, including for using fixed
effects.

Resources for the Future Blackman, Goff, and Rivera Planter
9
4.2. Fixed Effects
The fixed effects model is specified as
Yit = i + t + D’it-z + X’it-z+ it (2)
where are FMU-fixed effects and are year-fixed effects. The FMU-fixed effects control for
unobserved time-invariant FMU heterogeneity, including that generated by self-selection into
certification. The year-fixed effects control for unobserved temporal effects such as changes in
forest policy and in the international prices of timber affecting all FMUs in the study area. We
omit the time-invariant social and economic control variables because they are perfectly
correlated with the FMU-fixed effects. We estimate Equation (2) using ordinary least squares
(OLS) and cluster standard errors at the FMU level.
4.3. Matching
In addition to fixed effects, we control for self-selection by using matching to
“preprocess” our data (Imbens and Wooldridge 2009; Ho et al. 2007). That is, we identify a
matched control group of uncertified FMUs that are similar to the treatment group of certified
FMUs in terms of observed characteristics that drive forest cover change, drop unmatched
control FMUs from the regression sample, and then use OLS to estimate Equation (2). This
strategy combining nonparametric matching (i.e., dropping from the study sample control
observations that are dissimilar to the treatment observations) with standard parametric
regression typically generates treatment effects estimates that are more robust to misspecification
and omitted variables bias than does parametric regression alone (Imbens and Wooldridge 2009;
Ho et al. 2007; Ferraro and Miranda 2012).
We use propensity scores for each FMU—the probability of certification predicted by a
probit regression—to match certified and uncertified FMUs in four geographic regions within
Mexico (Rosenbaum and Rubin 1983). That is, certified FMUs in each region are matched to
uncertified FMUs in the same region. Propensity scores can be interpreted as weighted indices of
the characteristics that drive the treatment, here certification. We implement propensity score
matching as follows. First, we use a set of four cross-sectional probit models—one for each
region—to estimate propensity scores for each FMU. The model is specified as
Pr(Dij = 1| Wij) = F(W’ijj) (j = 1,2…4) (3)

Resources for the Future Blackman, Goff, and Rivera Planter
10
where j indexes regions, D is a binary variable indicating whether an FMU was certified in any
year from 2001 to 2012 (“ever-certified”), F is the standard normal cumulative distribution
function, and j is a vector of regression coefficients. Next, we create control groups of never-
certified FMUs by matching certified FMUs with never-certified FMUs on the basis of
propensity scores. We use nearest-neighbor 1-to-4 matching with replacement to identify the best
matches for each FMU (Cochrane and Rubin 1973). Finally, we drop all unmatched control
FMUs and then estimate Equation 2. We weight uncertified FMU-year observations in the
control group based on the number of times they were included as matches (Abadie and Imbens
2006). Again, we cluster standard errors at the FMU level.
4.4. Treated-Only Sample
A potential weakness of the fixed effects models is that the control group includes FMU-
year observations from never-certified FMUs as well as those from ever-certified ones. The latter
set of FMU-years may differ from the former set in unobservable ways (e.g., the management
capacity) that affect deforestation. To help control for such unobserved heterogeneity, we restrict
the sample to ever-certified FMUs. In this smaller sample, treatment FMU-years are those that
were FSC-certified in that year, and control FMU-years are those that were not yet certified or
were previously certified. In this sample, cross-sectional matching (in which ever-certified
FMUs are matched to never-certified FMUs) is obviously not feasible. Again, we cluster
standard errors at the FMU level.
5. Data
5.1. Sources
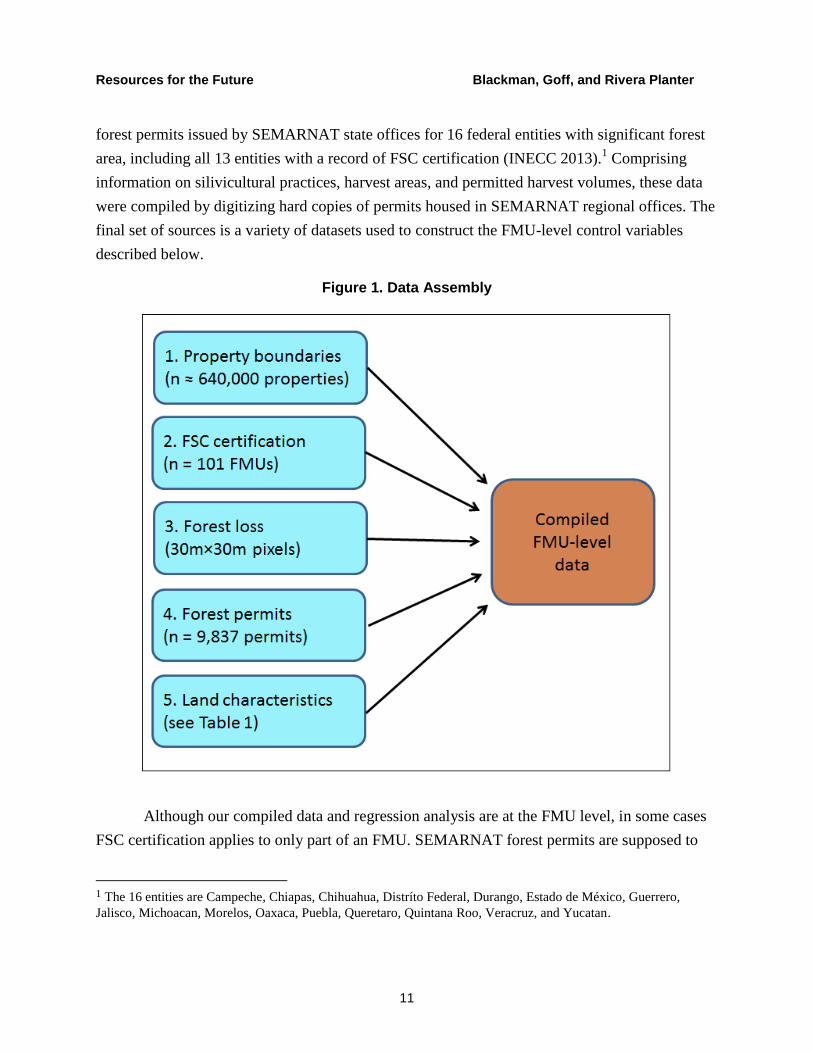
Our data are drawn from five sources (Figure 1). The first is cadastral data for virtually
all of Mexico, comprising more than 640,000 private and communal and state property polygons
(RAN undated; ASERCA 2003). The second is a master list of all 101 Mexican FMUs that
obtained FSC forest management certifications between 1996, when the first Mexican
certification was awarded, and 2015 (i.e., the population of FMUs certified during this period).
This list was compiled from registries maintained by FSC, Rainforest Alliance, and CCMSS. The
third is annual 2000–2012 forest loss data derived from high resolution (30m×30m) Landsat
satellite images for all of Mexico (Hansen et al. 2013). The fourth is a compendium of 9,837
Resources for the Future Blackman, Goff, and Rivera Planter
11
forest permits issued by SEMARNAT state offices for 16 federal entities with significant forest
area, including all 13 entities with a record of FSC certification (INECC 2013).1 Comprising
information on silivicultural practices, harvest areas, and permitted harvest volumes, these data
were compiled by digitizing hard copies of permits housed in SEMARNAT regional offices. The
final set of sources is a variety of datasets used to construct the FMU-level control variables
described below.
Figure 1. Data Assembly
Although our compiled data and regression analysis are at the FMU level, in some cases
FSC certification applies to only part of an FMU. SEMARNAT forest permits are supposed to
1 The 16 entities are Campeche, Chiapas, Chihuahua, Distríto Federal, Durango, Estado de México, Guerrero,
Jalisco, Michoacan, Morelos, Oaxaca, Puebla, Queretaro, Quintana Roo, Veracruz, and Yucatan.

Resources for the Future Blackman, Goff, and Rivera Planter
12
contain geolocator information defining harvest zone polygons. However, most permits,
particularly older ones, do not contain usable geolocator data. Hence, a harvest-zone-level
analysis is not feasible. Our FMU-level analysis has advantages and disadvantages. The
disadvantage is that we are not able to measure effects that only occur inside harvest zones. The
advantage is that we control for spatial spillover effects that occur when forest management
certification on one part of an FMU spurs deforestation on other parts.
5.2. Sample
Our regression samples of certified and uncertified FMUs were created as follows. To
create our sample of certified FMUs, we manually associated FMUs on our certification master
list with polygons in the cadastral data and records in the permit registry. We matched on FMU
names, municipio names, and any geolocator information included in certification records. Of
the 101 certified FMUs in our master list, we were dropped 37 either because matches were not
found or because data on the start and end dates of the certification were missing, leaving the 64
FMUs in our regression sample (Table A1).
To create our sample of uncertified FMUs, we first dropped all FMUs in the cadastral
data from states with no record of FSC certifications, with the exception of Campeche.2 The
purpose was to ensure that uncertified FMUs in our sample were as similar as possible to
certified ones. Next, we associated the surviving FMUs in the permit registry with polygons in
the cadastral data. To limit the sample of uncertified FMUs to a manageable size and to ensure
permit records for uncertified FMUs were as complete as those for certified ones (complete
permit records are required for FSC certification), we matched using geolocator information
contained in permit records, which are included only in complete permit documents. This filter
eliminated roughly two-thirds of the uncertified FMUs in the permit database. Finally, we
dropped 9 observations with missing data.
Having undertaken these steps, our full regression sample—that is, our sample before
using matching to select uncertified FMUs similar to certified ones—comprises 3,010 FMUs, 64
of which were ever-certified and 2,946 of which were never-certified (Figures 2A–2C). From
these cross-sectional data, we created a 12-year unbalanced panel spanning 2001–2012, the years
represented in our forest loss data (Hansen et al. 2013). The panel includes FMUs only during
2 We retained FMUs in Campeche, which has no FSC certifications, because our sample of never-certified potential
control FMUs in neighboring Quintana Roo was limited.

Resources for the Future Blackman, Goff, and Rivera Planter
13
years for which their regulatory permits were valid and counts FMUs as certified only for years
in which FSC certifications were valid. It comprises 18,103 FMU-year observations, of which
457 are FSC-certified and 17,646 are not certified. Again, this is the count of uncertified units
prior to matching.
Figure 2A. Forest Management Units Constituting Regression Sample

Resources for the Future Blackman, Goff, and Rivera Planter
14
Figure 2B. Forest Management Units Constituting Regression Sample in Durango State

Resources for the Future Blackman, Goff, and Rivera Planter
15
Figure 2C. Forest Management Units Constituting Regression Sample in Oaxaca State
5.3. Variables
Table 1 lists the variables in the regression analysis, including their names, definitions,
units, sources, spatial scales, and years. An asterisk identifies variables that vary over time as
well as across space, that is, variables that constitute the vector X in Equations 1 and 2.
Our dependent variable, percentage cleared, is the percentage of the total area of the
FMU cleared each year from 2001 to 2012. It is derived from fine-scale Landsat images (Hansen
et al. 2013).

Resources for the Future Blackman, Goff, and Rivera Planter
16
Table 1. Variables (*time varying)
Variable Description Units Source Scale Years
OUTCOME
percentage cleared* Percentage of total surface area cleared in year t 0/1 Hansen et al. (2013) 30m 2001–2012
TREATMENT
fsc all years* FSC certification in effect in year t? 0/1 CCMSS, FSC, RA FMU 2001-2012
fsc first certification* FSC initial certification in effect in year t? 0/1 CCMSS, FSC, RA FMU 2001-2012
fsc anticipatory* FSC initial certification awarded 1 or 2 years after t? 0/1 CCMSS, FSC, RA FMU 2001-2012
fsc year n* FSC initial certification awarded in year t-n? 0/1 CCMSS, FSC, RA FMU 2001-2012
fsc terminated FSC certification terminated in year t? 0/1 CCMSS, FSC, RA FMU 2001–2012
fsc suspended FSC certification suspended in year t? 0/1 CCMSS, FSC, RA FMU 2001–2012
fsc ever FSC certification in any year? 0/1 CCMSS, FSC, RA FMU 2001–2012
CONTROLS
Forest management
total timber volume* Total timber volume authorized for harvest in year ta m INECC FMU 2001–2012
homogeneous management Managed for phenotypic homogeneity? 0/1 INECC FMU 2001–2012
nontimber forest product Has nontimber forest product permit? 0/1 INECC FMU 2001–2012
selection logging Selection logging (vs. seed tree or clear-cut) silviculture? 0/1 INECC FMU 2001–2012
percentage protected Percentage overlap with national protected area 0/1 WDPA 1:50,000 to
1:1,000,000
1917–2010
FMU area Total surface area of forest management unit ha INECC FMU 2001–2012
Socioeconomic
population density* Population density in year t-1 pers./ha INEGI municipio 2000–2010
opportunity cost Gross annual agricultural revenueb 0/1 SAGARPA/INEGI FMU 2010
communal tenure Ejido, comunidad, or other type of communal (vs. private) tenure 0/1 INECC FMU 2001–2012
Climatological
rainfall* Mean total rainfall in year t mm Huffman et al. (2012) 25km 2001–2012
temperature* Mean temperature in year t oK NASA (2001) 1km 2001–2012
Geophysical
carbon Total above-ground carbon stock tons/ha Cartus et al. (2014) 30m circa 2006
elevation Mean altitude above sea level m Farr et al. (2007) 90m 2006
slope variability Standard deviation of slope % Farr et al. (2007) 90m 2006
aspect Mean aspect o Farr et al. (2007) 90m 2006
distance to city Mean travel time to nearest city with 50K+ residents min Nelson (2008) 30 arc-sec 2000
distance clearing in 2000 Mean distance to nearest cleared plot in year = 2000 m Hansen et al. (2013) 30m 2000

Resources for the Future Blackman, Goff, and Rivera Planter
17
Table Notes:
CCMSS = Consejo Civil Mexicano para la Silvicultura Sostenible; FSC = Forest Stewardship Council; FMU =
forest management unit; INEGI = Instituto Nacional de Estadística e Informática; RA = Rainforest Alliance;
SAGARPA = Secretaría de Agricultura, Ganadería, Desarrollo Rural, Pesca y Alimentación; WDPA = World
Database on Protected Areas. a Interpolated where values missing for one or more years, but available for both years bracketing the missing value.
b Computed from SAGARPA and INEGI data on hectares devoted to crops and pasture (comunidad level), average
yields (muncipio level), and average crop prices (municipio level).
Our four principle treatment variables— fsc all years, fsc first certification, fsc
anticipatory, and fsc year n —are binary dummy variables that aim to capture the deforestation
effects of FSC certification. As discussed below, most are used in separate models. Each variable
aims to capture a slightly different temporal effect. fsc all years is equal to one if certification
was in effect in year t (the current year), and is zero otherwise. It aims to pick up the average
annual effect on deforestation of certification during all years that certification was valid,
including ‘recertification’ years that follow the initial five-year certification period. By contrast,
fsc first certification is equal to one only during the first five-year certification period. Premised
on the idea that the initial certification period is most likely to affect deforestation, it aims to pick
up certification’s average annual effect over the course of the entire first five-year certification
period. fsc anticipatory is equal to one if the initial certification was awarded in any of the two
years after t. It is premised on the idea that FMUs improve forest management prior to their first
certification in order to meet FSC criteria. It aims to pick up certification’s average annual
anticipatory effects during the two years before the award of initial certification. Finally, fsc year
n is equal to one if the initial certification was awarded n years before t and is zero otherwise.
Unlike the first three treatment variables that purport to pick up average effects over a number of
years, these variables aim to capture single-year effects of the initial certification. For example,
fsc year 3 is equal to one if the initial certification was awarded three years before t, and aims to
capture only the effect in year t of that event.
In addition to these four main treatment variables, the variable fsc terminated identifies
FMUs with terminated FSC certificates in year t and the variable fsc suspended identifies those
with suspended, but not terminated, FSC certificates. Suspensions, which are rare in our sample,
occurred one year prior to some cases of termination. We use these last two variables to help
disentangle the effects of valid unsuspended FSC certifications. As noted above, our treatment
variables are derived from certification records maintained by FSC and its certifying bodies in
Mexico.
Among our control variables, four vary over time as well as across space: total timber
volume is the volume of timber (in cubic meters) authorized by SEMARNAT for extraction in
each year that a forestry permit was in force; population density is the average number of persons

Resources for the Future Blackman, Goff, and Rivera Planter
18
per square hectare lagged by one year; rainfall is average total rainfall each year; and
temperature is average annual temperature in each year. Total timber volume is drawn from
SEMARNAT permits (INECC 2013). Where values of this variable were missing for one or
more years, but available for years bracketing the missing value, we interpolated the missing
value(s) assuming a linear progression. In all, we interpolated 23 percent of the values of total
timber volume. Population density in each year was imputed from 2000, 2005, and 2010 census
data, again assuming a linear progression. Rainfall and temperature were derived from NASA
satellite data (Huffman et al. 2012; NASA 2001).
Finally, we use 11 time-invariant variables in our propensity score matching model; that
is, these variables constitute the vector W in Equation 3. To generate propensity scores, we use a
single time-invariant dependent variable, fsc ever, which is a binary variable indicating whether
the FMU was ever-certified in any year from 2001 to 2015. Control variables are forest
management, socioeconomic, geophysical, and FMU characteristics.
Among the forest management characteristics, homogeneous management is a binary
variable that identifies FMUs with forest management systems that aim to generate phenotypic
homogeneity; nontimber forest product is binary variable that identifies FMUs authorized by
SEMARNAT to harvest nontimber forest products such as palm fronds and mushrooms;
percentage protected is the percentage of the FMU inside a national protected area; and FMU
area is the total area of the FMU in hectares. Finally, selection logging is a binary variable that
indicates whether the FMU uses a logging silvicultural system wherein trees meeting age and
size criteria are selected for harvest. The other two silvicultural systems represented in our
sample of FMUs—seed trees and clear-cutting—both entail clear-cutting regardless of such
criteria. As discussed in the next subsection, we also use selection logging to test for subgroup
effects. All of these variables except percentage protected and FMU area were derived from
SEMARNAT permit data (INECC 2013).
Among the socioeconomic variables, opportunity cost is original FMU-level data on the
opportunity cost of retaining land in forest instead of converting it to agriculture or pasture. It is
the gross revenue from agriculture computed from secondary data on hectares planted in 365
crops (FMU level), average yields (municipio level), and average crop prices (municipio level).
The second static socioeconomic variable, communal tenure, is a binary dummy variable that
identifies FMUs with communal (versus private or state) tenure, including ejidos and
comunidades.
Finally, among the geophysical variables, carbon is total above-ground carbon stock per
hectare; elevation is average altitude; slope variability is the standard deviation of the slope;

Resources for the Future Blackman, Goff, and Rivera Planter
19
aspect is average directional orientation; distance to city is mean travel time to the nearest city
with more than 50,000 inhabitants; and distance to clearing is the mean Euclidian distance to the
nearest cleared 30m×30m plot of land in 2000.
5.4. Summary Statistics
Table 2 lists the number of FSC certifications in our regression sample by year and state.
Two-thirds of the 64 certifications are in two states—Durango (31) and Oaxaca (12) (Figures 2B
and 2C). Two more states—Puebla (7) and Quintana Roo (6)—account for most of the rest.
More than half of the certifications were awarded between 2001 and 2006, the first six years of
our panel.
Table 2. Regression Sample FSC Certifications, by Year and State
Year Chiapas Chih. Durango E. Mexico Jalisco Mich. Oaxaca Puebla Q. Roo Total
1996 0 0 0 0 0 0 4 0 0 4
1998 0 0 2 0 0 0 0 0 0 2
1999 0 0 1 0 0 0 0 0 0 1
2000 0 0 1 0 0 0 0 0 0 1
2001 0 1 4 0 0 0 3 0 2 10
2002 0 1 6 0 0 0 0 0 0 7
2003 0 0 1 0 0 0 1 0 0 2
2004 0 0 6 0 0 0 0 0 0 6
2005 0 1 2 0 0 0 2 0 3 8
2006 0 0 1 0 0 1 2 0 1 5
2007 0 0 1 0 0 0 0 0 0 1
2008 1 0 0 0 0 0 0 0 0 1
2009 0 0 0 0 1 0 0 0 0 1
2010 0 0 1 0 0 0 0 0 0 1
2011 0 0 1 0 0 0 0 0 0 1
2012 0 0 2 0 0 0 0 2 0 4
2013 0 1 1 0 0 0 0 3 0 5
2014 0 0 0 1 0 0 0 1 0 2
2015 0 0 1 0 0 0 0 1 0 2
Total 1 4 31 1 1 1 12 7 6 64
Sources: Consejo Civil Mexicano para la Silvicultura Sostenible, Forest Stewardship Council, Rainforest
Alliance.
Table 3 presents variable means for all 3,010 FMUs in our regression sample, and for
subsamples of 64 ever-certified FMUs and 2,946 never-certified FMUs. It also presents results
from difference-in-means tests for these subsamples.

Resources for the Future Blackman, Goff, and Rivera Planter
20
Table 3. Summary Statistics: Means and Difference of Means Tests at FMU-Year Level (*denotes time varying variables)
Variable All
Ever-
certified
Never-
certified
t-test
Number of FMU-years 18,103 457 17,646
Number of FMUs 3,010 64 2,946
OUTCOME
percentage cleared* (%/) 0.001 0.001 0.001
TREATMENT
fsc all years (0/1) 0.012 0.488 0.000 ***
CONTROLS
Forest management
total timber volume* m/ 2.308 17.598 1.912 ***
homogeneous management (0/1) 0.169 0.346 0.164 ***
nontimber forest product (0/1) 0.040 0.168 0.037 ***
selection logging (0/1) 0.831 0.538 0.839 ***
percentage protected (%/) 0.097 0.008 0.100 ***
FMU area (ha/) 3.645 19.203 3.242 ***
Socioeconomic
lagged pop. density* (pop/ha) 0.603 0.339 0.609 ***
opportunity cost (pesos/ha/) 3.304 3.404 3.301
communal tenure (0/1) 0.403 0.939 0.389 ***
Climatological
rainfall* (mm/ 1.023 1.173 1.018 ***
temperature* (oC/ 1.395 1.426 1.394 **
Geophysical
carbon (tons/ha/) 2.956 3.169 2.951 ***
elevation (m/) 2.057 1.790 2.064 ***
slope variability (s.d.) 0.796 2.362 0.755 ***
aspect (o/) 1.771 1.749 1.771
distance to city (min./ 2.543 3.031 2.531 ***
distance clearing in 2000 (m/ 1.765 3.240 1.727 ***
***, **, * = significant at 1, 5, 10% level; = 10, = 10,000.
Turning first to the outcome and treatment variables, for all FMUs in our sample,
percentage cleared is 0.001, which indicates that on average, one-tenth of 1 percent of each
FMU was cleared each year between 2001 and 2012. For an average-sized FMU in our sample
(3,645 hectares) that implies a forest loss of 3.6 hectares per year. For all FMUs in our sample,
fsc all years is 0.012, which indicates that on average, just over 1 percent of the FMUs in our
sample were FSC-certified each year between 2001 and 2012.
The tests comparing means from the ever-certified and never-certified subsamples
indicate statistically significant differences for every variable except percentage cleared,
opportunity cost, and aspect. Hence, certified and uncertified FMUs have very different average

Resources for the Future Blackman, Goff, and Rivera Planter
21
observable characteristics (which we characterize below in our discussion of the results of the
probit regressions used to generate propensity scores). The econometric models discussed in the
next section aim to control for such differences.
Fixed effects models like ours identify treatment effects by exploiting within-group (here
within-FMU) temporal variation and ignore between-group static variation. Therefore, to be
estimable, they require significant within-group variation (Greene 2008). Table 4 presents
statistics measuring overall, within-group, and between-group variation for our outcome and
treatment variables: percentage cleared and fsc all years. For both variables, within-group
variability is in fact significant.
Table 4. Overall, Within-Group, and Between-Group Variation for Outcome and Treatment Variables
Variable Variation Mean s.d. n
percentage cleared overall 0.001 0.007 18,103
between 0.006 3,010
within 0.006
fsc all years overall 0.012 0.110 18,103
between 0.093 3,010
within 0.051
Overall, between, and within variations are the variances of (𝑥𝑖𝑡 − �̅�), (𝑥𝑖 − �̅�), and (𝑥𝑖𝑡 − �̅�𝑖 + �̅�), respectively, where �̅� is the grand mean.
6. Results
We begin our discussion in this section with the probit regressions used to generate
propensity scores used in matching certified and uncertified FMUs, then discuss the results of
specification tests, and finally turn to our fixed effects OLS regression results.
6.1. Drivers of Certification
As noted above, we match certified FMUs to uncertified FMUs in the same geographic
region to help control for unobserved heterogeneity. We define four geographic regions: North
(Chihuahua, Durango, and Jalisco); Central (Estado de México and Puebla); South (Chiapas and
Oaxaca); and Yucatan Peninsula (Campeche and Quintana Roo) (Figure 2A). We exclude
regressors in some regions to avoid near-perfect predictors and/or nonconvergence.
Results from the four region-specific cross-sectional probit regressions (Equation 3)
confirm what our summary statistics suggest: FSC certification is not randomly assigned across
FMUs (Table 5). Rather, observable time-invariant forest management, socioeconomic and

Resources for the Future Blackman, Goff, and Rivera Planter
22
geophysical land characteristics are correlated with certification. For example, in the North
region, certified FMUs tend to be larger, more carbon-rich, at lower altitudes, and closer to forest
edges. And in the South, they tend to have homogeneous forest management, to have permits for
harvesting nontimber forest products, and to be larger, less hilly, and farther from cities. Such
characteristics affect forest cover change (Boucher et al. 2011; Chomitz 2007; Kaimowitz and
Angelson 1998). Hence, these probit regression results underscore the importance of controlling
for preexisting observable characteristics in estimating treatment effects.
Table 5. FMU-Level Cross-Sectional Propensity Score Probit Results: Dependent Variable is FSC Certification in Any Year; Marginal Effects (s.e.)
Variable
North
(Chihuahua,
Durango, Jalisco)
Central
(Estado de México,
Puebla)
South
(Chiapas,
Oaxaca)
Yucatan Penin.
(Campeche,
Quintana Roo)
Forest management
homogeneous management –0.0029 0.0034* 0.0017*
(0.0018) (0.0019) (0.0010)
nontimber forest product 0.0003***
(0.0001)
percentage protected –0.0230 –0.0109 –0.0018
(0.0420) (0.0124) (0.0025)
FMU area 0.0014*** 0.0061 0.0007*** 0.0035***
(0.0003) (0.0051) (0.00023) (0.0014)
Socioeconomic
opportunity cost 0.0025 -0.0005 0.0005 –0.0136
(0.0026) (0.0010) (0.0008) (0.0117)
communal tenure 0.0008
(0.0012)
Geophysical
carbon 0.0637*** 0.0120 0.0084
(0.0121) (0.0104) (0.0142)
elevation –0.0651*** –0.0196 0.0179
(0.0190) (0.0149) (0.0225)
slope variability 0.0042 0.0031 –1.0867***
(0.0033) (0.0025) (0.4465)
aspect 0.0529 0.0046 –0.0214
(0.0364) (0.0159) (0.02001)
distance to city 0.0023 0.0056 0.0060*** –0.0296
(0.0040) (0.0065) (0.00201) (0.0218)
distance clearing in 2000 –0.0300** –0.0058 0.0036*** –0.0025
(0.0151) (0.0095) (0.0015) (0.0032)
No. observations 874 415 593 74
Log likelihood –99.4731 –29.7084 –23.2285 –15.2939
Pseudo R2 0.3372 0.2481 0.6285 0.2656
***, **, * = significant at 1, 5, 10% level

Resources for the Future Blackman, Goff, and Rivera Planter
23
6.2. Specification Tests
Before proceeding to the main regression results, we report results of formal hypothesis
tests to support our fixed effects model specification. We focus on results for the full sample of
18,103 FMU-years. To check the intuition that a pooled OLS model is unlikely to generate
unbiased estimates of treatment effects, we use Breusch and Pagan’s (1980) Lagrange multiplier
test, formally, a test of whether the variance of i (the intercept component of a composite error
term i+it derived from Equation 1) is zero, which is a necessary condition for OLS to be
consistent. The test rejects the null hypothesis of zero variance at the 1 percent level, implying
that an individual effects model, either random effects or fixed effects and not simple pooled
OLS, is appropriate. To choose between a random effects and fixed effects model, we use a
Hausman (1978) test of whether differences in coefficients from the two models are systematic.
We reject the null of no systematic differences at the 1 percent level, implying that a fixed effects
model, not a random effects model, is called for. Finally, we use a Chow (1960) test to determine
whether year-fixed effects, in addition to FMU-fixed effects, are needed, formally, a test of
whether year-fixed effects are jointly equal to zero. We reject the null hypothesis at the 1 percent
level, a result that indicates year-fixed effects are indeed appropriate.
6.3. Certification Effects: Main Models
Given these specification test results, we use OLS to estimate Equation 2, which includes
both FMU-fixed effects and year-fixed effects, for three different samples, each of which
corresponds to a different model (Table 6). Model 1 uses the full unmatched regression sample,
Model 2 uses the matched sample, and Model 3 uses the sample consisting only of ever-certified
FMUs. We estimate two specifications of each model, which we refer to as A and B.
Specification A includes fsc all years, which aims to pick up the average annual effect of
certification over all years during which certification was valid, including recertification years.
Specification B instead includes fsc first certification, which aims to pick up the average annual
effects that occur only during the initial five-year certification period. All models also include:
fsc anticipatory, which aims to pick up anticipatory effects that occur in the two years preceding
the initial certification period; fsc suspended, a dummy variable that controls for suspensions;
and fsc terminated, a dummy variable that controls for terminations. As noted above, in Model 2,
observations are weighted based on the number of times they are used as matches and in all
models, standard errors are clustered at the FMU level.

Resources for the Future Blackman, Goff, and Rivera Planter
24
Table 6. FMU-Level Panel-Data OLS Regression Results; Dependent Variable is Percentage FMU Cleared in Year t = 2001–2012; Treatment is FSC certification (s.e.)
Model No. 1A 1B 2A 2B 3A 3B
Sample Full Full Full Full Full Full
Control obs. unmatched unmatched matched matched FSC only FSC only
fsc all years 0.0002 0.0003 0.0004
(0.0003) (0.0003) (0.0004)
fsc first certification 0.0002 0.0003 0.0004
(0.0002) (0.0002) (0.0002)
fsc anticipatory 0.0000 0.0000 0.0001 0.0002 0.0002 0.0002
(0.0004) (0.0004) (0.0004) (0.0004) (0.0005) (0.0004)
fsc suspended –0.0003 –0.0001 0.0001
(0.0008) (0.0010) (0.0013)
fsc terminated –0.0003 –0.0004 –0.0002
(0.0004) (0.0004) (0.0006)
total timber volume 0.0000 0.0000 0.0000 0.0000 0.0000 0.0000
(0.0000) (0.0000) (0.0000) (0.0000) (0.0000) (0.0000)
lagged pop. density 0.0003 0.0003 –0.0004 –0.0005 –0.0021 –0.0028
(0.0004) (0.0004) (0.0014) (0.0014) (0.0038) (0.0036)
rainfall 0.0003 0.0003 0.0009** 0.0009* 0.0010* 0.0010*
(0.0006) (0.0006) (0.0005) (0.0005) (0.0006) (0.0006)
temperature 0.0299** 0.0299** 0.0699** 0.0716** 0.0574 0.0596
(0.0140) (0.0140) (0.0339) (0.0339) (0.0466) (0.0463)
Average clearing 0.0011 0.0011 0.0011 0.0011 0.0012 0.0012
FMU-fixed effects? yes yes yes yes yes yes
Year-fixed effects? yes yes yes yes yes yes
Clustered s.e.s? yes yes yes yes yes yes
Prob. weights? no no yes yes no no
No. FMUs 3,010 3,010 205 205 64 64
No. observations 18,103 18,103 1,390 1,390 457 457
R2 0.0000 0.0000 0.0032 0.0032 0.0025 0.0024
Prob > F 0.0000 0.0000 0.0098 0.0177 0.1169 0.1370
***, **, * = significant at 1, 5, 10% level
The results offer no evidence that FSC certification affects deforestation (Table 6). None
of the contemporaneous or lagged treatment dummy variables are statistically significant in any
of the six models.
It is interesting to note that, although insignificant, the point estimates of treatment
effects for years when certification is active (i.e., the coefficients on fsc all years and fsc first

Resources for the Future Blackman, Goff, and Rivera Planter
25
certification) are positive and range from 0.0002 to 0.0004. Were these estimates statistically
significant, the implication for the A models (which include fsc all years) would be that FSC
certification in an average certification year increases the percentage of the FMU cleared by two
to four one-hundredths of 1 percentage point. Using the average 2001‒2012 rates of forest loss in
the relevant regression samples as baseline deforestation rates (0.0011‒0.0012; see Table 1), that
translates into an 18‒33 percent increase in deforestation. The B models (which include fsc first
certification) also imply an 18‒33 percent increase in deforestation. But again, none of these
point estimates are statistically significant. Finally, note that we are not able to reject the null
hypothesis that all the regressors in Model 3 are jointly insignificant, a result that likely stems
from the relatively small sample size (n = 457).
6.4. Certification Effects: Robustness Checks
We estimated a variety of additional models to check the robustness of finding that FSC
certification does not affect deforestation. These models essentially search for an effect of
certification on deforestation occurring in subsamples of FMUs or with temporal lags not
represented in our main models.
6.4.1. Forest Management Units Using Selection Silviculture
In principle, certification’s effects on deforestation could depend on the FMU’s choice of
silvicultural system. For example, certification could have stronger effects in FMUs using
selection logging than in those using seed trees and clear-cutting. If that were the case, the effects
of FSC certification could be diluted in a pooled sample of FMUs using different systems. To
control for such effects, we estimate models using subsamples that include only FMUs using
selection logging. Insufficient degrees of freedom preclude testing subsamples using other
silvicultural systems.
The results for these models are qualitatively quite similar to those for the main models.
None of the certification treatment effects are statistically significant (Table 7). Although effects
estimated using the matched sample (Model 5) and FSC-certified only sample (Model 6), appear
to be slightly larger than those from analogous main models (Models 3 and 4), they are actually
quite similar when expressed as percentage changes above a baseline deforestation rate. Note
that using this subsample, we are able to reject at the 5 percent level the null hypothesis that all
regressors in the certified only model (Model 6) are jointly insignificant.

Resources for the Future Blackman, Goff, and Rivera Planter
26
Table 7. FMU-Level Panel-Data OLS Regression Results; Dependent Variable is Percentage FMU Cleared in Year t = 2001–2012; Treatment is FSC Certification;
Sample Includes Only FMUs Using Selection Silviculture (s.e.)
Model No. 4A 4B 5A 5B 6A 6B
Sample
Selection
Silv.
Selection
Silv.
Selection
Silv.
Selection
Silv.
Selection
Silv.
Selection
Silv.
Control obs. unmatched unmatched matched matched FSC only FSC only
fsc all years 0.0002 0.0002 0.0006
(0.0005) (0.0006) (0.0008)
fsc first certification 0.0004 0.0005 0.0006
(0.0003) (0.0004) (0.0005)
fsc anticipatory –0.0004 –0.0003 –0.0002 –0.0000 0.0002 0.0003
(0.0006) (0.0006) (0.0008) (0.0007) (0.0012) (0.0010)
fsc suspended –0.0009 –0.0006 0.0001
(0.0011) (0.0014) (0.0020)
fsc terminated –0.0005 –0.0006 0.0001
(0.0006) (0.0007) (0.0011)
Average clearing 0.0012 0.0012 0.0016 0.0016 0.0018 0.0018
Control variables yes yes yes yes yes yes
FMU-fixed effects? yes yes yes yes yes yes
Year-fixed effects? yes yes yes yes yes yes
Clustered s.e.s? yes yes yes yes yes yes
Prob. weights? no no yes yes no no
No. FMUs 2,539 2,539 131 131 246 246
No. observations 15,046 15,046 889 889 35 35
R2 0.0000 0.0000 0.0020 0.0020 0.0028 0.0026
***, **, * = significant at 1, 5, 10% level
6.4.2. Forest Management Units in Various Geographic Regions
In principle, certification’s effects on deforestation could depend on the unobserved
factors that vary across regions in Mexico. For example, as discussed above, some evidence
suggests that a particularly strong driver of certification in the north of Mexico has been forest
managers’ desire to access overseas markets, while a particularly strong driver in the south has
been the provision of subsidies by government and international agencies (Anta Fonseca 2006).
If certification, for some reason, had stronger effects when driven by some such factors than
others, then here again the effects of FSC certification could be diluted in a pooled sample of
FMUs. To control for variation across regions in unobservable confounders, we estimate separate
models for southern Mexico and the Yucatan Peninsula (Chiapas, Oaxaca, Campeche, Quintana
Roo) and northern Mexico (Chihuahua, Durango, Jalisco, Estado de Mexico, Puebla).

Resources for the Future Blackman, Goff, and Rivera Planter
27
Again, we find that none of the treatment effects are statistically significant (Tables 8 and
9). Expressed as percentage changes above a baseline deforestation rate, the estimated effects for
southern Mexico are similar in magnitude to those from the main models, ranging in all but one
case from 10 to 38 percent. However, those for northern Mexico are noticeably smaller, ranging
from –17 to 30 percent.
Table 8. FMU-Level Panel-Data OLS Regression Results; Dependent Variable is Percentage FMU Cleared in Year t = 2001–2012; Treatment is FSC Certification; Regional
Sample = South and Yucatan (Chiapas, Oaxaca, Campeche, Quintana Roo) (s.e.)
Model No. 7A 7B 8A 8B 9A 9B
Sample
S. &
Yucatan
S. &
Yucatan
S. &
Yucatan
S. &
Yucatan
S. &
Yucatan
S. &
Yucatan
Control obs. full full matched matched FSC only FSC only
fsc all years 0.0003 0.0006 –0.0000
(0.0004) (0.0006) (0.0016)
fsc first certification 0.0008 0.0011 0.0011
(0.0007) (0.0008) (0.0011)
fsc anticipatory –0.0005 –0.0001 0.0005 0.0010 –0.0003 0.0005
(0.0004) (0.0006) (0.0005) (0.0008) (0.0013) (0.0016)
fsc suspended –0.0003 0.0006 0.0016
(0.0009) (0.0020) (0.0044)
fsc terminated –0.0012 –0.0013 –0.0017
(0.0009) (0.0012) (0.0030)
Average clearing 0.0029 0.0029 0.0036 0.0036 0.0029 0.0029
Control variables yes yes yes yes yes yes
FMU-fixed effects? yes yes yes yes yes yes
Year-fixed effects? yes yes yes yes yes yes
Clustered s.e.s? yes yes yes yes yes yes
Prob. weights? no no yes yes no no
No. FMUs 666 666 51 51 19 19
No. observations 3,045 3,045 297 297 124 124
R2 0.0324 0.0324 0.0139 0.0141 0.0291 0.0216
***, **, * = significant at 1, 5, 10% level

Resources for the Future Blackman, Goff, and Rivera Planter
28
Table 9. FMU-Level Panel-Data OLS Regression Results; Dependent Variable is Percentage FMU Cleared in year t = 2001–2012; Treatment is FSC Certification; Regional Sample = North and Central (Chihuahua, Durango, Jalisco, Estado de Mexico, Puebla)
(s.e.)
Model No. 10A 710B 11A 11B 12A 12B
Sample N. & Central
N. &
Central
N. &
Central
N. &
Central
N. &
Central
N. &
Central
Control obs. full full matched matched FSC only FSC only
fsc all years 0.0001 0.0000 –0.0001
(0.0003) (0.0002) (0.0002)
fsc first certification –0.0000 –0.0000 0.0000
(0.0002) (0.0002) (0.0002)
fsc anticipatory 0.0000 –0.0000 0.0000 0.0000 0.0000 0.0001
(0.0006) (0.0005) (0.0005) (0.0005) (0.0005) (0.0005)
fsc suspended –0.0001 –0.0002 –0.0004
(0.0003) (0.0002) (0.0003)
Average clearing 0.0003 0.0003 0.0005 0.0005 0.0006 0.0006
Control variables yes yes yes yes yes yes
FMU-fixed effects? yes yes yes yes yes yes
Year-fixed effects? yes yes yes yes yes yes
Clustered s.e.s? yes yes yes yes yes yes
Prob. weights? no no yes yes no no
No. FMUs 1,289 1,289 154 154 44 44
No. observations 9,161 9,161 1,093 1,093 327 327
R2 0.0327 0.0328 0.0898 0.0901 0.1356 0.1352
***, **, * = significant at 1, 5, 10% level
6.4.3. Single-Year Lagged Effects
Finally, we estimate models to identify effects that may have occurred with lags not
represented in our main models. The main models generate estimates of the average effect of
certification over a span of years: the coefficient on fsc all years can be interpreted as the
average annual effect over the entire duration of certification which, given repeated
recertifications, may be upward of 15 years, while the coefficient on fsc first certification can be
interpreted as the average annual effect during the initial five-year certification period. These
estimates may miss effects that tend to occur only in certain years just before or just after
certification.
To test for such effects, we estimate models with a vector of binary variables indicating
that certification was awarded n years ago, that is, for fsc year n where n ranges from ‒2 to 10. In

Resources for the Future Blackman, Goff, and Rivera Planter
29
addition, we include fsc year 11‒15, that indicates, for a given FMU-year, that certification
began 11 to 15 years earlier. To control for the effects of the suspension and termination of FSC
certification, we include interaction terms that identify the years in which these actions were
applied. That is, we interact fsc year n with fsc suspended and fsc terminated. Similarly, we
interact fsc year 11‒15 with fsc suspended and fsc terminated. Due to collinearity, we do not
include the interaction between fsc year n and fsc suspended for all years. Rather, we include the
most comprehensive set of interaction terms in which none of the binary variables are dropped
due to collinearity.
Again, we find none of the treatment effects are statistically significant in any of the
models, including those using the full sample (Figure 3), the matched sample (Figure 4), and the
certified only sample (Figure 5). Although the temporal response function is not statistically
significant, it is interesting to note that its shape is quite consistent across models: the point
estimate of the effect is close to zero for most years, but spikes in year four and then drops
precipitously in year five, which is the year preceding recertification. This shape hints at a
tendency of forest managers to clear forest in anticipation of a recertification audit. Results for
the subsample of FMUs practicing selection silviculture are qualitatively quite similar (Figures
A1–A3).
Figure 3. Estimated Coefficients for Single-Year Lagged Certification Dummy Variables: Fixed Effects Model; Full Sample

Resources for the Future Blackman, Goff, and Rivera Planter
30
Figure 4. Estimated Coefficients for Single-Year Lagged Certification Dummy Variables: Fixed Effects Model; Matched Control FMUs; Full Sample
Figure 5. Estimated Coefficients for Single-Year Lagged Certification Dummy Variables: Fixed Effects Model; Certified FMUs Only
Resources for the Future Blackman, Goff, and Rivera Planter
31
7. Discussion
We have used a rich FMU-level 2001–2012 panel data set—comprising information on
forest loss, certification, regulatory permitting, and geophysical and socioeconomic land
characteristics—along with econometric techniques that aim to control for both observed and
unobserved confounding factors, to identify the effect of FSC certification on deforestation in
Mexico, a country with both considerable FSC certification and deforestation. To our
knowledge, ours is among the first such analyses to use panel data techniques that control for
unobserved time-invariant heterogeneity. We find significant differences in the observed
characteristics of FSC-certified FMUs. For example, in certain regions in Mexico, certified
FMUs tend to be relatively large, carbon-rich, at high altitudes, and far from cities and previous
clearing. Our econometric analysis aims at controlling for these and other confounders.
The results of this analysis offer no evidence that FSC certification affects deforestation.
Because certification could in principle affect forests differently over time, we tested for a range
of temporal effects, including anticipatory effects, contemporaneous effects, single-year lagged
effects, and cumulative lagged effects. And because certification’s effects could in principle
differ across subgroups, we tested for effects among subsamples of FMUs using a specific
silvicultural practice (selection logging) and in two geographic regions (North and South). None
of these tests rejected the null hypothesis that certification does not affect deforestation.
Moreover, in most of our models, point estimates of treatment effects were positive. Very few
were negative.
Our analysis has at least three significant limitations. First, we are able to test for
certification’s effects only on deforestation. We are not able to test for effects on forest
degradation. As discussed below, in principle, FSC certification’s main environmental benefit
could be to stem degradation. Second, lacking a valid instrumental variable, we are not able to
control for time-varying confounding factors. Such factors could drive our findings if forest
managers’ decisions to seek certification were temporally correlated with spikes in forest loss
due to unobserved factors—that is, if forest managers experiencing spikes in forest loss tended to
seek certification. However, we are aware of no anecdotal or other type of evidence of such
correlation. Finally, lacking reliable data on harvest zones, we have conducted our analysis at the
FMU level, not at the harvest zone level. As discussed above, that has the advantage of
controlling for intra-FMU spillovers. However, it also implies that we are not able to measure
effects that occur only inside or outside of harvest zones.
That said, our findings comport with several studies on certification’s effects on
environmental outcomes. These include five of the six existing quantitative studies that purport

Resources for the Future Blackman, Goff, and Rivera Planter
32
to control for confounding factors (Nordén et al. 2015; Rico Staffron 2015; Panlasigui 2015;
Barbosa de Lima et al. 2009; Kukkonen et al. 2008) and several studies of CARs (Blackman et
al. 2014; Nebel et al. 2005; Rametsteiner and Simula 2003).
Identifying causal factors that might explain our results is beyond the scope of our
analysis. However, at least two complementary hypotheses are possible, if not plausible. One is
that in Mexico, FSC certification has not spurred significant improvements in forest
management. Rather, the improvements that forest managers have made associated with
certification have either been minor and/or focused on nonenvironmental factors. That is the
conclusion of a recent study of more than 1,000 CARs issued to 35 Mexican FMUs in which the
authors found that the vast majority addressed minor procedural issues and focused on social,
economic, and legal issues rather than environmental ones (Blackman et al. 2014).
A second possibility is that even if FSC certification did spur significant changes in forest
management, these changes had more substantial effects on forest degradation, which our
outcome measure does not pick up, than on deforestation. An important implication is that our
results do not necessarily imply that FSC certification does not have environmental benefits in
Mexico, only that its effects on forest loss are not discernible.
What are the policy implications of our findings? As just noted, they do not imply that
FSC certification has no environmental benefits, including stemming forest degradation.
However, they do suggest that its effects on deforestation may be limited. This finding should at
least give pause to policymakers using or considering using forest certification as a tool for
addressing that particular problem.

Resources for the Future Blackman, Goff, and Rivera Planter
33
References
Abadie, A., and G. Imbens. 2006. Large sample properties of matching estimators for average
treatment effects. Econometrica 74: 235–67.
Agencia de Servicios a la Comercialización y Desarrollo de Mercados Agropecuarios
(ASERCA). 2003. Ejidos shape files.
Anta Fonseca, S. 2006. Forest certification in Mexico. In B. Cashore, F. Gale, E. Meidinger, and
D. Newsom (eds.), Confronting sustainability: Forest certification in developing and
transitioning countries. Report 8. New Haven, CT: Yale School of Forestry and
Environmental Studies.
Auld, G., and L. Gulbrandsen. 2013. Private regulation in global environmental governance. In
R. Faulkner (ed.), The handbook of global climate and environment policy. Wiley-
Blackwell.
Barbosa de Lima, A., A. L. Novaes Keppe, F. E. Maule, G. Sparovek, M. Corréa Alves, and R.
F. Maule. 2009. Does certification make a difference? Impact assessment study on
FSC/SAN certification in Brazil. Available at:
https://www.imaflora.org/downloads/biblioteca/Does_certification_make_a_difference.p
df
Blackman, A., A. Raimondi, and F. Cubbage. 2014. Does forest certification in developing
countries have environmental benefits? Insights from Mexican Corrective Action
Requests. Resources for the Future Discussion Paper 14-06. Washington, DC.
Blackman A., and J. Rivera. 2011. Producer-level benefits of sustainability certification.
Conservation Biology 25(6): 1176–85.
Bray, D., C. Antinori, E. Duran, O. Magana, J. F. Mas, V. H. Ramos, R. Tardanico, J. M. Torres,
and A. Velazquez. 2006. Governance in the Maya Forest of Mexico and Guatemala:
Protected areas and community forests. Paper presented at World Bank Workshop on
Sustainable Development: The Role of Better Governance and Improved Institutions,
November 10, Washington, DC.
Brotto, L., D. Pettenella, L. Secco, and M. Masiero. 2010. Integrating FSC certification in
REDD+ projects: A guideline for project developers. Department of Land, Environment,
Agriculture and Forestry (LEAF). University of Padova.

Resources for the Future Blackman, Goff, and Rivera Planter
34
Boucher, D., P. Elias, K. Lininger, C. May-Tobin, S. Roquemore, and E. Saxon. 2011. The root
of the problem. What’s driving tropical deforestation today? Union of Concerned
Scientists.
Breusch, T., and A. Pagan. 1980. The Lagrange multiplier test and its application to model
specification in econometrics. Review of Economic Studies 47: 239–53.
Cartus, O., J. Kellndorfer, W. Walker, C. Franco, J. Bishop, L. Santos, and J. M. M. Fuentes.
2014. A national, detailed map of forest aboveground carbon stocks in Mexico. Remote
Sensing 6(6): 5559–88.
Cashore, B., F. Gale, E. Meidinger, and D. Newsom. 2006a. Confronting sustainability: Forest
certification in developing and transitioning countries. Report 8. New Haven, CT: Yale
School of Forestry and Environmental Studies.
———. 2006b. Introduction: Forest certification in analytical and historical perspective. In B.
Cashore, F. Gale, E. Meidinger, and D. Newsom (eds.), Confronting sustainability:
Forest certification in developing and transitioning countries. Report 8. New Haven, CT:
Yale School of Forestry and Environmental Studies.
Cervigni, R., and A. Brizzi. 2001. Biodiversity. In M. Guigale, O. Lafourcade, and V. Nguyen
(eds.), Mexico: A comprehensive development agenda for the new era. Washington, DC:
World Bank, Chapter 27.
Chomitz, K. 2007. At loggerheads? Agricultural expansion, poverty reduction and environment
in the tropical forests. Washington, DC: World Bank.
Chow, G. 1960. Tests of equality between sets of coefficients in two linear regressions.
Econometrica 28(3): 591–605.
Cochrane, W., and D. Rubin. 1973. Controlling bias in observational studies: A review. Sankhya
Series 35: 417–46.
Ebeling, J., and M. Yasue. 2009. The effectiveness of market-based conservation in the tropics:
Forest certification in Ecuador and Bolivia. Journal of Environmental Management
90(2): 1145–53.
Farr, T. G., et al. 2007. The shuttle radar topography mission. Reviews of Geophysics 45.
Ferraro, P. and J. J. Miranda. 2012. Comparing experimental and non-experimental evaluation
designs using a large-scale randomized experiment in environmental policy. Working
Paper. Andrew Young School of Policy Studies, Georgia State University: Atlanta.
Food and Agriculture Organization (FAO). 2011. State of the world’s forests 2011. Rome: FAO.

Resources for the Future Blackman, Goff, and Rivera Planter
35
Forest Stewardship Council (FSC). 2011. Recommendations and strategic framework for an FSC
climate change engagement. Forest Carbon Working Group. Bonn, Germany: FSC
International Center.
———. 2012. FSC principles and criteria for forest stewardship. FSC-STC-01-001 (V5-0) EN.
Available at: https://ic.fsc.org/the-revised-pc.191.htm. Accessed February 20, 2014.
———. 2014a. Global FSC certificates: Type and distribution. November.
———. 2014b. FSC website: https://ic.fsc.org/.
Greene, W. 2008. Econometric analysis (6th Edition). Saddle River, NJ: Prentice Hall.
Hagan, J., L. Irland, and A. Whitman. 2005. Changing timberland ownership in the northern
forest and implications for biodiversity. Report #MCCS-FCP-2005-1. Brunswick, ME:
Manomet Center for Conservation Sciences.
Hansen, M. C., P. V. Potapov, R. Moore, M. Hancher, S. A. Turubanova, A. Tyukavina, D.
Thau, S. V. Stehman, S. J. Goetz, T. R. Loveland, A. Kommareddy, A. Egorov, L. Chini,
C. O. Justice, and J. R. G. Townshend. 2013. High-resolution global maps of 21st-
century forest cover change. Science 342 (15 November): 850–53.
Hausman, J. 1978. Specification tests in econometrics. Econometrica 46: 1251–71.
Ho, D., K. Imai, G. King, and E. Stuart. 2007. Matching as nonparametric preprocessing for
reducing model dependence in parametric causal inference. Political Analysis 15: 199–
236.
Huffman, G. J., E. F. Stocker, D. T. Bolvin, E. J. Nelkin, and R. F. Adler. 2012, last updated
2013: TRMM Version 7 3B42 and 3B43 Data Sets. NASA/GSFC, Greenbelt, MD.
Humphreys, D. 1996. Forest politics: The evolution of international cooperation. London:
Earthscan.
Imbens, G., and J. Wooldridge. 2009. Recent developments in the econometrics of program
evaluation. Journal of Economic Literature 47(11): 5–86.
Instituto Nacional de Ecología y Cambio Climactico (INECC). 2013. Digitized SEMARNAT
forestry permits for 16 Mexican States. Mexico, DF: INECC.
Kaimowitz, D., and A. Angelsen. 1998. Economic models of tropical deforestation: A review.
Bogor, Indonesia: Center for International Forestry Research.

Resources for the Future Blackman, Goff, and Rivera Planter
36
Kukkonen, M., H. Rita, S. Hohnwald, and A. Nygren. 2008. Treefall gaps of certified,
conventionally managed and natural forests as regeneration sites for Neotropical timber
trees in northern Honduras. Forest Ecology and Management 255(7): 2163–76.
Madrid, L., J. M. Núñez, G. Quiroz, and Y. Rodríguez. 2010. La propiedad social forestal en
México. Investigación Ambiental 1(2): 179–96.
Meidinger, E., C. Elliott, and G. Oesten (eds.). 2003. Social and political dimensions of forest
certification. Remagen: Oberwinter, Germany.
Milder, J., L. Gross, and A. Class. 2012. Assessing the ecological impacts of agriculture eco-
certification and standards: A global review of the science and practice. Internal Report.
Washington, D.C.: EcoAgricutlure Partners.
Miteva, S., C. Loucks, and S. Pattanayak. 2015. Social and environmental impacts of forest
management certification in Indonesia. PLOS One 10(7): e0129675.
doi:10.1371/journal.pone.0129675.
Miteva, D., S. Pattanayak, and P. Ferraro. 2012. Evaluation of biodiversity policy instruments:
What works and what doesn’t? Oxford Review of Economic Policy 28(1): 69–92.
Moore, S., F. Cubbage, and C. Eicheldinger. 2012. Impacts of Forest Stewardship Council (FSC)
and Sustainable Forestry Initiative (SFI) forest certification in North America. Journal of
Forestry 110(2): 79–88.
National Aeronautics and Space Administration (NASA). 2001. Land Processes Distributed
Active Archive Center (LP DAAC). MOD11A2. USGS/Earth Resources Observation and
Science (EROS) Center, Sioux Falls, SD.
Nebel, G., L. Quevedo, J. Bredahl Jacobsen, and F. Helles. 2005. Development and economic
significance of forest certification: The case of FSC in Bolivia. Forest Policy and
Economics 7(2): 175–86.
Nelson, A. 2008. Estimated travel time to the nearest city of 50,000 or more people in year 2000.
Global Environment Monitoring Unit–Joint Research Centre of the European
Commission, Ispra, Italy.
Newsom, D., V. Bahn, and B. Cashore. 2006. Does forest certification matter? An analysis of
operation-level changes required during the SmartWood certification process in the
United States. Forest Policy and Economics 9: 197–208.
Newsom, D., and D. Hewitt. 2005. The global impacts of SmartWood certification. Rainforest
Alliance. June 9.

Resources for the Future Blackman, Goff, and Rivera Planter
37
Nordén, A., J. Coria, and L. Villalobos. 2015. Impact evaluation of forest certification in
Sweden. Working Paper. University of Gothenburg Department of Economics.
Organisation for Economic Co-operation and Development (OECD). 2003. Mexico
Environmental Performance Review. Paris: OECD.
Panlasigui, S. 2015. Evaluating the impact of Forest Stewardship Council Certification on forest
loss rates in Cameroon’s logging concessions. Master’s thesis. Nicholas School of the
Environment, Duke University, Durham, NC.
Peña-Claros, M., S. Blommerde, and F. Bongers. 2009. Assessing the progress made: An
evaluation of forest management certification in the tropics. Tropical Resource
Management Papers 95, Wageningen University, The Netherlands.
Rametsteiner, E., and M. Simula. 2003. Forest certification: An instrument to promote
sustainable forest management? Journal of Environmental Management 67: 87–98.
Registro Agrario Nacional (RAN). Undated. Land tenure data.
Rickenbach, M., and C. Overdevest. 2006. More than markets: Assessing Forest Stewardship
Council (FSC) certification as a policy tool. Journal of Forestry 104(3): 143–47.
Rico Staffron, J. 2015. Deforestation impacts of the Forest Stewardship Council (FSC)
certification in the Peruvian Amazon. Master’s thesis. Nicholas School of the
Environment, Duke University, Durham, NC.
Romero, C., F. Putz, M. Guariguata, E. Sills, P. Cerutti, and G. Lescuyer. 2013. An overview of
current knowledge about the impacts of forest management certification: A proposed
framework for its evaluation. Occasional Paper 91. Bogor, Indonesia: Center for
International Forestry Research.
Rosenbaum, P., and D. Rubin. 1983. The central role of the propensity score in observational
studies for causal effects. Biometrika 70: 41–55.
Simpson, H., J. Donellan, and S. Harrington. 2005. Voluntary implementation of best
management practices in East Texas: Results from Round 6 of BMP Implementation
Monitoring. College Station: Texas Forest Service.
http://txforestservice.tamu.edu/shared/article.asp?DocumentID=950&mc=forest.

Resources for the Future Blackman, Goff, and Rivera Planter
38
Appendix 1.
Forest Stewardship Council International Principles and Criteria (FSC-STD-01-001 V5-0 EN, 2012)
Principles (first level) and Criteria (second level) are abbreviated. For the full text, see
https://ic.fsc.org/principles-and-criteria.34.htm.
1. Compliance with laws
1.1. Legal status of organization to be certified (“organization”)
1.2. Legal status of management unit
1.3. Legal rights to operate management unit
1.4. Illegal resource use
1.5. Compliance with laws, conventions, codes of practice
1.6. Resolution of disputes over issues of law
1.7. Corruption
1.8. Commitment to FSC Principles and Criteria
2. Workers’ rights and employment conditions
2.1. Principles of International Labor Organization
2.2. Gender equality
2.3. Health and safety practices
2.4. Living wages
2.5. Job training
2.6. Grievance resolution
3. Indigenous people’s rights
3.1. Identification of indigenous peoples
3.2. Legal and customary rights
3.3. Prior consent
3.4. Rights, customs, and culture
3.5. Sites of special significance
3.6. Traditional knowledge
4. Community relations
4.1. Identification of local communities
4.2. Legal and customary rights
4.3. Opportunities for employment and training
4.4. Engagement with local communities
4.5. Avoidance of negative impacts
4.6. Grievance resolution
4.7. Sites of special significance
4.8. Traditional knowledge

Resources for the Future Blackman, Goff, and Rivera Planter
39
5. Benefits from the forest
5.1. Benefits from a range of ecosystem services
5.2. Sustainable harvest levels
5.3. Planning for positive and negative externalities
5.4. Use of local value added services
5.5. Commitment to long-term economic viability
6. Environmental values and impacts
6.1. Assessment of environmental values
6.2. Assessment of potential impacts on environmental values
6.3. Actions to prevent and mitigate negative impacts
6.4. Protection of rare and threatened species
6.5. Protection/restoration of native ecosystems
6.6. Maintenance of biological diversity
6.7. Protection/restoration water resources
6.8. Enhancing resilience
6.9. Conversion of natural forests to plantations, and plantation to other uses
6.10. Plantations
7. Management planning
7.1. Management policies and objective
7.2. Management plan
7.3. Verifiable targets
7.4. Revisions of plan
7.5. Transparency
7.6. Stakeholder engagement
8. Monitoring and assessment
8.1. Implementation of management plan
8.2. Environmental and social impacts
8.3. Analysis of monitoring results
8.4. Transparency
8.5. Tracking and tracing system
9. High conservation values
9.1. Assessment
9.2. Maintenance and enhancement
9.3. Precautionary approach
9.4. Periodic monitoring
10. Implementation of management activities
10.1. Regeneration
10.2. Species used for regeneration
10.3. Alien species
10.4. Genetically modified organisms
10.5. Silvicultural practices
10.6. Fertilizers

Resources for the Future Blackman, Goff, and Rivera Planter
40
10.7. Integrated pest management
10.8. Biological control agents
10.9. Natural hazards
10.10. Infrastructure development
10.11. Conservation of environmental values
10.12. Waste disposal

Resources for the Future Blackman, Goff, and Rivera Planter
41
Appendix 2.
Table A1. 64 Certified Forest Management Units in Regression Sample
State Municipio Name Tenure
First year
certified
Last year
certified
Size
(ha)
Chiapas Cintalapa P.P. Los Ocotones P 2008 2020 1,373
Chihuahua Guadalupe y Calvo Ejido El Tule y Portugal E 2013 2018 8,843
Chihuahua Guadalupe y Calvo Ejido La Trinidad E 2002 2019 43,722
Chihuahua Guadalupe y Calvo Ejido Redondeados E 2005 2007 82,156
Chihuahua Madera Ejido El Largo y Anexos E 2001 2017 261,460
Durango Durango Ejido Agustin Melgar E 2002 2007 7,050
Durango Durango Ejido Centenario E 1998 2010 4,353
Durango Durango Ejido Cienega de Caballos E 2004 2017 6,318
Durango Durango Ejido Echeverria de la Sierra E 1998 2008 5,484
Durango Durango Ejido el Encinal E 1999 2005 7,073
Durango Durango Ejido el Nayar E 2002 2012 4,975
Durango Durango Ejido Llano Grande E 2012 2017 10,946
Durango Durango Ejido San Isidro E 2002 2007 7,348
Durango Pueblo Nuevo Com. San B. de Milpillas Chico C 2004 2017 153,202
Durango Pueblo Nuevo Ejido Adolfo Ruiz Cortinez E 2010 2015 4,224
Durango Pueblo Nuevo Ejido Antonio Molina Deras E 2011 2014 7,882
Durango Pueblo Nuevo Ejido Chavarria Nuevo E 2005 2010 8,374
Durango Pueblo Nuevo Ejido Chavarria Viejo E 2005 2017 9,788
Durango Pueblo Nuevo Ejido el Brillante E 2004 2014 9,517
Durango Pueblo Nuevo Ejido la Campana E 2004 2014 5,932
Durango Pueblo Nuevo Ejido la Ciudad E 2002 2018 13,795
Durango Pueblo Nuevo Ejido la Victoria E 2001 2020 10,761
Durango Pueblo Nuevo Ejido las Bayas E 2013 2018 4,323
Durango Pueblo Nuevo Ejido los Bancos E 2015 2020 3,652
Durango Pueblo Nuevo Ejido Pueblo Nuevo E 2000 2016 166,755
Durango Pueblo Nuevo Ejido San Esteban y Anexos E 2001 2018 9,685
Durango San Dimas Ejido Duraznitos y Picachos E 2004 2014 3,410
Durango San Dimas Ejido La Manga y Anexos E 2004 2014 6,305
Durango San Dimas Ejido San Jose de Causas E 2006 2011 7,613
Durango San Dimas Ejido San Pedro E 2007 2019 9,822
Durango San Dimas Ejido Vencedores E 2002 2018 23,926
Durango San Dimas P.P. Lote 1 Fr. II de la Trinidad P 2002 2007 300
Durango Santiago Papasquiaro Ejido Salto de Camellones E 2001 2019 10,641
Durango Santiago Papasquiaro Ejido San Diego de Tenzaenz E 2001 2018 60,468
Durango Tepehuanes Com. el Tarahumar y Bajios … C 2003 2019 73,310
Durango Tepehuanes Comunidad Lobos y Pescaderos C 2012 2017 30,115
Est. de Mex. Coatepec Harinas Ejido Agua Bendita E 2014 2019 1,002
Jalisco Pihuamo Ejido Barranca del Calabozo E 2009 2014 2,073
Michoacan Nuevo Parangaricutiro Com. Nuevo San Juan Parang. C 2006 2011 18,138
Oaxaca Capulalpam de Mendez Com. Capulalpam de Mendez* C 1996 2012 3,843
Oaxaca Ixtlan de Juarez Comunidad Ixtlan de Juarez C 2001 2017 18,180

Resources for the Future Blackman, Goff, and Rivera Planter
42
Oaxaca Nuevo Zoquiapam Comunidad Nuevo Zoquiapam C 2005 2009 9,465
Oaxaca S. Juan B. Jayacatlan Com. S. Juan Bautista Jayacatlan C 2003 2008 12,300
Oaxaca San Juan Quiotepec Com. S. Miguel Maninaltepec C 2006 2009 13,743
Oaxaca San Miguel Aloapam Comunidad San Miguel Aloapam C 2005 2008 13,518
Oaxaca Santa Catarina Ixtepeji Com. Santa Catarina Ixtepeji C 2006 2017 21,059
Oaxaca Santiago Comaltepec Comunidad Santiago Comaltepec* C 1996 2012 18,070
Oaxaca Santiago Textitlan Comunidad Santiago Textitlan C 2001 2018 28,146
Oaxaca Santiago Xiacui Comunidad la Trinidad Ixtlan* C 1996 2012 805
Oaxaca Santiago Xiacui Comunidad Santiago Xiacui* C 1996 2012 1,681
Oaxaca Zimatlan de Alvarez Comunidad San Pedro el Alto C 2001 2018 30,048
Puebla Chignahuapan C.P. Innominado … Chignahuapan P 2015 2020 43
Puebla Chignahuapan Ejido Cruz Colorada E 2013 2018 1,055
Puebla Chignahuapan Ejido el Manantial E 2014 2019 395
Puebla Chignahuapan Ejido Llano Grande E 2012 2017 2,446
Puebla Chignahuapan Ejido Llano Verde E 2013 2018 814
Puebla Chignahuapan Ejido Piedra Ancha 2 Ampliacion E 2012 2017 1,014
Puebla Zacatlan Ejido Rancho Nuevo Nanacamila E 2013 2018 490
Quintana Roo Felipe Carrillo Puerto Ejido Laguna Kana E 2001 2006 18,495
Quintana Roo Felipe Carrillo Puerto Ejido Naranjal Poniente E 2001 2006 12,620
Quintana Roo Felipe Carrillo Puerto Ejido Petcacab E 2005 2009 59,721
Quintana Roo Othon P. Blanco Ejido Caoba E 2005 2018 67,781
Quintana Roo Othon P. Blanco Ejido Chac-Choben E 2006 2009 18,654
Quintana Roo Othon P. Blanco Ejido Tres Garantias E 2005 2009 43,678
*Certified jointly as Unión de Comunidades Productoras Forestales Zapotecas-Chinantecas de la Sierra de Juárez
(UZACHI). Tenure: E = ejido; C = comunidad; P = private.
Sources: Rainforest Alliance, Consejo Civil Mexicano para la Silvicultura Sostenible.

Resources for the Future Blackman, Goff, and Rivera Planter
43
Figure A1. Estimated Coefficients for Single-Year Lagged Certification Dummy Variables: Fixed Effects Model; FMUs Using Selection Silviculture Only

Resources for the Future Blackman, Goff, and Rivera Planter
44
Figure A2. Estimated Coefficients for Single-Year Lagged Certification Dummy Variables: Fixed Effects Model; Matched Control FMUs;
FMUs Using Selection Silviculture Only

Resources for the Future Blackman, Goff, and Rivera Planter
45
Figure A3. Estimated Coefficients for Single-Year Lagged Certification Dummy Variables: Fixed Effects Model; Certified FMUs Using Selection Silviculture Only