Embed Size (px)
Citation preview
358
Journal of Advanced Management Science Vol. 1, No. 4, December 2013
©2013 Engineering and Technology Publishingdoi: 10.12720/joams.1.4.358-362
Does Enterprise Risk Management Create Value
Norlida Abdul Manab Department of Banking and Risk Management, School of Economics, Finance and Banking, Universiti Utara Malaysia,
Malaysia
E-mail: [email protected]
Zahiruddin Ghazali
Department of Finance, School of Economics Finance and Banking, Universiti Utara Malaysia, Malaysia
E-mail: [email protected]
Abstract—This research paper examines whether the
enterprise risk management (ERM) practices can create
value to Malaysian public listed companies (PLCs) in
Malaysia. The sample consists of 417 PLCs in Malaysia. The
analysis focuses on the companies’ financial characteristics
by using stepwise multiple regressions. This research
ventures into understanding the influence of financial ratios
and risk management on shareholders wealth. The findings
show that return on equity, opacity, debt over asset,
operating margin, cost of financing and taxation, and
financial slack are significant for financial companies. While,
only return on asset is significant for financial companies.
This is could be due to the nature of financial companies that
are highly regulated.
Index Terms—enterprise risk management, shareholder
value, corporate governance, public listed companies,
Malaysia
I. INTRODUCTION
The disintegration of traditional risk management (TRM)
and also the influences of external and internal factors to
business risks, as well as the rapid growth of economies,
have triggered more demand and enforcement of effective
risk management by most countries. It is widely accepted
that effective risk management is the core of successful
companies, regardless of size or industry sector. A series of
company failures, corporate scandals, and frauds are other
reasons for companies to effectively implement risk
management.
In Malaysia, the 1997 Asian financial crisis had affected
one tenth of the 800 public-listed companies on the Bursa
Malaysia and poor risk management was cited as a major
factor of the companies’ failure [1]. This has caused more
severe corporate governance problems in publicly listed
companies. The problems include ineffective board of
directors, and lack of awareness and responsibilities
among members of the boards.
Subsequently, after the crisis, the issue of corporate
governance has received much attention in Malaysia where
the government directly emphasized the listed companies
Manuscript received July 10, 2013; revised September 28, 2013.
to be more proactive in controlling risk and maintaining
good reporting. In the Malaysian Code on corporate
governance 2000, risk management initiative has been
integrated as one of the important part of corporate
governance code and has been cited as a key responsibility
of the board of directors.
The Code is incorporated into the new Bursa Listing
Requirements and it is applied to all PLCs in Malaysia. The
PLCs are required to disclose their Risk Management,
Internal Control and Corporate Governance Guidelines in
the annual report to ensure the transparency in delivering
information to their shareholders, stakeholders, and other
related bodies.
However, financial companies are highly regulated
compared to other types of companies [2], [3]. This is
because they are exposed to financial risk, which is more
complex and requires a broad skill and knowledge with
specific tools to manage risks. Corporate governance
compliance has been cited as the most motivation factor for
non-financial companies to implement ERM [4].
Effectively managing or controlling the factors that
cause risk can result in market leadership, increasing a
company’s growth and investor confidence [5]. Corporate
entities believe that the successful operation of any
business depends on risk management [6]. This has been
highlighted as in [7], that there is evidence in terms of
theories that show how value can be created from the
adoption and application of risk management and how risk
can also destroy corporate value.
Shareholder value is a financial indicator that has been
used as a measurement of reference to the successful
implementation of ERM practices. Reference [8] (p.38)
noted that ERM “must be ‘measurable’ and the value
proposition will assist companies to create competitive
advantage, improve business performance and reduce
cost”. Several research findings agreed that ERM
implementation can reduce the overall risk profile by
reducing the cost of capital and increasing the company’s
performance, and these will lead to maximise shareholder
value [9]. Reference [10] found that ERM helps companies
to manage the bottom line and increases shareholder value
by increasing earnings growth, revenue growth, return on
capital, earning consistency, and reducing expenses.
359
Journal of Advanced Management Science Vol. 1, No. 4, December 2013
©2013 Engineering and Technology Publishing
Earnings growth and revenue growth are the top business
issues [11].
With regard to the ERM practices, there is almost no
direct empirical evidence that shows value to be created by
ERM and the link is more theoretical rather than being
proven by hard empirical fact [12]. This is aligned with the
statement as in [13], where there is no prior study has
considered the value relevance of ERM practices.
Reference [14] found that only some firms that adopted
ERM experience a reduction in earnings volatility and the
overall study failed to find support that ERM is value
creating. Other prior studies have only found empirical
evidence of a positive relationship between specific forms
of risk management and firm’s value. Thus, this study is
intended to examine whether ERM practices and corporate
governance compliance can influence shareholder value
among Malaysian public listed companies.
II. ERM CONCEPT AND VALUE CREATION
There are four important issues in the ERM concept.
Firstly, ERM views risk as being more complete,
consistent, and collective rather than focusing only on
hazard or financial risk [15]. It engages with all types of
risk, which are currently faced by business organisations.
The risks are commonly categorised as hazard risk,
financial risk, operational risk, and strategic risk [16]-[18].
Secondly, ERM is a process. Refer to the reference
number, as in [19], ERM is a framework that involves a
process of identifying, defining, quantifying, comparing,
prioritising, and treating all types of risks facing an
organisation. Reference [19] added that the ERM process
requires a wide range of tools and methodologies, which
helps to explain the relationship between risk profile and
its impact on shareholder value.
Thirdly, the ERM involves the overall human resource,
that is, people at all levels of the entire organisation. The
ERM programme is initiated by the board of directors and
they are primarily responsible for risk management
activities in order to safeguard a company’s asset. The
successful implementation of ERM highly depends on the
efficiency and the effectiveness of the management, where
it is required to identify and evaluate the company’s risks
and to design, operate, and control an internal control
system to address those risks [20]. The employees, as
bottom level staff, also play an important role in ERM
implementation. They are responsible for the daily
operation of the internal control system. In essence, ERM
is not just about responsibilities, but it is the way how
people work and the way they relate to the strategy and
growth in order to achieve the company’s objective [21].
Finally, the ERM underlying concept is that each type of
organisation whether profit, non-profit, or government
agency, provides value for its stakeholders [22]. This had
been stressed in the definitions of ERM and in the ERM
concept itself. The ERM definition as in [23] showed the
important role of ERM in creating shareholder value in an
organisation. This is agreed by other reference number, as
in [24] that the function of ERM is to drive value creation,
either in terms of financial and non-financial aspects.
Even though shareholder value has been stressed as the
most significant impact of ERM implementation by many
authors and researchers, the increase in shareholder value
does not necessarily mean that the organisational risk
management programme has been successfully
implemented and has achieved the objectives. According
to the reference number, as in [25], the contribution of risk
management to shareholder value has been discussed
widely, especially in financial risk management. Reference
[25] analysed the theoretical argument between financial
risk management and value creation and proved it in terms
of empirical evidence. The study had showed that risk
management at the company level represents a means to
increase shareholder value. Reference [26] also discovered
that investors valued company specific risk management
activities. However, there is only a little empirical support
to theories that showed risk management as a means to
maximise shareholder value.
III. METHODOLOGY
The public listed companies (PLCs) were selected as the
population of this study for the reason that normally ERM
is adopted by the larger organisations, such as the PLCs
and multinational companies. Furthermore, the PLCs
would have to exercise the best practice of corporate
governance under the Malaysian Code of Corporate
Governance and Bursa Malaysia Listing Requirements
where risk management is part of it.
The selection of the companies was based on random
alphabetical of listed companies in the 2010 Bursa Listed
Companies Schedule. Nonetheless, all financial companies
(49 companies) are included in this study, in which they are
treated as placebo (control) samples. The primary reason
for employing these companies as control samples is
because they are highly regulated as compared to other
types of companies.
Table I shows the overall number of companies in this
study (417) which is roughly 43.81 percent of the whole
population. It comprises of 49 financial companies or 11.8
percent from the total sample of this study.
TABLE I. SAMPLES BY SECTOR
Sector
Frequency
Percent
Cumulative
Percent
Construction 19 4.6 4.6
Consumer 44 10.6 15.1
Finance (Placebo) 49 11.8 26.9
Hotels 3 0.7 27.6
Ind-Pod 102 24.5 52.0
IPC 2 0.5 52.5
Plantation 22 5.3 57.8
Properties 79 18.9 76.7
Reits 16 3.8 80.6
Technology 9 2.2 82.7
Trade and Services 72 17.3 100.0
Total
417
100.0

360
Journal of Advanced Management Science Vol. 1, No. 4, December 2013
©2013 Engineering and Technology Publishing
For the purpose of this study, stepwise multiple
regressions are considered the most appropriate analysis.
The analysis focuses on the companies’ financial
characteristics which include leverage, net profit margin,
returns on asset, returns on equity, financial slacks, and
intangible assets and cost of financing and taxation (CFT).
The model can be written as follows:
OPCbSLKbROEbROAbNPMbCFTbADbaEPS 65433210 /
where,
EPS =earnings per share
D/A = total debt over total asset
CFT = cost of financing and taxation
NPM = net profit margin
ROA = returns on asset in current year
ROE = returns on equities in current year
SLK = cash and securities in hand
OPC = total intangible asset
e = error terms
IV. FINDINGS AND DISCUSSION
TABLE II. SUMMARY OF RESULT FOR SHAREHOLDER WEALTH
OVERALL SAMPLE MODEL
Variable Predic-
ted
Sign
Coeffi-
cient
Standar
d Error
t Signifi-
cance
Level
(Constant) .060 3.159 .002
ROE + .126 .039 6.258 .000
ROA + .136 .000 6.848 .000
Opacity - .125 .286 6.283 .000
Slack +/- .085 .224 4.064 .000
D/A - -.061 .153 -2.84
6
.004
Adjusted R2
0.066
F-Value 34.675a
Durbin-Watson 1.65
N 2872
Predictors: (Constant), Total Debt upon Total Asset (D/A), Cost of
Financing and Taxation (CFT), Net Profit Margin
(NPM), Return on Asset (ROA), Return on Equity
(ROE), Near Liquid Asset (SLK), Total Intangible
Asset (OPC)
Dependent Variable: EPS
Note: the expected sign. a, is 1% significance level
Table II illustrates the test result for the overall sample
for this study testing the relationship between several
aspects of risk management (in the financial ratios form)
and shareholders wealth. It is found that several variables
(5 out of 7) having significant relationships with
shareholders wealth (EPS). Based on the results, the
stepwise regression equation was as follows:
ADbSLKbOPCbROAbROEbaEPS /653210
The adjusted r-square for this model is 6.6 percent and
the F-value is 34.675. The F statistics which is significant
at the one percent level implies collectively, the variables
have significant impact on EPS. Nonetheless, only 6.6
percent of variation in shareholder wealth (EPS) could be
explained by variance of return on equity (ROE), return on
asset (ROA), opacity, financial slack and debt over asset.
The result is in line and as mooted with the previous study
that there is only a little empirical support that showed risk
management influenced the shareholder wealth.
As anticipated, all variables have the exact signs as
predicted except for opacity. It is expected, higher opacity
(β=-0.125, p<0.05) to decrease EPS as opacity is an
investment into intangible (opaque) asset. Opaque assets
are known not to produce valuable asset during bankruptcy
or financial distress. Nonetheless, the result does not
support the above explanation. Hence, investment in
opacity is in contrast to asset risk management.
TABLE III. SUMMARY OF RESULT FOR SHAREHOLDER WEALTH
NON-FINANCIAL SAMPLE MODEL
Variable Predic-
ted
Sign
Coeffi-
cient
Standard
Error
t Significan
ce Level
(Consta
nt)
.058 3.817 .000
ROA + -.283 .001 -14.56
3
.000
ROE + .108 .038 5.187 .000
Opacity - .124 .270 6.309 .000
D/A - -.063 .146 -3.003 .003
OPM + .092 .113 3.724 .000
CFnTax - -.061 .045 -2.530 .011
Slack +/- .050 .239 2.406 .016
Adjusted R2
0.134
F-Value 51.764a
Durbin-Watson 1.813
N 2499
Predictors: (Constant), Total Debt upon Total Asset (D/A), Cost
Dependent Variable: EPS
Note: the expected sign. a, is 1% significance level
Result for Non-financial companies sub-sample model
(Table III) produces an adjusted r-square of 13.4% with
F-value at 51.764 and significant at p=0.001. It is found
that all variables tested are significant and the stepwise
regression equation was as follows:
SLKbCFTbOPMbADbOOPCbROEbROAbaEPS 65433210 /
The findings showed that return on asset (ROA) was the
most important factor in explaining the shareholder wealth,
and this is followed by return on equity (ROE), opacity
(OPC), debt over asset (D/A), operating margin (OPM),
cost of financing and taxation (CFT), and cash and security
in hand (SLK). The value of R2 = 0.134 indicated that these
two EWRM critical success factors included in the
regression equation explained only 13.4 percent of the
variation of the shareholder value. This indicated that the
ERM was not the main factor that contributes to
shareholder value.
Nevertheless, two of the variables are not conforming to
the predicted signs. Both asset management ratio (ROA
and Opacity) suggest that non-financial companies’
shareholders wealth negatively related to efficient asset
management. This implies that companies to be less
361
Journal of Advanced Management Science Vol. 1, No. 4, December 2013
©2013 Engineering and Technology Publishing
efficient in asset management to enhance companies’
shareholder wealth.
Moreover, it is found that cash management (cost of
financing and taxation (CFT) and cash equivalent asset
(Slack) are significant contributing variables in enhancing
shareholder’ wealth. These two variables pose a risk to
shareholders wealth if not well managed. CFT is cash flow
that does not enhance companies’ value; and financial
slacks are non-invested companies’ cash. Nonetheless,
stepwise regression included these variables to be the last
and least influential variables in determining shareholders’
wealth. From the researcher’s points of view, this result is
due to indifferent sectorial classification causing the effect
of cash management to subside as a strong determinant to
shareholders’ wealth.
In light of companies riskiness measured by total debt
upon total asset (D/A)(β=-0.063,p<0.05), test result finds
the variable to be influential and align with known
knowledge to have a negative impact to shareholders
wealth. Lastly companies operating margin (OPM) a
measure of internal operational risk management, it is
found that it is tested significant and the impact it produces
is as expected as a substantial influential variable.
The overall results indicated that the risk management
practices in non-financial companies are likely to be
affected by accounting ratios and corporate governance
compliances. The results supported the previous finding as
in [17] that the MCCG compliance as a driven factor for
non-financial companies to implement ERM.
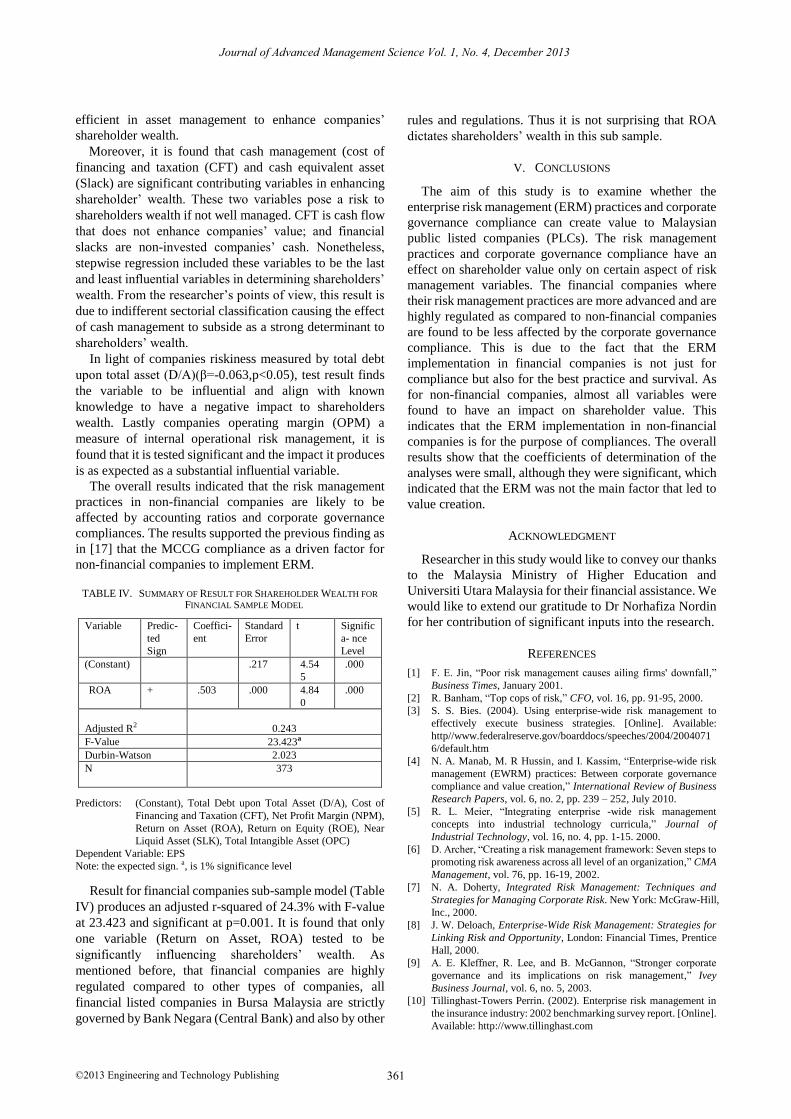
TABLE IV. SUMMARY OF RESULT FOR SHAREHOLDER WEALTH FOR
FINANCIAL SAMPLE MODEL
Variable Predic-
ted
Sign
Coeffici-
ent
Standard
Error
t Signific
a- nce
Level
(Constant)
.217 4.54
5
.000
ROA + .503 .000 4.84
0
.000
Adjusted R2
0.243
F-Value 23.423a
Durbin-Watson 2.023
N 373
Predictors: (Constant), Total Debt upon Total Asset (D/A), Cost of
Financing and Taxation (CFT), Net Profit Margin (NPM),
Return on Asset (ROA), Return on Equity (ROE), Near
Liquid Asset (SLK), Total Intangible Asset (OPC)
Dependent Variable: EPS
Note: the expected sign. a, is 1% significance level
Result for financial companies sub-sample model (Table
IV) produces an adjusted r-squared of 24.3% with F-value
at 23.423 and significant at p=0.001. It is found that only
one variable (Return on Asset, ROA) tested to be
significantly influencing shareholders’ wealth. As
mentioned before, that financial companies are highly
regulated compared to other types of companies, all
financial listed companies in Bursa Malaysia are strictly
governed by Bank Negara (Central Bank) and also by other
rules and regulations. Thus it is not surprising that ROA
dictates shareholders’ wealth in this sub sample.
V. CONCLUSIONS
The aim of this study is to examine whether the
enterprise risk management (ERM) practices and corporate
governance compliance can create value to Malaysian
public listed companies (PLCs). The risk management
practices and corporate governance compliance have an
effect on shareholder value only on certain aspect of risk
management variables. The financial companies where
their risk management practices are more advanced and are
highly regulated as compared to non-financial companies
are found to be less affected by the corporate governance
compliance. This is due to the fact that the ERM
implementation in financial companies is not just for
compliance but also for the best practice and survival. As
for non-financial companies, almost all variables were
found to have an impact on shareholder value. This
indicates that the ERM implementation in non-financial
companies is for the purpose of compliances. The overall
results show that the coefficients of determination of the
analyses were small, although they were significant, which
indicated that the ERM was not the main factor that led to
value creation.
ACKNOWLEDGMENT
Researcher in this study would like to convey our thanks
to the Malaysia Ministry of Higher Education and
Universiti Utara Malaysia for their financial assistance. We
would like to extend our gratitude to Dr Norhafiza Nordin
for her contribution of significant inputs into the research.
REFERENCES
[1] F. E. Jin, “Poor risk management causes ailing firms' downfall,”
Business Times, January 2001.
[2] R. Banham, “Top cops of risk,” CFO, vol. 16, pp. 91-95, 2000.
[3] S. S. Bies. (2004). Using enterprise-wide risk management to
effectively execute business strategies. [Online]. Available:
http//www.federalreserve.gov/boarddocs/speeches/2004/2004071
6/default.htm
[4] N. A. Manab, M. R Hussin, and I. Kassim, “Enterprise-wide risk
management (EWRM) practices: Between corporate governance
compliance and value creation,” International Review of Business
Research Papers, vol. 6, no. 2, pp. 239 – 252, July 2010.
[5] R. L. Meier, “Integrating enterprise -wide risk management
concepts into industrial technology curricula,” Journal of
Industrial Technology, vol. 16, no. 4, pp. 1-15. 2000.
[6] D. Archer, “Creating a risk management framework: Seven steps to
promoting risk awareness across all level of an organization,” CMA
Management, vol. 76, pp. 16-19, 2002.
[7] N. A. Doherty, Integrated Risk Management: Techniques and
Strategies for Managing Corporate Risk. New York: McGraw-Hill,
Inc., 2000.
[8] J. W. Deloach, Enterprise-Wide Risk Management: Strategies for
Linking Risk and Opportunity, London: Financial Times, Prentice
Hall, 2000.
[9] A. E. Kleffner, R. Lee, and B. McGannon, “Stronger corporate
governance and its implications on risk management,” Ivey
Business Journal, vol. 6, no. 5, 2003.
[10] Tillinghast-Towers Perrin. (2002). Enterprise risk management in
the insurance industry: 2002 benchmarking survey report. [Online].
Available: http://www.tillinghast.com

362
Journal of Advanced Management Science Vol. 1, No. 4, December 2013
©2013 Engineering and Technology Publishing
[11] J. A. Miccolis, K. Hively, and B. W. Merkly, Enterprise Risk
Management: Trends and Emerging Practices, Florida: The
Institute of Internal Auditors Research, 2001.
[12] G. Schroeck, Risk Management and Value Creation in Financial
Institutions, New Jersey: John and Sons, Inc. 2002.
[13] R. E. Hoyt and A. P. Liebenberg, “The value of enterprise risk
management,” Journal of Risk and Insurance, vol. 78, no. 4, pp.
795-822, 2011.
[14] D. P. Pagach and R. S. Warr. (April 2010). The effects of enterprise
risk management on firm performance. [Online]. Available:
http://ssrn.com/abstract=1155218
[15] E. W. Davenport and L. M. Bradley. (2001). Enterprise risk
management: A consultative perspective. [Online]. Available:
www.casact.com
[16] A. Darlington, S. Grout, and J. Whitworth. (2001). How safe is safe
enough? An introduction to risk management. [Online]. Available:
http://www.actuaries.ie/Events%20and%20Papers/Events%20200
2/2002-03-20_Risk%20Management/How_safe_is_safe_enough_
March2002.pdf
[17] P. L. Walker, W. G. Shenkir, and T. L. Barton, Enterprise Risk
Management: Putting It All Together, Altamonte Springs, FL:
Institute of Internal Auditors Research Foundation, 2002.
[18] S. P. D'Arcy, “Enterprise risk management,” Journal of Risk
Management of Korea, vol. 12, no. 1, pp. 207-228, 2001.
[19] M. A. Blake, “Taking a holistic approach with enterprise risk
management,” Rural Telecommunications, vol. 22, no. 6, pp. 58-61,
2003.
[20] B. Waite, Managing Risk and Resolving Crisis, London: Financial
Times Prentice Hall, 2001.
[21] K. H. S. Pickett, Enterprise Risk Management: A Manager’s
Journey, New Jersey: John Wiley & Sons, Inc. 2006.
[22] COSO. (2003). Enterprise risk management framework: Draft.
[Online]. Available: :
http://www.enterprise_wide_risk_management+&+De+Loach+ht
ml
[23] J. A. Miccolis and S. Shah. (2000). Enterprise risk management:
An analytic approach: Tillinghast-Towers Perrin Monograph.
[Online]. Available: http://www.tillingast.com
[24] KPMG. (2005). Strategic risk management survey: A survey of
contemporary strategic risk management practices in Australia and
New Zealand. [Online]. Available: http”//www.kpmg.com.au
[25] S. M. Bartram, “Corporate risk management as a lever for
shareholder value creation,” Financial Markets, Institutions &
Instruments, vol. 9, no. 5, pp. 279-323, 2000.
[26] S. M. Casidy, R. L. Constand, and R. B. Corbett, “The market value
of the corporate risk management function,” Journal of Risk and
Insurance, vol. 57, no. 4, pp. 664-670. 1990.
Norlida Abdul Manab obtained her PhD from University
of Technology MARA, Malaysia in the field of risk
management. She is currently Senior Lecturer in the
Department of Banking and Risk Management, School of
Economics, Finance and Banking (SEFB), College of
Business (COB), Universiti Utara Malaysia. Her main
research interests include enterprise-wide risk management, financial
risk management and other issues in risk management. She actively
involved in teaching and supervising PhD students in the area of risk
management and insurance.
Zahiruddin Ghazali obtained his PhD from Universiti
Sains Malasia (USM), Malaysia in the field of finance. He
is currently Head of Department and Senior Lecturer in the
Department of Finance, School of Economics, Finance and
Banking (SEFB), College of Business (COB), Universiti
Utara Malaysia. His main research interests include
corporate governance, market events studies, firm’s performances and
financial management. He is actively involved in teaching graduate and
post-graduate finance courses and supervising PhD students in the area
of corporate governance and firm’s performances.


![Risk Management (3C05/D22) Unit 3: Risk Management · 2004. 4. 29. · Risk-management planning Risk resolution [Boehm 1991] Risk monitoring Software risk management steps & techniques](https://img.pdfslide.net/doc/110x75/6122993708b35f7a264d6759/risk-management-3c05d22-unit-3-risk-2004-4-29-risk-management-planning.jpg)