Embed Size (px)
Citation preview
Capital Markets Review Vol. 29, No. 1, pp. 17-39 (2021)
17
Does Entropy Index Explain the Determinant of
Capital Market Integration in ASEAN?
Ignatius Roni Setyawan1 & Buddi Wibowo2 1 Faculty of Economics and Business, Tarumanagara University, Indonesia.
2 Faculty of Economics and Business, Universitas Indonesia, Indonesia.
Abstract: Research Question: This study will examine whether the entropy
index by Ruefli (1990) could become the main determinant of capital market
integration in ASEAN. Motivation: Continuing the study of Pretorius (2002)
and Bracker and Koch (1999) who successfully used the correlation equation
model to explore the capital market integration determinants in several
regions, this study utilizes the correlation method to identify some new
determinant of the capital market integration in ASEAN such as level of intra
industry competition and intensity of role of global investors. Idea: This
study is proposed a new thinking in the capital market integration i.e. when
the capital market is integrated so thus there is no relevant for international
diversification; but it will shift to the industrial diversification. Data: This
study needs not only four data years 2006-2009 but also requires 10 industrial
groups from the Global Industry Classification Standard (GICS) version from
OSIRIS toward 5 ASEAN countries hence we obtain 240 data observations in
order to employ SUR. Especially 10 industrial groups from GICS is used to
estimate entropy index by Ruefli (1990) for each industry. Method/Tools: We
must use SUR (Seemingly Unrelated Regression) and for estimation process
is compliance to Zellner’s assumption that there should be a contemporaneous
correlation of error from each equation of 5 ASEAN countries. Findings: we
find that the entropy index of Ruefli (1990) is proven as an effective proxy for
level of intra industry competition which functions as primary determinant of
capital market integration in ASEAN. While the other finding is some stock
market such as Malaysia looks so restrictive towards the existence of global
investors. The finding confirms the result of Mitchell and Joseph (2010) and
Omay and Iren (2019) about the strict foreign exchange control regime in
Malaysia. Contribution: We are probably one of the market integration
studies that obtain industrial structure becomes the main determinant of
market integration through entropy index and we reconfirm the studies of Faff
and Mittoo (2003), Roll (1992), Pretorius (2002), Carrieri et al. (2004) and
Hwang and Sitorus (2014) which has considered about industry factors.
Keywords: Entropy index, unconditional and dynamic conditional
correlation, SUR (Seemingly Unrelated Regression), stock market in ASEAN
JEL classification: G15, G32, Q02
Corresponding author: Ignatius Roni Seyawan . Tel.: 62-21-5655507, 08, 09 and 10. Fax: 62-21-5655521.
Email: [email protected], [email protected] and [email protected]
Received 9 Sep 2020; Final revised 2 Feb 2021; Accepted 8 March 2021; Available online 15 June 2021.
To link to this article: https://www.mfa.com.my/cmr/v29_i1_a2/
© Malaysian Finance Association, 2021. This work is licensed under the terms of the Creative Commons Attribution (CC BY) (http://creativecommons.org/licenses/by/4.0/).
Ignatius Roni Setyawan and Buddi Wibowo
18
1. Introduction
From Cheng (2000) and Yusof and Madjid (2006) and then Do et al. (2016), we can
identify two groups of studies of market integration namely IRGISG (Intensity of Role of
Global Investors Study Group) and Industry Factors Study Group (IFSG). Examples of
IRGISG namely Bekaert et al. (2002), Edison and Warnock (2003) and Froot and
Ramadorai (2008) and examples of IFSG are Tu (1998), Faff and Mittoo (2003) and Carrieri
et al. (2004). Both of studies claim that Local Pull Factors (LPF) and Global Push Factors
(GPF) are more important to one another, although they refer to the theory of stock market
interdependence from Pretorius (2002). These conditions will bring to the first research gap
i.e. the divergence from Local Pull Factors and Global Push Factors as main determinant of
market integration.
The theory of stock market interdependence of Pretorius (2002) says there are three
determinants of the integration such as the contagion, economic integration and capital
market characteristics. Capital market characteristics include volatility, liquidity and
industry similarity. From the theory of stock market interdependence it is stated that Global
Push Factors associated with contagion because contagion occurs as a result of increased
international capital flows. Meanwhile, Local Pull Factors are characteristic of the appeal of
a capital market for global investors.
In the view of IRGISG, Global Push Factors will be more relevant as a determinant of
integration due to the role of global investors since the era of liberalization of capital
markets increased. The role of global investors is demonstrated by the increasing global
investor fund flows. According to Froot and Ramadorai (2008), the increased flow of funds
will affect the global investor in the stock market index of a country. Dvořák (2005) and
Aggarwal et al. (2009) states the foreign funds flow will affect the level of integration for a
more open capital markets would be utilized by global investors to be more aggressive in
penetrating. But the study of Edison and Warnock (2003) and Bae et al. (2004) stated that
some countries increase the level of protection for local investors. This is because the more
negative the dominant role of global investors who are expected to take action to destabilize
the local stock exchange to trigger an increase in the volatility of the stock and in turn lead
to bubble. Nevertheless study of Bekaert and Harvey (2000) declared that global investor
also has the positive role that can bring improved performance and liquidity of the market
index trading. Which then becomes a problem is the behavior change of global investors is
hard to be detected at any time by the regulator.
Meanwhile in the opinion of Industry Factors Study Group (IFSG), Local Pull Factors
more relevant as a determinant of integration as an industry sector will have an attraction for
global investors. Before the flow of investment funds, global investors will study the
characteristics of each industrial sector. Based on the study of MSCI Barra, every country in
ASEAN has a unique respective industry. According to the study of Carrieri et al. (2004)
and Dutt and Mihov (2008) the industrial sector is expected to affect the level of integration
because it has a risk exposure that is worthy of consideration by every global investor in
calculating the benefits of international diversification. In the classical model ICAPM, the
higher the expected return required of an industry makes the higher the risk to be borne by
the industry. Moreover it would be true if the industry is categorized as the global industry
such as the Faff and Mittoo (2003). More relevant Local Pull Factors (LPF) as a determinant
of integration as well as the industrial sector has two arguments i.e. the similarity of
industrial structure and industry strategic risk. According to Roll (1992), industrial structure
similarity is that if two countries have similar industrial structures, the comovement between
the two countries in the market index will increase along with the high concentration of cash
flow.
Does Entropy Index Explain the Determinant of Capital Market Integration in ASEAN?
19
While it also industry strategic risk associated with competitive conditions in the
industry. These factors should be considered by global investors because it adds to the risk
component of international diversification. Menchero and Morozov (2011) declared that the
global investor can further enhance the benefits of diversification through a more focused
strategy of diversification in industries with low levels of competition. But the next question
arises of how to measure the level of competition. Biker and Haaf (2002) and Hsin and
Tseng (2012) measure the level of industry competition with HHI (Herfindahl Hirschman
Indices), whereas the HHI is designed to industry concentration. Industry concentration may
reflect the nature of competition in the long life industry. In the turbulence industry such as
information technology, concentration does not reflect the nature of competition in the
industry and the consequences it was to be inadequate if HHI is continue to used as a proxy
of competition. Thus it will create a second research gap that is the need for measures the
level of competition in the industry as a more appropriate because it is generally a
qualitative measure of competition. One of example is Porter's Five Forces. So this study
takes a measure of competition is more quantitative. Gauge this competition is the entropy
index by Ruefli (1990) that will measure how drastic changes in its ranking in the industry
for a period of observation. Entropy indices are calculated by OTSA (Ordinal Time Series
Analysis) is considered superior to the HHI (Herfindahl Hirschman Indices).
Based on the first and second gap, it will also be created the third gap of this study i.e.
how to model simultaneously both determinants of the level of integration of both Local
Pull Factors (LPF) and the Global Push Factors (GPF). Simultaneously modeling is
expected to justify the theory of stock market interdependence of Pretorius (2002) that these
two equally important factors. Simultaneous modeling of both the determinants of
integration is still dominated by panel data regression and cointegration techniques. Panel
data regression conducted by Chuah (2005) and Bekaert et al. (2011) find that the LPF is
more important than GPF in emerging markets (including ASEAN). Cointegration
techniques in ASEAN were conducted by Click and Plummers (2005) and Kuper and
Lestano (2007) with more focus on Global Push Factors. This is because the motive for their
study is the detection of long run equilibrium relationship between ASEAN countries
indexes and index of developed countries. The findings of these two approaches are
contradictory, so in our opinion it was taken a more comprehensive modeling.
Finally for the academic contribution we have two items, first, we will address to
examine the capital market integration determinant using two indicators that is entropy
index by Ruefli (1990) referred to Roll (1992), Pretorius (2002), Faff and Mittoo (2003),
Dutt and Mihov (2008) and the other is the intensity of the role of global investors the basis
of international capital mobility argument from Marston (1995) and Mishkin and Eakins
(2000) and the role of global investors from Bekaert and Harvey (2005) and Froot and
Ramadorai (2008).
Secondly, we extend correlation equation model from Bracker and Koch (1999) and
Pretorius (2002) with stressing the derivation of the empirical model (section 3.1 until 3.3)
and adding the new factor determinant of capital market integration in ASEAN countries i.e.
Entropy Index by Ruefli (1990) and the Entropy Concept by Ng (1995). The estimation of
Entropy Index must need data construction of GICS in ASEAN.
2. Literature Review and Hypotheses Development
2.1 Stock Market Interdependence According to Pretorius (2002), the assumption of stock market interdependence is LOOP
(Law of One Price). LOOP itself states an integrated market is the market where the asset
has the same expected return regardless of where assets are traded. As for the capital market
is segmented then the expected return of asset markets will depend on the location of the
Ignatius Roni Setyawan and Buddi Wibowo
20
related asset. LOOP is a consequence of the enactment of global investors needs to consider
the global risks. LOOP enforceability will depend also on how much the mobility of
international capital flows. Mobility of international capital flows will increase the linkage
of each stock market. International capital flows will become into the mechanism of global
investors for international diversification activities. On the one hand they will secure the
investment in capital markets of host countries and on the other hand they also will secure
savings (risk-free investment) in the country of origin. If there is no substitution effect
between saving and investment, international capital flows will continue to flow and the
stock market will raise interdependences. Pretorius (2002) states independences of stock
market will depend on contagion, economic integration and capital market characteristics.
2.2 Contagion Contagion can be described as the comovement of the stock market is not caused by the
general movement of fundamental factors. There are two factors that work such as the
informational factors and institutional factors. Informational factors based on well-known
from the comparison between the stock market and the "Keynesian Beauty Contest". By the
same analogy with the "Keynesian Beauty Contest", investors in the stock market will sell
its investment in specific asset class if they believe that other investors will sell their
investments in the same class. Herding behavior of investors will lead to excessive volatility
as noted also by Bekaert et al. (2005).
While institutional factors related to redemption and about two stage investment strategy
of hedge fund. Most of the flow of funds into emerging market is open end fund that
commonly purchased by global investors. When faced with large scale withdrawal, then the
hedge fund will sell all the assets into more liquid market or they will allocate their assets
into several indices-weighting. Their action would create an excessive decline in the
performance of the market.
2.2.1 Economic Integration
There are two explanatory factors that is bilateral trade and macroeconomic variables like as
interest rate and inflation. The extent of correlation between variables was applied to the
two countries thus the correlation between the two countries over the market return will also
increase depending on the closeness of the bilateral trade between the two countries. When
conducting the return correlation testing in ASEAN, Click and Plummers (2005) finds the
similar pattern to the return correlation between Singapore and Malaysia is stronger than the
return correlation between Singapore and Philippines.
Bracker and Koch (1999) states that the interest rate and inflation has an influence on the
market return. So the correlation between the two variables will also influence the
correlation of the market return. It is also reinforced by Roll (1992) that the interest rate and
inflation will be considered by global investors when making asset valuations. In contrast to
the bilateral trade is positively related to the correlation of stock returns, therefore interest
rate and inflation would have a negative influence each other.
2.2.2 Capital Market Characteristics
There are three components of capital market characteristics i.e. the volatility, liquidity and
industry sectors (but that overlooked here is the industrial sector). The argument is that
when two countries have similar industrial structures, the correlation between the two
market indexes will rise. For example, when the two markets in emerging market index is
dominated by the stocks in a sector such as Oil and Gas, so when a decline in world oil
demand will result in a significant reduction of its share price of Oil and Gas in the two
countries. The dominance of this industry sector was much easier to make international
Does Entropy Index Explain the Determinant of Capital Market Integration in ASEAN?
21
factors affecting the movement of market indices compared to the two countries if these
countries have a heterogeneous structure of the industry. One important part of the industrial
structure according to the study of Ng (1995) is the industry concentration. Industry
concentration relates to the opinions of Roll (1992) about the similarity of industrial
structure. The stock return correlation between two stock markets will increase when the
composition of the growing industrial sectors of both countries has similarities. Increase in
correlation is not only because the flow of funds from bilateral relations on the basis of
economic policy and business cycles but also due to the homogenization of the international
diversification of industrial structure on a global investor. Homogenization of the industry
structure here is the dominance of the industrial sector on a consolidated market index.
Roll (1992) then describes the context of the industrial structure in terms of volatility and
correlation difference. When an industrial sector in a country has a high volatility will not
necessarily follow the same conditions in other countries. This happens because of the
dominance of the industrial sector as the dominant sector in each country will vary
according to the economic potential of each country. Volatility that occurred that was
caused by the excess of (induced) negative international diversification, which in the
beginning but then expect an increase in return that there is an increase in correlation. In a
study of Roll (1992) the Herfindahl index was used as a proxy for industrial structure affects
the volatility of returns. These results reinforce the view that the industrial structure has the
potential to be a correlation of stock returns explanatory variables. This is because the
volatility or the variance return is the decisive element return correlations are important in
addition to the covariance of two related stock returns.
Meanwhile Bekaert and Harvey (1997) suggests the increase in correlation is due to the
increased volatility of stock returns. But as soon as they argued that the increased volatility
of stock returns will be an attraction for global investors in the international diversification
strategy. Despite the high volatility of return raises the level of correlation, but Chen and
Zhang (1997) suggests the benefits of international diversification remains a reliable global
investors from an industry that provides a higher return. This condition is realized when
global investors put forward as a partner country portfolio and this is reinforced Bekaert and
Harvey (1997) and Cha and Oh (2000) who found a low correlation between the market
return the developed and developing countries. One other issue about the relationship
between industry sectors with the stock market interdependence is the relationship between
industrial sectors with other industrial sectors. Park and Woo (2002) found a correlation
significance of the industry return index in developed countries over the period 1973-2001.
Of particular interest is the correlation between the level of the industry in general the
European countries is higher when compared to USA, except for industrial TMT
(Technology, Media and Telecommunication). The findings of Park and Woo (2002) for
non TMT industries in line with the assumption of bilateral trade in economic integration.
While for the TMT industry showed higher idiosyncratic risk of the TMT (USA) from TMT
(Europe) like as IT Bubble.
2.3 Hypothesis Development
2.3.1 Concept of Entropy
In general, entropy is a measure of the amount of disorder in the system. High entropy
means disorder is high while the low entropy reflects the regularity. According to the laws
of thermodynamics, the higher the entropy will be more chaotic a system. In the science of
industrial organization, entropy is often associated with concentration and competition [see
Ng (1995)]. While the financial science, entropy has been used by Tu (1998) to test the
integration of capital markets of Taiwan and the USA with entropy-based pricing (EBP)
derived from Consumption CAPM (CCAPM). Ng (1995) suggests the concept of entropy to
Ignatius Roni Setyawan and Buddi Wibowo
22
measure industry concentration is relevant because the entropy reflects the number of firms
in the industry and the equity market. The essence of entropy in this context aims to
measure the level of industry concentration through the information described as a
probability distribution of market share. With so entropy can be interpreted as a measure of
uncertainty associated company's market share. In her study Ng (1995) using the arithmetic
mean value of the minimum and maximum entropy to measure the concentration index
depends on the class boundaries, the number of players in one class and size class specific
industries.
Because entropy is a measure of disorder, uncertainty and randomness in a system then
according to Ng (1995) entropy will also be useful to measure industry competition. The
argument of this is the entropy will vary according to shape the pattern of randomness or
randomness that occurs. Entropy will depend on the number of firms in the industry and a
growing number of companies in the industry will reflect the level of intra industry
competition is getting higher and higher entropy. In addition the entropy depends on the
distribution of market share will increase competition and higher entropy will too. Entropy
was inversely proportional to the concentration of industry, so that a high entropy will
reflect the low concentration level and the competition will high.
Associated with Tu (1998), the concept of EBP is derived from the SDF model
(Stochastic Discount Factors) proved the integration of Taiwan and the USA. Because of a
component model for the function Langrangian EBP (L) is identical with the entropy index
Ruefli (1990); L = ∑ pjln (pj /qj)Si=1 + ∑ λj(− ∑ pjXij)
Sj=1
ni=1 + λ0(1 ─ ∑ pj
Sj=1 ), the concept
of entropy will be relevant as a determinant of capital market integration.
2.3.2 The Concept of Intensity Role of Global Investors
Initially Bekaert and Harvey (2000) have not so justified the negative role of global
investors that is as speculators. This is related to the phenomenon of increased capital
market liberalization in ASEAN exchange authority on the belief that the role of investors in
ASEAN investors will give added value to increase trading liquidity and market indexes.
But with the Asian monetary crisis of 1997/1998 and 2007/2008 the global financial crisis is
the perception of the authority of several exchanges began to change toward the role of
global investors. They began to increase the level of resistance but in indirect form are
generally in the form of protection against domestic investors. Conducting direct obstacle in
the form of restrictions on current stock market is less relevant because of liberalization has
done more than 20 years. Thus it may be clear that stock markets are opened for foreigner.
If there is more reason for global investors play a positive and negative role is always
associated with efforts to secure the benefits of international diversification in emerging
markets. As noted by Bekaert and Harvey (1997), emerging market has two attractiveness
for global investors such as high volatility and the market index return correlations are low.
High volatility can be seen with the dynamics of the movement of market indexes in each
ASEAN country. The existence of high volatility is attractive to global investors with short
time horizons that do Covered Interest Arbitrage (CIA) which focuses on capital gains in
exchange rate risk compensation. While the low correlation to attract global investors with
long time horizon which generally as informed investors who seek the fundamental value.
Observing the negative and positive role of global investors, each authority should be
familiar with it. Positive role can be seen from non negative NFFF (Net Foreign Fund Flow)
what it means more global investors to channel funds to the local exchanges so that the local
market indexes rose. However the essence of NFFF is hot money thus possible occurrence
of a negative NFFF. It can be recognized during the period of crisis in the form of falling
market indexes. As a reaction to that negative role, the exchange authority can increase the
level of protection for domestic investors. Level of protection is not just a tight capital
Does Entropy Index Explain the Determinant of Capital Market Integration in ASEAN?
23
controls, such as Malaysia but can be a limitation of series A and B shares in China's capital
markets. But this protection must be well managed so that the positive role of global
investors is not lost. This is because the status of emerging markets that depend on the
intensity of the role of global investors can not be eliminated although the regulators have
an option to protect their domestic investors from the aggressive global investors.
2.3.3 Level of Intra Industry Competition and Degree of Capital Market Integration
Engwall (1973) and Ruefli (1990) conducted a study on the importance of industry structure
for the company in terms of the dynamics of competition in an industry sector. They hold
the view that the importance of analysis of competition between firms as measured by the
entropy index in addition to knowing the position of superior and inferior inter-company
now also be able to predict the position of superior and inferior among companies in the
future. This is because technically the entropy index is calculated on the basis of time-series
and use the ordinal scale (ranking) for example 1,2,3,4, 5…. n where for n indicates the
number of firms in the industry. Refer to Collins and Ruefli (1992) that is the nature of the
dynamics of competition in entropy is derived from the information theory of Shannon. As
we know the information theory is related to disorder, uncertainty and randomness in a
system.
Characteristic of the dynamics of competition between firms within the business
environment can be brought to the dynamics of competition among the company's stock if
the company is also related to listing on the stock market of a country. The use of entropy
index in evaluating the performance ranking of companies listing on stock exchange will
attract the attention of global investors because of the assessment ranking for this by using
common ratio scale proved disappointing market participants as in the case of Enron and
World at bubble dotcom and probably the fallen of Lehman Brother in 2008 due to global
financial crisis.
When examined in the study of capital market integration, the author's knowledge no one
has to use the entropy index Ruefli (1990) as a determinant factor. That has existed so far is
proving the integration of capital markets in the context of industrial sectors such as studies
Cavaglià et al. (2000), Ratner and Leal (2005) and Antoniou et al. (2007). They have a view
of the context of industrial integration is sufficient to provide a picture for global investors
see the potential in each industry sector is viable or not as part of their portfolio of industrial
diversification. However, when examined using the entropy index, the dynamic changes of
each company in one industry sector will be more apparent, so too when they need full
information about the general picture of the existing industrial sector in the capital market,
then the numbers in the sub-component of entropy (lower, diagonal and upper entropy) is
expected to be more objective in the assessment of strategic industry risk. Based on the
description, the alternative hypothesis (H1) proposed is:
H1: Level of intra industry competition will influence toward degree of capital market
integration in ASEAN countries
2.3.4 The Intensity of Role of Global Investors and Capital Market Integration
Two arguments are used to explain the relationship between the two is the role of global
investors and international financial integration through the concept UCIRP (Uncovered
Interest Rate Parity). Both of these arguments stem from a grand theory: international
capital mobility. According to Sula and Willet (2009), with increasingly free flow of capital
from developed country to a developing country as a result of liberalization and free trade,
then physical activity, economics and finance of each country as if it had been fused. This
happens because the enactment of a good standard in shape, size and price in each country
who declare themselves as members of an economic and trade bloc, so that each country
Ignatius Roni Setyawan and Buddi Wibowo
24
will declare readiness to open with each other and compete freely with each other. A
manifestation of international capital mobility is greatest in the history of European
economic integration which gave birth to the EEC (European Economic Community). On
each member of the EEC (see now the EU) will occur in an efficient capital mobility,
because member state have been open with each other and compete freely. As for non-
members countries, then capital mobility occurs when common rules which would receive a
reduction in restrictions.
At a higher level then the international capital mobility will reach the level of Optimum
Currency Area (OCA), such as the formation of the Euro Currency in 1999. When the
context has led to the standardization of currencies like euro and dollar, the level of
integration has led to a discussion of domain Interest Rate Parity (IRP). This is because the
flow of capital that occurs because of differences in interest rates. Marston (1995), Bhatt
and Virmani (2005) and Solnik and McLeavey (2009) state the interest rate differential may
be relevant to CIRP (Covered Interest Rate Parity) and UCIRP (Uncovered Interest Rate
Parity). CIRP related to international capital flows are not restricted tend to equate the
nominal interest rate if they are tied up in a common currency (single). Seeing the EEC who
already have the Euro currency then it should be applied CIRP. However this is not easily
realized because the EEC became the European Union has changed and although the Euro
(except Pound Sterling) still exist but tend to be less bargaining power Euro against the U.S.
dollar. Not easy to apply CIRP create the context of financial integration are discussed with
UCIRP. UCIRP associated with unrestricted capital flows tend to equalize nominal interest
rates. An effort to cope with exchange rate risk, and then by taking into account differences
in domestic interest rate (id) and abroad (if), make global investors are always looking for
opportunities to do the CIA (Covered Interest Arbitrage). According to Marston (1995) and
Solnik and Mcleavey (2009), the CIA can be done by purchasing foreign securities because
of the condition of the forward discount. The phenomenon of the CIA in lines with the
argument that there cointegration between international capital flows and exchange rates in
addition to the interest rate even if only for the case of Indonesia. This is because global
investors who bring different currency than the local currency on the one hand can be
correlated with the movement of local currency and may also be correlated with stock
market conditions. Based on a study of Dvořák (2005) and Aggarwal et al. (2009) in
Indonesia, the activity appeared to be particularly dominant global investors as domestic
investors. But the unique despite the inferior performance of global investors in the short
term, but were superior in the long run. Explanation of differences in the performance of
global investors it is a phenomenon of the difference of information between global
investors and domestic investors. Domestic investors are perceived to have the advantage of
knowledge of local conditions of Indonesia, while foreign (global) investors are considered
to have the experience and global network of brokerage as a form of information
superiority. In order to become the most dominant, the investor needs to have a combination
of local ownership and global capabilities of information brokerage.
Bekaert and Harvey (2000) state there are two roles of global investors in emerging
markets. The first role relates to the actions of global investors in influencing the technical
aspects of trading in a stock because it could potentially increase the liquidity, efficiency
and value of related shares. While the role of the second act of a global investors to better
obtain information superiority. But according to Bekaert and Harvey (2000) the role of
negative impact if it is so global investors does not get the information advantages, then
they will make a withdrawal. In larger-scale withdrawal of funds called the phenomenon of
surge or sudden stop of capital flows (Sula and Willet, 2009). This phenomenon triggers
global investor's restrictions such in Malaysia since 1998. The restriction is conduct by
increasing level of protection toward domestic investors. It is not only make limit purchase
Does Entropy Index Explain the Determinant of Capital Market Integration in ASEAN?
25
some series stock like as in China and Philippines but also increasing the tight control of
capital outflow from Malaysia. Hence starting in 1999 Malaysia imposed this restriction by
excluding its investable index from IFC. Based on previous description, we propose
alternative hypothesis (H2) as follow:
H2: The intensity of the role of global investors tend to raise the degree of capital market
integration in ASEAN countries.
3. Empirical Model Development
3.1 Entropy Index
Ruefli (1990) provides a decrease in the entropy index denoted by H (S)k by starting from
the transition matrix. This transition matrix is defined as a matrix that will show changes in
the ranking of all players in an industry (k) can be symbolized as Tk, which has a tij element
that is the frequency of ranking position changes between players in one industry each year
divided by the number of years of observation (m). The Tk is then converted to pk matrix,
from the relative transition frequency of the pijk which can be formulated as follows:
pijk = tijk/ m (1)
Furthermore, with the pk transition matrix, a number of measures that will provide
information about the level of uncertainty associated with the behavior of ranking changes
among players in an industry can be raised. Then based on the large number of players
denoted as q, then obtained:
H(S)k = [ ∑i (∑j pi,j,k/n pi,j,k)/q/- ln(1/q)] (2)
where H (S)k is the entropy index for industry k, i is the row side of the transition matrix and
j is the column side of the transition matrix. H (S) k will reach its maximum condition if ∑
1.1. / q ln (1 / q) = - ln (1 / q). And because ln (1 / q) = - ln (q) then equation 2 can be
written:
H(S)k = [ ∑i (∑j pi,j,k ln pi,j,k) /q ln (q)] (3)
According to Ruefli (1990), H (S) k follows the log-linear property of the entropy
function which has three forms of uncertainty position namely improving (lower), holding
(diagonal) and worsening (upper). Therefore, for the sake of analysis, H (S)k which is the
total entropy needs to be decomposed into 3 parts, namely lower, diagonal and upper
entropy. In the case of the dynamics of the life cycle of the fragmented software industry
life cycle, the results of the study of Ruefli (1990) show that the lower entropy position is
smaller than the upper entropy. This means that more company members in the industry are
downgraded compared to upgraded. This also means that the dynamics of industrial
competition are very high because of the short life cycle that has a low level of industrial
concentration and high competition as a result of the large number of players in the industry.
Based on the previous explanation, the steps of estimating the entropy index from Ruefli
(1990) operationally are as follow:
1) Making a tabulation of ranking based on the movement of outcomes such as net profit
and sales between companies in the industrial sector. If the context is international
diversification, it is more appropriate to use net profit on the grounds that this net profit
will determine the target of global investor returns.
2) Make ordinal rank data from the first process.
Ignatius Roni Setyawan and Buddi Wibowo
26
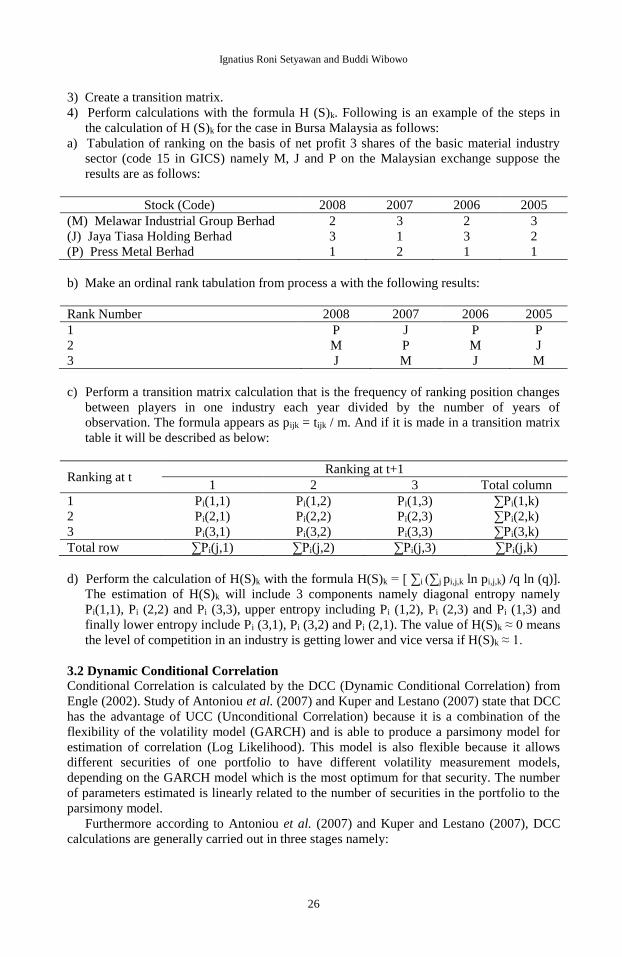
3) Create a transition matrix.
4) Perform calculations with the formula H (S)k. Following is an example of the steps in
the calculation of H (S)k for the case in Bursa Malaysia as follows:
a) Tabulation of ranking on the basis of net profit 3 shares of the basic material industry
sector (code 15 in GICS) namely M, J and P on the Malaysian exchange suppose the
results are as follows:
Stock (Code) 2008 2007 2006 2005
(M) Melawar Industrial Group Berhad 2 3 2 3
(J) Jaya Tiasa Holding Berhad 3 1 3 2
(P) Press Metal Berhad 1 2 1 1
b) Make an ordinal rank tabulation from process a with the following results:
Rank Number 2008 2007 2006 2005
1 P J P P
2 M P M J
3 J M J M
c) Perform a transition matrix calculation that is the frequency of ranking position changes
between players in one industry each year divided by the number of years of
observation. The formula appears as pijk = tijk / m. And if it is made in a transition matrix
table it will be described as below:
Ranking at t Ranking at t+1
1 2 3 Total column
1 Pi(1,1) Pi(1,2) Pi(1,3) ∑Pi(1,k)
2 Pi(2,1) Pi(2,2) Pi(2,3) ∑Pi(2,k)
3 Pi(3,1) Pi(3,2) Pi(3,3) ∑Pi(3,k)
Total row ∑Pi(j,1) ∑Pi(j,2) ∑Pi(j,3) ∑Pi(j,k)
d) Perform the calculation of H(S)k with the formula H(S)k = [ ∑i (∑j pi,j,k ln pi,j,k) /q ln (q)].
The estimation of H(S)k will include 3 components namely diagonal entropy namely
Pi(1,1), Pi (2,2) and Pi (3,3), upper entropy including Pi (1,2), Pi (2,3) and Pi (1,3) and
finally lower entropy include Pi (3,1), Pi (3,2) and Pi (2,1). The value of H(S)k ≈ 0 means
the level of competition in an industry is getting lower and vice versa if H(S)k ≈ 1.
3.2 Dynamic Conditional Correlation
Conditional Correlation is calculated by the DCC (Dynamic Conditional Correlation) from
Engle (2002). Study of Antoniou et al. (2007) and Kuper and Lestano (2007) state that DCC
has the advantage of UCC (Unconditional Correlation) because it is a combination of the
flexibility of the volatility model (GARCH) and is able to produce a parsimony model for
estimation of correlation (Log Likelihood). This model is also flexible because it allows
different securities of one portfolio to have different volatility measurement models,
depending on the GARCH model which is the most optimum for that security. The number
of parameters estimated is linearly related to the number of securities in the portfolio to the
parsimony model.
Furthermore according to Antoniou et al. (2007) and Kuper and Lestano (2007), DCC
calculations are generally carried out in three stages namely:
Does Entropy Index Explain the Determinant of Capital Market Integration in ASEAN?
27
a) GARCH model (1,1) for k asset return where rt│Ft-1 ~ N (0, Ht). (4)
b) Calculation of standardized residual that is εit = rit / (hit) 1/2. (5)
c) Calculation of time-varying correlation (ρij,t).
Steps a, b and c above can begin with the determination of the conditional variance (Ht)
matrix which is formulated as follows:
Ht = Dt Rt Dt (6)
where Rt is the conditional correlation matrix n x n and Dt is the diagonal matrix n x n
whose elements are time-varying standard deviations from the GARCH univariate model
with the diagonal i. The GARCH univariate specification for Dt is stated as follows:
hit = ωi + αi ri2
t-1 + βiht-1 (7)
where hit is conditional volatility, ri2
t-1 is the past square innovations, and αi and βi are the
coefficients of the parameters ri2
t-1 and ht-1. The specifications of this GARCH univariate
can be modified to accommodate asymmetric effects. Next the residuals are standardized
with the standard deviation conditional and can be written as follows:
εit = rit/ (hit)1/2; εit ~ N (0,Rt) (8)
Based on the equation 8 above, conditional correlation is defined as ρij,t = E[εit,εjt] which is
the Engle (2002) of DCC model. In more detail ρij,t can be stated as:
ρij,t = Et−1[rit , rjt]
{Et−1[rit2 ]Et−1[rjt
2 ]}1/2 (9)
The dynamic correlation structure ρij, t consists of Qt, Rt and Qt* expressed as follows:
Qt = (1- αn – βn) Q + αn (εt-1,ε’t-1) + βn Qt-1 (10)
Rt = Qt*-1 Qt Qt
*-1 (11)
diag (Qt*)1/2 = diag [1/(q11,t)1/2 ……. 1/(q kk,t)1/2] (12)
where Q = unconditional covariance from standardized residuals. If αn + βn < 1, the
correlation will mean reverting (after shock, the correlation will return to normal levels),
and if αn + βn = 1 then this correlation will be integrated. To estimate Qt* in the component
model in equation 12, the log likelihood function is needed as follows:
logL (θ1θ2│Xt) = 1/2T∑t=1[k log(2π) + log (│Rt│) + 2 log (│Dt│) + r’tD-1tR-1
tD-1trt] (13)
Model 13 has 2 components, namely volatility (θ1) and dynamic correlation (θ2). As noted
from Antoniou et al. (2007), the volatility component model (θ1) and dynamic correlation
(θ2) can be written into models at equation 14 and 15, namely:
logL (θ1│rt) = -1/2T∑t=1[k log(2π) + log (In) + 2log(│Dt│) + r’tD-1tR-1
tD-1trt] (14)
logL (θ2│θ1, rt) = -1/2T∑t=1[k log(2π) + log (│Rt│) +2log(│Dt│)+ ε’tRt-1ε t
-1-ε’tεt] (15)
Estimated θ1 with GARCH and θ2 with maximum likelihood BEKK or Marquardt.
Ignatius Roni Setyawan and Buddi Wibowo
28
3.3 Empirical Testing Model
Suppose the unconditional correlation function between return for industry i in country j and
return for world factors (w) at time t can be formulated as follows:
ρ(Rijt,Rwt) = Cov Rijt,Rwt
σRijt.σRiwt (16)
where:
ρ(Rijt,Rwt) = correlation of Rijt and Rwt unconditional correlation (estimated by Pearson)
Cov Rijt, Rwt = covariance of Rijt and Rwt that is ∑ [Rijt − E(Rijt)]. [Rwt − E(Rwt)]ti,j,w =1
σRijt = standard deviation of Rijt (return of industry i at country j at time t)
σRwt = standard deviation of Rwt (world indices return w at time t)
If the calculation is done in detail, ρ(Rijt,Rwt) can be displayed in the form:
ρ(Rijt,Rwt) = ∑ [Rijt−E(Rijt)].[Rwt−E(Rwt)]t
i,j,w =1
σRijt.σRwt (17)
where:
ρ(Rijt,Rwt) = correlation of Rijt and Rwt unconditional correlation (estimated by Pearson)
Cov Rijt, Rwt = covariance of Rijt and Rwt that is ∑ [Rijt − E(Rijt)]. [Rwt − E(Rwt)]ti,j,w =1
σRijt = standard deviation of Rijt (return of industry i at country j at time t)
σRwt = standard deviation of Rwt (world indices return w at time t)
E(Rijt) = expected return of industry i at country j at time t
E(Rwt) = expected return of world indices (w) at time t
As is known from Koutolas and Kryzanowski (1994)’s of IAPT model, Rijt and Rwt can
be considered identical to Rit and Rgt. Rit has a decomposition factor (I1t, I2t, .. Int). These
decomposition factors include industry and country dummies as determinants of Rit in the
model of King (1966) and Heston and Rouwenhorst (1994). The Rit model itself is
Rit = β0 +β1 I1t + β2 I2t + β3 I3t + β4 I4t + ………………………..... + βn Int (18)
where:
Rit = return of industry i at time t
I1t, I2t, .. Int = decomposition factors Rit covering country and industry dummies 1, 2, 3, 4,
5, ….. n at time t according to study of Heston and Rouwenhorst (1994)
β1, β2, … βn = coefficient of decomposition factor I1t, I2t, .. Int
β0 = intercept from Rit
While Rgt or Rwt because it is an international index return such as MSCI, DJGI, and
FTSE will be formulated differently. According to the study of Jorion and Schwartz (1986),
Rwt is estimated from the Fit projection equation which is Fit = Rit - (λ0 + λ1Rwt). Because Fit
is an error from Rit and Fit projection equation is intended to overcome the autocorrelation
problem between Rit and Rwt, Rwt as a component of ρ (Rit, Rwt) is approached by the MA
(q) process of Bekaert and Harvey (1997), so Rwt is:
Rwt = δ0 + δ1 εt-1 + δ2 εt-2 + δ3 εt-3 + ………………+ δq εt-q + εt (19)
Does Entropy Index Explain the Determinant of Capital Market Integration in ASEAN?
29
where:
εt = residual of Rwt [world (w) return at time t]
εt-1, εt-2, εt-3,……… εt-q = lag from residual of Rwt
q = orde from MA (Moving Average) process
δ0 , δ1,δ2, δ3,. …… δq = intercept and coefficient εt-1, εt-2, ………… εt-q
When the Rit component in equation (18) and the Rwt component in equation (19) are
substituted into equation (17) then for ρ (Rijt, Rwt) is obtained:
ρ(Rijt,Rwt) = ∑ [β0+∑ βntInt−1
i=1 E(Rijt)].[δ0+∑ δqεt−q−qq=1 E(Rwt)]t
i,j,w =1
σRijt.σRwt (20)
where:
ρ(Rijt,Rwt) = correlation Rijt and Rwt unconditional correlation (by Pearson)
σRijt = standard deviation of Rijt (industry return i on country j at time t)
σRwt = standard deviation of Rwt (international indices return (world) w at time t)
E(Rijt) = expected return of industry i on country j at time t
E(Rwt) = expected return of world (w) indices at time t
Rit = β0 + ∑ βntInt1i=1 (I is decomposition factor according to equation 3)
Rwt = δ0 + ∑ δqεt−qqq=1 (q is orde of MA process according to equation 4)
Because ρ (Rijt, Rwt) is assumed to be close to the normal distribution (iid: independent and
identically distributed) in the form of N (μ, σ) ≈ N (0,1) then σRijt = 1, σRwt = 1 so σRijt x
σRwt = 1, then on the basis of studies from Longin and Solnik (1995) and Pukthuanthong
and Roll (2009) about the nature of the relationship between Rijt and Rwt, equation (20)
changes to:
ρ(Rijt,Rwt) = ∑ [β0+∑ βntInt−1
i=1 0].[δ0+∑ δqεt−q−qq=1 0)]t
i,j,w =1
1.1 (21)
where estimation of ρ(Rijt, Rwt) is carried out by substitution of the property σRijt, σRwt, Rit,
Rwt, E(Rijt) and E(Rwt) according to the assumption N (0.1). This equation (6) is further
simplified to:
ρ(Rijt,Rwt) = [β0 + ∑ βntInt]Ii=1 +[δ0 + ∑ δqεt−q]
qq=1 (22)
where since [δ0 + ∑ δqεt−q]qq=1 is also notified by the Rwt residual, δ0 + ∑ =
qq 1 δqεt-q is
seen as εit in ρ (Rit, Rwt). This is because q is the Rwt MA (Moving Average) process order in
model (19). So this model (22) can be modified to:
ρ(Rijt,Rwt) = [β0 + ∑ βntInt]Ii=1 + εit (23)
and when applied in country j, the model (23) will change to:
ρ(Rijt,Rwt) = [β0 + ∑ βnjtInjt]Ii,j=1 + εijt (24)
where:
ρ(Rijt,Rwt) = Rijt and Rwt unconditional correlation (by Pearson)
Injt = decomposition factor n for ρ(Rijt,Rwt) in country j at time t
Ignatius Roni Setyawan and Buddi Wibowo
30
βnjt and β0 = coefficient of Injt and intercept from ρ(Rijt,Rwt)
εijt = error (residual) from ρ(Rijt,Rwt)
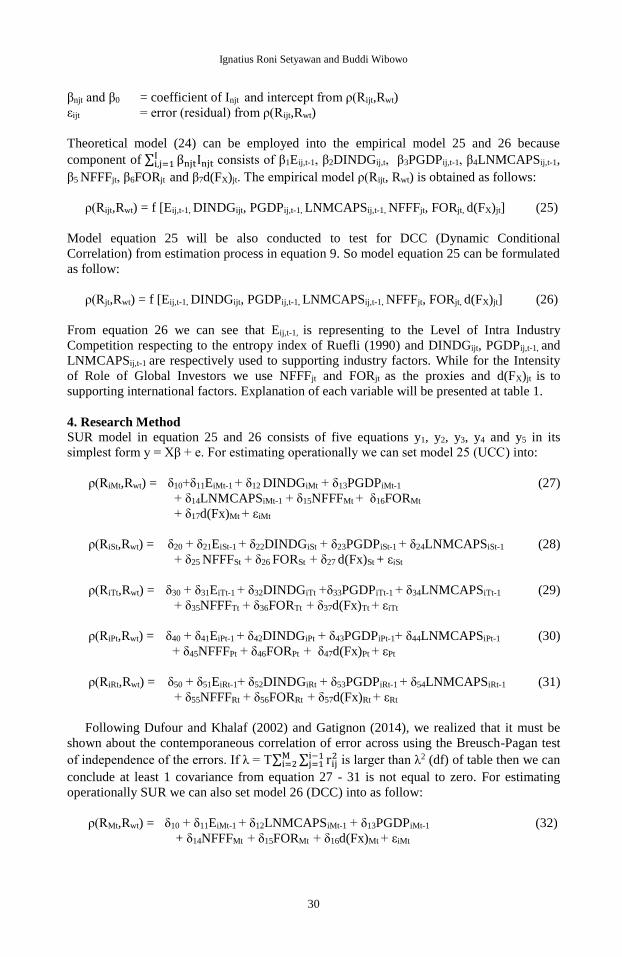
Theoretical model (24) can be employed into the empirical model 25 and 26 because
component of ∑ βnjtInjtIi,j=1 consists of β1Eij,t-1, β2DINDGij,t, β3PGDPij,t-1, β4LNMCAPSij,t-1,
β5 NFFFjt, β6FORjt and β7d(FX)jt. The empirical model ρ(Rijt, Rwt) is obtained as follows:
ρ(Rijt,Rwt) = f [Eij,t-1, DINDGijt, PGDPij,t-1, LNMCAPSij,t-1, NFFFjt, FORjt, d(FX)jt] (25)
Model equation 25 will be also conducted to test for DCC (Dynamic Conditional
Correlation) from estimation process in equation 9. So model equation 25 can be formulated
as follow:
ρ(Rjt,Rwt) = f [Eij,t-1, DINDGijt, PGDPij,t-1, LNMCAPSij,t-1, NFFFjt, FORjt, d(FX)jt] (26)
From equation 26 we can see that Eij,t-1, is representing to the Level of Intra Industry
Competition respecting to the entropy index of Ruefli (1990) and DINDGijt, PGDPij,t-1, and
LNMCAPSij,t-1 are respectively used to supporting industry factors. While for the Intensity
of Role of Global Investors we use NFFFjt and FORjt as the proxies and d(FX)jt is to
supporting international factors. Explanation of each variable will be presented at table 1.
4. Research Method SUR model in equation 25 and 26 consists of five equations y1, y2, y3, y4 and y5 in its
simplest form y = Xβ + e. For estimating operationally we can set model 25 (UCC) into:
ρ(RiMt,Rwt) = δ10+δ11EiMt-1 + δ12 DINDGiMt + δ13PGDPiMt-1
+ δ14LNMCAPSiMt-1 + δ15NFFFMt + δ16FORMt
+ δ17d(Fx)Mt + εiMt
(27)
ρ(RiSt,Rwt) = δ20 + δ21EiSt-1 + δ22DINDGiSt + δ23PGDPiSt-1 + δ24LNMCAPSiSt-1
+ δ25 NFFFSt + δ26 FORSt + δ27 d(Fx)St + εiSt
(28)
ρ(RiTt,Rwt) = δ30 + δ31EiTt-1 + δ32DINDGiTt +δ33PGDPiTt-1 + δ34LNMCAPSiTt-1
+ δ35NFFFTt + δ36FORTt + δ37d(Fx)Tt + εiTt (29)
(29)
ρ(RiPt,Rwt) = δ40 + δ41EiPt-1 + δ42DINDGiPt + δ43PGDPiPt-1+ δ44LNMCAPSiPt-1
+ δ45NFFFPt + δ46FORPt + δ47d(Fx)Pt + εPt (30)
(30)
ρ(RiRt,Rwt) = δ50 + δ51EiRt-1+ δ52DINDGiRt + δ53PGDPiRt-1 + δ54LNMCAPSiRt-1
+ δ55NFFFRt + δ56FORRt + δ57d(Fx)Rt + εRt
(31)
Following Dufour and Khalaf (2002) and Gatignon (2014), we realized that it must be
shown about the contemporaneous correlation of error across using the Breusch-Pagan test
of independence of the errors. If λ = T∑ ∑ rij2i−1
j=1Mi=2 is larger than λ2 (df) of table then we can
conclude at least 1 covariance from equation 27 - 31 is not equal to zero. For estimating
operationally SUR we can also set model 26 (DCC) into as follow:
ρ(RMt,Rwt) = δ10 + δ11EiMt-1 + δ12LNMCAPSiMt-1 + δ13PGDPiMt-1
+ δ14NFFFMt + δ15FORMt + δ16d(Fx)Mt + εiMt
(32)
Does Entropy Index Explain the Determinant of Capital Market Integration in ASEAN?
31
ρ(RSt,Rwt) = δ20 + δ21EiSt-1 + δ22LNMCAPSiSt-1 + δ23PGDPiSt-1
+ δ24NFFFSt + δ24FORSt + δ25d(Fx)St + εiSt
(33)
ρ(RTt,Rwt) = δ30 + δ31EiTt-1 + δ22LNMCAPSiTt-1 + δ23PGDPiTt-1
+ δ34NFFFTt + δ35FORTt + δ36d(Fx)Tt + εiTt
(34)
ρ(RPt,Rwt) = δ40 + δ41EiPt-1 + δ42LNMCAPSiPt-1 + δ43PGDPiPt-1
+ δ44NFFFPt + δ45FORPt + δ46d(Fx)Pt + εiPt
(35)
ρ(RRt,Rwt) = δ50 + δ51EiRt-1 + δ52LNMCAPSiRt-1 + δ53PGDPiRt-1
+ δ54NFFFRt + δ55FORRt + δ56d(Fx)Rt + εiRt
(36)
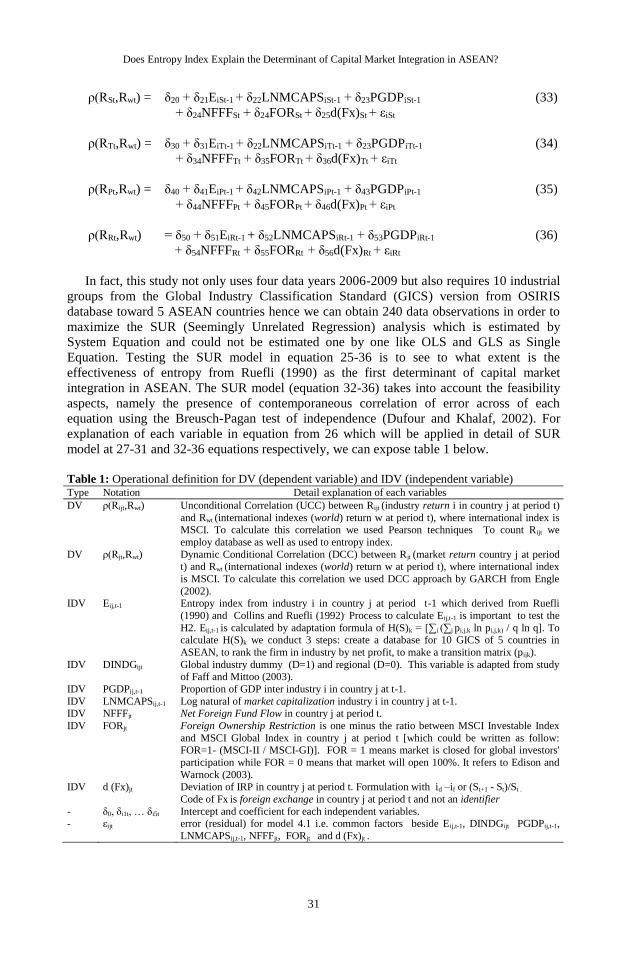
In fact, this study not only uses four data years 2006-2009 but also requires 10 industrial
groups from the Global Industry Classification Standard (GICS) version from OSIRIS
database toward 5 ASEAN countries hence we can obtain 240 data observations in order to
maximize the SUR (Seemingly Unrelated Regression) analysis which is estimated by
System Equation and could not be estimated one by one like OLS and GLS as Single
Equation. Testing the SUR model in equation 25-36 is to see to what extent is the
effectiveness of entropy from Ruefli (1990) as the first determinant of capital market
integration in ASEAN. The SUR model (equation 32-36) takes into account the feasibility
aspects, namely the presence of contemporaneous correlation of error across of each
equation using the Breusch-Pagan test of independence (Dufour and Khalaf, 2002). For
explanation of each variable in equation from 26 which will be applied in detail of SUR
model at 27-31 and 32-36 equations respectively, we can expose table 1 below.
Table 1: Operational definition for DV (dependent variable) and IDV (independent variable) Type Notation Detail explanation of each variables
DV ρ(Rijt,Rwt) Unconditional Correlation (UCC) between Rijt (industry return i in country j at period t)
and Rwt (international indexes (world) return w at period t), where international index is MSCI. To calculate this correlation we used Pearson techniques To count Rijt we
employ database as well as used to entropy index.
DV ρ(Rjt,Rwt) Dynamic Conditional Correlation (DCC) between Rjt (market return country j at period t) and Rwt (international indexes (world) return w at period t), where international index
is MSCI. To calculate this correlation we used DCC approach by GARCH from Engle
(2002). IDV Eij,t-1 Entropy index from industry i in country j at period t-1 which derived from Ruefli
(1990) and Collins and Ruefli (1992). Process to calculate Eij,t-1 is important to test the
H2. Eij,t-1 is calculated by adaptation formula of H(S)k = [∑i (∑j pi,j,k ln pi,j,k) / q ln q]. To calculate H(S)k we conduct 3 steps: create a database for 10 GICS of 5 countries in
ASEAN, to rank the firm in industry by net profit, to make a transition matrix (pijk).
IDV DINDGijt Global industry dummy (D=1) and regional (D=0). This variable is adapted from study of Faff and Mittoo (2003).
IDV PGDPij,t-1 Proportion of GDP inter industry i in country j at t-1.
IDV LNMCAPSij,t-1 Log natural of market capitalization industry i in country j at t-1. IDV NFFFjt Net Foreign Fund Flow in country j at period t.
IDV FORjt Foreign Ownership Restriction is one minus the ratio between MSCI Investable Index
and MSCI Global Index in country j at period t [which could be written as follow: FOR=1- (MSCI-II / MSCI-GI)]. FOR = 1 means market is closed for global investors'
participation while FOR = 0 means that market will open 100%. It refers to Edison and
Warnock (2003). IDV d (Fx)jt Deviation of IRP in country j at period t. Formulation with id –if or (St+1 - St)/St .
Code of Fx is foreign exchange in country j at period t and not an identifier
- δ0, δi1t, … δi5t Intercept and coefficient for each independent variables. - εijt error (residual) for model 4.1 i.e. common factors beside Eij,t-1, DINDGijt PGDPij,t-1,
LNMCAPSij,t-1, NFFFjt, FORjt and d (Fx)jt .
Ignatius Roni Setyawan and Buddi Wibowo
32
5. Result and Discussion
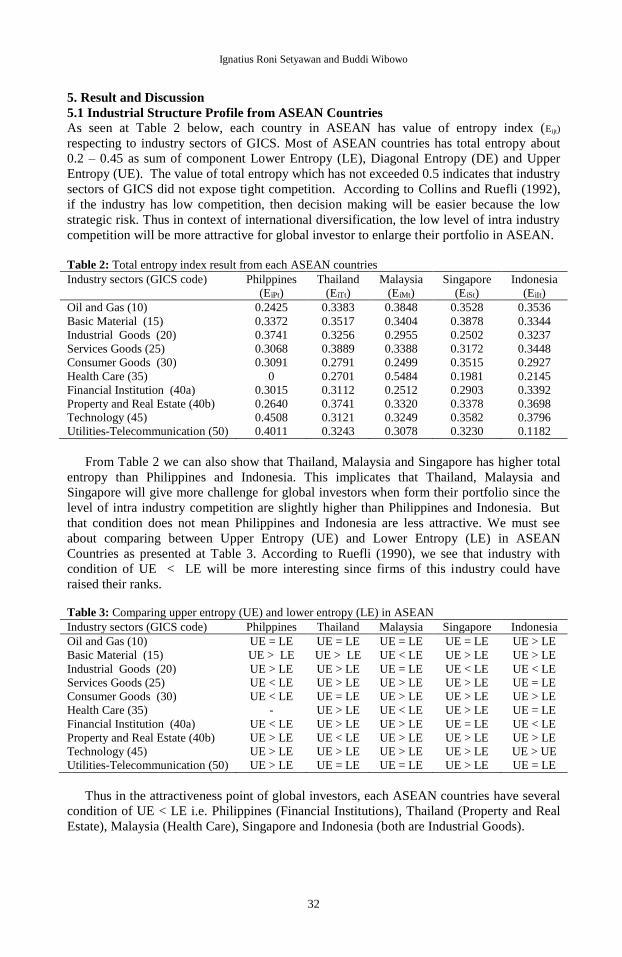
5.1 Industrial Structure Profile from ASEAN Countries
As seen at Table 2 below, each country in ASEAN has value of entropy index (Eijt)
respecting to industry sectors of GICS. Most of ASEAN countries has total entropy about
0.2 – 0.45 as sum of component Lower Entropy (LE), Diagonal Entropy (DE) and Upper
Entropy (UE). The value of total entropy which has not exceeded 0.5 indicates that industry
sectors of GICS did not expose tight competition. According to Collins and Ruefli (1992),
if the industry has low competition, then decision making will be easier because the low
strategic risk. Thus in context of international diversification, the low level of intra industry
competition will be more attractive for global investor to enlarge their portfolio in ASEAN.
Table 2: Total entropy index result from each ASEAN countries
Industry sectors (GICS code) Philppines
(EiPt)
Thailand
(EiTt)
Malaysia
(EiMt)
Singapore
(EiSt)
Indonesia
(EiIt)
Oil and Gas (10) 0.2425 0.3383 0.3848 0.3528 0.3536
Basic Material (15) 0.3372 0.3517 0.3404 0.3878 0.3344
Industrial Goods (20) 0.3741 0.3256 0.2955 0.2502 0.3237
Services Goods (25) 0.3068 0.3889 0.3388 0.3172 0.3448
Consumer Goods (30) 0.3091 0.2791 0.2499 0.3515 0.2927
Health Care (35) 0 0.2701 0.5484 0.1981 0.2145
Financial Institution (40a) 0.3015 0.3112 0.2512 0.2903 0.3392
Property and Real Estate (40b) 0.2640 0.3741 0.3320 0.3378 0.3698
Technology (45) 0.4508 0.3121 0.3249 0.3582 0.3796
Utilities-Telecommunication (50) 0.4011 0.3243 0.3078 0.3230 0.1182
From Table 2 we can also show that Thailand, Malaysia and Singapore has higher total
entropy than Philippines and Indonesia. This implicates that Thailand, Malaysia and
Singapore will give more challenge for global investors when form their portfolio since the
level of intra industry competition are slightly higher than Philippines and Indonesia. But
that condition does not mean Philippines and Indonesia are less attractive. We must see
about comparing between Upper Entropy (UE) and Lower Entropy (LE) in ASEAN
Countries as presented at Table 3. According to Ruefli (1990), we see that industry with
condition of UE < LE will be more interesting since firms of this industry could have
raised their ranks.
Table 3: Comparing upper entropy (UE) and lower entropy (LE) in ASEAN
Industry sectors (GICS code) Philppines Thailand Malaysia Singapore Indonesia
Oil and Gas (10) UE = LE UE = LE UE = LE UE = LE UE > LE
Basic Material (15) UE > LE UE > LE UE < LE UE > LE UE > LE
Industrial Goods (20) UE > LE UE > LE UE = LE UE < LE UE < LE
Services Goods (25) UE < LE UE > LE UE > LE UE > LE UE = LE
Consumer Goods (30) UE < LE UE = LE UE > LE UE > LE UE > LE
Health Care (35) - UE > LE UE < LE UE > LE UE = LE
Financial Institution (40a) UE < LE UE > LE UE > LE UE = LE UE < LE
Property and Real Estate (40b) UE > LE UE < LE UE > LE UE > LE UE > LE
Technology (45) UE > LE UE > LE UE > LE UE > LE UE > UE
Utilities-Telecommunication (50) UE > LE UE = LE UE = LE UE > LE UE = LE
Thus in the attractiveness point of global investors, each ASEAN countries have several
condition of UE < LE i.e. Philippines (Financial Institutions), Thailand (Property and Real
Estate), Malaysia (Health Care), Singapore and Indonesia (both are Industrial Goods).
Does Entropy Index Explain the Determinant of Capital Market Integration in ASEAN?
33
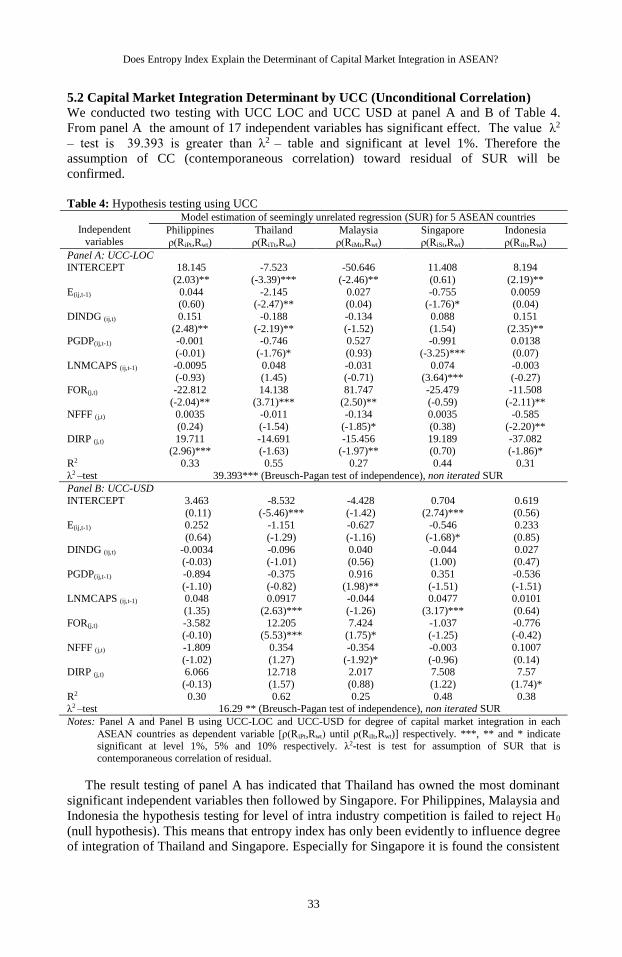
5.2 Capital Market Integration Determinant by UCC (Unconditional Correlation)
We conducted two testing with UCC LOC and UCC USD at panel A and B of Table 4.
From panel A the amount of 17 independent variables has significant effect. The value λ2
– test is 39.393 is greater than λ2 – table and significant at level 1%. Therefore the
assumption of CC (contemporaneous correlation) toward residual of SUR will be
confirmed.
Table 4: Hypothesis testing using UCC
Independent
variables
Model estimation of seemingly unrelated regression (SUR) for 5 ASEAN countries
Philippines
ρ(RiPt,Rwt)
Thailand
ρ(RiTt,Rwt)
Malaysia
ρ(RiMt,Rwt)
Singapore
ρ(RiSt,Rwt)
Indonesia
ρ(RiIt,Rwt)
Panel A: UCC-LOC INTERCEPT 18.145
(2.03)**
-7.523
(-3.39)***
-50.646
(-2.46)**
11.408
(0.61)
8.194
(2.19)**
E(ij,t-1) 0.044 (0.60)
-2.145 (-2.47)**
0.027 (0.04)
-0.755 (-1.76)*
0.0059 (0.04)
DINDG (ij,t) 0.151
(2.48)**
-0.188
(-2.19)**
-0.134
(-1.52)
0.088
(1.54)
0.151
(2.35)** PGDP(ij,t-1) -0.001
(-0.01)
-0.746
(-1.76)*
0.527
(0.93)
-0.991
(-3.25)***
0.0138
(0.07)
LNMCAPS (ij,t-1) -0.0095 (-0.93)
0.048 (1.45)
-0.031 (-0.71)
0.074 (3.64)***
-0.003 (-0.27)
FOR(j,t) -22.812
(-2.04)**
14.138
(3.71)***
81.747
(2.50)**
-25.479
(-0.59)
-11.508
(-2.11)** NFFF (j,t) 0.0035
(0.24)
-0.011
(-1.54)
-0.134
(-1.85)*
0.0035
(0.38)
-0.585
(-2.20)**
DIRP (j,t) 19.711 (2.96)***
-14.691 (-1.63)
-15.456 (-1.97)**
19.189 (0.70)
-37.082 (-1.86)*
R2 0.33 0.55 0.27 0.44 0.31
λ2 –test 39.393*** (Breusch-Pagan test of independence), non iterated SUR
Panel B: UCC-USD
INTERCEPT 3.463
(0.11)
-8.532
(-5.46)***
-4.428
(-1.42)
0.704
(2.74)***
0.619
(0.56) E(ij,t-1) 0.252
(0.64)
-1.151
(-1.29)
-0.627
(-1.16)
-0.546
(-1.68)*
0.233
(0.85)
DINDG (ij,t) -0.0034 (-0.03)
-0.096 (-1.01)
0.040 (0.56)
-0.044 (1.00)
0.027 (0.47)
PGDP(ij,t-1) -0.894
(-1.10)
-0.375
(-0.82)
0.916
(1.98)**
0.351
(-1.51)
-0.536
(-1.51) LNMCAPS (ij,t-1) 0.048
(1.35)
0.0917
(2.63)***
-0.044
(-1.26)
0.0477
(3.17)***
0.0101
(0.64)
FOR(j,t) -3.582 (-0.10)
12.205 (5.53)***
7.424 (1.75)*
-1.037 (-1.25)
-0.776 (-0.42)
NFFF (j,t) -1.809
(-1.02)
0.354
(1.27)
-0.354
(-1.92)*
-0.003
(-0.96)
0.1007
(0.14) DIRP (j,t) 6.066
(-0.13)
12.718
(1.57)
2.017
(0.88)
7.508
(1.22)
7.57
(1.74)*
R2 0.30 0.62 0.25 0.48 0.38 λ2 –test 16.29 ** (Breusch-Pagan test of independence), non iterated SUR
Notes: Panel A and Panel B using UCC-LOC and UCC-USD for degree of capital market integration in each
ASEAN countries as dependent variable [ρ(RiPt,Rwt) until ρ(RiIt,Rwt)] respectively. ***, ** and * indicate significant at level 1%, 5% and 10% respectively. λ2-test is test for assumption of SUR that is
contemporaneous correlation of residual.
The result testing of panel A has indicated that Thailand has owned the most dominant
significant independent variables then followed by Singapore. For Philippines, Malaysia and
Indonesia the hypothesis testing for level of intra industry competition is failed to reject H0
(null hypothesis). This means that entropy index has only been evidently to influence degree
of integration of Thailand and Singapore. Especially for Singapore it is found the consistent
Ignatius Roni Setyawan and Buddi Wibowo
34
result to reject H0 for entropy index by Ruefli (1990). This result has implication that the
most significantly of entropy index by Ruefli (1990) in Singapore which implied the closest
of industrial structure of Singapore with GICS.
Returning to panel A, when we use proxy NFFF(j,t) therefore in the whole ASEAN
countries the result is failed to reject H0. The testing result with proxy of NFFF(j,t) has been
confirmed by the testing hypothesis result in Malaysia and Thailand. The tight mechanism
of Malaysia and Thailand bourse through the high of FOR coefficient make inconclusive
prejudice that Malaysia and Thailand bourse still conducts tight control of fund flow from
global investors was reasonable enough. However if we compare to Philippines and
Indonesia, it will indicate the different context. For both of them although it was failed to
reject H0 like as Malaysia but the testing result is still tend to reject H0. On Philippines and
Indonesia, intensity of role of global investors tend to increase integration since the FOR
coefficient has the negative sign which will be different if we are comparing to FOR
coefficient of Malaysia and Thailand.
From panel B above it will only eight independent variables for all of equations that
significant. The sum of significant variable of UCC-USD is less than UCC-LOC. λ2–test of
16.29 is bigger than λ2–table and it is significant at level 1%. So that we conclude that
assumption of CC (Contemporaneous Correlation) by SUR ρ(Rijt,Rwt) was still be fulfilled.
The level of intra industry competition has not been proved to influence the degree of
integration in Philippines, Thailand and Indonesia. Proxy of level of intra industry
competition namely E(ij,t-1)(entropy) has an effect toward the degree of integration ρ(Rijt,Rwt).
Meanwhile for the other bourse, global investors could consider alternative proxies that
is in Thailand with LNMCAPS(ij,t-1) and Malaysia through PGDP(ij,t-1).. When using NFFF(j,t)
as the proxy of intensity of role global investors then in all ASEAN countries it is failed to
reject H0..Non significantly of that fund flow is occurred since the capital control regime
like as in Malaysia which could be confirmed by proxy FOR(j,t) on panel B above. The tight
of capital control regime in Malaysia is also followed by Thailand that make NFFF(j,t) has no
effect significantly toward ρ(Rijt,Rwt) although the sign is positive. Overall we can say the
non-significant of fund flow to increase the integration level.
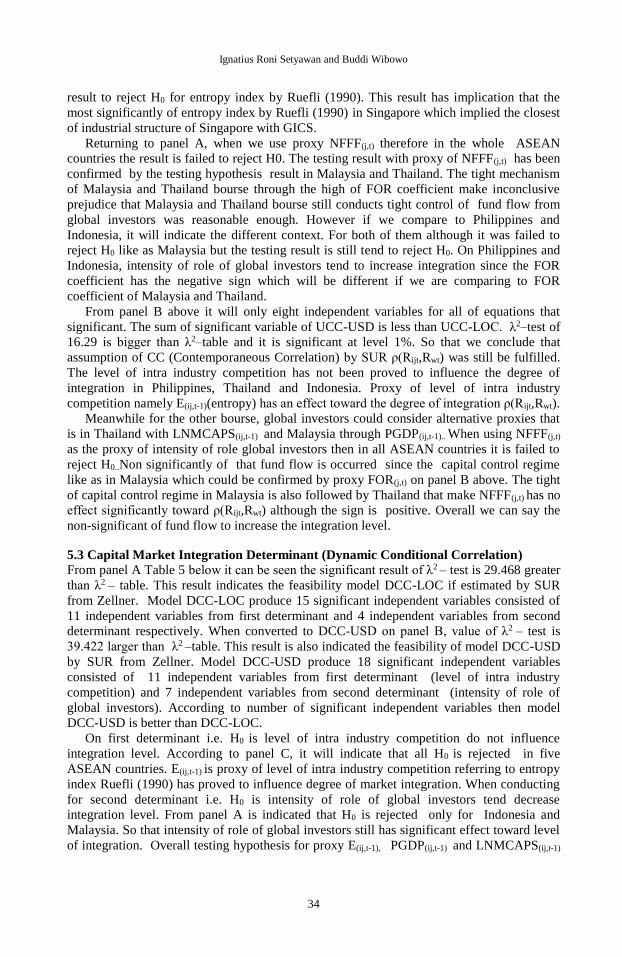
5.3 Capital Market Integration Determinant (Dynamic Conditional Correlation)
From panel A Table 5 below it can be seen the significant result of λ2 – test is 29.468 greater
than λ2 – table. This result indicates the feasibility model DCC-LOC if estimated by SUR
from Zellner. Model DCC-LOC produce 15 significant independent variables consisted of
11 independent variables from first determinant and 4 independent variables from second
determinant respectively. When converted to DCC-USD on panel B, value of λ2 – test is
39.422 larger than λ2 –table. This result is also indicated the feasibility of model DCC-USD
by SUR from Zellner. Model DCC-USD produce 18 significant independent variables
consisted of 11 independent variables from first determinant (level of intra industry
competition) and 7 independent variables from second determinant (intensity of role of
global investors). According to number of significant independent variables then model
DCC-USD is better than DCC-LOC.
On first determinant i.e. H0 is level of intra industry competition do not influence
integration level. According to panel C, it will indicate that all H0 is rejected in five
ASEAN countries. E(ij,t-1) is proxy of level of intra industry competition referring to entropy
index Ruefli (1990) has proved to influence degree of market integration. When conducting
for second determinant i.e. H0 is intensity of role of global investors tend decrease
integration level. From panel A is indicated that H0 is rejected only for Indonesia and
Malaysia. So that intensity of role of global investors still has significant effect toward level
of integration. Overall testing hypothesis for proxy E(ij,t-1), PGDP(ij,t-1) and LNMCAPS(ij,t-1)
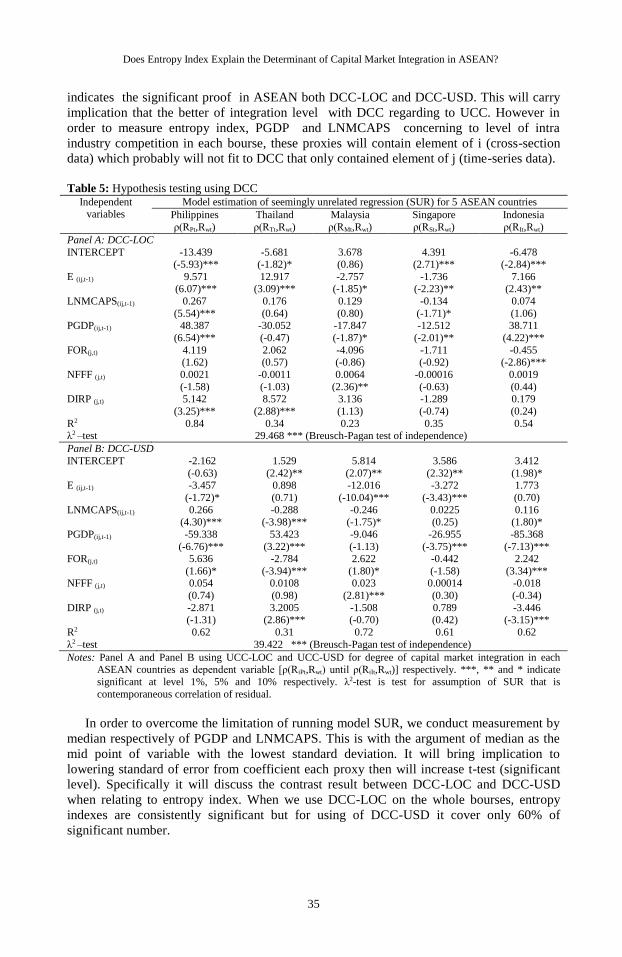
Does Entropy Index Explain the Determinant of Capital Market Integration in ASEAN?
35
indicates the significant proof in ASEAN both DCC-LOC and DCC-USD. This will carry
implication that the better of integration level with DCC regarding to UCC. However in
order to measure entropy index, PGDP and LNMCAPS concerning to level of intra
industry competition in each bourse, these proxies will contain element of i (cross-section
data) which probably will not fit to DCC that only contained element of j (time-series data).
Table 5: Hypothesis testing using DCC
Independent variables
Model estimation of seemingly unrelated regression (SUR) for 5 ASEAN countries
Philippines
ρ(RPt,Rwt)
Thailand
ρ(RTt,Rwt)
Malaysia
ρ(RMt,Rwt)
Singapore
ρ(RSt,Rwt)
Indonesia
ρ(RIt,Rwt)
Panel A: DCC-LOC
INTERCEPT -13.439 (-5.93)***
-5.681 (-1.82)*
3.678 (0.86)
4.391 (2.71)***
-6.478 (-2.84)***
E (ij,t-1) 9.571 (6.07)***
12.917 (3.09)***
-2.757 (-1.85)*
-1.736 (-2.23)**
7.166 (2.43)**
LNMCAPS(ij,t-1) 0.267
(5.54)***
0.176
(0.64)
0.129
(0.80)
-0.134
(-1.71)*
0.074
(1.06) PGDP(ij,t-1) 48.387
(6.54)***
-30.052
(-0.47)
-17.847
(-1.87)*
-12.512
(-2.01)**
38.711
(4.22)***
FOR(j,t) 4.119 (1.62)
2.062 (0.57)
-4.096 (-0.86)
-1.711 (-0.92)
-0.455 (-2.86)***
NFFF (j,t) 0.0021
(-1.58)
-0.0011
(-1.03)
0.0064
(2.36)**
-0.00016
(-0.63)
0.0019
(0.44) DIRP (j,t) 5.142
(3.25)***
8.572
(2.88)***
3.136
(1.13)
-1.289
(-0.74)
0.179
(0.24)
R2 0.84 0.34 0.23 0.35 0.54 λ2 –test 29.468 *** (Breusch-Pagan test of independence)
Panel B: DCC-USD
INTERCEPT -2.162
(-0.63)
1.529
(2.42)**
5.814
(2.07)**
3.586
(2.32)**
3.412
(1.98)* E (ij,t-1) -3.457
(-1.72)*
0.898
(0.71)
-12.016
(-10.04)***
-3.272
(-3.43)***
1.773
(0.70)
LNMCAPS(ij,t-1) 0.266 (4.30)***
-0.288 (-3.98)***
-0.246 (-1.75)*
0.0225 (0.25)
0.116 (1.80)*
PGDP(ij,t-1) -59.338
(-6.76)***
53.423
(3.22)***
-9.046
(-1.13)
-26.955
(-3.75)***
-85.368
(-7.13)*** FOR(j,t) 5.636
(1.66)*
-2.784
(-3.94)***
2.622
(1.80)*
-0.442
(-1.58)
2.242
(3.34)*** NFFF (j,t) 0.054
(0.74)
0.0108
(0.98)
0.023
(2.81)***
0.00014
(0.30)
-0.018
(-0.34)
DIRP (j,t) -2.871 (-1.31)
3.2005 (2.86)***
-1.508 (-0.70)
0.789 (0.42)
-3.446 (-3.15)***
R2 0.62 0.31 0.72 0.61 0.62
λ2 –test 39.422 *** (Breusch-Pagan test of independence)
Notes: Panel A and Panel B using UCC-LOC and UCC-USD for degree of capital market integration in each ASEAN countries as dependent variable [ρ(RiPt,Rwt) until ρ(RiIt,Rwt)] respectively. ***, ** and * indicate
significant at level 1%, 5% and 10% respectively. λ2-test is test for assumption of SUR that is
contemporaneous correlation of residual.
In order to overcome the limitation of running model SUR, we conduct measurement by
median respectively of PGDP and LNMCAPS. This is with the argument of median as the
mid point of variable with the lowest standard deviation. It will bring implication to
lowering standard of error from coefficient each proxy then will increase t-test (significant
level). Specifically it will discuss the contrast result between DCC-LOC and DCC-USD
when relating to entropy index. When we use DCC-LOC on the whole bourses, entropy
indexes are consistently significant but for using of DCC-USD it cover only 60% of
significant number.
Ignatius Roni Setyawan and Buddi Wibowo
36
That result indicates the effect of USD currency that will become disturbance in
relationship among DCC and entropy index. Concerning to role of proxy FOR and NFFF as
the second determinant of market integration using by DCC, it can be seen that we get the
better result for DCC-USD. When we analyze for DCC-USD, FOR has four significant
evidence in Thailand (negative sign) while Philippines, Indonesia and Malaysia (positive
respectively). DCC for integration level which will assume to be changed over time to time
(time-varying); but it is actually not changing the high-level protection from several
bourses. Although Thailand has the low protection level, it will not make international fund
flow come to entry significantly. As similar to DCC-LOC, Indonesian has the same result.
5.4 Discussion on Entropy as Determinant for Capital Market Integration
The results of the Entropy test in Singapore and Thailand, which have a significant negative
impact on capital market integration (measured by UCC), show that the degree of
competition that is not so high (i.e. low value) which has a positive meaning for global
investors to make more international diversification in many industry sectors at two
countries. Singapore as a developed industrial country and Thailand as a highly innovative
country in the industry will serve as a model for Malaysia, Indonesia and the Philippines to
further promote the attractiveness of their capital market for global investors. In this case, it
improves the attractiveness of the industrial structure so that it is increasingly leading to low
total entropy such as Singapore and Thailand.
For the industrial structure conditions are increasingly low total entropy, then every
industrial sector must be made to lead to a lower entropy condition that is greater than upper
entropy. In a detailed explanation of Setyawan and Wibowo (2019), lower entropy refers to
the tendency of companies as members in an industry to experience a rating increase in time
series. On the contrary for the industrial structure which has upper entropy conditions. An
increase in rating means an increase in profit performance which is the main input for
calculating company returns and something global investors are very much pursuing [see
Bracker and Koch (1999) and Carrieri et al. (2004)]. Overall, our research is the first
evidence in the literature on capital market integration studies that industrial structure can be
a determining variable for capital market integration through the entropy index by Ruefli
(1990). Of course this extends the results of study of Faff and Mittoo (2003), Roll (1992)
and Pretorius (2002) only discussed per industry sector category. The use of entropy index
by Ruefli (1990) could function as the effective substitute of industrial sector rotation in
conducting international diversification in ASEAN from many global investors. As Hwang
and Sitorus (2014) claimed that the use of GICS (Global Industry Classification Standard)
for industry factors on which to base.
6. Concluding Remarks This study has two important findings i.e. Singapore has the strong level of intra industry
competition in ASEAN and Malaysia has still protective toward the existing of global
investors. The result of Singapore can be drawn from the effective of entropy index by
Ruefli (1990) as the first determinant of market integration when we conduct testing
hypothesis using UCC-LOC, UCC-USD, DCC-LOC and DCC-USD. This result suggest
the most potential for global investors to make inter industry diversification since industrial
sector in Singapore closed to GICS.
The result of Malaysia can be shown by the still effective of proxy FOR and NFFF. Both
variables is becoming the second determinant of market integration by UCC and DCC. Our
result confirms the result of Mitchell and Joseph (2010) and also Omay and Iren (2019)
about the strict foreign exchange control regime in Malaysia. Therefore it will need more
and more approach from global investors to make penetration to Malaysia. They can adapt
Does Entropy Index Explain the Determinant of Capital Market Integration in ASEAN?
37
Dvořák (2005) strategy namely building trust with local brokerage to inflow the fund into
Malaysia.
Finally this study can continue effectively the correlation equation model from Pretorius
(2002) and Bracker and Koch (1999) which have put alternative measurement of capital
market integration and make model about determinant factors through correlation beside
cointegration. In order to make better result in the future, we suggest using of DCC in
industrial level from GICS. DCC industrial level from GICS will be fitted with entropy
index of Ruefli (1990). This study completes the discussion on the results level difference of
integration of capital markets at country and industrial level in ASEAN according to
Setyawan and Wibowo (2019). In situations such as the global covid-19 pandemic in the
world and especially in ASEAN, every global investor must prioritize a dynamic
international diversification strategy based on the risk on and risk off approach from Smales
(2016). However, the challenge in estimating the empirical model is combining it with
entropy index by Ruefli (1990).
References Aggarwal, S., Faircloth, S., Liu, C., & Rhee, S. G. (2009). Why do foreign investors underperform
domestic investors in trading activities? Evidence from Indonesia. Journal of Financial Market,
12(1), 32-53.
Antoniou, A., Pescetto, G. M., & Stevens, I. (2007). Market-wide and sectoral integration: Evidence
from the UK, USA and Europe. Managerial Finance, 33(3), 173-194.
Bae, K. H., Chan, K., & Ng, A. (2004). Investability and return volatility. Journal of Financial
Economics, 71(2), 239-263.
Bekaert, G., & Harvey, C. R. (1997). Emerging equity market volatility. Journal of Financial
Economics, 43(1), 29-77.
Bekaert, G., & Harvey C. R. (2000). Foreign speculators and emerging equity markets. The Journal of
Finance, 55(2), 565-613.
Bekaert, G., Harvey, C. R., & Lumsdaine, R. L. (2002). The dynamics of emerging market equity
flows. Journal of International Money and Finance, 21(3), 295-350.
Bekaert, G., Harvey, C. R., & Ng, A. (2005). Market integration and contagion. The Journal of
Business, 78(1), 39-69.
Bekaert, G., Harvey, C. R. , Lundblad, C. T., & Siegel, S. (2011). What segments equity market? The
Review of Financial Studies, 24(12), 341-3890.
Bhatt, V., & Virmani, A. (2005). Global integration of India’s money market: Interest rate parity in
India (ICRIER Working Paper No. 164). Retrieved from EconStor website:
https://www.econstor.eu/handle/10419/176186
Biker, J. A., & Haaf, K. (2002). Competition, concentration and their relationship: An empirical
analysis of the banking industry. Journal of Banking and Finance, 26(11), 2191-2214.
Bracker, K., & Koch, P. D. (1999). Economic determinants of the correlation structure across
international equity markets. Journal of Economics and Business, 51(6), 443-471.
Carrieri, F., Errunza, V., & Sarkissian, S. (2004). Industry risk and market integration. Management
Science, 50(2), 207-221.
Cavaglia, S., Brightman, C., & Aked, M. (2000). The increasing importance of industry factors.
Financial Analysts Journal, 56(5), 41-54.
Cha, B., & Oh, S. (2000). The relationship between developed equity markets and the Pacific Basin’s
emerging equity markets. International Review of Economics and Finance, 9(4), 299-322.
Cheng, H. (2000). Cointegration test for equity market integration: The case of the Great China
economic area (Mainland China, Hong Kong, and Taiwan), Japan and the United States
[Unpublished Doctoral Dissertation]. George Washington University.
Chen, N. F., & Zhang, F. (1997). Correlations, trades and stock returns of the Pasific-Basin markets.
Pasific-Basin Finance Journal, 5(5), 559–577.
Chuah, H. L. (2005). The integration of international equity markets [Doctoral Dissertation, Duke
University]. Duke University Libraries. https://find.library.duke.edu/catalog/DUKE003448371
Ignatius Roni Setyawan and Buddi Wibowo
38
Click, R. W., & Plummer, M. G. (2005). Stock market integration in ASEAN after the Asian financial
crisis. Journal of Asian Economics, 16(1), 5-28.
Collins, M. J., & Ruefli, T. W. (1992). Strategic risk: An ordinal approach. Management Science,
38(12), 1707-1731.
Do, H. Q., Bhatti, M. I., & Kónya, L. (2016). On ASEAN capital market and industry integration: A
review. Corporate Ownership and Control, 2(1), 8-23.
Dufour, J. M., & Khalaf, L. (2002). Exact tests for contemporaneous correlation of disturbances in
seemingly unrelated regressions. Journal of Econometrics, 106(1), 143-170.
Dutt, P., & Mihov, I. (2008). Stock market comovements and industrial structure (INSEAD Working
Paper No. 2008/53). Retrieved from SSRN website: https://papers.ssrn.com
/sol3/papers.cfm?abstract_id=1253269
Dvořák, T. (2005). Do domestic investor have an information advantage? Evidence from Indonesia.
The Journal of Finance, 60(2), 817-839.
Edison, H. J., & Warnock, F. E. (2003). A simple measure of the intensity of capital controls. Journal
of Empirical Finance, 10(1-2), 81-103.
Engwall, L. (1973). Models of industrial structure (Vol. 973). New York, NY: Lexington Books.
Engle, R. (2002). Dynamic conditional correlation: A simple class of multivariate generalized
autoregressive conditional heteroskedasticity models. Journal of Business and Economics
Stabiltics, 20(3), 339-350.
Faff, R. W., & Mittoo, U. R. (2003). Capital market integration and industrial structure: The case of
Australia, Canada and the United States. Journal of Economic Integration, 18(3), 433-465.
Froot, A. K., & Ramadorai, T. (2008). Institutional portfolio flows and international investments. The
Review of Financial Studies, 21(2), 937-971.
Gatignon, H. (2014). Statistical analysis of management data (3rd ed.). Boston, MA: Springer Science
& Business Media.
Heston, S. L., & Rouwenhorst, K. G. (1994). Does industrial structure explain the benefits of
international diversification? Journal of Financial Economics, 36(1), 3-27.
Hsin, C. W., & Tseng, P. W. (2012). Stock price synchronicities and speculative trading in emerging
markets. Journal of Multinational Financial Management, 22(3), 82-109.
Hwang, P., & Sitorus, R. E. (2014). A study of financial integration and optimal diversification
strategy in ASEAN equity markets. Journal of Economic Integration, 29(3), 496-519.
Jorion, P., & Schwartz, E. (1986). Integration versus segmentation in the Canadian stock market. The
Journal of Finance, 41(3), 603-614.
Mitchell, H., & Joseph, S. (2010). Changes in Malaysia: Capital controls, prime ministers and political
connections. Pacific-Basin Finance Journal, 18(5), 460-476.
King, B. F. (1966). Market and industry factors in stock price behavior. The Journal of Business,
39(1), 139-190.
Koutoulas, G., & Kryzanowski, L. (1994). Integration or segmentation of the canadian stock market:
Evidence based on the APT. Canadian Journal of Economics, 27(2), 329-351.
Kuper, G. H., & Lestano (2007). dynamic conditional correlation analysis of financial market
interdependence: An application to Thailand and Indonesia. Journal of Asian Economics, 18(4),
670-684.
Longin, F., & Solnik, B. (1995). Is the correlation in international equity returns constant: 1960-1990?
Journal of International Money and Finance, 14(1), 3-26.
Marston, R. C. (1995). International financial integration: A study of interest differentials between the
major industrial countries (1st ed.). New York, NY: Cambridge University Press.
Menchero, J., & Morozov, A. (2011). The relative strengths of industry and country factors in global
equity markets. (MSCI Barra Working Paper No. 2011-11). Retrieved from SSRN website:
https://papers.ssrn.com/sol3/papers.cfm?abstract_id=1915233
Mishkin, F. S., & Eakins, S. G. (2000). Financial markets and institutions (3rd ed.). Massachusetts,
USA: Addison-Wesley.
Ng, L. F. Y. (1995). Changing industrial structure and competitive pattern of manufacturing and non-
manufacturing in a small open economy: An entropy measurement. Managerial and Decision
Economics, 16(5), 547-563.
Omay, T., & Iren, P. (2019). Behavior of foreign investors in the Malaysian stock market in times of
crisis: A nonlinear approach. Journal of Asian Economics. 60, 85-100.
Does Entropy Index Explain the Determinant of Capital Market Integration in ASEAN?
39
Park, C. Y., & Woo, J. (2002). New economy and the effects of industrial structures on international
equity market correlations (ERD Working Paper No. 31). Retrieved from ECONSTOR website:
https://www.econstor.eu/handle/10419/109250
Pretorius, E. (2002). Economic determinants of emerging stock market interdependence. Emerging
Market Review, 3(1), 84-105.
Pukthuanthong, K., & Roll, R. (2009). Global market integration: An alternative measure and its
application. Journal of Financial Economics, 94(2), 214-232.
Ratner, M., & Leal, R. P. C. (2005). Sector integration and the benefits of global diversifications.
Multinational Finance Journal, 9(3-4), 237-269.
Roll, R. (1992). Industrial structure and the comparative behavior of international stock market
indices. The Journal of Finance, 47(1), 3-41.
Ruefli, T. W. (1990). Ordinal time series analysis: Methodology and applications in management
strategy and policy. Westport, CT: Quorum Books.
Setyawan, I. R., & Wibowo, B. (2019). Determinant capital market integration: The case of ASEAN
and implications to China. In C. T. Foo (Ed.), Finance and strategy inside China (Vol. 1, pp. 91-
111). Singapore: Springer.
Smales, L. A. (2016). Risk-on/risk-off: Financial market response to investor fear. Finance Research
Letter, 17, 125 -134.
Solnik, B., & McLeavey, D. (2009). Global Investment (6th ed.). Boston, USA: Pearson Prentice Hall.
Sula, O., & Willett, T. D. (2009). The reversibility of different types of capital flows to emerging
markets. Emerging Markets Review, 10(4), 296-310.
Tu, T. T. (1998). An entropic approach to equity market integration and consumption-based capital
asset pricing models [Doctoral Dissertation, Iowa State University]. Iowa State University Digital
Repository. https://lib.dr.iastate.edu/rtd/11896/
Yusof, R. M., & Majid, M. S. A. (2006). Who moves the Malaysian stock market: The U.S. or Japan?
Empirical evidence from the pre-, during and post-1997 Asian financial crisis. Gadjah Mada
International Journal of Business, 8(3), 367-406.