Embed Size (px)
Citation preview
Energy Policy 40 (2012) 473–479
Contents lists available at SciVerse ScienceDirect
Energy Policy
0301-42
doi:10.1
n Corr
E-m1 Se
for mor
journal homepage: www.elsevier.com/locate/enpol
Does financial development increase energy consumption? The roleof industrialization and urbanization in Tunisia
Muhammad Shahbaz a, Hooi Hooi Lean b,n
a Department of Management Sciences, COMSATS Institute of Information Technology, Lahore, Pakistanb Economics Program, School of Social Sciences, Universiti Sains Malaysia, 11800 USM, Penang, Malaysia
a r t i c l e i n f o
Article history:
Received 12 September 2011
Accepted 27 October 2011Available online 9 November 2011
Keywords:
Energy consumption
Financial development
Economic growth
15/$ - see front matter & 2011 Elsevier Ltd. A
016/j.enpol.2011.10.050
esponding author. Tel.: þ604 653 2663; fax:
ail address: [email protected] (H.H. Lean).
e Levine (1996), Bairer et al. (2004) and Abu
e discussion.
a b s t r a c t
This paper assesses the relationship among energy consumption, financial development, economic
growth, industrialization and urbanization in Tunisia from 1971 to 2008. The autoregressive distributed
lag bounds testing approach to cointegration and Granger causality tests is employed for the analysis.
The result confirms the existence of long-run relationship among energy consumption, economic
growth, financial development, industrialization and urbanization in Tunisia. Long-run bidirectional
causalities are found between financial development and energy consumption, financial development
and industrialization, and industrialization and energy consumption. Hence, sound and developed
financial system that can attract investors, boost the stock market and improve the efficiency of
economic activities should be encouraged in the country. Nevertheless, promoting industrialization and
urbanization can never be left out from the process of development. We add light to policy makers with
the role of financial development, industrialization and urbanization in the process of economic
development.
& 2011 Elsevier Ltd. All rights reserved.
1. Introduction
The objective of this paper is to assess the relationship amongenergy consumption, financial development, economic growth,industrialization and urbanization in Tunisia. Being one of thefastest growing economies in the North African region, Tunisia isan interesting case study as it faces energy shortage in fulfillingits growing energy needs. It is also important to investigate thedirection of causal relationship between energy consumption andeconomic growth. If the causality runs from economic growth toenergy consumption, energy conservation policies should beencouraged in reducing CO2 emissions. On the other hand, theenergy reduction policies may have inverse impact on economicgrowth if energy consumption Granger causes economic growth.
The role of financial development in an economy is widelydiscussed in the economic literature. Both cross-country andcountry-specific studies discussed the importance of financialdevelopment on economic growth. A well established and devel-oped financial system increases the efficiency and effectiveness offinancial institutions and boosts the innovations in the financialservices delivery system. It also helps the advancement of technol-ogy, reduction of information cost and profitability of investment.1
ll rights reserved.
þ604 657 0918.
-Bader and Abu-Qarn (2008)
Improvement in monetary transmission mechanism, as a result offinancial liberalization, also encourages savings and investmentand enhances economic growth. Literature shows that liberal-ization of financial markets leads to economic growth.2 An oppo-site view is also found in the literature, which states that financialdevelopment is a result of economic growth.3
A pioneering study by Kraft and Kraft (1978) found thateconomic growth caused growing energy demand in the UnitedStates during 1947–1974. According to Wolde-Rufael (2009) andApergis and Payne (2009a, 2009b, 2010), rise in energy demand inemerging countries is due to increases of income. To fulfill thegrowing needs of their people, the emerging countries need moreproduction, which leads to more energy consumption.
Several control variables are used in literature to explain therelationship between energy consumption and economic growth.Population growth, urbanization and industrialization are amongthe important factors that will boost energy consumption. Rapidgrowth in population will lead to urbanization, which may furthercause more usage of energy. On the other hand, industrializationaffects the energy consumption directly and indirectly. Industria-lization means enhancement of plants to expand production andhence energy consumption. Industrial growth contributes toeconomic growth through cross-sectoral growth that further
2 See Beakert and Harvey, 2000; Beakert et al. (2001, 2002, 2005) and Fung
(2009).3 See Robinson (1952), Lucas (1988) and Stern (1989).
M. Shahbaz, H.H. Lean / Energy Policy 40 (2012) 473–479474
enlarges the demand for energy. Furthermore, industrial growthalso increases the demand for labor and thus improves theirincome. The rise of income boosts the demand for consumeritems such as cars, TVs, refrigerators, computers, etc., whichincreases the energy consumption.
Much of the literature on energy focuses on the nexus ofoutput–energy, which portrays only a partial picture of theproblem. According to Boulila and Trabelsi (2004), financial devel-opment causes economic growth in Tunisia, which may furthercause more energy consumption. To the best knowledge of theauthors, this is the only comprehensive study that takes intoaccount financial development, industrialization and urbanizationin the energy–growth nexus for Tunisia and uses the longestavailable data from 1971 to 2008, making the estimation morereliable. The finding may help policy makers to better understandsome of the intricate development that confronts Tunisia.
The rest of the paper is organized as follows. Section 2 reviewsthe literature and Section 3 describes data and methodology. Resultsare reported in Section 4 and the conclusion is in Section 5.
6 The measure for domestic credit is obtained from banking sector, including
gross credit to various sectors but with the exception of credit to the central
government. Banking sector includes monetary authorities, deposit money banks
and other banking institutions for which data are available. It also includes
institutions that do not accept transferable deposits but incur such liabilities as
time and savings deposits. This is a broad measure for the development of
financial sector.7 Several researchers have used liquid liabilities as share of GDP (LLY) to proxy
2. Literature review
The relationship between financial development and economicgrowth is complex in both empirical and theoretical literatures(McKinnon, 1973; Bascom, 1994; Dow, 1996; Kaminsky andSchmukler, 2003; Claessens and Laeven, 2004). Without scanningthe prevailing economic situation, steps taken for financialdevelopment and financial liberalization may be harmful to theeconomy (Stiglitz, 2000; Rogoff, 2004; Arestis and Stein, 2005).The competition between domestic and foreign banks makes thefinancial market more flexible and generates more and newopportunities for investment. This flexibility enhances the rela-tionship between economic growth and financial development(Mankiw and Scarth, 2008; Karanfil, 2008; Sadorsky, 2010).
According to Karanfil (2009), the causality between economicgrowth and energy consumption is not justified just by a simplebivariate model.4 He suggested adding one of the financial variablessuch as domestic credit to private sector, stock market capitalizationor liquid liabilities into the model. He also argued that interest rateand exchange rate can affect the energy consumption throughenergy prices. In this regard, Stern (2000) indicated the omissionof relevant variables from the model. Furthermore, positive andsignificant relationships between energy consumption and eco-nomic growth are found by Lee and Chang (2008) by includingcapital stock in the model for some Asian countries.
Bartleet and Gounder (2010) studied the casual relationshipbetween energy consumption and economic growth using bothbivariate and multivariate models. They found that economicgrowth, employment and energy consumption have cointegrationrelationship. The causality results show that economic growthcauses energy consumption and economic activity determines theincrease of energy demand. Using the neo-classical productionfunction, they found that capital stock plays an important role indetermining the direction of casual relationship between energyconsumption and economic growth, and real GDP and employ-ment also significantly affect the energy consumption.
Sadorsky (2010) used different indicators5 of financial devel-opment in twenty-two emerging economies during the period
4 Kaplan et al. (2011) incorporated energy prices, capital and labor as
important variables for demand and production models and confirmed feedback
hypothesis between energy consumption and economic growth.5 FDI, deposit money to total bank assets as share of GDP, stock market
capitalization as share of GDP, stock market turnover ratio and total stock market
value traded over GDP.
1990–2006. They found that the impact of financial developmenton energy demand is positive and significant but small. Shahbazet al. (2010) suggested a significant and positive effect of financialdevelopment on energy consumption in Pakistan. The causalityanalysis indicated bidirectional casual relation between financialdevelopment and energy consumption. In Malaysia, Islam et al.(2011) revealed that financial development and economic growthhave positive impact on energy consumption. Different fromPakistan, a unidirectional causality was found running fromfinancial development to energy consumption in Malaysia.
On the energy–growth relation, Chontanawata et al. (2008)showed that energy consumption Granger causes economicgrowth in the OECD countries but the reverse happened in thenon-OECD countries. They also commented that energy conserva-tion policies may have inverse effect on economic growth. Ozturket al. (2010) indicated that economic growth Granger causesenergy consumption in the low income countries while feedbackhypothesis is found in the middle income countries. Similarly,Ozturk and Acaravci (2010) revealed the bidirectional causalrelation between energy consumption and economic growth inHungary. Altunbas and Kapusuzoglu (2011) found no long-runcausality between energy consumption and economic growth butshort run unidirectional causality runs from economic growth toenergy consumption in the United Kingdom.
Belloumi (2009) confirmed cointegration and bidirectionalcausal relationship between energy consumption and economicgrowth in Tunisia. However, by applying the bivariate Johansencointegration and Granger causality approaches, their findingsmay be biased. Lutkepohl (1982) argued that omissions ofimportant variables provide biased and inappropriate results onthe relationship. Bartleet and Gounder (2010) also recommendedincorporating other pertinent variables that also play an impor-tant role to elucidate the energy–growth nexus. Thus, we try tofill this research gap by investigating the relationship with amultivariate model.
3. Data and methodology
The sample used is annual data covering the period 1971–2008 taken from the World Development Indicators (WDI-CD,2009). Energy consumption is measured by total energy con-sumption per capita (kg of oil equivalent). Domestic credit toprivate sector as share of GDP is the proxy for financial devel-opment.6,7 Real GDP per capita measures the economic growth,industrial value added as share of GDP is the proxy for indus-trialization and urban population as share of total population isthe proxy for urbanization.
Log–linear specification produces a better result compared tothe linear functional form of model. Thus, all data are transformedto natural logarithmic. Modified from Sadorsky (2010), the basic
for financial development (McKinnon, 1973; King and Levine, 1993). The measure
does not present a true picture of financial development as it shows the volume of
financial sector but not financial development. Increase in LLY does not show
savings mobilization. This may misrepresent some nations having high indicator
even with an underdeveloped financial market. Among other measures to proxy
for financial development are the ratio of commercial bank assets to the sum of
commercial bank and central bank assets. The most common proxy is domestic
credit to private sector as share of GDP, e.g. (see Yucel (2009) for further details).
8 The mean prediction error of AIC based model is 0.0005 while that of SBC
based model is 0.0063 (Shrestha and Chowdhury, 2007).
M. Shahbaz, H.H. Lean / Energy Policy 40 (2012) 473–479 475
framework for energy demand is
ENCt ¼ f ðFDt ,GDPCt ,INDt ,URBtÞ ð1Þ
where ENC is logarithmic total energy consumption per capita, FD
is logarithmic domestic credit to private sector as share of GDP,GDPC is logarithmic real GDP per capita, IND is logarithmicindustrial value added as share of GDP and URB is logarithmicurban population as share of total population.
Financial development indicates the actual amount of moneyto be used in investment projects. A high value of financialdevelopment implies developed financial market, which meansbank and equity markets and fund are available for investment(Minier, 2009; Sadorsky, 2010). There are two main mechanismsto explain the enhancement in financial markets, which are linkedwith investment activities and hence the economic growth.The first mechanism is level effect, which reveals that developedfinancial markets channel financial resources to the high returnprojects. Regulations set a better accounting and reportingsystem, which enhances investor’s confidence and attracts foreigndirect investment (Sadorsky, 2010). The second mechanism isefficiency effect, which means financial development increasesliquidity and asset diversification and raises funds for appropriateventures. Thus, the impact of financial development on economicgrowth and thus the energy consumption should be positive.
Economic growth leads industrialization, which is the back-bone of the economic activities, and increases the demand forenergy through sectoral growth. Similarly, energy literature suchas Aqeel and Butt (2001) for Pakistan, Ghosh (2002) for India,Morimoto and Hope (2004) for Sri Lanka, Altinay and Karagol(2005) for Turkey, Ang (2008) for Malaysia, Bowden and Payne(2009) for USA, Halicioglu (2007) for Turkey, Odhiambo (2009) forTanzania posited that economic growth has positive impact onenergy consumption. The increase of share of industrial sector’svalue to GDP means more energy is required in order to keep thepace of economic growth consistent. A nation’s ability in upgrad-ing machineries to develop their industrial sectors varies willexplain the intensity of energy consumption. Jiang and Gao(2007) reported that a rise in industrial growth is linked withhigh demand for energy consumption in China.
Urbanization is a major feature of economic development thatinvolves many structural changes throughout the economy andhas important implication to the energy consumption. Urbaniza-tion deliberates population and hence economic activities.The rise in economic activities due to urbanization increases thedemand for energy consumption. Mishra et al. (2009) indicatedthat energy consumption is caused by urbanization in the shortrun for the Pacific Island countries. In the long span of time,energy consumption and urbanization cause gross domesticproduct.
We employ the autoregressive distributed lag (ARDL) boundstesting approach to cointegration developed by Pesaran et al.(2001) to explore the existence of long-run equilibrium amongthe series. The bounds testing approach has several advantages.The approach is applied irrespective of whether the variables areI(0) or I(1), unlike other widely used cointegration techniques.Moreover, a dynamic unrestricted error correction model (UECM)can be derived from the ARDL bounds testing through a simplelinear transformation. The UECM integrates the short-rundynamics with the long-run equilibrium without losing anylong-run information. The UECM is expressed as follows:
DENCt ¼ a1þaT TþaENC ENCt�1þaGDPC GDPCt�1þaFD FDt�1
þaIND INDt�1þaURB URBt�1þXp
i ¼ 1
aiDENCt�i
þXq
j ¼ 0
ajDGDPCt�jþXr
k ¼ 0
akDFDt�k þXs
l ¼ 0
alD INDt�l
þXt
m ¼ 0
amDURBt�mþmt ð2Þ
DFDt ¼ b1þbT TþbENC ENCt�1þbGDPC GDPCt�1þbFD FDt�1
þbIND INDt�1þbURB URBt�1þXp
i ¼ 1
biDFDt�i
þXq
j ¼ 0
bjDGDPCt�jþXr
k ¼ 0
bkDENCt�kþXs
l ¼ 0
blD INDt�l
þXt
m ¼ 0
bmDURBt�mþmt ð3Þ
DGDPCt ¼ W1þWT TþWENC ENCt�1þWGDPC GDPCt�1þWFD FDt�1
þWIND INDt�1þWURB URBt�1þXp
i ¼ 1
WiDGDPCt�i
þXq
j ¼ 0
WjDFDt�jþXr
k ¼ 0
WkDENCt�kþXs
l ¼ 0
WlD INDt�l
þXt
m ¼ 0
WmDURBt�mþmt ð4Þ
D INDt ¼ r1þrT TþrENC ENCt�1þrGDPC GDPCt�1þrFD FDt�1
þrIND INDt�1þrURB URBt�1þXp
i ¼ 1
riD INDt�i
þXq
j ¼ 0
rjDFDt�jþXr
k ¼ 0
rkDENCt�k þXs
l ¼ 0
rlDGDPCt�l
þXt
m ¼ 0
rmDURBt�mþmt ð5Þ
DURBt ¼ s1þsT TþsENC ENCt�1þsGDPC GDPCt�1þsFD FDt�1
þsIND INDt�1þsURB URBt�1þXp
i ¼ 1
siDURBt�i
þXq
j ¼ 0
sjDFDt�jþXr
k ¼ 0
skDENCt�kþXs
l ¼ 0
slDGDPCt�l
þXt
m ¼ 0
smD INDt�mþmt ð6Þ
where D is the first difference operator and mt are error terms. Theoptimal lag structure of the first difference regression is selected bythe Akaike Information criteria (AIC). Lags are induced by the noiseproperty in the error term.8 Pesaran et al. (2001) suggested F-test forjoint significance of the coefficients of the lagged level of thevariables. For example, the null hypothesis of no long-run relationshipbetween the variables in Eq. (2) is H0 : aENC ¼ aGDPC ¼ aFD ¼ aIND ¼
aURB ¼ 0 against the alternative hypothesis of cointegration H1 :aENC aaGDPC aaFDaaINDaaURBa0.
Two asymptotic critical bounds are used to test for cointegra-tion, lower bound is applied if the regressors are I(0) and theupper bound is used for I(1). If the F-statistic exceeds the uppercritical value, we conclude the favor of a long-run relationship.If the F-statistic falls below the lower critical values, we cannotreject the null hypothesis of no cointegration. However, if theF-statistic lies between the two bounds, inference would beinconclusive. When the order of integration for all the series isknown to be I(1), the decision is made based on the upper bound.Similarly, if all the series are I(0), then the decision is made based
Table 2Results of the Ng–Perron unit root test.
Variables MZa MZt MSB MPT
LevelENC �3.3273 �1.1513 0.3460 24.6911
FD �8.2178 �1.9570 0.2381 11.2944
GDPC �1.8814 �0.8360 0.4443 39.6181
IND �6.0343 �1.7368 0.2878 15.1009
URB �9.8729 �2.0209 0.2047 10.0736
1st DifferenceENC �27.4132n
�3.7003 0.1349 3.3353
FD �33.2143n�4.0718 0.1225 2.7623
GDPC �19.6562nn�3.1235 0.1589 4.7049
IND �16.8163n�2.8182 0.1675 5.9001
URB �20.0058nn�3.1531 0.1576 4.6129
Note: n and nn indicate the significance at the 1% and 5% levels, respectively.
Table 3Results of ARDL cointegration test.
Variable ENC FD GDPC IND URB
F-statistics 7.737nnn 6.754nnn 6.031 8.430nn 0.7215
Critical valuesa 1% level 5% level 10% level
Lower bounds 10.150 7.135 5.950a
Upper bounds 11.130 7.980 6.680
Diagnostic tests
R2 0.8957 0.8974 0.8465 0.7917 0.9439
Adj�R2 0.8133 0.7774 0.6104 0.4273 0.8554
F-statistics 10.878n 7.295n 3.5854n 2.1726nnn 10.7668n
Note: n, nn and nnn show the significance at 1%, 5% and 10% level, respectively.
M. Shahbaz, H.H. Lean / Energy Policy 40 (2012) 473–479476
on the lower bound. The robustness of the ARDL model has beenchecked through some diagnostic tests. The diagnostics testscheck serial correlation, functional form, normality of error termand heteroskedasticity.
After investigating the long-run relationship between thevariables, we employ the Granger causality test to determinethe causality between the variables. If there is cointegration, anerror correction model can be developed as follows:
ð1�LÞ
ENCt
FDt
GDPCt
INDt
URBt
26666664
37777775¼
f1
f2
f3
f4
f5
26666664
37777775þXp
i ¼ 1
ð1�LÞ
a11ia12ia13ia14ia15i
b21ib22ib23ib24ib25i
c31ic32ic33ic34ic35i
d41id42id43id44id45i
e51ie52ie53ie54ie55i
26666664
37777775
ENCt�i
FDt�i
GDPCt�i
INDt�i
URBt�i
26666664
37777775
þ
x1
x2
x3
z4
x5
26666664
37777775½ECTt�1�þ
m1t
m2t
m3t
m4t
m5t
26666664
37777775
ð7Þ
where (1�L) is the difference operator; ECTt�1 is the lagged errorcorrection term, which is derived from the long-run cointegratingrelationship. The long-run causation is shown by significancet-statistic of the lagged error correction term. The existence of asignificant relationship in first differences of the variablesprovides evidence on the direction of the short-run causality.The joint w2 statistic for the first difference lagged independentvariables is used to test the direction of short-run causalitybetween the variables. For instance, a12,ia0 8i indicates thatGranger causality runs from financial development to energyconsumption.
a Critical values bounds are from Narayan (2005) with unrestricted intercept
and unrestricted trend.
Table 4Results of the Johansen cointegration test.
Hypothesis Trace statistic Maximum eigenvalue
R¼0 92.8829n 36.5734nn
Rr1 56.3094n 29.1072nn
Rr2 27.2022 14.0898
Rr3 13.1123 12.3818
Rr4 0.7305 0.7305
Note: n andnn show significance at 1% and 5% level, respectively.
4. Empirical findings and discussion
Table 1 reports the descriptive statistics and correlation matrixof the variables. The correlation results show significant andpositive association between financial development and energyconsumption. There is also positive link between economicgrowth, industrial value added, urbanization and energyconsumption. The association of economic growth, industrialvalue added and urbanization with financial development ispositive and significant. The correlation between industrial valueadded and economic growth is positive but it is insignificantwhile urbanization is positively and significantly correlated witheconomic growth.
The results of Ng and Perron (2001) unit root tests are reportedin Table 2. Ng–Perron test is preferred as the results are morereliable and consistent compared to the traditional ADF and P–P
tests. DeJong et al. (1992) and Harris and Sollis (2003) argued thatdue to their poor size and power properties, these tests are notreliable for small sample size. These tests will over-reject thenull hypotheses when it is true and accept H0 when it is false.
Table 1Descriptive statistics and correlation matrix.
Variables ENC FD GDPC IND URB
Mean 6.3659 4.0319 7.2380 3.3474 4.0306
Std. dev. 0.2818 0.2096 0.2814 0.1156 0.1246
Skewness �0.3952 �1.0237 0.2263 �1.5606 �0.3455
Kurtosis 2.2822 2.9722 2.3332 5.5438 1.8006
FD 0.8833
GDPC 0.9737 0.7964
IND 0.5899 0.7002 0.4871
URB 0.9785 0.8712 0.9518 0.5091
Ng–Perron test can solve the problem of over-rejection of nullhypothesis and can be applied on small sample size. Table 2shows that all variables are I(1).
The Akaike information criterion is used to select the laglength for ARDL bounds testing approach to cointegration. Resultsof ARDL bounds testing are reported in Table 3. We find threecointegration vectors when energy consumption, financial devel-opment and industrialization are used as the dependent variables.This result confirms the existence of long-run relationshipbetween energy consumption, economic growth, financial devel-opment, industrialization and urbanization in Tunisia. For robust-ness check, we also perform the Johansen multivariatecointegration test. Results in Table 4 show two cointegratingvectors. This implies that the long-run relationship between thevariables is valid and robust.
Since there are cointegration vectors among the variables, wederive the long-run elasticities as the estimated coefficient of onelagged level independent variable divided by the estimatedcoefficient of one lagged level dependent variable and multiply
M. Shahbaz, H.H. Lean / Energy Policy 40 (2012) 473–479 477
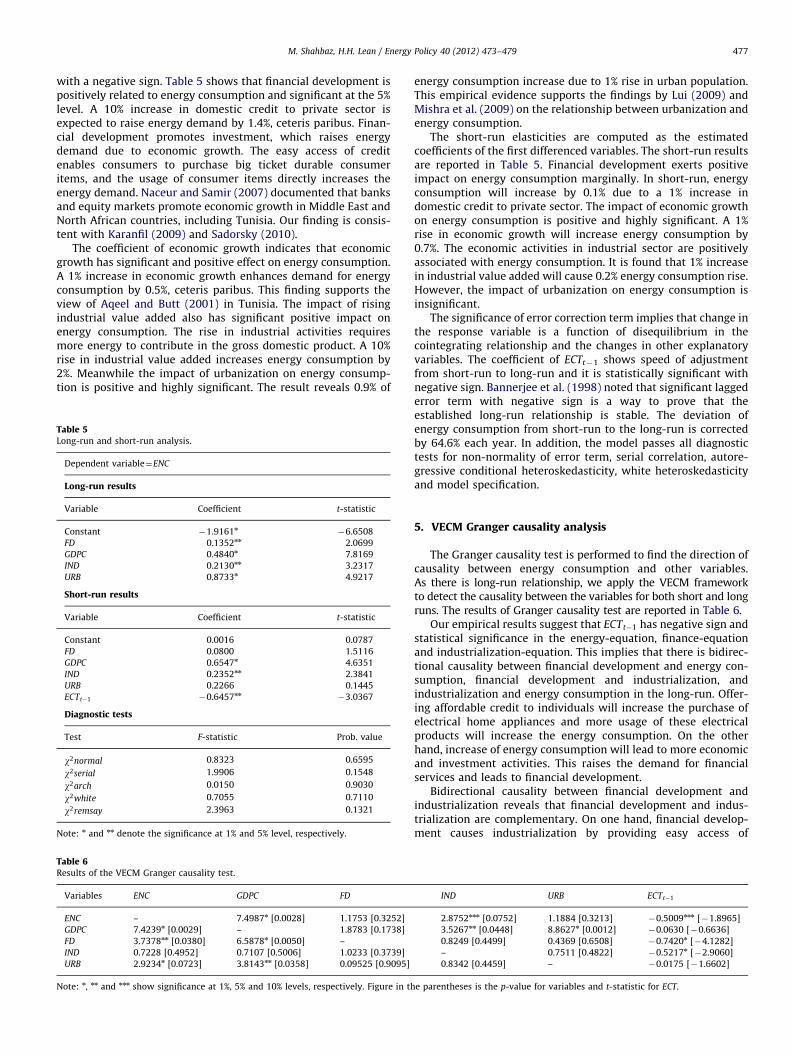
with a negative sign. Table 5 shows that financial development ispositively related to energy consumption and significant at the 5%level. A 10% increase in domestic credit to private sector isexpected to raise energy demand by 1.4%, ceteris paribus. Finan-cial development promotes investment, which raises energydemand due to economic growth. The easy access of creditenables consumers to purchase big ticket durable consumeritems, and the usage of consumer items directly increases theenergy demand. Naceur and Samir (2007) documented that banksand equity markets promote economic growth in Middle East andNorth African countries, including Tunisia. Our finding is consis-tent with Karanfil (2009) and Sadorsky (2010).
The coefficient of economic growth indicates that economicgrowth has significant and positive effect on energy consumption.A 1% increase in economic growth enhances demand for energyconsumption by 0.5%, ceteris paribus. This finding supports theview of Aqeel and Butt (2001) in Tunisia. The impact of risingindustrial value added also has significant positive impact onenergy consumption. The rise in industrial activities requiresmore energy to contribute in the gross domestic product. A 10%rise in industrial value added increases energy consumption by2%. Meanwhile the impact of urbanization on energy consump-tion is positive and highly significant. The result reveals 0.9% of
Table 5Long-run and short-run analysis.
Dependent variable¼ENC
Long-run results
Variable Coefficient t-statistic
Constant �1.9161n�6.6508
FD 0.1352nn 2.0699
GDPC 0.4840n 7.8169
IND 0.2130nn 3.2317
URB 0.8733n 4.9217
Short-run results
Variable Coefficient t-statistic
Constant 0.0016 0.0787
FD 0.0800 1.5116
GDPC 0.6547n 4.6351
IND 0.2352nn 2.3841
URB 0.2266 0.1445
ECTt�1 �0.6457nn�3.0367
Diagnostic tests
Test F-statistic Prob. value
w2normal 0.8323 0.6595
w2serial 1.9906 0.1548
w2arch 0.0150 0.9030
w2white 0.7055 0.7110
w2remsay 2.3963 0.1321
Note: n and nn denote the significance at 1% and 5% level, respectively.
Table 6Results of the VECM Granger causality test.
Variables ENC GDPC FD
ENC – 7.4987n [0.0028] 1.1753 [0.3252]
GDPC 7.4239n [0.0029] – 1.8783 [0.1738]
FD 3.7378nn [0.0380] 6.5878n [0.0050] –
IND 0.7228 [0.4952] 0.7107 [0.5006] 1.0233 [0.3739]
URB 2.9234n [0.0723] 3.8143nn [0.0358] 0.09525 [0.9095]
Note: n, nn and nnn show significance at 1%, 5% and 10% levels, respectively. Figure in th
energy consumption increase due to 1% rise in urban population.This empirical evidence supports the findings by Lui (2009) andMishra et al. (2009) on the relationship between urbanization andenergy consumption.
The short-run elasticities are computed as the estimatedcoefficients of the first differenced variables. The short-run resultsare reported in Table 5. Financial development exerts positiveimpact on energy consumption marginally. In short-run, energyconsumption will increase by 0.1% due to a 1% increase indomestic credit to private sector. The impact of economic growthon energy consumption is positive and highly significant. A 1%rise in economic growth will increase energy consumption by0.7%. The economic activities in industrial sector are positivelyassociated with energy consumption. It is found that 1% increasein industrial value added will cause 0.2% energy consumption rise.However, the impact of urbanization on energy consumption isinsignificant.
The significance of error correction term implies that change inthe response variable is a function of disequilibrium in thecointegrating relationship and the changes in other explanatoryvariables. The coefficient of ECTt�1 shows speed of adjustmentfrom short-run to long-run and it is statistically significant withnegative sign. Bannerjee et al. (1998) noted that significant laggederror term with negative sign is a way to prove that theestablished long-run relationship is stable. The deviation ofenergy consumption from short-run to the long-run is correctedby 64.6% each year. In addition, the model passes all diagnostictests for non-normality of error term, serial correlation, autore-gressive conditional heteroskedasticity, white heteroskedasticityand model specification.
5. VECM Granger causality analysis
The Granger causality test is performed to find the direction ofcausality between energy consumption and other variables.As there is long-run relationship, we apply the VECM frameworkto detect the causality between the variables for both short and longruns. The results of Granger causality test are reported in Table 6.
Our empirical results suggest that ECTt�1 has negative sign andstatistical significance in the energy-equation, finance-equationand industrialization-equation. This implies that there is bidirec-tional causality between financial development and energy con-sumption, financial development and industrialization, andindustrialization and energy consumption in the long-run. Offer-ing affordable credit to individuals will increase the purchase ofelectrical home appliances and more usage of these electricalproducts will increase the energy consumption. On the otherhand, increase of energy consumption will lead to more economicand investment activities. This raises the demand for financialservices and leads to financial development.
Bidirectional causality between financial development andindustrialization reveals that financial development and indus-trialization are complementary. On one hand, financial develop-ment causes industrialization by providing easy access of
IND URB ECTt�1
2.8752nnn [0.0752] 1.1884 [0.3213] �0.5009nnn [�1.8965]
3.5267nn [0.0448] 8.8627n [0.0012] �0.0630 [�0.6636]
0.8249 [0.4499] 0.4369 [0.6508] �0.7420n [�4.1282]
– 0.7511 [0.4822] �0.5217n [�2.9060]
0.8342 [0.4459] – �0.0175 [�1.6602]
e parentheses is the p-value for variables and t-statistic for ECT.
M. Shahbaz, H.H. Lean / Energy Policy 40 (2012) 473–479478
financial resources to firms. On the other hand, increase inindustrialization demands more financial services and leads tofinancial development. At the same time, industrial growthdemands more energy and energy as an important input ofproduction may improve the productivity and output.
In the short-run, we find bidirectional causal relationshipbetween energy consumption and economic growth. This impliesthat energy conservation polices may not adversely affect theeconomic growth. This finding is consistent with Belloumi (2009),who reported feedback effect in Tunisia. On the other hand,industrialization Granger causes energy consumption and eco-nomic growth. We also find that energy consumption Grangercauses urbanization while economic growth and urbanizationhave feedback effect. The demand-side hypothesis is confirmed aseconomic growth Granger causes financial development. Unidir-ectional causality is also found from energy consumption tofinancial development.
6. Conclusion and policy Implications
The literature on financial development–economic growthnexus enlightens us on the importance of finance in economicactivities while the energy literature relates the role of energy inenhancing economic growth. In a free market system, entrepre-neurs translate their ideas to actions with the assistant of finance.A financially developed system provides an appropriate way toreallocate financial resources in high return investment projects.Hence, investment stimulates economic growth, which in turnraises the demand for energy. This paper attempts to verify thereasoning that is intuitively appealing in the case of Tunisia.
Our empirical evidences confirm that cointegration existsamong the variables. We also find that financial development,economic growth, industrialization and urbanization increaseenergy consumption in Tunisia, especially in the long-run.Granger causality test reveals long-run bidirectional causalrelationship between financial development and energy con-sumption, financial development and industrialization, andindustrialization and energy consumption. Hence, sound anddeveloped financial system that can attract investors, boost thestock market and improve the efficiency of economic activitiesshould be encouraged in the country. Nevertheless, promotingindustrialization and urbanization can never be left out from theprocess of development.
Moreover, the long-run unidirectional causality from eco-nomic growth to energy consumption supports the energy con-servation policy. The environment friendly policies such aselectricity conservation, including efficiency improvement mea-sures and demand-side management policies, which aim toreduce the wastage of electricity would not adversely affect theeconomic activities in the long span of time. However, the short-run bidirectional causality between energy consumption andeconomic growth implies that energy conservation policies willrestrict economic growth in Tunisia. Therefore, energy conserva-tion policies should be used in the long-run only. In the short-run,the government could encourage investment activities onresearch and development to formulate new energy savingstechnology and involve financial sector to meet the rising demandfor energy due to the industrialization and urbanization.
While modernization of financial system does not help ineconomic growth and energy consumption, short-run economicpolicies may focus on enhancing the productivity and improvingthe overall economy in the country. The unidirectional causalityfrom energy consumption to financial development implies thatgovernment should implement loose monetary policy, which willstimulate investment activities and enhance economic growth
and hence the energy consumption. In turn, sustainable economicgrowth will generate more demand for financial services, whichwill then push the development of financial sector. The govern-ment can also direct the financial institutions to invest in energysector for meeting the rising demand for energy.
Industry sector is the second contributor after the agriculturesector in Tunisia, so Tunisian government should encourageinvestment activities not only in the small industry such ascottage industry but also in the heavy industry. This wave ofindustrialization will promote economic growth and increase theenergy consumption. Besides, the government should pay atten-tion to explore new sources of energy to meet the rising demandfor energy. Last but not the least, the government should alsoprovide energy facilities in the rural areas to control the rapidurbanization and its environmental consequences.
References
Abu-Bader, S., Abu-Qarn, A.S., 2008. Financial development and economic growth:the Egyptian experience. Journal of Policy Modeling 30, 887–898.
Altinay, G., Karagol, E., 2005. Electricity consumption and economic growth:evidence from Turkey. Energy Economics 27, 849–856.
Altunbas, Y., Kapusuzoglu, A., 2011. The causality between energy consumptionand economic growth in United Kingdom. Economic Research 9, 330–335.
Ang, J.B., 2008. Economic development, pollutant emissions and energy consump-tion in Malaysia. Journal of Policy Modeling 30, 271–278.
Apergis, N., Payne, J.E., 2009a. Energy consumption and economic growth inCentral America: evidence from a panel cointegration and error correctionmodel. Energy Economics 31, 211–216.
Apergis, N., Payne, J.E., 2009b. Energy consumption and economic growth:evidence from the Commonwealth of Independent States. Energy Economics31, 641–647.
Apergis, N., Payne, J.E., 2010. Energy consumption and growth in South America:evidence from a panel error correction model. Energy Economics 32, 1421–1426.
Aqeel, A., Butt, M.S., 2001. The relationship between energy consumption andeconomic growth in Tunisia. Asia–Pacific Development Journal 8, 101–110.
Arestis, P., Stein, H., 2005. An institutional perspective to finance and developmentas an alternative to financial liberalization. International Review of AppliedEconomics 18, 381–398.
Bairer, S.L., Dwyer Jr, G.P., Tamura, R., 2004. Does opening a stock exchange increaseeconomic growth? Journal of International Money and Finance 23, 311–331.
Bannerjee, A., Dolado, J., Mestre, R., 1998. Error-correction mechanism tests forcointegration in single equation framework. Journal of Time Series Analysis 19,267–283.
Bartleet, M., Gounder, R., 2010. Energy consumption and economic growth inNew Zealand: results of trivariate and multivariate models. Energy Policy 38,3505–3517.
Bascom, W.O., 1994. The Economics of Financial Reform in Developing Countries-Macmillan, London.
Beakert, G., Harvey, C.R., 2000. Foreign speculators and emerging equity markets.Journal of Finance 52, 565–614.
Beakert, G., Harvey, C.R., Lumsdaine, R.L., 2002. Dating the integration of worldequity markets. Journal of Financial Economics 65, 203–247.
Beakert, G., Harvey, C.R., Lundblad, C., 2001. Emerging equity markets andeconomic development. Journal of Development Economics 66, 465–504.
Beakert, G., Harvey, C.R., Lundblad, C., 2005. Does financial liberalization spurgrowth? Journal of Financial Economics 77, 3–55.
Belloumi, M., 2009. Energy consumption and GDP in Tunisia: cointegration andcausality analysis. Energy Policy 37, 2745–2753.
Boulila, G., Trabelsi, M., 2004. The causality issues in the finance and growthnexus: empirical evidence from Middle East and North African Countries.Review of Middle East Economics and Finance 2, 123–138.
Bowden, N., Payne, J.E., 2009. The causal relationship between US energyconsumption and real output: a disaggregated analysis. Journal of PolicyModeling 31, 180–188.
Chontanawata, J., Huntb, L.C., Pierse, R., 2008. Does energy consumption causeeconomic growth? Evidence from a systematic study of over 100 countries.Journal of Policy Modeling 30, 209–220.
Claessens, S., Laeven, L., 2004. What drives bank competition? Some internationalevidence?. Journal of Money, Credit and Banking 36, 563–583.
DeJong, D.N., Nankervis, J.C., Savin, N.E., Whiteman, C.H., 1992. Integration versustrend stationarity in time series. Econometrica 60, 423–433.
Dow, S., 1996. European monetary integration, endogenous credit creation andregional economic development. In: Vence-Deza, X., Metcalfe, J. (Eds.), Wealthfrom Diversity: Innovation and Structural Change and Finance for RegionalDevelopment in Europe, Kluwer, pp. 293–306.
Fung, H.K., 2009. Financial development and economic growth: convergence ordivergence? Journal of International Money and Finance 28, 56–78.
Ghosh, S., 2002. Electricity consumption and economic growth in India. EnergyPolicy 30, 125–129.
M. Shahbaz, H.H. Lean / Energy Policy 40 (2012) 473–479 479
Halicioglu, F., 2007. Residential electricity demand dynamics in Turkey. EnergyEconomics 29, 199–210.
Harris, R., Sollis, R., 2003. Applied Time Series Modeling and Forecasting. Wiley,West Sussex.
Islam, F., Shahbaz, M., Alam, M., 2011. Financial Development and EnergyConsumption Nexus in Malaysia: A Multivariate Time Series Analysis. MPRAPaper 28403, University Library of Munich, Germany.
Jiang, W., Gao, W., 2007. The Impact of Industrialization on China’s EnergyConsumption. School of City Development, University of Jinan, Jinan, China.
Kaminsky, G., Schmukler, S., 2003. Short-run Pain, Long-run Gain: The Effects ofFinancial Liberalization. NBER Working Paper No. 9787.
Kaplan, M., Ozturk, I., Kalyoncu, 2011. Energy consumption and economic growthin Turkey: cointegration and causality analysis. Romanian Journal of EconomicForecasting 2, 31–41.
Karanfil, F., 2008. Energy consumption and economic growth revisited: does sizeof underground economy matter? Energy Policy 36, 3019–3025.
Karanfil., F., 2009. How many times again will we examine the energy–incomenexus using a limited range of traditional econometric tools? Energy Policy 36,3019–3025.
King, R.G., Levine, R., 1993. Finance and growth: Schumpeter might be right.Quarterly Journal of Economics 108, 717–738.
Kraft, J., Kraft, A., 1978. On the relationship between energy and GNP. Journal ofEnergy and Development 3, 401–403.
Lee, C.C., Chang, C.P., 2008. Energy consumption and economic growth in Asianeconomies: a more comprehensive analysis using panel data. Resources andEnergy Economics 30, 50–65.
Levine, R., 1996. Financial Development and Economic Growth: Views and Agenda.Policy Research Working Paper Series 1678, The World Bank.
Lucas, R.E., 1988. On the mechanism of economic development. Journal ofMonetary Economics 22, 3–42.
Lui, Y., 2009. Exploring the relationship between urbanisation and energyconsumption in China using ARDL (autoregressive distributed lag) and FDM(factor decomposition model. Energy 34, 1846–1854.
Lutkepohl, H., 1982. Non-causality due to omitted variables. Journal of Econo-metrics 19, 367–378.
Mankiw, N.G., Scarth, W., 2008. Macroeconomics: Third Canadian EditionWorthPublishers, New York.
McKinnon, R.I., 1973. Money and Capital in Economic DevelopmentBrookingsInstitution, Washington, DC.
Minier, J., 2009. Opening a stock exchange. Journal of Development Economics 90,135–143.
Mishra, V., Sharma, S.S., Smyth, R., 2009. Is economic development export-led orimport-led in the Pacific Island Countries? Evidence from panel data models.Pacific Economic Bulletin 25, 46–63.
Morimoto, R., Hope, C., 2004. The impact of electricity supply on economic growthin Sri Lanka. Energy Economics 26, 77–85.
Naceur, S.B., Samir, G., 2007. Stock markets, banks, and economic growth:empirical evidence from the MENA region. Research in International Businessand Finance 21, 297–315.
Narayan, P.K., 2005. The saving and investment nexus for China: evidence fromcointegration tests. Applied Economics 17, 1979–1990.
Ng, S., Perron, P., 2001. Lag length selection and the construction of unit root testwith good size and power. Econometrica 69, 1519–1554.
Odhiambo, N.M., 2009. Energy consumption and economic growth nexus inTanzania: an ARDL bounds testing approach. Energy Policy 37, 617–622.
Ozturk, I., Acaravci, A., 2010. The causal relationship between energy consumptionand GDP in Albania, Bulgaria, Hungary and Romania: evidence from ARDLbound testing approach. Applied Energy 87, 1938–1943.
Ozturk, I., Aslan, A., Kalyoncu, H., 2010. Energy consumption and economic growthrelationship: evidence from panel data for low and middle income countries.Energy Policy 38, 4422–4428.
Pesaran, M.H., Shin, Y., Smith, R., 2001. Bounds testing approaches to the analysisof level relationships. Journal of Applied Econometrics 16, 289–326.
Robinson, J., 1952. The generalization of the general theory. In: The Rate of Interestand Other Essays. MacMillan, London.
Rogoff, K., 2004. Extending the limits of global financial integration. Journal ofPolicy Modeling 26, 519–523.
Sadorsky, P., 2010. The impact of financial development on energy consumption inemerging economies. Energy Policy 38, 2528–2535.
Shahbaz, M., Islam, F., Islam, M.M., 2010. The impact of financial development onenergy consumption in Pakistan: evidence from ARDL bounds testingapproach to cointegration. In: Proceedings of the Second InternationalConference on the Role of Social Sciences and Humanities in Engineering(ICoHSE) 2010, 12–14 November 2010, Bayview Beach Resort, Penang,Malaysia.
Shrestha, M., Chowdhury, K., 2007. Testing financial liberalization hypothesis withARDL modeling approach. Applied Financial Economics 17, 1529–1540.
Stern, D.I., 2000. A multivariate cointegration analysis of the role of energy in theU.S. macroeconomy. Energy Economics 22, 267–283.
Stern, N., 1989. The economics development: a survey. Economic Journal 100,597–685.
Stiglitz, J., 2000. Capital market liberalization, economic growth, and instability.World Development 28, 1075–1086.
Wolde-Rufael, Y., 2009. Energy consumption and economic growth: the experi-ence of African countries revisited. Energy Economics 31, 217–224.
Yucel, F., 2009. Causal relationships between financial development, trade open-ness and economic growth: the case of Turkey. Journal of Social Sciences 5,33–42.