Embed Size (px)
Citation preview
The Impact of
Innovation on R&D
Operations
Neil Patel PharmD.
Director, Pharmaceutical R&D
Operations
PricewaterhouseCoopers
PwC
2
Point of View
Can innovation be balanced against risk and
return on investment?
The industry must become more innovative…….
Through scientific advancement and rethinking
R&D Operations risk and ROI can be balanced.
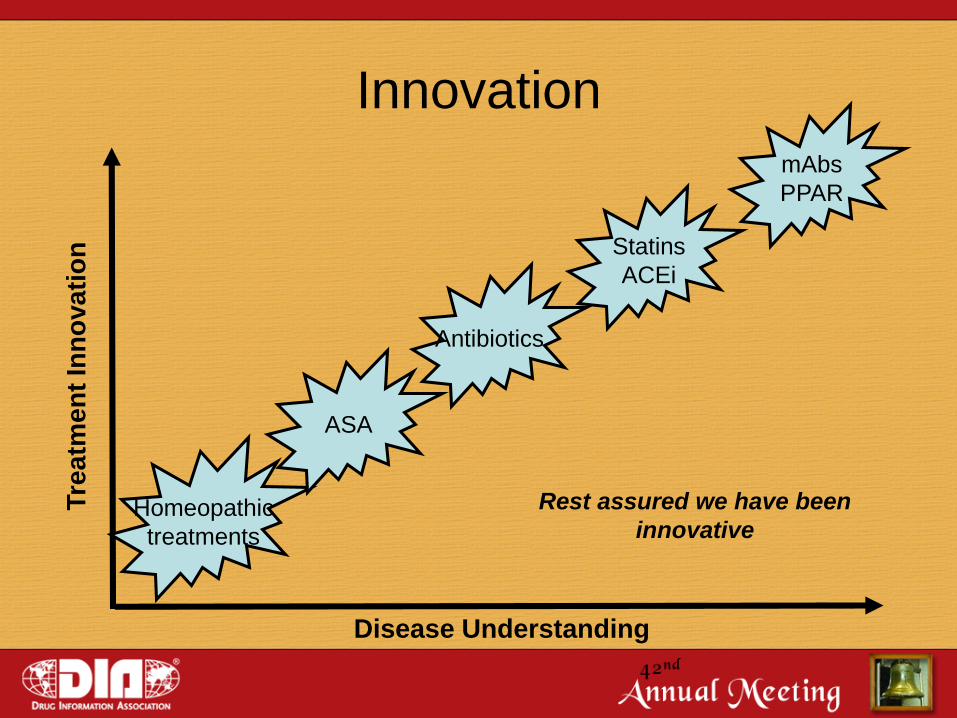
Innovation
Homeopathic
treatments
ASA
Antibiotics
Statins
ACEi
Tre
atm
en
t In
no
va
tio
n
Disease Understanding
mAbs
PPAR
Rest assured we have been
innovative
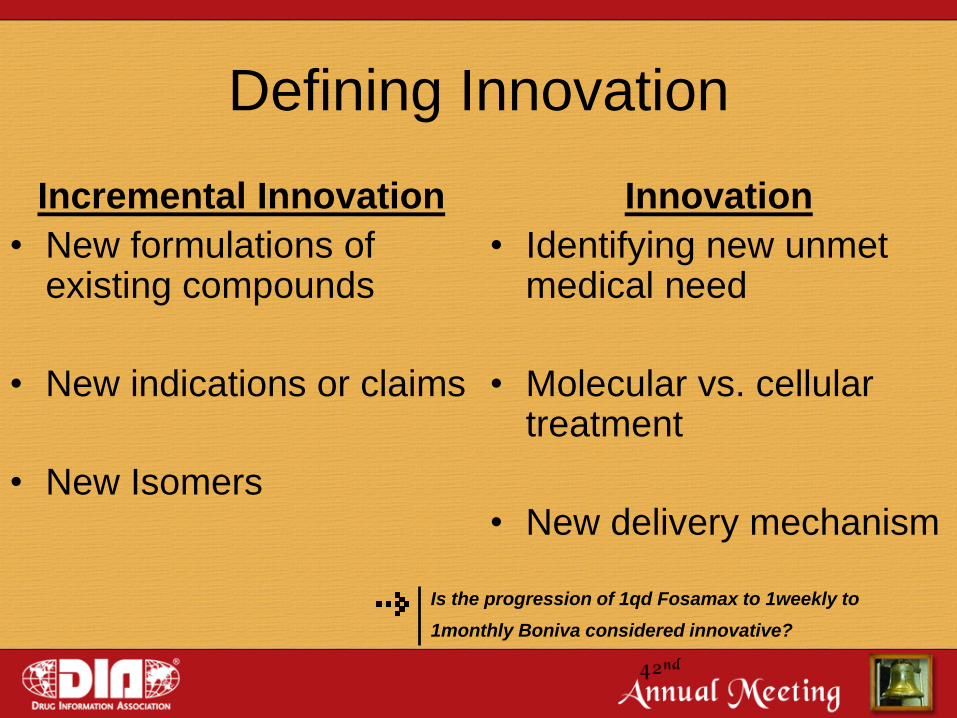
Defining Innovation
Incremental Innovation
• New formulations of existing compounds
• New indications or claims
• New Isomers
Innovation
• Identifying new unmet medical need
• Molecular vs. cellular treatment
• New delivery mechanism
Is the progression of 1qd Fosamax to 1weekly to
1monthly Boniva considered innovative?
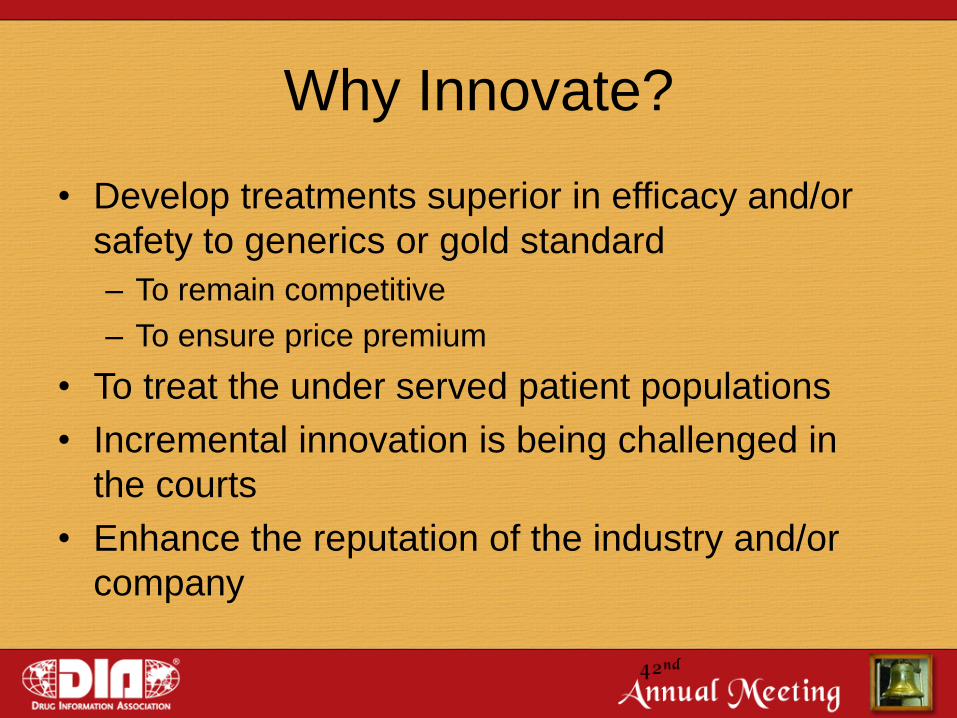
Why Innovate?
• Develop treatments superior in efficacy and/or
safety to generics or gold standard
– To remain competitive
– To ensure price premium
• To treat the under served patient populations
• Incremental innovation is being challenged in
the courts
• Enhance the reputation of the industry and/or
company
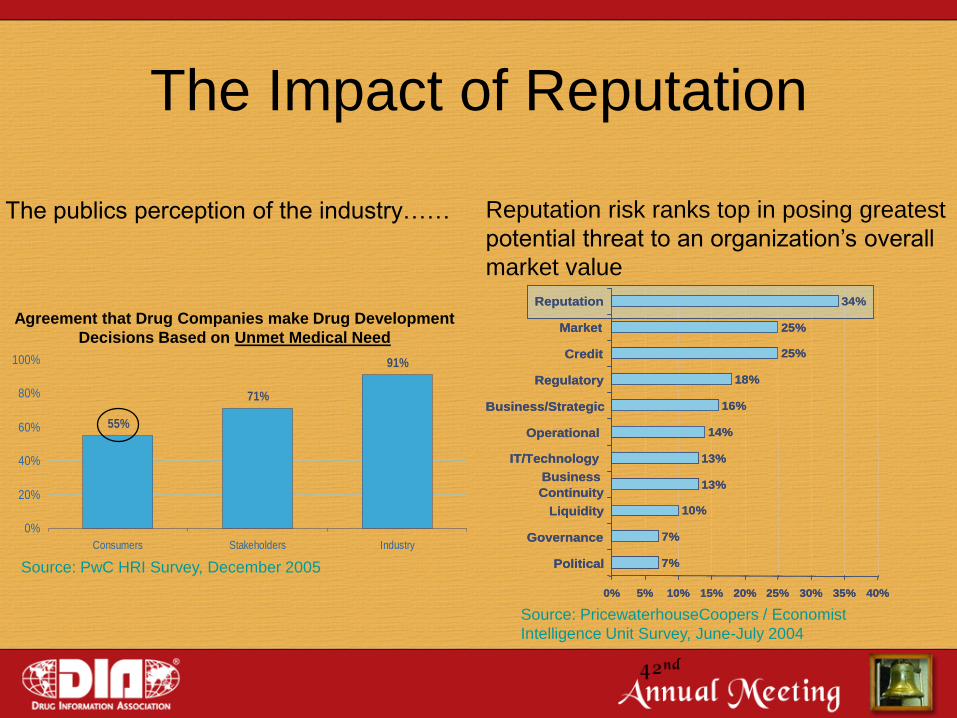
The Impact of Reputation
34%
25%
25%
18%
16%
14%
13%
13%
10%
7%
7%
0% 5% 10% 15% 20% 25% 30% 35% 40%
Reputation
Market
Credit
Regulatory
Business/Strategic
Operational
IT/Technology
Business
Continuity
Liquidity
Governance
Political
34%
25%
25%
18%
16%
14%
13%
13%
10%
7%
7%
0% 5% 10% 15% 20% 25% 30% 35% 40%
Reputation
Market
Credit
Regulatory
Business/Strategic
Operational
IT/Technology
Business
Continuity
Liquidity
Governance
Political
Reputation risk ranks top in posing greatest
potential threat to an organization’s overall
market value
Source: PricewaterhouseCoopers / Economist
Intelligence Unit Survey, June-July 2004
The publics perception of the industry……
Agreement that Drug Companies make Drug Development
Decisions Based on Unmet Medical Need
55%
71%
91%
0%
20%
40%
60%
80%
100%
Consumers Stakeholders Industry
Source: PwC HRI Survey, December 2005
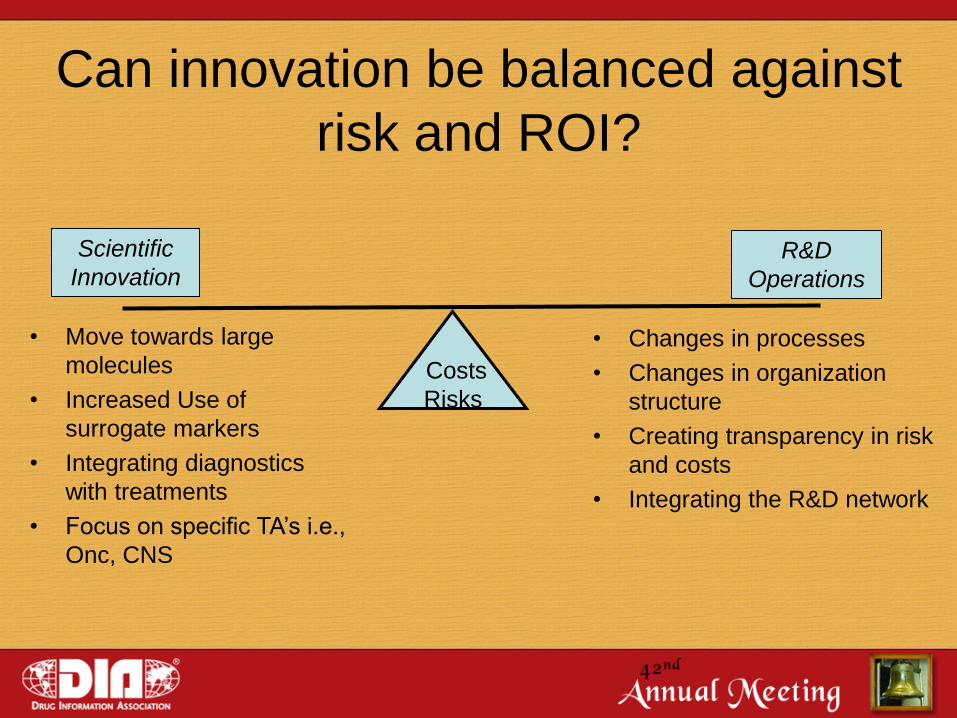
Can innovation be balanced against
risk and ROI?
Costs
Risks
Scientific
InnovationR&D
Operations
• Move towards large
molecules
• Increased Use of
surrogate markers
• Integrating diagnostics
with treatments
• Focus on specific TA’s i.e.,
Onc, CNS
• Changes in processes
• Changes in organization
structure
• Creating transparency in risk
and costs
• Integrating the R&D network
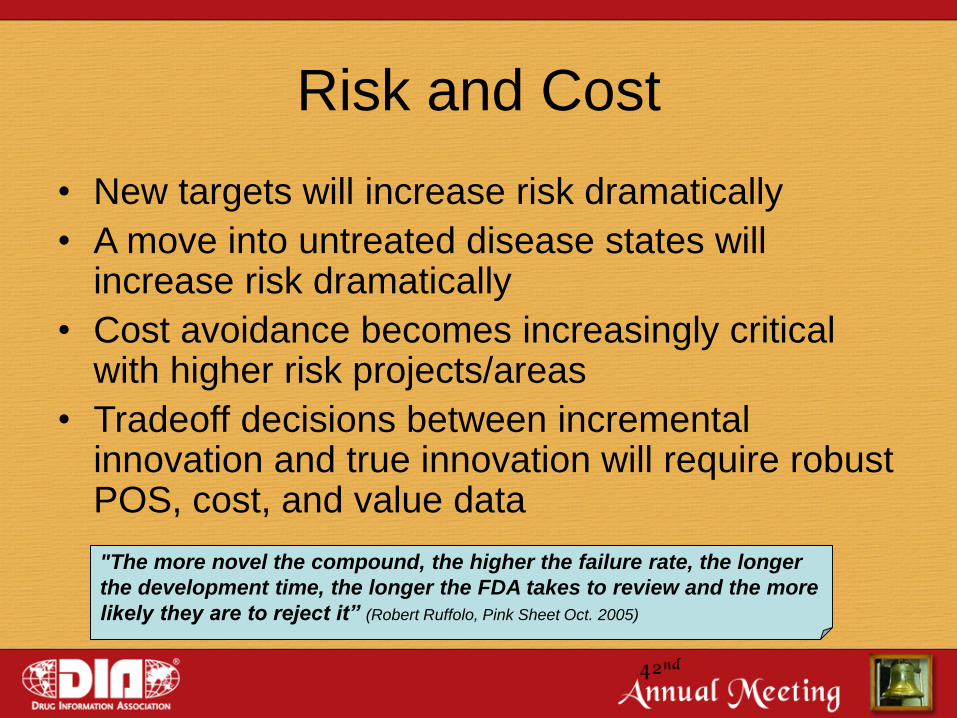
Risk and Cost
• New targets will increase risk dramatically
• A move into untreated disease states will increase risk dramatically
• Cost avoidance becomes increasingly critical with higher risk projects/areas
• Tradeoff decisions between incremental innovation and true innovation will require robust POS, cost, and value data
"The more novel the compound, the higher the failure rate, the longer
the development time, the longer the FDA takes to review and the more
likely they are to reject it” (Robert Ruffolo, Pink Sheet Oct. 2005)
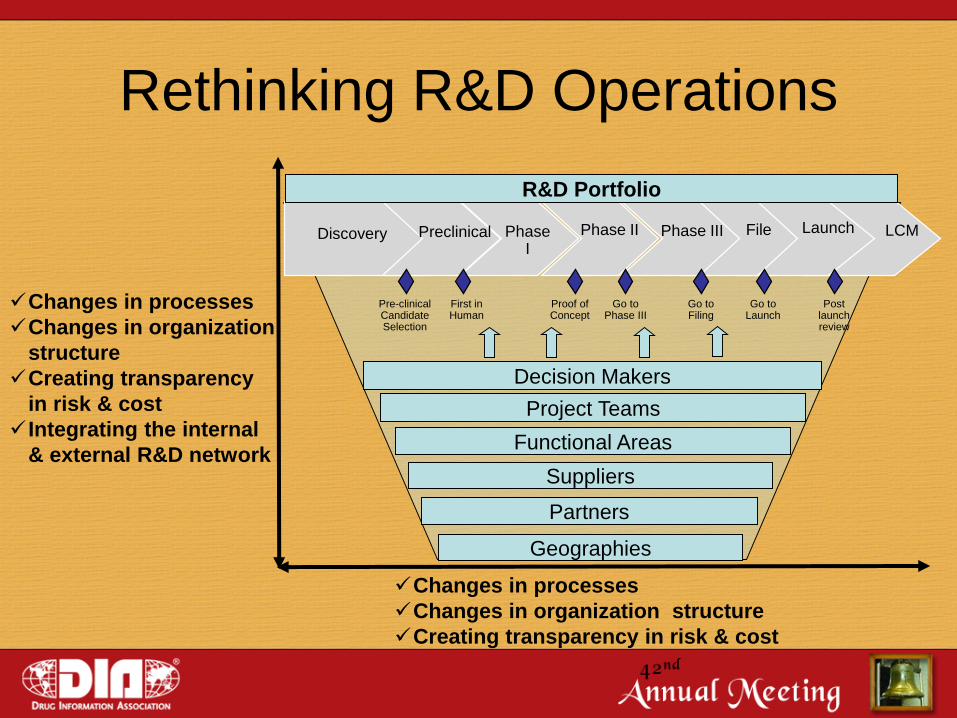
Rethinking R&D Operations
Changes in processes
Changes in organization
structure
Creating transparency
in risk & cost
Integrating the internal
& external R&D network
Postlaunch review
Go toFiling
Go to Phase III
Proof of Concept
Pre-clinical CandidateSelection
First inHuman
Go to Launch
LaunchDiscovery FilePhase IIIPhase IIPhaseI
Preclinical LCM
Changes in processes
Changes in organization structure
Creating transparency in risk & cost
Partners
Suppliers
Project Teams
Decision Makers
Functional Areas
Geographies
R&D Portfolio
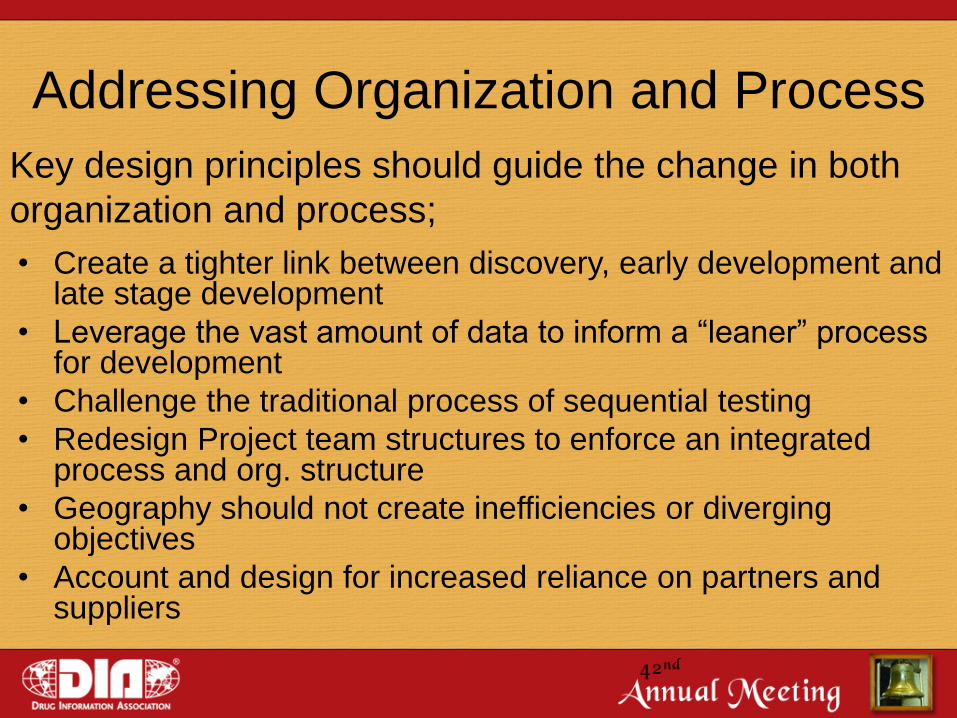
Addressing Organization and Process
• Create a tighter link between discovery, early development and late stage development
• Leverage the vast amount of data to inform a “leaner” process for development
• Challenge the traditional process of sequential testing
• Redesign Project team structures to enforce an integrated process and org. structure
• Geography should not create inefficiencies or diverging objectives
• Account and design for increased reliance on partners and suppliers
Key design principles should guide the change in both
organization and process;
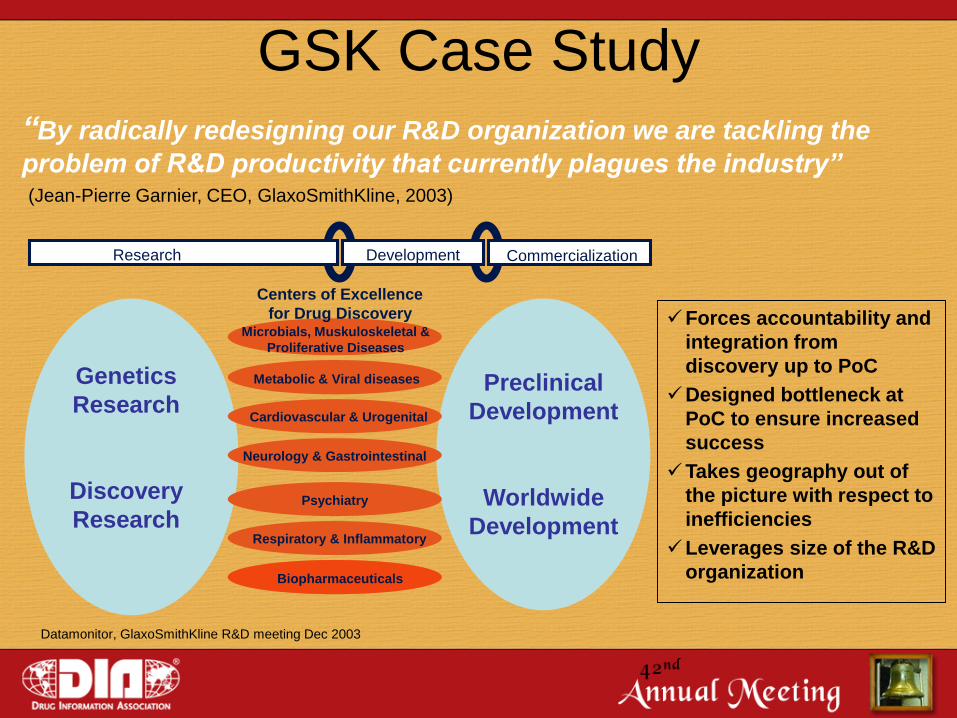
GSK Case Study
Commercialization
Genetics
Research
Discovery
Research
Preclinical
Development
Worldwide
Development
Biopharmaceuticals
Research Development
Microbials, Muskuloskeletal &
Proliferative Diseases
Centers of Excellence
for Drug Discovery
Metabolic & Viral diseases
Cardiovascular & Urogenital
Neurology & Gastrointestinal
Psychiatry
Respiratory & Inflammatory
Datamonitor, GlaxoSmithKline R&D meeting Dec 2003
“By radically redesigning our R&D organization we are tackling the
problem of R&D productivity that currently plagues the industry”(Jean-Pierre Garnier, CEO, GlaxoSmithKline, 2003)
Forces accountability and
integration from
discovery up to PoC
Designed bottleneck at
PoC to ensure increased
success
Takes geography out of
the picture with respect to
inefficiencies
Leverages size of the R&D
organization
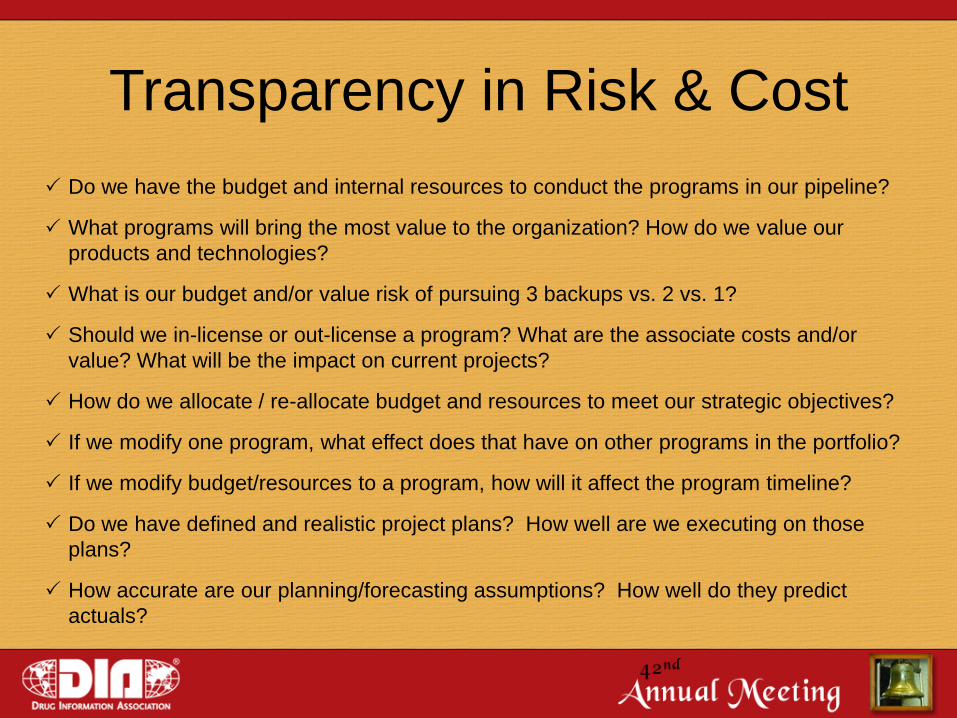
Transparency in Risk & Cost
Do we have the budget and internal resources to conduct the programs in our pipeline?
What programs will bring the most value to the organization? How do we value our
products and technologies?
What is our budget and/or value risk of pursuing 3 backups vs. 2 vs. 1?
Should we in-license or out-license a program? What are the associate costs and/or
value? What will be the impact on current projects?
How do we allocate / re-allocate budget and resources to meet our strategic objectives?
If we modify one program, what effect does that have on other programs in the portfolio?
If we modify budget/resources to a program, how will it affect the program timeline?
Do we have defined and realistic project plans? How well are we executing on those
plans?
How accurate are our planning/forecasting assumptions? How well do they predict
actuals?
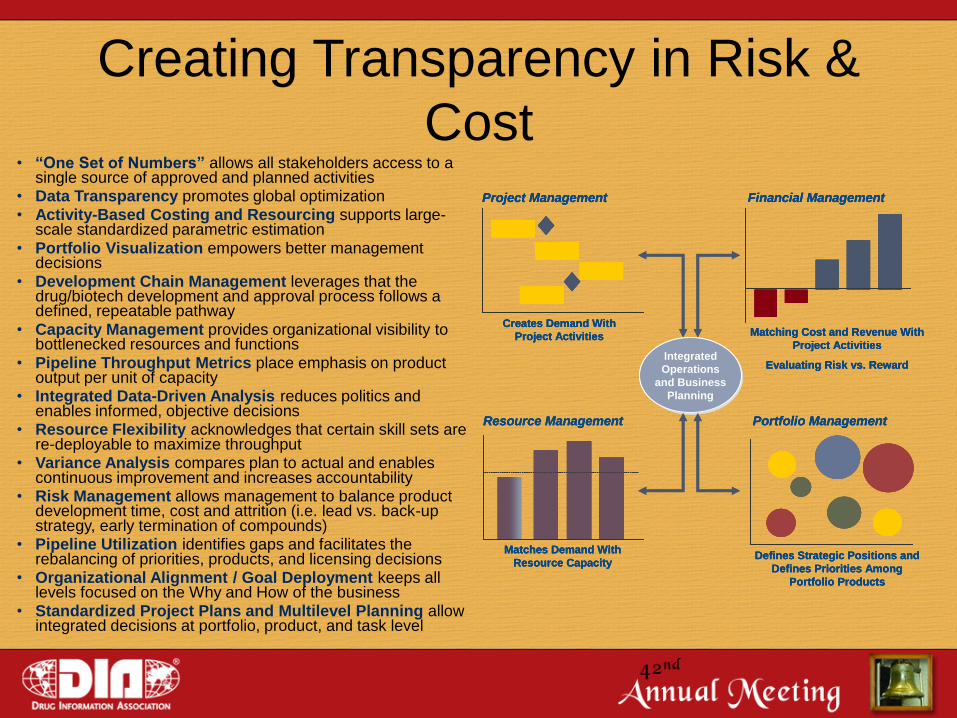
Creating Transparency in Risk &
Cost• “One Set of Numbers” allows all stakeholders access to a
single source of approved and planned activities• Data Transparency promotes global optimization• Activity-Based Costing and Resourcing supports large-
scale standardized parametric estimation• Portfolio Visualization empowers better management
decisions• Development Chain Management leverages that the
drug/biotech development and approval process follows a defined, repeatable pathway
• Capacity Management provides organizational visibility to bottlenecked resources and functions
• Pipeline Throughput Metrics place emphasis on product output per unit of capacity
• Integrated Data-Driven Analysis reduces politics and enables informed, objective decisions
• Resource Flexibility acknowledges that certain skill sets are re-deployable to maximize throughput
• Variance Analysis compares plan to actual and enables continuous improvement and increases accountability
• Risk Management allows management to balance product development time, cost and attrition (i.e. lead vs. back-up strategy, early termination of compounds)
• Pipeline Utilization identifies gaps and facilitates the rebalancing of priorities, products, and licensing decisions
• Organizational Alignment / Goal Deployment keeps all levels focused on the Why and How of the business
• Standardized Project Plans and Multilevel Planning allow integrated decisions at portfolio, product, and task level
Portfolio Management
Defines Strategic Positions and
Defines Priorities Among
Portfolio Products
Integrated
Operations
and Business
Planning
Integrated
Operations
and Business
Planning
Matching Cost and Revenue With
Project Activities
Evaluating Risk vs. Reward
Financial Management
Matches Demand With
Resource Capacity
Resource Management
Creates Demand With
Project Activities
Project Management
Portfolio Management
Defines Strategic Positions and
Defines Priorities Among
Portfolio Products
Portfolio Management
Defines Strategic Positions and
Defines Priorities Among
Portfolio Products
Integrated
Operations
and Business
Planning
Integrated
Operations
and Business
Planning
Matching Cost and Revenue With
Project Activities
Evaluating Risk vs. Reward
Financial Management
Matching Cost and Revenue With
Project Activities
Evaluating Risk vs. Reward
Financial Management
Matches Demand With
Resource Capacity
Resource Management
Matches Demand With
Resource Capacity
Resource Management
Creates Demand With
Project Activities
Project Management
Creates Demand With
Project Activities
Project Management
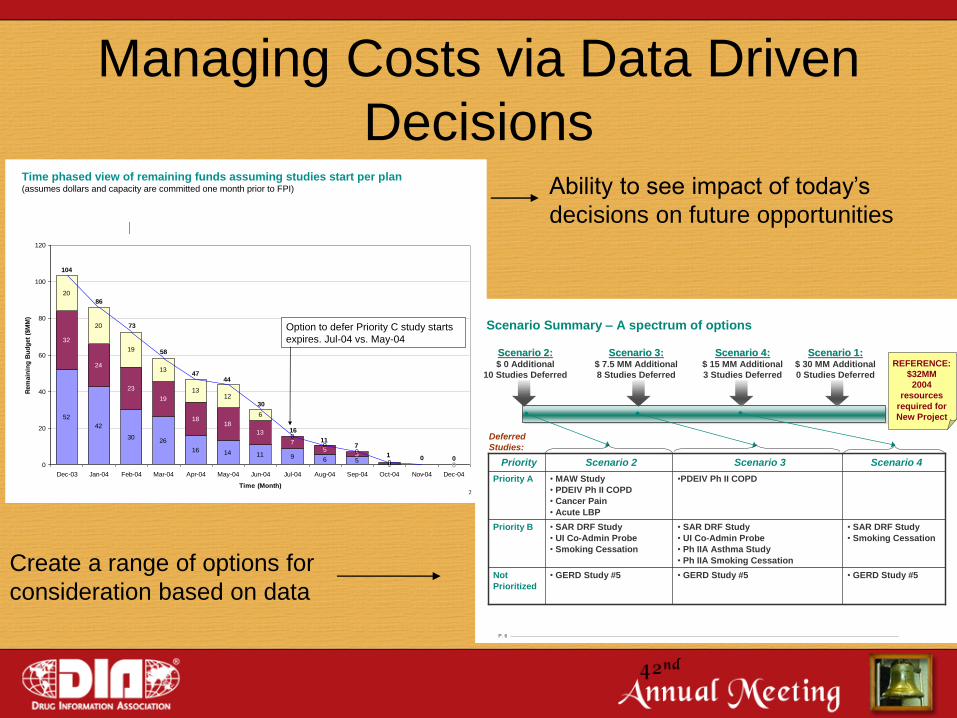
Managing Costs via Data Driven
Decisions
2
New FTE Growth Budget and Clinical Grants Budget by Priority in 2004
52
42
3026
16 14 11 9 6 50 0
32
24
23
19
1818
13
75
3
1 0
20
20
19
13
1312
6
0
00
0
47
58
104
86
73
44
30
16
117
1 0 00
20
40
60
80
100
120
Dec-03 Jan-04 Feb-04 Mar-04 Apr-04 May-04 Jun-04 Jul-04 Aug-04 Sep-04 Oct-04 Nov-04 Dec-04
Time (Month)
Rem
ain
ing
Bu
dg
et
($M
M)
Highest Normal A Normal B Total
Time phased view of remaining funds assuming studies start per plan(assumes dollars and capacity are committed one month prior to FPI)
Option to defer Priority C study starts
expires. Jul-04 vs. May-04
P. 6
Scenario Summary – A spectrum of options
Scenario 2:Scenario 2:$ 0 Additional
10 Studies Deferred
Scenario 3:Scenario 3:$ 7.5 MM Additional
8 Studies Deferred
Scenario 4:Scenario 4:$ 15 MM Additional
3 Studies Deferred
Scenario 1:Scenario 1:$ 30 MM Additional
0 Studies Deferred
REFERENCE:
$32MM
2004
resources
required for
New Project
• GERD Study #5• GERD Study #5• GERD Study #5Not
Prioritized
• SAR DRF Study
• Smoking Cessation
• SAR DRF Study
• UI Co-Admin Probe
• Ph IIA Asthma Study
• Ph IIA Smoking Cessation
• SAR DRF Study
• UI Co-Admin Probe
• Smoking Cessation
Priority B
•PDEIV Ph II COPD• MAW Study
• PDEIV Ph II COPD
• Cancer Pain
• Acute LBP
Priority A
Scenario 4Scenario 3Scenario 2Priority
Deferred
Studies:
Ability to see impact of today’s
decisions on future opportunities
Create a range of options for
consideration based on data
Integrating the R&D network
• Establish an operating model to enable;
– Integration of CRO’s, CMO’s, etc.
– Streamlined decisions for alliances & partnerships
– Entry and integration into emerging markets
• Enable transparency and understanding for
portfolio risk and costs internally as well as
externally
Key design principles which should guide the integration of
the overall R&D network;
To think about going forward…..
• AZ & Merck have stated a strategy to obtain innovation via licensing
• GSK have redesign it’s organization and have a stated strategy of licensing to obtain innovation
• BMS have stated a strategy to focus on LCM as a growth driver for incremental innovation
• Shire have stated a strategy of licensing compounds and paying a premium for low risk projects
• Novartis have stated a strategy to focus on the generics market as a growth driver
Who will win the hearts of investors in the next 10 years innovators, incremental innovators, or non-innovators?