Embed Size (px)
Citation preview

Does Intra-Africa Regional Trade Cooperation Enhance Export Survival?
Paper submitted for AEC Kigali, Rwanda 30th Oct‐2nd Nov.2012
By
Dr. Dick Nuwamanya Kamuganga1,
Graduate Institute of International and Development Studies, Geneva
Abstract
Sustainable export expansion is a key priority for all African countries to achieve sustainable economic growth. In this paper, I examine effects of intra‐regional trade cooperation on sustainability of Africa’s exports (export survival) within Africa and to the rest of the world. I also use a stratified Cox Proportional Hazard Model to econometrically evaluate the effects of a variety of trade costs, policy shocks, and export experience on the duration of export relationships for 53 African countries for the period 1995 to 2009. Results suggest that: (i) regional trade cooperation (integration) initiatives in Africa have non‐negligible effects on enhancing Africa’s export survival. The results also show that the depth of regional integration matters on lowering Africa’s export hazard rates relative to countries that are not in any regional cooperation. Secondly, the interaction effects between regional integration and a variety of trade costs shows, for instance; costs to export, time to export and customs procedures effects on hazard rates diminish with the depth of regional integration over time; and (ii) factors such as costs to export, transit delays (time to export), procedures to export, financial depth and institutional and policy biases against exports provide a natural framework for explaining the observable high hazard rates for African exports. These factors increase the probability of export failure in all African regional groups. Finally, I find that exporting experience to the regional markets significantly reduces African exports hazard rates.
Key words: regional integration, product survival, trade relationships.
JEL classification: F14, F15, C14, C41
1International Economics Section, Graduate Institute of International and Development Studies, Avenue de la Paix 11A, 1202 Genève, Switzerland. Email : [email protected]
1

1. Introduction Why doesn’t Africa sustain its export expansion along the existing products, new
products to existing and new markets? The standard explanation in the literature on African
export performance is that African countries have continuously exported single commodity
products that are vulnerable to price volatility in international markets2. Indeed, many empirical
studies point to Africa’s failure to discover new products and new markets and hence
diversifying into value added products3. This means that empirical research on Africa’s trade
performance has followed the same pattern. It has focused on determinants of export growth in
terms of volume and value along the intensive and extensive margins neglecting the crucial
channel of export survival and sustainance once export relationships are established. In light of
this, policy focus on export growth in African countries has been pressed on promotion of
diversification of export basket composition and destination markets emphasizing market
access initiatives including unilateral trade preferences and exemptions from multilateral trade
obligations. This means there is limited empirical literature on what factors drive or restrict
sustainance of an export relationship once established in Africa. Additionally, the effects of
intra‐regional trade cooperation on export survival in Africa have not been explored.
The primary purpose of this paper is to explore whether intra‐African regional trade
cooperation increases the likelihood of export relationships to survive longer once established
at exporter‐product‐market level. It also explores the other underlying factors that restrict or
enhance the survival of an African export relationship at exporter‐product‐market level once
established. Recent empirical work by Besedes and Prusa (2006a b) Nitsch (2009), Brenton et al
(2009) inter alia, suggest that overall trade relationships are short lived and can depend on
country, product and market characteristics as well as trade costs. In a different context here,
understanding the underlying reasons for high export failure rates for African export
relationships is of particular importance to policy makers in Africa as policies of enhancing
export survival may differ substantially from policies of increasing market penetration (market
access for African exports).
2 See OECD (2003) 3 See inter alia (Sachs and Warner (2001), Isham et al.(2002), Wood and Mayer (1998) )
2

The implicit research hypothesis is that high hazard rates for African export relationships
may reflect structural challenges of poor infrastructure‐therefore high trade costs, a variety of
bureaucratic frictions, poor business environment, weak economic institutions and policy bias
against exports. High hazard rates for African export may also reflect Africa’s comparative
advantage in low‐technology homogenous products4. I specifically attempt to answer three
related research questions: First, does regional trade cooperation has an effect on these factors
or does regional trade cooperation help reduce these hazard rates for African exports?; second,
what factors underlie Africa’s high hazard rates (high risk rates of export failure) of export
relationships; and third, do African traditional exports to traditional markets have a longer life
than non‐traditional exports to non‐traditional markets? I attempt to find distinctive regional
characteristics in Africa that affect the duration of African countries export relationships once
established. I explore to what extent these distinct regional characteristics within regional trade
cooperation enhance the chances of an export relationship to survive longer (i.e. to reduce the
hazard rates).
I use a comprehensive dataset that I assemble on regional trade cooperation in Africa. I
assemble a dataset of 12 African regional groupings at different stages of trade cooperation5. I
use this dataset to investigate distinctive regional characteristics that affect chances of African
countries export survival for longer periods. I also group the sample of exporting countries into
landlocked and maritime (coastal) countries and product groups into 21 sectors at HS 2 digit
level. I also use Harmonized System (HS) 6 digit product level bilateral trade data for 53 African
countries exporting to 191 markets around the world including intra‐African trade for a period
of 1995‐2009. Moreover, I utilize a recent dataset (WDI‐2011) on a variety of trade costs in
Africa (i.e., costs to export, cost of doing business, time to export, customs procedures, and
distance to the nearest port of shipments). The choice of the sample period is dictated by the
4 Research on trade duration shows that homogenous commodities have shorter spells than differentiated products (see Besedes and Prusa (2006a) Inter alia) 5 (i) Monetary Union as most advanced stage of trade cooperation (ii) Common Market in which free flow of goods and services is permitted as well as flow of capital, labor among member countries (iii) Customs Union in which member states have removed trade barriers amongst themselves and impose a common external tariff on third parties (iv) Preferential Trade Area in which member states impose a preferential tariff on each others goods and services and have varying trade policy instruments on third markets; (v) not yet in force regional trade initiatives/under negotiations; (vi) the rest of the world (including those African countries that have no ongoing preferential trade arrangement between them).
3

availability of relatively better bilateral trade data but also by the fact that I use relatively new
datasets on the variety of trade costs and business environment internally in African countries.
In the first step of my analysis, I use semi‐parametric techniques to compute some
stylized facts for the sample of the African countries exporters. The results show that export
failure is phenomenal in Africa. The average survival rate for each of the regions considered is
35 percent for the first year. That is only 35 percent of export relationships initiated survive
their first year of establishment. This implies an average hazard rate of 65 percent across the
region i.e., 65 percent of export relationships initiated in Africa fail in the first year of their
initiation (see table 2.2 for survival rates by region). With regard to intra‐African export survival
rates, these are slightly higher (36 percent) than survival rate for African exports to the rest of
the world (ROW, 34 percent) for the first year of export relationship establishment. The median
duration of an African export relationship is 1 year while the mean is only 2.08 years compared
to 3 years for the rest of the regions (see Brenton et al (2009). Just 2 percent of the (new)
African export relationships last up to 10 years and 0.5 percent until the end of the sample
period (15 years) in all of the regions under consideration. The results also show that observed
hazard rate patterns are reduced as African countries enter into deeper regional trade
cooperation initiatives. Figure 2.3 shows the corresponding survival rates plotted against time
for each of the regions involved.
I also find considerable heterogeneity across sectors. Unlike other authors (for instance,
Nitsch (2009)) who finds high hazard rates for homogenous goods, in my sample more
homogenous sectors 1‐5 largely exported to neighboring regions and African traditional exports
have the highest survival rates compared to more differentiated sectors in HS 84‐85 (electrical
machinery) or HS 90‐92 (optical instruments, clocks and watches etc) which have the least
survival rates indicating that manufactured African countries exports are outcompeted in
international markets (see table 2.4). Even sector 11 (textiles and textile products) has relatively
low survival rates, 37 percent of export relationship survive their first year of establishment in
this sector. That is some sectors to some destinations have relatively short survival times or
high hazard rates than others. Besedes and Prusa (2006b) and Nitsch (2009) inter alia find that
survival rates are higher for differentiated products than for homogenous products. The results
4

show the peculiarity of African exports in this case. The duration of African exports is higher for
traditional exports than for non‐traditional exports i.e. the relatively value added exports.
This would signify that Africa’s failure to expand and diversify its exports could be
related to this short time span of its export relationship in the differentiated sectors of its
exports. Export expansion can take place at least through three channels (see Stibart et al.
2011): first, through expansion along the existing trade relationships (intensive margin); second,
along the new‐product and new‐market margins (extensive margin) and third, along sustainance
of exports both on the extensive and intensive margins of trade. These statistics suggest that
African export expansion could be limited along the third channel due to these high hazard rates
which could in turn be attributed partly to internal challenges rather than the nature of markets
in which the products are exported. That is the hazard rates have much to do with the origin of
the exports than the destination of the export products. I will test this conjecture
econometrically.
In the second step of my analysis, I use a stratified Cox Proportional Hazard model (1972)
and various techniques for robustness checks to answer my research questions. I estimate the
hazard rate function for each region using semi‐parametric techniques stratified at product‐
country pair level, and the results show that African export relationship hazard rates are
associated with higher varieties of trade costs, i.e., trade costs have significant effects on the
probability of an African export relationship surviving. They also show that export costs, time to
export and cost of doing business are significantly more important in explaining the short
survival spans of African exports than policy shocks, financial depth and institutional frictions.
More importantly the results tend to suggest that regional trade cooperation tends to enhance
Africa’s export relationship survival. Both in my benchmark results which contains the factors
that may influence export survival i.e., including geographical and policy variables and the
regional integration dummies for Monetary Union (MU), Common Market (CM), Customs Union
(CU) and Free Trade Area (FTA) and others. The regional trade cooperation dummies are
statistically and economically significant and non‐negligibly enhance the chances of survival of
Africa’s export relationships. These results are robust when I interact the regional grouping
5

dummies with cost to export, time to export and cost of doing business. Thus the results tend to
suggest that deeper trade cooperation is essential for Africa’s export survival.
Besides, regional trade cooperation, policy variables such as exchange rate
misalignment, financial depth and institutional quality do increase hazard rates for Africa’s
export survival. I also confirm Brenton et al’s (2009) finding that export experience (unlike
Brenton & and his coauthors, I use product‐specific experience and market specific experience
as a measure of export experience), that is exporting a same product to new markets or new
products to existing markets strongly enhance the chances of an African export relationship.
Thus, I have provided product‐country level evidence of factors that inhibit Africa’s export
survival. In particular, I have shown that deeper regional trade cooperation have non‐negligibly
increased the probability that African export relationships last longer.
In terms of policy importance, the findings suggest a need to compliment policy focus on
promoting export growth by encouraging sustainable export relationships of existing and new
exports i.e., policy focus should also be put on sustaining export relationships once established.
The rest of the paper is organized in 6 parts as follows. The next part reviews related
literature. In part 3, I present the prima facie evidence from the data and discuss data
characteristics, define the variables that I will have to deal with in the econometric estimation of
the determinants of hazard rates for African export relationships. In part 4, I present the
empirical strategy, and part 5 presents results and discussions. The final part of the paper
contains my concluding remarks.
2. Literature Theoretical literature on determinants of trade duration is still nascent. There is limited
theoretical research on the determinants of how long an export relationship is supposed to last
once it’s established i.e., determinants of exit from the export market or import market.
Vernon (1966) and Grossman and Helpman (1991) studied the patterns of specialization and
attribute them to the life cycle of a product, the diffusion of technology or differences in factor
accumulation but none of these factors explain the dynamics of the survival of a typical trade
relationship (i.e., export survival).
6

Baldwin and Krugman (1989) theoretically explain the persistence effects of large
exchange rate shock on trade flows, in which large exchange rate fluctuations lead to entry or
exit decisions that are not reversed when the currency is returned to its previous level. In a
larger sense these authors demonstrate the effects of exchange rate shocks on the persistence
of trade.
Baldwin (1988) shows that if market‐entry costs are sunk, exchange rate shocks can
alter domestic market structure and thereby cause hysteresis of trade. Baldwin (1990)`s model
on hysteresis of trade shows that in presence of market entry costs, exchange rate
overvaluation leads to additional entry by foreign firms and these firms do not exit when the
exchange rate shock passes. The central idea of this work on hysteresis of trade and exchange
rate pass through effects trade (i.e., Baldwin and Krugman, 1989; Baldwin, 1988; Baldwin, 1990,
Dixit, 1989) is the existence of sunk market entry costs, in which firms tend to serve an export
market relatively over long periods of time. For instance in Baldwin and Krugman 1989, Baldwin
1988 and 1990, large exchange rate shocks lead to entry of new firms in the market which then
do not exit after the shocks have passed because firms have invested in marketing, research and
development, reputation and distribution networks. So these models emphasize the entry fixed
costs as key determinants of firms export status and persistence.
The next strand of literature on export status is empirical at firm level on export
performance and has focused on the role of market entry costs in export decision. The leading
authors here inter alia: Tybout and James (1997), Bernard and Jensen (1999, 2004) show that
presence of sunk costs plays a significant role in a firm’s decision to export. Tybout and James
(1997) use a dynamic probit model to investigate the exit and entry decision patterns of
Columbian manufacturing firms from 1981 to 1989. The authors control for firms past export
status and show that exporting history matters.
Similarly Bernard and Jensen (2004), using a slightly different linear probability empirical
framework with a panel of U.S. manufacturing plants, find statistically and economically
significant effects of entry costs, and that being an exporter today increases the probability of
being an exporter tomorrow by 36 percent. This literature provides evidence on the importance
7

of entry fixed costs for export status, and therefore influencing the duration of trading
relationships.
Recent work by Irarrazabal and Opromolla (2009) has provided additional insights on the
theory of entry and exit into export markets. They introduce uncertainty and sunk costs in a
trade model with heterogeneous firms and where firm productivity evolves stochastically. They
define a band of inaction like in Dixit (1989) and test using simulations how a cut in fixed costs
and sunk costs could affect exporters and non‐exporters status. Their results show that a
reduction in a per‐period fixed costs increases persistence in export status for exporters but
decreases persistence for non‐exporters. The central idea of this result is that as fixed costs
decline, the probability that an exporter would be able to cover his fixed costs increases. On the
other hand a reduction in sunk costs decreases the persistence in export status of exporters and
non‐exporters. They compare survival rates resulting from their simulations for both scenarios
and observe that survival rates are larger when there sunk costs.
Rauch and Watson (2003) provide some of the theoretical insights on the dynamics of
trade duration between developed countries (DCs) buyers and less developing countries` (LDCs)
suppliers. They show that search costs do matter in initiation and sustainance of trade
relationships. In their model, the authors demonstrate that the persistence of a trade
relationship will depend on the initial trade value (i.e., the model predicts that the length of a
trade relationship is positively correlated with the initial amount of the transaction and that the
propensity to start low value transactions increases with the cost of search and decreases with
the probability that the current or new supplier will be able to fulfill the large order successfully
after training (with reliability)), an initial learning and confidence building i.e., stages of
matching a buyer and a supplier, a buyer investing in the supplier to deepen their relationship. If
confidence and trust are not established, the relationship fails and the buyer re‐searches for
another supplier. The three steps are buyer‐supplier matching, relationship deepening and (or)
rematch. These authors note that buyers start with small purchases because of uncertainty
surrounding the new supplier. Orders increase with deepening relationship between the buyer
and supplier with respect to meet expectations on part of the buyer. In the African sample the
initial transactions are generally very low.
8

Thus in search models, trade is a connection between buyers and sellers and is a search
process, and because of its costliness, trade is terminated at some point in time, firms stop
searching for alternative partners even if they have not yet found the perfect partner. Rauch
(2001) emphasizes, networks help to reduce such partner‐related search costs because network
members have thorough knowledge of each others characteristics and more importantly, “their
members are engaged in repeated exchange that helps sustain cooperation.
Among the empirical papers on the dynamics of trade duration include: Besedes and
Prusa (2006a, b), Besedes (2008), they test some of the main predictions of the Rauch‐Watson
model using data on imports from the United States at the Tariff Schedule 8‐digit level and at
the HS 10 digit level. Other empirical findings include work by Nitsch (2009), Fugazza and
Molina (2009), and Besedes and Blyde (2010), all document similar stylized facts on trade
duration. The authors document evidence that trade duration is indeed very dynamic and brief
across the board. They also find that among other things, it’s affected by country characteristics,
product characteristics, trade costs as well as market characteristics and structure (see Nitsch,
2009 for instance).
Besedes and Prusa (2006a, b) show that duration of trade relationships face higher
hazard rates for homogenous goods than for differentiated goods6. Their results also suggest
that short trading relationships tend to be those transactions of low‐value. Besedes (2008)
focuses on the persistence of short and small valued relationships by applying Rauch‐Watson
search model. In this framework, the buyers, i.e., importers start with small purchases because
of the uncertainty surrounding the supplier. Orders increase with increasing confidence and
certainty of the supplier’s ability to fulfill the buyer’s expectations. Shepherd (2007) offers
insights for alternative explanation for low export values at the beginning of the export activity
that could be related to traditional product cycle i.e., discovery, rapid growth, maturation and
decline. The author argues that most of the new products do not get into the maturation stage.
Fugazza and Molina (2009) follow empirical strategy adopted in Besedes and Prusa
(2006b), to explore the patterns and determinants of trade duration for a set of 96 countries
over the period 1995‐2005. They analyze the sequence of export status at the HS 6‐digit level
6 In Besedes and Prusa (2006a) authors find that non‐OECD countries have relatively shorter durations of trade than OECD countries.
9

using the semi‐parametric Cox survival model controlling for factors possibly influencing export
survival. Their results indicate that trading relationships involving developed and emerging
economies face lower hazard rates than those involving developing countries. Second, their
results suggest that the relationship between trade duration and the type of product portrays
the degree of competition/information patterns characterizing traded products. Third, export
size appears to be positively correlated with exports survival. Finally, export fixed costs do affect
trade duration, but their effect decreases with time and with export size.
Nitsch (2009) finds that survival probabilities are affected by exporter characteristics,
product type and market structure. He shows that duration of exporting a product to Germany
is longer for products obtained from countries that are economically large and geographically
close to Germany. Brenton et al., (2010) perform analysis of a cross country bilateral export
flows at product level. They found export activity to be perilous especially for low income
countries. Their empirical results confirm the significance of a range of product‐ as well as
country specific factors in determining the survival of new export flows. They also find that
experience for exporting the same product to other markets or different products to the same
market is found to strongly increase the chance of export survival. They show selected African
countries to have relatively higher hazard rates than other regions of the world. In this research,
I do investigate the underlying reasons for these higher hazard rates.
Cadot et al., (2011) use transactions level export data for four African countries (Malawi,
Mali, Senegal and Tanzania) and they document high degree of experimentation at the
extensive margin associated with low survival rates. They find that survival probabilities rise
with the number of firms exporting the same product to the same destination from the same
country, pointing towards the existence of cross‐firm synergies. They also find that more
diversified firms in terms of products, but even more in terms of markets, are more likely to be
successful and survive beyond the first year. This is the only empirical paper that has dealt with
the sample on Africa.
This paper has three key empirical differences with the cited papers. First, overall, none
of the cited papers focuses specifically on the underlying factors for low survival rates for
African countries. Specifically, it will be the central duty of this paper to explore what factors are
10
responsible for Africa’s high hazard rates of its exports at product‐country level for the period
1995‐2009. Secondly, this paper studies the effects of intra‐regional trade cooperation on
African exports. Thirdly, the paper is largely concerned with the extension of the cited papers
above to an African sample at product‐country pair level, and studies the underlying factors for
high hazard rates for export relationships.
3. Data
3.1 Summary Statistics
I summarize the data I have assembled here (see appendix A for a detailed description). I
use product level data (HS 6 digit level bilateral trade flows) from 53 African countries, for the
period 1995‐20097.The core dataset used consists of approximately 15.35 million observations
of annual bilateral trade flows between 12 intra‐African region groupings and the rest of the
world (ROW). The unit of analysis is product‐country pair; I investigate bilateral export
relationships for 53 African countries to 191 markets for a period of 1995 to 2009. These data
are obtained from BACI CEPII international trade database, based on COMTRADE8. BACI
provides harmonized bilateral trade data. They use different harmonization procedures (see
Gaulier et al 2007), it reconciles mirror flows, thus providing a more complete and refined
geographical coverage of trade flows at product level. This dataset therefore represents a
relatively more accurate representation of bilateral trade matrix for African countries
appropriate for this research on export relationship duration for African countries. The data is
summarized in table 2.6. Figure 2.1 illustrates the histogram of trade values (USD: 1000) for the
whole sample.
7 I do urge caution in interpretation of the current results on two major accounts with respect to this level disaggregation. First, possible minor changes in product specification leading to product reclassification of an otherwise identical product, there by resulting in a recorded failure of an export relationship. Second, African countries suffer severe statistical capacity problems to report data to UN COMTRADE, so I anticipate underreporting, missing trade etc to affect my analysis and results. 8 BACI international trade database has been painstakingly constructed to provide near accurate representation of bilateral trade flows for countries reporting trade to the UN COMTRADE database (see Gaulier et al 2007 for details of BACI data construction).
11

3.2 Description and definition of variables
Infrastructure related trade cost variables
Cost to export: this variable is obtained from World Bank Development Indicators (WDI,
2011). It is measured in USD per container9. All the fees associated with completing the
procedures to export. These include costs for documents, administrative fees for customs
clearance, and technical control, customs broker fees, terminal handling charges and inland
transport. Only official costs are recorded (see WDI, 2011).
Time to export: this variable is the number of days taken to export a container. It is
recorded in calendar days (source WDI, 2011). The procedure for its calculation starts from the
moment it is initiated and runs until exporting activity is completed10. The waiting time between
procedures‐for example, during unloading of the cargo is included in the measure.
Cost of doing business: cost to register a business is normalized by presenting it as a
percentage of gross national income (GNI) per capita (Source WDI, 2011).
Procedures to export: Documents to export are all documents required per shipment by
government ministries, customs authorities, port and container terminals, health and technical
control agencies, and banks to export goods. Documents renewed annually and not requiring
renewal per shipment is excluded (source WDI, 2011). This variable is taken as a measure of
bureaucratic frictions in the export activity.
Regional trade cooperation variables
Monetary Union: this is a dummy that takes the value of 1 if the African trading partners
are in a monetary union cooperation and zero for the rest of the partners11. I expect this
variable to carry a negative sign in all the specifications (source: various sources).
9 The cost measures the fees levied on a 20‐foot container in U.S. dollars. The cost measure does not include tariffs or trade taxes. Several assumptions are made for the business surveyed: has 60 or more employees; is located in the country’s most populous city; is a private, limited liability company. It does not operate within an export processing zone or an industrial estate with special export or import privileges; is domestically owned with no foreign ownership; exports more than 10% of its sales. Assumptions about the traded goods 10 It is assumed that neither exporter nor the importer wastes time and that each commits to completing each remaining procedure without delay. Procedures that can be completed in parallel are measures as simultaneous. 11 I have 4 monetary unions, comprising of more than a 3rd of African countries.
12

Common Market: This is a dummy that takes the value of 1 if the African trading
partners are in a Common Market and zero for the rest of the trading partners. I expect this
variable to carry a negative sign in all specifications implying being in a common market
promotes export relationship survival (Source: WTO RTA database).
Customs Union: This is a dummy that takes the value of 1 if the African trading partners
are in a Customs Union and Zero for the rest of the trading partners. I expect this variable to
carry a negative sign in all specifications implying being in a common market promotes export
relationship survival (Source: WTO RTA database).
Preferential Trade Area: This is a dummy that takes the value of 1 if the African trading
partners are in a preferential trade area or negotiating a preferential trade area and zero for the
rest of the trading partners. I expect this variable to carry a negative sign in all specifications
implying being in a preferential trade area reduces the hazard rates of African exports (Source:
WTO RTA database).
Export experience: I define export experience to be both product and market specific
i.e., a variable indicating whether the exporting country already exports the given product to
other countries within the regional grouping and market experience signifies whether an export
has previously exported to this market. I expect a negative coefficient on this variable as export
experience enhances Africa’s export survival (source: Own calculation).
Rule of Law and bureaucratic friction variables
Institutions: I use various measures of institutional quality of the exporting African
country. The most robust one is the polity IV index provided by the polity IV project on political
regimes and characteristics. The “Polity Score” captures the regime authority spectrum on a 21‐
point scale ranging from ‐10 (hereditary monarchy) to +10 (consolidated democracy) for a
typical country. It’s a measure of regime type and in my specifications I use it to proxy the
quality of the bureaucracy to support entrepreneurial activity, the rule of law and business
contract enforcement. It’s hard to predict the influence of this variable on the survival rates of
African exports. But autocratic regimes should signify inefficient bureaucracies that do not
support business activities and therefore bad institutions increase the hazard rates of African
export relationships.
13

Conflict: This is a variable taking a value of 1 if a country has suffered a conflict or is in a
conflict during the sample period or zero otherwise. Like regime type, I expect the coefficient on
the hazard rate to be positive, implying an increase in the chances of an export relationship
failing for countries are at war or their trading partners.
Policy Shock Variables
Exchange rate misalignment: the variable is a measure of deviation from the trend of
the bilateral nominal exchange rate, I use an absolute value of deviation from the trend for the
15 years (Source WDI, 2011 and own calculations). The effects of this variable on the hazard
rates of African exports can go either way.
Financial depth: Domestic credit to private sector refers to financial resources provided
to the private sector, such as through loans, purchases of nonequity securities, and trade credits
and other accounts receivable, that establish a claim for repayment (WDI, 2011). For some
countries these claims include credit to public enterprises. I use private credit to GDP ratio as
the measure of financial depth (Source: WDI, 2011).
Foreign direct investment: foreign direct investment are the net inflows of investment
to acquire a lasting management interest (10 percent or more of voting stock) in an enterprise
operating in the African exporting economy. It is the sum of equity capital, reinvestment of
earnings, other long‐term capital, and short‐term capital as shown in the balances of payments
(source WDI, 2011). Data are in current U.S. dollars.
Market access variables
Unilateral preferences: This is a variable that takes a value of 1 if an exporter in the
sample is eligible for unilateral preference within the QUAD12, (the traditional major trading
partners) with other African countries, and zero otherwise. I expect a negative coefficient on
this variable as unilateral preferences are likely to reduce fixed costs of foreign market entry
and therefore, make it easy for enterprise to start export activity within the preference granting
countries (Source: UN TRAINS).
12 The QUAD is a group of Africa’s traditional trading partners. This is comprised of Canada, European Union, Japan and the United States. They have traditionally offered unilateral trade preferences, to many African beneficiary countries.
14

Product level tariff: I use effectively applied product level tariff, the data is taken from
UN TRAINS database. The database includes the ad valorem, specific, and estimated ad valorem
equivalent tariffs based on the most‐favored nation (MFN) status. In addition, I carefully take
into account product and country eligibility to these unilateral trade preferences and the
applicable tariffs under these programs. If a country/good qualifies for more than one
preference program, I use the minimum tariff of all qualifying programs.
3.3 Stylized Facts
I use semi‐parametric methods to explore the data i.e., using simple graphical
representation and tabulation to examine the differences in hazard rates (or survival rates)
across the exporting regions (and compare intra‐African and inter‐Africa rest of the world‐ROW
hazard rates) for each of product‐country pairs and across sectors for HS 2 digit level data. I
define a trade episode or a spell as the number of years in which a typical product‐country pair
export relationship lasts. That is, for each product‐country pair, I define a spell’s start and
ending dates (by year) for a specific export relationship. I have censored spells that begin 1995
(left censored) and those that end in 2009 as right censored13. Notice that a spell is allowed to
start and end at different years within the sample period i.e., a relationship can begin 1995 and
end in 1997 between Uganda and China and another one between Uganda exporting coffee to
Canada begin 1998 and end in 2004. Spells for specific export relationship beginning
independently at anytime and end anytime during the sample period14. Table 2.5 provides an
overview of the distribution of export flows for the African sample 1995‐2009. In column 1 the
table shows the evolution of export relationships for the full sample of African countries from
1995 to 2009. Column 2 shows the annual products exported per year. Column 3 shows the
evolution of the average number of products exported to each partner. Column 4 shows the
number of partners per year and column 5 shows the evolution of the average number of
destinations for each product. Overall, the picture painted here is a relatively significant
13 I can not be absolutely certain that spells that begin 1995 are as a result of a start of new export relationships or continuing from the previous years before 1995. Similarly I cannot be certain that spells that end in 2009 are as a result of end of sample or truly it’s because the export relationship is ending at this particular time. 14 In my sample, the maximum length of a spell is 14 years. An event when African exporter fails to exports to its partner is called a “failure”.
15

improvement in the export performance over the years in the sample period. For instance the
export relationships more than doubled over the years and so is the average number of
products exported to each partner.
Figure 2.1 presents a histogram of positive trade observations by size of groups. The
figure shows that almost 80 percent of trade flows in the African trade matrix are “zero flows”.
This implies that only 20 percent of Africa’s potential bilateral trade relationships are positive
trade flows. Also all Africa trade relationships fall below the mark of USD 100,000 at product
level. In addition, to this, I present more descriptive statistics of Africa’s export relationships
pair wise. Table 2.1 presents descriptive statistics for each regional grouping. That is number of
spells per region at the beginning of the sample period 1995 and at end of sample period in
2009. It also shows the annual death rate per region. Notice that overall across the regions, the
birth and deaths are very high but there are observable differences. For the full sample i.e.,
exports to the rest of the world and itself (un‐split sample), the deaths are relatively smaller
than the average death rates across the regions. Secondly, the death rates for countries in
monetary unions are relatively lower than those of Common market which are in turn lower
than those of the Customs Union and those of countries in a preferential trade arrangement (or
negotiating a trade arrangement). The regional grouping with highest annual death rate is CEN‐
SEAD with 60 annual death rates and the least is SACU with 25 percent. Third, the birth rates
also take similar patterns according to the stage of regional integration.
Figure 2.2 shows the survival probability over time for intra‐Africa exports and African
exports to the rest of the world (ROW). In figure 2.2, intra‐Africa export relationships have
slightly higher survival rates than the export relationships to the rest of the world (ROW).
Similarly, figures 2.3 and 2.4 shows coastal and landlocked countries; and survival rates by
regional grouping respectively. The graphs show that the probability of death of export
relationship is high in the first years of the export relationship discovery but decreases over
time. Figure 2.3 shows the survival rates for maritime and landlocked exporters, it shows that
maritime exporters have relatively higher survival rates than the landlocked exporters.
16

Table 2.2 shows the annual survival rates for each of the above regions. Once again,
whole sample survival rates lie between the average of the intra‐African trade sample (36
percent of initiated export relationship survives for their first year) and ROW sample survival
rate is 34 percent of export relationships destined outside Africa survive their first year of
initiation. Within intra‐African region, again SACU (a quasi‐monetary union, but a complete
customs union since 1993) has the highest survival rate at 49 percent, followed by SADC and
then UMA. Overall, deeply integrated regions have higher survival rates than those negotiating
or not yet in any regional negotiating initiatives. I do test these stylized facts econometrically in
the next part of the paper. Notice also that there is no survival completely to the end of the
sample period. Relative to other regions studied so far, only 2 percent of African export
relationships survive to the 10th year.
Table 2.3 shows the survival rates based on countries at the coast and for landlocked
countries. Survival rates for coastal countries (36 percent) are higher than for landlocked
countries (25 percent). This implies only 25 percent of African landlocked countries truly survive
their first year of an export relationship and by the end of 10th year of exports it’s only 1 percent
of these relationships that still exist compared to 2 percent for the maritime members. This
confirms stylized factors presented in literature on the challenges of landlocked developing
countries (see Faye et al. (2004) for the analysis of challenges of landlocked countries). It’s clear
that maritime countries also have higher survival rates than their landlocked counterparts
throughout the period of analysis. This once again is suggestive of inland domestic costs to
export, time to export and customs procedures which are more significant for countries that are
landlocked. Notice that the survivor function for deeper regional initiatives lies above those less
integrated regions and also that maritime countries survivor functions lies above that of
landlocked countries.
Table 2.4 shows survival rates by product sectors. Within sectors (HS 2 digit bilateral
trade flows) there are observable differences regarding the survival rates. Take for instance,
traditional African exports; sector 4 chapters 16 to 24 (which consist of prepared foodstuffs,
beverages and spirits, tobacco) and sector 5 which is HS chapter 25‐27 (which consist of mineral
products, including mineral fuels etc) have the highest survival rates. Within this group are
17

traditional commodity exports like coffee, tea, cocoa, crude petroleum products ‐ the major
traditional African commodity exports. So it’s not a surprise that these sectors have the highest
survival rates of 42 and 40 percent of all export relationships in these sectors survive at the end
of their first year. They are followed by vegetable products (sector 2‐HS chapter 6‐14). Within
sector 2 the survival rate is 41 percent in the first year of an established export relationship. For
the rest of the sectors as indicated in the table, the average survival rate for each sector is
around 35 percent. Notice also the average survival rate across the sectors for the fifth year of
African export relationship is only 8 percent. That is only 8 percent of export relationship
established at the beginning of the sample survival until their fifth year. At this stage mineral
products have the highest survival rate of 11 percent.
As shown in these tables I can infer 4 stylized facts about this data: First, results seem to
suggest that African exports last longer when Africa exports to itself than to other region;
second, there is considerable heterogeneity within African regional groupings depending on the
depth of integration as well as within sectors for African exports and African traditional exports
have long survival rates compared to other sectors; third; regional trade cooperation seem to
affect survival rates of African exports i.e., enhance export survival. That is export relationships
die faster in the less integrated regions, landlocked countries and they survive longest in the
maritime countries and more advanced integrated regions; and fourth, I can infer that
infrastructure related export costs appear to be one of the most important determinant of
Africa’s export relationships, other papers have found a significant influence of trade costs
proxied by geographical distance on incidence of non‐zero trade (see Baldwin and Harrigan
(2007) for U.S. product level analysis.
Other authors (see inter alia Besedes and Prusa (2006a), Nitsch (2009) Fuggaza and
Molina (2009)) have reported that short duration of trade may be explained by the small value
of many trade transactions. Since in a large portion of my sample the transactions are very small
(90% of African trade transactions are less than USD 5000), I have conducted the analysis with
all the transactions included otherwise my observations would be drastically reduced. Overall, I
can afford to ignore the size of the individual transactions since my major focus of analysis is on
18

whether regional integration really enhances the survival of the volume of trade as well as the
trade duration.
This prima facie evidence would point to infrastructure related trade costs, inland
procedures as major culprits in restricting Africa’s export survival rates. I now turn to test
empirically these stylized facts with an econometric specification below based on Stratified Cox
Proportional Hazard model (1972). My conjecture here is that the differences in the average
survival rates across the regions as destinations of Africa’s exports might not be solely the result
of specialization patterns but other factors might be playing a role as well. This is explored
further using econometric tools in the next part of the paper.
4. Empirical Framework/Methodology
My empirical analysis is motivated by the desire to understand the underlying reasons
for high hazard rates for African countries exports and whether regional trade cooperation has
an effect on these factors consequently enhancing Africa’s export relationship survival.
4.1 Empirical specification
The prima facie evidence in the previous part of the paper pointed to a number of
peculiarities in the data for my sample. In this part, I concentrate on investigating the factors
that may be restricting or enhancing export relationships survival within each region and also
endeavor to explain the differences in survival rates within the region. I am particularly
interested in the differences in each of the stages of regional integration as well as the
differences between landlocked countries and their maritime counterparts.
Following Besedes and Prusa (2006a, 2006b) Blyde (2008) and Nitsch (2009), I use the
continuous time proportional hazard (PH) model proposed by Cox (1972) for my benchmark
results and preferred specification. I estimate a simple stratified Cox proportional hazard model
version in which I exclude left censored observations. I stratify the sample by product‐country
pair, or HS 2 product categories or by regional grouping (in which case I report the results
accordingly). This implies that I allow the baseline hazards to vary across the geographical
19
region, the product categories, sectors, or chapters of products in the analysis i.e., I allow a
separate baseline hazard function for each of the product group.
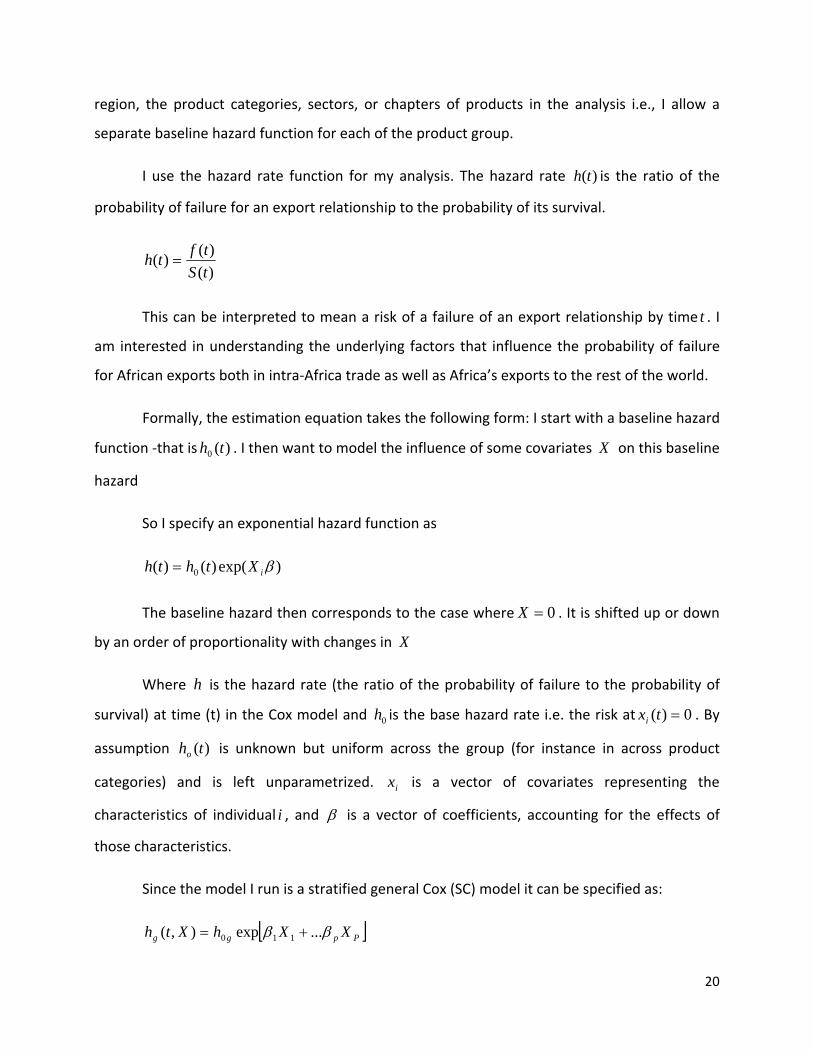
I use the hazard rate function for my analysis. The hazard rate is the ratio of the
probability of failure for an export relationship to the probability of its survival.
)(th
)()()(
tStfth =
This can be interpreted to mean a risk of a failure of an export relationship by time . I
am interested in understanding the underlying factors that influence the probability of failure
for African exports both in intra‐Africa trade as well as Africa’s exports to the rest of the world.
t
Formally, the estimation equation takes the following form: I start with a baseline hazard
function ‐that is . I then want to model the influence of some covariates )(0 th X on this baseline
hazard
So I specify an exponential hazard function as
)exp()()( 0 βiXthth =
The baseline hazard then corresponds to the case where 0=X . It is shifted up or down
by an order of proportionality with changes in X
Where is the hazard rate (the ratio of the probability of failure to the probability of
survival) at time (t) in the Cox model and is the base hazard rate i.e. the risk at
h
0h 0)( =txi . By
assumption is unknown but uniform across the group (for instance in across product
categories) and is left unparametrized. is a vector of covariates representing the
characteristics of individual i , and
)(toh
ix
β is a vector of coefficients, accounting for the effects of
those characteristics.
Since the model I run is a stratified general Cox (SC) model it can be specified as:
[ ]Ppgg XXhXth ββ ...exp),( 110 +=
20

Where strata defined from *,....,1 kg = *Z
Notice that there are same coefficients for each of stratum .,......1 pββ but the baseline
hazard functions may be different for each stratum. directly included in the
model, but
)(0 th g pXX ,.....,1
*Z appear only through the different baseline hazard functions.
I also run an alternative interaction model:
⎥⎦
⎤⎢⎣
⎡+++= ∑∑
−
= =
1*
1 1
***1
*10 ....)()(
k
j
p
ijiijpgg ZXXthth βββ where the do not involve 15
*β g
I estimate the above as a log‐linear version of this specification.
I group my sample into four major regional groups and therefore use 4 sets of variables
to conduct my analysis i.e., first, I have a variable as a Monetary Union. It is a dummy taking a
value of 1 if a country belongs to a monetary union /single currency of some sort and zero
otherwise. I also include a variable to reflect the number of years this country `s membership in
the monetary union. This is also the case for the other 3 variables based on these regional
groupings. That is (ii) Common Market, a dummy taking value of 1 if a country is in a Common
Market and Zero otherwise; (iii) Customs Union; and the (iv) a preferential trade area (PTA). I
examine the interplay of potential factors that restrict Africa’s export survival, estimating a
stratified Cox proportional hazard model (like other authors in this case that include Nitsch,
2009 on the duration of Germany imports etc)
5. Results
Table 2.7 presents my benchmark results with robust standard errors by clustering at
country‐pair product level. In column 1, I present the key variables of interest alone. I begin
with 4 variables that may help describe the regional trade cooperation in enhancing export
relationship survival apart from the determinants of international trade flows, and apart from
features of the product‐country pair. All the coefficients on the regional trade cooperation
15 .
21

variables carry the expected signs and are statistically and economically significant except the
coefficient on the preferential trade areas (PTA). This would imply that regional trade
cooperation reduces the probability of failure for African exports. The Common market and
Customs union results are more significant and robust throughout various specifications.
The coefficient on Preferential Trade Agreements (PTA) carries a counterintuitive sign. It
implies that Africa’s preferential trade agreements enhance rather that reduce hazard rates in
Africa. Similarly, Brenton et al (2010) in their specifications in a different framework from mine
included a dummy for PTA to indicate a presence of a preferential trade agreement between
the exporter and the importer, and they found the coefficient on the PTA increased the hazard
rates significantly. They attribute this counterintuitive result to their possible definition of their
relevant variable that is the fact that the reference year for the dummy is the starting year of
the trade relationship. This implied that trade flows, which are subject to a trade agreement,
only after they are initiated, is recorded as not being subject to the agreement. They also argue
that this surprising finding could be that some agreements actually facilitate bilateral trade
whereas others merely exist on paper. In this research, my conjecture is that this result is a
result of the fact that most of the PTAs are currently under negotiations and therefore the
protocols are not yet fully into force and therefore the benefits of the PTAs are not yet fully
harnessed by the members i.e., the business networking effects, information frictions still exist
and border bureaucracies are not harmonized yet. Ideally, one would like to distinguish the
effects of each form of regional trade cooperation on export survival, evidence of which I
present here.
Considering other covariates, column 9 presents estimation results when the full set of
covariates is included:
Does rule of law and conflict affect export survival in Africa? In all my specifications,
the measure for institutions is statistically significant and carries the expected sign. An
indication that regime type as a proxy of quality and strength of institutions that support
entrepreneurial activities does matter for the hazard rates of African export relationships. Since
most of African countries have poor institutions and contract enforceability may not be up to
22

standard to guarantee predictable standards on the suppliers’ side. Ranjan and Lee (2007) work
shows that the poor contract enforceability affects the volume of trade in their framework, the
degree of contract enforceability in the country is proxied by an index of the rule of law
provided by the international country risk guide (ICRG) database. In the current study, I use an
alternative measure of the quality of institutions as the polity index provided by the polity IV
project on political regimes and characteristics.
In the case of conflict, the conflict dummy unambiguously hurts the probability of export
survival for African export relationships. The coefficient on this variable carries an expected sign,
and is significant in all specifications. Overall, conflict and regime type seem to increase the
hazard rates of African export relationships. The evidence strongly supports the prediction that
hazard rates are higher for countries in conflict or have experienced conflict during the sample
period.
Does financial sector development affect the survival of African export relationship
survival? My null hypothesis is that sustaining an export relationship is not correlated with
various characteristics of the financial systems within African countries exporting to their
trading partners. I test the hypothesis using private credit to GDP ratio as the measure of
financial depth in African exporting countries. The coefficient on this variable indicates a
positive effect on the hazard rates of African exports. Signifying that financial
underdevelopment in Africa could have a crucial role in restricting Africa’s export relationship
survival. However, the sign of the coefficient is not stable. In some specifications, it carries a
negative sign. Intuitively, underdeveloped financial system in which firms are unable to access
financial resources for export activity or entrepreneurial start ups especially in times of financial
stress can force exporters out of business thus terminating export relationships untimely.
Additionally, financial depth is bound to influence entrepreneurial activity through the cost of
financial services. That is regional interest rates‐regional cost of borrowing are the highest in
Africa relative to other regions which imposes extra costs on business and are likely to
determine if the firm persist in the export market or exits untimely.
23

Do unilateral trade preferences affect Africa’s export survival? I include a measure of
unilateral preferences based on exporter eligibility and product eligibility for any of these
preferences granted by the QUAD countries16. These are the traditional major African trading
partners. The coefficient of the unilateral trade preference dummy is negative but statistically
insignificant. This would imply that unilateral trade preferences do not matter for the hazard
rates for African products. Previous studies have shown that unilateral trade preferences have
anti‐diversification effects (see Gamberoni (2007), Debaere and Mostashari (2010).
Does export experience matter for export survival? My null hypothesis is that export
experience has no effect on the survival of export relationship in Africa. I included both the
product specific experience, i.e., a variable indicating whether the exporting country already
exports the given product to other countries within the regional group and market specific
experience. They are both significant and carry a negative sign indicating that export experience
for a specific product or market experience do matter and reduce hazard rates significantly for
African export relationships. Qualitatively similar results have been obtained by other authors
inter alia Brenton et al. (2009), Faguzza and Molina (2009).
The coefficient of 0.97 and 0.336 on product and market experience respectively
signifies that the regional nature of exporting experience matters. The coefficient on the export
product experience can be interpreted to mean that 100 percent increase in total exports of
products within the same HS 6 digit product category implies a 97 percentage points in reduced
hazard rates.
This would also signify existence of learning effects specific to the product and to the
region of destination of these exports that help exporters to sustain their export relationships.
This results means that export experience whether product or market specific significantly
reduces the chances of an export relationship failure, that is reduces the hazard rates for
exports. Even when I have used a different measure of export experience from the other
16 The QUAD is a group of Africa’s traditional trading partners. This is comprised of Canada, European Union, Japan and United States. They have traditional offered unilateral trade preferences, to many African beneficiary countries.
24

authors, the results are qualitatively similar, that export experience of a given product and to a
given market is essential in sustaining the survival of an export relationship.
Overall this result on export experience complements the finding of Roberts and Tybout
(1997), Brenton et al (2010) who show that experience matters for the initiation of trade flows
as well. This result particularly makes a strong case for sustainance of export growth in the
African region and intra‐regional trade cooperation. It suggests that African exporters should
not look too far when trying to expand exports of their products to additional markets and that
existing exporters can assist new exporters through network effects i.e., sharing of regional
knowledge and information of a network of suppliers and buyers.
Do policy shocks influence Africa’s export relationship survival? I use exchange rate
misalignment to test the effects of policy biases on Africa export relationship survival. The
result show varied effects of exchange rate misalignment on the hazard rates for African export
relationships. The variable is a measure of deviation from the trend of the bilateral nominal
exchange rate. I use an absolute value from the deviation of the trend for the 15 years. The
results on this variable are not robust, in some specifications; it seems to have a negative effect
on hazard rates while in some specifications it seems to have positive effects. The estimated
coefficient on exchange rate misalignment suggests that a foreign depreciation (i.e., an increase
in the foreign country’s real exchange rate) is associated with higher hazard rates, a result that
is possible due to non‐linearity in the effect of exchange rate volatility on survival.
Normally, a decrease in the exporter’s exchange rate during the life time of the export
relationship implies that the importer’s purchasing power in the exporter’s currency rises. This
implies that naturally, the exporter’s products become more attractive and export relationships
here are likely to be sustained. Intuitively, the length of an export relationship is likely to be
affected by the movements of relative prices. That is an overvalued currency, as most of African
countries currencies were artificially overvalued in the 90s, for example reduces the
competitiveness of exports for the exporters in the African country. Conversely, an undervalued
currency reduces the purchasing power of Africa’s trading partners.
25

Foreign Direct Investment (FDI): Contrary to existing literature (see interlia, Kemme et
al (2009), on foreign direct investments export performance and export of differentiated
products, the coefficient on FDI is positive and statistically and economically significant,
indicating that FDI in Africa has a positive effect on hazard rates for African exports. . Strangely,
this result emerges even when the stylized facts show that actually African traditional exports
have higher survival rates than the differentiated products (see survival rates by HS 2), in other
words this results goes contrary to theory and the stylized facts from the data on African
sample.
Preferred specifications
Does infrastructure related trade costs restrict Africa’s export relationship survival? In
this part of the analysis, I present the important part of this empirical analysis: Testing the main
hypothesis on impact of infrastructure related trade costs and the regional trade cooperation on
export relationship survival for African exports. Recall there are 4 varieties of infrastructure
related trade frictions indentified in my dataset: (i) costs to export; (ii) cost of doing business;
(iii) time to export; and (iv) procedures to export.
In table 2.7a to table 2.7d, I present a variety of specifications taking into account the
effects of infrastructure and bureaucratic related trade frictional costs (costs to export, cost of
doing business, time to export and procedures to export) at country pair level. I also present
results from specifications in which I interact the key covariates of interest to provide evidence
for changes within the regional cooperation initiatives. The goal here is to understand whether
regional trade cooperation influences these infrastructure and bureaucratic related trade
frictions in the region, ease the search process i.e., if the factors affecting the survival of export
relationship act differently within the regional integration initiatives. These specifications come
at the cost of small sample size since for some variables only a limited number of observations
are available. In each table, in column I present level effects of the covariate of interest,
together with the regional grouping covariates and see their effects on the hazard rates for
African exports. In column 2 and 3 of each table I present the interaction effects and report the
changes in the sign and magnitudes of the coefficients.
26

Table 2.7a shows the level and interaction effects of the cost of doing business in Africa
on the hazard rates of African export relationships. In column 1 are the level effects of cost of
doing business. The sign on cost of doing business coefficient is positive and significant implying
that the cost of doing business increases the hazard rates for African exports.
Are the effects of cost of doing business declining with regional cooperation?
In column 2 I present the interaction effects of regional groupings and cost of doing
business. If regional trade cooperation reduces cost of doing business in Africa, I would expect a
reduction on its effect on hazard rates for African exports. Indeed except the coefficients on the
common market and preferential trade area dummies which are statistically significant and
positive implying no change in the negative effects of the cost of doing business and thus reduce
the hazard rates of African exports, the rest of the results of the variables indicate what is
expected. This result suggests that bad business environment create bias against exports of
existing products and initiation of new exports and may undermine opportunities for export
growth. Considering this result, regional trade cooperation seems to increase the survival rates
for African exports. That is the interacted variables for Monetary Union and Customs Union
dummies are negatively related to the hazard rates for African exports. This implies that
regional integration initiatives may play a role in reducing costs of doing business and enhancing
the chances of survival for each of the export relationship in the region.
A rather persistent unexpected result is the sign and magnitude of the coefficient on the
PTA. It implies PTAs are not helpful in raising survival rates of the export relationship survivals.
In terms of the changes in the significance, magnitude of these interaction factors,
demonstrates the significance of regional trade cooperation in enhancing sustaining of export
survival. All tests of significance of interaction effects were significant at least at 5 percent level.
I also interact the institutions variable with the stage of integration variable. For this
interaction, the results are mixed. With exception of the monetary union dummy, it seems that
regional trade cooperation reverses the effects of weak institutions across the board as the
impact of the interaction effects is negatively correlated to the hazard rates of African export
relationships.
27

Are the effects of costs to export declining with regional cooperation?
In table 2.7b I repeat the similar specifications above but with the variable of interest
now being the cost to export. In column 1 result are for level effects and the rest of the columns
are interaction effects. Notice the coefficient on costs to export is highly statistically significant
and carries expected sign. Costs to export do increase hazard rates for African exports. Its effect
does not change when I interact with regional variables. Except for the customs union dummy
whose coefficient is negative and statistically significant. This would imply the interaction
effects of this variable enhance the survival of Africa’s export relationships. It’s possible that
costs to export are driven by the pervasiveness of poor infrastructure in Africa implying that
even if countries regionally integrate, the exporting firms will still be experiencing the same
hurdles within the region thus the observed interaction effects. Similarly, here I also interact the
institutions and stage of integration variables. Now it’s only the customs union and PTA
coefficients that are statistically significant and carry the expected signs.
Intuitively, I expect costs to export to be a key driver of high hazard rates of African
export relationships. Costs to export is crucially based on distance, distance increases export
costs in a number of dimensions; it increases the time and the costs of delivering a product to
the market. The longer the distance covered by the shipment, the higher the cost of delivering a
product to the market. The longer the distance covered by the shipment, the higher the chances
of potential interruptions or delays which might prompt cancellations of subsequent orders.
Direct measures of transport costs would have been more appropriate but unfortunately data
on African exporters shipping costs and freight costs is very scanty and patchy (very few
countries report detailed information on shipping costs as part of their trade data statistics).
Are the effects of time to export declining with regional cooperation?
In table 2.7c, I present results for the level effects of time to export and interaction
effects for regional integration. I notice similar and robust results as in above. The level effects
of time to export increase hazard rates for African export relationship, implying that the long
the exports are delayed at the border or in transit, the higher the chances are that some of the
export relationships will be terminated (similar findings in different framework have been found
28
by Freund and Rocha (2010) that transit delays is a key reason for failure of African export
expansion at the extensive margin). The interaction effects work well for the monetary union,
Customs Union and PTA (i.e., in these regional groupings, imply there is a reduction in transit
delays) and therefore a reduction in the hazard rates for African export relationship. For
example numerous roadblocks, customs checks and procedures, unwarranted differing national
product standards and product regulations show up as export costs in terms of export delays
may act to contain export diversification by limiting regional trade flows and the experience in
exporting to the respective trading partner.
I test the significance of the interaction effects and the interaction effects for time to
export and regional trade cooperation were significantly different from zero at least at 5
percent level of significance.
Are the effects of procedures to export declining with regional cooperation?
In table 2.7d, I present results for the level effects and interaction effects for procedures
to export‐number of documents to export. In column 1, the level effects of procedures to export
shows that it increases the hazard rates and therefore reduces survival rates of African exports.
The result shows the importance of procedures to export, it’s highly significant and carries an
expected sign i.e., high the number of procedures to export (number of documentation
required) the high the chances of an export relationship failing (increases hazard rates for
African exports). Being in a monetary union and customs union does reverse these negative
effects on probability of export survival but not so in the common market and preferential trade
area.
Are the effects of financial underdevelopment declining with regional cooperation?
Table 2.7e presents the results for the level effects and interaction effects for financial
development. In column 1, the level effects of financial development indicate a hazard
enhancing effect. The coefficient carries a positive sign and is statistically significant. However,
the interaction effects produce significantly mixed results. For instance the coefficients on
monetary union and common market interaction would signify an increased hazard rate for
African export relationships. This means that regional trade cooperation in Africa has not
29

created the necessary financial networks to support export activities and entrepreneurial
participation in the region. In the case of the customs union, an interaction between the
measure of financial development and regional cooperation yields a negative and significant
coefficient, signifying that being in the customs union increases a chance of a pooled financial
resources and reduction in information frictions regarding funding for export activities and
therefore increasing the chance of African export survival.
Are the effects of market access declining with regional cooperation?
Product level tariff: I do include effectively applied tariff at product level to control for
changes in market access at regional level as well as exports to the rest of the world. Table 2.7f
presents the results of effects of market access in a regional cooperation context. The results on
product level tariff show that reduction in tariffs indeed increases the chance of an export
relationship survival. This result also confirms the significant role played by deeper regional
trade cooperation, since deeper cooperation involves tariff cutting amongst the members of a
regional grouping. For a given product, an increase in the tariff should lead some foreign firms
to exit since higher tariffs raise the costs of servicing the market. Though the data on tariffs at
product level is quite poor and including this variable significantly reduces my sample. But these
results are indicative of the importance of removal of intra‐regional trade frictions and attaining
of a regional market in expanding African exports. Additionally, trade agreements restrict
competition from countries outside the agreement thereby making the partnership more stable.
In terms of other conventional determinants of bilateral trade flows, I do control for
market size using sum of GDP for the trading partners in an export relationship. For economic
similarity, I use absolute difference in GDP per capita to control for tastes and preferences
among trading partners. The results are as those reported in conventional determinants of
bilateral trade flows in the gravity model, i.e., the larger the sum of GDP of trading partners, and
indicator of market size, the more likelihood for an export relationship will survive longer
(similar results have been obtained by Nitsch(2009)). That is hazard rates for African exports are
largely reduced when the sum of the GDP of trading partners is very large signifying a large
market size. Earlier research (see inter alia Baldwin and Harrigan (2007), Blyde (2008) and
30

Brenton et al.(2010) have reported the importance of economic size of both trading partners in
contributing to facilitating disappearance of zero flows in their trade matrix as well as their
trade flow survival.
Similarly, I find economic similarity between trading partners (measured by the absolute
difference in GDP per capita) to significantly reduce the hazard rates of African export
relationships. The measure of economic dissimilarity is between the partner countries is the
differences GDP of the exporter and importer countries. It’s also statistically significant, carries
the expected sign in all specifications.
Therefore, I have argued and tested for three effects of regional trade cooperation in
Africa on export duration: First, reduction in infrastructure related trade frictional costs
effects‐mainly transmitted through reduction in border procedures, harmonization of
documentation, product standards and elimination of border tariffs etc; secondly, reduction in
bureaucratic and information frictions and other trade cost frictions, because of regional
networks (regional trade cooperation initiatives act as platforms for networking among business
community i.e., buyer seller networks become reinforced and increasing certainty between
importers and suppliers (see Allen (2011)) for analysis on the role of information frictions in
international trade); the third effect of regional integration and duration of exports is through
the learning effects‐ since evidence shows that export experience is important for export
survival, its possible that hazard rates diminish with time because of learning by exporting and
since most of African countries have similar product standards.
Using various techniques, I have presented results that show that hazard rates are
indeed affected by infrastructure related regional trade frictions, financial depth, and
institutional quality and bureaucratic frictions as well as policy biases against exports in Africa. I
have presented results of the regional trade cooperation specific effects on Africa’s export
relationship survival. I have also presented evidence that shows that regional trade cooperation
initiatives significantly increase the probability of Africa’s export relationship survival. I included
the standard determinants of bilateral trade volumes within my preferred specification as well.
31

These empirical results could reflect one of the following stylized facts i.e., regional trade
cooperation could have one of the three specific effects: first, an increase in the depth of
regional trade cooperation could signify a reduction in search costs, reduction in border delays,
and reduction in shipping costs effectively making it profitable to export within the region and
thus sustaining product‐country pair export relationship once it has been established; the
second effect could result in also reduction of search costs via the network effects of the
regional trade cooperation in which case a deeper regional trade cooperation signifies, the
buyer seller partnership is easy to make since, trade frictions, information frictions are
significantly reduced; and the third effect could also result in landlocked countries having easy
access to port facilities through their regional neighbors which also would significantly reduce
the transitional delays and hence likely enhance the survival probabilities of perishable exports
from landlocked countries.
The empirical evidence emerging from this analysis supports the hypothesis that
regional trade cooperation is important in reducing Africa’s export relationship hazard rates,
through reducing infrastructure related trade costs that affect exports between partner states.
Also possibly through reducing border procedures, increasing information flow, harmonization
of standards etc. improves regional institutions and trade facilitation in the region. Alternatively,
regional trade cooperation contributes to the factors that facilitate the search process for
instance business networks, buyer seller networks etc that correspond with a higher probability
of export relationship survival. These changes consequently increase profitability for the
exporters and therefore sustaining export relationships once initiated.
Overall, the results strongly confirm my expectations. Hazard rates significantly are
negatively related with the stage of economic trade cooperation of each of the regional
grouping. In terms of Africa’s traditional exports and traditional markets, export relationships
have lower hazard rates when the market size is large, this would imply that larger African
trading partners tend to serve as African markets for a longer period of time (similar case for
importers of traditional African exports, for instance, cocoa, tea, coffee, petroleum products
tend to serve as African markets for a long time).
32

5.1 Robustness checks
In the first check, I use data based on only new products/ i.e., involves focusing on new
export activities only. The results are presented in table 2.8a columns 1‐7. The first column
presents results of the key variables of regional trade cooperation under investigation. In the
second, column I present the benchmark results as in main specification. In the third column to
seventh column, I control for a variety of infrastructure related trade frictions and bureaucratic
frictions. For space purposes, I do not report the results for specifications involving interaction
effects. But the results are qualitatively similar to those of my preferred specification. The
estimates indicate no change qualitatively, providing the needed proof that the findings are
robust.
The coefficients on the cost of doing business, time to export, costs to export and
procedures to exports covariates suggest that, the higher these costs are the strong the effect
on the hazard rates, or the likelihood of an African export relationship to fail, that is the larger
the negative effect on the survival of an export relationship.
In the second check, I use data adjusted for one year gaps (following Blyde (2008)), this time
focusing on interaction effects. The results are presented in table 2.8b columns 1‐4. The
estimates indicate one year gap adjustments do not alter the results in any significant way. The
empirical results remain qualitatively unchanged.
My third test involves using a linear probability model to test the significance of my
covariates on determining the length of a typical spell for a typical product‐country pair export
relationship. The results are shown in table 2.8c column 1‐4. The results are very much in line
with those of my preferred specification. In sum, it turns out that the estimation results are
remarkably robust across different samples and specifications. As in previous specifications, the
time interaction term indicates that the effect of fixed export costs diminishes over time and
this is consistent across regressions.
33

6. Conclusion
Why do African export relationships fail? Answering this question has been one of the
primary goals of this paper. Using simple semi‐parametric techniques and a Cox proportional
hazard model (1972), I show that the length of Africa’s export relationship is restricted by
infrastructure related trade costs, negative policy shocks, informational and bureaucratic
frictions as well as institutional weakness. I also find evidence that financial depth, poor
institutions; conflicts do increase hazard rates for African exports. I also control for market size,
geographical distance, and economic similarity and find that these factors do play an important
role in Africa’s export survival. I find that African export trade relationships have a very short
life, with the median duration of exporting a product just 1 year and average length of 2.08
years. In doing so, I contribute to the empirical literature on understanding the underlying
factors that explain high failure rates for African export relationships.
Does regional trade cooperation enhance Africa’s export relationship survival? I also
study the effects of regional trade cooperation on the duration of African export relationships. I
show empirical evidence that intra‐regional trade cooperation in Africa reduces significantly the
effects of a number of these trade frictions, implying that deeper and increased trade
cooperation would sustain Africa’s export expansion.
This evidence suggests that export costs, cost of doing business, border and transit
delays have non‐negligible effects on the hazard rates of African exports. However, their effects
are reversed when I interact these variables with the regional integration variables.
Furthermore, I find interaction effects significantly reversing the negative effects of the
variables. Furthermore, evidence suggests that regional trade cooperation is helping to reduce
the effects of these factors i.e., more integration leading to less border delays and transit
delays, and lower cost of doing business is reducing the hazard rates for African exports.
34

Does export experience help enhance the chances of export relationship survival in
Africa?
The results also show significant effects of export experience on increasing the chances
of African export relationship survival. Using a measure of product specific experience in a given
market, the results show that export experience increases the chances of African export survival
in a given market. Combined with the result on regional trade cooperation effects, this would
imply learning effects for African countries. It implies that African countries do learn to export to
their regional neighbors and also extend the length of their export relationships through these
learning effects. Within sectors, Africa’s traditional exports display the longest durations, but
also intra‐African exports have relatively longer durations than exports to the rest of the world.
What implications does the paper have for public policy in Africa? There are 4 lessons
that can be drawn from this study: first, the associated low hazard rates for deeper regional
trade cooperation initiatives suggests an opportunity for public policy interventions that are
aimed at further deepening the regional trade cooperation in Africa. The strategy that seeks to
increase and sustain export growth rates should involve enhancement of regional trade
cooperation efforts since the results show that regional trade cooperation depth is a non‐
negligible driver of Africa’s export survival. For instance, I found that monetary unions have a
relative higher survival rates and bigger effects on hazard rates than that of the Common
Market, which in turn had bigger effects than those of the Customs Union, and which in turn
have bigger effects than those of a Free Trade Area.
Secondly, since African exports are characterized by small firms and small values of exports,
regional integration provides an opportunity of encouraging progression from export of small
consignments to bigger consignments and larger firms thereby increasing the impact on export
growth (See Rauch (2010) on the effects of institutional changes favoring smaller rather than
larger firms, he argues such changes are likely to have relatively small impact on export growth).
Thirdly, it means that policy focusing only on entry into exporting will miss a fundamental
aspect of the dynamics of exporting (see Brenton et al (2010)). A strategy that seeks to increase
35

and sustain export growth rates should address constraints to export survival both at the
extensive and intensive margin of African trade.
Fourth, this paper provides the first step in examining the role of intra‐Africa trade
cooperation in Africa’s export expansion. A fruitful direction of future research would be to
examine how further regional integration affects trade survival in contexts such as
manufacturing, where products are differentiated and firms have regional market power.
36

References:
1. Allen, T. (2011) “Information Frictions in Trade” Job Market Paper, Yale University
2. Baldwin R. (1988), “Hysteresis in Import Prices: The Beachhead Effect” The American Economic Review, Vol. 78, Issue 4, pp.773‐785.
3. …………... (1990) “Hysteresis in Trade” Empirical Economics, Vol. 15(2), pp 127‐42
4. Baldwin, R. and J. Harrigan (2008) “ Zeros, Quality, and Space: Trade Theory and Trade Evidence” American Economic Journal: Microeconomics 3 (May 2011): 60–88
5. Baldwin, R. & P. Krugman (1989) “Persistent Trade Effects of Large Exchange Rate Shocks” Quarterly Journal Economics 104(4), 635‐654.
6. Bernard, A.B., Jensen, J.B., (2004), “Why Some Firms Export” Review of Economics and Statistics 86 (2), 561‐569
7. Bernard, A.B., Jensen, J.B., (2004), “Exceptional Exporter Performance: Cause, Effect or both?” Journal of International Economics 47, 1‐25
8. Besedes, T. and T. Prusa (2006a), “Product Differentiation and Duration of U.S. Import Trade,” Journal of International Economics, 70, pp. 339‐358
9. Besedes, T. and T. Prusa (2006b), “Ins, Outs and the Duration of Trade”, Canadian Journal of economics, Vol. 39, No. 1 pp. 266‐295
10. Besedes, T. and T. Prusa (2007), “The Role of Extensive and Intensive Margins and Export Growth,” NBER Working paper # 13628
11. Besedes, T. (2008) “A Search Cost Perspective on Duration of Trade” Review of international Economics 16(5), 835‐849
12. Blyde, J. (2008), “What Drives Export Survival? An Analysis of Export Duration in Latin America,” mimeo, Inter‐American Development Bank.
13. Brenton, Paul, Christian Saborowksi, and Erik Von Uexkull (2010), “What explains the Low Survival Rate of Developing Country Export Flows?” World Bank Econ Review (2010) 24(3) PP 474‐499.
14. Cadot, Olivier, Leonardo Iacovone, Ferdinand Rauch, and Denise Pierola (2011), “Success and Failure of African Exporters,” Policy Research Paper # 5657, The World Bank
15. Cleves, M.A., Gould, W.W. and Gutierrez, R.G. (2004), “An Introduction to Survival Analysis Using Stata” Stata Press, College Station, Texas
16. Cox, D. (1972), “Regression Models and Life Tables,” Journal of the Royal Statistical Society, Series B, 34, pp.187‐220.
17. Debaere, P. and S. Mostashari (2010) “Do tariffs for the extensive margin of international trade? an empirical analysis” Journal of International Economics, Vol. 81 pp 163–169
37

18. Dixit, A. (1989) “Hysteresis, Import Penetration, and Exchange Rate Pass‐Through” The Quarterly Journal of Economics, Vol. 104, No.2 pp.205‐228.
19. Faye et al. (2004) “The Challenge Facing Landlocked Developing Countries” Journal of Human Development Vol. 5 #1.
20. Fugazza and Molina (2009), “On the Determinants of Exports Survival” UNCTAD Policy Issues in International Trade and Commodities Study Series No.46
21. Freund C., and Rocha, N. (2010) “What Constrains Africa’s Exports” Policy Research Working Paper # 5184.‐
22. Gamberoni, E. (2007) “Do Unilateral Trade Preferences help Export Diversification?” an Investigation of the Impact of the European Unilateral Trade Preferences on Intensive and Extensive Margin of Trade” IHEID working paper 17‐2007.
23. Gaulier, G. and Zignago, S (2007). “BACI: International Trade Database at the Product‐level” CEPII, WP NO 2010‐23
24. Grossman, G. and Helpma, E. (1991) Innovation and Growth in the Global Economy. Cambridge, MA: MIT Press.
25. Irarrazabal A.A., and Opromolla, L. D. (2009) “A Theory of Entry and Exit into Exports Markets” University of Oslo, Banco de Portugal.
26. Isham, J, L. Pritchett, M. Woolcock and G. Busby (2002), “The Varieties of the Rentier Experience: How Natural Resource Endowments and Social Institutions Affect Economic Growth,” mimeo
27. Kemme, M.D, D. Mukherjee, and A. Nikolsko‐Rzhevskyy (2009) “Foreign Direct Investment and
Export Performance in Emerging Economies: Evidence from Indian IT firms” mimeo, University of Memphis.
28. Melitz, M. (2003), “The Impact of Trade on Intra‐Industry Reallocations and Aggregate Industry
Productivity,” Econometrica, 71(6): 1695‐1725.
29. Nitch, V. (2009), “Die another Day: Duration in German Import Trade,” Review of World Economy 145:133‐154
30. Ranjan, Priya and Jae Young Lee, 2007, “Contract Enforcement and International Trade,” 31. Economics and Politics, 19(2), July, 191‐218
32. Rauch, J. E. (1999) “Networks versus Markets in International Trade” Journal of International Economics, 48(1), 7‐35
33. Rauch, J.E. (2001) “Business and Social Networks in International Trade” Journal of Economic Literature, 39(4), 1177‐1203.
34. Rauch, J. E. and Watson, J. (2003) "Starting small in an unfamiliar environment,” international Journal of Industrial Organisation, vol. 21(7), pp.1021‐1042.
38

35. Rauch, J (2010), “Development through synergistic reform,” Journal of Development Economics, Vol. 93, Issue 2. pp 153‐161
36. SACHS, J. and A. WARNER (2001), “The Curse of Natural Resources,” European Economic Review, Vol. 45, No. 4‐6, pp. 827‐838.
37. Shepherd (2007) “Product Standards, Harmonization, and Trade: Evidence from the Extensive
Margin”. Policy Research Working Paper Series 4390. The World Bank
38. Stirbat L., R. Record and K. Nghardsaysone (2011) “Exporting from a Small Landlocked Economy: An Assessment of Firm‐Product‐Destination Survival Rates in the Lao PDR”. Policy Research Paper # 5695. The World Bank
39. Tybout R. and M. Roberts (1997) "The Decision to Export in Colombia: An Empirical Model of 40. Entry with Sunk Costs" The American Economic Review, Vol. 87, No. 4, pp. 545‐564
41. Vernon, R. (1966) “International Investment and International trade in the Product Cycle” Quarterly Journal of Economics, 80(2), 190‐207.
42. Wood, A. and J. Mayer (1998), “Africa’s Export Structure in a Comparative Perspective”, Study No. 4,
43. World Development Indicators (2011). The World Bank, Washington D.C. 44. UNCTAD (2001) African Development in a Comparative perspective, UNCTAD, Geneva, published
in Cambridge journal of Economics, Vol. 5, No. 3, pp. 369‐394.
39

Tables and Figures:
Figure 2.1: Histogram for the export values (USD: 1000) for African countries
Notes: This histogram shows the distribution of positive trade observations. Almost 80 percent of potential trade flows at product level in Africa’s trade matrix are “Zero flows”. Trade is reported in 1000S of USD. This implies that only 20 percent of Africa’s bilateral trade relationships are positive trade flows. Also all Africa trade relationships fall below the mark of USD: 100,000 at product level.
40

Figure 2.2 Export Survivals by Region (destination of exports)
Notes: This graph shows that intra‐Africa export relationships have slightly higher survival probabilities than African exports to the rest of the world.
41

Figure 2.3 Export Survivals by Exporting Region
Notes: This figure shows export survival probabilities within intra‐African regional trade cooperation. Southern Africa Customs (SACU) the world’s oldest customs union which is composed of Botswana, Namibia, Lesotho, South Africa and Swaziland has the highest survival probabilities of its exports. It also shows that less integrated regions like COMESA and ECCAS have low survival probabilities of their exports. In general, regions in deeper regional trade cooperation have relatively higher survival rates of their exports than less integrated regional grouping. This figure can be read simultaneously with table 2.2.
42
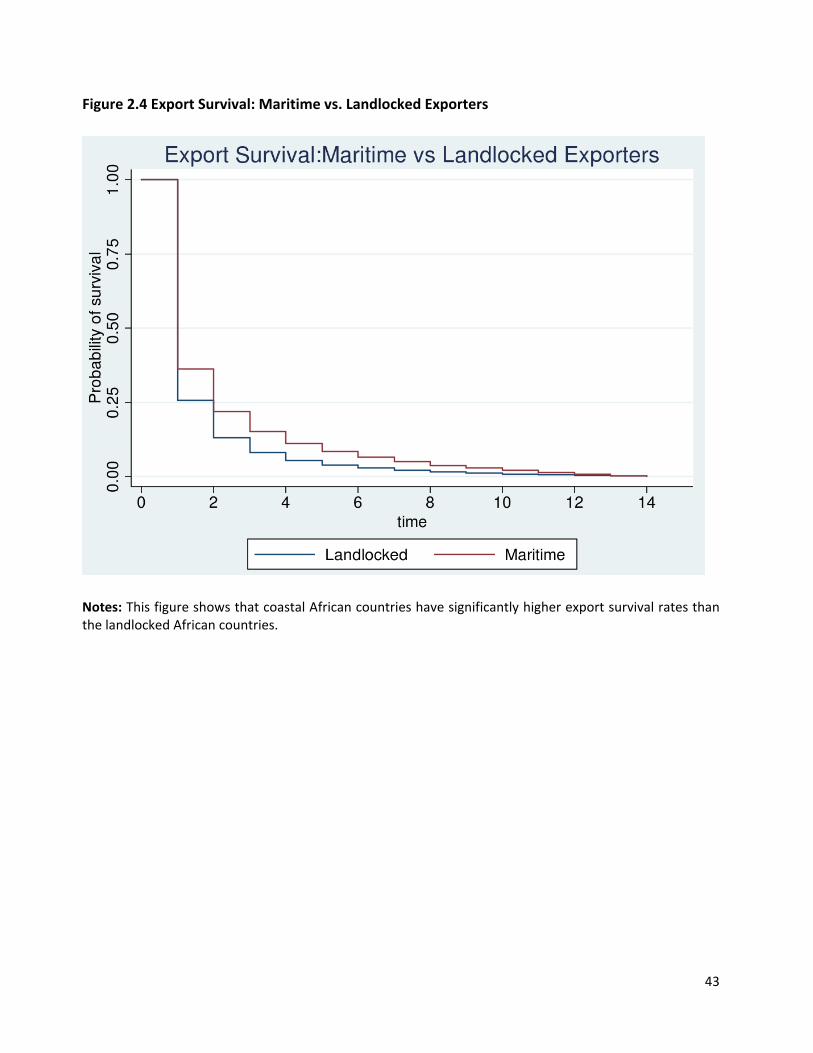
Figure 2.4 Export Survival: Maritime vs. Landlocked Exporters
Notes: This figure shows that coastal African countries have significantly higher export survival rates than the landlocked African countries.
43
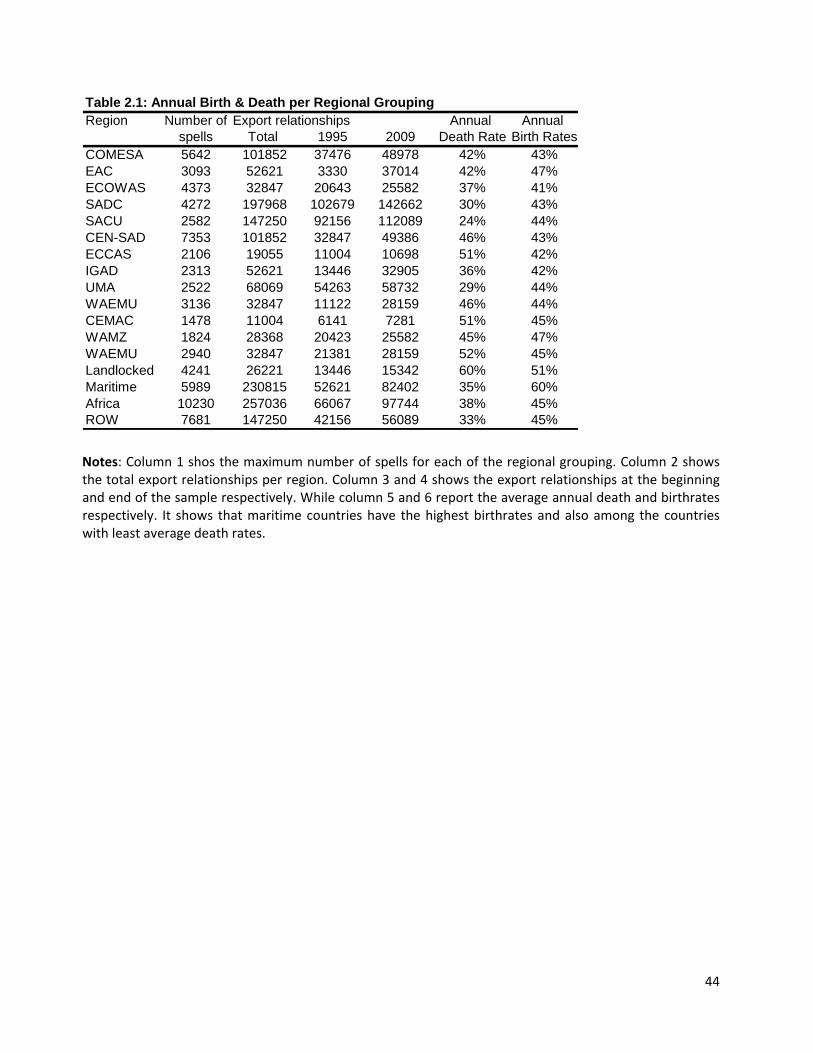
Region Number of Annual Annual spells Total 1995 2009 Death Rate Birth Rates
COMESA 5642 101852 37476 48978 42% 43%EAC 3093 52621 3330 37014 42% 47%ECOWAS 4373 32847 20643 25582 37% 41%SADC 4272 197968 102679 142662 30% 43%SACU 2582 147250 92156 112089 24% 44%CEN-SAD 7353 101852 32847 49386 46% 43%ECCAS 2106 19055 11004 10698 51% 42%IGAD 2313 52621 13446 32905 36% 42%UMA 2522 68069 54263 58732 29% 44%WAEMU 3136 32847 11122 28159 46% 44%CEMAC 1478 11004 6141 7281 51% 45%WAMZ 1824 28368 20423 25582 45% 47%WAEMU 2940 32847 21381 28159 52% 45%Landlocked 4241 26221 13446 15342 60% 51%Maritime 5989 230815 52621 82402 35% 60%Africa 10230 257036 66067 97744 38% 45%ROW 7681 147250 42156 56089 33% 45%
Export relationships Table 2.1: Annual Birth & Death per Regional Grouping
Notes: Column 1 shos the maximum number of spells for each of the regional grouping. Column 2 shows the total export relationships per region. Column 3 and 4 shows the export relationships at the beginning and end of the sample respectively. While column 5 and 6 report the average annual death and birthrates respectively. It shows that maritime countries have the highest birthrates and also among the countries with least average death rates.
44

Year SACU SADC UMA EAC COMESA CEN-SAD IGAD WAEMU ECOWAS WAMZ ECCAS CEMAC Africa ROW1 49% 41% 37% 32% 32% 32% 30% 28% 26% 24% 20% 20% 36% 34%2 32% 25% 23% 18% 18% 19% 17% 15% 14% 12% 10% 9% 22% 20%3 24% 18% 16% 12% 12% 13% 11% 10% 9% 8% 6% 6% 15% 14%4 18% 14% 12% 8% 8% 9% 8% 7% 6% 5% 3% 4% 11% 10%5 14% 10% 9% 6% 6% 7% 6% 5% 4% 4% 2% 3% 8% 8%6 11% 8% 7% 5% 5% 5% 5% 4% 3% 3% 2% 2% 6% 6%7 9% 6% 5% 4% 3% 4% 3% 3% 2% 2% 1% 2% 5% 4%8 7% 5% 4% 3% 3% 3% 3% 2% 2% 1% 1% 1% 4% 3%9 5% 3% 3% 2% 2% 2% 2% 1% 1% 1% 1% 1% 3% 2%
10 4% 2% 2% 2% 1% 2% 2% 1% 1% 1% 1% 1% 2% 2%11 2% 2% 1% 2% 1% 1% 2% 1% 1% 1% 0% 0% 1% 1%12 1% 1% 1% 1% 1% 1% 1% 0% 0% 0% 0% 0% 1% 1%13 0% 0% 0% 1% 0% 0% 1% 0% 0% 0% 0% 0% 0% 0%14 0% 0% 0% 0% 0% 0% 0% 0% 0% 0% 0% 0% 0% 0%15 0% 0% 0% 0% 0% 0% 0% 0% 0% 0% 0% 0% 0% 0%
Table 2.2 Survival Rates for Regional Groupings
Notes: This table shows the survival rates for each regional grouping. It is clearly seen that Southern Africa Customs Union (SACU), Southern Africa Development Community (SADC) the Arab Maghreb Union and Intra‐Africa export relationships have the highest export survival rates.
Year Maritime Landlocked1 36% 25%2 22% 13%3 15% 8%4 11% 5%5 9% 4%6 7% 3%7 5% 2%8 4% 2%9 3% 1%10 2% 1%11 1% 0%12 1% 0%13 0% 0%14 0% 0%15 0% 0%
Table 2.3 Survival Rates for Maritime and Landlocked countries
45
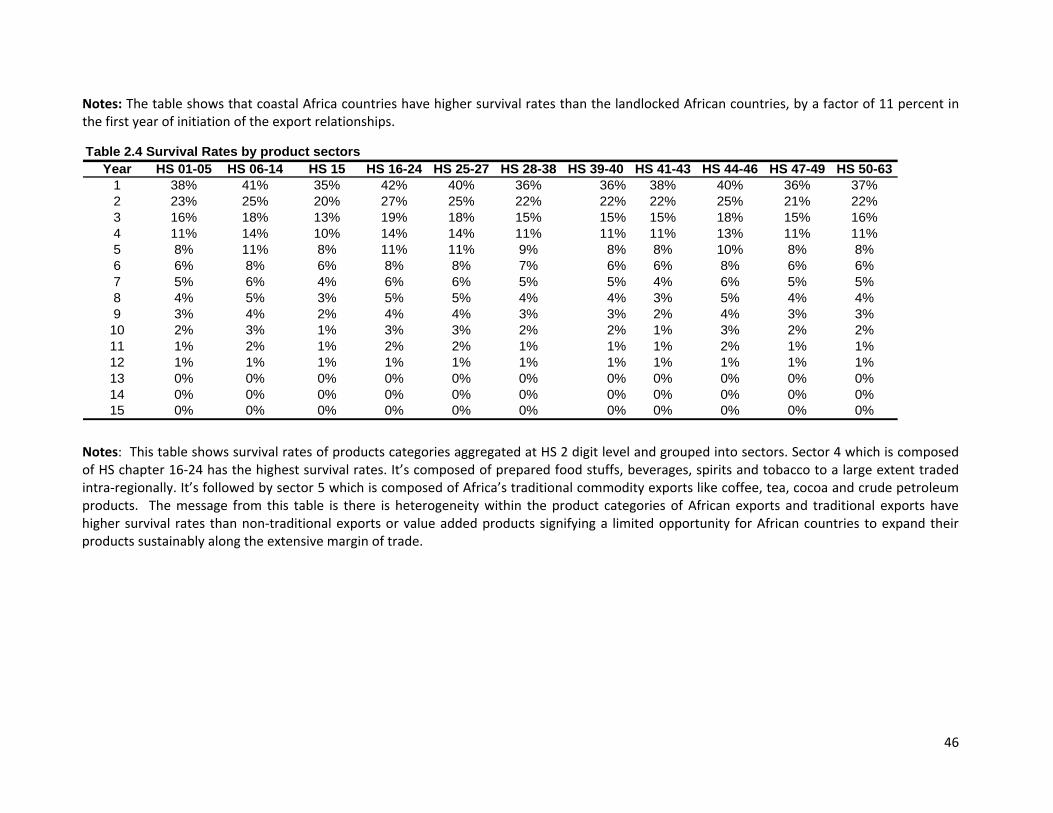
Notes: The table shows that coastal Africa countries have higher survival rates than the landlocked African countries, by a factor of 11 percent in the first year of initiation of the export relationships.
Year HS 01-05 HS 06-14 HS 15 HS 16-24 HS 25-27 HS 28-38 HS 39-40 HS 41-43 HS 44-46 HS 47-49 HS 50-631 38% 41% 35% 42% 40% 36% 36% 38% 40% 36% 37%2 23% 25% 20% 27% 25% 22% 22% 22% 25% 21% 22%3 16% 18% 13% 19% 18% 15% 15% 15% 18% 15% 16%4 11% 14% 10% 14% 14% 11% 11% 11% 13% 11% 11%5 8% 11% 8% 11% 11% 9% 8% 8% 10% 8% 8%6 6% 8% 6% 8% 8% 7% 6% 6% 8% 6% 6%7 5% 6% 4% 6% 6% 5% 5% 4% 6% 5% 5%8 4% 5% 3% 5% 5% 4% 4% 3% 5% 4% 4%9 3% 4% 2% 4% 4% 3% 3% 2% 4% 3% 3%10 2% 3% 1% 3% 3% 2% 2% 1% 3% 2% 2%11 1% 2% 1% 2% 2% 1% 1% 1% 2% 1% 1%12 1% 1% 1% 1% 1% 1% 1% 1% 1% 1% 1%13 0% 0% 0% 0% 0% 0% 0% 0% 0% 0% 0%14 0% 0% 0% 0% 0% 0% 0% 0% 0% 0% 0%15 0% 0% 0% 0% 0% 0% 0% 0% 0% 0% 0%
Table 2.4 Survival Rates by product sectors
Notes: This table shows survival rates of products categories aggregated at HS 2 digit level and grouped into sectors. Sector 4 which is composed of HS chapter 16‐24 has the highest survival rates. It’s composed of prepared food stuffs, beverages, spirits and tobacco to a large extent traded intra‐regionally. It’s followed by sector 5 which is composed of Africa’s traditional commodity exports like coffee, tea, cocoa and crude petroleum products. The message from this table is there is heterogeneity within the product categories of African exports and traditional exports have higher survival rates than non‐traditional exports or value added products signifying a limited opportunity for African countries to expand their products sustainably along the extensive margin of trade.
46

Table 2.4 Survival Rates by product sectorsYear HS 64-67 HS 68-70 HS 71 HS 72-83 HS 84-85 HS 86-89 HS 90-92 HS 93 HS 94-96 HS 97
1 37% 36% 36% 35% 29% 31% 28% 29% 34% 36%2 22% 22% 20% 21% 16% 17% 15% 16% 20% 22%3 15% 15% 14% 14% 10% 12% 10% 10% 14% 15%4 11% 12% 10% 10% 7% 8% 7% 7% 10% 11%5 8% 9% 8% 8% 6% 6% 5% 6% 8% 8%6 6% 7% 6% 6% 4% 4% 4% 4% 6% 6%7 5% 5% 4% 5% 3% 3% 3% 2% 5% 5%8 4% 4% 3% 3% 2% 2% 2% 2% 4% 4%9 3% 3% 2% 3% 2% 2% 2% 1% 3% 3%10 2% 2% 2% 2% 1% 1% 1% 1% 2% 2%11 1% 1% 1% 1% 1% 1% 1% 1% 1% 1%12 1% 1% 1% 1% 0% 1% 0% 0% 1% 1%13 0% 0% 0% 0% 0% 0% 0% 0% 0% 0%14 0% 0% 0% 0% 0% 0% 0% 0% 0% 0%15 0% 0% 0% 0% 0% 0% 0% 0% 0% 0%
47

Number of Average Number of Average number of trade Total products exported to Total destination markets for
Year relationships each partner each product1995 99245 3238 1103 90 311996 113337 3436 1200 94 331997 135324 3748 1389 97 361998 146255 3941 1506 97 371999 155521 4086 1570 99 382000 170193 4299 1716 99 402001 175923 4369 1772 99 402002 201833 4717 2005 101 432003 230981 5028 2187 106 462004 238816 5098 2189 109 472005 253327 5188 2459 103 492006 255700 5208 2336 109 492007 266597 5213 2446 109 512008 278825 5221 2638 106 532009 247165 5036 2318 107 49
Products PartnersTable 2.5: Diversification of exports (HS 6-digit level data)
Notes: Column 1 shows the total number of trade relationships for the whole sample, column 2 shows the products exported annually, column 3 shows the average number of products exported to each partner, column 4 shows the number destination markets and column 5 reports the average number of markets each product is exported. Overall, the table shows a rise in Africa`s export expansion both on product and market margins.
Exchange Rate Financial Trade Export Customs Cost of Time to Cost to Documentation Cost of Full Sample Statistics Tariff FDI_inflows Misalignment Depth Facilitation Costs Procedures Doing Business Export Export Doing BusinessLandlocked mean 7.73 1473.10 108.63 0.10 29.94 527.07 3.26 357.58 48.67 2400.26 8.41 357.58
p50 3.00 867.97 104.91 0.07 29.79 234.33 3.31 125.90 47.00 2098.00 8.00 125.90sd 12.18 1698.53 25.10 0.05 2.15 679.12 0.39 1032.10 7.54 866.94 1.91 1032.10
min 0.00 15.84 62.60 0.03 26.00 0.00 1.94 10.10 32.00 1050.00 6.00 10.10max 630.00 7603.90 179.28 0.25 37.42 5497.00 3.89 6375.50 78.00 5497.00 14.00 6375.50
range 630.00 7588.06 116.69 0.22 11.41 5497.00 1.95 6365.40 46.00 4447.00 8.00 6365.40Maritime mean 9.76 21319.71 103.96 0.40 22.19 226.17 3.76 68.33 25.21 1150.48 7.46 68.33
p50 5.00 11649.40 100.56 0.45 22.81 88.42 3.76 20.00 26.00 1087.00 8.00 20.00sd 13.79 27829.82 24.16 0.24 3.21 314.20 0.57 150.64 9.04 438.22 1.71 150.64
min 0.00 0.00 67.53 0.00 16.79 0.00 2.60 0.00 11.00 463.00 4.00 0.00max 3000.00 117434.15 597.36 0.87 32.57 3733.00 5.10 2051.50 69.00 3733.00 14.00 2051.50
range 3000.00 117434.15 529.83 0.87 15.78 3733.00 2.50 2051.50 58.00 3270.00 10.00 2051.50
Table 2.6: Summary Statistics of Key explanatory variables
48

Notes: This table reports the summary statistics of the key explanatory variables. The table shows heterogeneity within the values of some of the explanatory variables depending on whether the country is coastal or landlocked.
(1) (2) (3) (4) (5) (6) (7) (8) (9)Dep. Var.: Hazard RateMonetary Union -0.012*** -0.005 -0.034 -0.032 -0.029 -0.032 -0.031 -0.025 -0.016*
(0.003) (0.003) (0.004) (0.004) (0.004) (0.004) (0.004) (0.004) (0.004) Common Market -0.235*** -0.248*** -0.298*** -0.300*** -0.293*** -0.273*** -0.273*** -0.276*** -0.271***
(0.005) (0.006) (0.006) (0.006) (0.006) (0.006) (0.006) (0.006) (0.006) Customs Union -0.294*** -0.339*** -0.470*** -0.470*** -0.457*** -0.459*** -0.453*** -0.441*** -0.427***
(0.012) (0.014) (0.016) (0.016) (0.016) (0.016) (0.016) (0.016) (0.016) Preferential Trade Area 0.045* 0.051*** 0.023*** 0.024*** 0.029*** 0.023*** 0.023*** 0.026*** 0.029**
(0.003) (0.004) (0.004) (0.004) (0.004) (0.004) (0.004) (0.004) (0.004) Polity index 0.002* 0.003*** 0.003*** 0.003*** 0.003*** 0.003*** 0.003*** 0.003***
(0.000) (0.000) (0.000) (0.000) (0.000) (0.000) (0.000) (0.000) Financial Depth 0.354** 0.368*** 0.484*** 0.387*** 0.391*** 0.428*** 0.363
(0.019) (0.019) (0.020) (0.020) (0.020) (0.020) (0.020) Unilateral preferences -0.067 -0.064 -0.077* -0.075** -0.074 -0.069*
(0.004) (0.004) (0.004) (0.004) (0.005) (0.005) Conflict Dummy 0.095*** 0.100*** 0.099*** 0.096*** 0.080***
(0.002) (0.002) (0.002) (0.002) (0.002) Exchange rate Misalignment 0.181*** -0.179 -0.176* 0.174*
(0.003) (0.003) (0.003) (0.003) Export Experience -0.974*** -0.928*** -0.926***
(0.004) (0.004) (0.004) Market Experience -0.330*** -0.328***
(0.001) (0.001) FDI inflows 0.093***
(0.002) Observations 9250650.000 7758811.000 7156517.000 7156517.000 7156517.000 7156517.000 7156517.000 7156517.000 7115195.000
* p<0.05 ** p<0.01
Table 2.7: Bench mark results
Notes: The dependent variable is the hazard rate. The unit of observation is the product‐country pair. A positive sign on the coefficient signifies an increase in the probability of an export relationship failure (increase in hazard rate), a negative coefficient signifies an increased probability of export relationship survival (i.e., the covariate is negatively correlated with the hazard rate and positively correlated with export relationship survival). Stars indicate level of statistical significance: *** p<0.001 **p<0.01 * p<0.05
49

50

(1) (2) (3)Dep. Var.: Hazard RateMonetary Union -0.078*** -0.326*** -0.252***
(0.007) (0.023) (0.024) Common Market -0.182*** 1.111*** 1.119***
(0.015) (0.054) (0.055) Customs Union -0.111*** 1.408*** 1.493***
(0.017) (0.134) (0.138) Preferential Trade Area -0.124*** 0.285*** 0.202***
(0.007) (0.025) (0.026) Polity index 0.009*** 0.009*** 0.012***
(0.000) (0.000) (0.000) Financial Depth 2.161*** 2.319*** 2.366***
(0.070) (0.070) (0.070) Conflict Dummy 0.075*** 0.073*** 0.073***
(0.006) (0.006) (0.006) Exchange Rate Misalignment -1.024*** -0.997*** -0.998***
(0.025) (0.025) (0.026) Export Experience -2.224*** -2.221*** -2.221***
(0.013) (0.013) (0.013) Market Experience -0.528*** -0.529*** -0.529***
(0.003) (0.003) (0.003) FDI inflows 0.093*** 0.086*** 0.089***
(0.010) (0.011) (0.011) Cost of Doing Business 0.002*** 0.029*** 0.029***
(0.005) (0.005) (0.005) MU*Cost of Doing Business -0.112*** -0.130***
(0.006) (0.006) CM*Cost of Doing Business 0.057*** 0.054***
(0.005) (0.006) CU*Cost of Doing Business -0.273*** -0.249***
(0.025) (0.026) PTA*Cost of Doing Business 0.341*** 0.296***
(0.013) (0.014) MU*Polity Index 0.017***
(0.001) CM*Polity Index -0.011***
(0.001) CU*Polity Index -0.033***
(0.003) PTA*Polity Index -0.011***
(0.002) Observations 2834223.000 2834223.000 2834223.000
* p<0.05 ** p<0.01 *** p<0.001
Table 2.7a: Level and Interaction effects of cost of doing business
Notes: column 1 indicate the level effects of cost of doing business. Column 2 the interaction effects all significant atleast 5 percent level. Column 3 indicate interaction effects including institutions. Standard errors are reported in parentheses. Stars indicate level of statistical significance: *** p<0.001 **p<0.01 * p<0.05
51

(1) (2) (3)Dep. Var.: Hazard RateMonetary Union 0.119*** -1.270*** -1.465***
(0.014) (0.222) (0.227) Common Market 0.069 5.000*** 5.396***
(0.045) (0.531) (0.538) Customs Union -0.415*** -10.382*** -22.024***
(0.065) (0.969) (1.917) Preferential Trade Area 0.419 0.524 -0.449
(0.016) (0.369) (0.402) Polity index 0.001 -0.000 -0.000
(0.001) (0.001) (0.001) Financial Depth 0.833*** -0.656*** 0.753***
(0.137) (0.137) (0.138) Conflict Dummy 0.144*** 0.185*** 0.181***
(0.029) (0.028) (0.028) Exchange rate misalignment -0.095 0.164* 0.216**
(0.073) (0.075) (0.075) Export experience -4.756*** -4.753*** -4.751***
(0.027) (0.027) (0.027) Market experience -0.729*** -0.728*** -0.727***
(0.006) (0.006) (0.006) FDI inflows 0.059* 0.071** 0.078**
(0.026) (0.026) (0.026) Costs to Export 0.129*** 0.146*** 0.149***
(0.020) (0.021) (0.021) MU* Costs to export 0.129* -0.000
(0.053) (0.058) CM*Costs to export 0.195*** 0.219***
(0.032) (0.032) CU*Costs to export -0.439*** -0.443***
(0.143) (0.302) PTA*Costs to export 0.690*** 0.728***
(0.073) (0.074) MU*Polity index 0.011**
(0.004) CM*Polity index 0.004
(0.004) CU*Polity index -0.626***
(0.044) PTA*Polity index -0.022***
(0.005) Observations 1643331.000 1643331.000 1643331.000
* p<0.05 ** p<0.01 *** p<0.001
Table 2.7b level and interaction effects of costs to export
Notes: The dependent variable is the hazard rate. Column 1 indicates the level effects of cost to export. Column 2 the interaction effects with regional cooperation, all interaction effects are significantly different from zero except for monetary union and costs to export. Standard errors are in parentheses. Stars indicate level of statistical significance: *** p<0.001 **p<0.01 * p<0.05
52

(1) (2) (3)Dep. Var.: Hazard RateMonetary Union 0.124*** -1.228*** -1.375***
(0.014) (0.130) (0.132) Common Market 0.075 4.573*** 4.911***
(0.045) (0.274) (0.278) Customs Union -0.399*** -19.617*** -20.993***
(0.065) (1.524) (1.682) Preferential Trade Area -0.430*** 0.975*** 0.873***
(0.016) (0.171) (0.185) Polity index 0.001 0.001 0.001
(0.001) (0.001) (0.001) Financial Depth 1.166*** 0.727*** 0.764***
(0.137) (0.140) (0.140) Conflict Dummy 0.130*** 0.153*** 0.149***
(0.029) (0.029) (0.029) Exchange rate misalignment 0.160* 0.341*** 0.368***
(0.073) (0.073) (0.074) Export experience -4.759*** -4.754*** -4.753***
(0.027) (0.027) (0.027) Market experience -0.726*** -0.727*** -0.727***
(0.006) (0.006) (0.006) FDI inflows 0.052* 0.069** 0.071**
(0.026) (0.026) (0.026) Time to export 0.156*** 0.235*** 0.214***
(0.023) (0.023) (0.023) MU*time to export -0.395*** -0.363***
(0.052) (0.055) CM*time to export -0.378* 0.402
(0.038) (0.038) CU*time to export -5.126*** -5.603***
(0.408) (0.451) PTA*time to export -1.536*** -1.570***
(0.089) (0.089) MU*polity index -0.005
(0.004) CM*polity index 0.013***
(0.004) CU*polity index -0.127***
(0.017) PTA*polity index -0.035***
(0.005) Observations 1643331.000 1643331.000 1643331.000
* p<0.05 ** p<0.01 *** p<0.001
Table 2.7c level and interaction effects of time to export
Notes: Column 1 reports level effects of time to export. Column 2 reports interaction effects of time to export with the stage of regional cooperation‐all effects are significant atleast 5 percent level. Standards errors are reported in parentheses.
53

(1) (2) (3)Dep. Var.: Hazard RateMonetary Union -0.106 -0.049* -0.379***
(0.014) (0.022) (0.074) Common Market 0.102* -4.213*** -4.785***
(0.046) (0.455) (0.459) Customs Union -0.343*** -0.226** 22.737***
(0.066) (0.078) (2.019) Preferential Trade Area -0.497*** -0.428*** -1.461***
(0.020) (0.025) (0.228) Polity index 0.002 0.002 0.000
(0.001) (0.001) (0.001) Financial Depth 1.034*** 0.785*** 0.789***
(0.137) (0.139) (0.139) Conflict Dummy 0.149*** 0.150*** 0.182***
(0.029) (0.029) (0.029) Exchange rate misalignment -0.123 -0.160* -0.117
(0.072) (0.072) (0.072) Export experience -4.756*** -4.753*** -4.749***
(0.027) (0.027) (0.027) Market experience -0.729*** -0.729*** -0.728***
(0.006) (0.006) (0.006) FDI inflows 0.063* 0.065* 0.086**
(0.026) (0.026) (0.026) Procedures to export 0.066*** 0.042** 0.064***
(0.014) (0.014) (0.014) MU*procedures to export -0.121***
(0.025) CM*procedures to export 0.047***
(0.010) CU*procedures to export -2.710***
(0.235) PTA*procedures to export 0.501*** 0.567***
(0.051) (0.051) MU*polity index 0.011*** 0.005 0.007
(0.002) (0.004) (0.004) CM*polity index 0.005 0.006
(0.003) (0.003) CU*polity index -0.038** -0.947***
(0.013) (0.078) PTA*polity index -0.026*** -0.025***
(0.005) (0.005) Observations 1643331.000 1643331.000 1643331.0
* p<0.05 ** p<0.01 *** p<0.001
Table 2.7d level and interaction effects of procedures to export
00
Notes:. Column 1 reports level effects of procedures to export. Column 2 interaction effects for institutions and column 3 interaction effects for procedures to export with regional cooperation. The unit of observation is an exporter‐product‐product year quadruplet. Clustered standard errors in parentheses, stars indicate statistical significance: *** p<0.001, ** p<0.01, * p<0.05
54

(1) (2) (3)Dep. Var.: Hazard RateMonetary Union -0.017*** -0.078*** -0.143***
(0.004) (0.007) (0.007) Common Market -0.269*** -0.512*** -0.517***
(0.006) (0.016) (0.018) Customs Union -0.427*** -0.266*** -0.316***
(0.016) (0.037) (0.038) Preferential Trade Area 0.028*** -0.085*** 0.005
(0.004) (0.009) (0.011) Polity index 0.003*** 0.003*** 0.005***
(0.000) (0.000) (0.000) Conflict dummy 0.081*** 0.082*** 0.083***
(0.002) (0.002) (0.002) Exchange rate misalignment -0.172* -0.171 -0.171
(0.003) (0.003) (0.003) Product experience -0.926*** -0.926*** -0.926***
(0.004) (0.004) (0.004) Market experience -0.328*** -0.328*** -0.328***
(0.001) (0.001) (0.001) FDI inflow 0.094*** 0.093*** 0.092***
(0.002) (0.002) (0.002) Financial Depth 0.350*** 0.350*** 0.375***
(0.020) (0.020) (0.020) MU*financial depth 0.141*** 0.076***
(0.011) (0.011) CM*financial depth 0.083*** 0.094***
(0.009) (0.009) CU*financial depth -0.241** -0.078*
(0.053) (0.055) PTA*financial depth 0.294*** 0.258***
(0.017) (0.017) MU*polity index -0.003***
(0.000) CM*polity index -0.010***
(0.000) CU*polity index -0.019***
(0.003) PTA*polity index 0.003***
(0.001) Observations 7115195.000 7115195.000 7115195.000
* p<0.05 ** p<0.01 *** p<0.001
Table 2.7e level and interaction effects of financial depth
Notes:. Column 1 reports level effects of financial depth. Column 2 reports interaction effects‐significant at least 5 percent level except for the customs union. Standard errors in parentheses, stars indicate statistical significance: *** p<0.001, ** p<0.01, * p<0.05.
55

(1) (2) (3)Dep. Var.: Hazard RateMonetary Union -0.017 -0.001 -0.043
(0.023) (0.026) (0.033) Common Market 0.468* 1.016 1.237
(0.187) (0.635) (0.659) Customs Union -0.470*** -0.305*** -0.411***
(0.062) (0.069) (0.107) Preferential Trade Area 0.091 0.277 0.393*
(0.167) (0.182) (0.195) Polity index 0.006*** 0.006*** 0.009***
(0.002) (0.002) (0.002) Financial Depth -0.537*** -0.555*** -0.561***
(0.131) (0.131) (0.131) Conflict Dummy 0.060** 0.058* 0.059**
(0.023) (0.023) (0.023) Exchange rate misalignment 0.063** 0.061** 0.056**
(0.020) (0.020) (0.020) Export experience 0.004 0.004 0.004
(0.010) (0.010) (0.010) Market experience 0.003 0.003 0.003
(0.023) (0.023) (0.023) FDI inflows 0.072*** 0.073*** 0.070***
(0.017) (0.017) (0.017) Tariff 0.001 0.002* 0.002**
(0.001) (0.001) (0.001) MU*tariff -0.020*** -0.022***
(0.005) (0.006) CM*tariff -0.002 -0.002
(0.001) (0.001) CU*tariff -0.011 -0.009
(0.025) (0.025) PTA*tariff 0.008 0.009
(0.006) (0.006) MU*polity index 0.033
(0.021) CM*polity index 0.008*
(0.004) CU*polity index -0.100
(0.127) PTA*polity index 0.029
(0.017) Observations 182165.000 182165.000 182165.000
* p<0.05 ** p<0.01 *** p<0.001
Table 2.7f: Level and interaction effects of product level tariff
Notes:. column 1 shows the level effects of product level tariff, which is not significant. Column 2 shows the interaction effects with stage of regional cooperation‐only monetary union has a significant effects at 5 percent level. Clustered standard errors are in parentheses, stars indicate statistical significance: *** p<0.001, ** p<0.01, * p<0.05.
56
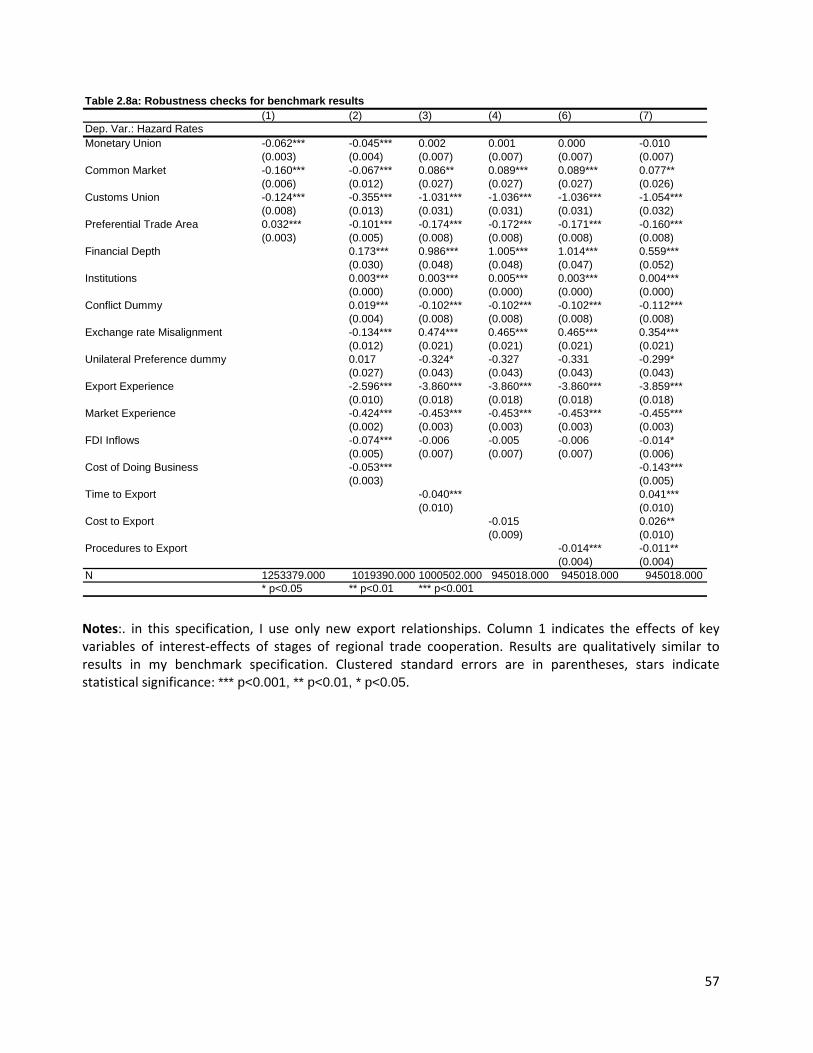
Table 2.8a: Robustness checks for benchmark results(1) (2) (3) (4) (6) (7)
Dep. Var.: Hazard RatesMonetary Union -0.062*** -0.045*** 0.002 0.001 0.000 -0.010
(0.003) (0.004) (0.007) (0.007) (0.007) (0.007) Common Market -0.160*** -0.067*** 0.086** 0.089*** 0.089*** 0.077**
(0.006) (0.012) (0.027) (0.027) (0.027) (0.026) Customs Union -0.124*** -0.355*** -1.031*** -1.036*** -1.036*** -1.054***
(0.008) (0.013) (0.031) (0.031) (0.031) (0.032) Preferential Trade Area 0.032*** -0.101*** -0.174*** -0.172*** -0.171*** -0.160***
(0.003) (0.005) (0.008) (0.008) (0.008) (0.008) Financial Depth 0.173*** 0.986*** 1.005*** 1.014*** 0.559***
(0.030) (0.048) (0.048) (0.047) (0.052) Institutions 0.003*** 0.003*** 0.005*** 0.003*** 0.004***
(0.000) (0.000) (0.000) (0.000) (0.000) Conflict Dummy 0.019*** -0.102*** -0.102*** -0.102*** -0.112***
(0.004) (0.008) (0.008) (0.008) (0.008) Exchange rate Misalignment -0.134*** 0.474*** 0.465*** 0.465*** 0.354***
(0.012) (0.021) (0.021) (0.021) (0.021) Unilateral Preference dummy 0.017 -0.324* -0.327 -0.331 -0.299*
(0.027) (0.043) (0.043) (0.043) (0.043) Export Experience -2.596*** -3.860*** -3.860*** -3.860*** -3.859***
(0.010) (0.018) (0.018) (0.018) (0.018) Market Experience -0.424*** -0.453*** -0.453*** -0.453*** -0.455***
(0.002) (0.003) (0.003) (0.003) (0.003) FDI Inflows -0.074*** -0.006 -0.005 -0.006 -0.014*
(0.005) (0.007) (0.007) (0.007) (0.006) Cost of Doing Business -0.053*** -0.143***
(0.003) (0.005) Time to Export -0.040*** 0.041***
(0.010) (0.010) Cost to Export -0.015 0.026**
(0.009) (0.010) Procedures to Export -0.014*** -0.011**
(0.004) (0.004) N 1253379.000 1019390.000 1000502.000 945018.000 945018.000 945018.000
* p<0.05 ** p<0.01 *** p<0.001
Notes:. in this specification, I use only new export relationships. Column 1 indicates the effects of key variables of interest‐effects of stages of regional trade cooperation. Results are qualitatively similar to results in my benchmark specification. Clustered standard errors are in parentheses, stars indicate statistical significance: *** p<0.001, ** p<0.01, * p<0.05.
57

Robustness Checks
(1) (2) (3) (4)Dep. Var.:Spell lengthMonetary Union 0.058* 0.002** 0.065 0.074***
(0.067) (0.114) (0.076) (0.078) Common Market 0.096 0.097 0.071 0.089*
(0.143) (0.017) (0.119) (0.133) Customs Union 1.196* 0.568** 1.164** 1.164***
(0.051) (0.002) (0.012) (0.001) Preferential Trade Area 0.087 0.119 0.084 0.123
(0.060) (0.105) (0.088) (0.078) Polity index -0.005 -0.004 -0.006 -0.004
(0.002) (0.007) (0.003) (0.003) Financial Depth 1.777** 0.842 1.586 1.778
(0.003) (0.602) (0.320) (0.280) Conflict dummy -0.049*** -0.191*** -0.085*** -0.069***
(0.287) (0.048) (0.263) (0.290) Exchange rate misalignment -0.000 -0.000 -0.000 -0.000
(0.000) (0.000) (0.000) (0.000) FDI inflow -0.081* -0.197*** -0.047*** -0.091***
(0.102) (0.028) (0.092) (0.083) Cost to export -0.034*
(0.172) Cost of doing business -0.001***
(0.045) Time to export -0.240**
(0.066) Procedures to Export -0.111**
(0.026) Constant 23.384 2.535 19.529 25.388
(14.427) (2.025) (9.893) (11.961) Observations 2176836.000 3693834.000 2176836.000 2176836.00R Sq. 0.825 0.718 0.825 0.825
* p<0.05 ** p<0.01 *** p<0.001
Table 2.8b: LPM Specification. Benchmark: Level Effects
0
Notes: In this specification, I use a linear probability specification; the dependent variable is spell length of each export relationship. A positive coefficient implies that the covariates enhance the chances of export relationship survival. Clustered standard errors are in parentheses, stars indicate statistical significance: *** p<0.001, ** p<0.01, * p<0.05.
58

Table 2.8c: LPM Specification: Interaction Effects (1) (2) (3) (4) (5)
Dep. Spell LengthMonetary Union 0.019 0.064** 1.866*** 0.117* 0.160**
(0.087) (0.022) (0.150) (0.046) (0.051) Common Market 1.717*** 1.378*** 3.263*** 2.840*** 2.826***
(0.184) (0.072) (0.416) (0.327) (0.383) Customs Union 2.820* 0.371 1.379* 0.310 6.347***
(1.402) (0.266) (0.642) (0.239) (0.455) Preferential Trade Area 0.034 0.334*** 1.326*** 1.144*** 4.101***
(0.125) (0.028) (0.278) (0.137) (0.217) Time to export -0.212***
(0.018) MU*time to export 0.008
(0.038) CM*time to export -0.018
(0.025) CU*time to export 1.059**
(0.372) FTA*time to export 0.566***
(0.062) Polity index -0.006*** -0.005*** -0.005*** -0.004*** -0.005***
(0.001) (0.001) (0.001) (0.001) (0.001) Financial Depth -1.426* 0.466 1.762 1.584 1.228
(0.080) (0.054) (0.080) (0.080) (0.085) Conflict dummy -0.084*** -0.191*** -0.065** -0.084*** -0.081***
(0.024) (0.009) (0.024) (0.024) (0.024) exchange rate misalignment -0.000*** -0.000*** -0.000*** -0.000*** -0.000***
(0.000) (0.000) (0.000) (0.000) (0.000) FDI inflows -0.055*** -0.181*** -0.075*** -0.090*** -0.104***
(0.015) (0.010) (0.015) (0.015) (0.015) Cost of doing business -0.041***
(0.007) MU*cost of doing business 0.133***
(0.008) CM*cost of doing business -0.006
(0.006) CU*cost of doing business 0.007
(0.050) PTA*cost of doing business 0.335***
(0.018) Cost to export 0.056***
(0.016) MU*cost to export 0.197***
(0.040) CM*cost to export -0.272***
(0.021) CU*cost to export -0.018
(0.091) PTA*cost to export 0.444***
(0.058) Procedures to export 0.125*** 0.131***
(0.011) (0.011) MU*procedures to export 0.118*** 0.380***
(0.015) (0.021) CM*procedures to export -0.009 -0.017**
(0.006) (0.006) CU*procedures to export -0.198*** -0.416***
(0.035) (0.051) PTA*procedures to export 0.329*** 0.288***
(0.036) (0.038) MU*polity index -0.022***
(0.003) CM*polity index 0.002
(0.002) CU*polity index 0.316***
(0.033) PTA*polity index 0.007
(0.006) MU*Years of effective cooperation -0.029***
(0.003) CM*Years of effective cooperation -0.000
(0.002) CU* Years of effective cooperation 0.313***
(0.019) PTA* Years of effective cooperation -0.029***
(0.007) Constant 18.102*** 1.698* 22.060*** 24.096*** 21.622***
(1.669) (0.823) (1.637) (1.651) (1.656) Observations 2176836.000 3693834.000 2176836.000 2176836.000 2176836.000 R.Sq. 0.825 0.718 0.825 0.825 0.825
59* p<0.05 ** p<0.01 *** p<0.001

Notes: this is linear probability specification with interaction effects. A positive coefficient implies that the covariates enhance the chances of export relationship survival. Clustered standard errors are in parentheses, stars indicate statistical significance: *** p<0.001, ** p<0.01, * p<0.05.
Table 2.9: Regional grouping by stage of trade cooperation
Member`s Member`s Member`s Member`s Regional Block Year of Year of Year of entry Year of entryBlock Membership Entry [FTA] Entry [Customs Union] [Common Market] [Monetary Union]UEMOA Benin 1994
Burkina Faso 1994Ivory Coast 1994Guinea-Bissau 1997Mali 1994Niger 1994Senegal 1994Togo 1994
CMA Lesotho 1993South Africa 1993Swaziland 1993Namibia 1993
CEMAC (UDEAC) Cameroon 1999Central African Rep. 1999Chad 1999Congo 1999Equatorial Guinea 1999Gabon 1999Sao Tome & Principe 1999
Monetary Union & Pseudo Monetary Union Blocs
Notes: This includes West African Economic and Monetary Union (UEMOA), CFA is the common currency; The Common Monetary Area of Southern Africa (CMA) uses the rand as the common currency i.e., the currencies of Lesotho, Namibia and Swaziland are linked one for one with the South African Rand; The Economic and Monetary Community of Central Africa (CEMAC) uses the Central Africa CFA as the common currency.
SACU Botswana November 11, 1994Lesotho November 11, 1994Namibia November 11, 1994South Africa November 11, 1994Swaziland November 11, 1994
EAC Burundi 1st July 2010Kenya 1st July 2010Rwanda 1st July 2010Tanzania 1st July 2010Uganda 1st July 2010
Common Market Blocs
Notes: Southern Africa Customs Union (SACU) and East African Community Common Market (EAC).
60

Member`s Member`s Member`s Member`s Regional Block Year of Year of Year of entry Year of entryBlock Membership Entry [FTA] Entry [Customs Union] [Common Market] [Monetary Union]COMESA Angola
Burundi 21-Dec-81 31st October, 2000Comoros 21-Dec-81 31st October, 2000Dem. Rep. Congo 21-Dec-81 31st October, 2000Djibouti 21-Dec-81 31st October, 2000Egypt 06-Jan-99 31st October, 2000Eritrea 1994 31st October, 2000Ethiopia 21-Dec-81 31st October, 2000Kenya 21-Dec-81 31st October, 2000Libya 03-Jun-05 31st October, 2000Madagascar 21-Dec-81 31st October, 2000Malawi 21-Dec-81 31st October, 2000Mauritius 21-Dec-81 31st October, 2000Namibia 31st October, 2000Rwanda 21-Dec-81 1st January 2004Seychelles 2001 31st October, 2000Sudan 21-Dec-81 31st October, 2000Swaziland 21-Dec-81 31st October, 2000Tanzania 31st October, 2000Uganda 21-Dec-81 31st October, 2000Zambia 21-Dec-81 31st October, 2000Zimbabwe 21-Dec-81 31st October, 2000
Customs Union Blocs
Notes: Common Market for Eastern and Southern Africa (COMESA).
ECOWAS Benin 1975 24-Jul-93Burkina Faso 1975 24-Jul-93Cape Verde 1977 24-Jul-93Ivory Coast 1975 24-Jul-93Gambia 1975 24-Jul-93Ghana 1975 24-Jul-93Guinea 1975 24-Jul-93Guinea-Bissau 1975 24-Jul-93Liberia 1975 24-Jul-93Mali 1975 24-Jul-93Mauritania 1975 24-Jul-93Niger 1975 24-Jul-93Nigeria 1975 24-Jul-93Senegal 1975 24-Jul-93Sierra Leone 1975 24-Jul-93Togo 1975 24-Jul-93
Notes: Economic Community of West African States (ECOWAS)
61

Member`s Member`s Member`s Member`s Regional Block Year of Year of Year of entry Year of entryBlock Membership Entry [FTA] Entry [Customs Union] [Common Market] [Monetary Union]SADC Angola 1992 01-Sep-00
Botswana 1992 01-Sep-00Dem. Rep. Congo 1997 01-Sep-00Lesotho 1992 01-Sep-00Malawi 1992 01-Sep-00Mauritius 1995 01-Sep-00Madagascar 2005 01-Sep-00Mozambique 1992 01-Sep-00Namibia 1992 01-Sep-00Seychelles 15-Sep-07 01-Sep-00South Africa 1994 01-Sep-00Swaziland 1992 01-Sep-00Tanzania 1992 01-Sep-00Zambia 1992 01-Sep-00Zimbabwe 1992 01-Sep-00
Preferential Trade Areas
Notes: Southern African Development Community (SADC)
CEN-SAD Benin Burkina Faso 4th February 1998Chad Côte d'Ivoire Egypt Ghana Guinea Bissau MaliNigerSudanCentral African Rep. Apr-99Eritrea Apr-99Senegal Feb-00Djibouti Feb-00Gambia Feb-00Liberia LibyaMorocco Nigeria Sierra LeoneSomaliTogoTunisia
Notes: Community of Sahel‐Saharan States.
IGAD Djibouti 1996Ethiopia 1996Kenya 1996Somalia 1996Sudan 1996Uganda 1996
Notes: Intergovernmental Authority on Development.
62

UMA Algeria 1990Libya 1990Morocco 1990Tunisia 1990
Notes: Arab Maghreb Union
WAMZ Gambia 2015(planned)GhanaGuineaLiberiaNigeriaSierra Leone
Notes: West African Monetary Zone, on course to introduce a single currency by 2015.
ECCAS (CEEAC) Angola 06-Feb-98Burundi 07-Feb-98Cameroon 08-Feb-98Central African Rep. 09-Feb-98Chad 10-Feb-98Congo 11-Feb-98Dem. Rep. Congo 12-Feb-98Equatorial Guinea 13-Feb-98Gabon 14-Feb-98Rwanda 15-Feb-98Sao Tome & Principe 16-Feb-98
Notes: Economic Community of Central African States.
63