Embed Size (px)
Citation preview
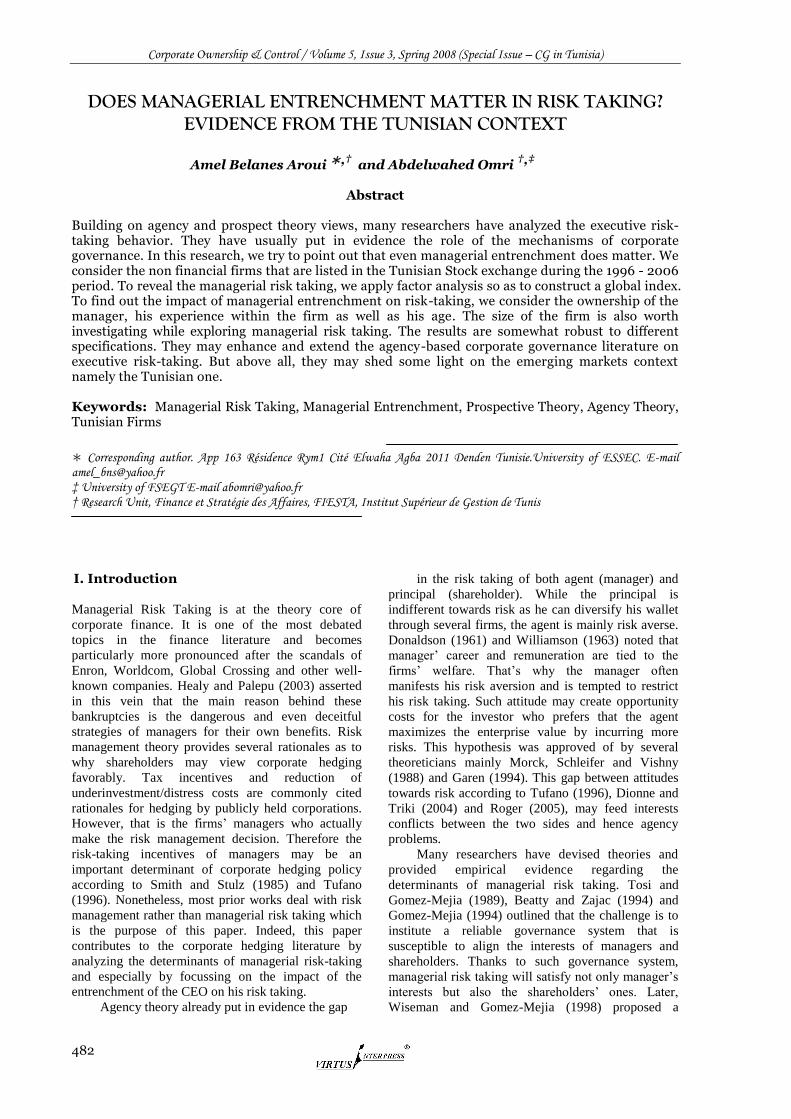
Corporate Ownership & Control / Volume 5, Issue 3, Spring 2008 (Special Issue – CG in Tunisia)
482
DOES MANAGERIAL ENTRENCHMENT MATTER IN RISK TAKING? EVIDENCE FROM THE TUNISIAN CONTEXT
Amel Belanes Aroui ∗,† and Abdelwahed Omri †,‡
Abstract
Building on agency and prospect theory views, many researchers have analyzed the executive risk-taking behavior. They have usually put in evidence the role of the mechanisms of corporate governance. In this research, we try to point out that even managerial entrenchment does matter. We consider the non financial firms that are listed in the Tunisian Stock exchange during the 1996 - 2006 period. To reveal the managerial risk taking, we apply factor analysis so as to construct a global index. To find out the impact of managerial entrenchment on risk-taking, we consider the ownership of the manager, his experience within the firm as well as his age. The size of the firm is also worth investigating while exploring managerial risk taking. The results are somewhat robust to different specifications. They may enhance and extend the agency-based corporate governance literature on executive risk-taking. But above all, they may shed some light on the emerging markets context namely the Tunisian one.
Keywords: Managerial Risk Taking, Managerial Entrenchment, Prospective Theory, Agency Theory, Tunisian Firms
∗ Corresponding author. App 163 Résidence Rym1 Cité Elwaha Agba 2011 Denden Tunisie.University of ESSEC. E-mail [email protected] ‡ University of FSEGT E-mail [email protected] † Research Unit, Finance et Stratégie des Affaires, FIESTA, Institut Supérieur de Gestion de Tunis
I. Introduction
Managerial Risk Taking is at the theory core of
corporate finance. It is one of the most debated
topics in the finance literature and becomes
particularly more pronounced after the scandals of
Enron, Worldcom, Global Crossing and other well-
known companies. Healy and Palepu (2003) asserted
in this vein that the main reason behind these
bankruptcies is the dangerous and even deceitful
strategies of managers for their own benefits. Risk
management theory provides several rationales as to
why shareholders may view corporate hedging
favorably. Tax incentives and reduction of
underinvestment/distress costs are commonly cited
rationales for hedging by publicly held corporations.
However, that is the firms’ managers who actually
make the risk management decision. Therefore the
risk-taking incentives of managers may be an
important determinant of corporate hedging policy
according to Smith and Stulz (1985) and Tufano
(1996). Nonetheless, most prior works deal with risk
management rather than managerial risk taking which
is the purpose of this paper. Indeed, this paper
contributes to the corporate hedging literature by
analyzing the determinants of managerial risk-taking
and especially by focussing on the impact of the
entrenchment of the CEO on his risk taking.
Agency theory already put in evidence the gap
in the risk taking of both agent (manager) and
principal (shareholder). While the principal is
indifferent towards risk as he can diversify his wallet
through several firms, the agent is mainly risk averse.
Donaldson (1961) and Williamson (1963) noted that
manager’ career and remuneration are tied to the
firms’ welfare. That’s why the manager often
manifests his risk aversion and is tempted to restrict
his risk taking. Such attitude may create opportunity
costs for the investor who prefers that the agent
maximizes the enterprise value by incurring more
risks. This hypothesis was approved of by several
theoreticians mainly Morck, Schleifer and Vishny
(1988) and Garen (1994). This gap between attitudes
towards risk according to Tufano (1996), Dionne and
Triki (2004) and Roger (2005), may feed interests
conflicts between the two sides and hence agency
problems.
Many researchers have devised theories and
provided empirical evidence regarding the
determinants of managerial risk taking. Tosi and
Gomez-Mejia (1989), Beatty and Zajac (1994) and
Gomez-Mejia (1994) outlined that the challenge is to
institute a reliable governance system that is
susceptible to align the interests of managers and
shareholders. Thanks to such governance system,
managerial risk taking will satisfy not only manager’s
interests but also the shareholders’ ones. Later,
Wiseman and Gomez-Mejia (1998) proposed a
Corporate Ownership & Control / Volume 5, Issue 3, Spring 2008 (Special Issue – CG in Tunisia)
483
behavioral agency model. According to them,
behavioral theory bloomed and developed regardless
of agency theory although they are complementary.
Their model tried to reconcile between these two
theories. On one hand, their model emphasized the
efficiency of governance mechanisms dedicated to
improve and control managerial risk taking by the
principal. On the other hand, it highlighted the
psychological and behavioral side of this very specific
managerial decision.
However, entrenchment theory stipulated that
governance mechanisms are not sufficient enough to
compel the management to behave in favour of
shareholders interests and restrict the empire
building efforts of managers. Piggé (1998) explained
that managerial entrenchment reveals the agent
willing to overcome the principal control, at least
partially, in order to build up some personal
advantages namely special rewards and remuneration.
Further more, manager can increase the dependence
of the firm’s partners on him and his skills.
Management can even reduce the impact of corporate
governance which obviously aims at restricting his
authority and controlling his decision. There are in
fact a wide range of entrenchment strategies followed
by the manager to fulfil such objectives. Alexandre
and Paquerot (2000) asserted for instance that
investment policy may constitute a pertinent tool for
managerial entrenchment. By taking up some risky
projects that are specific and suitable to his skills, the
manager increases the firm risk but above all the
dependence of the firm on him. Besides, manager can
increase his entrenchment by making the information
not easily accessible or also by building some
relational networks, either formal or not.
In sum, many theories may contribute in
explaining managerial risk taking. Not only agency
but also prospective theories were the main references.
But little is known about what really may influence
managerial risk taking. We are yet to understand
completely the factors that drive this managerial
decision and the manner in which these factors
interact. Entrenchment theory was a little bit
neglected although it may offer further explanations
and recommendations. This paper wants to contribute
to the relatively limited literature on managerial risk
taking. This is the main purpose of this paper.
But above all, the justification of this paper is to
continue carrying the debate into the realm of
emerging markets. Researchers have almost focused
on the private sector in a few developed countries.
Therefore, a fairly detailed, if incomplete, picture is
available. No doubt, not only managerial risk taking
but also managerial entrenchment are expected to
deviate from the norms that have been long accepted
in developed ones. Our survey wishes to be the first
study focusing on this frame in Tunisia.
In particular, the Tunisian case presents at least
four interesting features that make its study relevant
in terms of policy recommendations for this country
and others in the Middle East and North Africa
region. First, most Tunisian managers seem to be risk
averse and scarcely undertake risky projects.
According to a recent survey led by the Council of
Capital Market, Tunisian managers would rather opt
for secure and certain investments such as accounts
savings, Treasury bills than receipts in risky
reinvestments such as the SICAR, the mutual funds
and stocks despite the various measures granted by
authorities so as to promote such financial products.
Second, most Tunisian firms are still family
corporations and presents highly concentrated
ownership and opaque ultimately identification. Thus,
managers have tendency to preserve the maximum of
opacity on the family's business. Third, Tunisians
managers can not yet be rewarded by stock options.
Therefore, stock options can neither constitute a
managerial incentive nor reveal managerial risk
aversion. Fourth, the Tunisian Stock Exchange
witnessed several reforms especially the introduction
of an electronic system for transactions in phase with
international standards and this innovation is
expected to have an impact on the way firms set their
investment and indebtedness policies which are
thoroughly tied with managerial risk taking.
More above, this paper suggests an
econometrically sound approach to modelling
managerial risk taking. It is the first paper, to our
knowledge, to construct a global index revealing the
intensity of managerial risk taking and the pioneer
work to reveal the impact of managerial entrenchment
on risk taking within the Tunisian firms.
The remainder of this paper is organized as
follows. Section II describes the conceptual
framework and details the working hypotheses.
Section III presents a brief overview of the
methodology and data used. Section IV sums up the
empirical results. Section V concludes.
II. Conceptual Framework And Working Hypotheses
Theoretical work in risk management suggests that
corporate taxes, costs of underinvestment and
financial distress, managerial motives, and
information asymmetry may provide a value-
maximizing corporation with rationales to alter risk
according to Smith and Stulz (1985), Froot et al.
(1993) and Leland (1998). However, the prior
empirical work in managerial risk taking makes use of
several different proxies to measure risk management.
On one hand, some researchers namely Dionne
and Triki (2004), Beasley et al. (2005), Davies et al.
(2005) and Coles et al. (2006) evaluated the risk
taking of the manager through his payment in stock
options. These researchers approved of the arguments
of Coffee (1988), Hoskisson and al. (1991) and
Mehran (1995) that a manager rewarded accordingly
to the firm performance, his risk aversion decreased
and would prefer risky projects with increasing
variance. However, this argument did not enjoy the
unanimity according to Beatty and Zajac (1994).

Corporate Ownership & Control / Volume 5, Issue 3, Spring 2008 (Special Issue – CG in Tunisia)
484
Some researchers of whom Shavell (1979) suggested
that when the manager supports too much risk, he
became excessively risk averse in spite of stock
options. Besides, it seems that the manager payment is
rather a determinant than a measure of managerial risk
taking. In addition, managers are not yet rewarded
with stock options in the Tunisian Stock Exchange.
On the other hand, some researchers notably
Zahra (2005) linked the risk taking of manager to the
risk of the company given that the manager is the
decision maker. Therefore, Chen and Steiner (1999),
Beasley et al. (2005), Kose et al. (2005) and Coles et
al. (2006) asserted that business diversification was
abundantly used in financial literature as indication of
a moderate and careful risk taking. Other researchers
of whom Crutchley and Hansen (1989), Rogers
(2005), Davies et al. (2005) and Coles et al. (2006)
estimated the risk taking of manager by expenses in
research and development and capital expenditures.
As for Zahra (2005), he evaluated it through the
partnership strategies at the national scale and abroad,
the conquest of new local or foreign markets and the
investments in new technologies. We can not exploit
such measures for lack of data in the Tunisian Stock
Exchange.
Based on prior theoretical and empirical work in
risk management, we are going to consider other
seven proxies and construct a global index to assess
managerial risk taking within the Tunisian Stock
Exchange. First of all, managers would rather select
riskier projects so as to generate more internal funds
to finance the new opportunities of investments. Gay
and Nam (1999), Knop et al. (2002), Rogers (2005),
Dionne and Triki (2004), Davies et al. (2005) and
Coles et al. (2006) gave evidence that managerial risk
taking is then justified as a means to avoid the
underinvestment problem. A common proxy for
investment opportunities is the market-to-book ratio
(MBV) and it is positively correlated with
managerial risk taking. We also consider the intensity
of investment (INV). It is predicted that the more
persevering investment policy is, the more risky
managerial decisions are. External financing is much
more expensive than internal one. Similarly, firms
with greater rate of growth that needed funds to
preserve their growth and profitability ought to incur
more risks. Besides, we refer to the indebtedness
ratio (LEV). This measure was used by Myers (1977),
Chen and Steiner (1999) and Coles et al. (2006) who
asserted that managerial risk taking can be reveald
through an aggressive indebtedness policy. Chen and
Steiner (1999) noted in this regard that excessive
debts increase the risk of bankruptcy. It is the
financial leverage that leads to a non diversifiable
managerial risk. It is expected that the more hard-line
managerial risk taking is, the higher the indebtedness
ratio is. Three proxies are used for the debt ratio:
LEV1, LEV2 and LEV3 which measure the total
debt to respectively book value of capital; the market
value of total assets and the book value of total assets.
The fifth variable is the volatility of the return on
equity (ROE). According to Chen and Steiner (1999),
Guay and Nam (1999) and Coles et al. (2006), such
volatility translates the risk taking of the manager as
estimated and felt by the financial market through the
fluctuations of the firm value. It is estimated that the
more managerial risk taking increases, the more this
volatility increases. Additionally, we consider the
volatility of the return on assets (ROA). It is an
approximation of the risk of the exploitation
operations and reveals the manager’s strategy
according to which he behaves, risky or moderate.
This was held by Leuz and al. (2003), Cebenoyan and
Strahan (2004) and Kose et al. (2005) who suggested
in this respect that the management of results allows
the leaders to hide the real profitability of the
company. One foresees that the more intensive
managerial risk taking is, the higher this volatility is.
Finally, we apply the factor analysis so as to construct
a global index of managerial risk taking that would
reconcile between these four aspects of managerial
decisions.
H1: All else equal, managerial risk taking are
positively correlated with the opportunities growth,
investment intensity, the indebtedness ratio and the
volatility of both ROE and ROA.
The manager, as an agent, aims at being the
best entrenched, in order to reduce the risk of being
dismissed. Although this is the main objective of
managerial entrenchment, the CEO may also misuse
corporate assets for his own benefits at the cost of
outside investors and accumulate personal rewards
and remunerations. The CEO is expected to
maximise his risk taking in order to maximise the
firm value. However, he may reduce his risk taking
and even opt for a quiet life according to Windram
(2005). The nature of the relation between managerial
entrenchment and risk management is in fact complex.
There is a large variety of strategies that would
increase the level of managerial entrenchment
through specific investments, information
manipulation and relational networks. However, the
level of managerial entrenchment does depend on
many factors that are specific to the manager himself.
Broadly speaking, the participation of the manager
into the capital, his experience within the firm as
well as his age, all of these factors are expected to
influence the managerial entrenchment. Therefore,
we will test the impact of these factors on managerial
risk taking so as to reveal the impact of the
entrenchment of manager on his risk taking. Beyond
that, various arguments do bear on the issue.
Building on agency theory, the participation of
the manager into the capital of the firm would align
executives’ and shareholders’ interests and hence a
convergence. Jensen and Meckling (1976)
hypothesized in this vein that that agency costs
associated with manager-owner conflicts increase
with the degree of the separation of ownership and
control. When the manager is the sole equity owner of
a firm, there is no separation of ownership and
control; and hence no agency problems. The manager

Corporate Ownership & Control / Volume 5, Issue 3, Spring 2008 (Special Issue – CG in Tunisia)
485
is thus motivated to optimise his risk taking so as to
maximise the firm value. However, recent empirical
researches namely those of Davies et al. (2005) put in
evidence a non linear relationship between managerial
ownership and corporate value. This has been
attributed to the onset of managerial entrenchment,
which results in a decrease of corporate value for
increasing levels of managerial holdings. Davies et al.
(2005) proposed a new structure that accounts for the
effect of conflicting managerial incentives, and
external and internal disciplinary monitoring
mechanisms. Specifically, for low levels of
managerial ownership, external discipline and internal
controls or incentives will dominate behavior as
suggested by Fama (1980) and Jensen and Ruback
(1983). At intermediate levels of managerial
ownership, management interests begin to converge
with those of shareholders. However, managers may,
at this level of holdings, maximise their personal
wealth through increasing perquisites and
guaranteeing their employment at the expense of
corporate value. Indeed, even though external market
controls are still in place, these and the effect of
convergence of interests are not strong enough to
align the behavior of management to shareholders.
This lack of discipline provides evidence of a
deficiency in incentives for managers to maximise
shareholder value at this level of ownership. As levels
of managerial equity ownership grow, objectives
converge further to those of shareholders.
Nevertheless, at ownership levels below 50%,
managers do not have total control of the firm and
external discipline still exists. Managers are likely still
subject to discipline from external block shareholders.
At levels above 50% ownership, managers have
complete control of the company. Although atomistic
shareholders are unlikely to have been able to in
influence managers at far lower levels of ownership
than this, there is always a possibility that a cartel of
blockholders, allied with minority shareholder’s rights
may be able to mount a challenge to management if
they fail to make decisions in shareholders’ best
interests. Thus, we expect a non linear relationship
between managerial ownership and managerial risk
taking. As a proxy to managerial ownership MOWN,
we measure the percentage of capital the CEO holds.
H2: All else equal, the relationship between
managerial ownership and managerial risk taking is
not linear in the Tunisian Stock Exchange.
Managerial entrenchment does also depend on
his experience as a chairman as well his experience
before being nominated a chairman within the firm.
Empirical research has not straight highlighted its
impact on managerial risk taking. It is a little bit
confusing. Indeed, Chaganti and Sambharya (1987)
assumed that creativeness and originality shrink as
long as the manager gets more experienced.
Consequently, one hypothesizes that managerial risk
taking would reduce with experience. Furthermore,
Loomes et al. (2003) and Li et al. (2004) suggested
that risk aversion raise with experience. Likewise,
one expects that managerial risk taking would
decrease with the CEO experience. However, we can
not distinguish whether his experience before being
nominated chairman or as a chairman within the firm.
Agency theory stipulated in this framework that
when the CEO is also the chairman, the capabilities of
the board to monitor the CEO are weaken. Brickley et
al. (1997) argued that there are also costs associated
with having two persons holding the CEO and
chairman posts. But, they find no evidence that firms
with separate persons holding the CEO and chairman
posts perform better. In contrast, Pi and Timme
(1993) found that firms with one person holding both
posts have less cost efficiency and performance than
those with two persons holding the two titles. As a
proxy, we count the experience of the manager before
being nominated as a chairman (MEXPBF) and his
experience as a chairman (MEXPAF). We test
whether the relation between the experience of the
CEO and managerial risk taking is negative in
Tunisia.
H3: All else equal, the experience of the CEO is
negatively correlated with managerial risk taking in
the Tunisian Stock Exchange.
How should the CEO’ age influence managerial
risk taking? The most popular view among the
financial advisors is that as the investors get older
their choices become less risky and more rationale. In
recent years, several other researchers examine
optimal portfolio choice as a function of the
investment horizon within different economic
frameworks and under different assumptions. For
example, Benzoni, Collin-Dufresne, and Goldstein
(2006) found that a young investor should invest more
into the risky asset because cointegration generates a
high correlation between returns to human capital and
market returns. As long as the investor gets older, his
portfolio’s allocation should shift from primarily
equities to a balanced portfolio and then to a primarily
bond portfolio. Gollier (2002) provided a theoretical
foundation to the notion of time diversification and
deduce an argument that sustains the folk wisdom
suggesting that younger people should invest more of
their wealth in risky assets. The basic idea has its
roots in the prospective theory. King and Leape
(1987) noted in this frame that older mangers are
more mature and risk averse. They added that daring,
audacity; overconfidence, inventiveness and
creativity are thoroughly tied with youth. As a proxy,
we assess the manager age (MAGE) through three
values: 1, 2 and 3 which mean respectively that the
CEO age is less than 40 years, between 40 and 60
years and finally over 60 years. The CEO age is
hypothesized to be negatively correlated with
managerial risk taking.
H4: All else equal, the age of manager is
negatively correlated with his risk taking in the
Tunisian Stock Exchange.
Smith and Stulz (1985) suggested that the costs
of managerial risk taking are proportional to the firm
size. In particular, larger firms should have easier

Corporate Ownership & Control / Volume 5, Issue 3, Spring 2008 (Special Issue – CG in Tunisia)
486
access to external capital markets and can borrow at
better conditions. Even the conflicts between
creditors and shareholders are more severe for
smaller firms rather than larger ones. Besides, larger
firms tend to be more diversified and their cash flows
are more regular and less volatile. Thus, larger firms
should be more willing to undertake riskier projects.
The managers of small firms will be then more risk
averse. Besides, Howard (1988) noted that as the firm
grows, its wealth increases and so does its ability to
manage bigger and riskier projects. Dionne and Triki
(2004), Beasley et al. (2005) and Walls (2005)
approved of such results and concluded that
managerial risk taking is a heavy burden for small
firms. As surrogate to size, we use the total assets
value (LNSIZE) and it is expected to be positively
correlated with managerial risk taking.
H5: All else equal, larger firms incur more
risks. We expect that the degree of managerial risk
taking will be positively associated with the size of
the firm in the Tunisian Stock Exchange.
III. Data And Empirical Methodology
A. Data
The data used is provided by the Tunisian Stock
Exchange and the Council of Capital Market
through respectively their official bulletins and
their annuals reports covering the period 1996 to
2006. The data relative to the determinants of
managerial entrenchment are collected through a
questionnaire destined to the managers of the
Tunisian listed firms. Tunisian firms that are non-
quoted in the Tunisian Stock Exchange are not
compelled to reveal the needed information. For such
reasons, we can not spread the survey for all Tunisian
companies. Besides, most prior work, however,
implicitly recognizes differences in determinants in
financial decisions between financial and non
financial firms. That’s why we ought to exclude
financial firms from the analysis. The period of study
covers eleven years, from 1996 to 2006, which
appears a period long enough to smooth out variables
fluctuations. Moreover, it should be pointed here that
combining cross-section and time series data is
worthwhile as it provides a wealth of information.
The use of panel data allows increasing the sample
size and hence the gain in degrees of freedom which
is particularly relevant when a relatively large number
of regressors and a small number of firms are used
which is our case here.
[Insert table 1 about here]
In table 1, some relevant descriptive statistics
are provided for the variables that are used to
evaluate the impact of managerial entrenchment. For
instance, the average age of Tunisian managers is
between 40 and 60 years. Most of them were not
hired by the firm before being nominated a chairman.
They are usually directly nominated without having
any prior experience within the firm. In addition, half
of the managers have occupied this post for more or
less 5 years. However, there are some managers who
are chairmen for 30 years. An important stylized fact
on Tunisian listed firms is the too low managerial
ownership. In fact, managerial ownership is on
average around 3% which is too low. But above all,
half of the considered managers detain about 1,7% of
the capital of the firm they run. Such figure may
reveal that managerial ownership can not incite
managers to incur risks as it is in major empirical
researches. More above, as managerial risk taking
may be influenced by firm size; we also exhibit its
descriptive statistics. We should point out that most
non financial firms that are listed in the Tunisian
stock exchange have the same size which would
eliminate the bias due to size.
[Insert table 2 about here]
In addition, we provide in table 2 the
descriptive statistics of the variables making up the
global score of managerial risk taking. Table 2 shows
a very low rate of investment which is around 13%
of total assets. The rate of MBV is also too small
which confirms the risk aversion of Tunisian
managers. They usually do not look for new
investments that may be risky. An additional striking
result is the high leverage ratio. Total debt is on
average 3,1 times the book value of equity. The total
debt may even represent more than the half of total
assets. Although a high rate of indebtedness witnesses
of a risky behaviour, it may not be the case in the
Tunisian context as firms are compelled to borrow to
finance their investments. They have not an
alternative source of financing. Another important
stylized fact on Tunisian firms is the volatility of the
firms listed in the Tunisian Stock Exchange. The
dispersion indicators of the volatility of both ROA
and ROE approve of such volatility. Finally, table 1
shows a low average rate of the score of managerial
risk taking which confirms the risk averse attitude of
most managers of the listed firms in the Tunisian
Stock Exchange.
B. Operational Model
The following regression equation is estimated to
provide bearing on the remaining hypotheses
indicated above (H2 through H5):
RISKi,t=f+a1MOWNi,+ MOWN2i,t+a3MOWN
3i,t+
bMEXBFi,t+cMEXAFi,t+dMAGEi,t+eLNSIZEi,t+εit where: RISK ≡ Global index of managerial risk
taking obtained after applying factor analysis to seven
variables which are MBV, INV, LEV1, LEV2, LEV3,
VROA and VROE; where: MBV is Market-to-book-value;
INV is Total investments deflated by total assets; LEV1 is
Total debt divided by book value of capital; LEV2 is Total
debt divided by the market value of total assets; LEV3 is
Total debt divided by the book value of total assets; VROA
is Standard deviation of ROA for a three-year period;
Corporate Ownership & Control / Volume 5, Issue 3, Spring 2008 (Special Issue – CG in Tunisia)
487
VROE is Standard deviation of ROE for a three-year
period; MOWN is % of Managerial ownership; MEXBF is
Managerial experience before being nominated a
chairman; MEXAF is Managerial experience as a
chairman; MAGE is the Age of manager; it equals 1 if it is
less than 40 years, 2 if it is between 40 and 60 years and
finally 3 if it is over 60 years; LNSIZE is Logarithm of the
value of total assets.
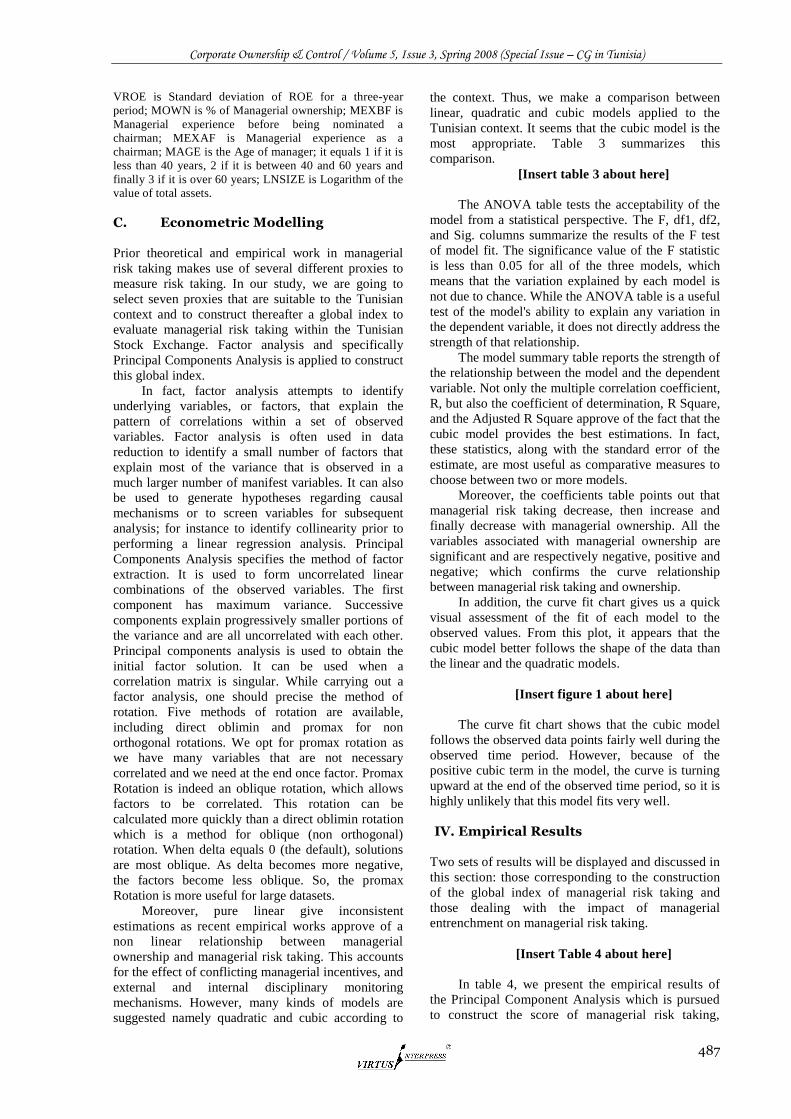
C. Econometric Modelling
Prior theoretical and empirical work in managerial
risk taking makes use of several different proxies to
measure risk taking. In our study, we are going to
select seven proxies that are suitable to the Tunisian
context and to construct thereafter a global index to
evaluate managerial risk taking within the Tunisian
Stock Exchange. Factor analysis and specifically
Principal Components Analysis is applied to construct
this global index.
In fact, factor analysis attempts to identify
underlying variables, or factors, that explain the
pattern of correlations within a set of observed
variables. Factor analysis is often used in data
reduction to identify a small number of factors that
explain most of the variance that is observed in a
much larger number of manifest variables. It can also
be used to generate hypotheses regarding causal
mechanisms or to screen variables for subsequent
analysis; for instance to identify collinearity prior to
performing a linear regression analysis. Principal
Components Analysis specifies the method of factor
extraction. It is used to form uncorrelated linear
combinations of the observed variables. The first
component has maximum variance. Successive
components explain progressively smaller portions of
the variance and are all uncorrelated with each other.
Principal components analysis is used to obtain the
initial factor solution. It can be used when a
correlation matrix is singular. While carrying out a
factor analysis, one should precise the method of
rotation. Five methods of rotation are available,
including direct oblimin and promax for non
orthogonal rotations. We opt for promax rotation as
we have many variables that are not necessary
correlated and we need at the end once factor. Promax
Rotation is indeed an oblique rotation, which allows
factors to be correlated. This rotation can be
calculated more quickly than a direct oblimin rotation
which is a method for oblique (non orthogonal)
rotation. When delta equals 0 (the default), solutions
are most oblique. As delta becomes more negative,
the factors become less oblique. So, the promax
Rotation is more useful for large datasets.
Moreover, pure linear give inconsistent
estimations as recent empirical works approve of a
non linear relationship between managerial
ownership and managerial risk taking. This accounts
for the effect of conflicting managerial incentives, and
external and internal disciplinary monitoring
mechanisms. However, many kinds of models are
suggested namely quadratic and cubic according to
the context. Thus, we make a comparison between
linear, quadratic and cubic models applied to the
Tunisian context. It seems that the cubic model is the
most appropriate. Table 3 summarizes this
comparison.
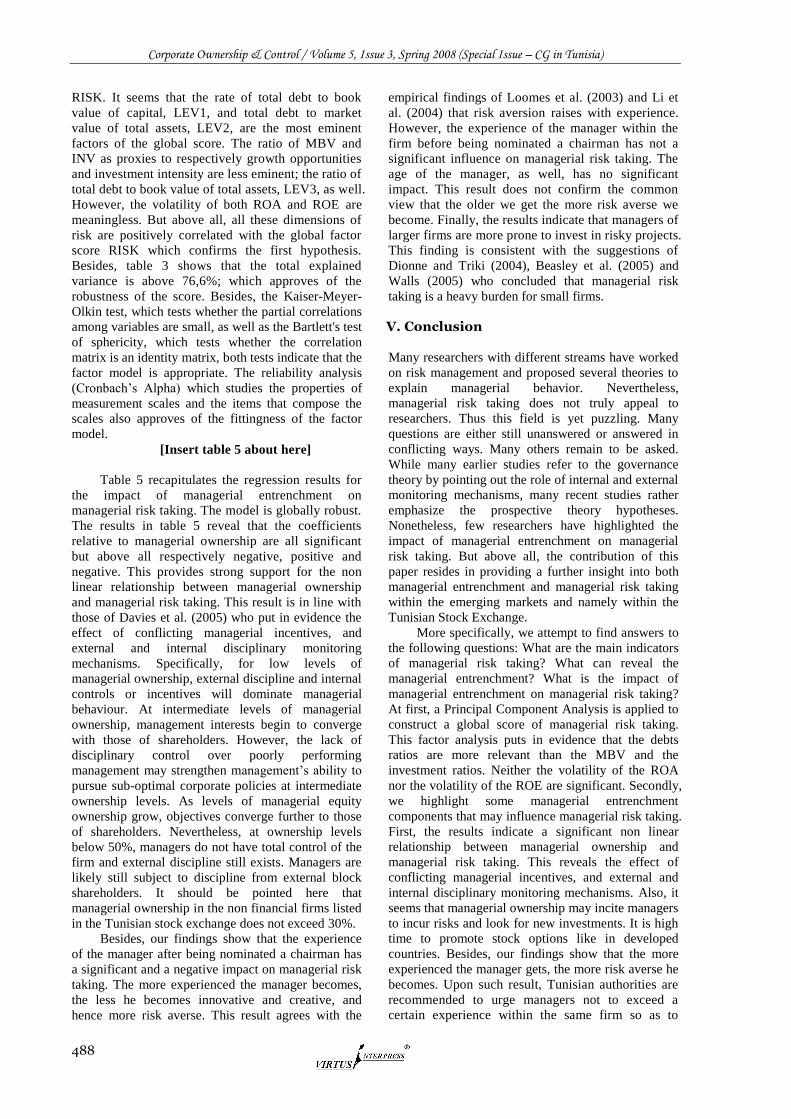
[Insert table 3 about here]
The ANOVA table tests the acceptability of the
model from a statistical perspective. The F, df1, df2,
and Sig. columns summarize the results of the F test
of model fit. The significance value of the F statistic
is less than 0.05 for all of the three models, which
means that the variation explained by each model is
not due to chance. While the ANOVA table is a useful
test of the model's ability to explain any variation in
the dependent variable, it does not directly address the
strength of that relationship.
The model summary table reports the strength of
the relationship between the model and the dependent
variable. Not only the multiple correlation coefficient,
R, but also the coefficient of determination, R Square,
and the Adjusted R Square approve of the fact that the
cubic model provides the best estimations. In fact,
these statistics, along with the standard error of the
estimate, are most useful as comparative measures to
choose between two or more models.
Moreover, the coefficients table points out that
managerial risk taking decrease, then increase and
finally decrease with managerial ownership. All the
variables associated with managerial ownership are
significant and are respectively negative, positive and
negative; which confirms the curve relationship
between managerial risk taking and ownership.
In addition, the curve fit chart gives us a quick
visual assessment of the fit of each model to the
observed values. From this plot, it appears that the
cubic model better follows the shape of the data than
the linear and the quadratic models.
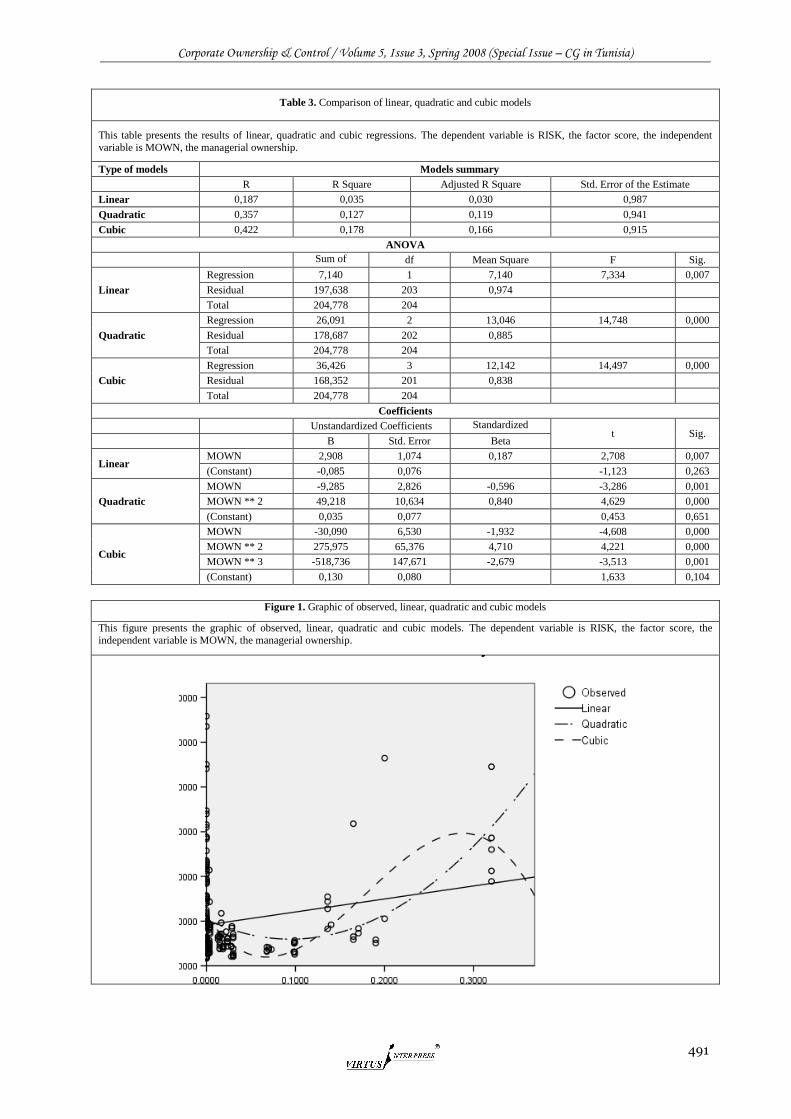
[Insert figure 1 about here]
The curve fit chart shows that the cubic model
follows the observed data points fairly well during the
observed time period. However, because of the
positive cubic term in the model, the curve is turning
upward at the end of the observed time period, so it is
highly unlikely that this model fits very well.
IV. Empirical Results
Two sets of results will be displayed and discussed in
this section: those corresponding to the construction
of the global index of managerial risk taking and
those dealing with the impact of managerial
entrenchment on managerial risk taking.
[Insert Table 4 about here]
In table 4, we present the empirical results of
the Principal Component Analysis which is pursued
to construct the score of managerial risk taking,
Corporate Ownership & Control / Volume 5, Issue 3, Spring 2008 (Special Issue – CG in Tunisia)
488
RISK. It seems that the rate of total debt to book
value of capital, LEV1, and total debt to market
value of total assets, LEV2, are the most eminent
factors of the global score. The ratio of MBV and
INV as proxies to respectively growth opportunities
and investment intensity are less eminent; the ratio of
total debt to book value of total assets, LEV3, as well.
However, the volatility of both ROA and ROE are
meaningless. But above all, all these dimensions of
risk are positively correlated with the global factor
score RISK which confirms the first hypothesis.
Besides, table 3 shows that the total explained
variance is above 76,6%; which approves of the
robustness of the score. Besides, the Kaiser-Meyer-
Olkin test, which tests whether the partial correlations
among variables are small, as well as the Bartlett's test
of sphericity, which tests whether the correlation
matrix is an identity matrix, both tests indicate that the
factor model is appropriate. The reliability analysis
(Cronbach’s Alpha) which studies the properties of
measurement scales and the items that compose the
scales also approves of the fittingness of the factor
model.
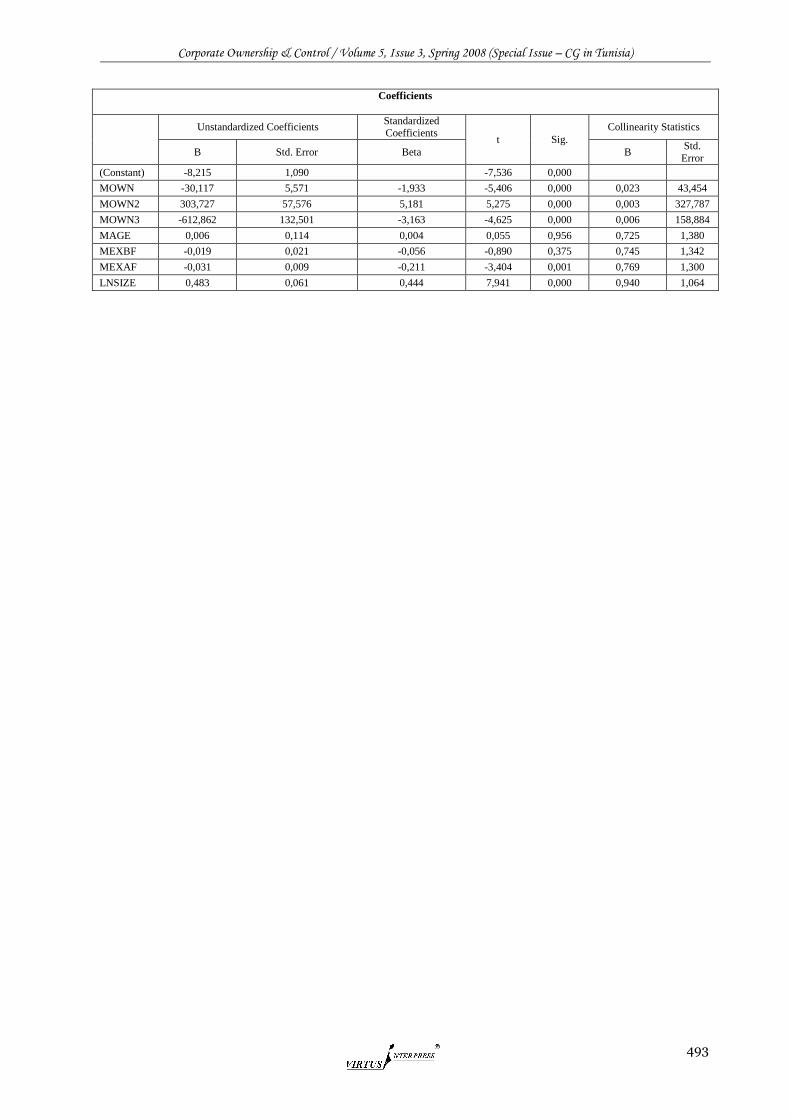
[Insert table 5 about here]
Table 5 recapitulates the regression results for
the impact of managerial entrenchment on
managerial risk taking. The model is globally robust.
The results in table 5 reveal that the coefficients
relative to managerial ownership are all significant
but above all respectively negative, positive and
negative. This provides strong support for the non
linear relationship between managerial ownership
and managerial risk taking. This result is in line with
those of Davies et al. (2005) who put in evidence the
effect of conflicting managerial incentives, and
external and internal disciplinary monitoring
mechanisms. Specifically, for low levels of
managerial ownership, external discipline and internal
controls or incentives will dominate managerial
behaviour. At intermediate levels of managerial
ownership, management interests begin to converge
with those of shareholders. However, the lack of
disciplinary control over poorly performing
management may strengthen management’s ability to
pursue sub-optimal corporate policies at intermediate
ownership levels. As levels of managerial equity
ownership grow, objectives converge further to those
of shareholders. Nevertheless, at ownership levels
below 50%, managers do not have total control of the
firm and external discipline still exists. Managers are
likely still subject to discipline from external block
shareholders. It should be pointed here that
managerial ownership in the non financial firms listed
in the Tunisian stock exchange does not exceed 30%.
Besides, our findings show that the experience
of the manager after being nominated a chairman has
a significant and a negative impact on managerial risk
taking. The more experienced the manager becomes,
the less he becomes innovative and creative, and
hence more risk averse. This result agrees with the
empirical findings of Loomes et al. (2003) and Li et
al. (2004) that risk aversion raises with experience.
However, the experience of the manager within the
firm before being nominated a chairman has not a
significant influence on managerial risk taking. The
age of the manager, as well, has no significant
impact. This result does not confirm the common
view that the older we get the more risk averse we
become. Finally, the results indicate that managers of
larger firms are more prone to invest in risky projects.
This finding is consistent with the suggestions of
Dionne and Triki (2004), Beasley et al. (2005) and
Walls (2005) who concluded that managerial risk
taking is a heavy burden for small firms.
V. Conclusion
Many researchers with different streams have worked
on risk management and proposed several theories to
explain managerial behavior. Nevertheless,
managerial risk taking does not truly appeal to
researchers. Thus this field is yet puzzling. Many
questions are either still unanswered or answered in
conflicting ways. Many others remain to be asked.
While many earlier studies refer to the governance
theory by pointing out the role of internal and external
monitoring mechanisms, many recent studies rather
emphasize the prospective theory hypotheses.
Nonetheless, few researchers have highlighted the
impact of managerial entrenchment on managerial
risk taking. But above all, the contribution of this
paper resides in providing a further insight into both
managerial entrenchment and managerial risk taking
within the emerging markets and namely within the
Tunisian Stock Exchange.
More specifically, we attempt to find answers to
the following questions: What are the main indicators
of managerial risk taking? What can reveal the
managerial entrenchment? What is the impact of
managerial entrenchment on managerial risk taking?
At first, a Principal Component Analysis is applied to
construct a global score of managerial risk taking.
This factor analysis puts in evidence that the debts
ratios are more relevant than the MBV and the
investment ratios. Neither the volatility of the ROA
nor the volatility of the ROE are significant. Secondly,
we highlight some managerial entrenchment
components that may influence managerial risk taking.
First, the results indicate a significant non linear
relationship between managerial ownership and
managerial risk taking. This reveals the effect of
conflicting managerial incentives, and external and
internal disciplinary monitoring mechanisms. Also, it
seems that managerial ownership may incite managers
to incur risks and look for new investments. It is high
time to promote stock options like in developed
countries. Besides, our findings show that the more
experienced the manager gets, the more risk averse he
becomes. Upon such result, Tunisian authorities are
recommended to urge managers not to exceed a
certain experience within the same firm so as to

Corporate Ownership & Control / Volume 5, Issue 3, Spring 2008 (Special Issue – CG in Tunisia)
489
promote the initiative and the creativity. On the other
hand, neither the anterior experience of the manager
nor his age have a significant influence on
managerial risk taking. These two criteria are thus
not so eminent while hiring a new manager. Finally,
the results indicate that managers of larger firms are
more prone to invest in risky projects. Such result
would stimulate Tunisian authorities to strengthen
the value of listed firms and assist their growth. Last
but not least, our findings would be more significant
and pertinent if the study covers all non financial
firms not only the listed ones.
References
1. Alexandre, H. et Paquerot, M., 2000, «Efficacité des
structures de contrôle et enracinement des dirigeants»,
Finance Contrôle Stratégie, 3(2), 5-29.
2. Beasley, M.S., Clune, R. and Hermanson, D.R., 2005,
«Enterprise Risk Management: An Empirical Analysis
of Factors associated with the Extent of
Implementation», Journal of Accounting and Public
Policy, 24, 521–531.
3. Beatty, R.P. and Zajac, E.J., 1994, «Managerial
Incentives, Monitoring and Risk Bearing: A Study of
Executive Compensation, Ownership and Board
Structure in Initial Public Offerings», Administrative
Science Quarterly, 39, 313-335.
4. Benzoni, L., Collin-Dufresne, P. and Goldstein, R.S.,
2006, «Portfolio Choice over the Life-Cycle when the
Stock and Labor markets are Cointegrated», Journal
of Finance forthcoming.
5. Brickley, J.A., Coles, J.L. and Jarrell, J., 1997,
«Leadership Structure: Separating the CEO and the
Chairman of the Board», Journal of Corporate
Finance, 3, 189-220.
6. Cebenoyan, A.S. and Strahan, P.E., 2004, «Risk
Management, capital Structure and Lending at Banks»,
Journal of Banking and Finance, 28, 19-43.
7. Chaganti, R. and Sambharya, R., 1987, «Strategic
Orientation and Characteristics of Upper
Management», Strategic Management Journal, 8,
393-401.
8. Chen, C.R. and Steiner, T.L., 1999, «Managerial
Ownership and Agency Conflicts: A Nonlinear
Simultaneous equation Analysis of Managerial
Ownership, Risk Taking, Debt Policy and Dividend
Policy», The Financial Review, 34, 119-36.
9. Coffee, J.C., 1988, «Shareholders versus Managers:
The Strain in the Corporate Web», In J.C. Coffee, Jr.I.
Lowenstein and S. Rose-Ackerman (Eds), «Knights,
Raiders and Targets: The Impact of the Hostile
Takeover», 77-134. New York: Oxford University
Press.
10. Coles, J.L., Naveen, D. D. and Naveen, L., 2006,
«Managerial Incentives and Risk-Taking», Journal of
Financial Economics, 79, 431-468.
11. Crutchley, C. and Hansen, R.S., 1989, «A Test of the
Agency Theory of Managerial Ownership, Corporate
Leverage, and Corporate Dividends», Financial
Management, 18, 36-46.
12. Davies, J.R., Hillier, D. and McColgan, P., 2005,
«Ownership Structure, Managerial Behavior and
Corporate Value», Journal of Corporate Finance, 11,
645-660.
13. Dionne, G. and Triki, T., 2004, «On Risk
Management Determinants: What Really Matters?»,
Working Paper, CIRPEE, 0417.
14. Donaldson, G., 1961, «Corporate Debt capacity: A
Study of Corporate Debt Policy and the Determinants
of Corporate Debt capacity», Boston: Harvard
University Press.
15. Fama, E.F., 1980, «Agency Problems and the Theory
of the Firm», Journal of Political Economy, 88, 288–
307.
16. Froot, K.A., Scharfstein, D. and Stein, J., 1993, «Risk
Management: Coordinating Corporate Investment and
Financing Policies», Journal of Finance, 48 (5),
1629–1658.
17. Garen, J.E., 1994, «Executive Compensation and
Principal Agent Theory», Journal of Political
Economy, 102, 1175-1199.
18. Gay, G. and Nam, J., 1999, «The Underinvestment
Problem and Corporate Derivatives Use», Financial
Management, 27, 53-69.
19. Gollier, C., 2002, «Time Diversification, Liquidity
Constraints, and Decreasing Aversion to Risk on
Wealth», Journal of Monetary Economics, 49, 1439-
1459.
20. Gomez-Mejia, L., 1994, «Executive Compensation: A
Reassessment and a Future Research Agenda», In G.
Ferris (Eds.), Research in Personal and Human
Resources Management, 12, 161-222, Greenwich,
CT! JAI Press.
21. Healy, P.M. and Palepu, K.G., 2003, «The Fall of
Enron», Journal of Economic Perspectives, 17, 27-50.
22. Hoskisson, R.E., Hitt, M.A. and Hill, C.W.L, 1991,
«Managerial Risk Taking in Diversified Firms: An
Evolutionary Perspective», Organization Science, 2,
296-314.
23. Howard, R.A., 1988, «Decision Analysis: Practice and
Promise», Management Science, 34 (6), 679– 695.
24. Jensen, M.C. and Meckling, W.H., 1976, «Theory of
the Firm: Managerial Behaviour, Agency Costs and
Ownership Structure», Journal of Financial
Economics, 3, 305-60.
25. Jensen, M.C. and Ruback, R.S., 1983, «The Market
for Corporate Control: the Scientific Evidence»,
Journal of Financial Economics, 11, 5 –55.
26. King, M. A. and Leape, J. I., 1987, «Asset
Accumulation, Information and Life Cycle», NBER
Working Papers, 2392.
27. Knopf, J., Nam, J. and Thornton, J., 2002, «The
Volatility and Price Sensitivities of Managerial Stock
Option Portfolios and Corporate Hedging», Journal of
Finance, 57, 801-813.
28. Kose, J., Litov, L. and Yeung, B., 2005, «Corporate
Governance and Managerial Risk Taking: Theory and
Evidence», Working Paper, New York University.
29. Leland, H., 1998, «Agency Costs, Risk Management,
and Capital Structure», Journal of Finance, 53, 1213-
1243.
30. Leuz, C., Nanda, D. and Wysocki, P., 2003, «Earnings
Management and Investor Protection: an International
Comparison», Journal of Financial Economics, 69,
506-527.
31. Li, K., Morck, R., Yang, F. and Yeung, B., 2004,
«Firm-Specific Variation and Openness in Emerging
Markets», Review of Economics and Statistics, 86,
658-669.
32. Loomes, G.C., Starwer, C.V. and Sugden, R., 2003,
«Do Anomalies Disappear in Repeated Markets? »,
Economic Journal, 113, 153–166.

Corporate Ownership & Control / Volume 5, Issue 3, Spring 2008 (Special Issue – CG in Tunisia)
490
33. Mehran, H., 1995, «Executive Compensation
Structure, Ownership and Firm Performance»,
Journal of Financial Economics, 38, 163–184.
34. Morck, R., Shleifer, A. and Vishny, R.W., 1988,
«Management Ownership and Market Valuation: An
Empirical Analysis», Journal of Financial Economics,
20, 293– 315.
35. Myers, S., 1977, «The Determinants of Corporate
Borrowing», Journal of Financial Economics, 5, 147–
175.
36. Pi, L. and Timme, S.G., 1993, «Corporate Control and
Bank Efficiency», Journal of Banking and Finance,
17 (2-3), 515-530.
37. Pigé, B., 1998, «Enracinement des dirigeants et
richesse des actionnaires», Finance Contrôle Stratégie,
1 (3), 131-158.
38. Rogers, D.A., 2005, «Management Risk-Taking
Incentives and Executive Stock Option Repricing: A
Study of US Casino Executives», Financial
Management, 34, 95-121.
39. Shavel, S., 1979, «Risk Sharing and Incentives in the
Principle and Agent Relationship», Bell Journal of
Economics, 10, 55-73.
40. Smith, C., and Stultz, R., 1985, «The Determinants of
Firms' hedging Policies», Journal of Financial and
Quantitative Analysis, 20, 391-405.
41. Tosi, H.L. and Gomez-Mejia, L., 1989, «The
Decoupling of CEO Pay and Performance: An
Agency Theory Perspective», Administrative Science
Quarterly, 34, 169-190.
42. Tufano, P., 1996, «Who Manages Risk? An Empirical
Examination of Risk Management Practices in the
Gold Mining Industry», Journal of Finance, 51, 1097-
1137.
43. Walls, M.R., 2005, «Corporate Risk Taking and
Performance: A 20 Year Look at the Petroleum
Industry», Journal of Petroleum Science and
Engineering, 48, 127-140.
44. Williamson, O.E., 1963, «Managerial Discretion and
Business Behavior», American Review, 53 (1032),
1047-1051.
45. Windram, R., 2005, «Risk-Taking Incentives: A
Review of the Literature», Journal of Economic
Surveys, 19 (1), 65-90.
46. Wiseman, R.M. and Gomez-Mejia, L.R., 1998, «A
Behavioral Agency Model of Managerial Risk
Taking», Academy of Management Review, 23 (1),
133-153.
47. Zahra, S.A., 2005, «Entrepreneurial Risk Taking in
Family Firms», Family Business Review, XVIII (1),
23-40.
Appendices
Table 1. Descriptive statistics of managerial entrenchment components
This table presents descriptive statistics for the independent variables used in our estimations. MOWN is the percentage of
managerial ownership; MEXBF is the managerial experience before being nominated a chairman; MEXAF is the managerial
experience as a chairman; MAGE is the age of the manager; it equals 1 if it is less than 40 years, 2 if it is between 40 and 60
years and finally 3 if it is over 60 years; LNSIZE is the Logarithm of the value of total assets.
MOWN MEXBF MEXAF MAGE LNSIZE MOWN
N Valid 205 206 206 206 206 205
Missing 1 0 0 0 0 1
Mean 0,7330 7,7087 2,0971 17,7172 0,0302
Median 0,0000 5,0000 2,0000 17,5982 0,0017
Std. Deviation 2,9353 6,8270 0,5590 0,9203 0,0643
Minimum 0,0000 1,0000 1,0000 16,1481 0,0000
Maximum 30,0000 29,0000 3,0000 21,0159 0,3200
Table 2. Descriptive statistics of managerial risk taking components
This table presents descriptive statistics for the components of the dependent variable RISK used in our estimations. MBV
is the market-to-book-value; INV is the total investments deflated by total assets; LEV1 is the total debt divided by book
value of capital; LEV2 is the total debt divided by the market value of total assets; LEV3 is the total debt divided by the
book value of total assets; VROA is the standard deviation of ROA for a three-year period; VROE is the standard
deviation of ROE for a three-year period; RSIK is the factor score.
MBV INV LEV1 LEV2 LEV3 VROE VROA RISK
N Valid 206 206 206 206 206 206 206 206
Missing 0 0 0 0 0 0 0 0
Mean 1,5197 0,2214 3,0863 2,1207 0,5256 0,3367 0,0261 0,0000
Median 1,2786 0,1331 1,7743 0,7732 0,4810 0,2176 0,0171 -
0,3932 Std. Deviation 0,7858 0,3655 3,5185 3,4468 0,3929 0,3478 0,0309 1,0000
Minimum 0,6556 -
1,2400 0,0832 0,0328 0,0436 0,0058 0,0002 -
0,8302 Maximum 7,0994 2,7550 23,8184 24,2568 3,1578 1,9611 0,1805 4,5838
Corporate Ownership & Control / Volume 5, Issue 3, Spring 2008 (Special Issue – CG in Tunisia)
491
Table 3. Comparison of linear, quadratic and cubic models
This table presents the results of linear, quadratic and cubic regressions. The dependent variable is RISK, the factor score, the independent
variable is MOWN, the managerial ownership.
Type of models Models summary
R R Square Adjusted R Square Std. Error of the Estimate
Linear 0,187 0,035 0,030 0,987
Quadratic 0,357 0,127 0,119 0,941
Cubic 0,422 0,178 0,166 0,915
ANOVA
Sum of
Squares df Mean Square F Sig.
Linear
Regression 7,140 1 7,140 7,334 0,007
Residual 197,638 203 0,974
Total 204,778 204
Quadratic
Regression 26,091 2 13,046 14,748 0,000
Residual 178,687 202 0,885
Total 204,778 204
Cubic
Regression 36,426 3 12,142 14,497 0,000
Residual 168,352 201 0,838
Total 204,778 204
Coefficients
Unstandardized Coefficients Standardized
Coefficients t Sig. B Std. Error Beta
Linear MOWN 2,908 1,074 0,187 2,708 0,007
(Constant) -0,085 0,076 -1,123 0,263
Quadratic
MOWN -9,285 2,826 -0,596 -3,286 0,001
MOWN ** 2 49,218 10,634 0,840 4,629 0,000
(Constant) 0,035 0,077 0,453 0,651
Cubic
MOWN -30,090 6,530 -1,932 -4,608 0,000
MOWN ** 2 275,975 65,376 4,710 4,221 0,000
MOWN ** 3 -518,736 147,671 -2,679 -3,513 0,001
(Constant) 0,130 0,080 1,633 0,104
Figure 1. Graphic of observed, linear, quadratic and cubic models
This figure presents the graphic of observed, linear, quadratic and cubic models. The dependent variable is RISK, the factor score, the
independent variable is MOWN, the managerial ownership.

Corporate Ownership & Control / Volume 5, Issue 3, Spring 2008 (Special Issue – CG in Tunisia)
492
Table 5. The determinants of managerial risk taking
This table presents results of the cubic regression. The dependent variable is RISK, the factor score. The dependent variables are MOWN,
MEXBF, MEXAF, MAGE and LNSIZE. MOWN is the percentage of managerial ownership; MEXPBF is the managerial experience before being nominated a chairman; MEXPAF is the managerial experience as a chairman; MAGE is the age of the manager; it equals 1 if it is less than
40 years, 2 if it is between 40 and 60 years and finally 3 if it is over 60 years; LNSIZE is the Logarithm of the value of total assets.
Model Summary
R R Square Adjusted R Square Std. Error of the Estimate
0,646 0,417 0,397 0,7767
ANOVA
Sum of Squares df Mean Square F Sig.
Regression 85,541 7 12,220 20,254 0,000
Residual 119,459 198 0,603
Total 205,000 205
Table 4. Construction of the score of managerial risk taking
This table presents the empirical results of the Principal Component Analysis pursued to construct the score of managerial risk taking RISK.
Component Score Coefficient Matrix(a)
Component
1
VROA 0,000
VROE 0,000
LEV1 0,572
LEV2 0,543
LEV3 0,006
MBV 0,012
INV 0,001
Rotation Method: equamax with Kaiser Normalization.
a - Coefficients are standardized.
Communalities
Raw Rescaled
Initial Extraction Initial Extraction
VROA 0,121 0,001 1,000 0,005
VROE 0,001 1,84E-005 1,000 0,019
LEV1 12,380 9,902 1,000 0,800
LEV2 11,881 9,295 1,000 0,782
LEV3 0,154 0,075 1,000 0,483
MBV 0,618 0,085 1,000 0,138
INV 0,134 0,003 1,000 0,022
Total Variance Explained
Component Initial Eigenvalues(a) Extraction Sums of Squared Loadings
Total % of Variance Cumulative % Total % of Variance Cumulative %
Raw
1 19,361 76,561 76,561 19,361 76,561 76,561
2 5,079 20,086 96,647
3 0,526 2,078 98,725
4 0,138 0,545 99,270
5 0,111 0,438 99,708
6 0,073 0,288 99,997
7 0,001 0,003 100,000
Rescaled
1 19,361 76,561 76,561 2,249 32,126 32,126
2 5,079 20,086 96,647
3 0,526 2,078 98,725
4 0,138 0,545 99,270
5 0,111 0,438 99,708
6 0,073 0,288 99,997
7 0,001 0,003 100,000
a - When analyzing covariance matrix, initial eigenvalues are the same across the raw and rescaled solution.
KMO and Bartlett's Test(a)
a - Based on correlations
Kaiser-Meyer-Olkin Measure of Sampling Adequacy 0,717
Bartlett's Test of Sphericity
301,655 301,655
21 21
0,000 0,000
Reliability Statistics Cronbach's Alpha N of Items
0,546 7
Corporate Ownership & Control / Volume 5, Issue 3, Spring 2008 (Special Issue – CG in Tunisia)
493
Coefficients
Unstandardized Coefficients Standardized Coefficients
t Sig.
Collinearity Statistics
B Std. Error Beta B Std.
Error
(Constant) -8,215 1,090 -7,536 0,000
MOWN -30,117 5,571 -1,933 -5,406 0,000 0,023 43,454
MOWN2 303,727 57,576 5,181 5,275 0,000 0,003 327,787
MOWN3 -612,862 132,501 -3,163 -4,625 0,000 0,006 158,884
MAGE 0,006 0,114 0,004 0,055 0,956 0,725 1,380
MEXBF -0,019 0,021 -0,056 -0,890 0,375 0,745 1,342
MEXAF -0,031 0,009 -0,211 -3,404 0,001 0,769 1,300
LNSIZE 0,483 0,061 0,444 7,941 0,000 0,940 1,064