Embed Size (px)
Citation preview

Does Operational Excellence Influence Small and Mid-sized Firm Performance?
Kenneth P. [email protected]
Chief EconomistManufacturing Extension Partnership
National Institute of Standards and Technology
May 2016
Paper prepared for the 2016 Industry Studies Conference
Minneapolis, MN
Research Question
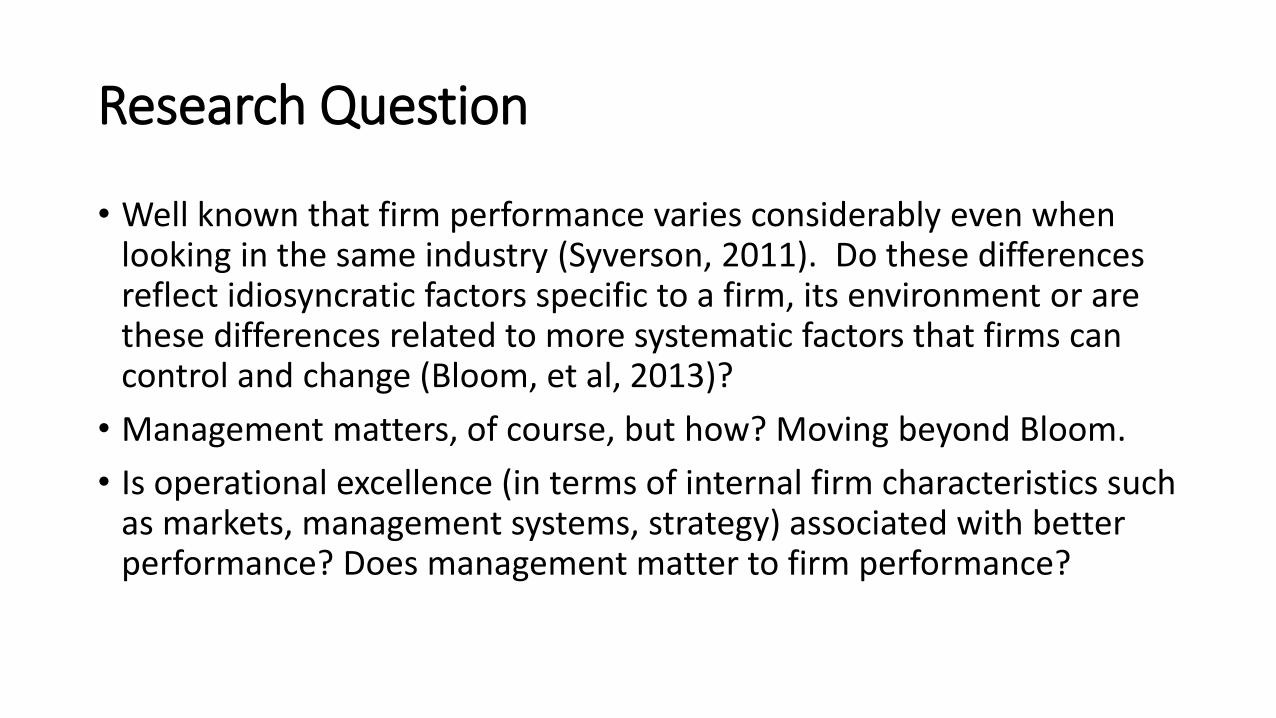
• Well known that firm performance varies considerably even when looking in the same industry (Syverson, 2011). Do these differences reflect idiosyncratic factors specific to a firm, its environment or are these differences related to more systematic factors that firms can control and change (Bloom, et al, 2013)?
• Management matters, of course, but how? Moving beyond Bloom.
• Is operational excellence (in terms of internal firm characteristics such as markets, management systems, strategy) associated with better performance? Does management matter to firm performance?
The Basic Model
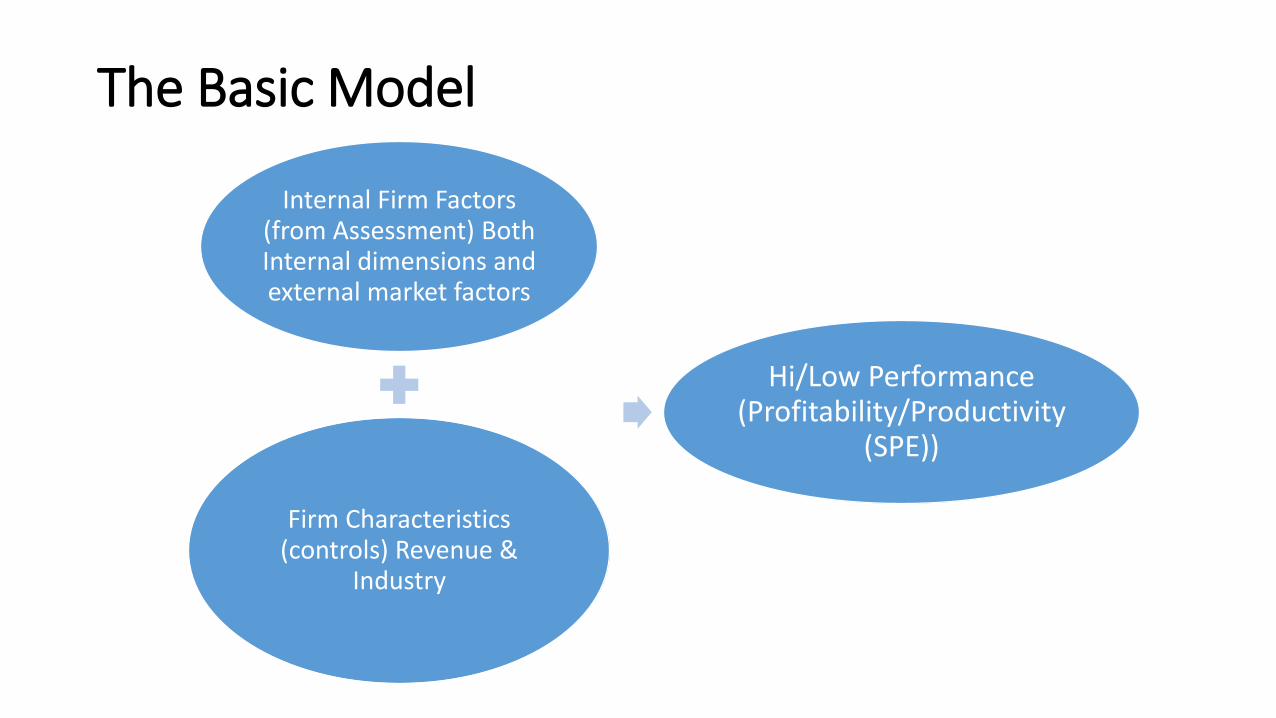
Internal Firm Factors (from Assessment) Both Internal dimensions and external market factors
Firm Characteristics (controls) Revenue &
Industry
Hi/Low Performance (Profitability/Productivity
(SPE))

Research Design
• Cross sectional correlation design.
• Basic descriptive statistics, cross-tabs, correlation, and logit models.
• Controls include firm size (revenue) and industry (mfg./non-mfg.).

About the Data
• Proprietary Data from CoreValue (N=1,456 cases: 350 Manufacturing Firms, 1,106 Non-manufacturing firms). Only have data for 500 cases with employment. Only 101 Manufacturing firms with employment.
• Self assessment (sometimes guided) on 18 key dimensions of a firm including management systems (finance, operations, legal, HR, innovation), strategy, markets (by size, market share, barriers to entry, customers), products (differentiation, brand). Likert scale (0, 3, 5, 7, & 10). How close is a company to best practice (‘0’ means no alignment whatsoever with the best practice/standard, while a ‘10’ means they are in perfect alignment).
• Performance Variables (self-reported) on Revenue, EBITDA and other information on Employment, Industry (mfg. or non-mfg.).

Basic Descriptive Statistics
Revenue EBIDTAProfit
Margin EmploymentSales Per Employee
# of Cases 1,456 1,456 1,456 500 500
Mean $11,041,312 $1,188,696 23.9% 50.7 $312,555
Std. Dev. $30,933,567 $3,590,956 71.2% 182.5 $796,167
Median $2,800,000 $300,000 11.7% 15.0 $150,000
• Smaller Firms
• Typical firm has:• Just over $11M in
revenue, • About 51 employees, • A profit margin of just
under 24%, and, • About one-quarter of
sample is in manufacturing.
• Some errors in the data (revenue, EBITDA, employment).
• Differences across the firms on self-assessment scores.

Data Analysis
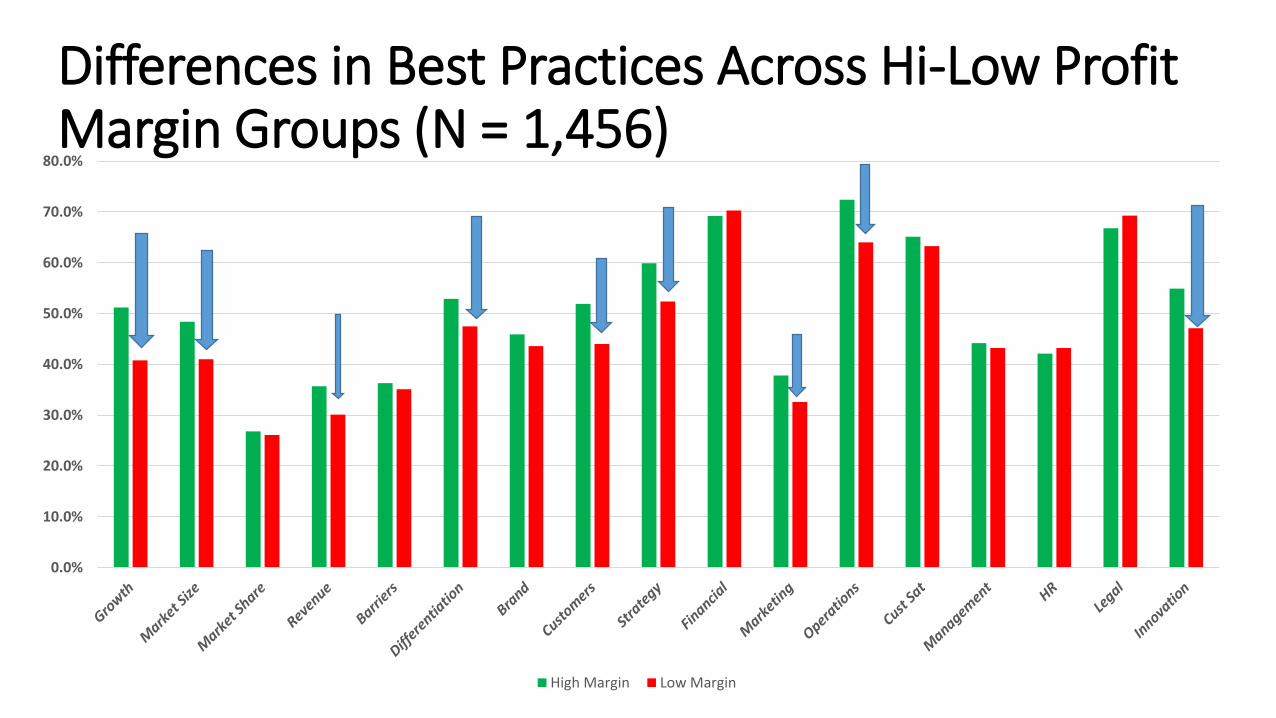
• Created groupings of firms into high and low performance categories based on median profit margin and sales per employee. Firms above median were coded as 1 (high performers) and firms below median were coded as zero (low performers).
• Created a series of dummy variables based on self assessment across 17 dimensions. Firms with an assessment of >= 7 were coded as 1 (best practice) and all others were coded as 0.
• Also compared a combined management score based on 17 dummy variables and average score (management score/17).
• Compared best practice groupings using simple bivariate correlations and differences across high/low performance groupings.
• Correlations indicated that variables such as growth, market size, customers, strategy, operations, and innovation were positive and significant related to better performance. Confirmed by other bivariate analysis (chi-square).
Differences in Best Practices Across Hi-Low Profit Margin Groups (N = 1,456)
0.0%
10.0%
20.0%
30.0%
40.0%
50.0%
60.0%
70.0%
80.0%
High Margin Low Margin

Differences in Management Score and Average Management Score Across Profit Margin Groups
8.6
7.9
7.4
7.6
7.8
8
8.2
8.4
8.6
8.8
Management Score
High Margin Low Margin
0.51
0.47
0.45
0.46
0.47
0.48
0.49
0.5
0.51
0.52
Average Management Score
High Margin Low Margin

Differences in Best Practices Across Hi-Low Sales Per Employee Groups (N = 500)
0.0%
10.0%
20.0%
30.0%
40.0%
50.0%
60.0%
70.0%
80.0%
Hi SPE Low SPE

Differences in Management Score and Average Management Score Across SPE Groups
8.4
8
7.8
7.9
8
8.1
8.2
8.3
8.4
8.5
Management Score
High SPE Low SPE
0.49
0.47
0.46
0.465
0.47
0.475
0.48
0.485
0.49
0.495
Average Management Score
High SPE Low SPE

The basic Logistic Regression Model• Dependent Variable: 1 = above median profit margin and 0 otherwise. Or SPE 1 = above median SPE and 0 otherwise
• Independent Variables: 19 variables in the model. Log of Revenue Industry Dummy 1 = Manufacturing, 0 otherwiseDummy Variables: 1 = best practice, 0 otherwise Growth Orientation Market Size Market Share Recurring Revenue Barriers Product Differentiation Brand Customer Diversification Strategy Financial Systems Marketing Systems Operations Customer Satisfaction Management Human Resources Legal Innovation

Logistic Results: Profit Margin Groups(N=1,456)B S.E. Wald df Sig. Exp(B)
GROWTH .413 .124 11.143 1 .001 1.512
MKTSIZE .125 .121 1.075 1 .300 1.133
RECREVENUE .175 .129 1.837 1 .175 1.192
BARRIERS .091 .124 .532 1 .466 1.095
DIFFERENTIATION -.022 .131 .029 1 .864 .978
BRAND -.008 .130 .004 1 .952 .992
CUSTOMERDIV .214 .126 2.885 1 .089 1.238
STRATEGY .200 .118 2.857 1 .091 1.221
FINANCIALSYS -.116 .145 .641 1 .423 .891
MARKETINGSYS .107 .131 .668 1 .414 1.113
OPERATIONS .474 .141 11.337 1 .001 1.607
CUSTSAT -.055 .133 .168 1 .682 .947
MGMTSYS -.074 .136 .294 1 .587 .929
HRSYS -.142 .135 1.111 1 .292 .867
INNOVATION .107 .130 .668 1 .414 1.113
MARKETSHARE .094 .142 .435 1 .510 1.098
LEGALSYS -.081 .144 .317 1 .573 .922
Logrev -.388 .036 118.090 1 .000 .678
MfgDummy -.144 .139 1.076 1 .300 .866
Constant 5.060 .514 96.737 1 .000 157.540
67% of the cases are correctly predictedCox & Snell R Square= .134Nagelkerke R Square = .179

Odds Ratio: Profit Margin Predictors
1.607
1.512
1.238 1.2211.133
0.678
0
0.2
0.4
0.6
0.8
1
1.2
1.4
1.6
1.8
Operations Growth Customer Diversification Strategy Recurring Revenu Log Revenue (Size)
Odds Ratio

Logistic Results: Sales Per Employee Groups (N=500)
B S.E. Wald df Sig. Exp(B)
GROWTH -.298 .234 1.623 1 .203 .743
MKTSIZE -.382 .225 2.884 1 .089 .683
RECREVENUE -.204 .254 .643 1 .423 .816
BARRIERS -.100 .236 .180 1 .671 .905
DIFFERENTIATION .465 .258 3.241 1 .072 1.591
BRAND .058 .248 .055 1 .815 1.060
CUSTOMERDIV .156 .235 .439 1 .507 1.169
STRATEGY .362 .224 2.601 1 .107 1.436
FINANCIALSYS -.415 .278 2.232 1 .135 .660
MARKETINGSYS .013 .245 .003 1 .958 1.013
OPERATIONS .610 .273 4.986 1 .026 1.841
CUSTSAT -.335 .251 1.785 1 .182 .715
MGMTSYS -.068 .256 .071 1 .790 .934
HRSYS .009 .255 .001 1 .972 1.009
INNOVATION -.010 .259 .002 1 .968 .990
MARKETSHARE -.621 .271 5.227 1 .022 .538
LEGALSYS -.238 .265 .804 1 .370 .788
Logrev .772 .085 83.415 1 .000 2.165
MfgDummy -.322 .285 1.283 1 .257 .724
Constant -10.725 1.206 79.110 1 .000 .000
72% of the cases are correctly predictedCox & Snell R Square= .264Nagelkerke R Square = .353

Odds Ratio: Sales Per Employee Predictors
2.165
1.841
1.607
1.436
0.715 0.683
0.538
0.678
0
0.5
1
1.5
2
2.5
Log Revenue (Size) Operations Differentiation Strategy Cust Sat MarketSize Market Share Financial Systems
Odds Ratio

Conclusions• Performance varies considerably.
• Industry does not seem to matter but a blunt measure. Some indication that manufacturing is related to below average performance but may reflect smaller N.
• Size does matter. But, bigger is not always better. Size is negatively related to profit margin but positively related to sales per employee...
• Management and Markets Matter. Strategy, growth orientation, operational performance, and diversified customer base are all likely to boost profit performance significantly.
• Markets share and size is negatively related to above average sales per employee performance. Product differentiation, strategy, and operational performance boost sales per employee.
• Aggregate Management Score and Avg Score are related to improved profit margin performance with controls. Mirror results above. Does not work well with Sales Per Employee.
• More modeling. Subsets. Quantile Regression as another alternative. Other measures of performance. Better measure of productivity in particular. More sample.
• Cleaning up the data. More detail. Other measures (more industry detail, ownership characteristics, etc.)
• More data (limited N since employment was a new variable being collected). Look at changes over time.

References
Bloom, et al. January 2013. Management in America. CES 13-01 Working Paper. http://www2.census.gov/ces/wp/2013/CES-WP-13-01.pdf
Bloom, N. & Van Reenen, J. (2010b). Why do management practices differ across firms and countries? Journal of Economic Perspectives, 24(1), 203-224.
Levinthal, D.A. (1997) Adaption on rugged landscapes. Management Science, 43(7), 934-950.
March, J.G. & Sutton, R.I. (1997). Organizational performance as a dependent variable. Organization Science, 8(6), 698-706.
Milgrom, P. & Roberts, J. (1990). The economics of modern manufacturing: Technology, strategy, and organization. American Economic Review, 80(3), 511-528.
Roberts, J. (2004). The modern firm: Organizational design for performance and growth. New York: Oxford University Press.
Syverson, C. (2014) The importance of measuring dispersion in firm-level outcomes. IZA World of Labor, 53, 1-10. http://wol.iza.org/articles/importance-of-measuring-dispersion-in-firm-level-outcomes-1.pdf
Syverson, C. (2011). What determines productivity? Journal of Economic Literature, 49(2), 326-365.