Embed Size (px)
Citation preview
Does Resource Wealth Cause Authoritarian Rule?
Michael L. RossVisiting Scholar, Development Research Group
World [email protected]
Assistant Professor, Political ScienceUniversity of Michigan
April 4, 2000
For presentation at Yale University, April 10, 2000. An earlier version of this paper waspresented at the World Bank Research Group workshop on “The Economics of PoliticalViolence,” Princeton University, March 18-19, 2000. Please do not cite without theauthor’s permission; comments are welcome. For their thoughtful comments on earlierdrafts, I am grateful to Pradeep Chhibber, Phil Keefer, Steve Knack, Miriam Lowi,Nicholas Sambanis, and Jennifer Widner. Special thanks to Irfan Nooruddin for hisresearch assistance and valuable advice. The views expressed in this paper are solely theauthor’s.
2
Abstract
Middle East scholars often suggest that the region’s absence of democracy is in part due
to its oil wealth. This paper examines three aspects of the “oil-impedes-democracy”
claim. First, is it true? Does oil have a consistently anti-democratic effect on states,
once other factors – such as the effects of income and Islamic culture – are accounted
for? Second, can this claim be generalized: it is true only in the Middle East, or
elsewhere as well? Do other types of minerals, and other types of commodities, have
comparable effects on governments? Finally, if oil does have anti-democratic properties,
what is the causal mechanism?
Using pooled time-series cross-national data from 105 states between 1971 and
1997, this paper finds that oil exports are strongly associated with authoritarian rule; that
this effect is not limited to the Middle East; and that other types of mineral exports have a
similar anti-democratic effect, while agricultural exports do not.
It then tests three explanations for this phenomenon: a “modernization effect,”
which holds that growth that is based on the export of oil and minerals fails to bring
about the social and cultural changes that typically produce democratic government; a
“rentier effect,” which suggests that resource-rich governments use low tax rates and
patronage to dampen democratic pressures; and a “repression effect,” which holds that
resource wealth retards democratization by enabling the government to better fund the
apparatus of repression. It finds little support for a modernization effect but significant
support for both a rentier effect and a repression effect.
3
Introduction
According to some political scientists, oil has very odd properties. Many studies show
that when incomes rise, democratic government becomes more likely. Yet often social
scientists believe there is an exception to this rule: that if rising incomes can be traced to
a country’s oil wealth, this democratizing effect will disappear. Does oil have anti-
democratic properties? What about other minerals and other commodities? How can we
explain these effects?
The claim that oil and democracy don’t mix is often invoked by area specialists to
explain why the high-income states of the Arab Middle East have not become
democratic. If true, this phenomenon could have far-reaching consequences for oil-rich
states around the world, including Nigeria, Indonesia, Venezuela, and the oil-rich states
of former Soviet Central Asia. If other minerals have similar properties, it could help
explain the absence or weakness of democracy in sub-Saharan Africa and parts of Latin
America and Southeast Asia. Yet the “oil-impedes-democracy” claim has received little
attention outside the circle of Mideast scholars; moreover, it has not been tested with
quantitative data, either within or beyond the Middle East.
This paper uses pooled time-series cross-national data from 105 states between
1971 and 1997 to explore three aspects of the oil-impedes-democracy claim. The first is
the claim’s validity: is it true? Does oil have a consistently anti-democratic effect on
states, once other factors are accounted for?
Second, the paper examines the claim’s generality. Does oil effect regime types
only in the Middle East, or elsewhere as well? Do other types of minerals, and other
types of commodities, have comparable effects on governments? Does resource wealth
influence all states or only small states?
4
Finally, the paper explores the claim’s causality: if oil does have anti-democratic
properties, what is the causal mechanism? This paper tests three possible explanations: a
“modernization effect,” which holds that growth that is based on the export of oil and
minerals fails to bring about the social and cultural changes that typically produce
democratic government; a “rentier effect,” which suggests that resource-rich governments
use low tax rates and patronage to allay demands for greater accountability; and a
“repression effect,” which holds that resource wealth retards democratization by enabling
governments to better fund the apparatus of repression.
The paper has three aims. The first is to help resolve a debate among area
specialists over the absence of democracy in the Middle East. In the 1990s a vigorous
debate emerged among Mideast scholars over why the region was so little affected by the
“third wave” of democratic transitions, which had brought new democracies to much of
the developing world. Perhaps the sharpest dispute was between advocates of a cultural
approach, who suggested that Islamic or Arab culture was unfriendly towards democracy
[Sharabi 1988; Hudson 1995]; and proponents of a political economy approach, who
argued that the region’s oil wealth impeded democracy by allowing governments to keep
taxes low and buy off dissenters [Crystal 1990; Anderson 1995a].
This debate has been difficult to resolve, in part, for methodological reasons:
virtually all of the region’s states have been highly authoritarian since independence,
giving Mideast scholars almost no variation on the dependent variable (regime type) and
hence little leverage in testing their arguments. This paper seeks to advance the debate
by testing the cultural and political economy arguments with panel data from a global set
of states, and using a dummy variable for the Mideast to control for region-specific
effects.
5
The second aim is to help narrow the gap between Middle East area specialists and
scholars of comparative democracy. Most ‘global’ studies of democratization have
overlooked the Mideast entirely [O’Donnell, Schmitter, and Whitehead 1986; Diamond,
Linz, and Lipset 1988; Inglehart 1997]. Influential studies by Przeworski and Limongi
[1997] and Przeworski, Alvarez, Cheibub, and Limongi [1996] simply drop the oil-rich
Mideast states from their database, treating them as outliers whose exclusion requires no
explanation. Global explanations of democracy should not exclude whole categories of
states unless the states are truly exceptional – that is, they are affected by variables that
have no influence elsewhere. This paper shows that the Mideast is less exceptional than
both democracy scholars and area specialists often assume; and demonstrates how the
region’s oil-rich states can be better incorporated into global studies of democracy.
The paper also emphasizes some of the insights of Mideast scholars into the
sources of democratization – insights that have been overlooked by the democracy
literature, but which may have far-reaching consequences. This paper tests several of the
arguments advanced by area scholars and shows them to be both valid and general.
Perhaps the most compelling is that governments that maintain low personal and
corporate taxes, and have generous budgets for patronage, are likely to become less
democratic than governments with higher taxes and lower spending.
Finally, the paper addresses the growing literature on the problems of resource-rich
states. Many of the poorest and most troubled states in the developing world have,
paradoxically, high levels of natural resource wealth. There is a growing body of
evidence that resource wealth can have a harmful effect on a country’s development
prospects: states with greater natural resource wealth tend to grow more slowly than their
resource-poor counterparts [Sachs and Warner 1995, 1999; Leite and Weidmann 1999;
6
Ross 1999]; they are also more likely to suffer from civil wars [Collier and Hoeffler
1998]. This paper suggests there is a third leg to this “resource curse”: that resource-rich
states are less likely to become democratic than their resource-poor counterparts.
The paper begins by contrasting the ways that Mideast specialists and democracy
scholars have addressed the oil-impedes-democracy claim. It then outlines three causal
mechanisms that might explain it. The third section presents a model of regime types and
describes the research design. Section four presents the results, and section five
concludes.
1. The Concept of the “Rentier State”
Area specialists often describe the governments of the Mideast and North Africa as
“rentier states,” since they derive a large fraction of their revenues from external rents.1
More than half of government revenues in Saudi Arabia, Bahrain, the United Arab
Emirates, Oman, Kuwait, Qatar and Libya have, at times, come from the sale of oil.
Jordan, Syria, and Egypt earn large locational rents through payments for pipeline
crossage, transit fees, and passage through the Suez Canal. Workers’ remittances have
been an important source of foreign exchange in Egypt, Yemen, Syria, Lebanon, Tunisia,
Algeria, and Morocco, although these rents go (at least initially) to private actors, not the
state. The foreign aid that flows to Israel, Egypt, and Jordan may also be considered a
type of economic rent.
1 Throughout this paper I use the term “Middle East” to include North Africa. I adopt the World Bank’sdefinition of this region: Algeria, Bahrain, Egypt, Iran, Iraq, Israel, Jordan, Kuwait, Lebanon, Libya, MaltaMorocco, Oman, Qatar, Saudi Arabia, Syria, Tunisia, United Arab Emirates, and Yemen.
7
Economists used the term “rentier state” in the early 20th century to refer to the
Europe states that extended loans to non-European governments.2 Mahdavy [1970, 428]
is widely credited with giving the term its current meaning: a state that receives
substantial rents from “foreign individuals, concerns or governments.” Beblawi [1987,
51] later refined this definition, suggesting that a rentier state is one where the rents are
paid by foreign actors; where they accrue directly to the state; and where “only a few are
engaged in the generation of this rent (wealth), the majority being only involved in the
distribution or utilization of it.”
There are two main variants of the rentier state claim. One is that rentier states are
less likely to become democratic; the other is that they do a poor job of promoting
economic development. This paper discusses the first claim.3
According to Anderson [1987, 9], “The notion of the rentier state is one of the
major contributions of Middle East regional studies to political science.” Indeed, some
scholars of comparative democracy use a version of this argument to account for the
otherwise-puzzling states of the Middle East; yet they show no agreement on why oil
might impede democratization. In his seminal article on the “third wave” of democratic
transitions, Huntington [1991, 31-32] suggests that the democratic trend may bypass the
Middle East since many of these states “depend heavily on oil exports, which enhances
the control of the state bureaucracy.” Barro’s [1999] model of democracy includes a
dummy variable for states that derive at least two-thirds of their export income from oil,
and produce at least one percent of world oil exports; he explains that “the idea here is
that the income generated from natural resources such as oil may create less pressure for
2 According to Lenin [1917 (1975), 253], “The rentier state is a state of parasitic, decaying capitalism, andthis circumstance cannot fail to influence all the socio-political conditions of the countries concerned.”3 Ross [1999] discusses the second claim.
8
democratization than income associated with the accumulation of human and physical
capital [S164].” Quantitative studies of democracy by Przeworski and Limongi [1997]
and Przeworski, Alvarez, Cheibub, and Limongi [1996] drop the oil-rich Mideast states
from their database with no explanation – assuming, perhaps, that the political anomalies
created by oil wealth are self-evident.
The concept of the rentier state – and its associated implications about the anti-
democratic properties of oil – may well be one of the major contributions of area scholars
to political science. Yet three types of questions about the claim have not been carefully
investigated. First are questions about the argument’s validity: is it true? The rentier
state hypothesis is difficult to test in the Middle East because the region provides scholars
with little variation on the dependent variable: virtually all of the region’s governments
have been highly authoritarian since gaining independence. Moreover, there are other
plausible explanations for the Mideast anomaly, the most obvious being region’s large
Islamic population. In other words, it is hard to be confident that oil is a significant
obstacle to democratization in the Mideast, when almost all research on this topic has
been confined to case studies of Islamic, oil-rich, Middle Eastern autocracies.
There are also unaddressed questions about the claim’s generality. If oil does hurt
democracy, does this only occur in the Middle East or also in other regions? It is not
surprising that interest in the rentier state concept has largely been restricted to Mideast
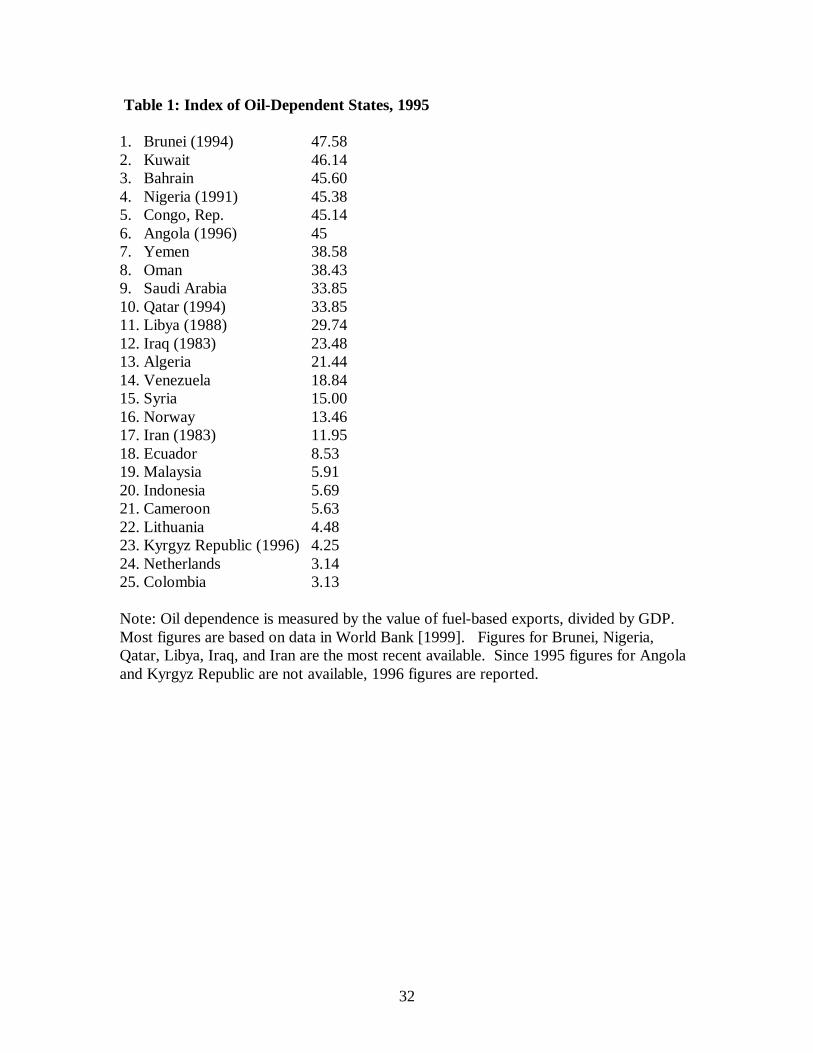
specialists: ten of the fifteen states most dependent on oil wealth – measured by the value
of 1995 oil exports as a percentage of GDP – are in the Middle East region [Table 1].
Still, if the rentier state hypothesis is true for all oil exporters, then its importance has
been underappreciated by non-Mideast specialists. If it only holds for states in the
Middle East, then Mideast specialists should explain why this would be so.
9
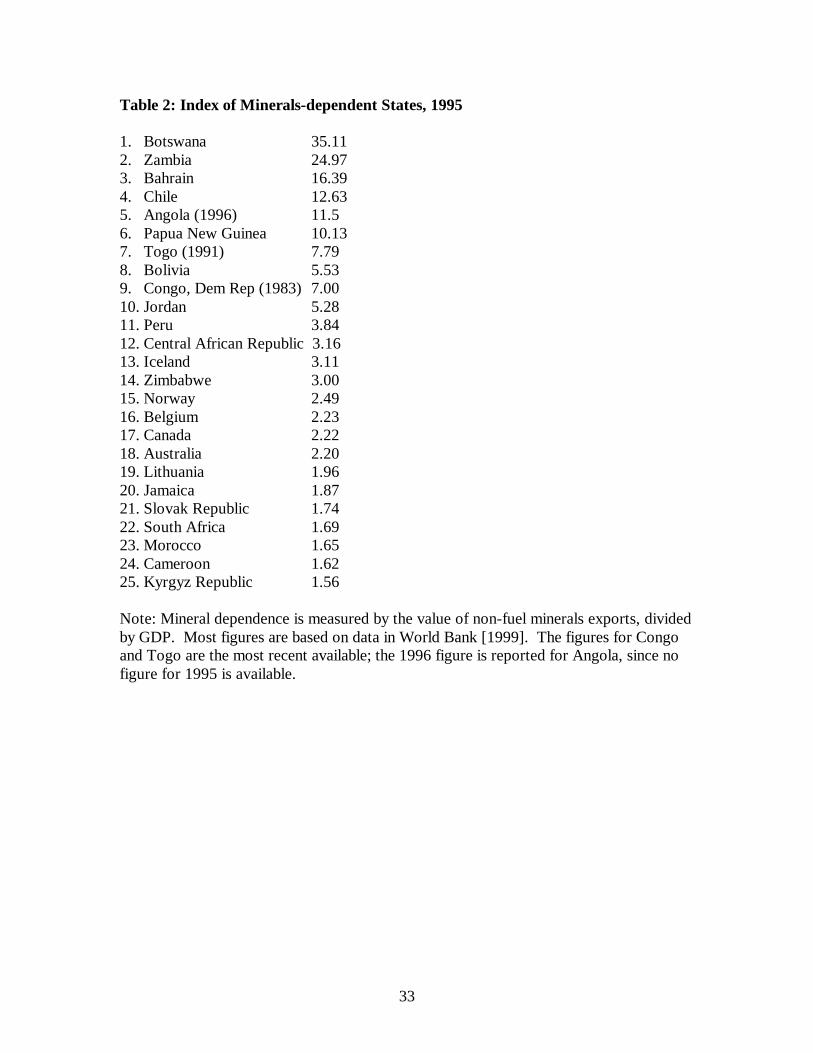
A different question of generality is whether these anti-democratic effects are
restricted to oil, or whether they extend to other types of other commodities such as
nonfuel minerals and agricultural goods. Recall that Beblawi defines a rentier state as
one that receives substantial rents from foreign actors; where the rents accrue directly to
the state; and where only a few are engaged in the generation of these rents. These
conditions apply to both oil and minerals exporters [Table 2]. Yet they do not apply to
most exporters of agricultural commodities: these commodities generally do not produce
rents; in most cases, export revenues go directly to private actors, not the state; and
agricultural production is far more labor-intensive than mineral production, and hence
employs a larger fraction of the population for a given value of exports.4
2. Causal Mechanisms
If oil does thwart democracy, how does this process occur? Modernization theory offers
one possible cause, which might be called the “modernization effect.” Mideast
specialists tend to favor a different argument, which might be called the “rentier effect.”
A close reading of case studies, particularly in Africa, suggests a third alternative: a
“repression effect.”
The Modernization effect
Modernization theory holds that democracy is caused by a collection of social and
cultural changes – including higher levels of urbanization, education, and occupational
specialization – which in turn is caused by economic development [Lipset 1959; Deutsch
4 Note that, by contrast, dependency theory suggests that developing states are politically constrained bytheir reliance on the export of all types of primary commodities to advanced industrialized states [Cardoso
10
1961 Inglehart 1997]. Different scholars weigh these intervening variables differently;
perhaps the most carefully investigated claim comes from Inglehart [1997, 163], who
argues that two aspects of social change have a strong effect on the likelihood that a state
will become democratic:
1. Rising education levels, which produce a more articulate public that is betterequipped to organize and communicate, and2. Rising occupational specialization, which first shifts the workforce into thesecondary sector and then into the tertiary sector. These changes produce a moreautonomous workforce, accustomed to thinking for themselves on the job andhaving specialized skills that enhance their bargaining power against elites.
Modernization theory does not address the question of resource wealth per se; but
an implicit corollary is that when economic development does not produce the specified
cultural and social changes, it will not result in democratization. As Inglehart [1997,
161] notes, “Is the linkage between development and democracy due to wealth per se?
Apparently not: if democracy automatically resulted from simply becoming wealthy, then
Kuwait and Libya would be model democracies.” Resource-led growth might fail to
bring about democracy if it raises incomes without triggering the types of social and
cultural changes – including higher education levels or greater occupational
specialization – that eventually lead to more accountable governments.
The Rentier Effect
A second causal mechanism comes from the work of Middle East scholars, who have
thought carefully about this problem for over two decades.5 Several of them argue for
what might be called a “rentier effect,” by which a government uses its abundant
and Faletto 1979; Evans 1979; Bollen 1983]. Advocates of this view might expect that a state’s regimetype is correlated with its dependence on all types of primary commodities.5 Perhaps they have thought about it too carefully. Chaudhry [1997, 187] notes that “theories of the rentierstate far outstrip detailed empirical analysis of actual cases.”
11
resources to relieve social pressures that might otherwise lead to demands for greater
accountability. There are at least three ways this may occur.6
The first is a “taxation effect.” It suggests that when governments derive sufficient
revenues from the sale of oil, they are likely to tax their populations less heavily, or not at
all; in the absence of taxation, the public will become less likely to demand
accountability from – and representation in – their government [Luciani 1987, Anderson
1995b].
The argument’s logic is grounded in studies of the evolution of democratic
institutions in Western Europe; scholars there have portrayed the public demand for
representation in government as a response to the sovereign’s demand for taxes [Tilly
1975; North and Weingast 1989]. Some scholars have used case studies to look for
similar correlations in the Mideast between variations in tax levels and variations in the
demand for political accountability. Crystal [1990] found that the discovery of oil made
the governments of Kuwait and Qatar less accountable to the traditional merchant class.
Brand’s [1992] study of Jordan argued that a drop in foreign aid and remittances in the
1980s led to greater pressures for political representation. Yet Waterbury [1994, 29]
sounded a note of skepticism, arguing that in the Middle East
Neither historically nor in the twentieth century is there much evidence thattaxation has evoked demands that governments account for their use of tax monies.Predatory taxation has produced revolts, especially in the countryside, but there hasbeen no translation of tax burden into pressures for democratization.
A second component might be called the “spending effect”: that oil wealth leads to
greater spending on patronage, which in turn dampens latent pressures for greater
6 There is no consensus among Mideast specialists on the relative validity of these three effects; I treatthem here as complementary.
12
democratization.7 Entelis [1976], for example, argues that the Saudi Arabian government
used its oil wealth for spending programs that helped reduce pressures for democracy.
While all authoritarian governments may use their fiscal powers to alleviate dissent, these
scholars imply that oil wealth provides Middle East governments with budgets that are
exceptionally large and “soft” [Anderson 1995a]. Mideast rulers may follow the same
tactics as their authoritarian counterparts elsewhere, but oil revenues make their actions
more effective.
The logic of the spending effect is slightly different than the logic of the taxation
effect. The taxation effect implies that in the absence of a grievance (taxes) the public
will not bother to demand representation, suggesting that the population has no intrinsic
desire for representation in government. The spending effect implies that citizens do
have latent democratic impulses, but that these are subverted by government payoffs.
The third component might be called a “class formation” effect. It holds that when
oil revenues provide a government with sufficiently abundant revenues, the government
will use its largesse to prevent the formation of social groups that are independent from
the state, and hence have reason to demand political rights. These arguments are rooted
in Barrington Moore’s [1966] claim that the formation of an independent bourgeoisie
helped bring about democracies in England and France. Scholars examining the cases of
Algeria [Moore 1976], Libya [First 1980], Tunisia [Bellin 1994], Iran [Shambayati 1994]
and the Republic of Congo [Clark 1997] have all observed oil-rich states precluding the
formation of independent social groups; all argue that the state is thereby blocking a
necessary precondition of democracy.
7 Lam and Wantchekon [1999] develop a formal model that makes a similar point, showing how resourcewealth can impede democracy by enhancing the distributive influence of an elite.
13
Whether these states acted deliberately or not is a matter of some disagreement. In
the case of Libya, First [1980, 137] suggests “there is not a consistent policy against the
development of an indigenous bourgeoisie, but the growth of this class is in practice
constrained by the state’s own economic ventures and its links with international capital.”
Chaudhry [1994, 19], on the other hand, argues that in the 1970s the Mideast
governments used their oil revenues to develop programs that were “Explicitly designed
to depoliticize the population… In all cases, governments deliberately destroyed
independent civil institutions while generating others designed to facilitate the political
aims of the state.”
Although the class formation argument has Marxist roots, in practice it is similar to
the spending argument: governments tend to obstruct democratization through their
munificence, either by paying off potential dissenters (the spending effect) or by
hindering the formation of economically independent social classes (the class formation
effect). With a slightly updated terminology, it could also be phrased as a “social
capital” argument: resource-rich governments may be so large and free-spending that
they inhibit the formation of social capital – civic institutions that lie above the family
and below the state – and hence block the transition to democracy.
The rentier effect implies that a state’s fiscal policies will systematically influence
its regime type: governments that fund themselves through personal and corporate taxes,
and are relatively lean, are more likely to become democratic; governments that fund
themselves through trade taxes and parastatals, and have more generous budgets, are
more likely to be authoritarian.
The Repression Effect
14
Finally, oil wealth and authoritarianism may be linked by repression. Citizens in
resource-rich states may want democracy just as much (or as little) as citizens elsewhere,
but resource wealth may cause their governments to invest more heavily in the apparatus
of repression. There is some evidence from case studies of a repression effect. Skocpol
[1982] notes that much of Iran’s pre-1979 oil wealth was spent on the military, producing
a “rentier absolutist state.” In his study of the Republic of Congo’s oil boom in the 1990s,
Clark [1997] finds that the surge in revenues allowed the government to build up the
armed forces and train a special presidential guard to help maintain order. Gause [1995]
argues that Middle East democratization has been inhibited, in part, by the prevalence of
the mukhabarat (national security) state.
There are at least three reasons why resource wealth might lead to higher levels of
military spending. One is that given the opportunity to better arm itself against popular
pressures, an authoritarian government will readily do so. A second is that resource-rich
states may be more prone to warfare, perhaps to defend their wealth from others. Either
of these dynamics could help explain the persistence of authoritarian rule in the Mideast.
As Waterbury [1994, 26] notes,
Whether the extraordinary burden of arms and outsized militaries [in the MiddleEast] has resulted from or been the cause of [the region’s wars], the fact remainsthat Middle Eastern praetorians have dominated the political scene to a degree andwith a technological impregnability that ‘tin-pot’ African dictators or LatinAmerican caudillos could seldom boast.
A third reason for high military expenditures may be ethnic or regional conflict,
particularly in states outside the Mideast. Mineral wealth is often geographically
concentrated; if it happens to be concentrated in a region populated by an ethnic or
religious minority, resource extraction may promote or exacerbate ethnic tensions, as
federal and regional actors compete for authority over mineral rights. These disputes
15
may lead to higher military spending and less democracy in resource-rich, ethnically
fractured states such as Angola, Burma, the Democratic Republic of Congo, Indonesia,
Nigeria, Papua New Guinea, Sierra Leone, and South Africa. This mechanism would be
consistent with the findings of Collier and Hoeffler [1998] that natural resource wealth
tends to make civil war more likely.
3. Model Specification and Research Design
To test questions about the validity, generality, and causal mechanisms behind the oil-
impedes-democracy claim, I develop a model to predict regime types and test it using a
generalized least-squares method with a pooled time-series cross-national data set, which
includes data on all sovereign states with populations over 100,000 between 1971 and
1997.
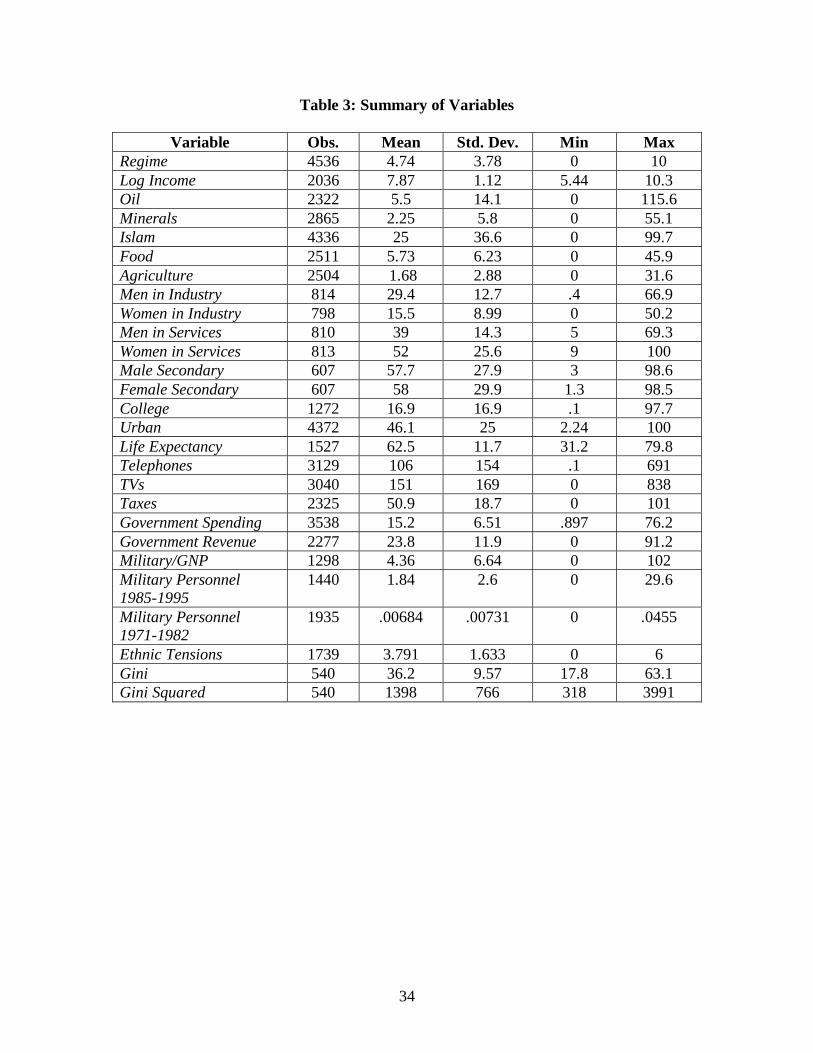
For the basic model described below, the data set is able to utilize 1422 country-
year observations from 105 states, out of a possible 3897 observations from 158 states.
The data for each of the variables is summarized in Table 3.
The basic regression model is:
Regimei,t = a1 + b1(Regimei,t-5) + b3(Oili,t-5) + b4(Mineralsi,t-5) + b2(log Incomei,t-5) + b5
(Islami) + b6(OECDi)
where i is the country and t is the year.
The dependent variable, Regime, is constructed from the Polity98 data set compiled
by Gurr and Jaggers. Gurr and Jaggers present two 0-10 interval scale variables,
DEMOC and AUTOC. Each one is a composite of underlying variables that measure the
way chief executives are recruited, whether they gain office through competitive
elections, whether non-elites may obtain executive office, and whether they are
16
constrained by, and accountable to, other actors. The DEMOC variable differentiates
among states that are relatively democratic, while the AUTOC variable differentiates
among authoritarian states. Since the two indicators contain separate, non-overlapping
types of information about each country-year, I combine them into a single measure by
subtracting the autocracy measure from the democracy measure.8 I then rescale it as a 0
to 10 variable, with 10 representing “most democratic.”
Oil and Minerals are my independent variables; they measure the export value of
mineral-based fuels (petroleum, natural gas, and coal), and the export value of non-fuel
ores and metals exports, as a fraction of GDP. These variables capture both the
importance of fuels and minerals as sources of export revenue, and their relative
importance in the domestic economy. They are similar to the indicators used by Sachs
and Warner [1995, 1999] and Leite and Weidmann [1999] in their studies of the
influence of resource wealth on economic performance. While Sachs and Warner
combine fuels, non-fuel minerals, and agricultural goods into a single variable, I place
them in separate variables to see if their regression coefficients (and hence their influence
on regime types) differ.
On the right-hand side I include log Income, the natural log of per capita GDP
corrected for purchasing power parity (PPP), in current international dollars. Per capita
income has been widely accepted as a correlate of democracy since Lipset [1959]; its
validity has been confirmed in more recent tests by Burkhart and Lewis-Beck [1994],
Londregan and Poole [1996], Przeworski and Limongi [1997], and Barro [1999].
8 Here I am following the practice of Londregan and Poole [1996].
17
Also on the right hand side is the variable Islam, which denotes the Muslim
percentage of the state’s population in 1970.9 Previous studies have suggested that states
with large Muslim populations tend to be less democratic than non-Muslim states
[Salamé 1994, Lipset 1994, Midlarsky 1998]. Of all the religious categories tested by
Barro [1999], Islam (measured the same way with the same data set) had by far the
largest and most statistically significant influence on a state’s regime type.10 Including
Islam as a variable in this model has special importance because many states with great
mineral wealth also have large Muslim populations – not only in the Middle East, but in
parts of Asia (Indonesia, Malaysia, Brunei) and Africa (Nigeria).11
The model also includes the variable OECD, a dummy that is coded 1 for states
that are members of the Organization for Economic Cooperation and Development
(excluding new members Mexico and South Korea) and 0 for all others. Previous
researchers have found that the advanced industrialized states of the OECD are
significantly more likely to be democratic in the post-World War II era than the states of
the developing world, even after the influence of income and other factors are accounted
for [Burkhart and Lewis-Beck 1994, Londregan and Poole 1996, Przeworski and
Limongi 1997]. There is no consensus on why this is so. It has variously been attributed
to the West’s unique historical trajectory [Moore 1966]; the cultural influence of
Protestantism [Lipset 1959, Huntington 1991]; the residual effects of Western
9 In virtually all cases, the figure for 1980 (the only other year for which data were available) was identicalto the 1970 figure.10 Observers offer different arguments to explain the negative correlation between democracy and Islamicpopulations (=-.38); see, for example, Sharabi [1988]; Lewis [1993]; and Hudson [1995]. There is noreason to assume that Islam and democracy will continue to be negatively correlated in the future. Twostates with large Islamic populations, Nigeria and Indonesia, have recently moved towards democracy, andsome of the most important pro-democracy forces in other Islamic states (including Algeria, Egypt,Malaysia) draw on strong Islamic traditions. It is instructive to recall that until the ‘third wave’ ofdemocratization began in the mid-1970s, democracy and Catholicism were negatively correlated.11 The simple correlation between Oil and Islam is .44
18
colonialism on non-Western states [Dahl 1971]; and a “world system” that constrains the
prospects of states in the non-Western “periphery” [Wallerstein 1974; Bollen 1983;
Burkhart and Lewis-Beck 1994]. Conceivably any anti-democratic effects from Oil and
Minerals might be spurious, and simply reflect the location of most fuel and minerals
exporting-states in the non-Western world. The OECD dummy helps account for any of
these Western-specific effects, without taking a position on the mechanisms behind it.
Finally on the right-hand side is Regimet-5, which is a lagged version of the
dependent variable. Placing it on the right-hand side of the model helps capture any
country-specific historical or cultural features that may influence the state’s level of
democracy.
The tests are run with a feasible generalized least-squares process using Stata 6.0.
Since I include a lagged dependent variable on the right-hand side of the equation, I
correct for first-order autocorrelation using a panel-specific process, which allows the
degree of autocorrelation to vary from country to country.
I use a five-year lag for all independent and control variables. The five-year lag
provides greater confidence that the direction of causality is correctly specified; it also
reflects the model’s effort to account for factors that have an enduring impact on regime
types. Using shorter lags does not change the significance of the results, although it tends
to increase the coefficient of the lagged dependent variable relative to the other
explanatory variables. Hence with shorter lags, a country’s regime type becomes
overwhelmingly a function of its regime type in the previous period, a finding that is
unenlightening.
19
4. Results
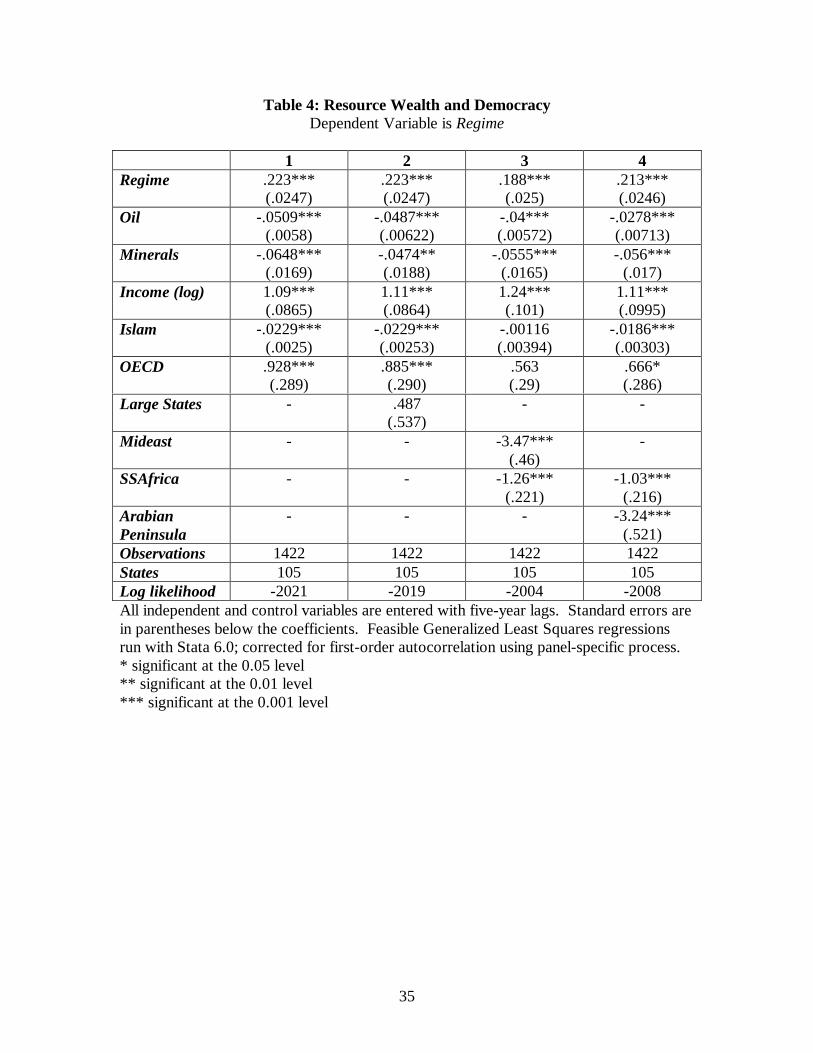
The results of the basic model are reported in Table 4, column 1. All of the variables are
highly significant with the expected signs. Both Oil and Minerals have strong anti-
democratic effects; these effects are of roughly the same magnitude, although the
Minerals coefficient is somewhat larger.
To determine how general this effect is, I carry out several tests. To see whether
other types of commodity exports also inhibit democratization, two variables were added
to the model: Food, which measures the value of all food exports as a fraction of GDP;
and Agriculture, which measures the value of all non-food agricultural exports as a
fraction of GDP. Neither variable is significant, either when entered directly or
transformed.12 This is consistent with the rentier state thesis: oil and other minerals
impede democracy, but other primary commodities – which generate few or no rents,
produce less export income for the state, and entail greater employment – have no effect.
The next test was designed to see if the model was heavily influenced by the
inclusion of small states in the sample. Some of the states most dependent on oil have
small populations, including Brunei, and the Persian Gulf states of Bahrain, Kuwait,
Qatar, and the United Arab Emirates; it would not be surprising if they had a large
influence on the magnitude and significance of the Oil variable. To determine this a
dummy variable, Large States, was added to the model; it was coded 0 if a state’s
population was below one million and one otherwise. The results are displayed in Table
4, Column 2. The coefficient on the population dummy is positive but not significant; its
inclusion reduces the Oil and Minerals coefficients by four percent and 28 percent
respectively, but leaves them highly significant.
12 Results available from author on request.
20
I then tested the model to see if the apparent effects of Oil and Minerals were
caused by unspecified cultural or historical impediments to democratization in the Middle
East and Sub-Saharan Africa, two regions where these states are concentrated. I added
two dummy variables to the regression, Mideast and SSAfrica, which were coded 1 if the
states were classified by the World Bank as residing in these regions and zero otherwise.
The results are listed in column 3 of Table 4. The coefficients for both Mideast and
SSAfrica are large, negative, and highly significant. The coefficients on the Oil and
Minerals variables are again reduced but remain highly significant. The Islam variable
loses significance, due to its high correlation with the Mideast variable (=.65).
For the final test, I used a new dummy, Arabian Peninsula, in place of the Mideast
dummy; it was coded one for the seven oil-rich states on the Saudi Arabian Peninsula
(Bahrain, Kuwait, Oman, Saudi Arabia, Qatar, the United Arab Emirates, and Yemen)
and zero otherwise. Conceivably the Mideast dummy is too broad, since it attempts to
capture the effects of residing in a region that is socially and geologically relatively
diverse. The anti-democratic effects of oil might instead be restricted to the Arabian
Peninsula, which is dominated by monarchies, sparsely populated, and endowed with
spectacular oil wealth. Using Arabian Peninsula instead of Mideast reduces the problem
of collinearity with Islam (=.44), although Arabian Peninsula and Oil remain highly
collinear (=.74). Still, while including the Arabian Peninsula dummy reduces the Oil
coefficient by about half, Oil remains highly significant.
These tend to confirm both the validity and generality of the rentier state
hypothesis. The hypothesis predicts that a state’s reliance on oil exports will make it less
democratic; that a similar effect should be found in states that rely on nonfuel minerals
exports; that this effect should not occur in states that rely on other types of primary
21
exports; and that these effects will not be limited to the Mideast. All of these predictions
are consistent with these tests. Moreover, the anti-democratic properties of oil and
mineral wealth are powerful: a single standard deviation increase in the Oil variable
produces a .72 drop in the 0-10 democracy index. A standard deviation rise in the
Minerals variable leads to a .38 drop. A state that is highly reliant on oil exports – at the
1995 level of Angola, Nigeria, or Kuwait – is predicted to lose 2.3 points on the
democracy scale. A mineral-exporting state at the same level would lose 2.9 points.
4. Causal Mechanisms
To test the three causal mechanisms I add a series of intervening variables, lagged by one
year, to the basic model. Adding new variables reduces the sample size from 1422
observations to between 1410 and 299 observations. As the sample shrinks, it becomes
increasingly skewed towards states that are relatively wealthy, democratic, and Western,
introducing a pronounced sample bias. To minimize this problem, after running each of
the following regressions, a second regression is created using the same, reduced sample,
but without the intervening variable. The results of the two regressions are then
compared; if the intervening variable is valid, it should be statistically significant, and its
inclusion should reduce the absolute values of the Oil and Minerals coefficients.
Modernization Effect
To test the modernization hypothesis I use eleven indicators to determine whether
abnormally low levels of occupational specialization, urbanization, education,
communications technology, and nutrition and health can help explain the dearth of
democracy in the resource-rich states.
22
To measure occupational specialization I look at the number of men and women in
the economy’s secondary (industrial) and tertiary (services) sectors, as a fraction of the
men and women in the economically active population. These data are drawn from the
International Labor Organization and cover 63 countries. According to Inglehart [1997,
163], the movement of the labor force into the industrial and service sectors produces “a
more autonomous workforce, accustomed to thinking for themselves on the job and
having specialized skills that enhance their bargaining power against elites,” which in
turn tends to promote a more democratic government.
For educational levels, I use figures on the enrollment of men and women in
secondary school, as a fraction of the corresponding age group in the population at large;
and college enrollment as a fraction of the population. Both data sets are collected by
national governments and assembled by the United Nations Educational, Scientific, and
Cultural Organization (UNESCO). Figures on secondary enrollment are available for 44
countries; figures on college enrollment are available for 91 countries. Inglehart [1997,
163] suggests that rising education levels “produce a more articulate public that is better
equipped to organize and communicate,” and hence more likely to demand accountable
government.
I measure levels of nutrition and health by using a variable that measures life
expectancy at birth. The underlying data are compiled by several UN agencies and cover
90 states. Proponents of modernization theory suggest that the quality of a population’s
physical health should be linked to democratization [Lerner 1958, Deutsch 1961. More
recently Inglehart [1997, 87] argues that as a society’s basic needs are satisfied – in terms
of nutrition, good health, and high life expectancy – they will increasingly turn to
“postmaterialist” values, including a desire for self-expression and individual freedom;
23
this value shift, in turn, will facilitate more democratic government. Earlier scholars
measured the quality of a population’s health by using the number of doctors per capita
[Lipset 1959]; life expectancy at birth is a superior measure since it better accounts for
nutrition, women’s health care, and a multitude of other factors.
To determine how “modern” a society’s communications technology is, I measure
the number of telephone mainlines and televisions per capita. In Lipset’s [1959] classic
analysis, the greater a society’s level of “media participation,” the more likely it is to be
democratic.13 Data on telephone mainlines and televisions are available for 105 and 102
states respectively and cover virtually all country-years in the data set; they are collected
by the International Telecommunications Union.
Finally, to measure urbanization I use the fraction of a state’s population currently
living in urban areas. Proponents of modernization theory predict that higher levels of
urbanization will lead to higher levels of democracy [Lipset 1959]. The urbanization
data is collected by the United Nations and is available for all 105 states.
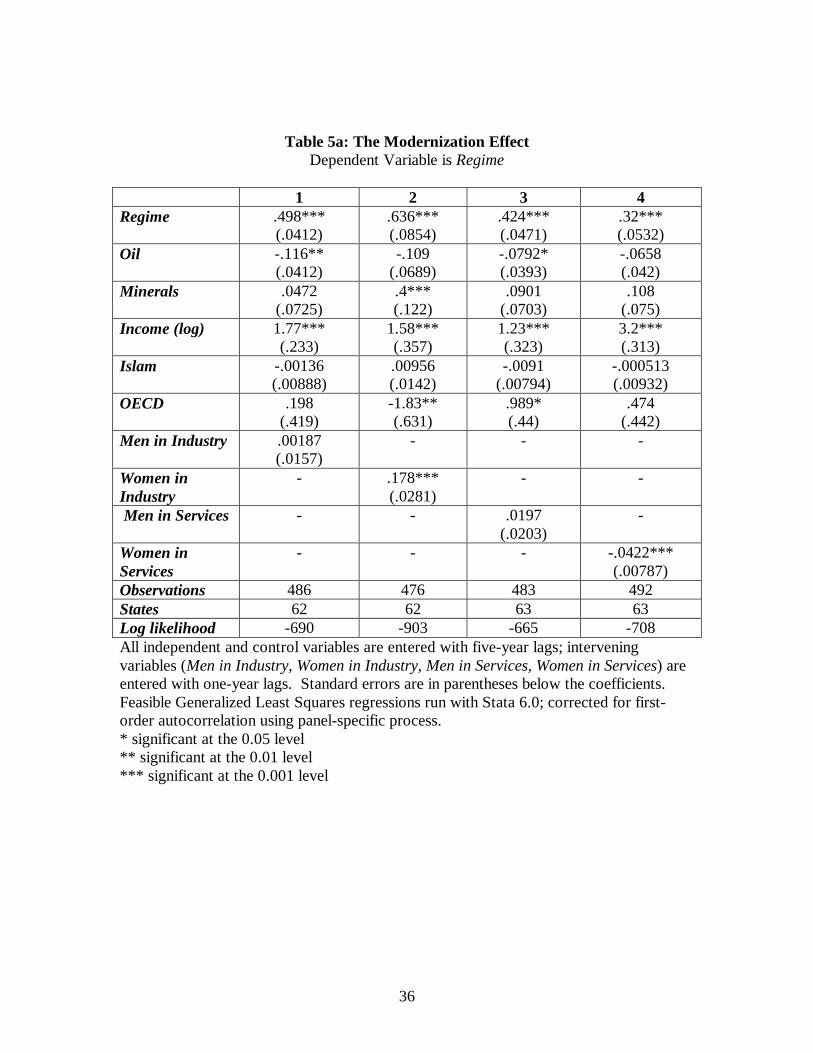
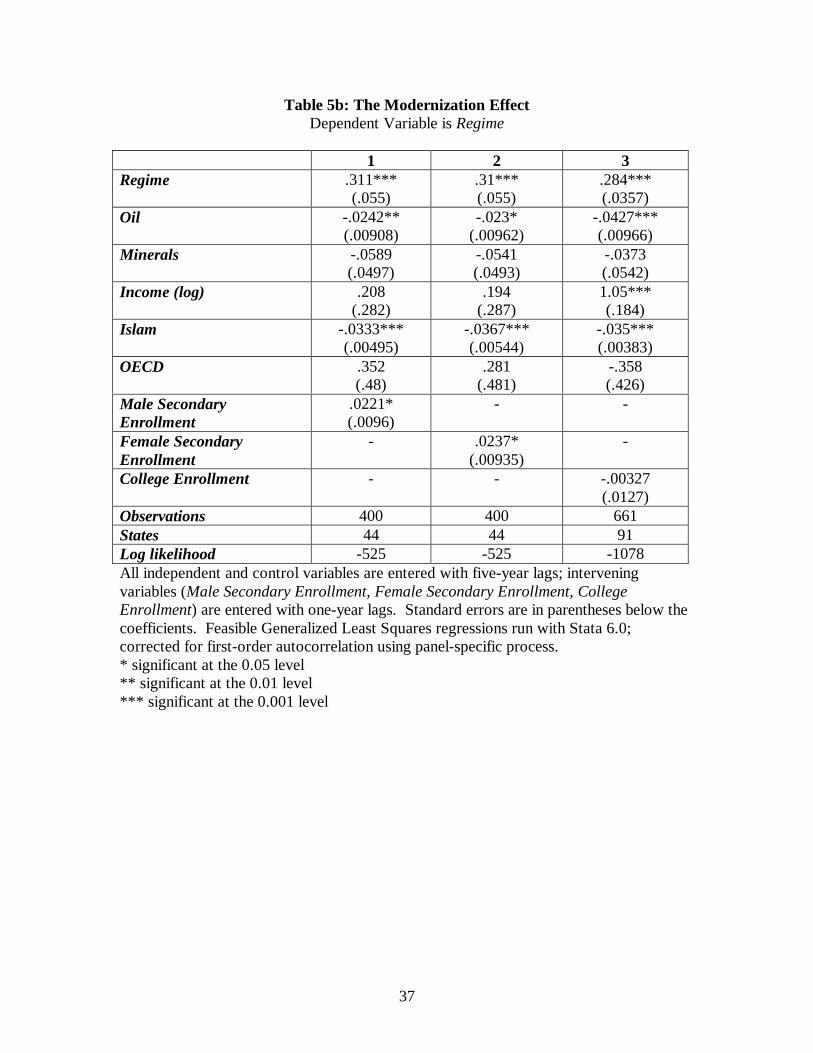
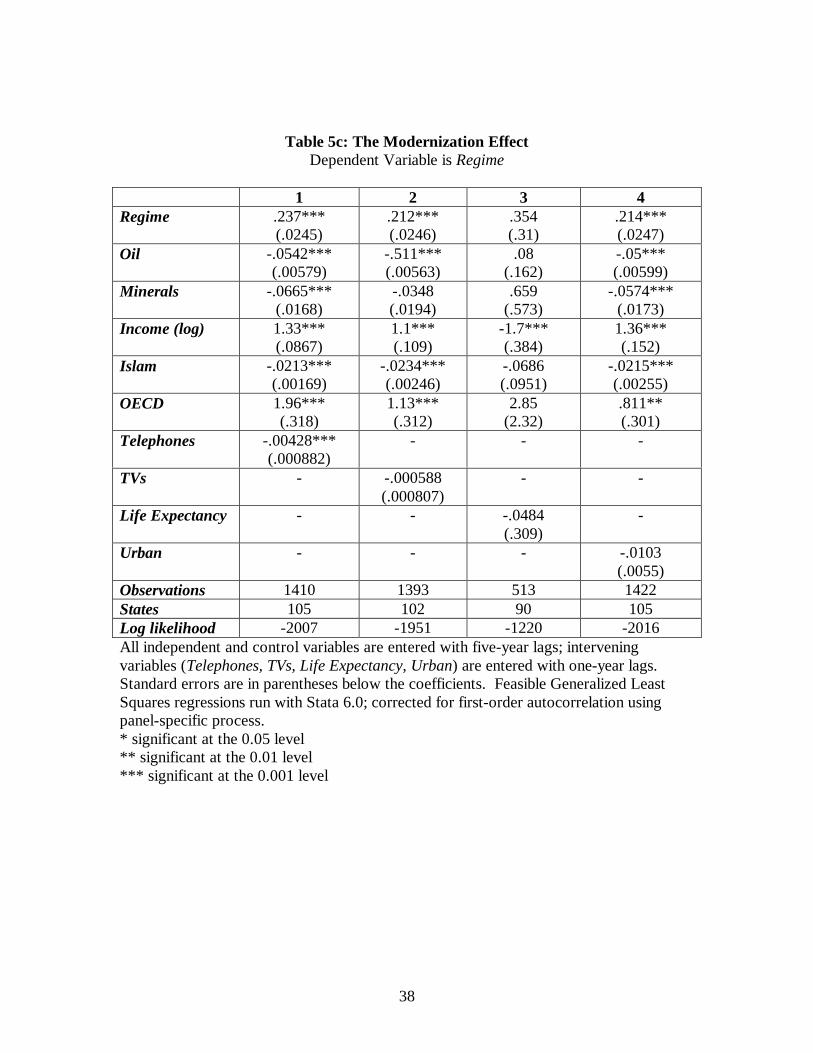
The results from these regressions are reported in Tables 5a, 5b, and 5c; overall
they do not support the modernization thesis.14 Four variables are not significant and
produce no measurable changes in the values of the Oil and Minerals coefficients: men in
industry, life expectancy, college enrollment, and televisions per capita. Two are not
significant but nonetheless produce the predicted change in the Oil and Minerals
coefficients: the fraction of men in the service sector, and the level of urbanization.
Three variables are at least marginally significant but in the opposite direction predicted
by the modernization hypothesis: women in services, urbanization, and telephones per
13 Lipset measured media participation using telephones, radios, and newspaper copies per capita.
24
capita.15 Just three variables are statistically significant and in the direction suggested by
the modernization hypothesis: women in industry, and both male and female secondary
enrollment.
A closer look at these three variables, however, shows that they cannot account for
the influence of Oil and Minerals on Regime. The Women in Industry variable has a
significant effect on both the Oil and Minerals variables, but not in the hypothesized
direction: it raises their absolute values instead of lowering them. The effects of Male
Secondary and Female Secondary, in the sample of 44 states, are identical: neither leads
to a change in the Oil variable, and both lead to an increase in the absolute value of
Minerals – again, not the hypothesized direction.
All eleven modernization indicators perform poorly; none offers support for the
modernization hypothesis.
RentierEffect
To test the rentier hypothesis, I use three indicators. The first is Taxes, which measures
the percentage of government revenue collected through taxes on goods, services,
income, profits, and capital gains. The data are collected by the International Monetary
Fund (IMF). According to the hypothesized “taxation effect,” states that fund themselves
through taxes (and hence have higher values on the Taxes variable) should be more
democratic; conversely, states that fund themselves through other means (such as trade
taxes, parastatals, external grants, and right-of-way fees) should be more authoritarian.
14 It is important to emphasize that these are not tests of modernization theory per se, but a narrower issue:whether a corollary of modernization theory can help explain why oil and mineral wealth are correlatedwith authoritarianism.15 Urbanization is significant at the 0.10 level.
25
The second variable is Government Spending, which measures government
consumption as a percentage of GDP; this includes all current spending for purchases of
goods and services (including wages and salaries) by all levels of government. The data
are compiled by the World Bank, which collects the data from the OECD, national
statistical organizations, central banks, and World Bank missions. According to the
hypothesized spending effect, higher levels of government spending – particularly on
patronage and pork barrel projects – should reduce a population’s demand for
representative government.
The third variable is Government Revenue, which measures government revenue as
a fraction of GDP, as measured by the IMF. This final indicator is one way to look for a
class formation effect. This hypothesized effect implies that as governments increase in
size (relative to the domestic economy) they are increasingly likely to prevent the
formation of social classes that are financially independent from the government; and that
the absence of politically independent classes will hinder a transition to democracy.16
Without good indicators for politically independent social groups, this hypothesis cannot
be tested directly with cross-national data; only case studies can do this. Still, the
Government Revenue variable offers an indirect test: the greater the government’s size
(measured as a fraction of GDP), the less likely independent social classes should be to
form.
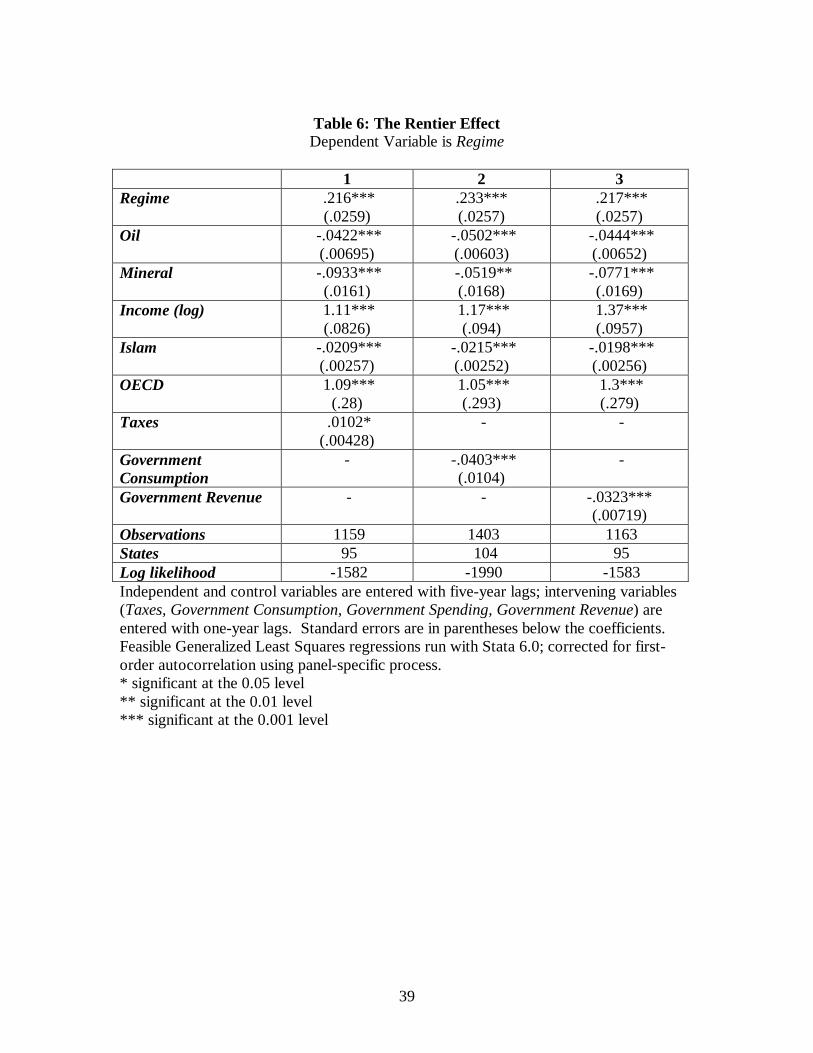
The tests for each of these variables are consistent with the rentier hypothesis. The
coefficient on the Taxes variable is positive and highly significant.17 Its inclusion
16 Of course, a larger budget may not be the only cause of such government actions, but it is the only causethat can be linked to resource wealth in an obvious way.17 Note that other studies have found that a government’s reliance on personal and corporate tax revenuesis strongly and negatively influenced by per capita income: poor states tend to rely on trade taxes, rich oneson personal and corporate taxes [Easterly and Rebelo 1993; Zee 1996]. Since per capita income is included
26
produces a nine percent drop in the Oil coefficient, although the Minerals coefficient
rises slightly (Table 6, Column 1).18 The divergence between oil exporters and minerals
exporters can be explained by an odd fact: once income is controlled for, greater oil
dependence is indeed correlated with lower taxes rates; but greater mineral dependence is
weakly correlated with higher tax rates.
The effect of taxes on regime types turns out to be strictly a short-term one: when
Taxes is introduced into the model with a two or three year lag, its coefficient quickly
drops in size and loses significance. This implies that marginal tax increases have only
short-term effects: people tend to respond to tax hikes right away, or not at all.
As reported in Table 6 Column 2, the coefficient on the Government Spending
variable is negative and highly significant. When Government Spending is included in
the model, the Minerals coefficient drops by about twenty percent, while the Oil variable
remains unchanged. This is consistent with the underlying logic of the “spending effect,”
at least for mineral exporters: greater mineral wealth produces governments with larger
consumption budgets, which in turn blocks democratization.19 Unlike the taxation effect,
the spending effect is more enduring: the Government Spending variable has much the
same effect on regime type after three years as it does after one.
The coefficient on the Government Revenue variable is negative and highly
significant, as predicted by the rentier hypothesis. Its inclusion lowers the value of the
in the model, the actual effect of Taxes on regime types is probably larger than the coefficient in thisregression suggests.18 While it is possible that causality runs in the other direction – that regime type influences taxation – it isnot obvious that more democratic states are more inclined to depend on personal and corporate taxes. Ifanything the opposite should be true: more democratic governments should be less disposed to fundthemselves through personal and corporate taxes.19 This result is not likely caused by endogeneity. While there is evidence that regime types influencelevels of government consumption, it is in the opposite direction found here: democratic governments tendto favor higher levels of social spending than their authoritarian counterparts [Brown and Hunter 1999].
27
Oil variable by five percent and the Minerals variable by eleven percent (Table 6 Column
3).
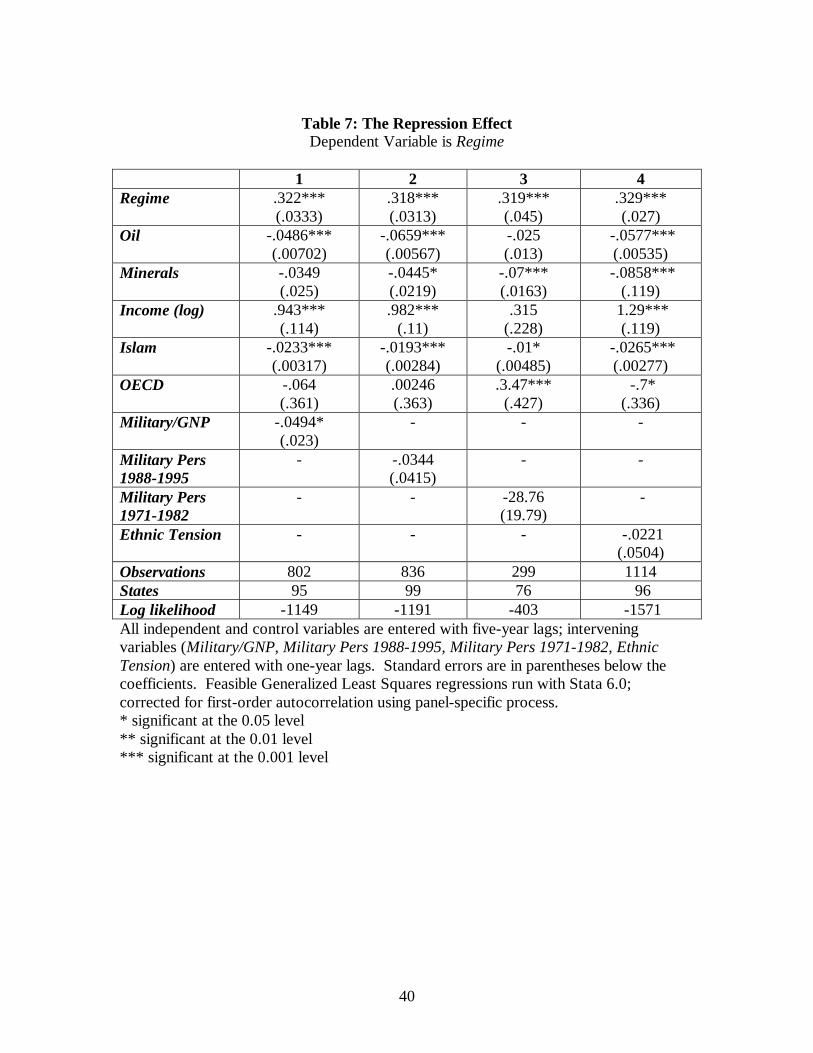
Repression Effect
To test the repression hypothesis – that resource wealth enables governments to better
arm themselves against popular pressures – I used three variables. The first is
Military/GNP, which measures the size of the military budget as a fraction of GNP. The
data cover 1985-1995; they were originally collected by the Arms Control and
Disarmament Agency (ACDA) of the U.S. government. Since resource-rich states tend
to have government budgets that are atypically large relative to the size of their
economies, this is a better indicator than military spending as a fraction of government
spending.
The second variable is Military Pers 1985-1995, which measures the size of the
military as a fraction of the labor force; it includes some paramilitary forces “if those
forces resemble regular units in their organization, equipment, training, or mission.” The
data are also from ACDA and cover the specified years. Unlike the Military/GNP
measure, this indicator helps control for variations in military wages, and the presence of
conscription, across states.
Finally, Military Pers 1971-1982 measures the size of the military as a fraction of
the total population. The data cover the years 1971-1982 and are drawn from Banks
[1983]. Each measure was entered separately in the basic model with a one-year lag; the
results are displayed in Table 7, Columns 1 through 3.
The coefficient on Military/GNP is negative and significant at the 0.05 level; its
inclusion produces a 24 percent drop in the Oil coefficient and an eight percent drop in
28
the Minerals coefficient. The coefficients on the military personnel variables are
negative but not significant. These results are consistent with at least a modified form of
the repression hypothesis: that resource wealth leads to greater spending on the military,
which in turn retards a transition to democracy.
Why do oil and mineral rich governments spend so heavily on arms? Is it to
repress popular pressures, or is it a response to exogenous levels of instability? To
address this question I use data from The Political Risk Services Group, a private firm
that uses subjective measures to gauge investment risks for its clients. It produces a 0-6
measure of “Ethnic Tensions,” which measures “the degree of tension within a country
attributable to racial, nationality, or language divisions.” Scores are available for 97
states between 1982 and 1997. Higher values indicate less ethnic tension. When added to
the basic model, the Ethnic Tensions coefficient is negative and not statistically
significant (Table 7, Column 4). Its inclusion leaves both the Oil and Minerals variables
unchanged.20 These results imply that ethnic tensions cannot help explain why resource
rich states spend so heavily on repression.
5. Conclusion
This paper uses panel data to show that the oil-impedes-democracy claim is both valid
and powerful: a single standard deviation rise in oil wealth is associated with a .72 drop
in the 0-10 democracy scale. It also finds that this effect is generalizable along two
dimensions: first, these effects are not restricted to the Mideast, where many of the oil-
rich states are clustered; and second, other types of mineral wealth have similar anti-
democratic properties.
20 I also ran the results while controlling for ethno-linguistic fractionalization; the results were identical.
29
The paper tests three explanations for these effects: one derived from
modernization theory, which implies that growth that is based on the export of oil and
minerals may fail to bring about democracy, because it fails to induce a set of
“modernizing” social and cultural changes; a “rentier effect,” suggested by Mideast area
specialists, which holds that resource-rich governments use low tax rates and a flood of
patronage to allay popular demands for democracy; and a “repression effect,” which
implies that resource wealth retards democratization by enabling the government to better
fund the state’s security apparatus. It finds little support for a modernization effect but
significant support for both a rentier effect and a repression effect. Resource wealth
enables authoritarian governments to ward off democratic pressures by keeping taxes
low; by funding patronage; by investing in repression; and possibly, by forestalling the
formation of economically independent social groups.
These findings have implications for four problems in comparative politics. The
first concerns the sources of authoritarian rule in the Mideast. Over the last decade,
Middle East specialists have disagreed over why so many states in the region have
remained unaffected by the Third Wave of democratic transitions. Some have faulted the
region’s oil wealth; others have looked to Islamic culture; a third group has emphasized
the exceptional strength of the region’s military forces. This paper shows that both oil
and Islam have played important roles in hindering democracy in the Mideast. It also
suggests that the oil wealth can, at least in part, explain why military spending is so high
– and confirms that these large military budgets help obstruct a move towards democracy.
The second problem is about the determinants of democracy. For decades,
Mideast area specialists have argued that oil wealth leads to authoritarian rule because it
allows governments to maintain low tax rates and high levels of patronage; an unspoken
30
corollary was that low tax rates and high levels of government spending could themselves
retard a transition to democracy. Although this hypothesis was grounded in studies of the
evolution of democracy in Western Europe, it was largely overlooked by scholars outside
the region. This paper uses panel data to show that Mideast specialists have been right:
low tax rates and high spending levels do inhibit democracy, regardless of the state’s oil
wealth. A one standard deviation rise in the fraction of government revenues raised from
taxes is associated with a 0.19 rise on the democracy scale; a single standard deviation
increase in the size of the government’s consumption budget, measured as a fraction of
GDP, is associated with a 0.26 drop on the democracy scale.
The third problem is how scholars of comparative democracy – particularly those
who use quantitative methods – deal with the oil-rich states of the Middle East. Often
they have treated these states as anomalies and either dropped them from their data sets
or used dummy variables to control for their effects. If these states were truly anomalies
– and their failure to democratize could not be explained by more general factors that
have a similar influence on other states – this treatment might be justified. This paper
shows, however, that there is nothing anomalous about the influence of oil on the Mideast
states: oil has a consistent influence on both Mideast and non-Mideast states; the
relationship between oil and autocracy is approximately linear, so that oil-rich and oil-
poor states are similarly affected; and other types of mineral wealth have similar, anti-
democratic properties. Rather than exclude the Mideast cases or use dummy variables,
democracy scholars should treat both oil and mineral wealth as explanatory variables.
The final problem concerns the fate of the resource-rich states. Many of the
world’s most troubled states have, paradoxically, high levels of oil and mineral wealth.
Earlier studies have shown that resource wealth tends to reduce economic growth, and to
31
increase the likelihood of civil war. This paper suggests there is a third leg to the
“resource curse”: authoritarian rule.
These three effects may interact in important ways. Authoritarian governments
may be less able to resolve domestic unrest, which may help explain why they are more
prone to civil wars. Slow growth may make domestic unrest tougher to resolve; civil
wars, in turn, wreak economic havoc. There is nothing inevitable about the resource
curse: states like Malaysia, Chile, and Botswana have done relatively well despite their
oil and mineral wealth. Yet most other developing states have found – like King Midas –
that their mineral wealth can become an unexpected source of grief.
32
Table 1: Index of Oil-Dependent States, 1995
1. Brunei (1994) 47.582. Kuwait 46.143. Bahrain 45.604. Nigeria (1991) 45.385. Congo, Rep. 45.146. Angola (1996) 457. Yemen 38.588. Oman 38.439. Saudi Arabia 33.8510. Qatar (1994) 33.8511. Libya (1988) 29.7412. Iraq (1983) 23.4813. Algeria 21.4414. Venezuela 18.8415. Syria 15.0016. Norway 13.4617. Iran (1983) 11.9518. Ecuador 8.5319. Malaysia 5.9120. Indonesia 5.6921. Cameroon 5.6322. Lithuania 4.4823. Kyrgyz Republic (1996) 4.2524. Netherlands 3.1425. Colombia 3.13
Note: Oil dependence is measured by the value of fuel-based exports, divided by GDP.Most figures are based on data in World Bank [1999]. Figures for Brunei, Nigeria,Qatar, Libya, Iraq, and Iran are the most recent available. Since 1995 figures for Angolaand Kyrgyz Republic are not available, 1996 figures are reported.
33
Table 2: Index of Minerals-dependent States, 1995
1. Botswana 35.112. Zambia 24.973. Bahrain 16.394. Chile 12.635. Angola (1996) 11.56. Papua New Guinea 10.137. Togo (1991) 7.798. Bolivia 5.539. Congo, Dem Rep (1983) 7.0010. Jordan 5.2811. Peru 3.8412. Central African Republic 3.1613. Iceland 3.1114. Zimbabwe 3.0015. Norway 2.4916. Belgium 2.2317. Canada 2.2218. Australia 2.2019. Lithuania 1.9620. Jamaica 1.8721. Slovak Republic 1.7422. South Africa 1.6923. Morocco 1.6524. Cameroon 1.6225. Kyrgyz Republic 1.56
Note: Mineral dependence is measured by the value of non-fuel minerals exports, dividedby GDP. Most figures are based on data in World Bank [1999]. The figures for Congoand Togo are the most recent available; the 1996 figure is reported for Angola, since nofigure for 1995 is available.
34
Table 3: Summary of Variables
Variable Obs. Mean Std. Dev. Min MaxRegime 4536 4.74 3.78 0 10Log Income 2036 7.87 1.12 5.44 10.3Oil 2322 5.5 14.1 0 115.6Minerals 2865 2.25 5.8 0 55.1Islam 4336 25 36.6 0 99.7Food 2511 5.73 6.23 0 45.9Agriculture 2504 1.68 2.88 0 31.6Men in Industry 814 29.4 12.7 .4 66.9Women in Industry 798 15.5 8.99 0 50.2Men in Services 810 39 14.3 5 69.3Women in Services 813 52 25.6 9 100Male Secondary 607 57.7 27.9 3 98.6Female Secondary 607 58 29.9 1.3 98.5College 1272 16.9 16.9 .1 97.7Urban 4372 46.1 25 2.24 100Life Expectancy 1527 62.5 11.7 31.2 79.8Telephones 3129 106 154 .1 691TVs 3040 151 169 0 838Taxes 2325 50.9 18.7 0 101Government Spending 3538 15.2 6.51 .897 76.2Government Revenue 2277 23.8 11.9 0 91.2Military/GNP 1298 4.36 6.64 0 102Military Personnel1985-1995
1440 1.84 2.6 0 29.6
Military Personnel1971-1982
1935 .00684 .00731 0 .0455
Ethnic Tensions 1739 3.791 1.633 0 6Gini 540 36.2 9.57 17.8 63.1Gini Squared 540 1398 766 318 3991
35
Table 4: Resource Wealth and DemocracyDependent Variable is Regime
1 2 3 4Regime .223***
(.0247).223***(.0247)
.188***(.025)
.213***(.0246)
Oil -.0509***(.0058)
-.0487***(.00622)
-.04***(.00572)
-.0278***(.00713)
Minerals -.0648***(.0169)
-.0474**(.0188)
-.0555***(.0165)
-.056***(.017)
Income (log) 1.09***(.0865)
1.11***(.0864)
1.24***(.101)
1.11***(.0995)
Islam -.0229***(.0025)
-.0229***(.00253)
-.00116(.00394)
-.0186***(.00303)
OECD .928***(.289)
.885***(.290)
.563(.29)
.666*(.286)
Large States - .487(.537)
- -
Mideast - - -3.47***(.46)
-
SSAfrica - - -1.26***(.221)
-1.03***(.216)
ArabianPeninsula
- - - -3.24***(.521)
Observations 1422 1422 1422 1422States 105 105 105 105Log likelihood -2021 -2019 -2004 -2008All independent and control variables are entered with five-year lags. Standard errors arein parentheses below the coefficients. Feasible Generalized Least Squares regressionsrun with Stata 6.0; corrected for first-order autocorrelation using panel-specific process.* significant at the 0.05 level** significant at the 0.01 level*** significant at the 0.001 level
36
Table 5a: The Modernization EffectDependent Variable is Regime
1 2 3 4Regime .498***
(.0412).636***(.0854)
.424***(.0471)
.32***(.0532)
Oil -.116**(.0412)
-.109(.0689)
-.0792*(.0393)
-.0658(.042)
Minerals .0472(.0725)
.4***(.122)
.0901(.0703)
.108(.075)
Income (log) 1.77***(.233)
1.58***(.357)
1.23***(.323)
3.2***(.313)
Islam -.00136(.00888)
.00956(.0142)
-.0091(.00794)
-.000513(.00932)
OECD .198(.419)
-1.83**(.631)
.989*(.44)
.474(.442)
Men in Industry .00187(.0157)
- - -
Women inIndustry
- .178***(.0281)
- -
Men in Services - - .0197(.0203)
-
Women inServices
- - - -.0422***(.00787)
Observations 486 476 483 492States 62 62 63 63Log likelihood -690 -903 -665 -708All independent and control variables are entered with five-year lags; interveningvariables (Men in Industry, Women in Industry, Men in Services, Women in Services) areentered with one-year lags. Standard errors are in parentheses below the coefficients.Feasible Generalized Least Squares regressions run with Stata 6.0; corrected for first-order autocorrelation using panel-specific process.* significant at the 0.05 level** significant at the 0.01 level*** significant at the 0.001 level
37
Table 5b: The Modernization EffectDependent Variable is Regime
1 2 3Regime .311***
(.055).31***(.055)
.284***(.0357)
Oil -.0242**(.00908)
-.023*(.00962)
-.0427***(.00966)
Minerals -.0589(.0497)
-.0541(.0493)
-.0373(.0542)
Income (log) .208(.282)
.194(.287)
1.05***(.184)
Islam -.0333***(.00495)
-.0367***(.00544)
-.035***(.00383)
OECD .352(.48)
.281(.481)
-.358(.426)
Male SecondaryEnrollment
.0221*(.0096)
- -
Female SecondaryEnrollment
- .0237*(.00935)
-
College Enrollment - - -.00327(.0127)
Observations 400 400 661States 44 44 91Log likelihood -525 -525 -1078All independent and control variables are entered with five-year lags; interveningvariables (Male Secondary Enrollment, Female Secondary Enrollment, CollegeEnrollment) are entered with one-year lags. Standard errors are in parentheses below thecoefficients. Feasible Generalized Least Squares regressions run with Stata 6.0;corrected for first-order autocorrelation using panel-specific process.* significant at the 0.05 level** significant at the 0.01 level*** significant at the 0.001 level
38
Table 5c: The Modernization EffectDependent Variable is Regime
1 2 3 4Regime .237***
(.0245).212***(.0246)
.354(.31)
.214***(.0247)
Oil -.0542***(.00579)
-.511***(.00563)
.08(.162)
-.05***(.00599)
Minerals -.0665***(.0168)
-.0348(.0194)
.659(.573)
-.0574***(.0173)
Income (log) 1.33***(.0867)
1.1***(.109)
-1.7***(.384)
1.36***(.152)
Islam -.0213***(.00169)
-.0234***(.00246)
-.0686(.0951)
-.0215***(.00255)
OECD 1.96***(.318)
1.13***(.312)
2.85(2.32)
.811**(.301)
Telephones -.00428***(.000882)
- - -
TVs - -.000588(.000807)
- -
Life Expectancy - - -.0484(.309)
-
Urban - - - -.0103(.0055)
Observations 1410 1393 513 1422States 105 102 90 105Log likelihood -2007 -1951 -1220 -2016All independent and control variables are entered with five-year lags; interveningvariables (Telephones, TVs, Life Expectancy, Urban) are entered with one-year lags.Standard errors are in parentheses below the coefficients. Feasible Generalized LeastSquares regressions run with Stata 6.0; corrected for first-order autocorrelation usingpanel-specific process.* significant at the 0.05 level** significant at the 0.01 level*** significant at the 0.001 level
39
Table 6: The Rentier EffectDependent Variable is Regime
1 2 3Regime .216***
(.0259).233***(.0257)
.217***(.0257)
Oil -.0422***(.00695)
-.0502***(.00603)
-.0444***(.00652)
Mineral -.0933***(.0161)
-.0519**(.0168)
-.0771***(.0169)
Income (log) 1.11***(.0826)
1.17***(.094)
1.37***(.0957)
Islam -.0209***(.00257)
-.0215***(.00252)
-.0198***(.00256)
OECD 1.09***(.28)
1.05***(.293)
1.3***(.279)
Taxes .0102*(.00428)
- -
GovernmentConsumption
- -.0403***(.0104)
-
Government Revenue - - -.0323***(.00719)
Observations 1159 1403 1163States 95 104 95Log likelihood -1582 -1990 -1583Independent and control variables are entered with five-year lags; intervening variables(Taxes, Government Consumption, Government Spending, Government Revenue) areentered with one-year lags. Standard errors are in parentheses below the coefficients.Feasible Generalized Least Squares regressions run with Stata 6.0; corrected for first-order autocorrelation using panel-specific process.* significant at the 0.05 level** significant at the 0.01 level*** significant at the 0.001 level
40
Table 7: The Repression EffectDependent Variable is Regime
1 2 3 4Regime .322***
(.0333).318***(.0313)
.319***(.045)
.329***(.027)
Oil -.0486***(.00702)
-.0659***(.00567)
-.025(.013)
-.0577***(.00535)
Minerals -.0349(.025)
-.0445*(.0219)
-.07***(.0163)
-.0858***(.119)
Income (log) .943***(.114)
.982***(.11)
.315(.228)
1.29***(.119)
Islam -.0233***(.00317)
-.0193***(.00284)
-.01*(.00485)
-.0265***(.00277)
OECD -.064(.361)
.00246(.363)
.3.47***(.427)
-.7*(.336)
Military/GNP -.0494*(.023)
- - -
Military Pers1988-1995
- -.0344(.0415)
- -
Military Pers1971-1982
- - -28.76(19.79)
-
Ethnic Tension - - - -.0221(.0504)
Observations 802 836 299 1114States 95 99 76 96Log likelihood -1149 -1191 -403 -1571All independent and control variables are entered with five-year lags; interveningvariables (Military/GNP, Military Pers 1988-1995, Military Pers 1971-1982, EthnicTension) are entered with one-year lags. Standard errors are in parentheses below thecoefficients. Feasible Generalized Least Squares regressions run with Stata 6.0;corrected for first-order autocorrelation using panel-specific process.* significant at the 0.05 level** significant at the 0.01 level*** significant at the 0.001 level
41
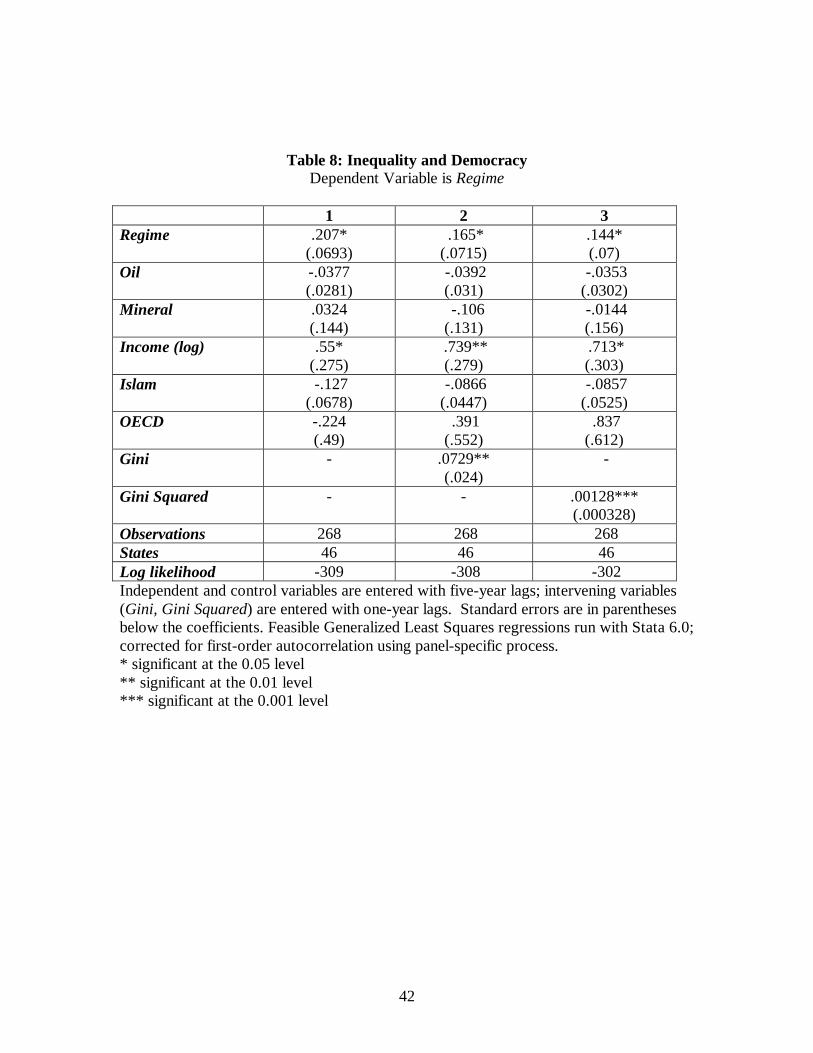
Appendix One: Resources, Inequality, and Democracy
Can inequality help explain the link between resource wealth and authoritarian rule? A
glance at the case study literature on the Mideast provides few clues. Mahdavy [1970,
467] extrapolates from the case of Iran to suggest that in rentier states “vast external
rents” are concentrated in the hands of a few. Yet Luciani [1987, 74] argues that
inequality is politically irrelevant in rentier states, because “the solution of maneuvering
for personal advantage within the existing setup is always superior to seeking an alliance
with others in similar conditions.”
Still, one plausible hypothesis is that development strategies based on the
extraction of oil and minerals tend to be highly unequal; this inequality in turn blocks a
transition to democracy.
It is notoriously difficult to test hypotheses about inequality, due to the paucity of
reliable cross-national data; moreover, scholars disagree about whether inequality is
linked to democratization, and if so, whether the relationship is linear or non-linear
[Muller 1988; Przeworski et al. 1996; Burkhart 1997]. I tested for both linear and non-
linear effects using variables dubbed Gini and Gini Squared, which are based on the
high-quality observations of gini coefficients compiled by Deininger and Squire [1996].
Both are highly significant with positive coefficients, suggesting that greater inequality is
associated with democracy (Table 9).
Unfortunately, it is not possible to determine if this inequality can help explain the
link between resource wealth and authoritarianism: neither the Oil nor the Minerals
coefficient is significant for this sample.
42
Table 8: Inequality and DemocracyDependent Variable is Regime
1 2 3Regime .207*
(.0693) .165*(.0715)
.144*(.07)
Oil -.0377(.0281)
-.0392(.031)
-.0353(.0302)
Mineral .0324(.144)
-.106(.131)
-.0144(.156)
Income (log) .55*(.275)
.739**(.279)
.713*(.303)
Islam -.127(.0678)
-.0866(.0447)
-.0857(.0525)
OECD -.224(.49)
.391(.552)
.837(.612)
Gini - .0729**(.024)
-
Gini Squared - - .00128***(.000328)
Observations 268 268 268States 46 46 46Log likelihood -309 -308 -302Independent and control variables are entered with five-year lags; intervening variables(Gini, Gini Squared) are entered with one-year lags. Standard errors are in parenthesesbelow the coefficients. Feasible Generalized Least Squares regressions run with Stata 6.0;corrected for first-order autocorrelation using panel-specific process.* significant at the 0.05 level** significant at the 0.01 level*** significant at the 0.001 level
43
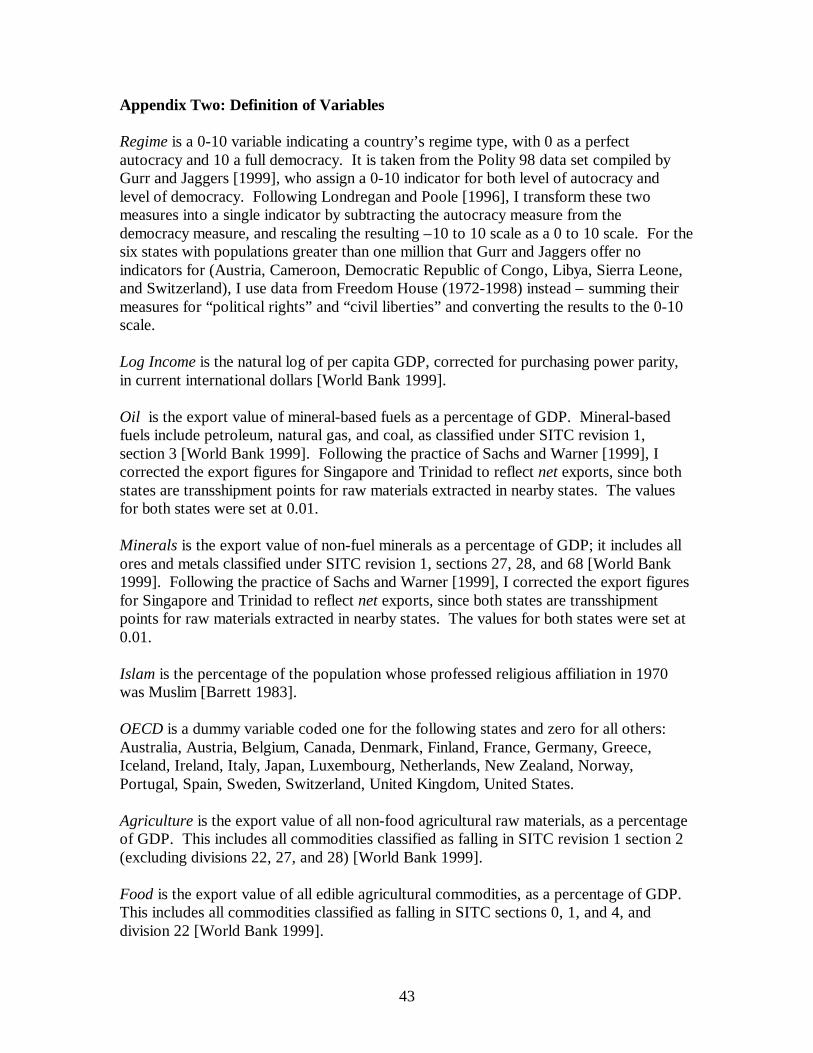
Appendix Two: Definition of Variables
Regime is a 0-10 variable indicating a country’s regime type, with 0 as a perfectautocracy and 10 a full democracy. It is taken from the Polity 98 data set compiled byGurr and Jaggers [1999], who assign a 0-10 indicator for both level of autocracy andlevel of democracy. Following Londregan and Poole [1996], I transform these twomeasures into a single indicator by subtracting the autocracy measure from thedemocracy measure, and rescaling the resulting –10 to 10 scale as a 0 to 10 scale. For thesix states with populations greater than one million that Gurr and Jaggers offer noindicators for (Austria, Cameroon, Democratic Republic of Congo, Libya, Sierra Leone,and Switzerland), I use data from Freedom House (1972-1998) instead – summing theirmeasures for “political rights” and “civil liberties” and converting the results to the 0-10scale.
Log Income is the natural log of per capita GDP, corrected for purchasing power parity,in current international dollars [World Bank 1999].
Oil is the export value of mineral-based fuels as a percentage of GDP. Mineral-basedfuels include petroleum, natural gas, and coal, as classified under SITC revision 1,section 3 [World Bank 1999]. Following the practice of Sachs and Warner [1999], Icorrected the export figures for Singapore and Trinidad to reflect net exports, since bothstates are transshipment points for raw materials extracted in nearby states. The valuesfor both states were set at 0.01.
Minerals is the export value of non-fuel minerals as a percentage of GDP; it includes allores and metals classified under SITC revision 1, sections 27, 28, and 68 [World Bank1999]. Following the practice of Sachs and Warner [1999], I corrected the export figuresfor Singapore and Trinidad to reflect net exports, since both states are transshipmentpoints for raw materials extracted in nearby states. The values for both states were set at0.01.
Islam is the percentage of the population whose professed religious affiliation in 1970was Muslim [Barrett 1983].
OECD is a dummy variable coded one for the following states and zero for all others:Australia, Austria, Belgium, Canada, Denmark, Finland, France, Germany, Greece,Iceland, Ireland, Italy, Japan, Luxembourg, Netherlands, New Zealand, Norway,Portugal, Spain, Sweden, Switzerland, United Kingdom, United States.
Agriculture is the export value of all non-food agricultural raw materials, as a percentageof GDP. This includes all commodities classified as falling in SITC revision 1 section 2(excluding divisions 22, 27, and 28) [World Bank 1999].
Food is the export value of all edible agricultural commodities, as a percentage of GDP.This includes all commodities classified as falling in SITC sections 0, 1, and 4, anddivision 22 [World Bank 1999].
44
Large States is a dummy variable coded one for states with populations over one millionat any point between 1971 and 1997, and zero otherwise.
Mideast is a dummy variable coded one for the following states and zero otherwise:Algeria, Bahrain, Egypt, Iran, Iraq, Israel, Jordan, Kuwait, Lebanon, Libya, Morocco,Oman, Qatar, Saudi Arabia, Syria, Tunisia, United Arab Emirates, and Yemen
SSAfrica is a dummy variable coded one for states classified by the World Bank asresiding in sub-Saharan Africa and zero otherwise.
Arabian Peninsula is a dummy variable coded one for the states on the Saudi Arabianpeninsula (Bahrain, Kuwait, Oman, Saudi Arabia, Qatar, the United Arab Emirates, andYemen) and zero otherwise.
Men in Industry and Women in Industry indicate the fraction of the total workingpopulation of each gender group working in activities defined by the ILO as “industry.”This includes mining and quarrying (including oil production), manufacturing, electricity,gas and water, and construction, corresponding to major divisions 2–5 (ISIC revision 2)or tabulation categories C–F (ISIC revision 3). The data are compiled by the WorldBank’s Development Data Group using an ILO database corresponding to table 2a in itsYearbook of Labour Statistics.
Men in Services and Women in Services indicate the fraction of the total workingpopulation of each gender group working in activities defined by the ILO as “services.”Services include wholesale and retail trade and restaurants and hotels; transport, storage,and communications; financing, insurance, real estate, and business services; andcommunity, social, and personal services, corresponding to major divisions 6–9 (ISICrevision 2) or tabulation categories G–P (ISIC revision 3). The data are compiled by theWorld Bank’s Development Data Group using an ILO database corresponding to table 2ain its Yearbook of Labour Statistics.
Male Secondary Enrollment and Female Secondary Enrollment indicate the fraction ofmales and females enrolled in secondary school, relative to their numbers in thepopulation. The data are reported to the United Nations Educational, Scientific, andCultural Organization (UNESCO) by national education authorities.
Life Expectancy indicates the life expectancy at birth of both males and females. Theunderlying figures are from the United Nations Department of Economic and SocialAffairs, Population and Vital Statistics Report; demographic and health surveys fromnational sources; and United Nations Children’s Fund (UNICEF), The State of theWorld’s Children 1999.
Urban is the midyear population of areas defined as urban in each country and reportedto the United Nations, expressed as a fraction of the total population. The data are fromfrom the United Nations’ World Urbanization Prospects: The 1996 Revision.
45
Telephones is the number of telephone mainlines (i.e., separate lines to a given householdor firm) per 1,000 people. The data are derived from the InternationalTelecommunication Union’s (ITU) World Telecommunication Development Report.
TVs is the number of televisions per 1,000 people, according to an annual questionnairesent to member countries by the ITU. The data are derived from the InternationalTelecommunication Union’s (ITU) World Telecommunication Development Report.
Taxes is the percentage of government revenue raised through taxes on goods, service,income, profits, and capital gains. The data are collected by the IMF.
Government Spending, expressed as a percentage of GDP, includes “all currentexpenditures for purchases of goods and services by all levels of government, excludingmost government enterprises. It also includes capital expenditure on national defense andsecurity.” The data are collected from the OECD, and from national statisticalorganizations and central banks by visiting and resident World Bank missions, andpublished by the World Bank [1999].
Government Revenue, expressed as a percentage of GDP, includes all forms ofgovernment revenues excluding grants. The data is collected by the InternationalMonetary Fund.
Military/GNP measures the size of the military budget as a fraction of GNP. The datacover 1985-1995; they were originally collected by the Arms Control and DisarmamentAgency (ACDA) of the U.S. government.
Military Pers 1985-1995 measures the size of the military as a percentage of the laborforce; it includes some paramilitary forces “if those forces resemble regular units in theirorganization, equipment, training, or mission.” The data are also from ACDA and coverthe specified years.
Military Pers 1971-1982 measures the size of the military as a fraction of the totalpopulation. The data cover the years 1971-1982 and are drawn from Banks [1983].Unlike Military Personnel 1985-1995 it does not account for variations in the size of thelabor force.
Ethnic Tensions is a 0-6 interval-level variable that measures “the degree of tensionwithin a country attributable to racial, nationality, or language divisions.” Data cover 97states between 1982 and 1997; the codings are carried out a private firm, The PoliticalRisk Services Group, and published in their monthly International Country Risk Guide;they are also available as the IRIS-3 computer database. The monthly data has beenchanged into annual data by taking the mean of the 12 monthly values.
Gini consists of the high-quality observations of gini coefficients compiled by Deiningerand Squire [1996].
Gini Squared are the squared values of the high-quality observations of gini coefficientsin Deininger and Squire [1996].
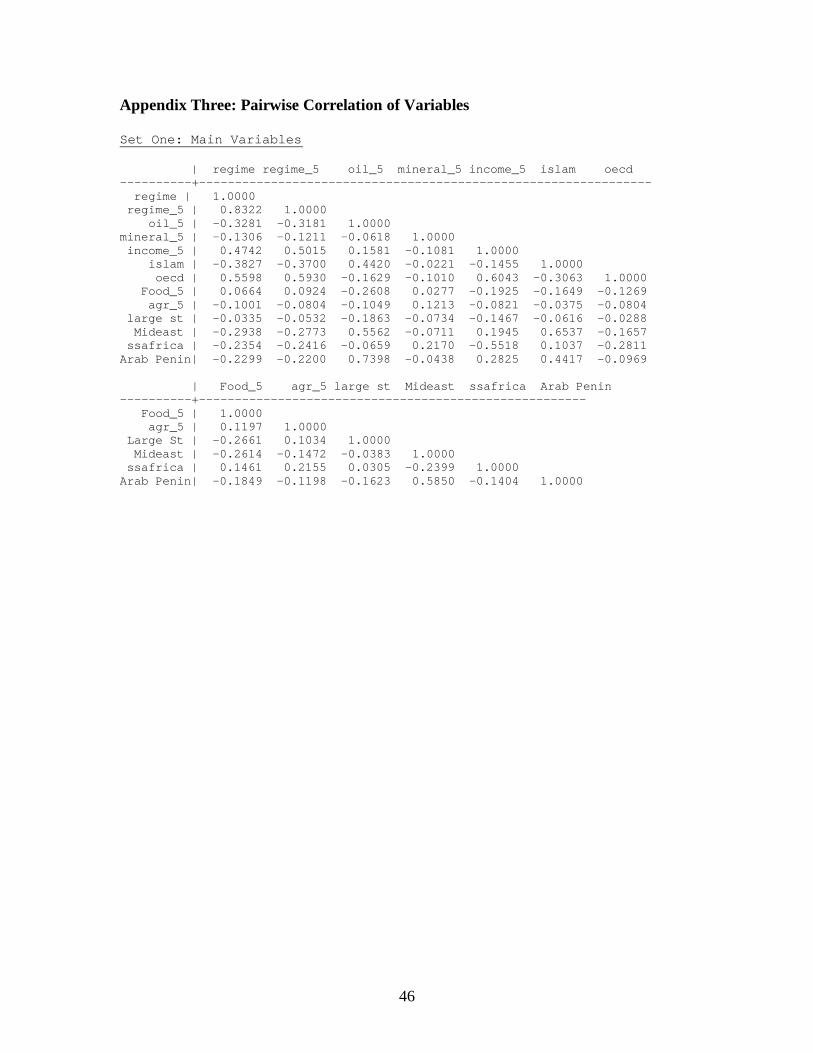
46
Appendix Three: Pairwise Correlation of Variables
Set One: Main Variables
| regime regime_5 oil_5 mineral_5 income_5 islam oecd----------+--------------------------------------------------------------- regime | 1.0000 regime_5 | 0.8322 1.0000 oil_5 | -0.3281 -0.3181 1.0000mineral_5 | -0.1306 -0.1211 -0.0618 1.0000 income_5 | 0.4742 0.5015 0.1581 -0.1081 1.0000 islam | -0.3827 -0.3700 0.4420 -0.0221 -0.1455 1.0000 oecd | 0.5598 0.5930 -0.1629 -0.1010 0.6043 -0.3063 1.0000 Food_5 | 0.0664 0.0924 -0.2608 0.0277 -0.1925 -0.1649 -0.1269 agr_5 | -0.1001 -0.0804 -0.1049 0.1213 -0.0821 -0.0375 -0.0804 large st | -0.0335 -0.0532 -0.1863 -0.0734 -0.1467 -0.0616 -0.0288 Mideast | -0.2938 -0.2773 0.5562 -0.0711 0.1945 0.6537 -0.1657 ssafrica | -0.2354 -0.2416 -0.0659 0.2170 -0.5518 0.1037 -0.2811Arab Penin| -0.2299 -0.2200 0.7398 -0.0438 0.2825 0.4417 -0.0969
| Food_5 agr_5 large st Mideast ssafrica Arab Penin----------+------------------------------------------------------ Food_5 | 1.0000 agr_5 | 0.1197 1.0000 Large St | -0.2661 0.1034 1.0000 Mideast | -0.2614 -0.1472 -0.0383 1.0000 ssafrica | 0.1461 0.2155 0.0305 -0.2399 1.0000Arab Penin| -0.1849 -0.1198 -0.1623 0.5850 -0.1404 1.0000
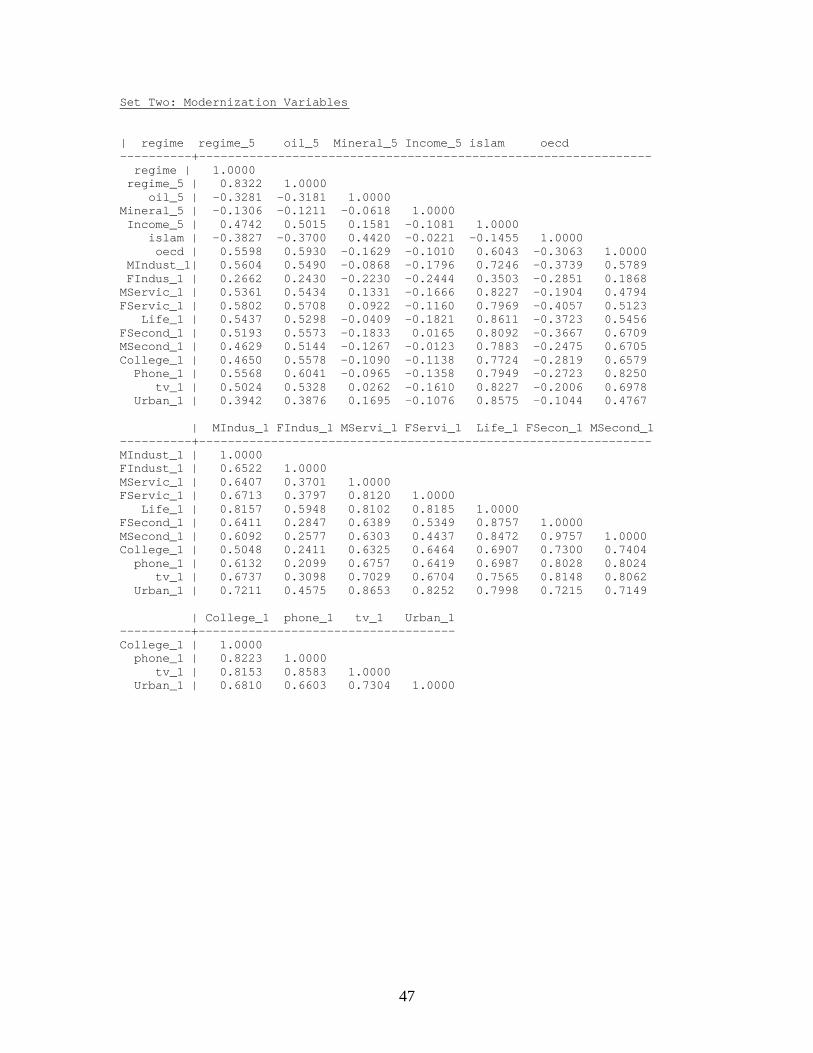
47
Set Two: Modernization Variables
| regime regime_5 oil_5 Mineral_5 Income_5 islam oecd----------+--------------------------------------------------------------- regime | 1.0000 regime_5 | 0.8322 1.0000 oil_5 | -0.3281 -0.3181 1.0000Mineral_5 | -0.1306 -0.1211 -0.0618 1.0000 Income_5 | 0.4742 0.5015 0.1581 -0.1081 1.0000 islam | -0.3827 -0.3700 0.4420 -0.0221 -0.1455 1.0000 oecd | 0.5598 0.5930 -0.1629 -0.1010 0.6043 -0.3063 1.0000 MIndust_1| 0.5604 0.5490 -0.0868 -0.1796 0.7246 -0.3739 0.5789 FIndus_1 | 0.2662 0.2430 -0.2230 -0.2444 0.3503 -0.2851 0.1868MServic_1 | 0.5361 0.5434 0.1331 -0.1666 0.8227 -0.1904 0.4794FServic_1 | 0.5802 0.5708 0.0922 -0.1160 0.7969 -0.4057 0.5123 Life_1 | 0.5437 0.5298 -0.0409 -0.1821 0.8611 -0.3723 0.5456FSecond_1 | 0.5193 0.5573 -0.1833 0.0165 0.8092 -0.3667 0.6709MSecond_1 | 0.4629 0.5144 -0.1267 -0.0123 0.7883 -0.2475 0.6705College_1 | 0.4650 0.5578 -0.1090 -0.1138 0.7724 -0.2819 0.6579 Phone_1 | 0.5568 0.6041 -0.0965 -0.1358 0.7949 -0.2723 0.8250 tv_1 | 0.5024 0.5328 0.0262 -0.1610 0.8227 -0.2006 0.6978 Urban_1 | 0.3942 0.3876 0.1695 -0.1076 0.8575 -0.1044 0.4767
| MIndus_1 FIndus_1 MServi_1 FServi_1 Life_1 FSecon_1 MSecond_1----------+---------------------------------------------------------------MIndust_1 | 1.0000FIndust_1 | 0.6522 1.0000MServic_1 | 0.6407 0.3701 1.0000FServic_1 | 0.6713 0.3797 0.8120 1.0000 Life_1 | 0.8157 0.5948 0.8102 0.8185 1.0000FSecond_1 | 0.6411 0.2847 0.6389 0.5349 0.8757 1.0000MSecond_1 | 0.6092 0.2577 0.6303 0.4437 0.8472 0.9757 1.0000College_1 | 0.5048 0.2411 0.6325 0.6464 0.6907 0.7300 0.7404 phone_1 | 0.6132 0.2099 0.6757 0.6419 0.6987 0.8028 0.8024 tv_1 | 0.6737 0.3098 0.7029 0.6704 0.7565 0.8148 0.8062 Urban_1 | 0.7211 0.4575 0.8653 0.8252 0.7998 0.7215 0.7149
| College_1 phone_1 tv_1 Urban_1----------+------------------------------------College_1 | 1.0000 phone_1 | 0.8223 1.0000 tv_1 | 0.8153 0.8583 1.0000 Urban_1 | 0.6810 0.6603 0.7304 1.0000
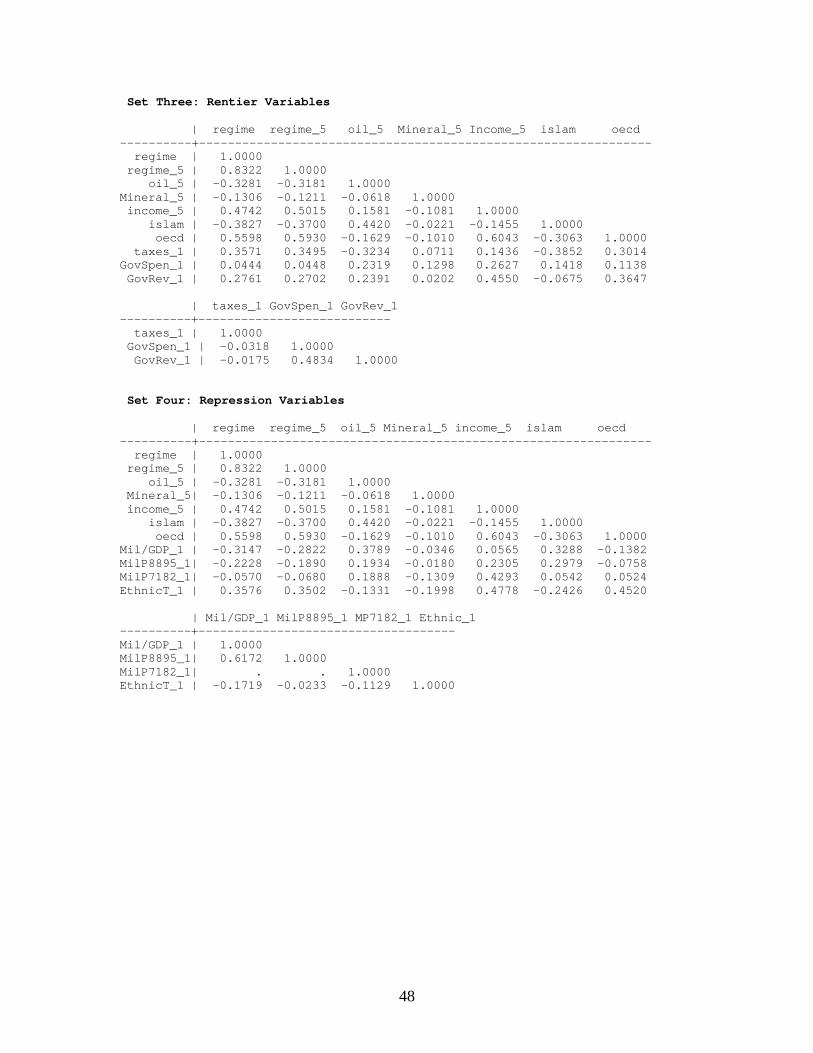
48
Set Three: Rentier Variables
| regime regime_5 oil_5 Mineral_5 Income_5 islam oecd----------+--------------------------------------------------------------- regime | 1.0000 regime_5 | 0.8322 1.0000 oil_5 | -0.3281 -0.3181 1.0000Mineral_5 | -0.1306 -0.1211 -0.0618 1.0000 income_5 | 0.4742 0.5015 0.1581 -0.1081 1.0000 islam | -0.3827 -0.3700 0.4420 -0.0221 -0.1455 1.0000 oecd | 0.5598 0.5930 -0.1629 -0.1010 0.6043 -0.3063 1.0000 taxes_1 | 0.3571 0.3495 -0.3234 0.0711 0.1436 -0.3852 0.3014GovSpen_1 | 0.0444 0.0448 0.2319 0.1298 0.2627 0.1418 0.1138 GovRev_1 | 0.2761 0.2702 0.2391 0.0202 0.4550 -0.0675 0.3647
| taxes_1 GovSpen_1 GovRev_1----------+--------------------------- taxes_1 | 1.0000 GovSpen_1 | -0.0318 1.0000 GovRev_1 | -0.0175 0.4834 1.0000
Set Four: Repression Variables
| regime regime_5 oil_5 Mineral_5 income_5 islam oecd----------+--------------------------------------------------------------- regime | 1.0000 regime_5 | 0.8322 1.0000 oil_5 | -0.3281 -0.3181 1.0000 Mineral_5| -0.1306 -0.1211 -0.0618 1.0000 income_5 | 0.4742 0.5015 0.1581 -0.1081 1.0000 islam | -0.3827 -0.3700 0.4420 -0.0221 -0.1455 1.0000 oecd | 0.5598 0.5930 -0.1629 -0.1010 0.6043 -0.3063 1.0000Mil/GDP_1 | -0.3147 -0.2822 0.3789 -0.0346 0.0565 0.3288 -0.1382MilP8895_1| -0.2228 -0.1890 0.1934 -0.0180 0.2305 0.2979 -0.0758MilP7182_1| -0.0570 -0.0680 0.1888 -0.1309 0.4293 0.0542 0.0524EthnicT_1 | 0.3576 0.3502 -0.1331 -0.1998 0.4778 -0.2426 0.4520
| Mil/GDP_1 MilP8895_1 MP7182_1 Ethnic_1----------+------------------------------------Mil/GDP_1 | 1.0000MilP8895_1| 0.6172 1.0000MilP7182_1| . . 1.0000EthnicT_1 | -0.1719 -0.0233 -0.1129 1.0000
49
References
Anderson, Lisa (1987) "The State in the Middle East and North Africa," ComparativePolitics 20 (1, October), 1-18.
--- (1995a, "Democracy in the Arab World: A Critique of the Political Culture Approach,"in Political Liberalization and Democratization in the Arab World; Volume One,Theoretical Perspectives, eds. Rex Brynen, Bahgat Korany, and Paul Noble, Boulder:Lynne Rienner, 77-92.
--- (1995b)"Peace and democracy in the Middle East: The constraints of soft budgets,"Journal of International Affairs 49 (1, Summer).
Banks, Arthur S. (1983), "Cross National Time-Series Data Archive"
Barrett, David B., ed. (1982), World Christian Encyclopedia. New York: OxfordUniversity Press.
Barro, Robert J. (1999) "Determinants of Democracy," Journal of Political Economy 107(6), S158-S183.
Beblawi, Hazem (1987), "The Rentier State in the Arab World," in The Rentier State, eds.Hazem Beblawi and Giacomo Luciani, New York: Croom Helm, 49-62.
Bellin, Eva (1994) "The Politics of Profit in Tunisia: Utility of the Rentier Paradigm?,"World Development 22, 427-436.
Bollen, Kenneth A. (1983) "World System Position, Dependency, and Democracy: TheCross-National Evidence," American Sociological Review 48, 468-479.
Brand, Laurie A. (1992), "Economic and Political Liberalization in a Rentier Economy: thecase of the Hashemite Kingdom of Jordan," in Privatization and Liberalization in theMiddle East, eds. Iliya Harik and Denis J. Sullivan, Bloomington: Indiana University Press,167-188.
Brown, David S. and Wendy Hunter (1999) "Democracy and Social Spending in LatinAmerica, 1980-92," American Political Science Review 93 (4), 779-790.
Burkhart, Ross E. (1997) "Comparative Democracy and Income Distribution: Shape andDirection of the Causal Arrow," Journal of Politics 59, 148-164.
Burkhart, Ross E. and Michael S. Lewis-Beck (1994) "Comparative Democracy: TheEconomic Development Thesis," American Political Science Review 88 (4), 903-910.
Cardoso, Fernando Henrique and Enzo Faletto (1979), Dependency and Development inLatin America. Berkeley: University of California Press.
50
Chaudhry, Kiren Aziz (1994) "Economic Liberalization and the Lineages of the RentierState," Comparative Politics 27 (October), 1-25.
--- (1997), The Price of Wealth: Economies and Institutions in the Middle East. Ithaca:Cornell University Press.
Clark, John (1997) "Petro-Politics in Congo," Journal of Democracy 8 (3), 62-76.
Collier, Paul and Anke Hoeffler (1998) "On economic causes of civil war," OxfordEconomic Papers 50, 563-573.
Crystal, Jill (1990), Oil and Politics in the Gulf: rulers and merchants in Kuwait andQatar. New York: Cambridge University Press.
Dahl, Robert A. (1971), Polyarchy: Participation and Opposition. New Haven: YaleUniversity Press.
Deininger, Klaus and Lyn Squire (1996) "A New Data Set Measuring Income Inequality,"The World Bank Economic Review 10 (3), 259-287.
Deutsch, Karl W. (1961) "Social Mobilization and Political Development," AmericanPolitical Science Review 55 (3), 493-514.
Diamond, Larry, Juan J. Linz, and Seymour Martin Lipset, eds. (1988), Democracy inDeveloping Countries. Boulder: Lynne Rienner.
Easterly, William and Sergio Rebelo (1993) "Fiscal policy and economic growth," Journalof Monetary Economics 32, 417-458.
Entelis, John P. (1976), "Oil Wealth and the Prospects for Democratization in the ArabianPeninsula: the case of Saudi Arabia," in Arab Oil: Impact on the Arab Countries andGlobal Implications, eds. Naiem A. Sherbiny and Mark A. Tessler, New York: PraegerPublishers, 77-111.
Evans, Peter (1979), Dependent Development: The Alliance of Multinational, State, andLocal Capital in Brazil. Princeton: Princeton University Press.
First, Ruth (1980), "Libya: Class and State in an Oil Economy," in Oil and Class Struggle,eds. Petter Nore and Terisa Turner, London: Zed Press, 119-142.
Gause II, F. Gregory (1995), "Regional Influences on Experiments in PoliticalLiberalization in the Arab World," in Political Liberalization and Democratization in theArab World; Volume One, Theoretical Perspectives, eds. Rex Brynen, Bahgat Korany, andPaul Noble, Boulder: Lynne Rienner, 283-306.
Gurr, Ted R. and Jaggers (1999), "Polity 98: Regime Characteristics, 1800-1998,"http://www.bsos.umd.edu/cidcm/polity/
51
Hudson, Michael (1995), "The Political Culture Approach to Arab Democratization: TheCase for Bringing It Back In, Carefully," in Political Liberalization and Democratization inthe Arab World; Volume One, Theoretical Perspectives, eds. Rex Brynen, Bahgat Korany,and Paul Noble, Boulder: Lynne Rienner, 61-76.
Huntington, Samuel (1991) "Democracy's Third Wave," Journal of Democracy 2 (Spring),12-34.
Inglehart, Ronald (1997), Modernization and Postmodernization. Princeton: PrincetonUniversity Press.Lam, Ricky and Wantchekon, Leonard (1999), “Dictatorships as a Political DutchDisease,” Yale University, mimeo.
Leite, Carlos and Jens Weidmann (1999), "Does Mother Nature Corrupt? NaturalResources, Corruption, and Economic Growth," IMF Working Paper WP/99/85.
Lenin, V. I. (1975 (1917)), "Imperialism, the Highest Stage of Capitalism," in The LeninAnthology, ed. Robert C. Tucker, New York: WW Norton and Company, 204-274.
Lerner, Daniel (1958), The Passing of Traditional Society. New York: Free Press.
Lewis, Bernard (1993) "Islam and Liberal Democracy," The Atlantic Monthly 271(February), 89-98.
Lipset, Seymour Martin (1959) "Some Social Requisites of Democracy: EconomicDevelopment and Political Legitimacy," American Political Science Review 53 (1), 69-105.
--- (1994) "The Social Requisites of Democracy Revisited," American Sociological Review59 (February), 1-22.
Londregan, John B. and Keith T. Poole (1996) "Does High Income Promote Democracy?,"World Politics 49 (October), 1-30.
Luciani, Giacomo (1987), "Allocation vs. Production States: A Theoretical Framework," inThe Rentier State, eds. Hazem Beblawi and Giacomo Luciani, London: Croom Helm, 63-82.
Mahdavy, Hussein (1970), "The Patterns and Problems of Economic Development inRentier States: The Case of Iran," in Studies in Economic History of the Middle East, ed.M. A. Cook, London: Oxford University Press, 428-467.
Midlarsky, Manus (1998) "Democracy and Islam: Implications for Civilizational Conflictand the Democratic Peace," International Studies Quarterly 42, 485-511.
Moore, Barrington (1966), Social Origins of Dictatorship and Democracy. Boston: BeaconPress.
52
Moore, Clement Henry (1976), "Petroleum and Political Development in the Maghreb," inArab Oil: Impact on the Arab Countries and Global Implications, eds. Naiem A. Sherbinyand Mark A. Tessler, New York: Praeger Publishers, 112-129.
Muller, Edward N. (1988) "Democracy, Economic Development, and Income Inequality,"American Sociological Review 53, 50-68.
North, Douglass C. and Barry R. Weingast (1989) "Constitutions and Commitment: TheEvolution of Institutions Governing Public Choice in Seventeenth-Century England," TheJournal of Economic History XLIX (4, December), 803-832.
O'Donnell, Guillermo, Philippe C. Schmitter, and Lawrence Whitehead, eds. (1986),Transitions from Authoritarian Rule: Prospects for Democracy. Baltimore: Johns HopkinsUniversity Press.
Przeworski, Adam, Michael Alvarez, Jose Antonio Cheibub, and Fernando Limongi (1996)"What Makes Democracies Endure," Journal of Democracy 7 (1, January), 39-55.
Przeworski, Adam and Fernando Limongi (1997) "Modernization: Theories and Facts,"World Politics 49 (2, January), 155-183.
Ross, Michael L. (1999) "The Political Economy of the Resource Curse," World Politics 51(2, January), 297-322.
Sachs, Jeffrey D. and Andrew M. Warner (1995), "Natural Resource Abundance andEconomic Growth," Development Discussion Paper No. 517a, Harvard Institute forInternational Development, Cambridge.
--- (1999) "The big push, natural resource booms and growth," Journal of DevelopmentEconomics 59 (1), 43-76.
Salamé, Ghassan, ed. (1994), Democracy Without Democrats? The Renewal of Politics inthe Muslim World. London: I.B. Tauris Publishers.
Shambayati, Hootan (1994) "The Rentier State, Interest Groups, and the Paradox ofAutonomy: State and Business in Turkey and Iran," Comparative Politics 26 (3, April),307-331.
Sharabi, Hisham (1988), Neopatriarchy: A Theory of Distorted Change in Arab Society.New York: Oxford University Press.
Skocpol, Theda (1982) "Rentier State and Shi'a Islam in the Iranian Revolution," Theoryand Society 11, 265-283.
Tilly, Charles, ed. (1975), The Formation of National States in Western Europe. Princeton:Princeton University Press.
Wallerstein, Immanuel (1974), The Modern World-System. New York: Academic Press.
53
Waterbury, John (1994), "Democracy Without Democrats?: the potential for politicalliberalization in the Middle East," in Democracy Without Democrats? The Renewal ofPolitics in the Muslim World, ed. Ghassan Salamé, New York: I.B. Tauris Publishers, 23-47.
World Bank (1999), "World Development Indicators," CD-ROM. The World Bank,Washington D.C.
Zee, Howell H. (1996) "Empirics of Cross-country Tax Revenue Comparisons," WorldDevelopment 24, 1659-1671.