Embed Size (px)
Citation preview
DOES SPECIES TRAIT COMPOSITION INFLUENCE MACROINVERTEBRATERESPONSES TO IRRIGATION WATER WITHDRAWALS: EVIDENCE FROM
THE INTERMOUNTAIN WEST, USA
SCOTT W. MILLER,a* DAVID WOOSTERb and JUDITH L. LIc
a Department of Watershed Sciences, Utah State University, Logan, Utah 84322, USAb Department of Fisheries and Wildlife, Oregon State University, Hermiston Agricultural Research and Extension Center, Hermiston, Oregon
97838 USAc Department of Fisheries and Wildlife, Oregon State University, 104 Nash Hall, Corvallis, Oregon 97331 USA
ABSTRACT
Irrigation water withdrawals are ubiquitous in arid and semi-arid regions; however, predictable macroinvertebrate responseshave not emerged. Inconsistent responses are frequently attributed to the amount of water withdrawn, while physicochemicaland biological differences among systems remain unstudied. In this study, we sought to determine if species traits influencemacroinvertebrate responses to water withdrawals. We sampled above and below 12 independent water diversions experiencingdischarge reductions greater than 75% in central and eastern Oregon and Washington, USA. When considering all 12 rivers, weobserved significant alterations to the hydrologic environment, in addition to increased algal standing stocks, silt cover andminimum temperatures; however, macroinvertebrate responses were limited to increased downstream densities, as indices andcommunity composition did not significantly change. Functionally, species traits were more sensitive than structural indices;proportional abundance for 12 of 52 species traits significantly differed above and below all points of diversion. Trait changessuggest a shift in functional composition to compensate for hydrologic alterations and reduced habitat area. Grouping referencessites (upstream) by species trait composition revealed a strong ambient gradient of increasing resistance and resilience from highto low elevations; however, we did not find evidence for differential susceptibility to water withdrawals among trait-basedreference groups. Though water withdrawals changed the representation of select species traits, frequencies of trait states mostvulnerable to water withdrawals were too homogenously distributed among sites to elicit differential responses among trait-based reference groups. At larger spatial scales or among disparate hydrologic regimes, grouping systems by species traits willlikely reduce variability and offer a more general currency for detecting perturbation response relationships. Copyright# 2009John Wiley & Sons, Ltd.
key words: discharge; elevation; irrigation water withdrawals; macroinvertebrates; resilience; resistance; species traits
Received 16 April 2009; Revised 25 September 2009; Accepted 12 October 2009
INTRODUCTION
Agriculture is the most common land use in the world and accounts for 90% of total freshwater consumption
(Meyer and Turner, 1992; Oki and Kanae, 2006). In arid and semi-arid regions, agricultural production depends on
surface and groundwater withdrawals, which represent primary causes of hydrologic alterations to river systems
(Allan and Flecker, 1993; Dynesius and Nilsson, 1994; Bunn and Arthington, 2002). For example, surface water
withdrawals for irrigated agriculture can change the magnitude, duration, timing and spatial extent of low flow
conditions (Wilber et al., 1996; Eheart and Tornil, 1999; Miller et al., 2007). Such hydrologic alterations can
significantly impact the structure and function of river ecosystems by altering water quality, thermal regimes,
ecosystem connectivity and habitat availability (Meier et al., 2003; Benstead et al., 2005; Dewson et al., 2007a).
The ubiquity of surface water withdrawals, at both regional and global scales is apparent by the geographic
diversity of recent studies investigating impacts to macroinvertebrate communities (e.g. United Kingdom: Castella
et al., 1995; United States: Miller et al., 2007; Australia: McKay and King, 2006; New Zealand: Dewson et al.,
RIVER RESEARCH AND APPLICATIONS
River Res. Applic. 26: 1261–1280 (2010)
Published online 7 December 2009 in Wiley Online Library(wileyonlinelibrary.com) DOI: 10.1002/rra.1327
*Correspondence to: Scott W. Miller, Department of Watershed Sciences, Utah State University, 5210 OldMain Hill, Logan, Utah 84322, USA.E-mail: [email protected]
Copyright # 2009 John Wiley & Sons, Ltd.
2007a). Despite increasing study, predictable biological responses have not emerged. While some studies observed
detrimental impacts to macroinvertebrate communities (Dudgeon, 1992; Rader and Belish, 1999; McIntosh et al.,
2002; Miller et al., 2007), others found little to no impact (Castella et al., 1995; Dewson et al., 2003; McKay and
King, 2006; Dewson et al., 2007a). Both the inability to detect adverse impacts at low withdrawal levels and
variability in responses among studies are often attributed to threshold response patterns, as well as
physicochemical and biological differences among systems (Castella et al., 1995; Rader and Belish, 1999; Dewson
et al., 2003). Corrarino and Brusven (1983), Rader and Belish (1999) and Miller et al. (2007) provide evidence for
threshold responses, with only high levels of withdrawal having adverse impacts. In contrast, the ability of
functional composition or species traits (i.e. life history strategies, ecological preferences and morphological
adaptations) to explain variable macroinvertebrate responses to low flow disturbances remains less certain.
Species trait composition at local and regional scales reflects differences in physical selective forces, including
natural patterns of spatiotemporal variability (Poff and Ward, 1990; Townsend and Hildrew, 1994; Richards et al.,
1997; Heino, 2005) and anthropogenic alterations (Chessman and Royal, 2004; Doledec et al., 2006). These
physical templates affect the susceptibility of macroinvertebrates to disturbance (resistance), as well as their ability
to recover following removal of a stressor (resilience) (Townsend and Hildrew, 1994). For example,
macroinvertebrate communities found in disturbance-prone areas typically have higher proportions of small,
highly fecund, mobile individuals with broad habitat requirements (Townsend and Hildrew, 1994; Townsend et al.,
1997a; Doledec et al., 2006). Therefore, in two geographically separated systems, with disparate physical
templates, macroinvertebrates are likely to respond to a perturbation in ways indicated by species trait composition,
not necessarily species composition when exposed to the same low flow event (Resh et al., 1988; Townsend et al.,
1997b; Lake, 2000). We hypothesize that local and regional differences in macroinvertebrate species trait
composition influence responses to water withdrawals and may explain differing responses among studies.
Our objectives were to quantify the impacts of irrigation water withdrawals on (i) macroinvertebrate abundance
and composition and (ii) species trait composition. We then sought to compare species and trait responses among
groups of rivers with contrasting species trait compositions. If macroinvertebrate responses to water withdrawals
depend on a site-specific pool of traits, biological responses would be inconsistent among watersheds differing in
physicochemical conditions and subsequent trait compositions. For example, we anticipated natural differences in
species trait composition among river segments differing in elevation or stream size because of disparate
environmental conditions and temporal patterns of variability; whereas high elevation reaches would be inhabited
by taxa with relatively narrow habitat requirements (e.g. preference for cold—stenothermic thermal regimes and
erosional habitats), obligate feeding behaviours (e.g. predators or shredders) and other K-selected life history
strategies, riverine reaches at lower elevations might have traits conferring greater resistance and resilience (e.g.
small body size, desiccation tolerance, and generalist feeding strategies) making them less susceptible to water
withdrawals. Consequently, adverse responses to water withdrawals (e.g. reduced richness and lower
Ephemeroptera, Plecoptera and Trichoptera (EPT) density) would be greatest for high elevation river segments
with small watershed areas.
METHODS
Study area
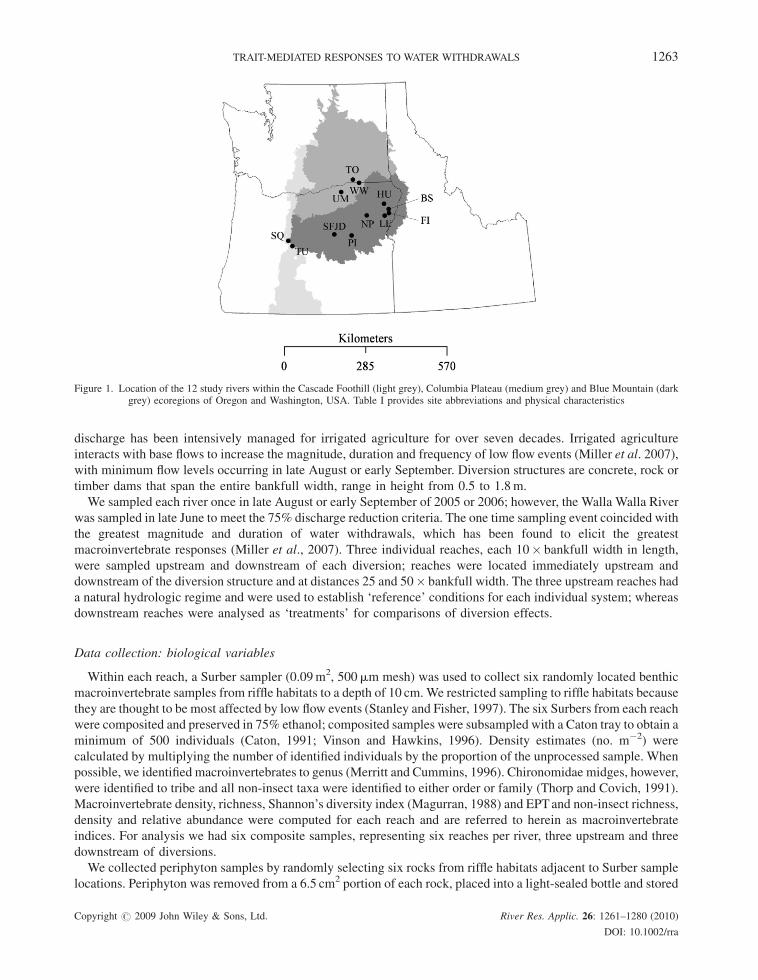
We studied 12 lotic systems within the Blue Mountains, Columbia Plateau and Cascade Foothills ecoregions
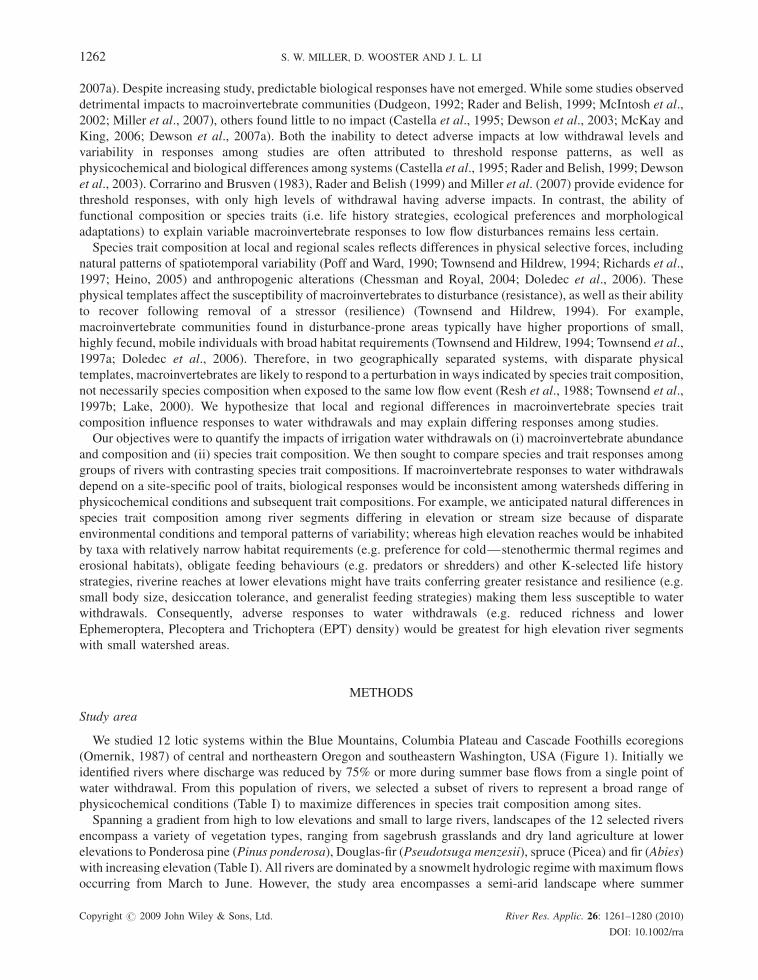
(Omernik, 1987) of central and northeastern Oregon and southeastern Washington, USA (Figure 1). Initially we
identified rivers where discharge was reduced by 75% or more during summer base flows from a single point of
water withdrawal. From this population of rivers, we selected a subset of rivers to represent a broad range of
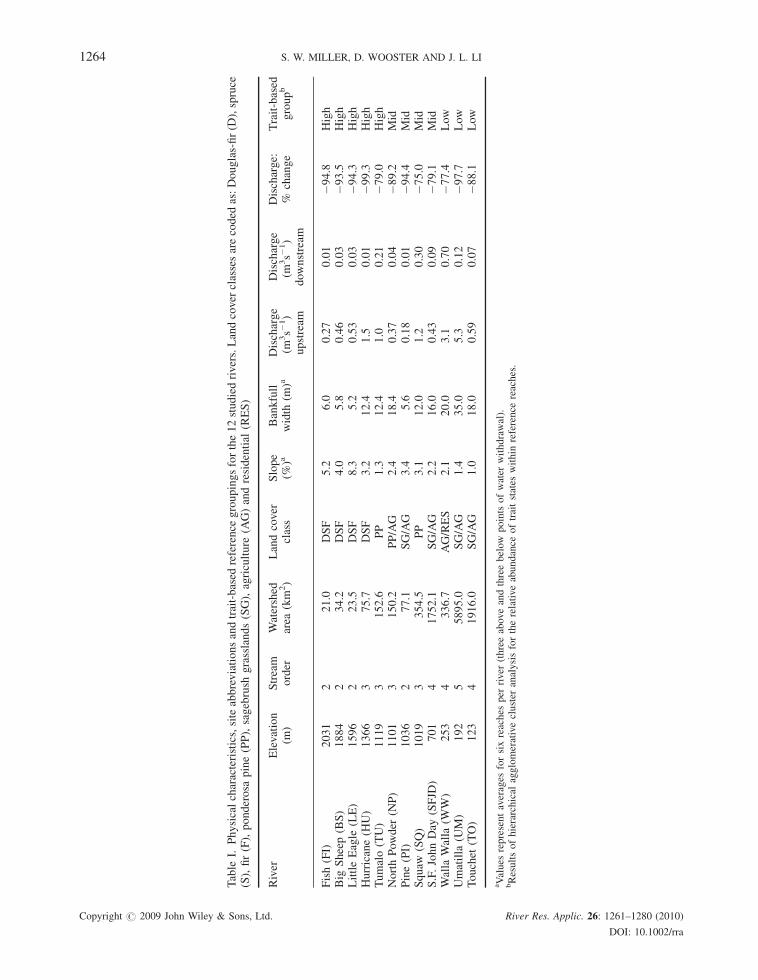
physicochemical conditions (Table I) to maximize differences in species trait composition among sites.
Spanning a gradient from high to low elevations and small to large rivers, landscapes of the 12 selected rivers
encompass a variety of vegetation types, ranging from sagebrush grasslands and dry land agriculture at lower
elevations to Ponderosa pine (Pinus ponderosa), Douglas-fir (Pseudotsuga menzesii), spruce (Picea) and fir (Abies)
with increasing elevation (Table I). All rivers are dominated by a snowmelt hydrologic regimewith maximum flows
occurring from March to June. However, the study area encompasses a semi-arid landscape where summer
Copyright # 2009 John Wiley & Sons, Ltd. River Res. Applic. 26: 1261–1280 (2010)
DOI: 10.1002/rra
1262 S. W. MILLER, D. WOOSTER AND J. L. LI
discharge has been intensively managed for irrigated agriculture for over seven decades. Irrigated agriculture
interacts with base flows to increase the magnitude, duration and frequency of low flow events (Miller et al. 2007),
with minimum flow levels occurring in late August or early September. Diversion structures are concrete, rock or
timber dams that span the entire bankfull width, range in height from 0.5 to 1.8m.
We sampled each river once in late August or early September of 2005 or 2006; however, the Walla Walla River
was sampled in late June to meet the 75% discharge reduction criteria. The one time sampling event coincided with
the greatest magnitude and duration of water withdrawals, which has been found to elicit the greatest
macroinvertebrate responses (Miller et al., 2007). Three individual reaches, each 10� bankfull width in length,
were sampled upstream and downstream of each diversion; reaches were located immediately upstream and
downstream of the diversion structure and at distances 25 and 50� bankfull width. The three upstream reaches had
a natural hydrologic regime and were used to establish ‘reference’ conditions for each individual system; whereas
downstream reaches were analysed as ‘treatments’ for comparisons of diversion effects.
Data collection: biological variables
Within each reach, a Surber sampler (0.09m2, 500mm mesh) was used to collect six randomly located benthic
macroinvertebrate samples from riffle habitats to a depth of 10 cm. We restricted sampling to riffle habitats because
they are thought to be most affected by low flow events (Stanley and Fisher, 1997). The six Surbers from each reach
were composited and preserved in 75% ethanol; composited samples were subsampled with a Caton tray to obtain a
minimum of 500 individuals (Caton, 1991; Vinson and Hawkins, 1996). Density estimates (no. m�2) were
calculated by multiplying the number of identified individuals by the proportion of the unprocessed sample. When
possible, we identified macroinvertebrates to genus (Merritt and Cummins, 1996). Chironomidae midges, however,
were identified to tribe and all non-insect taxa were identified to either order or family (Thorp and Covich, 1991).
Macroinvertebrate density, richness, Shannon’s diversity index (Magurran, 1988) and EPTand non-insect richness,
density and relative abundance were computed for each reach and are referred to herein as macroinvertebrate
indices. For analysis we had six composite samples, representing six reaches per river, three upstream and three
downstream of diversions.
We collected periphyton samples by randomly selecting six rocks from riffle habitats adjacent to Surber sample
locations. Periphyton was removed from a 6.5 cm2 portion of each rock, placed into a light-sealed bottle and stored
Figure 1. Location of the 12 study rivers within the Cascade Foothill (light grey), Columbia Plateau (medium grey) and Blue Mountain (darkgrey) ecoregions of Oregon and Washington, USA. Table I provides site abbreviations and physical characteristics
Copyright # 2009 John Wiley & Sons, Ltd. River Res. Applic. 26: 1261–1280 (2010)
DOI: 10.1002/rra
TRAIT-MEDIATED RESPONSES TO WATER WITHDRAWALS 1263
Table
I.Physicalcharacteristics,siteabbreviationsandtrait-based
reference
groupingsforthe12studiedrivers.Landcover
classesarecoded
as:Douglas-fir(D
),spruce
(S),fir(F),ponderosa
pine(PP),sagebrush
grasslands(SG),agriculture
(AG)andresidential
(RES)
River
Elevation
(m)
Stream
order
Watershed
area
(km
2)
Landcover
class
Slope
(%)a
Bankfull
width
(m)a
Discharge
(m3s�
1)
upstream
Discharge
(m3s�
1)
downstream
Discharge:
%change
Trait-based
groupb
Fish(FI)
2031
221.0
DSF
5.2
6.0
0.27
0.01
�94.8
High
Big
Sheep(BS)
1884
234.2
DSF
4.0
5.8
0.46
0.03
�93.5
High
LittleEagle
(LE)
1596
223.5
DSF
8.3
5.2
0.53
0.03
�94.3
High
Hurricane(H
U)
1366
375.7
DSF
3.2
12.4
1.5
0.01
�99.3
High
Tumalo(TU)
1119
3152.6
PP
1.3
12.4
1.0
0.21
�79.0
High
NorthPowder
(NP)
1101
3150.2
PP/AG
2.4
18.4
0.37
0.04
�89.2
Mid
Pine(PI)
1036
277.1
SG/AG
3.4
5.6
0.18
0.01
�94.4
Mid
Squaw
(SQ)
1019
3354.5
PP
3.1
12.0
1.2
0.30
�75.0
Mid
S.F.JohnDay
(SFJD
)701
41752.1
SG/AG
2.2
16.0
0.43
0.09
�79.1
Mid
Walla
Walla
(WW)
253
4336.7
AG/RES
2.1
20.0
3.1
0.70
�77.4
Low
Umatilla
(UM)
192
55895.0
SG/AG
1.4
35.0
5.3
0.12
�97.7
Low
Touchet
(TO)
123
41916.0
SG/AG
1.0
18.0
0.59
0.07
�88.1
Low
aValues
representaverages
forsixreaches
per
river
(threeaboveandthreebelow
pointsofwater
withdrawal).
bResultsofhierarchical
agglomerativecluster
analysisfortherelativeabundance
oftraitstates
within
reference
reaches.
Copyright # 2009 John Wiley & Sons, Ltd. River Res. Applic. 26: 1261–1280 (2010)
DOI: 10.1002/rra
1264 S. W. MILLER, D. WOOSTER AND J. L. LI
frozen. Defrosted samples were split with a plankton splitter for determination of ash-free dry mass (AFDM)
(Steinman and Lamberti, 1996) and biomass of chlorophyll-a. We used hot ethanol to extract chlorophyll-a
(Sartory and Grobbelaar, 1984) and spectrophotometry of the filtrate for biomass determination using the equation
of Steinman and Lamberti (1996).
Data collection: species traits
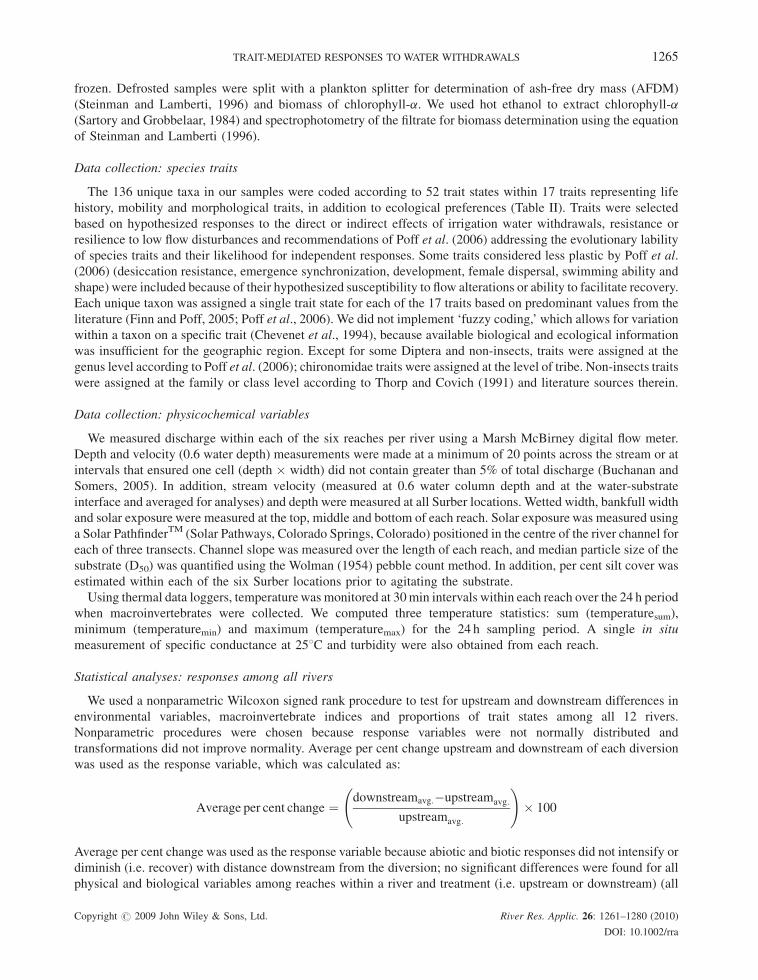
The 136 unique taxa in our samples were coded according to 52 trait states within 17 traits representing life
history, mobility and morphological traits, in addition to ecological preferences (Table II). Traits were selected
based on hypothesized responses to the direct or indirect effects of irrigation water withdrawals, resistance or
resilience to low flow disturbances and recommendations of Poff et al. (2006) addressing the evolutionary lability
of species traits and their likelihood for independent responses. Some traits considered less plastic by Poff et al.
(2006) (desiccation resistance, emergence synchronization, development, female dispersal, swimming ability and
shape) were included because of their hypothesized susceptibility to flow alterations or ability to facilitate recovery.
Each unique taxon was assigned a single trait state for each of the 17 traits based on predominant values from the
literature (Finn and Poff, 2005; Poff et al., 2006). We did not implement ‘fuzzy coding,’ which allows for variation
within a taxon on a specific trait (Chevenet et al., 1994), because available biological and ecological information
was insufficient for the geographic region. Except for some Diptera and non-insects, traits were assigned at the
genus level according to Poff et al. (2006); chironomidae traits were assigned at the level of tribe. Non-insects traits
were assigned at the family or class level according to Thorp and Covich (1991) and literature sources therein.
Data collection: physicochemical variables
We measured discharge within each of the six reaches per river using a Marsh McBirney digital flow meter.
Depth and velocity (0.6 water depth) measurements were made at a minimum of 20 points across the stream or at
intervals that ensured one cell (depth � width) did not contain greater than 5% of total discharge (Buchanan and
Somers, 2005). In addition, stream velocity (measured at 0.6 water column depth and at the water-substrate
interface and averaged for analyses) and depth were measured at all Surber locations. Wetted width, bankfull width
and solar exposure were measured at the top, middle and bottom of each reach. Solar exposure was measured using
a Solar PathfinderTM (Solar Pathways, Colorado Springs, Colorado) positioned in the centre of the river channel for
each of three transects. Channel slope was measured over the length of each reach, and median particle size of the
substrate (D50) was quantified using the Wolman (1954) pebble count method. In addition, per cent silt cover was
estimated within each of the six Surber locations prior to agitating the substrate.
Using thermal data loggers, temperature was monitored at 30min intervals within each reach over the 24 h period
when macroinvertebrates were collected. We computed three temperature statistics: sum (temperaturesum),
minimum (temperaturemin) and maximum (temperaturemax) for the 24 h sampling period. A single in situ
measurement of specific conductance at 258C and turbidity were also obtained from each reach.
Statistical analyses: responses among all rivers
We used a nonparametric Wilcoxon signed rank procedure to test for upstream and downstream differences in
environmental variables, macroinvertebrate indices and proportions of trait states among all 12 rivers.
Nonparametric procedures were chosen because response variables were not normally distributed and
transformations did not improve normality. Average per cent change upstream and downstream of each diversion
was used as the response variable, which was calculated as:
Average per cent change ¼ downstreamavg:�upstreamavg:
upstreamavg:
!� 100
Average per cent change was used as the response variable because abiotic and biotic responses did not intensify or
diminish (i.e. recover) with distance downstream from the diversion; no significant differences were found for all
physical and biological variables among reaches within a river and treatment (i.e. upstream or downstream) (all
Copyright # 2009 John Wiley & Sons, Ltd. River Res. Applic. 26: 1261–1280 (2010)
DOI: 10.1002/rra
TRAIT-MEDIATED RESPONSES TO WATER WITHDRAWALS 1265
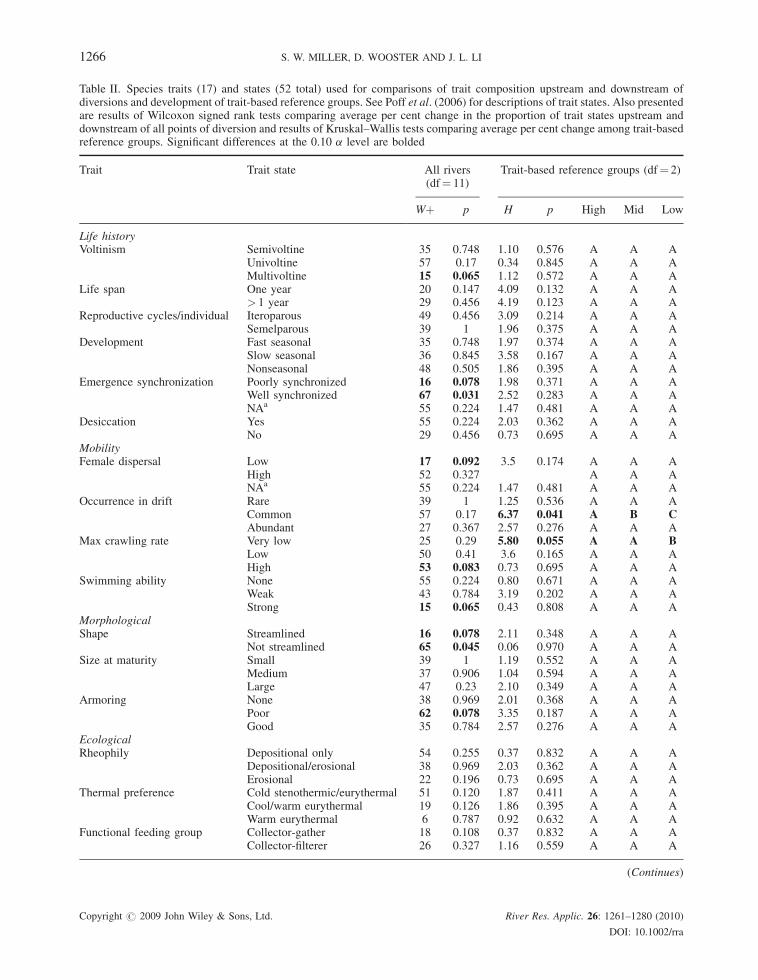
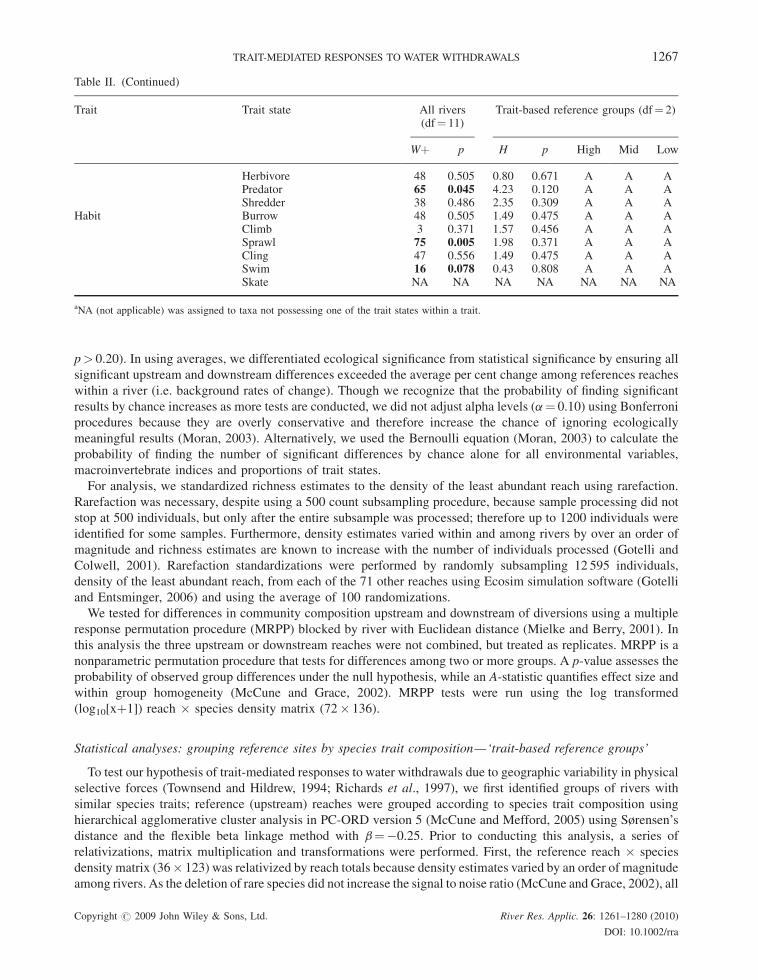
Table II. Species traits (17) and states (52 total) used for comparisons of trait composition upstream and downstream ofdiversions and development of trait-based reference groups. See Poff et al. (2006) for descriptions of trait states. Also presentedare results of Wilcoxon signed rank tests comparing average per cent change in the proportion of trait states upstream anddownstream of all points of diversion and results of Kruskal–Wallis tests comparing average per cent change among trait-basedreference groups. Significant differences at the 0.10 a level are bolded
Trait Trait state All rivers(df¼ 11)
Trait-based reference groups (df¼ 2)
Wþ p H p High Mid Low
Life historyVoltinism Semivoltine 35 0.748 1.10 0.576 A A A
Univoltine 57 0.17 0.34 0.845 A A AMultivoltine 15 0.065 1.12 0.572 A A A
Life span One year 20 0.147 4.09 0.132 A A A> 1 year 29 0.456 4.19 0.123 A A A
Reproductive cycles/individual Iteroparous 49 0.456 3.09 0.214 A A ASemelparous 39 1 1.96 0.375 A A A
Development Fast seasonal 35 0.748 1.97 0.374 A A ASlow seasonal 36 0.845 3.58 0.167 A A ANonseasonal 48 0.505 1.86 0.395 A A A
Emergence synchronization Poorly synchronized 16 0.078 1.98 0.371 A A AWell synchronized 67 0.031 2.52 0.283 A A ANAa 55 0.224 1.47 0.481 A A A
Desiccation Yes 55 0.224 2.03 0.362 A A ANo 29 0.456 0.73 0.695 A A A
MobilityFemale dispersal Low 17 0.092 3.5 0.174 A A A
High 52 0.327 A A ANAa 55 0.224 1.47 0.481 A A A
Occurrence in drift Rare 39 1 1.25 0.536 A A ACommon 57 0.17 6.37 0.041 A B CAbundant 27 0.367 2.57 0.276 A A A
Max crawling rate Very low 25 0.29 5.80 0.055 A A BLow 50 0.41 3.6 0.165 A A AHigh 53 0.083 0.73 0.695 A A A
Swimming ability None 55 0.224 0.80 0.671 A A AWeak 43 0.784 3.19 0.202 A A AStrong 15 0.065 0.43 0.808 A A A
MorphologicalShape Streamlined 16 0.078 2.11 0.348 A A A
Not streamlined 65 0.045 0.06 0.970 A A ASize at maturity Small 39 1 1.19 0.552 A A A
Medium 37 0.906 1.04 0.594 A A ALarge 47 0.23 2.10 0.349 A A A
Armoring None 38 0.969 2.01 0.368 A A APoor 62 0.078 3.35 0.187 A A AGood 35 0.784 2.57 0.276 A A A
EcologicalRheophily Depositional only 54 0.255 0.37 0.832 A A A
Depositional/erosional 38 0.969 2.03 0.362 A A AErosional 22 0.196 0.73 0.695 A A A
Thermal preference Cold stenothermic/eurythermal 51 0.120 1.87 0.411 A A ACool/warm eurythermal 19 0.126 1.86 0.395 A A AWarm eurythermal 6 0.787 0.92 0.632 A A A
Functional feeding group Collector-gather 18 0.108 0.37 0.832 A A ACollector-filterer 26 0.327 1.16 0.559 A A A
(Continues)
Copyright # 2009 John Wiley & Sons, Ltd. River Res. Applic. 26: 1261–1280 (2010)
DOI: 10.1002/rra
1266 S. W. MILLER, D. WOOSTER AND J. L. LI
p> 0.20). In using averages, we differentiated ecological significance from statistical significance by ensuring all
significant upstream and downstream differences exceeded the average per cent change among references reaches
within a river (i.e. background rates of change). Though we recognize that the probability of finding significant
results by chance increases as more tests are conducted, we did not adjust alpha levels (a¼ 0.10) using Bonferroni
procedures because they are overly conservative and therefore increase the chance of ignoring ecologically
meaningful results (Moran, 2003). Alternatively, we used the Bernoulli equation (Moran, 2003) to calculate the
probability of finding the number of significant differences by chance alone for all environmental variables,
macroinvertebrate indices and proportions of trait states.
For analysis, we standardized richness estimates to the density of the least abundant reach using rarefaction.
Rarefaction was necessary, despite using a 500 count subsampling procedure, because sample processing did not
stop at 500 individuals, but only after the entire subsample was processed; therefore up to 1200 individuals were
identified for some samples. Furthermore, density estimates varied within and among rivers by over an order of
magnitude and richness estimates are known to increase with the number of individuals processed (Gotelli and
Colwell, 2001). Rarefaction standardizations were performed by randomly subsampling 12 595 individuals,
density of the least abundant reach, from each of the 71 other reaches using Ecosim simulation software (Gotelli
and Entsminger, 2006) and using the average of 100 randomizations.
We tested for differences in community composition upstream and downstream of diversions using a multiple
response permutation procedure (MRPP) blocked by river with Euclidean distance (Mielke and Berry, 2001). In
this analysis the three upstream or downstream reaches were not combined, but treated as replicates. MRPP is a
nonparametric permutation procedure that tests for differences among two or more groups. A p-value assesses the
probability of observed group differences under the null hypothesis, while an A-statistic quantifies effect size and
within group homogeneity (McCune and Grace, 2002). MRPP tests were run using the log transformed
(log10[xþ1]) reach � species density matrix (72� 136).
Statistical analyses: grouping reference sites by species trait composition—‘trait-based reference groups’
To test our hypothesis of trait-mediated responses to water withdrawals due to geographic variability in physical
selective forces (Townsend and Hildrew, 1994; Richards et al., 1997), we first identified groups of rivers with
similar species traits; reference (upstream) reaches were grouped according to species trait composition using
hierarchical agglomerative cluster analysis in PC-ORD version 5 (McCune and Mefford, 2005) using Sørensen’s
distance and the flexible beta linkage method with b¼�0.25. Prior to conducting this analysis, a series of
relativizations, matrix multiplication and transformations were performed. First, the reference reach � species
density matrix (36� 123) was relativized by reach totals because density estimates varied by an order of magnitude
among rivers. As the deletion of rare species did not increase the signal to noise ratio (McCune and Grace, 2002), all
Table II. (Continued)
Trait Trait state All rivers(df¼ 11)
Trait-based reference groups (df¼ 2)
Wþ p H p High Mid Low
Herbivore 48 0.505 0.80 0.671 A A APredator 65 0.045 4.23 0.120 A A AShredder 38 0.486 2.35 0.309 A A A
Habit Burrow 48 0.505 1.49 0.475 A A AClimb 3 0.371 1.57 0.456 A A ASprawl 75 0.005 1.98 0.371 A A ACling 47 0.556 1.49 0.475 A A ASwim 16 0.078 0.43 0.808 A A ASkate NA NA NA NA NA NA NA
aNA (not applicable) was assigned to taxa not possessing one of the trait states within a trait.
Copyright # 2009 John Wiley & Sons, Ltd. River Res. Applic. 26: 1261–1280 (2010)
DOI: 10.1002/rra
TRAIT-MEDIATED RESPONSES TO WATER WITHDRAWALS 1267
species were retained within this matrix. Second, we multiplied the reference reach � species density matrix
(36� 123) by the species � trait matrix (123� 52) to obtain the relative abundance of a trait state within a reach.
The resulting matrix (36� 52) was transformed using arcsine-squareroot to improve distributional properties of the
data. Finally, indicator species analysis (ISA) was used to quantitatively determine the most ecologically
meaningful point for pruning the cluster analysis dendogram (Dufrene and Legendre, 1997). This technique
identified the grouping level at which trait states have maximum discriminatory efficiency among groups of rivers.
Specifically, an average p-value for all 52 trait state indicator values was obtained at each grouping level in the
dendogram. The dendogram was pruned at the grouping level yielding the lowest average p-value.
To identify trait states characteristic of individual trait-based reference groups derived from cluster analysis, we
overlaid groups onto a non-metric multidimensional scaling (NMS) ordination of reference reaches ordinated by
the relative abundance of species traits (i.e. same reference reach � species trait matrix (36� 52) used in cluster
analysis). NMS is an indirect gradient analysis technique that uses rank community dissimilarities to iteratively
search for the optimal arrangement of sample objects in as few dimensions as possible (McCune and Grace, 2002).
NMS was run with Sørensen’s distance in PC-ORD version 5 (McCune and Mefford, 2005). We assessed
dimensionality by evaluating the relationship of final stress versus the number of dimensions; in addition, a Monte
Carlo test with 250 runs of the randomized data quantified the probability of observing a stress as low as or lower
than that observed through chance alone. Ordination solutions were rigidly rotated to maximize loadings of
environmental variables with individual ordination axes. Pearson correlation coefficients for the relationship of
individual trait states with ordination axis scores were used to assess the relative abundance of trait states within
groups. A value of 0.40 was chosen as a cutoff for interpreting ecologically meaningful correlations, which was
more conservative than the Pearson coefficient corresponding to statistical significance (r¼ 0.32).
Statistical analyses: trait-mediated responses to water withdrawals
To test for trait-mediated responses to water withdrawals we compared average per cent upstream and
downstream change in environmental variables, macroinvertebrate indices and trait proportions among trait-based
reference groups using a Kruskal–Wallis test. Again, we used a nonparametric procedure because transformations
did not alleviate departures from normality and unequal variances. Upstream and downstream differences in
community composition among trait-based reference groups were compared using compositional vectors
(McCune, 1992), which dissect compositional changes into the magnitude and direction of change in ordination
space. For our application, the magnitude and direction of change upstream and downstream of individual
diversions was computed using Sørensen’s distance of log transformed (log10[xþ1]) macroinvertebrate densities
and compared among trait-based reference groups with MRPP.
RESULTS
Responses among all rivers: physicochemical variables
In accordance with our selection criteria, discharge reductions ranged from 75 to 99%, with half the sites
experiencing more than 90% water withdrawal (Table I). Although continuous discharge data were not available,
withdrawal amounts exceeded 75% of ambient levels from June to September for all rivers except the Walla Walla,
which met this requirement in June only (Miller, personal communication with irrigation districts). Mean velocity,
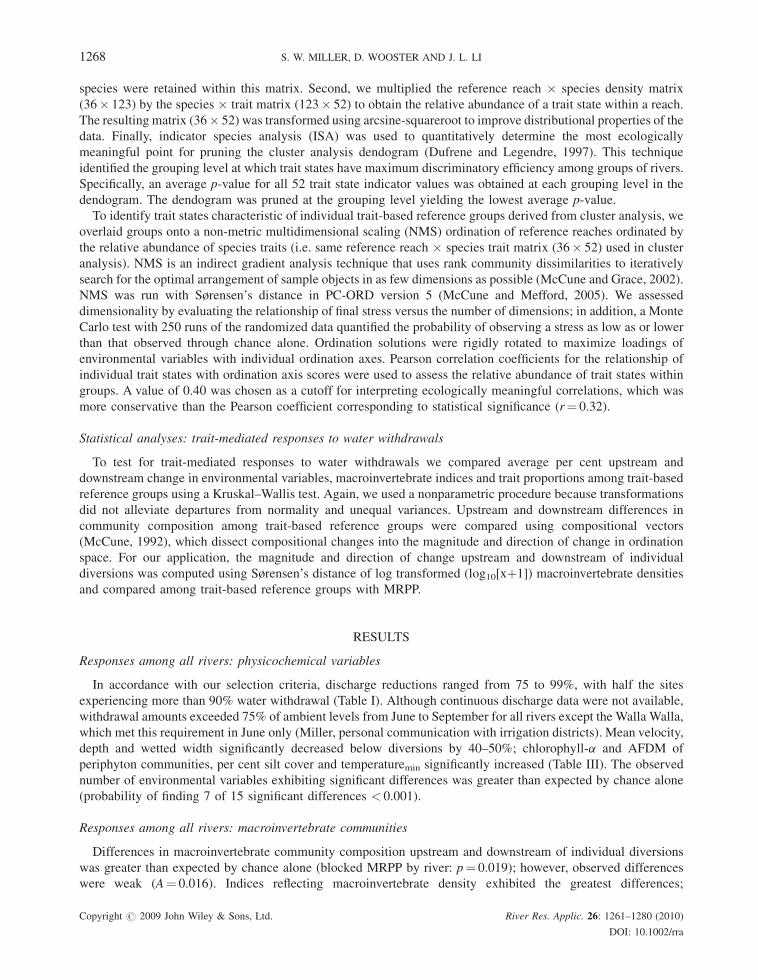
depth and wetted width significantly decreased below diversions by 40–50%; chlorophyll-a and AFDM of
periphyton communities, per cent silt cover and temperaturemin significantly increased (Table III). The observed
number of environmental variables exhibiting significant differences was greater than expected by chance alone
(probability of finding 7 of 15 significant differences < 0.001).
Responses among all rivers: macroinvertebrate communities
Differences in macroinvertebrate community composition upstream and downstream of individual diversions
was greater than expected by chance alone (blocked MRPP by river: p¼ 0.019); however, observed differences
were weak (A¼ 0.016). Indices reflecting macroinvertebrate density exhibited the greatest differences;
Copyright # 2009 John Wiley & Sons, Ltd. River Res. Applic. 26: 1261–1280 (2010)
DOI: 10.1002/rra
1268 S. W. MILLER, D. WOOSTER AND J. L. LI
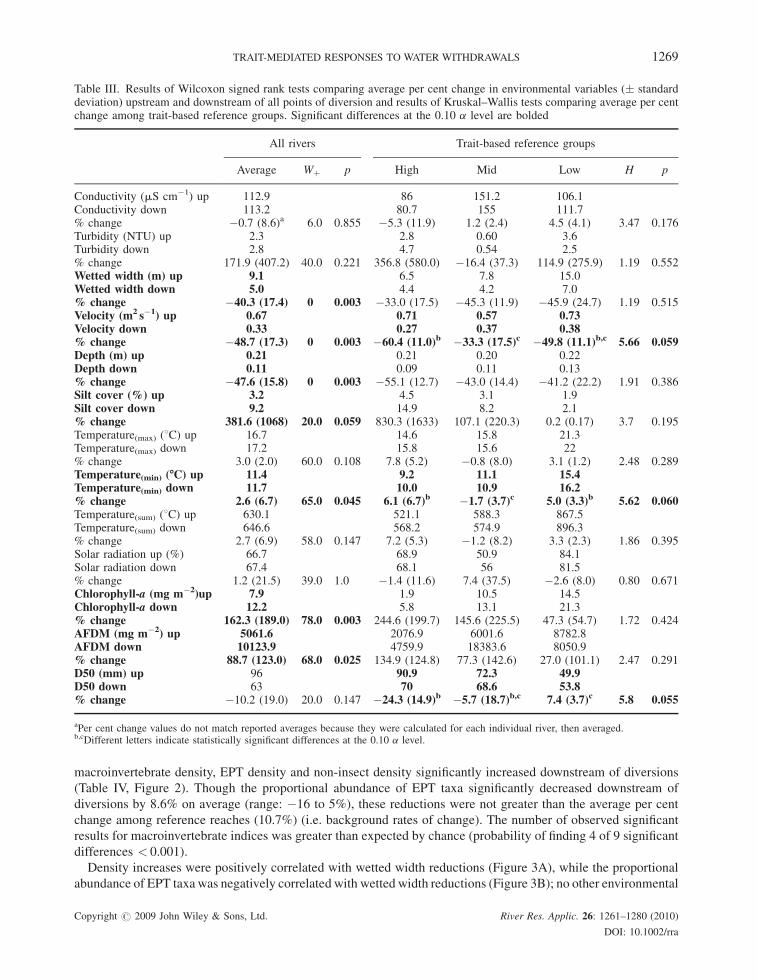
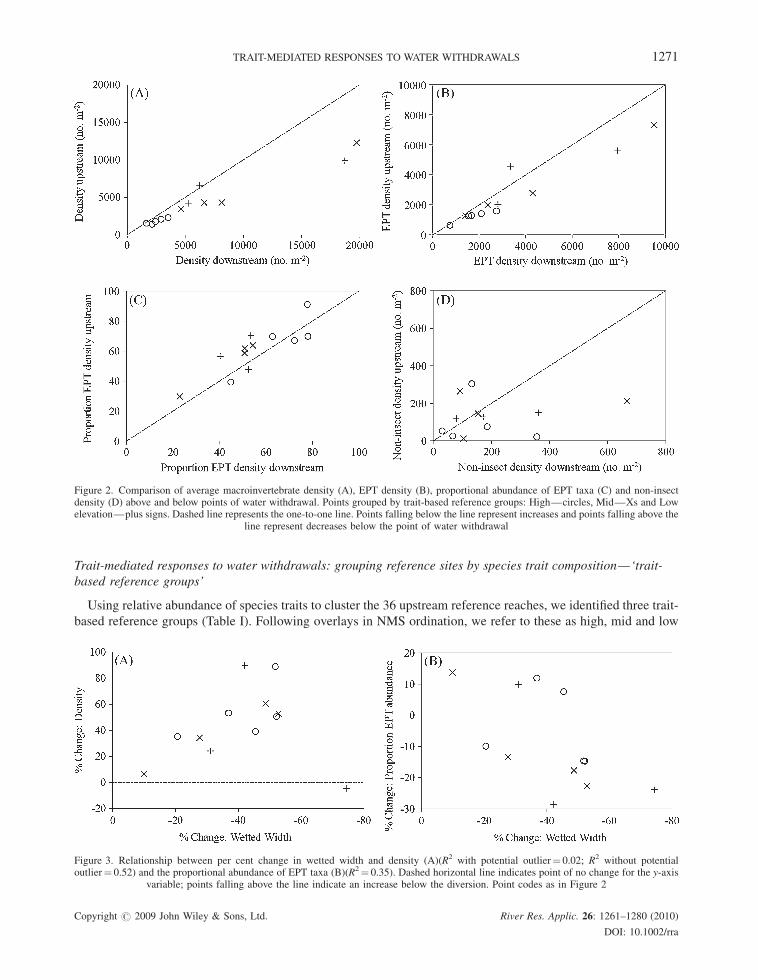
macroinvertebrate density, EPT density and non-insect density significantly increased downstream of diversions
(Table IV, Figure 2). Though the proportional abundance of EPT taxa significantly decreased downstream of
diversions by 8.6% on average (range: �16 to 5%), these reductions were not greater than the average per cent
change among reference reaches (10.7%) (i.e. background rates of change). The number of observed significant
results for macroinvertebrate indices was greater than expected by chance (probability of finding 4 of 9 significant
differences < 0.001).
Density increases were positively correlated with wetted width reductions (Figure 3A), while the proportional
abundance of EPT taxa was negatively correlated with wetted width reductions (Figure 3B); no other environmental
Table III. Results of Wilcoxon signed rank tests comparing average per cent change in environmental variables (� standarddeviation) upstream and downstream of all points of diversion and results of Kruskal–Wallis tests comparing average per centchange among trait-based reference groups. Significant differences at the 0.10 a level are bolded
All rivers Trait-based reference groups
Average Wþ p High Mid Low H p
Conductivity (mS cm�1) up 112.9 86 151.2 106.1Conductivity down 113.2 80.7 155 111.7% change �0.7 (8.6)a 6.0 0.855 �5.3 (11.9) 1.2 (2.4) 4.5 (4.1) 3.47 0.176Turbidity (NTU) up 2.3 2.8 0.60 3.6Turbidity down 2.8 4.7 0.54 2.5% change 171.9 (407.2) 40.0 0.221 356.8 (580.0) �16.4 (37.3) 114.9 (275.9) 1.19 0.552Wetted width (m) up 9.1 6.5 7.8 15.0Wetted width down 5.0 4.4 4.2 7.0% change �40.3 (17.4) 0 0.003 �33.0 (17.5) �45.3 (11.9) �45.9 (24.7) 1.19 0.515Velocity (m2 s�1) up 0.67 0.71 0.57 0.73Velocity down 0.33 0.27 0.37 0.38% change �48.7 (17.3) 0 0.003 �60.4 (11.0)b �33.3 (17.5)c �49.8 (11.1)b,c 5.66 0.059Depth (m) up 0.21 0.21 0.20 0.22Depth down 0.11 0.09 0.11 0.13% change �47.6 (15.8) 0 0.003 �55.1 (12.7) �43.0 (14.4) �41.2 (22.2) 1.91 0.386Silt cover (%) up 3.2 4.5 3.1 1.9Silt cover down 9.2 14.9 8.2 2.1% change 381.6 (1068) 20.0 0.059 830.3 (1633) 107.1 (220.3) 0.2 (0.17) 3.7 0.195Temperature(max) (8C) up 16.7 14.6 15.8 21.3Temperature(max) down 17.2 15.8 15.6 22% change 3.0 (2.0) 60.0 0.108 7.8 (5.2) �0.8 (8.0) 3.1 (1.2) 2.48 0.289Temperature(min) (-C) up 11.4 9.2 11.1 15.4Temperature(min) down 11.7 10.0 10.9 16.2% change 2.6 (6.7) 65.0 0.045 6.1 (6.7)b �1.7 (3.7)c 5.0 (3.3)b 5.62 0.060Temperature(sum) (8C) up 630.1 521.1 588.3 867.5Temperature(sum) down 646.6 568.2 574.9 896.3% change 2.7 (6.9) 58.0 0.147 7.2 (5.3) �1.2 (8.2) 3.3 (2.3) 1.86 0.395Solar radiation up (%) 66.7 68.9 50.9 84.1Solar radiation down 67.4 68.1 56 81.5% change 1.2 (21.5) 39.0 1.0 �1.4 (11.6) 7.4 (37.5) �2.6 (8.0) 0.80 0.671Chlorophyll-a (mg m�2)up 7.9 1.9 10.5 14.5Chlorophyll-a down 12.2 5.8 13.1 21.3% change 162.3 (189.0) 78.0 0.003 244.6 (199.7) 145.6 (225.5) 47.3 (54.7) 1.72 0.424AFDM (mg m�2) up 5061.6 2076.9 6001.6 8782.8AFDM down 10123.9 4759.9 18383.6 8050.9% change 88.7 (123.0) 68.0 0.025 134.9 (124.8) 77.3 (142.6) 27.0 (101.1) 2.47 0.291D50 (mm) up 96 90.9 72.3 49.9D50 down 63 70 68.6 53.8% change �10.2 (19.0) 20.0 0.147 �24.3 (14.9)b �5.7 (18.7)b,c 7.4 (3.7)c 5.8 0.055
aPer cent change values do not match reported averages because they were calculated for each individual river, then averaged.b,cDifferent letters indicate statistically significant differences at the 0.10 a level.
Copyright # 2009 John Wiley & Sons, Ltd. River Res. Applic. 26: 1261–1280 (2010)
DOI: 10.1002/rra
TRAIT-MEDIATED RESPONSES TO WATER WITHDRAWALS 1269
variables, including discharge reduction, showed significant relationships with macroinvertebrates indices. The
paucity of significant relationships among discharge reductions and variability in the magnitude or direction of
macroinvertebrate responses (correlation of per cent water withdrawal with all macroinvertebrates metrics:
r< 0.15, p> 0.10), suggests the range of sampled water withdrawal levels (75–99%) did not confound the detection
of significant differences.
Responses among all rivers: species traits
Tweleve trait states representing each of the four major trait categories (life history, mobility, morphological and
ecological) significantly differed upstream and downstream of all points of diversion (Table II). Trait states
exhibiting significant downstream differences were related to: (i) functional feeding groups (predators increased
(Figure 4A)); (ii) habit (sprawlers increased (Figure 4B); swimmers decreased (Figure 4C)); (iii) streamlining
(streamlined decreased (Figure 4D)); not streamlined increased); (iv) aromoring (poor armoring increased);
(v) dispersal (strong swimming ability decreased; low adult dispersal decreased (Figure 4E)); high crawling rate
increased (Figure 4F)); (vi) voltinism (multivoltine and increased (Figure 4G)) and (vii) emergence
synchronization (poorly synchronized decreased; well synchronized increased (Figure 4H)). The number of
species traits exhibiting significant downstream differences was greater than expected by chance (probability of
observing 12 of 52 significant differences < 0.001).
Table IV. Results of Wilcoxon signed rank tests comparing average per cent change in macroinvertebrate indices (� standarddeviation) upstream and downstream of diversions and results of Kruskal–Wallis tests comparing average per cent changeamong trait-based groups. Significant differences at the 0.10 a level are bolded
All rivers Trait-based reference groups
Average Wþ p High Mid Low H p
Density (no. m�2) up 2441.8 1836.3 6096.6 6880.2Density down 3697.6 2538.1 9791.5 10076.6% change 44.3 (29.3)a 77.0 0.003 37.0 (18.7) 59.3 (22.7) 36.5 (48.5) 1.44 0.484Richness up 27.1 24.3 34.2 28.3Richness down 28.4 26.7 33.8 30.9% change 5.4 (12.7) 56.5 0.196 10.4 (12.7) �1.3 (7.9) 9.2 (9.3) 2.89 0.236Diversity up 2.4 2.3 2.6 2.6Diversity down 2.5 2.4 2.4 2.8% change 2.2 (11.2) 49.0 0.456 6.9 (11.6) �6.5 (9.5) 5.9 (3.0) 3.96 0.138Non-insect density(no. m�2) up 125.6 95.9 158.3 131.4Non-insect density down 200.5 154.9 255.0 204.5% change 242.9 (481.3) 61.4 0.092 353.8 (678.9) 250.3 (413.6) 48.2 (88.1) 2.03 0.363Non-insect proportion up 3.4 4.7 3.0 2.0Non-insect proportion down 4.0 6.4 2.5 2.1% change 116.4 (313.4) 51.0 0.367 221.0 (477.2) 67.5 (148.5) (148.5) 7.5 (39.2) 0.21 0.898Non-insect richness up 2.6 14.5 17.8 15.1Non-insect richness down 2.8 16.1 16.8 14.8% change 11.9 (26.0) 44.0 0.113 21.8 (21.4) �4.1 (19.7) 16.7 (37.9) 4.19 0.123EPT density (no. m�2) up 2639.7 1234.6 3340.6 4047.0EPT density down 3375.9 1758.7 4401.6 4703.4% change 30.2 (25.0) 73.0 0.009 38.4 (22.3) 28.8 (19.8) 18.3 (38.4) 0.54 0.762EPT proportion up 60.5 67.4 53.5 58.3EPT proportion down 55.1 67.1 44.8 48.8% change �8.6 (15.2) 13.0 0.045 1.7 (13.1) �17.1 (4.1) �14.3 (21.1) 4.18 0.124EPT richness up 15.7 14.5 17.8 15.1EPT richness down 16.0 16.1 16.8 14.8% Change 2.3 (11.8) 41.0 0.505 11.02 (8.3) �5.5 (7.3) �1.9 (14.6) 4.15 0.125
aPer cent change values do not match reported averages because they were calculated for each individual river, then averaged.
Copyright # 2009 John Wiley & Sons, Ltd. River Res. Applic. 26: 1261–1280 (2010)
DOI: 10.1002/rra
1270 S. W. MILLER, D. WOOSTER AND J. L. LI
Trait-mediated responses to water withdrawals: grouping reference sites by species trait composition—‘trait-
based reference groups’
Using relative abundance of species traits to cluster the 36 upstream reference reaches, we identified three trait-
based reference groups (Table I). Following overlays in NMS ordination, we refer to these as high, mid and low
Figure 2. Comparison of average macroinvertebrate density (A), EPT density (B), proportional abundance of EPT taxa (C) and non-insectdensity (D) above and below points of water withdrawal. Points grouped by trait-based reference groups: High—circles, Mid—Xs and Lowelevation—plus signs. Dashed line represents the one-to-one line. Points falling below the line represent increases and points falling above the
line represent decreases below the point of water withdrawal
Figure 3. Relationship between per cent change in wetted width and density (A)(R2 with potential outlier¼ 0.02; R2 without potentialoutlier¼ 0.52) and the proportional abundance of EPT taxa (B)(R2¼ 0.35). Dashed horizontal line indicates point of no change for the y-axis
variable; points falling above the line indicate an increase below the diversion. Point codes as in Figure 2
Copyright # 2009 John Wiley & Sons, Ltd. River Res. Applic. 26: 1261–1280 (2010)
DOI: 10.1002/rra
TRAIT-MEDIATED RESPONSES TO WATER WITHDRAWALS 1271
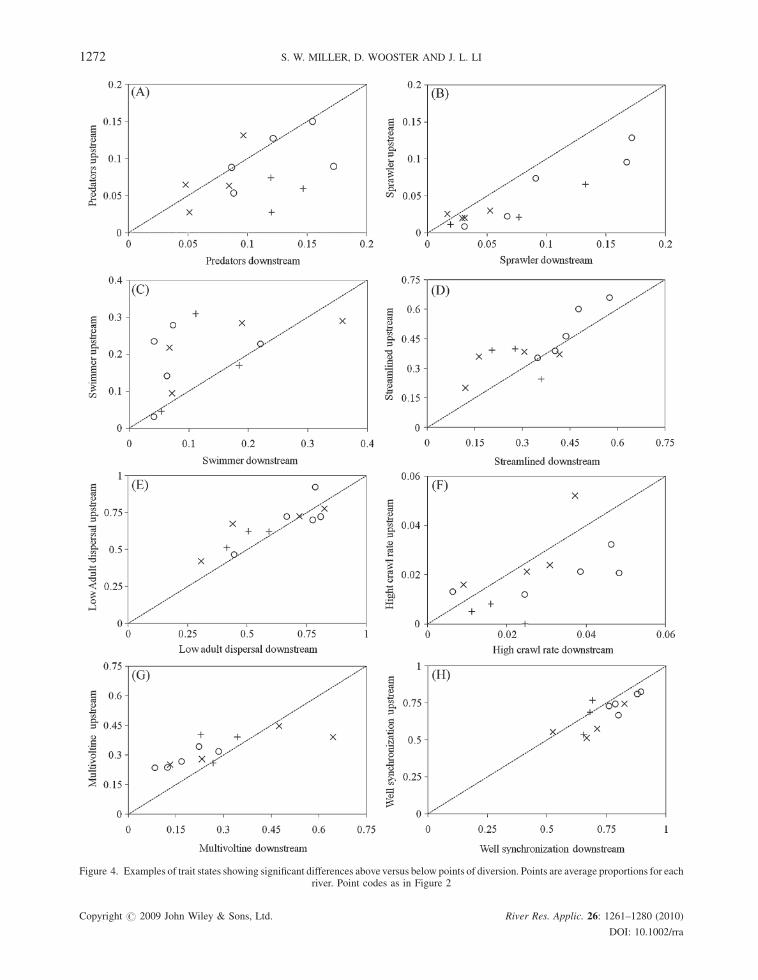
Figure 4. Examples of trait states showing significant differences above versus below points of diversion. Points are average proportions for eachriver. Point codes as in Figure 2
Copyright # 2009 John Wiley & Sons, Ltd. River Res. Applic. 26: 1261–1280 (2010)
DOI: 10.1002/rra
1272 S. W. MILLER, D. WOOSTER AND J. L. LI
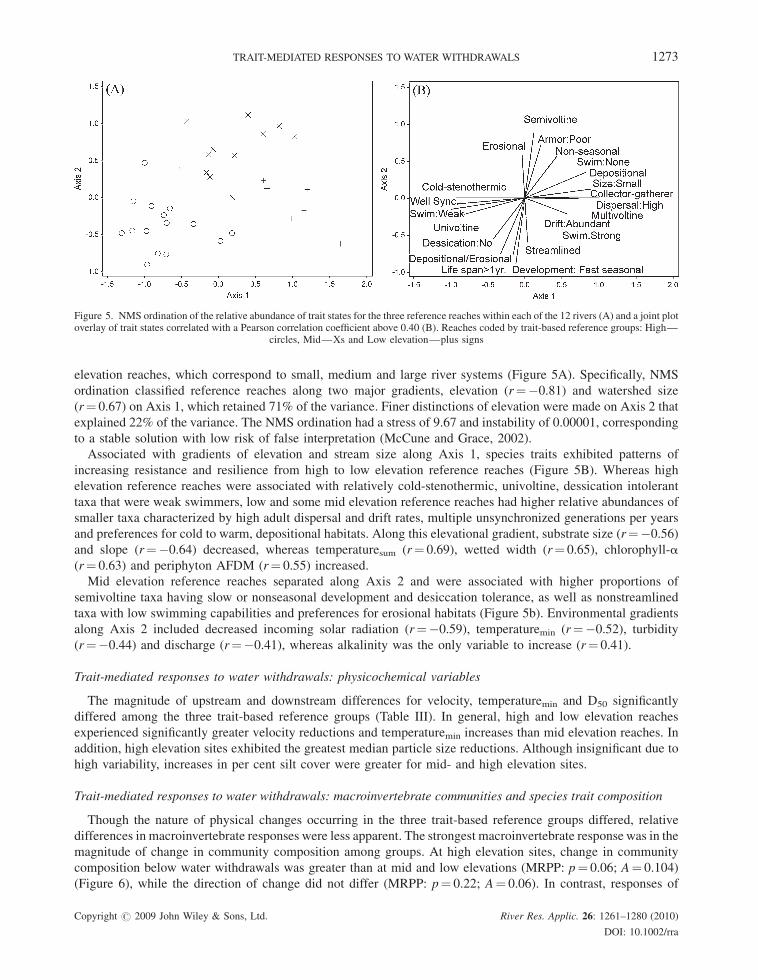
elevation reaches, which correspond to small, medium and large river systems (Figure 5A). Specifically, NMS
ordination classified reference reaches along two major gradients, elevation (r¼�0.81) and watershed size
(r¼ 0.67) on Axis 1, which retained 71% of the variance. Finer distinctions of elevation were made on Axis 2 that
explained 22% of the variance. The NMS ordination had a stress of 9.67 and instability of 0.00001, corresponding
to a stable solution with low risk of false interpretation (McCune and Grace, 2002).
Associated with gradients of elevation and stream size along Axis 1, species traits exhibited patterns of
increasing resistance and resilience from high to low elevation reference reaches (Figure 5B). Whereas high
elevation reference reaches were associated with relatively cold-stenothermic, univoltine, dessication intolerant
taxa that were weak swimmers, low and some mid elevation reference reaches had higher relative abundances of
smaller taxa characterized by high adult dispersal and drift rates, multiple unsynchronized generations per years
and preferences for cold to warm, depositional habitats. Along this elevational gradient, substrate size (r¼�0.56)
and slope (r¼�0.64) decreased, whereas temperaturesum (r¼ 0.69), wetted width (r¼ 0.65), chlorophyll-a(r¼ 0.63) and periphyton AFDM (r¼ 0.55) increased.
Mid elevation reference reaches separated along Axis 2 and were associated with higher proportions of
semivoltine taxa having slow or nonseasonal development and desiccation tolerance, as well as nonstreamlined
taxa with low swimming capabilities and preferences for erosional habitats (Figure 5b). Environmental gradients
along Axis 2 included decreased incoming solar radiation (r¼�0.59), temperaturemin (r¼�0.52), turbidity
(r¼�0.44) and discharge (r¼�0.41), whereas alkalinity was the only variable to increase (r¼ 0.41).
Trait-mediated responses to water withdrawals: physicochemical variables
The magnitude of upstream and downstream differences for velocity, temperaturemin and D50 significantly
differed among the three trait-based reference groups (Table III). In general, high and low elevation reaches
experienced significantly greater velocity reductions and temperaturemin increases than mid elevation reaches. In
addition, high elevation sites exhibited the greatest median particle size reductions. Although insignificant due to
high variability, increases in per cent silt cover were greater for mid- and high elevation sites.
Trait-mediated responses to water withdrawals: macroinvertebrate communities and species trait composition
Though the nature of physical changes occurring in the three trait-based reference groups differed, relative
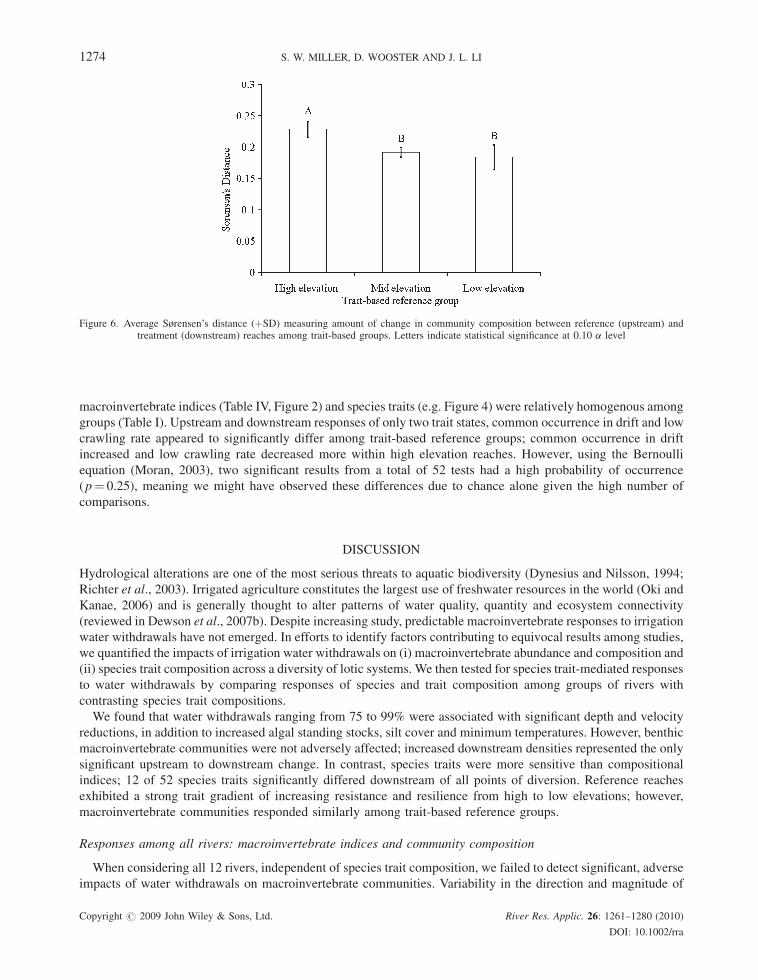
differences in macroinvertebrate responses were less apparent. The strongest macroinvertebrate response was in the
magnitude of change in community composition among groups. At high elevation sites, change in community
composition below water withdrawals was greater than at mid and low elevations (MRPP: p¼ 0.06; A¼ 0.104)
(Figure 6), while the direction of change did not differ (MRPP: p¼ 0.22; A¼ 0.06). In contrast, responses of
Figure 5. NMS ordination of the relative abundance of trait states for the three reference reaches within each of the 12 rivers (A) and a joint plotoverlay of trait states correlated with a Pearson correlation coefficient above 0.40 (B). Reaches coded by trait-based reference groups: High—
circles, Mid—Xs and Low elevation—plus signs
Copyright # 2009 John Wiley & Sons, Ltd. River Res. Applic. 26: 1261–1280 (2010)
DOI: 10.1002/rra
TRAIT-MEDIATED RESPONSES TO WATER WITHDRAWALS 1273
macroinvertebrate indices (Table IV, Figure 2) and species traits (e.g. Figure 4) were relatively homogenous among
groups (Table I). Upstream and downstream responses of only two trait states, common occurrence in drift and low
crawling rate appeared to significantly differ among trait-based reference groups; common occurrence in drift
increased and low crawling rate decreased more within high elevation reaches. However, using the Bernoulli
equation (Moran, 2003), two significant results from a total of 52 tests had a high probability of occurrence
(p¼ 0.25), meaning we might have observed these differences due to chance alone given the high number of
comparisons.
DISCUSSION
Hydrological alterations are one of the most serious threats to aquatic biodiversity (Dynesius and Nilsson, 1994;
Richter et al., 2003). Irrigated agriculture constitutes the largest use of freshwater resources in the world (Oki and
Kanae, 2006) and is generally thought to alter patterns of water quality, quantity and ecosystem connectivity
(reviewed in Dewson et al., 2007b). Despite increasing study, predictable macroinvertebrate responses to irrigation
water withdrawals have not emerged. In efforts to identify factors contributing to equivocal results among studies,
we quantified the impacts of irrigation water withdrawals on (i) macroinvertebrate abundance and composition and
(ii) species trait composition across a diversity of lotic systems. We then tested for species trait-mediated responses
to water withdrawals by comparing responses of species and trait composition among groups of rivers with
contrasting species trait compositions.
We found that water withdrawals ranging from 75 to 99% were associated with significant depth and velocity
reductions, in addition to increased algal standing stocks, silt cover and minimum temperatures. However, benthic
macroinvertebrate communities were not adversely affected; increased downstream densities represented the only
significant upstream to downstream change. In contrast, species traits were more sensitive than compositional
indices; 12 of 52 species traits significantly differed downstream of all points of diversion. Reference reaches
exhibited a strong trait gradient of increasing resistance and resilience from high to low elevations; however,
macroinvertebrate communities responded similarly among trait-based reference groups.
Responses among all rivers: macroinvertebrate indices and community composition
When considering all 12 rivers, independent of species trait composition, we failed to detect significant, adverse
impacts of water withdrawals on macroinvertebrate communities. Variability in the direction and magnitude of
Figure 6. Average Sørensen’s distance (þSD) measuring amount of change in community composition between reference (upstream) andtreatment (downstream) reaches among trait-based groups. Letters indicate statistical significance at 0.10 a level
Copyright # 2009 John Wiley & Sons, Ltd. River Res. Applic. 26: 1261–1280 (2010)
DOI: 10.1002/rra
1274 S. W. MILLER, D. WOOSTER AND J. L. LI
macroinvertebrate responses among systems did not account for the null results, but rather high macroinvertebrate
resistance to water withdrawals exceeding 75% of ambient flow levels.
We observed significant alterations to the quality and quantity of the hydrologic environment, in addition to
increased algal standing stocks, siltation levels and minimum temperatures; however macroinvertebrate
community composition did not change appreciably. Furthermore, most disturbance intolerant indices showed
increasing and not decreasing trends downstream of diversions (positive difference) and no taxon was consistently
exclusive to upstream or downstream reaches within a river. Increased macroinvertebrate density (i.e. overall, EPT
and non-insect) was the only significant response among all rivers, which appeared to occur evenly among
taxonomic groups as macroinvertebrate diversity, taxonomic richness and relative abundance remained unchanged.
These results correspond to those of Castella et al. (1995), McKay and King (2006) and Dewson et al. (2007a), who
did not find negative responses to water withdrawals exceeding 90% of ambient levels.
Observed density changes are a common response of macroinvertebrates to reduced discharge, both natural
(Smith and Pearson, 1987; Stanley et al., 1994; Suren et al., 2003) and anthropogenic (Gore, 1977; Rader and
Belish, 1999; Dewson et al., 2007a). Our observed positive linear relationship between wetted width reductions and
increased density supports the hypothesis that organisms crowd into areas of reduced habitat availability during low
flows (Gore, 1977; Castella et al., 1995; Dewson et al., 2007a); however, this pattern has not been consistently
observed among studies. Density has been found to increase in the absence of width reductions (Rader and Belish,
1999; Dewson et al., 2003, 2007a) below points of water withdrawal, while in other studies density decreases
accompanied wetted width reductions (McIntosh et al., 2002; McKay and King, 2006; Miller et al., 2007). Rader
and Belish (1999) attributed increased densities to elevated water temperatures in the absence of width reductions,
which could increase rates of both primary and secondary production. We observed significant increases in
minimum temperatures, periphyton AFDM and biomass of chlorophyll-a, but they were not related to density
increases (r¼ 0.2, r¼ 0.03, r¼ 0.02, respectively). Water quality conditions within remaining wetted habitats
might explain variability in the direction and magnitude of change among studies. Boulton (2003) suggests
densities will increase in areas of reduced habitat availability until water quality declines and exceeds threshold
tolerances of individual taxa.
Furthermore, disparate trends among studies may be related to the way in which upstream and downstream
density differences are computed. For example, despite observed density increases below diversions on a per m2
basis in our study, the total number of invertebrates was significantly reduced by 13% on average after scaling
estimates to total wetted habitat availability (i.e. total riffle area) (Wþ¼ 6.0; p¼ 0.011; df¼ 11). Furthermore,
when rescaled, lower elevation systems (40% reduction) experienced significantly greater density reductions than
mid (19%) or high elevation sites (9.6%) (H¼ 6.8; p¼ 0.034; df¼ 2). Such differences are likely a function of
channel morphology and not trait composition. Thus, the reduced habitat availability appeared unable to
accommodate all organisms displaced by wetted width reductions. Consequently, downstream reaches experienced
a net loss of organisms compared to upstream reaches, although reductions were relatively small compared to the
extent of habitat loss. Density dependent mechanisms such as increased predation and competition that could
accompany reduced habitat area and food quality provide a plausible explanation for decreased densities (reviewed
in Dewson et al., 2007b); we observed significant increases in the proportion of predators below all diversions. Such
results illustrate the importance of accounting for reductions in available habitat when examining hydrologic
alterations in order to accurately quantify macroinvertebrate responses.
We recognize that water withdrawals spanned a gradient from 75 to 99%; however, this did not appear to
confound the detection of macroinvertebrate responses, as no macroinvertebrate indices exhibited significant
correlations with per cent water withdrawal. Furthermore, the higher proportion of flow removed from high
elevation sites did not appear to introduce bias; high elevation reaches were not more adversely impacted as
compared to mid or low elevation reaches. Rather, we offer two alternative explanations to explain the paucity of
macroinvertebrate responses. First, studied macroinvertebrate communities may be highly resistant to reduced
velocities, depths and habitat availability because antecedent hydrologic conditions for all studied systems include
predictable summer low flow events, which would act as filters for the selection of appropriate trait strategies. Thus,
the perturbation is not novel from an evolutionary standpoint (Lytle and Poff, 2004). Low flow impacts to habitat
quality and quantity are expected to have less effect when mimicking seasonal low flow patterns, as they did in our
Copyright # 2009 John Wiley & Sons, Ltd. River Res. Applic. 26: 1261–1280 (2010)
DOI: 10.1002/rra
TRAIT-MEDIATED RESPONSES TO WATER WITHDRAWALS 1275
study (Resh et al., 1988; Poff andWard, 1990; Wallace, 1990). Water withdrawals that do not occur in concordance
with predictable seasonal patterns of hydrologic variability will likely have far greater impacts.
Second, observed environmental alterations may be of statistical, but not ecological significance. Despite
discharge reductions exceeding 90%, water withdrawals did not appear to render habitat physiologically or
ecologically unfit. Water withdrawals significantly altered hydrologic variables, siltation levels and periphyton
standing stocks, but velocities remained within an apparently tolerable range (0.21–0.47m s�1) and siltation levels
only increased from 3.2 to 9.2% on average. Furthermore, maximum temperatures and dissolved constituents
remained unchanged. As long as desiccation does not occur and water quality conditions are kept at tolerable levels,
macroinvertebrates appear resistant to low flow conditions (Dewson et al., 2007a; Miller et al., 2007).
Responses among all rivers: species traits
Human alterations to river systems can represent new and sometimes novel selection forces, both on ecological
and evolutionary time scales (Lytle and Poff, 2004). We asked if irrigation water withdrawals act as such forces by
altering the representation of trait states from the regional species pool. The proportional abundance for 12 of 52
(23%) trait states representing 10 of 17 traits significantly differed upstream and downstream of all points of
diversion. Despite ecologically insignificant changes in community composition, we believe select traits differed
above and below diversions because specific traits co-occurred in several ubiquitous and abundant taxa affected by
water withdrawals. In particular, the mayfly Baetis (family Baetidae) constituted 16% of average abundance
upstream of all diversions and only 9% downstream; all traits significantly decreasing downstream of diversions
occur in Baetis (e.g. multivoltine, poorly synchronized, low adult dispersal, strong swimmer, and streamlined).
Similar patterns were observed for the less abundant, but ubiquitous baetids Acentrella, Diphetor and Fallceon.
Doledec et al. (2006) found similar results when only 8% of species responded to a land-use gradient in comparison
to 26% of species traits.
Trait changes suggest a shift in functional composition to compensate for altered micro habitat conditions (e.g.
stream hydraulics, periphyton cover, substrate composition), paralleling responses of Lamouroux et al. (2004),
Heino (2005) and Doledec et al. (2006) among others. Below points of water withdrawal species trait composition
shifted to favour sprawling taxa, predators and those with high crawling rates, while traits related to mobility within
the water column and avoidance of high flow environments decreased. Crawlers might have an advantage over
swimmers because of a greater ability to seek out favourable habitats or utilize spatial refugia under low flow
condition (Extence, 1981; Delucchi, 1989; Townsend and Hildrew, 1994). Predator efficiency may also increase
with the benign environmental conditions associated with low flow conditions, as prey concentrate into reduced
habitat areas and their susceptibility to predation increases (Power et al., 1988, Peckarsky et al., 1990; Lake, 2003).
Lastly, observed siltation increases below points of water withdrawal would select for more sprawling taxa as
opposed to clingers.
Conversely, some trait changes appear counterintuitive and proportional changes in trait states did not always
accompany changes in environmental conditions. For example, multivoltine taxa with poorly synchronized
emergence decreased downstream of diversions, though these traits commonly infer resistance and resilience to
disturbance and increase in highly variable habitats (Townsend and Hildrew, 1994; Mackay, 1992; Townsend et al.,
1997a). Such anomalies demonstrate the need for caution when interpreting changes in multiple trait states across
environmental gradients (Doledec et al., 2006; Poff et al., 2006). Results presented herein and findings by Poff et al.
(2006) demonstrate that suites of traits can co-occur in taxa as syndromes of highly correlated trait states. This lack
of independence can potentially inflate the number of trait responses and lead to spurious interpretations.
Correlations among traits may also constrain responses of individual traits along environmental gradients.
For example, the proportion of grazers did not increase downstream of diversions, despite significant increases in
the quantity of benthic biofilms. This surprisingly neutral response might have resulted from other traits of
the dominant grazers (e.g. streamlined, rheophilic) which decreased below points of diversion. The quality of the
benthic biofilms did not appear to confound this response, as both periphyton AFDM and biomass of chlorophyll-aincreased (Autotrophic index increased by 142 on average) and such increases were not attributed to a
predominance of filamentous algae.
Copyright # 2009 John Wiley & Sons, Ltd. River Res. Applic. 26: 1261–1280 (2010)
DOI: 10.1002/rra
1276 S. W. MILLER, D. WOOSTER AND J. L. LI
Trait-mediated responses to water withdrawals: grouping reference sites by species
trait composition—‘trait-based reference groups’
In support of our hypothesis, macroinvertebrate trait composition at reference site systematically varied with
elevation and/or stream size highlighting the potential for differential responses to water withdrawals. Trait-based
gradients occurred independent of water withdrawals, as all reference sites had natural hydrologic regimes. Rather,
trait-based gradients were driven by both ecological and biological traits reflecting changes in habitat conditions
and disturbance regimes from high to low elevations. For example, proportions of warm-water taxa, collector-
filterers and gatherers and preferences for depositional habitats increased from high to low elevations; paralleling
gradients of increasing temperature, wetted width and biomass of periphyton and chlorophyll-a; and decreased
median particle sizes from high to low elevations. Such changes demonstrate that multiple species traits in addition
to functional feeding groups mirror longitudinal habitat gradients outlined in the River Continuum Concept (RCC)
(Vannote et al., 1980; Finn and Poff 2005). Consequently, we effectively sampled a diversity of physicochemical
conditions from which to identify potential sources of variability in macroinvertebrate responses to water withdrawals.
The interaction of temporal variability and human impacts (i.e. disturbance regime) likely explain gradients of
increasing resistance and resilience from high to low elevations reference reaches. Although long-term data were
not available for all rivers, annual variability (i.e. annual maximumminus minimum) for discharge and temperature
was inversely related to elevation and watershed area for six of the studied rivers (unpublished data, Miller).
Horwitz (1978) and Stanford and Ward (1981) observed similar spatial patterns of variability for temperature and
discharge respectively, in snowmelt rivers of the Rocky Mountains. Thermal- and discharge-driven variability are
often used to define the temporal component of Southwood’s (1977) habitat template (Chessman and Royal, 2004),
with temporally variable environments predicted to have a similar functional composition as our lowland reference
reaches (i.e. opportunistic, generalists, with r-selected life history strategies) (Townsend and Hildrew, 1994;
Townsend et al., 1997b).
Despite the exclusive use of ‘reference’ reaches for developing trait-based reference groups, these sites were not
free from human impacts of thermal pollution, sedimentation and nutrient loading. Human impacts appeared to
increase in intensity at lower elevations across the study region (personal observations) and likely interacted with
natural altitudinal differences in disturbance magnitude to increase numbers of disturbance adapted organisms.
Trait-mediated responses to water withdrawals: macroinvertebrate communities and species trait composition
Despite differences in species traits among high, mid and low elevation reference reaches, we observed only
weak evidence for differential responses to water withdrawals across elevations. The magnitude of upstream and
downstream changes in community composition was greater for high elevation reaches, but macroinvertebrate
communities were not adversely impacted. Indices typically sensitive to disturbance (e.g. richness, proportion and
density of EPT taxa) exhibited non-significant increases and not decreases downstream of diversions. Observed
turnover in community composition was likely caused by greater environmental changes for high elevation reaches,
not necessarily reflecting differences in species traits. For example, velocity and substrate size class reductions and
temperature increases were significantly greater at high elevation reaches and per cent change in velocity had the
only significant correlation (r¼ 0.57) with the magnitude of upstream and downstream change in
macroinvertebrate community composition (Sørensen’s distance). If greater rates of change were related to
species traits, we would expect upstream and downstream differences in trait states to be greater for high elevation
reaches, which was not observed.
There are at least three potential explanations for why differential responses were not observed, despite
differences in species traits among high, mid and low elevation reference reaches. First, though our study spanned a
range of stream types across three ecoregions, temporal variability of the hydrologic regimes was limited to
differences in magnitude and duration, not frequency or predictability of high or low flow events, which are known
to be strong selective forces (Lytle and Poff, 2004). Literature cited herein encompasses a greater range of
hydrologic regimes, which potentially differ in frequency and predictability of temporal variability, in addition to
magnitude and duration. Consequently, we would expect increased disparity in species traits across larger
geographic areas and thus a greater potential for differential responses to disturbances of similar magnitude and
duration. Our results suggest that systems exhibiting geographic variability in the frequency of traits related to adult
Copyright # 2009 John Wiley & Sons, Ltd. River Res. Applic. 26: 1261–1280 (2010)
DOI: 10.1002/rra
TRAIT-MEDIATED RESPONSES TO WATER WITHDRAWALS 1277
dispersal, swimming ability, shape and emergence synchronization are most likely to exhibit differential responses
to water withdrawals. Second, as previously described, environmental alterations imposed by water withdrawals
might have been insufficient to exceed the physiological or ecological tolerances of macroinvertebrates found in the
study region. Finally, the dearth of significant differences among groups could reflect low statistical power resulting
from high within group variance. Given observed variance estimates, the power to detect a 25% change in
macroinvertebrate indices among trait-based groups at the 0.10 alpha level ranged from 9–88% (average¼ 40%);
however, it is important to note that within group variability was attributed to the magnitude and not the direction of
change, which was consistent among groups.
CONCLUSIONS
Inconsistent responses of stream macroinvertebrates to water withdrawals have been attributed to the amount of
water withdrawn in addition to variation in physicochemical and biological composition of studied systems. When
attempting to control for the amount of water withdrawn, we did not find evidence for differential
macroinvertebrate responses related to site-specific pools of species traits. Despite ecologically insignificant
changes in community composition, select species traits were affected by water withdrawals across all sites;
however, frequencies of the most vulnerable trait states were too homogeneously distributed to elicit differential
responses among high, mid and low elevation reaches at the observed spatial scale. Our finding that
macroinvertebrate species traits display varying qualities of resistance and resilience within and among systems
demonstrates the importance of considering species trait composition in geographically broad surveys of
macroinvertebrate responses to various perturbations. At larger spatial scales or when comparing biotic responses
among disparate hydrologic regimes, grouping systems by trait-based reference groups might reduce variability
and offer a more general currency for detecting perturbation response relationships.
While we initially proposed that macroinvertebrate trait composition would account for variable responses among
systems, it appears that differences in the magnitude of environmental alterations might interact with species trait
composition to elicit the greatest responses. For example, high elevation sites generally experienced the most drastic
changes in the fundamental instream variables influencing the density and composition of macroinvertebrate
communities (e.g. temperature, substrate, velocity, AFDM and chlorophyll-a). These same sites had the greatest
proportion of taxawith relatively narrow habitat requirements (e.g. preference for cold—stenothermic thermal regimes
and erosional habitats), obligate feeding behaviours (e.g. predators or shredders) and other K-selected life history
strategies. Consequently, faced with more severe alterations to the physical environment the trait composition of
macroinvertebrates within high elevation reaches suggests reduced resistance and resilience to low flow disturbances.
Our quantitative application of species traits revealed both advantages and disadvantages of using this re-
emerging paradigm to detect and interpret macroinvertebrate responses to disturbance. Trait-based monitoring
programmes can aid in the identification of indicator taxa, provide a mechanistic understanding for compositional
changes and identify shifts in functional attributes of lotic ecosystems (Richards et al., 1997; Usseglio-Polatera
et al., 2000; Doledec et al., 2006). In our study, changes in trait states such as reduced streamlined body forms and
high swimming capabilities identified obvious and expected responses to hydrologic alterations. In contrast,
increased frequencies of predators downstream of diversions offered a potential density dependent explanation for
overall reduced macroinvertebrate densities associated with wetted width reductions. Conversely, the potential lack
of independence among traits co-occurring in taxa can both lead to spurious interpretations, while also constraining
responses of individual traits. Overall, species traits appeared more responsive to the effects of water withdrawals
than compositional measures. Finally, the use of species traits also offered insights into the potential mechanisms
underlying macroinvertebrate responses to low flow events.
ACKNOWLEDGEMENTS
This work was supported by grants from the Agricultural Research Foundation of OSU, the Hermiston Agriculture
and Extension Center and USDA CSRESS award no. 2005-35102-16305. Authors thank Bruce McCune and
Desiree Tullos for their critical reviews of this manuscript. Authors also thank the landowners of central and eastern
Oregon and Washington for granting us access to their land during this study.
Copyright # 2009 John Wiley & Sons, Ltd. River Res. Applic. 26: 1261–1280 (2010)
DOI: 10.1002/rra
1278 S. W. MILLER, D. WOOSTER AND J. L. LI
REFERENCES
Allan JD, Flecker AS. 1993. Biodiversity conservation in running waters. Bioscience 43: 32–43.
Benstead JP, March JP, Pringle CM, Scatena FM. 2005. Effects of low-head dams and water abstractions on migratory tropical stream biota.
Ecological Applications 9: 656–668.
Boulton AJ. 2003. Parallels and contrasts in the effects of drought on streammacroinvertebrate assemblages.Freshwater Biology 48: 1173–1185.
Buchanan TJ, Somers WP. 2005. United States Geological Survey, Techniques of Water Resources Investigations, Book 3, Chapter A8. United
States Geological Survey: Arlington, VA.
Bunn SE, Arthington AH. 2002. Basic principles and ecological consequences of altered flow regimes for aquatic biodiversity. Environmental
Management 30: 492–507.
Castella E, BickertonM, Armitage PD, Petts GE. 1995. The effects of water abstractions on invertebrate communities.Hydrobiologia 308: 167–
182.
Caton LW. 1991. Improving subsampling methods for the EPA ‘Rapid Bioassessment’ benthic protocols. Bulletin of the North American
Benthological Society 8: 317–319.
Chessman BC, Royal MJ. 2004. Bioassessment without reference sites: use of environmental filters to predict natural assemblages of river
macroinvertebrates. Journal of the North American Benthological Society 23: 599–615.
Chevenet F, Doledec S, Chessel D. 1994. A fuzzy coding approach for the analysis of long-term ecological data. Freshwater Biology 31: 295–
309.
Corrarino CA, Brusven MA. 1983. The effects of reduced stream discharge on insect drift and stranding of near shore insects. Freshwater
Invertebrate Biology 2: 88–98.
Delucchi CM. 1989. Movement patterns of invertebrates in temporary and permanent streams. Oecologia 78: 199–207.
Dewson ZS, Death RG, James ABW. 2003. The effect of water abstractions on invertebrate communities in four small North Island streams.New
Zealand Natural Sciences 28: 51–65.
Dewson ZS, James ABW, Death RG. 2007a. Invertebrate responses to short-term water abstraction in small New Zealand streams. Freshwater
Biology 52: 357–369.
Dewson ZS, James ABW, Death RG. 2007b. A review of the consequences of decreased flow for instream habitat and macroinvertebrates.
Journal of the North American Benthological Society 263: 401–415.
Doledec S, Phillips N, Scarsbrook M, Riley RH, Townsend CR. 2006. Comparison of structural and functional approaches to determining
landuse effects on grassland stream invertebrate communities. Journal of the North American Benthological Society 25: 44–60.
Dudgeon D. 1992. Effects of water transfer on aquatic insects in a stream in Hong Kong. Regulated Rivers: Research and Management 7: 369–
377.
Dufrene M, Legendre P. 1997. Species assemblages and indicator species: the need for a flexible asymmetrical approach. Ecological
Monographs 67: 345–366.
Dynesius M, Nilsson C. 1994. Fragmentation and flow regulation of river systems in the northern third of the world. Science 266: 753–762.
Eheart JW, Tornil DW. 1999. Low-flow frequency exacerbation by irrigation withdrawals in the agricultural Midwest under various climate
scenarios. Water Resources Research 35: 2237–2246.
Extence CA. 1981. The effect of drought on benthic invertebrate communities in a lowland river. Hydrobiologia 83: 217–224.
Finn DS, Poff NL. 2005. Variability and convergence in benthic communities along the longitudinal gradients of four physically similar Rocky
Mountain streams. Freshwater Biology 50: 243–261.
Gore JA. 1977. Reservoir manipulations and benthic macroinvertebrates in a prairie river. Hydrobiologia 55: 113–123.
Gotelli NJ, Colwell RL. 2001. Quantifying biodiversity: procedures and pitfalls in the measurement and comparison of species richness. Ecology
Letters 4: 379–391.
Gotelli NJ, Entsminger GL. 2006. Ecosim: Null models software for ecology. Version 7.0. Acquired Intelligence Inc. and Kesey-Bear. Jericho,
VT. Available at: http://garyentsminger.com/ecosim.htm
Heino J. 2005. Functional biodiversity of macroinvertebrate assemblages along major ecological gradients of boreal headwater streams.
Freshwater Biology 50: 1578–1587.
Horwitz RJ. 1978. Temporal variability patterns and the distributional patterns of stream fishes. Ecological Monographs 48: 307–321.
Lake PS. 2000. Disturbance, patchiness, and diversity in streams. Journal of the North American Benthological Society 19: 573–592.
Lake PS. 2003. Ecological effects of perturbation by drought in flowing water. Freshwater Biology 48: 1161–1172.
Lamouroux N, Doledec S, Gayraud S. 2004. Biological traits of streammacroinvertebrate communities: effects of microhabitat, reach, and basin
filters. Journal of the North American Benthological Society 23: 449–466.
Lytle DA, Poff NL. 2004. Adaptation to natural flow regime. Trends in Ecology and Evolution 19: 94–100.
Mackay RJ. 1992. Colonization by lotic macroinvertebrates: a review of processes and patterns. Canadian Journal of Fisheries and Aquatic
Sciences 49: 617–629.
Magurran AE. 1988. Ecological Diversity and Its Measures. Princeton University Press: New Jersey.
McCune B. 1992. Components of error in predictions of species compositional change. Journal of Vegetation Science 3: 27–34.
McCune B, Grace JB. 2002. Analysis of Ecological Communities. MJM Software: Gleneden Beach, OR.
McCune B, Mefford MJ. 2005. PC-ORD, Multivariate Analysis of Ecological Data, Version 5.0. MJM Software: Gleneden Beach, OR.
McIntosh MD, Benbow ME, Burky AJ. 2002. Effects of stream diversion on riffle macroinvertebrate communities in a Maui, Hawaii, stream.
River Research and Applications 18: 569–581.
Copyright # 2009 John Wiley & Sons, Ltd. River Res. Applic. 26: 1261–1280 (2010)
DOI: 10.1002/rra
TRAIT-MEDIATED RESPONSES TO WATER WITHDRAWALS 1279
McKay SF, King AJ. 2006. Potential ecological effects of water abstraction in small, unregulated streams. River research and Application 22:
1023–1037.
Meier W, Bonjour C, Wuest A, Reichert P. 2003. Modeling the effects of water diversion on the temperature of mountain streams. Journal of
Environmental Engineering 129: 755–764.
Merritt RW, Cummins KW. 1996. An introduction to the Aquatic Insects of North America. Kendall/Hunt Publishing: Dubuque, Iowa.
Meyer WB, Turner BL II. 1992. Human population growth and global land-use/cover change. Annual Review of Ecology and Systematics 23:
39–61.
Mielke PW Jr, Berry KJ. 2001. Permutation Methods: A Distance Function Approach, Springer Series in Statistics. Springer: New York.
Miller SW, Wooster D, Li J. 2007. Resistance and resilience of macroinvertebrate communities to irrigation water withdrawals. Freshwater
Biology 52: 2494–2510.
Moran MD. 2003. Arguments for rejecting the sequential Bonferroni in ecological studies. Oikos 100: 403–405.
Oki T, Kanae S. 2006. Global hydrologic cycles and world water resources. Science 313: 1068–1072.
Omernik J. 1987. Ecoregions of the conterminous United States. Annals of the Association of American Geographers 77: 118–125.
Peckarsky BL, Horn SC, Statzner B. 1990. Stonefly predation along a hydraulic gradient: a field test of the harsh-benign hypothesis. Freshwater
Biology 24: 181–191.
Poff NL, Ward JV. 1990. Physical habitat template of lotic ecosystems: recovery in the context of historical pattern of spatiotemporal
heterogeneity. Environmental Management 14: 629–645.
Poff NL, Olden JL, Vieira NKM, Finn DS, Simmons MP, Kondratieff BC. 2006. Functional trait niches of North American lotic insects: trait-
based ecological applications in light of phylogenetic relationships. Journal of the North American Benthological Society 25: 730–755.
Power ME, Stout RJ, Cushing CE, Harper PP, Hauer FR, Matthews WJ, Moyle PB, Statzner B, Wais De Badgen IR. 1988. Biotic and abiotic
controls in river and stream communities. Journal of the North American Benthological Society 7: 456–479.
Rader RB, Belish TA. 1999. Influence of mild to severe flow alterations on invertebrates in three mountain streams. Regulated Rivers: Research
and Management 15: 353–363.
Resh VH, Brown AV, Covich AP, Gurtz ME, Li HW, Minshall GW, Reice SR, Sheldon AL, Wallace JB, Wissmar RC. 1988. The role of
disturbance in stream ecology. Journal of the North American Benthological Society 7: 433–455.
Richards C, Haro RJ, Johnson LB, Host GE. 1997. Catchment and reach-scale properties as indicators of macroinvertebrate species traits.
Freshwater Biology 37: 219–230.
Richter BD, Mathews R, Harrison DL, Wigington R. 2003. Ecologically sustainable water management: managing river flows for ecological
integrity. Ecological Applications 13: 206–224.
Sartory DP, Grobbelaar JE. 1984. Extraction of chlorophyll a from freshwater phytoplankton for spectrophotometric analysis. Hydrobiologia
114: 177–187.
Smith RE, Pearson RG. 1987. The macro-invertebrate communities of temporary pools in an intermittent stream in tropical Queensland.
Hydrobiologia 150: 45–61.
Southwood TRE. 1977. Habitat, the templet for ecological strategies. Journal of Animal Ecology 46: 337–365.
Stanford JA, Ward JV. 1981. Insect species diversity as a function of environmental variability and disturbance in streams. In Stream Ecology:
Application and Testing of General Ecological Theory, Barnes JR, Minshall GW (eds). Plenum Press: New York; 265–277.
Stanley EH, Fisher SG. 1997. Ecosystem expansion and contraction in streams. Bioscience 47: 427–443.
Stanley EH, Buschman DL, Boulton AJ, Grimm NB, Fisher SG. 1994. Invertebrate resistance and resilience to intermittency in desert streams.
American Midland Naturalist 131: 288–300.
Steinman AD, Lamberti GA. 1996. Biomass and pigments of benthic algae. In Methods in Stream Ecology, Hauer FR, Lamberti GA (eds).
Academic Press: San Diego, CA; 295–313.
Suren AM, Biggs BJF, Duncan MJ, Bergey L. 2003. Benthic community composition dynamics during summer low-flows in two rivers of
contrasting enrichment 2. Invertebrates. New Zealand Journal of Marine and Freshwater Research 37: 71–83.
Thorp JH, Covich AP. 1991. Ecology and Classification of North American Freshwater Invertebrates. Academic Press: San Diego, California.
Townsend CR, Hildrew AG. 1994. Species traits in relation to a habitat templet for river systems. Freshwater Biology 31: 265–275.
Townsend CR, Doledec S, Scarsbrook MR. 1997a. Species traits in relation to temporal and spatial heterogeneity in stream: a test of habitat
templet theory. Freshwater Biology 37: 367–387.
Townsend CR, Scarsbrook MR, Doledec S. 1997b. Quantifying disturbance in streams: alternative measures of disturbance in relation to
macroinvertebrate species traits and species richness. Journal of the North American Benthological Society 16: 531–544.
Usseglio-Polatera P, BournaudM, Richoux P, Tachet H. 2000. Biomonitoring through biological traits of benthic macroinvertebrates: how to use
species trait databases? Hydrobiologia 422/423: 153–162.
Vannote RL, Minshall GW, Cummins KW, Sedell JR, Cushing CE. 1980. The river continuum concept. Canadian Journal of Fisheries and
Aquatic Sciences 37: 130–137.
VinsonMR, Hawkins CP. 1996. Effects of sampling area and subsampling procedure on comparisons of taxa richness among streams. Journal of
the North American Benthological Society 15: 392–399.
Wallace JB. 1990. Recovery of lotic macroinvertebrate communities from disturbance. Environmental Management 14: 605–620.
Wilber DH, Tighe RE, O’Neil LJ. 1996. Associations between changes in agriculture and hydrology in the Cache River basin, Arkansas, USA.
Wetlands 16: 366–378.
Wolman MG. 1954. A method of sampling coarse river-bed material. Transactions of the American Geophysical Union 35: 951–956.
Copyright # 2009 John Wiley & Sons, Ltd. River Res. Applic. 26: 1261–1280 (2010)
DOI: 10.1002/rra
1280 S. W. MILLER, D. WOOSTER AND J. L. LI