Embed Size (px)
Citation preview
Regional Information Report 5J.2016-06
Does the Queets Exploitation Rate Indicator Stock Represent the Distribution of Fishery Impacts of Washington Coastal Chinook Salmon Stocks in Pacific Salmon Treaty Fisheries?
by
Randy Peterson
Robert A. Clark
and
Danielle F. Evenson
September 2016
Alaska Department of Fish and Game Divisions of Sport Fish and Commercial Fisheries
Symbols and Abbreviations The following symbols and abbreviations, and others approved for the Système International d'Unités (SI), are used without definition in the following reports by the Divisions of Sport Fish and of Commercial Fisheries: Fishery Manuscripts, Fishery Data Series Reports, Fishery Management Reports, and Special Publications. All others, including deviations from definitions listed below, are noted in the text at first mention, as well as in the titles or footnotes of tables, and in figure or figure captions. Weights and measures (metric) centimeter cm deciliter dL gram g hectare ha kilogram kg kilometer km liter L meter m milliliter mL millimeter mm Weights and measures (English) cubic feet per second ft3/s foot ft gallon gal inch in mile mi nautical mile nmi ounce oz pound lb quart qt yard yd Time and temperature day d degrees Celsius °C degrees Fahrenheit °F degrees kelvin K hour h minute min second s Physics and chemistry all atomic symbols alternating current AC ampere A calorie cal direct current DC hertz Hz horsepower hp hydrogen ion activity pH (negative log of) parts per million ppm parts per thousand ppt, ‰ volts V watts W
General Alaska Administrative Code AAC all commonly accepted abbreviations e.g., Mr., Mrs.,
AM, PM, etc. all commonly accepted professional titles e.g., Dr., Ph.D., R.N., etc. at @ compass directions:
east E north N south S west W
copyright corporate suffixes:
Company Co. Corporation Corp. Incorporated Inc. Limited Ltd.
District of Columbia D.C. et alii (and others) et al. et cetera (and so forth) etc. exempli gratia (for example) e.g. Federal Information Code FIC id est (that is) i.e. latitude or longitude lat or long monetary symbols (U.S.) $, ¢ months (tables and figures): first three letters Jan,...,Dec registered trademark trademark United States (adjective) U.S. United States of America (noun) USA U.S.C. United States
Code U.S. state use two-letter
abbreviations (e.g., AK, WA)
Mathematics, statistics all standard mathematical signs, symbols and abbreviations alternate hypothesis HA base of natural logarithm e catch per unit effort CPUE coefficient of variation CV common test statistics (F, t, χ2, etc.) confidence interval CI correlation coefficient (multiple) R correlation coefficient (simple) r covariance cov degree (angular ) ° degrees of freedom df expected value E greater than > greater than or equal to ≥ harvest per unit effort HPUE less than < less than or equal to ≤ logarithm (natural) ln logarithm (base 10) log logarithm (specify base) log2, etc. minute (angular) ' not significant NS null hypothesis HO percent % probability P probability of a type I error (rejection of the null hypothesis when true) α probability of a type II error (acceptance of the null hypothesis when false) β second (angular) " standard deviation SD standard error SE variance population Var sample var
REGIONAL INFORMATION REPORT 5J.2016-06
DOES THE QUEETS EXPLOITATION RATE INDICATOR STOCK REPRESENT THE DISTRIBUTION OF FISHERY IMPACTS OF
WASHINGTON COASTAL CHINOOK SALMON STOCKS IN PACIFIC SALMON TREATY FISHERIES?
by Randy Peterson and Danielle F. Evenson
Alaska Department of Fish and Game, Division of Commercial Fisheries
and
Robert A. Clark Alaska Department of Fish and Game, Division of Sport Fisheries
Alaska Department of Fish and Game Division of Commercial Fisheries
1255 West 8th Street, Juneau, Alaska, 99801
September 2016
The Regional Information Report Series was established in 1987 and was redefined in 2007 to meet the Division of Commercial Fisheries regional need for publishing and archiving information such as area management plans, budgetary information, staff comments and opinions to Alaska Board of Fisheries proposals, interim or preliminary data and grant agency reports, special meeting or minor workshop results and other regional information not generally reported elsewhere. Reports in this series may contain raw data and preliminary results. Reports in this series receive varying degrees of regional, biometric and editorial review; information in this series may be subsequently finalized and published in a different department reporting series or in the formal literature. Please contact the author or the Division of Commercial Fisheries if in doubt of the level of review or preliminary nature of the data reported. Regional Information Reports are available through the Alaska State Library and on the Internet at: http://www.adfg.alaska.gov/sf/publications/.
Randy Peterson and Danielle F. Evenson Alaska Department of Fish and Game, Division of Commercial Fisheries,
1255 West 8th Street, Juneau, AK 99801, USA and
Robert A. Clark, Alaska Department of Fish and Game, Division of Sport Fisheries,
1255 West 8th Street, Juneau, AK 99801, USA and
This document should be cited as follows: Peterson, R. L., R. A. Clark, and D. F. Evenson. 2016. Does the Queets Exploitation Rate Indicator Stock represent
the distribution of fishery impacts of Washington coast Chinook salmon stocks in Pacific Salmon Treaty fisheries? Alaska Department of Fish and Game, Division of Commercial Fisheries, Regional Information Report 5J.2016-06, Juneau.
The Alaska Department of Fish and Game (ADF&G) administers all programs and activities free from discrimination based on race, color, national origin, age, sex, religion, marital status, pregnancy, parenthood, or disability. The department administers all programs and activities in compliance with Title VI of the Civil Rights Act of 1964, Section 504 of the Rehabilitation Act of 1973, Title II of the Americans with Disabilities Act (ADA) of 1990, the Age Discrimination Act of 1975, and Title IX of the Education Amendments of 1972.
If you believe you have been discriminated against in any program, activity, or facility please write: ADF&G ADA Coordinator, P.O. Box 115526, Juneau, AK 99811-5526
U.S. Fish and Wildlife Service, 4401 N. Fairfax Drive, MS 2042, Arlington, VA 22203 Office of Equal Opportunity, U.S. Department of the Interior, 1849 C Street NW MS 5230, Washington DC 20240
The department’s ADA Coordinator can be reached via phone at the following numbers: (VOICE) 907-465-6077, (Statewide Telecommunication Device for the Deaf) 1-800-478-3648,
(Juneau TDD) 907-465-3646, or (FAX) 907-465-6078 For information on alternative formats and questions on this publication, please contact:
ADF&G, Division of Sport Fish, Research and Technical Services, 333 Raspberry Rd, Anchorage AK 99518 (907) 267-2375
TABLE OF CONTENTS Page
LIST OF TABLES........................................................................................................................................................ II
LIST OF FIGURES ...................................................................................................................................................... II
LIST OF APPENDICES ............................................................................................................................................. III
ABSTRACT .................................................................................................................................................................. 1
INTRODUCTION ......................................................................................................................................................... 1 OBJECTIVES ................................................................................................................................................................ 2
METHODS .................................................................................................................................................................... 2
Modified Contribution Method ...................................................................................................................................... 2 Data ............................................................................................................................................................................... 4
RESULTS ...................................................................................................................................................................... 5
DISCUSSION ................................................................................................................................................................ 5 ACKNOWLEDGEMENTS ........................................................................................................................................... 6
REFERENCES CITED ................................................................................................................................................. 7
TABLES AND FIGURES ............................................................................................................................................. 9
APPENDIX A: BROOD YEAR TOTAL MODIFIED CONTRIBUTION SCATTERPLOTS .................................. 17
APPENDIX B: FEASIBILITY ANALYSIS OF THE MODIFIED CONTRIBUTION METHOD: LITTLE PORT WALTER .................................................................................................................................................................... 23 APPENDIX C: REMOVE QUEETS ANALYSIS ...................................................................................................... 25
APPENDIX E: FISHERY DEFINITIONS .................................................................................................................. 39
APPENDIX F: MODEL DIAGNOSTICS OF ANALYSES 1–5 ................................................................................ 43
LIST OF TABLES Table Page 1. Washington Coast hatchery release-groups. .................................................................................................. 10 2. Overall Chinook salmon hatchery and CWT+Ad production from Washington Coast by Region, BY
1999–2014. .................................................................................................................................................... 10 3. Description of the stocks and brood year combinations investigated. ........................................................... 10 4. ANOVA table for Analyses 1–5. ................................................................................................................... 11 5. Tests of the hypothesis that QUE was not different from the other stocks: 𝐻𝐻0: 𝐶𝐶𝐶𝐶 = 0 vs 𝐻𝐻𝐻𝐻: 𝐶𝐶𝐶𝐶 ≠ 0
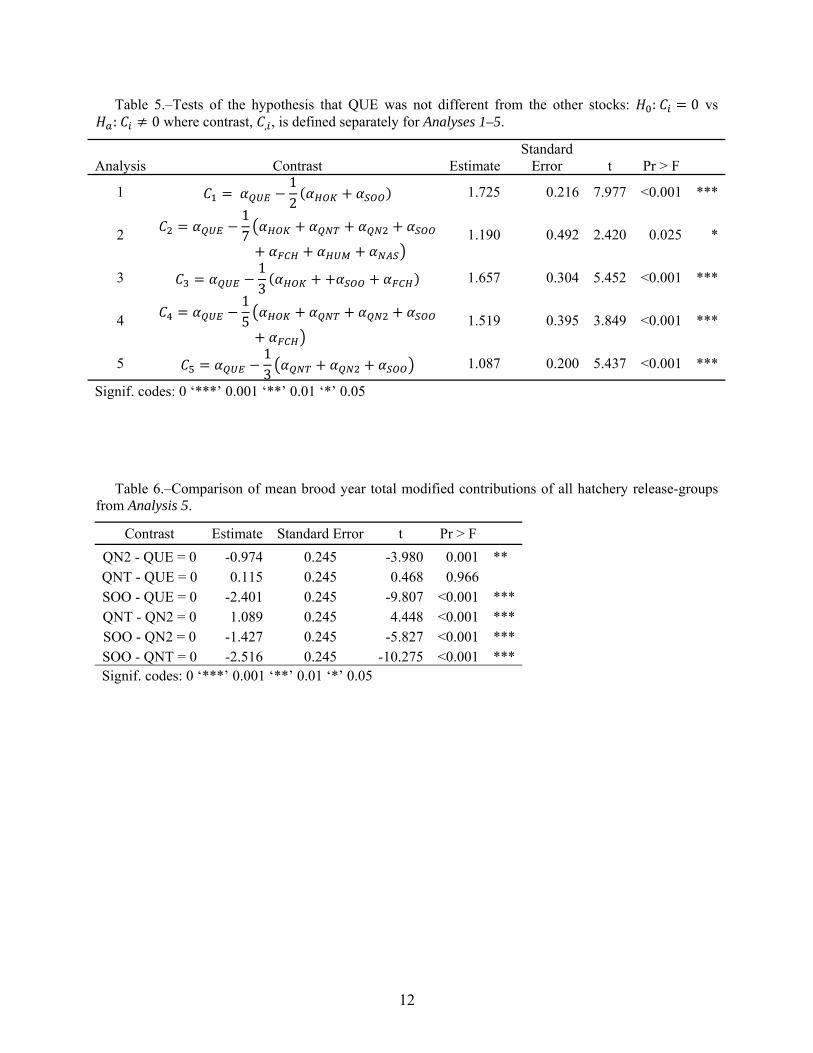
where contrast, 𝐶𝐶, 𝐶𝐶, is defined separately for Analyses 1–5. ......................................................................... 12 6. Comparison of mean brood year total modified contributions of all hatchery release-groups from
Analysis 5. ..................................................................................................................................................... 12
LIST OF FIGURES Figure Page 1. Map showing Washington Coast regions. .................................................................................................... 13 2. Average annual hatchery production of Washington Coastal stocks by region, for brood years 1999–
2014. .............................................................................................................................................................. 14
ii
3. Average brood year total modified contributions by stock for each of the stock and brood year combinations analyzed. ................................................................................................................................. 15
LIST OF APPENDICES Appendix Page A.1. Log brood year total modified contribution scatterplots for Analysis 1. ....................................................... 18 A.2. Log brood year total modified contribution scatterplots for Analysis 2. ....................................................... 19 A.3. Log brood year total modified contribution scatterplots for Analysis 3. ....................................................... 20 A.4. Log brood year total modified contribution scatterplots for Analysis 4. ....................................................... 21 A.5. Log brood year total modified contribution scatterplots for Analysis 5. ....................................................... 22 B.1. Average brood year total modified contribution of Chickamin (CHIC) and Unuk (UNUK) broodstock
(left panel). .................................................................................................................................................... 24 B.2. ANOVA table for Little Port Walter analysis. .............................................................................................. 24 C.1. ANOVA table for Analyses 1–5 with QUE removed. ................................................................................... 27 D.1. Number of Ad+CWTs fish released by hatchery and brood year. ................................................................. 30 D.2. Number of Ad+CWTs released and modified tag ratios for Analysis 1. ....................................................... 31 D.3. Number of Ad+CWTs released and modified tag ratios for Analysis 2. ....................................................... 32 D.4. Number of Ad+CWTs released and modified tag ratios for Analysis 3. ....................................................... 33 D.5. Number of Ad+CWTs released and modified tag ratios for Analysis 4. ....................................................... 33 D.6. Number of Ad+CWTs released and modified tag ratios for Analysis 5. ....................................................... 34 D.7. Brood year total modified contribution estimates for Analysis 1. ................................................................. 35 D.8. Brood year total modified contribution estimates for Analysis 2. ................................................................. 36 D.9. Brood year total modified contribution estimates for Analysis 3. ................................................................. 36 D.10. Brood year total modified contribution estimates for Analysis 4. ................................................................. 36 D.11. Brood year total modified contribution estimates for Analysis 5. ................................................................. 37 E.1. Description of the fisheries used in the Washington Coast Analyses. ........................................................... 40 E.2. Description of the fisheries used in the Little Port Walter analysis. .............................................................. 41 F.1. Residual vs fitted plots from each of the analyses. ........................................................................................ 44
iii
1
ABSTRACT The Chinook Technical Committee (CTC) of the Pacific Salmon Commission (PSC) uses coded-wire tagged (CWT) hatchery-origin Chinook salmon as surrogates to estimate harvest and exploitation rates exerted on natural spawning populations. The Queets (QUE) exploitation rate indicator stock is used by the CTC to represent four natural-origin fall Chinook salmon stocks along the Washington Coast—Queets, Quillayute, Hoh, and Grays Harbor and to represent the distribution of fishing impacts on the overall Washington Coastal fall stock group. No formal evaluations on whether QUE hatchery-origin fish adequately represent harvests and exploitation rates of natural stocks have occurred. Although there is insufficient information available to test the applicability to represent natural-origin fish, there are other CWT release-groups from hatcheries along Washington Coast to make comparisons. We apply a new method to test representativeness of the QUE exploitation rate indicator stock with data from PSC aggregate abundance based management (AABM) troll fisheries in Southeast Alaska and Northern British Columbia. The methodology is based upon modified tag ratios, which standardize the probability of a fish having a CWT, and modified contributions, which should not expect differences between hatcheries. Five separate brood year and stock combinations were analyzed using a two-way ANOVA; in each analysis we found a significant difference between stocks with p-values <0.001. QUE was always significantly different from the other Washington Coast stocks. The difference of QUE to other stocks was >0 in all analyses, indicating that QUE over-represents fishery impacts in the AABM troll fisheries. Given that hatchery releases from Strait of Juan de Fuca and Willapa Bay regions represent nearly three quarters of the annual Washington Coast hatchery production, the inability of QUE to represent all Washington Coastal fall hatchery production is cause for reevaluation of the assumptions for use of this exploitation indicator stock in estimation of fishery impacts.
Key words Chinook salmon, Washington Coast, Queets, coded-wire tags, exploitation rate, indicator stocks, Pacific Salmon Treaty.
INTRODUCTION Washington Coastal fall natural stocks tracked by the Chinook Technical Committee (CTC) of the Pacific Salmon Commission (PSC) include Chinook salmon from the Hoko, Quillayute, Hoh, and Queets rivers, and from Grays Harbor. Washington Coast origin Chinook salmon are an important component of Chapter Three of the Pacific Salmon Treaty (PST). These fall stocks are highly migratory with a northerly oceanic distribution, and are therefore significant contributors to several fisheries in the PST area. The Southeast Alaska aggregate abundance based management (AABM), Northern British Columbia AABM, and Washington coastal terminal fisheries are the primary harvest sectors for Washington Coastal fall stocks. The CTC conducts annual analyses using coded-wire tagged (CWT) data to determine stock specific exploitation rates in these fisheries.
Exploitation rate indicator stocks are CWT hatchery release-groups used as proxies to estimate harvest and exploitation rates for neighboring stocks—the indicator stock concept. The CTC assumes that exploitation rate indicator stocks experience the same harvest and maturation rates as the stock groups they represent, but more often than not this assumption is not validated. Indicator stocks are used in a cohort analysis, a procedure that reconstructs the cohort size and exploitation history of a given stock and brood year (BY) using CWT release and recovery data (TCCHINOOK (88)-02). The analysis provides stock-specific estimates of BY total, age- and fishery-specific exploitation rates, maturation rates, survival indices, annual distributions of fishery mortalities, and fishery indices. Estimates of age- and fishery-specific exploitation and maturation rates from the cohort analysis are combined with data on catches, escapements, incidental mortalities, and stock enhancement to complete an annual calibration of the PSC Chinook Model. Output from the model and related statistics are used to judge compliance of fisheries under the PST.
2
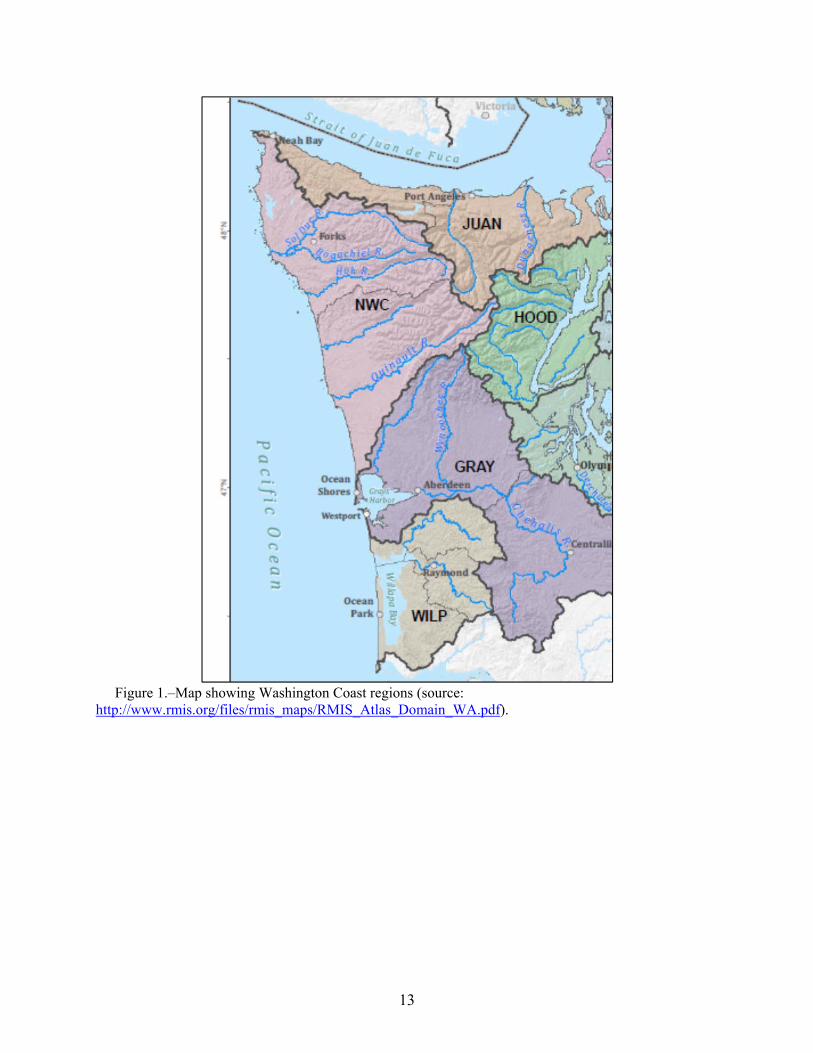
Chinook stocks of the Washington Coast originate from four regions—Strait of Juan de Fuca, Northern Washington Coast, Grays Harbor, and Willapa Bay (Table 1, Figure 1). There are numerous hatcheries in the Washington Coast area, multiple CWT hatchery release-groups, and the coverage of hatchery release-groups varies by region (Table 1). Each CWT stock in Table 1 is distinguishable by unique CWTs and clipped adipose fins (CWT+Ad) and has extensive historical tagging and recovery coverage. The CTC primarily uses hatchery release-groups from the Queets (QUE), and to a lesser extent Hoko (HOK) and Tsoo-Yess (SOO), as indicator stocks of the Washington Coast. The rationale behind the use of QUE, HOK, and SOO is predicated on data availability; these three stocks have the longest historical time series of release and catch data (TCCHINOOK 15-(01) V1). The PSC Chinook Model uses QUE as the sole indicator stock to represent both hatchery and natural stocks originating from the Washington Coast.
OBJECTIVES The Queets exploitation rate indicator stock is used by the CTC to represent four natural-origin Chinook stocks along the Washington Coast and to represent the distribution of fishing impacts on the overall Washington Coastal fall stock group. No formal evaluations on whether tagged Queets hatchery-origin fish adequately represent the harvests and exploitation rates of the natural stocks that they are assumed to represent has occurred. Although insufficient information is available to test whether QUE represents the distribution of natural-origin fish, there are other CWT release-groups from hatcheries along the Washington Coast that can be used to verify whether the Queets exploitation rate indicator stock is sufficiently representative of the other Washington Coastal stocks to be suitable for PST purposes. The objective of this study is to test the representativeness of the QUE exploitation rate indicator stock by comparing the ocean distribution of fishing impacts with other Washington Coastal hatchery releases using data from the PSC AABM troll fisheries in Southeast Alaska and Northern British Columbia.
METHODS MODIFIED CONTRIBUTION METHOD The modified contribution method can be used to evaluate one or more indicator stocks across brood years, fisheries, and ages; and most importantly can be applied to compare CWT indicator stocks releasing different numbers of fish—as is often the case. The indicator stock assumption, which says that an indicator stock represents the same natural mortality, vulnerability, exploitation rates, and distributions as other stocks it was assumed to represent, is difficult to evaluate because there are rarely multiple indicator stocks from the same region to compare against. Given that there are two or more indicator stocks, the intuitive means to compare them would be compare brood year exploitation patterns, but this approach is limited to only the special case that each indicator stock releases the same number of fish annually (i.e. differences of harvest contributions would then be a function of differential mortality, vulnerability, exploitation rates, or distribution). The modified contribution method relaxes the requirement of equal release sizes so that brood year exploitation rates can be freely compared.
The following definitions of CWT hatchery stock, CWT hatchery stock group, modified tag ratio, and modified contribution are used in this analysis. A CWT hatchery stock is a series of CWT tag code release-groups from a single hatchery. A CWT hatchery stock group is a group of CWT hatchery stocks. Both CWT hatchery stocks and the CWT hatchery stock group were indexed by brood year. The modified tag ratio, which standardizes the probability of a fish
3
having a CWT from a single CWT hatchery stock across the CWT hatchery stock group, within a brood year, is the sum of all fish released in a CWT hatchery stock group divided by the number of fish released for each CWT hatchery stock:
,∑ ,
, (Eq. 1)
where , is the number of salmon released from a CWT hatchery stock i in brood year by. The modified tag ratio has a few notable properties. If the number of CWT hatchery stocks in a CWT hatchery stock group is 1, then the modified tag ratio is 1. If all CWT hatchery stocks’ release sizes are the same, the modified tag ratio is a scalar and can be ignored. Large differences between CWT hatchery stock release sizes yield larger modified tag ratios. The estimated modified contribution of stock i in fishery j is calculated by normal means as the number of CWTs recovered in fishery stratum j multiplied by the modified tag ratio and expanded for sampling rates and head and tag loss (Bernard and Clark, 1996):
,, ∗ (Eq. 2)
where , is the number of CWTs recovered from stock i in fishery j, is the sampling expansion for fishery j, and is the expansion for head and tag loss in fishery j. Note that subscript by was dropped in Eq. 2 to simplify the equation at no cost to generality. The estimated total modified contribution of stock i in one or more fisheries j is calculated as:
∑ , (Eq. 3)
where is computed annually for each stock. Each brood is vulnerable to a fishery at one or more ages, so the total modified contribution is indexed by age. The estimated brood year total modified contribution of stock i is the sum harvest across ages vulnerable:
∑ , (Eq. 4)
where age a ranges from 2 to 8; however, since 99% of fish harvested in the AABM troll fisheries are ages 3 to 6, all other ages are ignored.. The brood year total modified contribution is the catch of stock i across multiple calendar years.
Recall that the modified tag ratio standardizes the probability of a fish having a CWT within a CWT hatchery stock group by weighting each CWT hatchery stock by the number of fish released against the total number of fish released by the entire CWT hatchery stock group. Hence, two CWT hatchery stocks that release the same number of fish would have the same probability of capture and therefore the same modified tag ratio and if CWT hatchery stock 1 released more fish than CWT hatchery stock 2, CWT hatchery stock 1 would a higher probability of capture and therefore a smaller modified tag ratio. Thus, in both cases from the aforementioned example, we’d expect that the sum modified contribution of each CWT hatchery stock would be equal under the null hypothesis that there was no difference, which is equivalent to the indicator stock assumption.
An appropriate model to compare the brood year total modified contributions and control for variability between broods is a two-way analysis of variance (ANOVA). The log-linear model is written as:
log , , (Eq. 5)
4
i = 1, 2, ..., n; by = 1, 2 …, t
where is the general mean, is the stock effect, is the brood year effect, and , is the random errors; note , ~N(0, ). Equation 5 can be used to compare brood year total modified contributions of any number of stock and brood years, though the choice of n and t will determine the degrees of freedom available to test hypotheses. No interaction term was included because there was not sufficient number of replicate hatchery release-groups.
There are three hypotheses of interest: 1) differences between stocks, 2) difference between QUE and other stocks, and 3) all pairwise differences between stocks. The latter two hypotheses are post hoc tests, and where appropriate, used adjusted p-values (Bretz et al. 2016). The first hypothesis tests for differences among stocks, : ⋯ vs : . Hypothesis 1 was calculated using the traditional F test in a two-way ANOVA and was computed in R (Experimental design book, R core team, 2016). If the first hypothesis was not significantly different, no further hypotheses were tested. The second hypothesis tests for a difference
between QUE and all other stocks, : ⋯ 0 vs :
⋯ 0, where was the mean of QUE and ⋯ was the average
of the means of the other stocks. If 0, it indicates that there was no difference between QUE and the average of the other stocks. If 0, it indicates that QUE on average was exploited at a higher rate than the average of the other stocks and similarly if 0, it indicates that QUE on average was exploited at a lower rate than the average of the other stocks. The third hypothesis tests for differences between all stocks, : 0 vs : 0, for all
, resulting in n(n-1)/2 comparisons. Conducting statistical tests of all pairwise differences increases the chances of making a Type-I error, so hypothesis three was applied once. The interpretation of in hypothesis 3 is similar to that of hypothesis 2: 0 implies no difference between stock i and stock j, 0 implies that stock i was exploited at a higher rate than stock j, and 0 implies that stock i was exploited at a lower rate than stock j. Hypotheses 2 and 3 were computed using the multcomp package in R (Hothorn et al. 2008).
The feasibility of the modified contribution method was evaluated by comparing hatchery release-groups released at the NOAA research hatchery at Little Port Walter in Alaska and is discussed in Appendix A. A test of robustness of the modified contribution method to removal of a highly influential stock (QUE) is presented in Appendix C.
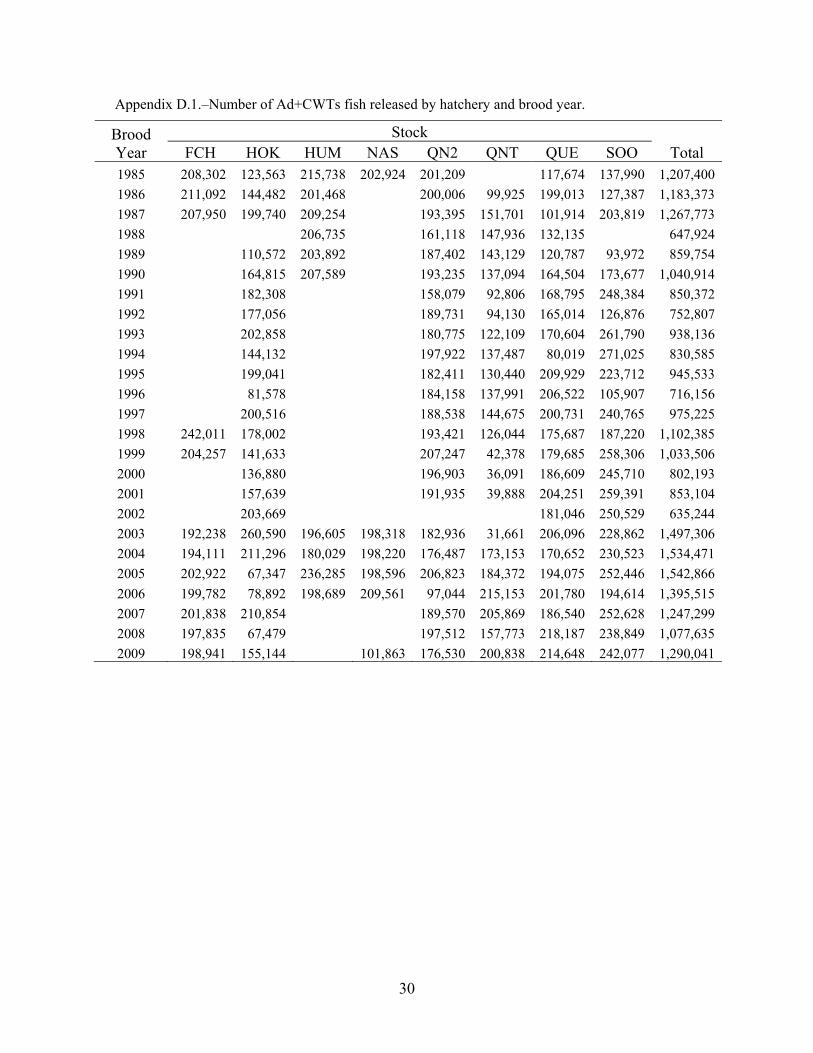
DATA The eight hatchery stocks used in the analysis are, from north to south: Hoko Falls (HOK), Salmon River (QUE), Makah (SOO), Quinault Lake (QNT), Quinault (QN2), Humptulips (HUM), Naselle (NAS), and Forks Creek (FCH) (Table 1). Values of , , , , , and were retrieved online from the Regional Mark Information System (RMIS) database (http://www.rmpc.org). Data from RMIS were loaded into the CTC’s CAS database in order to relate CWT recoveries to the standard fishery definitions used by the CTC. The number of Washington Coast CWT hatchery release-groups varied by stock and brood year (Appendix D). Across brood years, QUE hatchery release-groups were the most consistent, with regular releases since brood year 1985. Hatchery release-groups from SOO, QNT, QN2, and HOK were a little less consistent, with nearly continuous releases since brood year 1985. Hatchery release-groups from FCH, HUM, and NAS were the least consistent. Nearly 90% of the hatchery release-groups
5
were comprised of 100,000 or more fish with an average of 175,000 fish per hatchery release-group. Hatchery release-groups from QNT were the smallest, with four release-groups less than 50,000. The CWT tag codes used in this analysis are available upon request.
Five separate brood year and stock combinations were selected to compare a maximal number of hatchery release-groups, within the constraints of the brood year data available (Table 3). Breaks in the brood year time series were present in most of the analyses; however, the existence of breaks does not prevent application of the modified contribution method. Data after brood year 2009 were not considered in this analysis because catch information for these brood years was not complete.
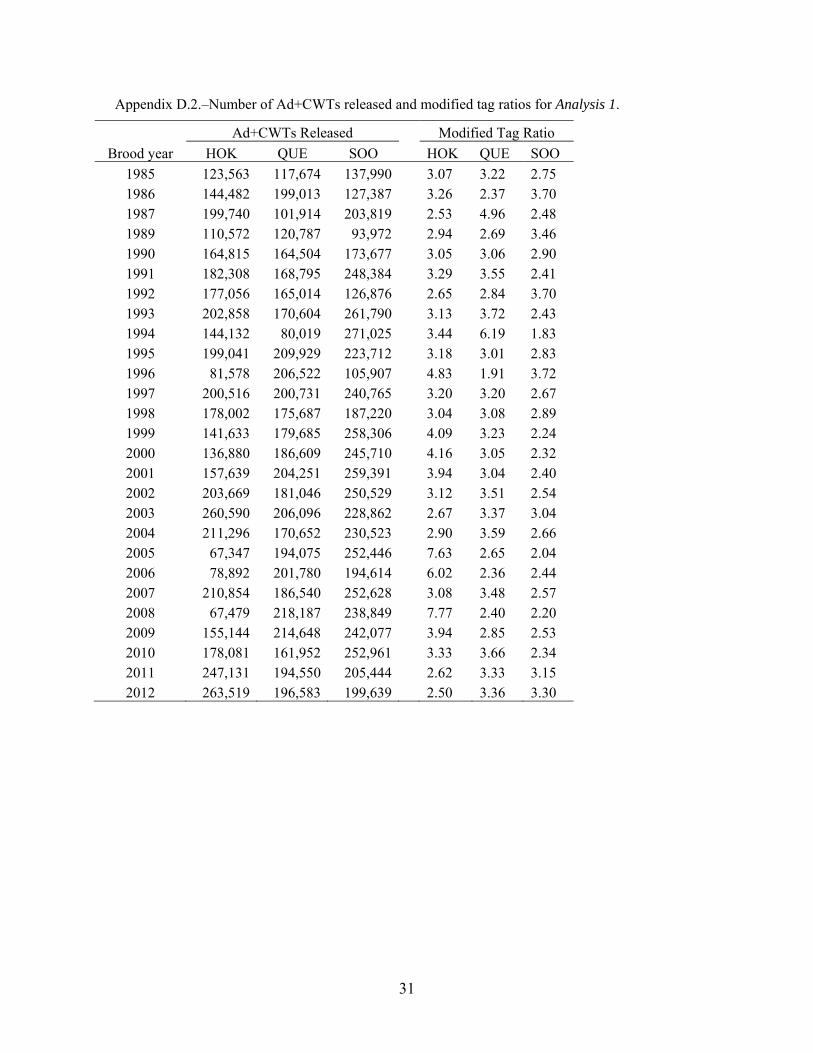
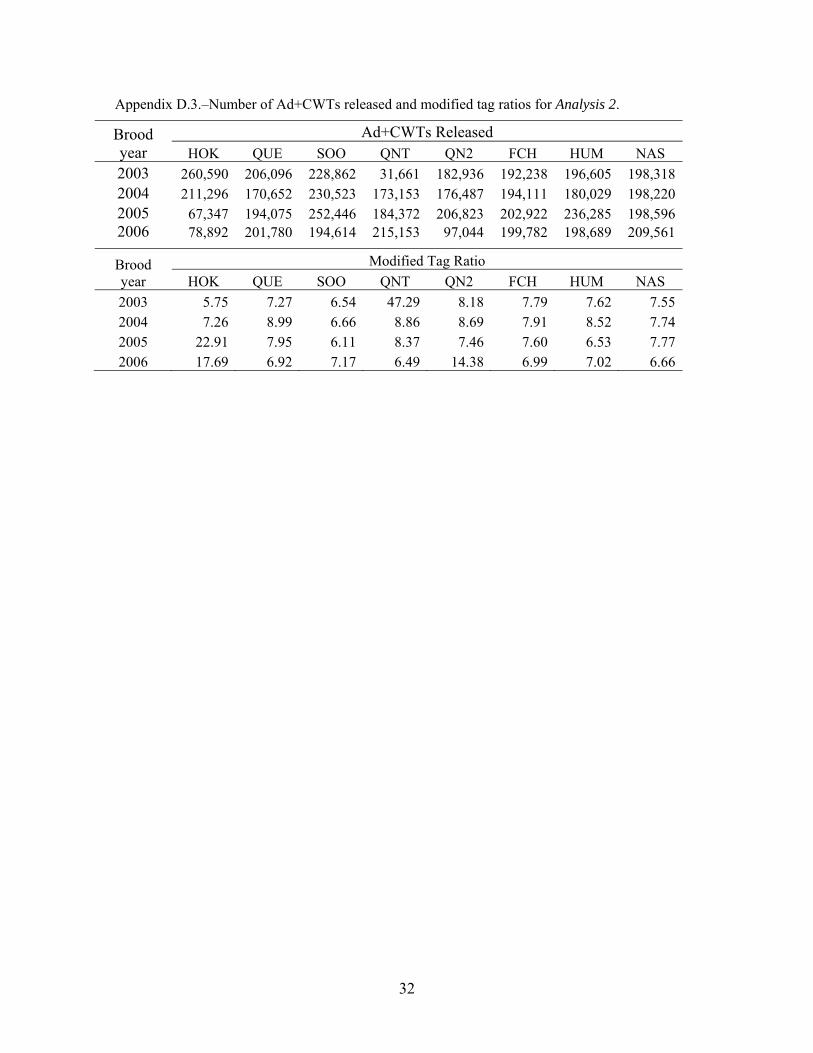
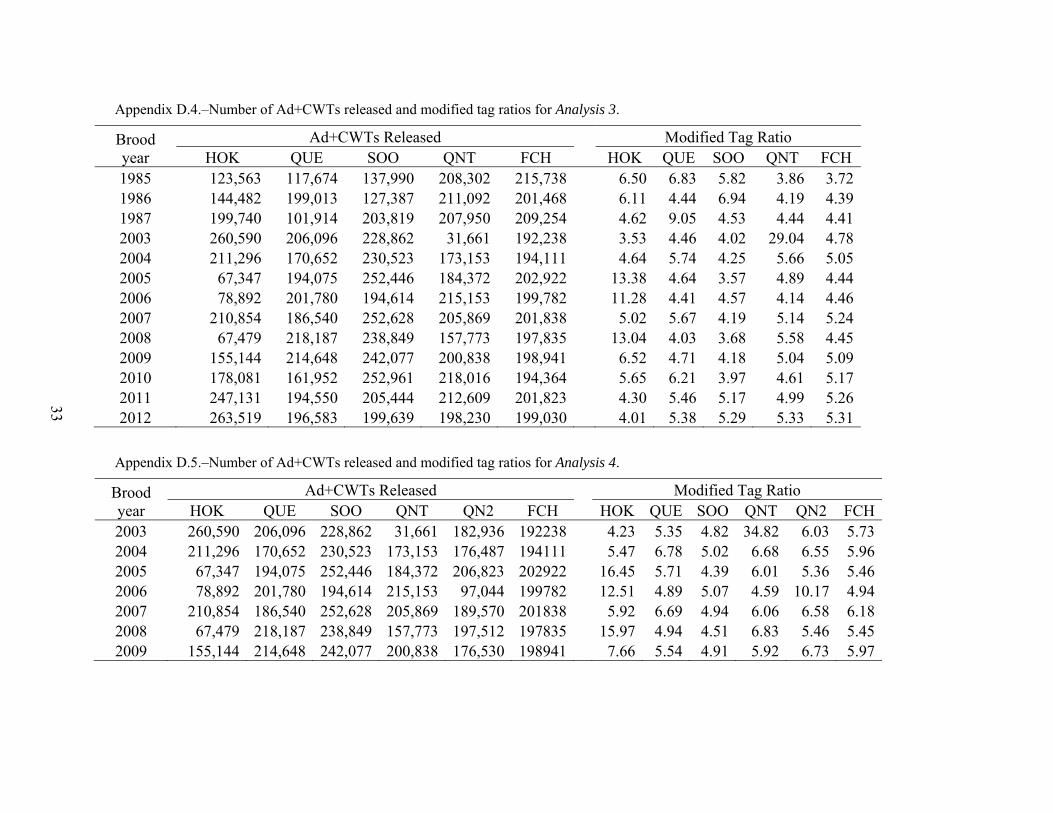
Each brood year and stock combination examined compares a unique set of stocks. Analysis 1 compared the three CWT indicator stocks from the Washington Coastal stock aggregate that the CTC regularly reports (TCCHINOOK 15-(01) V1). Analysis 2 compared CWT hatchery stocks across the entire Washington Coast aggregate. Analysis 3 was the same as Analysis 1 except that it included a stock from Willapa Bay, FCH. Analysis 4 was similar to Analysis 3, but it included two stocks near QUE – QN2, QNT. Analysis 5 compared only stocks from North Washington Coast.
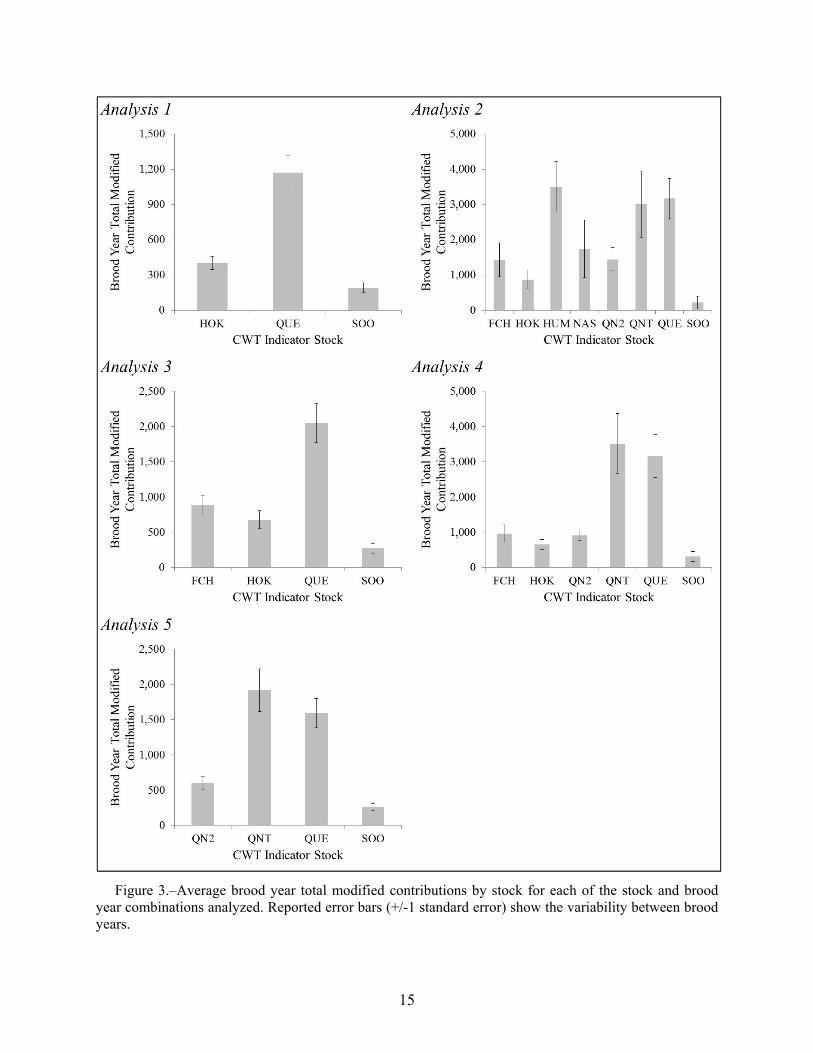
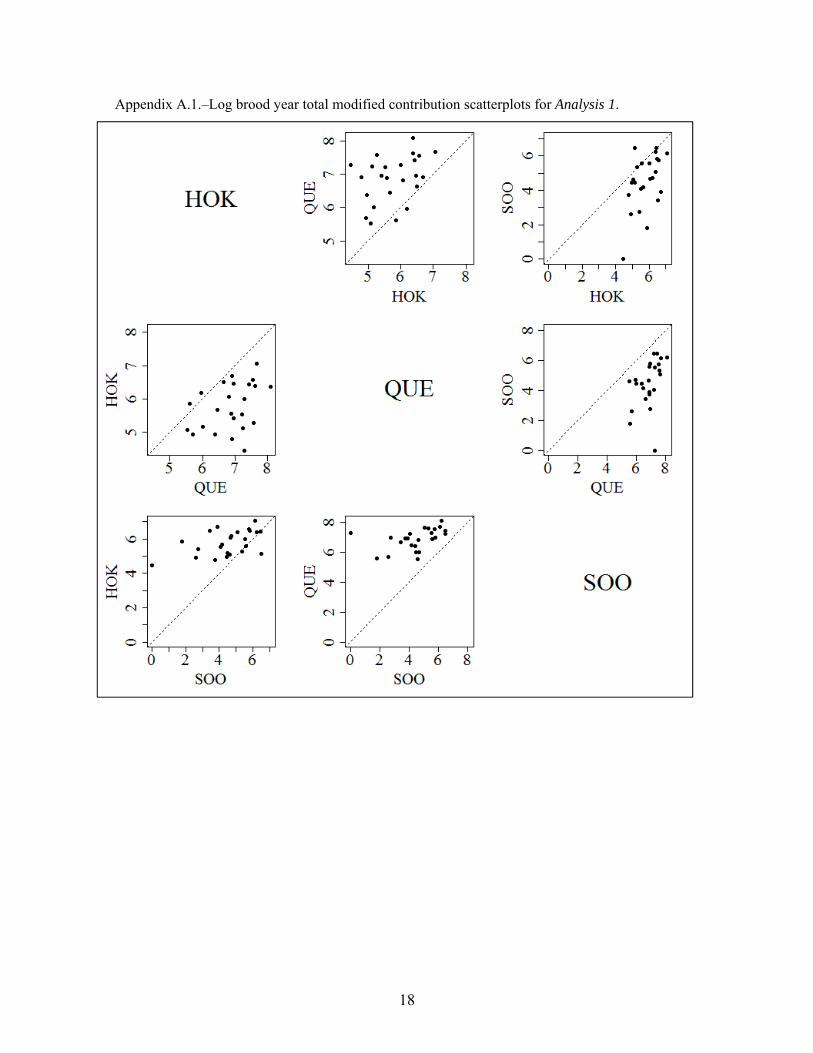
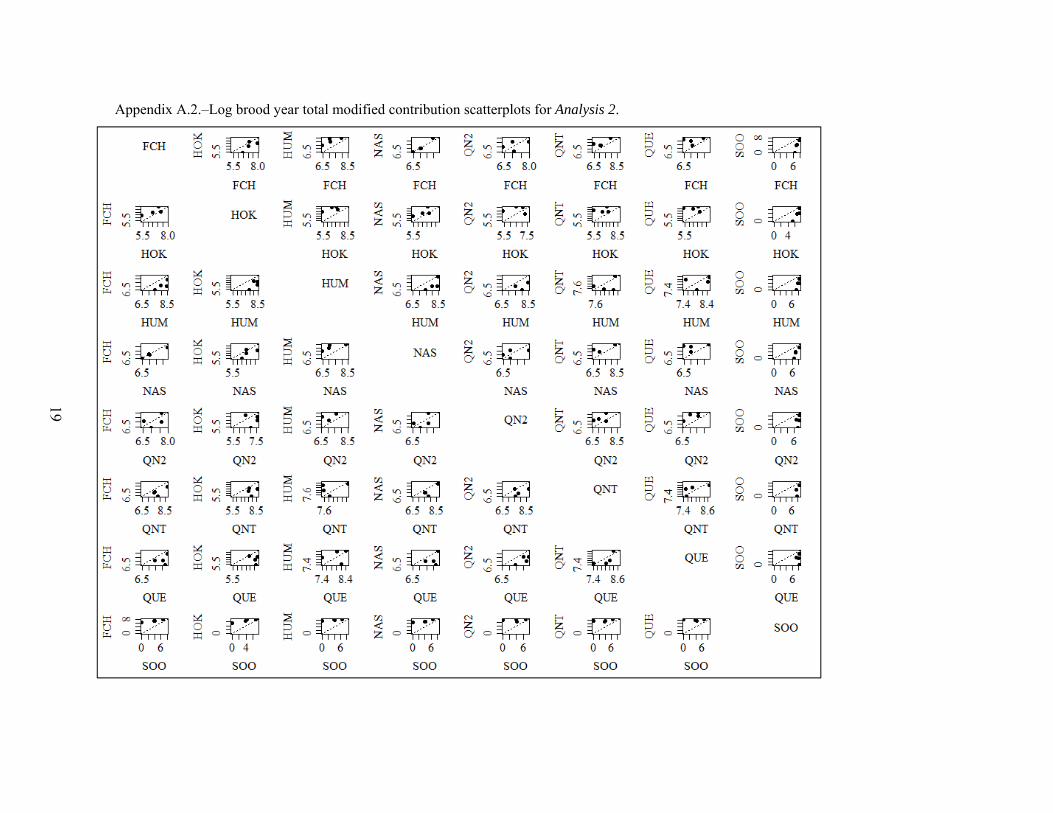
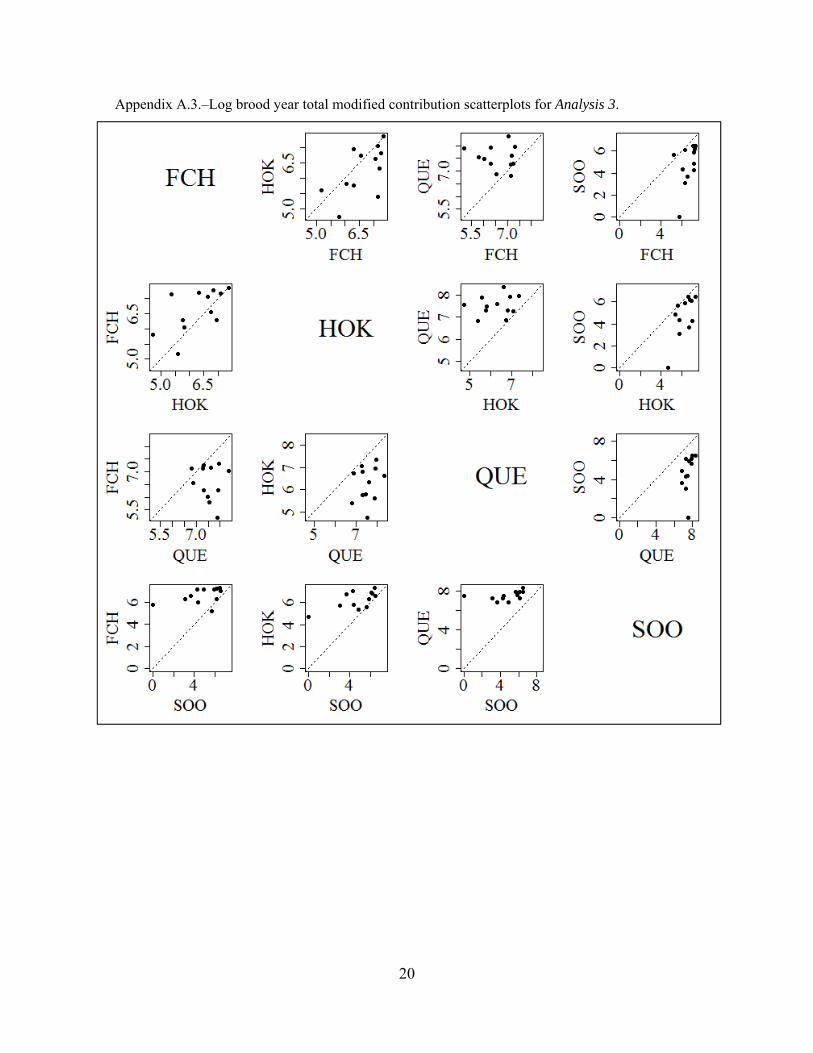
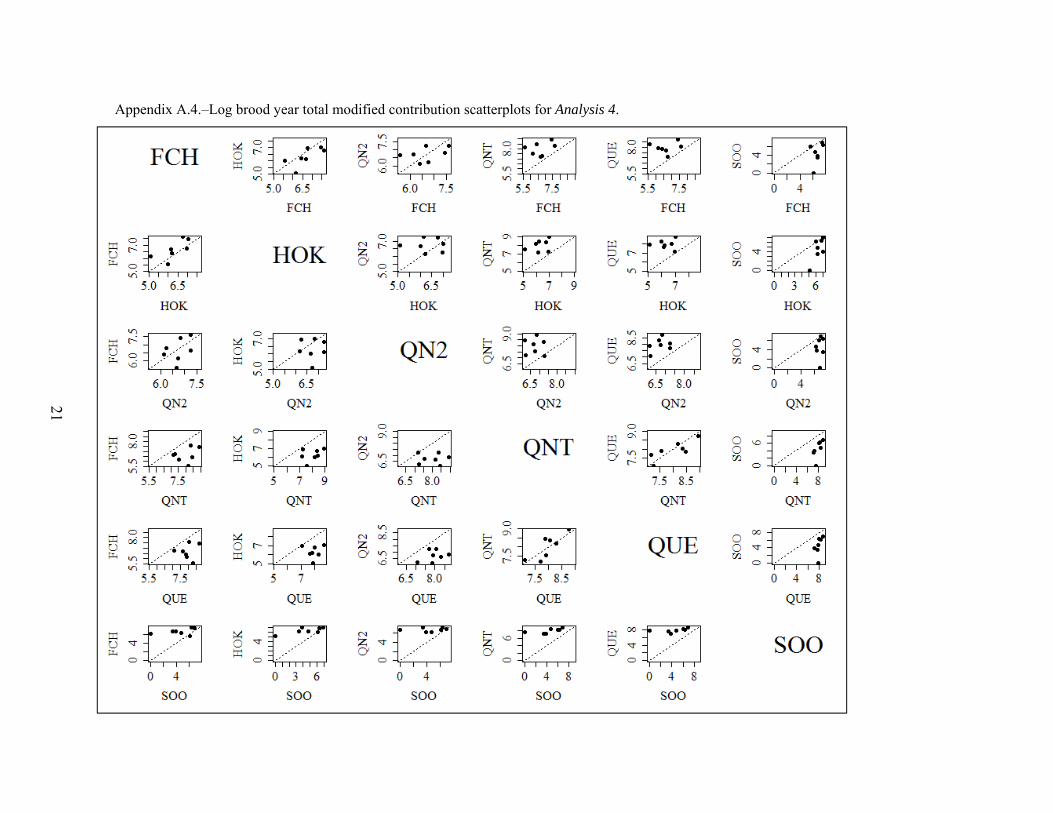
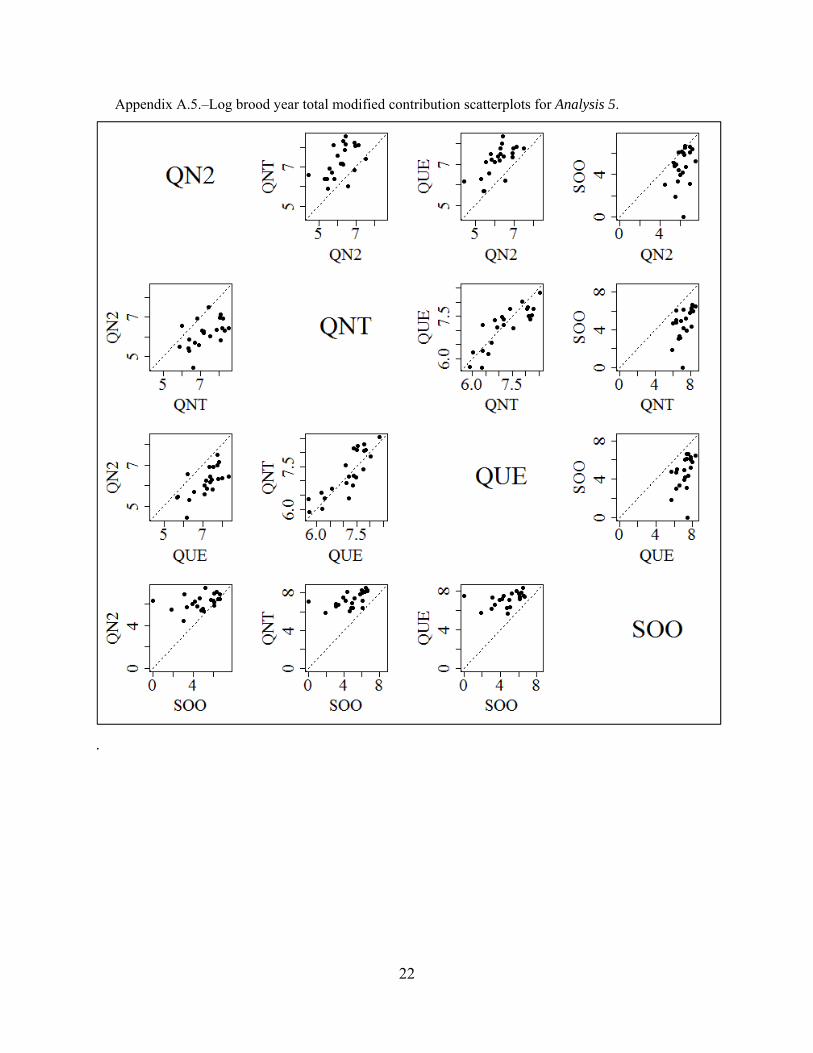
RESULTS Modified tag ratios and brood year total modified contributions were calculated for the five stock and brood year combinations. QUE often had the greatest modified contribution, whereas SOO often had the smallest (Figure 3). Error bars in Figure 3 show the standard error of modified contributions for Analyses 1–5; as expected, analyses with more years of data have smaller standard errors. Although not depicted in Figure 3, stocks with higher modified contributions tended to have greater variability, which was as expected for log-normally distributed data. Scatterplots of the log modified contribution for Analyses 1–5 can be found in Appendix A. Under the null hypothesis, expected values should fall on the 1:1 line in each scatterplot, which provides a visual means to compare pairwise differences between hatchery release-groups. Scatterplots for each analysis highlighted differences among most of the stocks in the analysis. Analyses with more brood years in the comparison— 1, 3, and 5— indicated that QUE had consistently greater modified contributions than other stocks, with the exception of QNT.
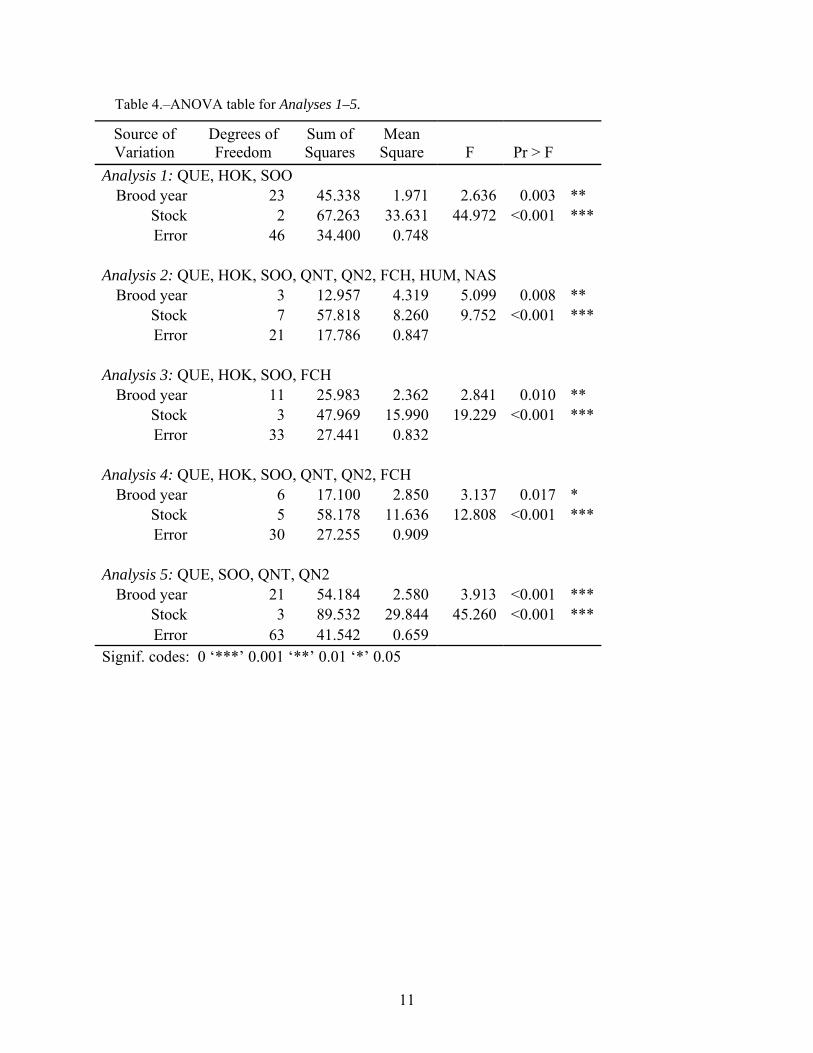
Two-way ANOVAs were calculated for the five stock and brood year combinations (Table 4). All analyses were significant, p <0.001. In all of the analyses, the stock effect was significant, p <0.001, indicating that in each analysis at least two stocks were significantly different. The brood year effect was significant in all of the analyses, p<0.05.
Comparisons show that QUE was significantly different from the other stocks in all analyses, p <0.05 (Table 5). The difference of QUE to the average of the other stocks was greater than 0 in all comparisons. Pairwise comparisons of the Northern Washington Coast stocks were significant in 5 of the 6 comparisons, p <0.001 (Table 6). An additional analysis was conducted to determine if the presence of QUE in the analyses was driving the significance of the stock effect; results were robust to the removal of QUE (Appendix C).
DISCUSSION The analysis clearly indicates that the QUE indicator stock does not share the same ocean distribution of fishing impacts as the other Washington Coastal hatchery releases. Differences in
6
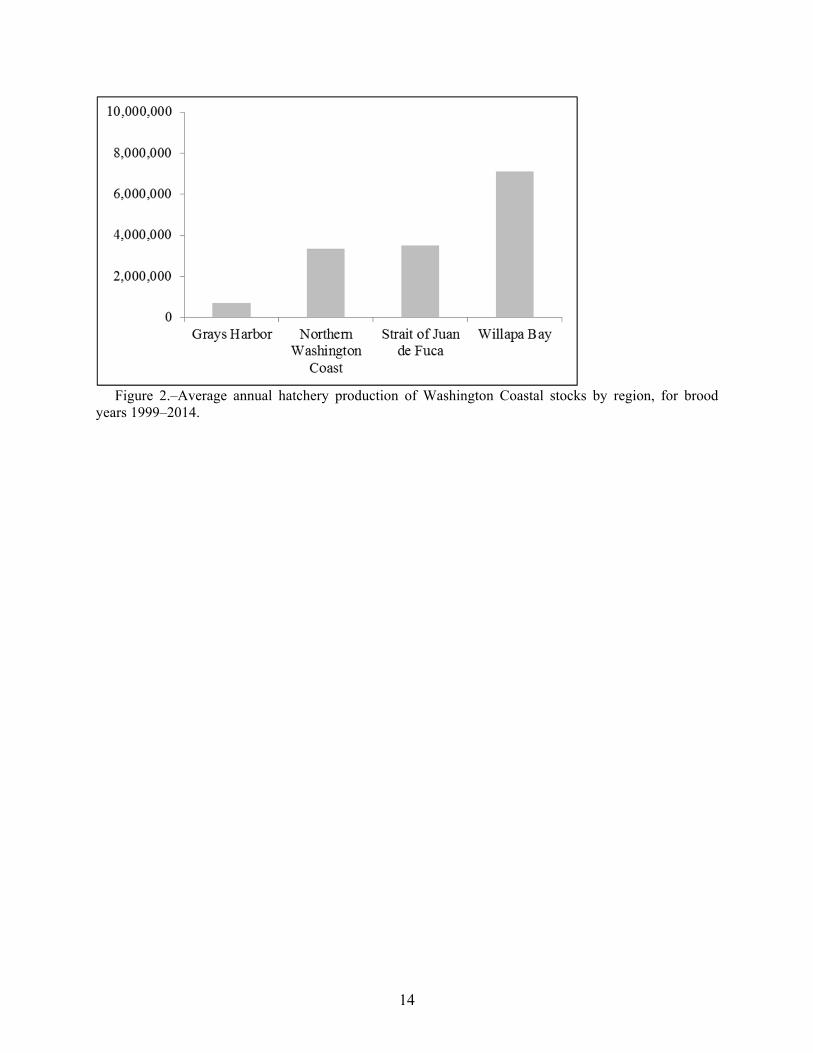
the contributions to fisheries between stocks were significant in all comparisons, indicating that QUE may not represent all stocks along the Washington coast and may not represent stocks in the same geographic area such as Makah (SOO), Quinault Lake (QNT), or Quinault (QN2). QUE consistently over-represented fishery impacts in SEAK and NBC AABM troll fisheries relative to other Washington Coastal stocks it is assumed to represent. Given that hatchery releases from the Strait of Juan de Fuca and Willapa Bay regions combined represent nearly three quarters of the annual Washington Coast hatchery production, the inability of QUE to represent all Washington Coastal fall hatchery production is cause for a serious reevaluation of the assumptions for use of this exploitation indicator stock in estimation of fishery impacts. This apparent bias also has implications for the validity of management objectives of Washington Coast stocks, since many of the production models for these stocks are based on run reconstructions of ocean impacts from QUE recovery data.
These results also bring into question the scientific rigor of current assessments of natural-origin Washington Coast stocks. The validity of QUE (or any of the other hatchery stocks) as a surrogate for natural-origin stocks has never been evaluated to verify that exploitation rate of hatchery-origin indicator stocks adequately represent the harvests and exploitation rates of natural stocks. Although only part of the exploitation history of these stocks, the pattern of AABM fishery contributions differs from other Washington Coast hatchery releases across all analyses conducted herein, raising questions regarding the true exploitation rate and distribution of total mortalities of all natural-origin stocks along the Washington coast.
The use of QUE as the sole Washington Coast exploitation indicator stock by the CTC is problematic and rife with implications for the management and evaluation of fisheries under the Pacific Salmon Treaty (PST). The CTC uses data from recoveries of QUE releases to generate estimates of age- and fishery-specific exploitation and maturation rates from cohort analysis combined with data on catches, escapements, incidental mortalities, and stock enhancement to complete an annual calibration of the PSC Chinook Model. Output from the model and related statistics are used to set harvest limits for AABM fisheries and used to evaluate compliance of all fisheries under the PST. Consequently, all CTC analyses that use QUE as the sole indicator stock of the Washington Coast stock aggregate should be interpreted with caution until the validity of this approach is evaluated.
We recommend that additional hatchery exploitation stocks used to represent distribution and harvest of Washington Coast and Juan de Fuca Chinook stocks be established and that natural-origin CWT indicator stocks be established. This would facilitate tracking of natural-origin fish and allow carefully developed experiments to verify the assumption that hatchery-origin Chinook adequately represent their natural-origin counterparts. An option for further consideration until such time as natural origin Chinook are directly tagged is to use a blended approach to represent this stock group using a combination of all available CWT data.
ACKNOWLEDGEMENTS We wish to thank Alaska Department of Fish and Game employees John H. Clark, John Carlile, and Bill Templin for thoughtful input and review.
7
REFERENCES CITED Bernard, D. R., and J. E. Clark. 1996. Estimating salmon harvest with coded-wire tags. Canadian Journal of
Fisheries and Aquatic Sciences 53: 2323–2332.
Bretz, Frank, Torsten Hothorn, and Peter Westfall. Multiple comparisons using R. CRC Press, 2016.
CTC (Chinook Technical Committee). 1988. 1987 annual report. Pacific Salmon Commission Joint Chinook Technical Committee Report TCCHINOOK (88)-2. Vancouver, BC.
(CTC) Chinook Technical Committee. 2015. 2014 Exploitation Rate Analysis and Model Calibration: Volume One. TCCHINOOK (15)-1 V1. July 2015. Vancouver, BC.
(CTC) Chinook Technical Committee. 2015. 2014 Exploitation Rate Analysis and Model Calibration: Volume Two. TCCHINOOK (15)-1 V2. July 2015. Vancouver, BC.
(CTC) Chinook Technical Committee. 2016. Annual Report of Catch and Escapement for 2015. TCCHINOOK (16)–3. July 2016. Vancouver, BC.
Hothorn, T., F. Bretz and P. Westfall. 2008. Simultaneous Inference in General Parametric Models. Biometrical Journal 50(3): 346–363.
R Core Team. 2014. R: A language and environment for statistical computing. R Foundation for Statistical Computing, Vienna, Austria. URL: http://www.R-project.org/

8

9
TABLES AND FIGURES
10
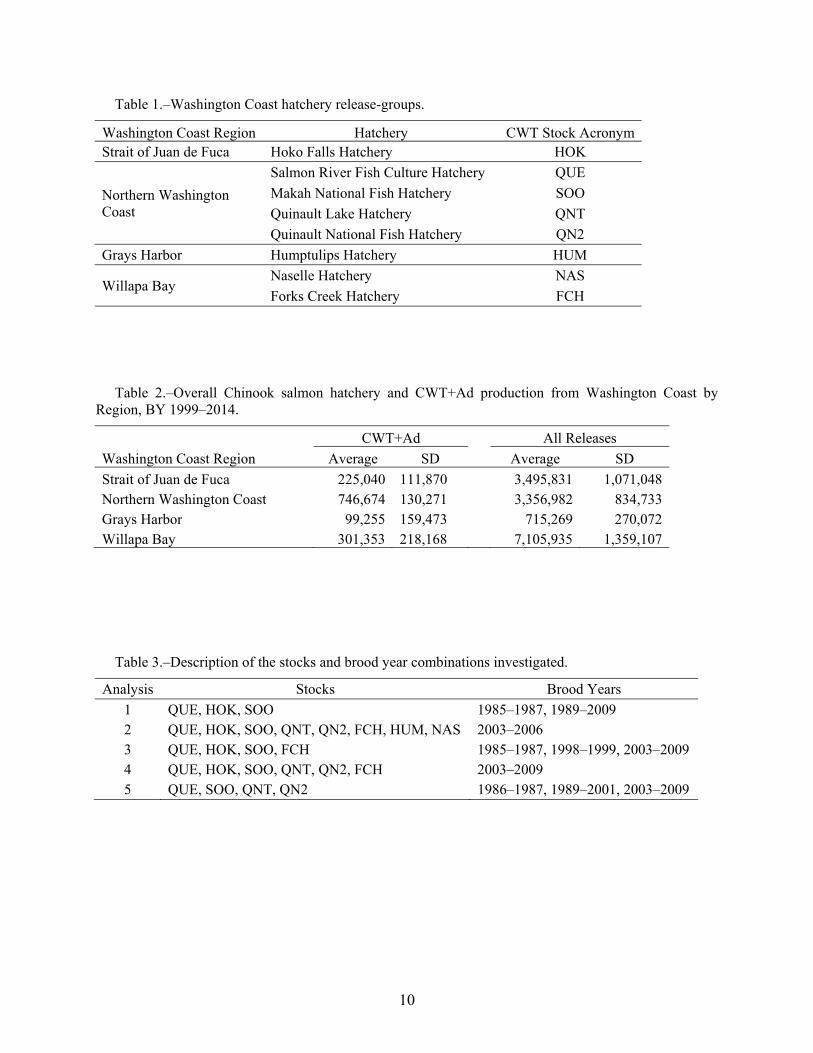
Table 1.–Washington Coast hatchery release-groups.
Washington Coast Region Hatchery CWT Stock Acronym Strait of Juan de Fuca Hoko Falls Hatchery HOK
Northern Washington Coast
Salmon River Fish Culture Hatchery QUE
Makah National Fish Hatchery SOO
Quinault Lake Hatchery QNT
Quinault National Fish Hatchery QN2
Grays Harbor Humptulips Hatchery HUM
Willapa Bay Naselle Hatchery NAS
Forks Creek Hatchery FCH
Table 2.–Overall Chinook salmon hatchery and CWT+Ad production from Washington Coast by Region, BY 1999–2014.
CWT+Ad All Releases
Washington Coast Region Average SD Average SD
Strait of Juan de Fuca 225,040 111,870 3,495,831 1,071,048Northern Washington Coast 746,674 130,271 3,356,982 834,733Grays Harbor 99,255 159,473 715,269 270,072Willapa Bay 301,353 218,168 7,105,935 1,359,107
Table 3.–Description of the stocks and brood year combinations investigated.
Analysis Stocks Brood Years
1 QUE, HOK, SOO 1985–1987, 1989–2009 2 QUE, HOK, SOO, QNT, QN2, FCH, HUM, NAS 2003–2006 3 QUE, HOK, SOO, FCH 1985–1987, 1998–1999, 2003–2009 4 QUE, HOK, SOO, QNT, QN2, FCH 2003–2009 5 QUE, SOO, QNT, QN2 1986–1987, 1989–2001, 2003–2009
11
Table 4.–ANOVA table for Analyses 1–5.
Source of Variation
Degrees of Freedom
Sum of Squares
Mean Square
F
Pr > F
Analysis 1: QUE, HOK, SOO Brood year 23 45.338 1.971 2.636 0.003 **
Stock 2 67.263 33.631 44.972 <0.001 *** Error 46 34.400 0.748
Analysis 2: QUE, HOK, SOO, QNT, QN2, FCH, HUM, NASBrood year 3 12.957 4.319 5.099 0.008 **
Stock 7 57.818 8.260 9.752 <0.001 *** Error 21 17.786 0.847
Analysis 3: QUE, HOK, SOO, FCH Brood year 11 25.983 2.362 2.841 0.010 **
Stock 3 47.969 15.990 19.229 <0.001 *** Error 33 27.441 0.832
Analysis 4: QUE, HOK, SOO, QNT, QN2, FCH Brood year 6 17.100 2.850 3.137 0.017 *
Stock 5 58.178 11.636 12.808 <0.001 *** Error 30 27.255 0.909
Analysis 5: QUE, SOO, QNT, QN2 Brood year 21 54.184 2.580 3.913 <0.001 ***
Stock 3 89.532 29.844 45.260 <0.001 *** Error 63 41.542 0.659
Signif. codes: 0 ‘***’ 0.001 ‘**’ 0.01 ‘*’ 0.05
12
Table 5.–Tests of the hypothesis that QUE was not different from the other stocks: : 0 vs : 0 where contrast, , , is defined separately for Analyses 1–5.
Analysis Contrast EstimateStandard
Error t Pr > F
1 12
1.725 0.216 7.977 <0.001 ***
2 17
1.190 0.492 2.420 0.025 *
3 13
1.657 0.304 5.452 <0.001 ***
4 15
1.519 0.395 3.849 <0.001 ***
5 13
1.087 0.200 5.437 <0.001 ***
Signif. codes: 0 ‘***’ 0.001 ‘**’ 0.01 ‘*’ 0.05
Table 6.–Comparison of mean brood year total modified contributions of all hatchery release-groups from Analysis 5.
Contrast Estimate Standard Error t Pr > F
QN2 - QUE = 0 -0.974 0.245 -3.980 0.001 ** QNT - QUE = 0 0.115 0.245 0.468 0.966SOO - QUE = 0 -2.401 0.245 -9.807 <0.001 ***QNT - QN2 = 0 1.089 0.245 4.448 <0.001 ***SOO - QN2 = 0 -1.427 0.245 -5.827 <0.001 ***SOO - QNT = 0 -2.516 0.245 -10.275 <0.001 ***Signif. codes: 0 ‘***’ 0.001 ‘**’ 0.01 ‘*’ 0.05
13
Figure 1.–Map showing Washington Coast regions (source:
http://www.rmis.org/files/rmis_maps/RMIS_Atlas_Domain_WA.pdf).
14
Figure 2.–Average annual hatchery production of Washington Coastal stocks by region, for brood
years 1999–2014.
15
Figure 3.–Average brood year total modified contributions by stock for each of the stock and brood
year combinations analyzed. Reported error bars (+/-1 standard error) show the variability between brood years.

16
17
APPENDIX A: BROOD YEAR TOTAL MODIFIED CONTRIBUTION SCATTERPLOTS
18
Appendix A.1.–Log brood year total modified contribution scatterplots for Analysis 1.
19
Appendix A.2.–Log brood year total modified contribution scatterplots for Analysis 2.
20
Appendix A.3.–Log brood year total modified contribution scatterplots for Analysis 3.
21
Appendix A.4.–Log brood year total modified contribution scatterplots for Analysis 4.
22
Appendix A.5.–Log brood year total modified contribution scatterplots for Analysis 5.
.
23
APPENDIX B: FEASIBILITY ANALYSIS OF THE MODIFIED CONTRIBUTION METHOD: LITTLE PORT
WALTER
24
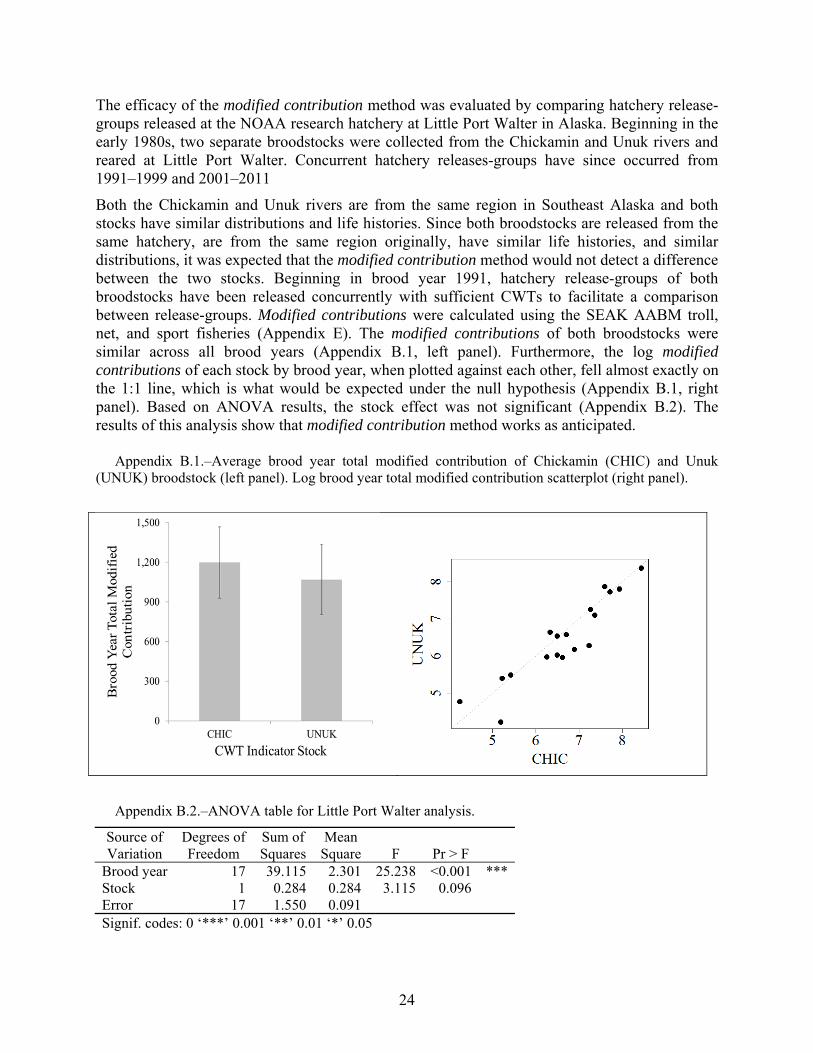
The efficacy of the modified contribution method was evaluated by comparing hatchery release-groups released at the NOAA research hatchery at Little Port Walter in Alaska. Beginning in the early 1980s, two separate broodstocks were collected from the Chickamin and Unuk rivers and reared at Little Port Walter. Concurrent hatchery releases-groups have since occurred from 1991–1999 and 2001–2011
Both the Chickamin and Unuk rivers are from the same region in Southeast Alaska and both stocks have similar distributions and life histories. Since both broodstocks are released from the same hatchery, are from the same region originally, have similar life histories, and similar distributions, it was expected that the modified contribution method would not detect a difference between the two stocks. Beginning in brood year 1991, hatchery release-groups of both broodstocks have been released concurrently with sufficient CWTs to facilitate a comparison between release-groups. Modified contributions were calculated using the SEAK AABM troll, net, and sport fisheries (Appendix E). The modified contributions of both broodstocks were similar across all brood years (Appendix B.1, left panel). Furthermore, the log modified contributions of each stock by brood year, when plotted against each other, fell almost exactly on the 1:1 line, which is what would be expected under the null hypothesis (Appendix B.1, right panel). Based on ANOVA results, the stock effect was not significant (Appendix B.2). The results of this analysis show that modified contribution method works as anticipated.
Appendix B.1.–Average brood year total modified contribution of Chickamin (CHIC) and Unuk (UNUK) broodstock (left panel). Log brood year total modified contribution scatterplot (right panel).
Appendix B.2.–ANOVA table for Little Port Walter analysis.
Source of Variation
Degrees of Freedom
Sum of Squares
Mean Square F Pr > F
Brood year 17 39.115 2.301 25.238 <0.001 ***Stock 1 0.284 0.284 3.115 0.096Error 17 1.550 0.091 Signif. codes: 0 ‘***’ 0.001 ‘**’ 0.01 ‘*’ 0.05
25
APPENDIX C: REMOVE QUEETS ANALYSIS
26
Tests of significance in two-way ANOVAs compare mean values across all groups and the inclusion of a group that is very different from all of the others could be the sole factor in observed significant differences. The stock effect was significant (p<0.001) in all five of our analyses, but we hypothesize that this conclusion could be the result of including data from QUE in all of the analyses. Our hypothesis is based on the following: visually, modified contributions of QUE were different than the modified contributions of the other stocks (Figure 3; Appendix A); and, QUE was significantly different than the other stocks (Table 5). To evaluate this possible explanation for the significant result, data from QUE releases were removed from each of the analyses and the modified tag ratios and modified contributions re-computed for each of the remaining stocks. The null hypothesis in this case would be that removal of QUE from the analyses will not affect the conclusions of a significant stock effect in all five analyses. Recall that the modified tag ratio is calculated as:
,∑ ,
,, (Eq. C.1)
where the omission of a stock from the analysis, given that i ≥2, will only change the numerator, and thus not change the ratio of the modified tag ratios for any of the remaining stocks:
; , (Eq. C.2)
and it follows that the relationship of the modified contributions will also remain the same. Removal of a stock from the analysis was anticipated to have largely two different influences:
1. The removal of a stock(s) will result in a modified tag ratio that is strictly less than the previous tag ratio, with the opposite also being true, that the addition of a stock(s) will give a modified tag ratio that is strictly greater. Noting that larger tag ratios have greater uncertainty, and vice versa, the omission of a stock will only impact the uncertainty around the modified contribution estimate. However, because the sum modified contribution is log-transformed, some of the stock addition or removal effect is mitigated.
2. The removal of a stock(s) will decrease the degrees of freedom used to test the main stock effect by (n-1) and (n-1)*(t-1) degrees of freedom. Fewer stocks could mean less ability to detect differences, especially when t (the number of brood years) is small.
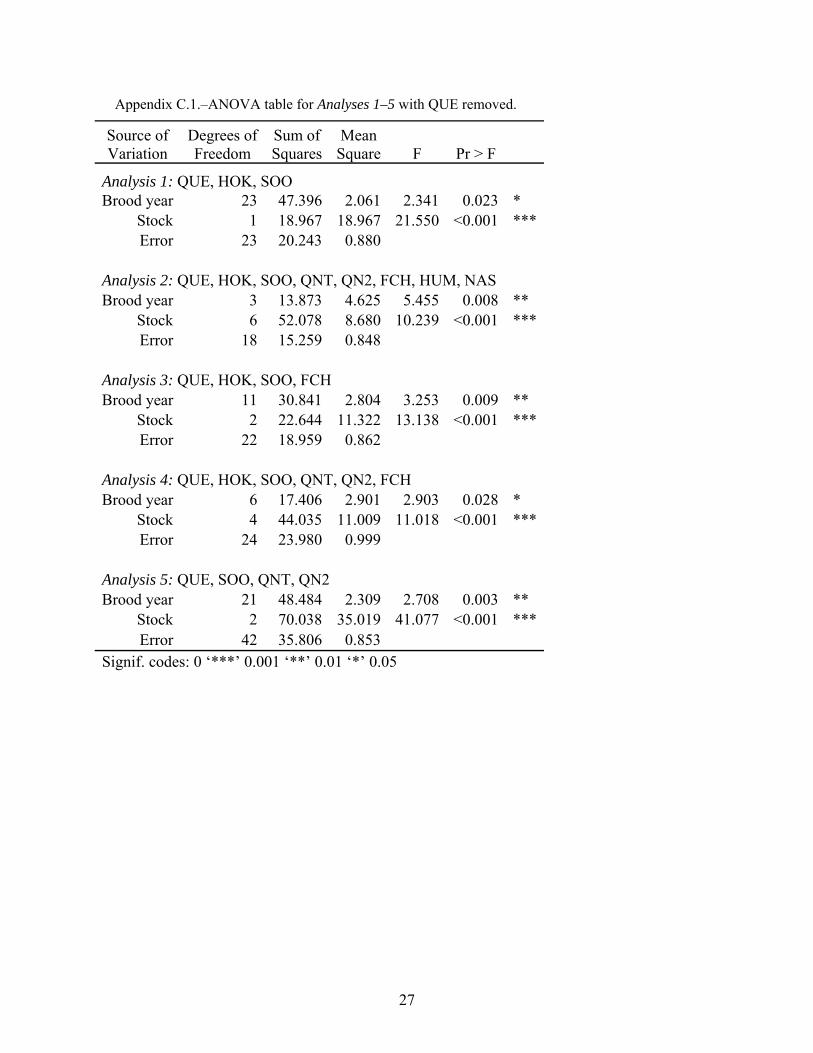
After removing data from QUE and re-running the analyses, we found that the removal of QUE did not change the main conclusion – the stock effect remained significant in all five analyses (Appendix C.1). We could not reject the null hypothesis that removal of QUE would not affect the conclusions. These results show that the conclusions gained from the comparisons are valid for all stocks and are robust to the influence of data from QUE.
27
Appendix C.1.–ANOVA table for Analyses 1–5 with QUE removed.
Source of Variation
Degrees of Freedom
Sum of Squares
Mean Square F Pr > F
Analysis 1: QUE, HOK, SOO Brood year 23 47.396 2.061 2.341 0.023 *
Stock 1 18.967 18.967 21.550 <0.001 ***Error 23 20.243 0.880
Analysis 2: QUE, HOK, SOO, QNT, QN2, FCH, HUM, NAS Brood year 3 13.873 4.625 5.455 0.008 **
Stock 6 52.078 8.680 10.239 <0.001 ***Error 18 15.259 0.848
Analysis 3: QUE, HOK, SOO, FCH Brood year 11 30.841 2.804 3.253 0.009 **
Stock 2 22.644 11.322 13.138 <0.001 ***Error 22 18.959 0.862
Analysis 4: QUE, HOK, SOO, QNT, QN2, FCH Brood year 6 17.406 2.901 2.903 0.028 *
Stock 4 44.035 11.009 11.018 <0.001 ***Error 24 23.980 0.999
Analysis 5: QUE, SOO, QNT, QN2 Brood year 21 48.484 2.309 2.708 0.003 **
Stock 2 70.038 35.019 41.077 <0.001 ***Error 42 35.806 0.853
Signif. codes: 0 ‘***’ 0.001 ‘**’ 0.01 ‘*’ 0.05

28
29
APPENDIX D: HATCHERY RELEASE-GROUPS, MODIFIED TAG RATIOS, AND MODIFIED CONTRIBUTIONS
30
Appendix D.1.–Number of Ad+CWTs fish released by hatchery and brood year.
Brood Year
Stock FCH HOK HUM NAS QN2 QNT QUE SOO Total
1985 208,302 123,563 215,738 202,924 201,209 117,674 137,990 1,207,400
1986 211,092 144,482 201,468 200,006 99,925 199,013 127,387 1,183,373
1987 207,950 199,740 209,254 193,395 151,701 101,914 203,819 1,267,773
1988 206,735 161,118 147,936 132,135 647,924
1989 110,572 203,892 187,402 143,129 120,787 93,972 859,754
1990 164,815 207,589 193,235 137,094 164,504 173,677 1,040,914
1991 182,308 158,079 92,806 168,795 248,384 850,372
1992 177,056 189,731 94,130 165,014 126,876 752,807
1993 202,858 180,775 122,109 170,604 261,790 938,136
1994 144,132 197,922 137,487 80,019 271,025 830,585
1995 199,041 182,411 130,440 209,929 223,712 945,533
1996 81,578 184,158 137,991 206,522 105,907 716,156
1997 200,516 188,538 144,675 200,731 240,765 975,225
1998 242,011 178,002 193,421 126,044 175,687 187,220 1,102,385
1999 204,257 141,633 207,247 42,378 179,685 258,306 1,033,506
2000 136,880 196,903 36,091 186,609 245,710 802,193
2001 157,639 191,935 39,888 204,251 259,391 853,104
2002 203,669 181,046 250,529 635,244
2003 192,238 260,590 196,605 198,318 182,936 31,661 206,096 228,862 1,497,306
2004 194,111 211,296 180,029 198,220 176,487 173,153 170,652 230,523 1,534,471
2005 202,922 67,347 236,285 198,596 206,823 184,372 194,075 252,446 1,542,866
2006 199,782 78,892 198,689 209,561 97,044 215,153 201,780 194,614 1,395,515
2007 201,838 210,854 189,570 205,869 186,540 252,628 1,247,299
2008 197,835 67,479 197,512 157,773 218,187 238,849 1,077,635
2009 198,941 155,144 101,863 176,530 200,838 214,648 242,077 1,290,041
31
Appendix D.2.–Number of Ad+CWTs released and modified tag ratios for Analysis 1.
Brood year
Ad+CWTs Released Modified Tag Ratio
HOK QUE SOO HOK QUE SOO
1985 123,563 117,674 137,990 3.07 3.22 2.75 1986 144,482 199,013 127,387 3.26 2.37 3.70 1987 199,740 101,914 203,819 2.53 4.96 2.48 1989 110,572 120,787 93,972 2.94 2.69 3.46 1990 164,815 164,504 173,677 3.05 3.06 2.90 1991 182,308 168,795 248,384 3.29 3.55 2.41 1992 177,056 165,014 126,876 2.65 2.84 3.70 1993 202,858 170,604 261,790 3.13 3.72 2.43 1994 144,132 80,019 271,025 3.44 6.19 1.83 1995 199,041 209,929 223,712 3.18 3.01 2.83 1996 81,578 206,522 105,907 4.83 1.91 3.72 1997 200,516 200,731 240,765 3.20 3.20 2.67 1998 178,002 175,687 187,220 3.04 3.08 2.89 1999 141,633 179,685 258,306 4.09 3.23 2.24 2000 136,880 186,609 245,710 4.16 3.05 2.32 2001 157,639 204,251 259,391 3.94 3.04 2.40 2002 203,669 181,046 250,529 3.12 3.51 2.54 2003 260,590 206,096 228,862 2.67 3.37 3.04 2004 211,296 170,652 230,523 2.90 3.59 2.66 2005 67,347 194,075 252,446 7.63 2.65 2.04 2006 78,892 201,780 194,614 6.02 2.36 2.44 2007 210,854 186,540 252,628 3.08 3.48 2.57 2008 67,479 218,187 238,849 7.77 2.40 2.20 2009 155,144 214,648 242,077 3.94 2.85 2.53 2010 178,081 161,952 252,961 3.33 3.66 2.34 2011 247,131 194,550 205,444 2.62 3.33 3.15 2012 263,519 196,583 199,639 2.50 3.36 3.30
32
Appendix D.3.–Number of Ad+CWTs released and modified tag ratios for Analysis 2.
Brood year
Ad+CWTs Released HOK QUE SOO QNT QN2 FCH HUM NAS
2003 260,590 206,096 228,862 31,661 182,936 192,238 196,605 198,3182004 211,296 170,652 230,523 173,153 176,487 194,111 180,029 198,2202005 67,347 194,075 252,446 184,372 206,823 202,922 236,285 198,5962006 78,892 201,780 194,614 215,153 97,044 199,782 198,689 209,561
Brood year
Modified Tag Ratio
HOK QUE SOO QNT QN2 FCH HUM NAS
2003 5.75 7.27 6.54 47.29 8.18 7.79 7.62 7.552004 7.26 8.99 6.66 8.86 8.69 7.91 8.52 7.742005 22.91 7.95 6.11 8.37 7.46 7.60 6.53 7.772006 17.69 6.92 7.17 6.49 14.38 6.99 7.02 6.66
33
Appendix D.4.–Number of Ad+CWTs released and modified tag ratios for Analysis 3.
Brood year
Ad+CWTs Released Modified Tag Ratio HOK QUE SOO QNT FCH HOK QUE SOO QNT FCH
1985 123,563 117,674 137,990 208,302 215,738 6.50 6.83 5.82 3.86 3.721986 144,482 199,013 127,387 211,092 201,468 6.11 4.44 6.94 4.19 4.391987 199,740 101,914 203,819 207,950 209,254 4.62 9.05 4.53 4.44 4.412003 260,590 206,096 228,862 31,661 192,238 3.53 4.46 4.02 29.04 4.782004 211,296 170,652 230,523 173,153 194,111 4.64 5.74 4.25 5.66 5.052005 67,347 194,075 252,446 184,372 202,922 13.38 4.64 3.57 4.89 4.442006 78,892 201,780 194,614 215,153 199,782 11.28 4.41 4.57 4.14 4.462007 210,854 186,540 252,628 205,869 201,838 5.02 5.67 4.19 5.14 5.242008 67,479 218,187 238,849 157,773 197,835 13.04 4.03 3.68 5.58 4.452009 155,144 214,648 242,077 200,838 198,941 6.52 4.71 4.18 5.04 5.092010 178,081 161,952 252,961 218,016 194,364 5.65 6.21 3.97 4.61 5.172011 247,131 194,550 205,444 212,609 201,823 4.30 5.46 5.17 4.99 5.262012 263,519 196,583 199,639 198,230 199,030 4.01 5.38 5.29 5.33 5.31
Appendix D.5.–Number of Ad+CWTs released and modified tag ratios for Analysis 4.
Brood year
Ad+CWTs Released Modified Tag Ratio HOK QUE SOO QNT QN2 FCH HOK QUE SOO QNT QN2 FCH
2003 260,590 206,096 228,862 31,661 182,936 192238 4.23 5.35 4.82 34.82 6.03 5.732004 211,296 170,652 230,523 173,153 176,487 194111 5.47 6.78 5.02 6.68 6.55 5.962005 67,347 194,075 252,446 184,372 206,823 202922 16.45 5.71 4.39 6.01 5.36 5.462006 78,892 201,780 194,614 215,153 97,044 199782 12.51 4.89 5.07 4.59 10.17 4.942007 210,854 186,540 252,628 205,869 189,570 201838 5.92 6.69 4.94 6.06 6.58 6.182008 67,479 218,187 238,849 157,773 197,512 197835 15.97 4.94 4.51 6.83 5.46 5.452009 155,144 214,648 242,077 200,838 176,530 198941 7.66 5.54 4.91 5.92 6.73 5.97
34
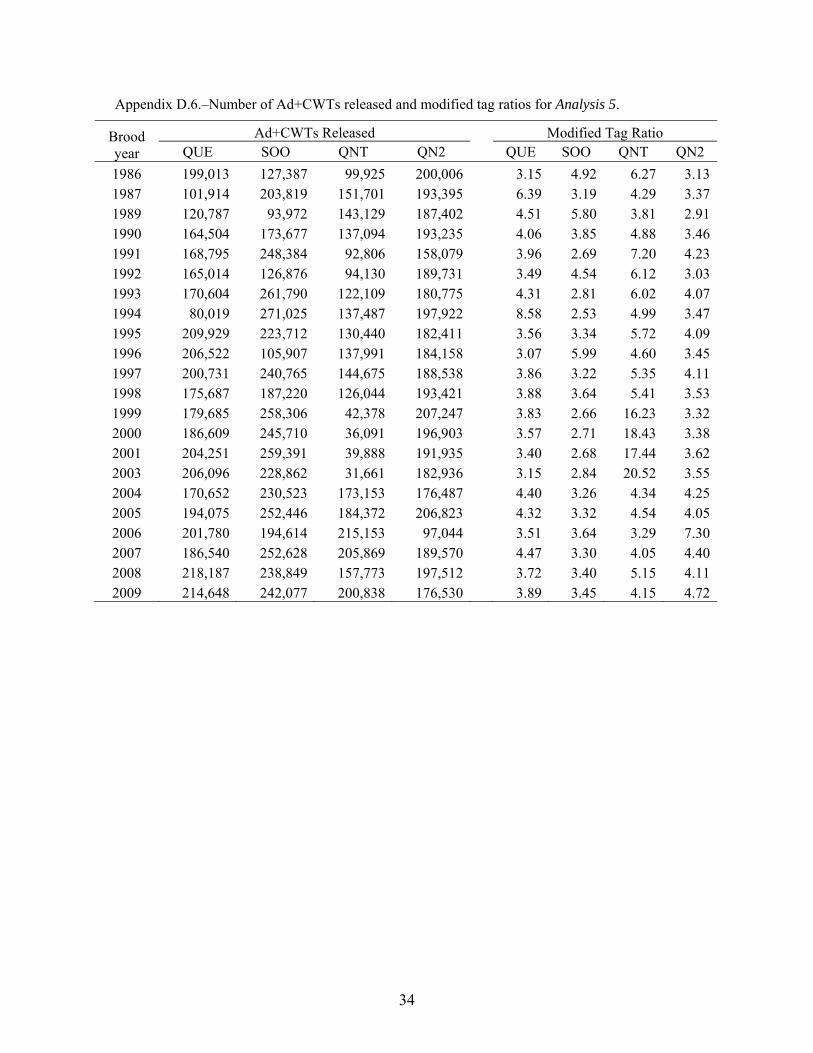
Appendix D.6.–Number of Ad+CWTs released and modified tag ratios for Analysis 5.
Brood year
Ad+CWTs Released Modified Tag Ratio QUE SOO QNT QN2 QUE SOO QNT QN2
1986 199,013 127,387 99,925 200,006 3.15 4.92 6.27 3.131987 101,914 203,819 151,701 193,395 6.39 3.19 4.29 3.371989 120,787 93,972 143,129 187,402 4.51 5.80 3.81 2.911990 164,504 173,677 137,094 193,235 4.06 3.85 4.88 3.461991 168,795 248,384 92,806 158,079 3.96 2.69 7.20 4.231992 165,014 126,876 94,130 189,731 3.49 4.54 6.12 3.031993 170,604 261,790 122,109 180,775 4.31 2.81 6.02 4.071994 80,019 271,025 137,487 197,922 8.58 2.53 4.99 3.471995 209,929 223,712 130,440 182,411 3.56 3.34 5.72 4.091996 206,522 105,907 137,991 184,158 3.07 5.99 4.60 3.451997 200,731 240,765 144,675 188,538 3.86 3.22 5.35 4.111998 175,687 187,220 126,044 193,421 3.88 3.64 5.41 3.531999 179,685 258,306 42,378 207,247 3.83 2.66 16.23 3.322000 186,609 245,710 36,091 196,903 3.57 2.71 18.43 3.382001 204,251 259,391 39,888 191,935 3.40 2.68 17.44 3.622003 206,096 228,862 31,661 182,936 3.15 2.84 20.52 3.552004 170,652 230,523 173,153 176,487 4.40 3.26 4.34 4.252005 194,075 252,446 184,372 206,823 4.32 3.32 4.54 4.052006 201,780 194,614 215,153 97,044 3.51 3.64 3.29 7.302007 186,540 252,628 205,869 189,570 4.47 3.30 4.05 4.402008 218,187 238,849 157,773 197,512 3.72 3.40 5.15 4.112009 214,648 242,077 200,838 176,530 3.89 3.45 4.15 4.72
35
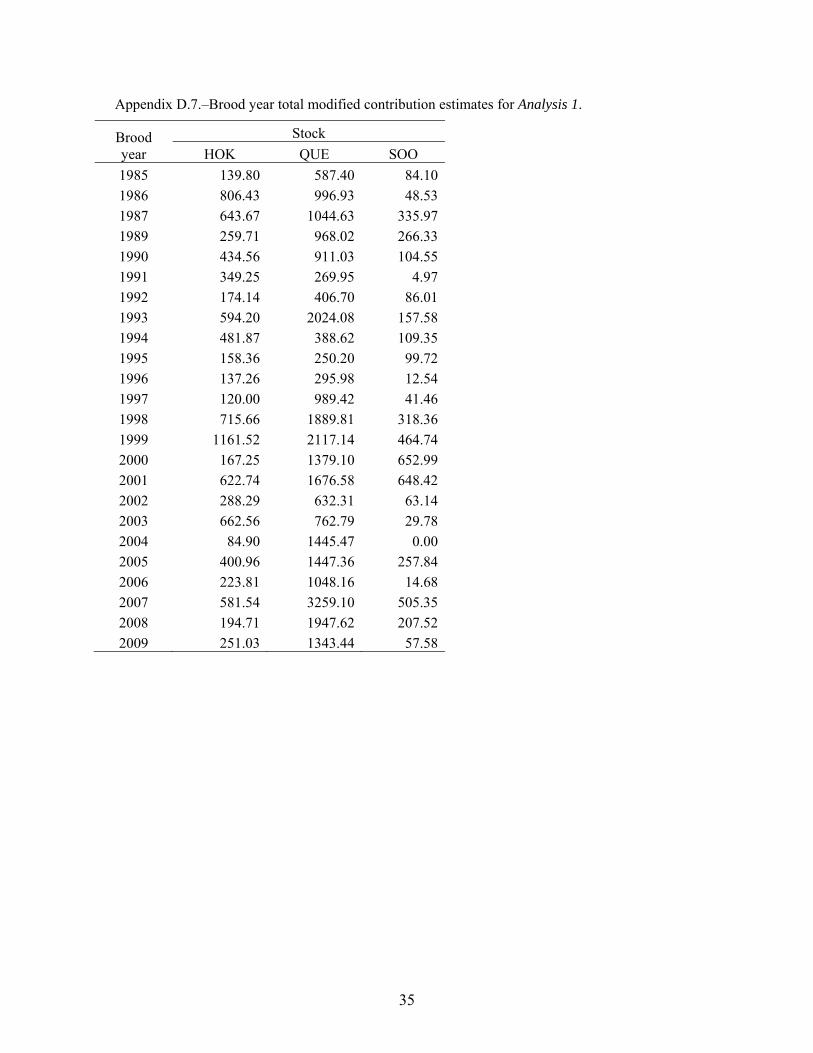
Appendix D.7.–Brood year total modified contribution estimates for Analysis 1.
Brood year
Stock
HOK QUE SOO
1985 139.80 587.40 84.10
1986 806.43 996.93 48.53
1987 643.67 1044.63 335.97
1989 259.71 968.02 266.33
1990 434.56 911.03 104.55
1991 349.25 269.95 4.97
1992 174.14 406.70 86.01
1993 594.20 2024.08 157.58
1994 481.87 388.62 109.35
1995 158.36 250.20 99.72
1996 137.26 295.98 12.54
1997 120.00 989.42 41.46
1998 715.66 1889.81 318.36
1999 1161.52 2117.14 464.74
2000 167.25 1379.10 652.99
2001 622.74 1676.58 648.42
2002 288.29 632.31 63.14
2003 662.56 762.79 29.78
2004 84.90 1445.47 0.00
2005 400.96 1447.36 257.84
2006 223.81 1048.16 14.68
2007 581.54 3259.10 505.35
2008 194.71 1947.62 207.52
2009 251.03 1343.44 57.58
36
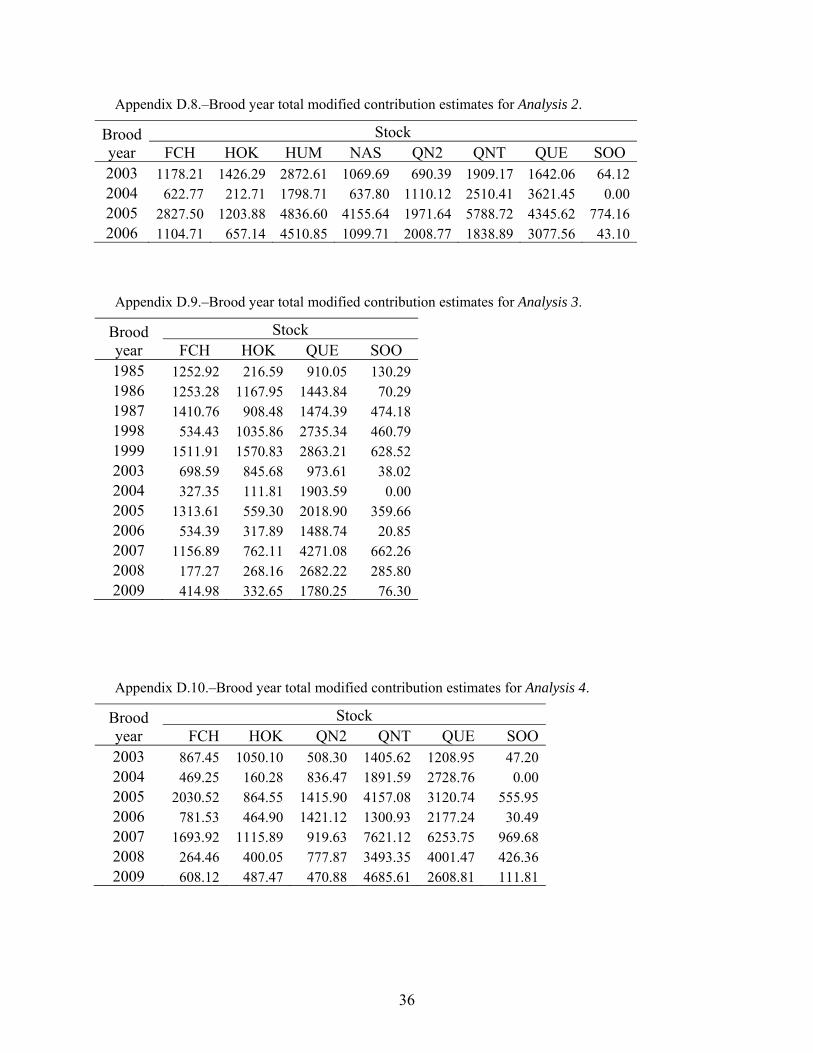
Appendix D.8.–Brood year total modified contribution estimates for Analysis 2.
Brood year
Stock FCH HOK HUM NAS QN2 QNT QUE SOO
2003 1178.21 1426.29 2872.61 1069.69 690.39 1909.17 1642.06 64.12 2004 622.77 212.71 1798.71 637.80 1110.12 2510.41 3621.45 0.00 2005 2827.50 1203.88 4836.60 4155.64 1971.64 5788.72 4345.62 774.16 2006 1104.71 657.14 4510.85 1099.71 2008.77 1838.89 3077.56 43.10
Appendix D.9.–Brood year total modified contribution estimates for Analysis 3.
Brood year
Stock FCH HOK QUE SOO
1985 1252.92 216.59 910.05 130.291986 1253.28 1167.95 1443.84 70.291987 1410.76 908.48 1474.39 474.181998 534.43 1035.86 2735.34 460.791999 1511.91 1570.83 2863.21 628.522003 698.59 845.68 973.61 38.022004 327.35 111.81 1903.59 0.002005 1313.61 559.30 2018.90 359.662006 534.39 317.89 1488.74 20.852007 1156.89 762.11 4271.08 662.262008 177.27 268.16 2682.22 285.802009 414.98 332.65 1780.25 76.30
Appendix D.10.–Brood year total modified contribution estimates for Analysis 4.
Brood year
Stock FCH HOK QN2 QNT QUE SOO
2003 867.45 1050.10 508.30 1405.62 1208.95 47.202004 469.25 160.28 836.47 1891.59 2728.76 0.002005 2030.52 864.55 1415.90 4157.08 3120.74 555.952006 781.53 464.90 1421.12 1300.93 2177.24 30.492007 1693.92 1115.89 919.63 7621.12 6253.75 969.682008 264.46 400.05 777.87 3493.35 4001.47 426.362009 608.12 487.47 470.88 4685.61 2608.81 111.81
37
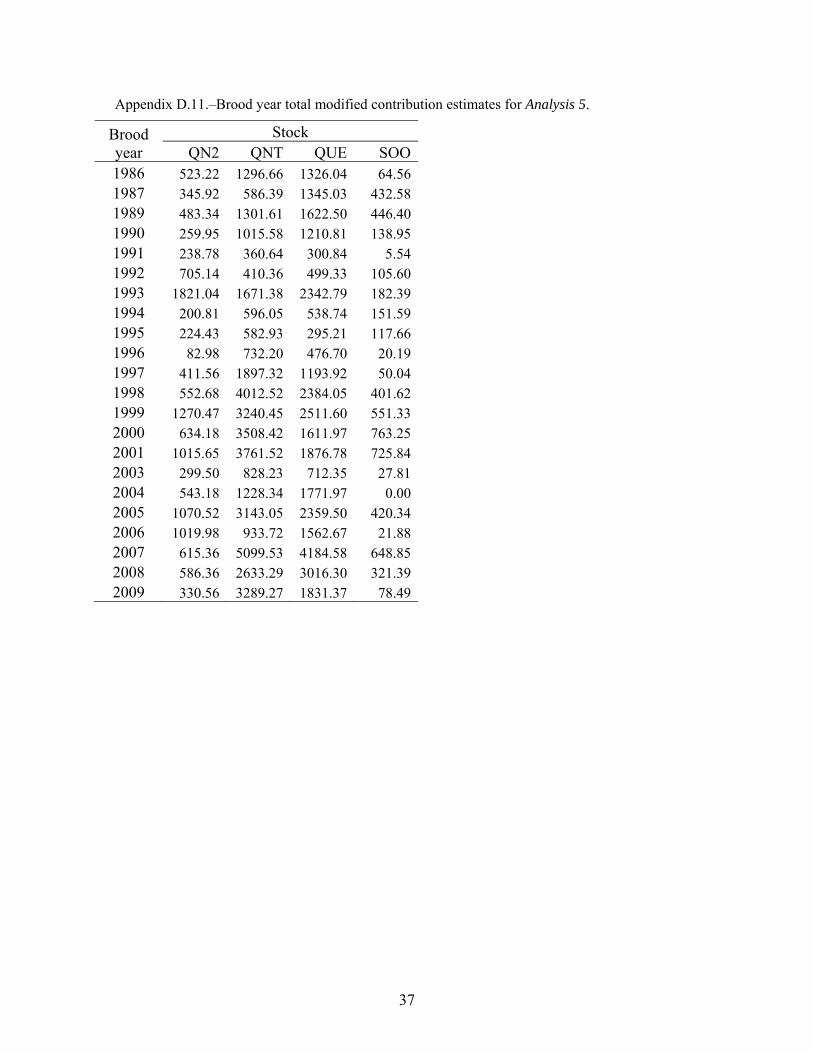
Appendix D.11.–Brood year total modified contribution estimates for Analysis 5.
Brood year
Stock QN2 QNT QUE SOO
1986 523.22 1296.66 1326.04 64.561987 345.92 586.39 1345.03 432.581989 483.34 1301.61 1622.50 446.401990 259.95 1015.58 1210.81 138.951991 238.78 360.64 300.84 5.541992 705.14 410.36 499.33 105.601993 1821.04 1671.38 2342.79 182.391994 200.81 596.05 538.74 151.591995 224.43 582.93 295.21 117.661996 82.98 732.20 476.70 20.191997 411.56 1897.32 1193.92 50.041998 552.68 4012.52 2384.05 401.621999 1270.47 3240.45 2511.60 551.332000 634.18 3508.42 1611.97 763.252001 1015.65 3761.52 1876.78 725.842003 299.50 828.23 712.35 27.812004 543.18 1228.34 1771.97 0.002005 1070.52 3143.05 2359.50 420.342006 1019.98 933.72 1562.67 21.882007 615.36 5099.53 4184.58 648.852008 586.36 2633.29 3016.30 321.392009 330.56 3289.27 1831.37 78.49

38
39
APPENDIX E: FISHERY DEFINITIONS
40
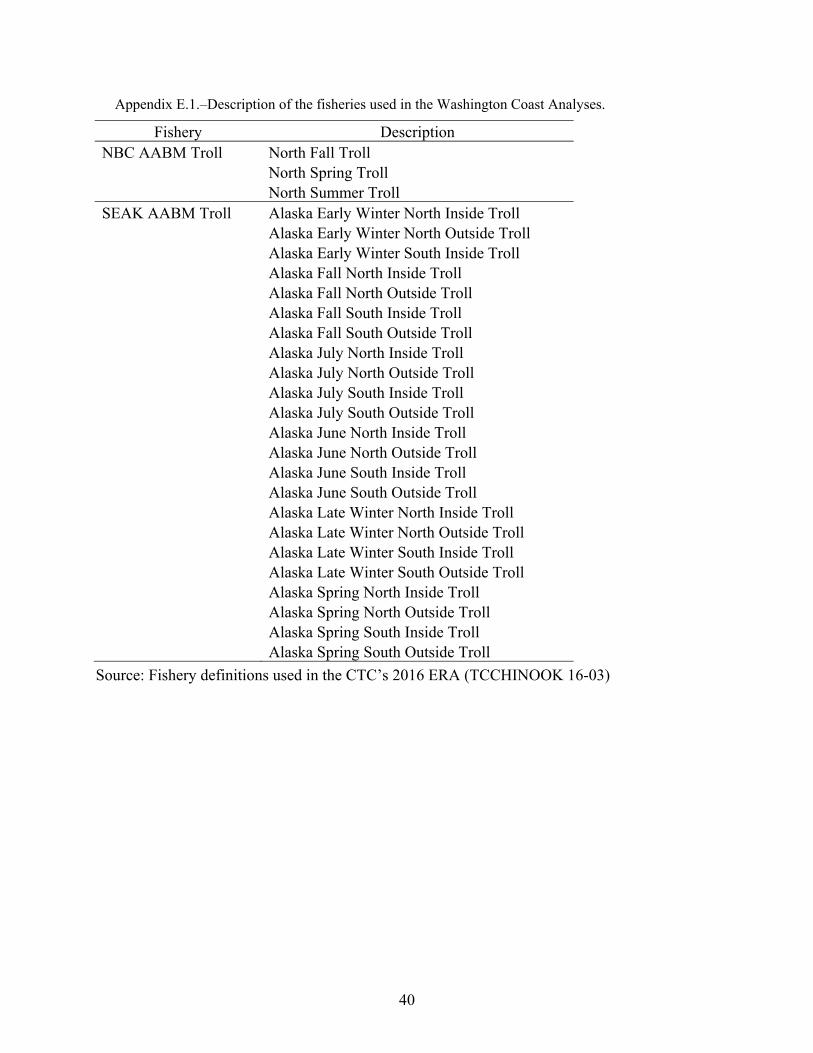
Appendix E.1.–Description of the fisheries used in the Washington Coast Analyses.
Fishery Description NBC AABM Troll North Fall Troll
North Spring Troll North Summer Troll
SEAK AABM Troll Alaska Early Winter North Inside Troll Alaska Early Winter North Outside Troll Alaska Early Winter South Inside Troll Alaska Fall North Inside Troll Alaska Fall North Outside Troll Alaska Fall South Inside Troll Alaska Fall South Outside Troll Alaska July North Inside Troll Alaska July North Outside Troll Alaska July South Inside Troll Alaska July South Outside Troll Alaska June North Inside Troll Alaska June North Outside Troll Alaska June South Inside Troll Alaska June South Outside Troll Alaska Late Winter North Inside Troll Alaska Late Winter North Outside Troll Alaska Late Winter South Inside Troll Alaska Late Winter South Outside Troll Alaska Spring North Inside Troll Alaska Spring North Outside Troll Alaska Spring South Inside Troll Alaska Spring South Outside Troll
Source: Fishery definitions used in the CTC’s 2016 ERA (TCCHINOOK 16-03)
41
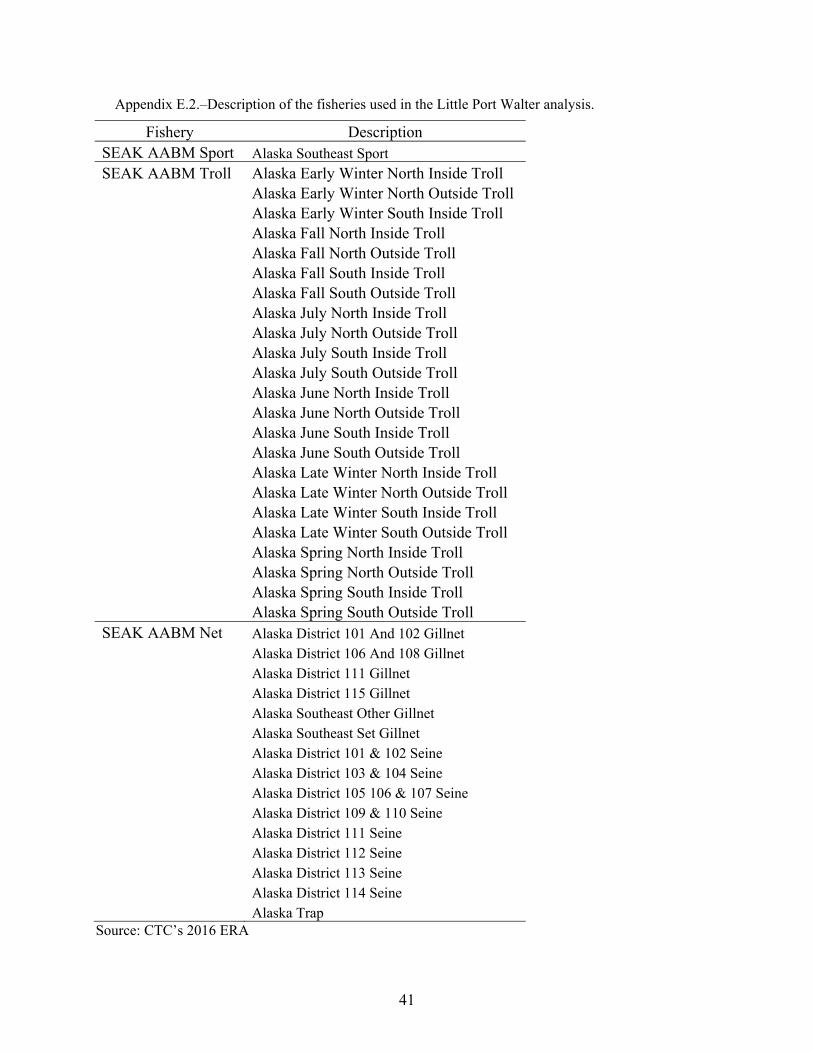
Appendix E.2.–Description of the fisheries used in the Little Port Walter analysis.
Fishery Description SEAK AABM Sport Alaska Southeast Sport
SEAK AABM Troll Alaska Early Winter North Inside Troll Alaska Early Winter North Outside Troll Alaska Early Winter South Inside Troll Alaska Fall North Inside Troll Alaska Fall North Outside Troll Alaska Fall South Inside Troll Alaska Fall South Outside Troll Alaska July North Inside Troll Alaska July North Outside Troll Alaska July South Inside Troll Alaska July South Outside Troll Alaska June North Inside Troll Alaska June North Outside Troll Alaska June South Inside Troll Alaska June South Outside Troll Alaska Late Winter North Inside Troll Alaska Late Winter North Outside Troll Alaska Late Winter South Inside Troll Alaska Late Winter South Outside Troll Alaska Spring North Inside Troll Alaska Spring North Outside Troll Alaska Spring South Inside Troll Alaska Spring South Outside Troll
SEAK AABM Net Alaska District 101 And 102 Gillnet Alaska District 106 And 108 Gillnet Alaska District 111 Gillnet Alaska District 115 Gillnet Alaska Southeast Other Gillnet Alaska Southeast Set Gillnet Alaska District 101 & 102 Seine Alaska District 103 & 104 Seine Alaska District 105 106 & 107 Seine Alaska District 109 & 110 Seine Alaska District 111 Seine Alaska District 112 Seine Alaska District 113 Seine Alaska District 114 Seine Alaska Trap
Source: CTC’s 2016 ERA

42
43
APPENDIX F: MODEL DIAGNOSTICS OF ANALYSES 1–5
44
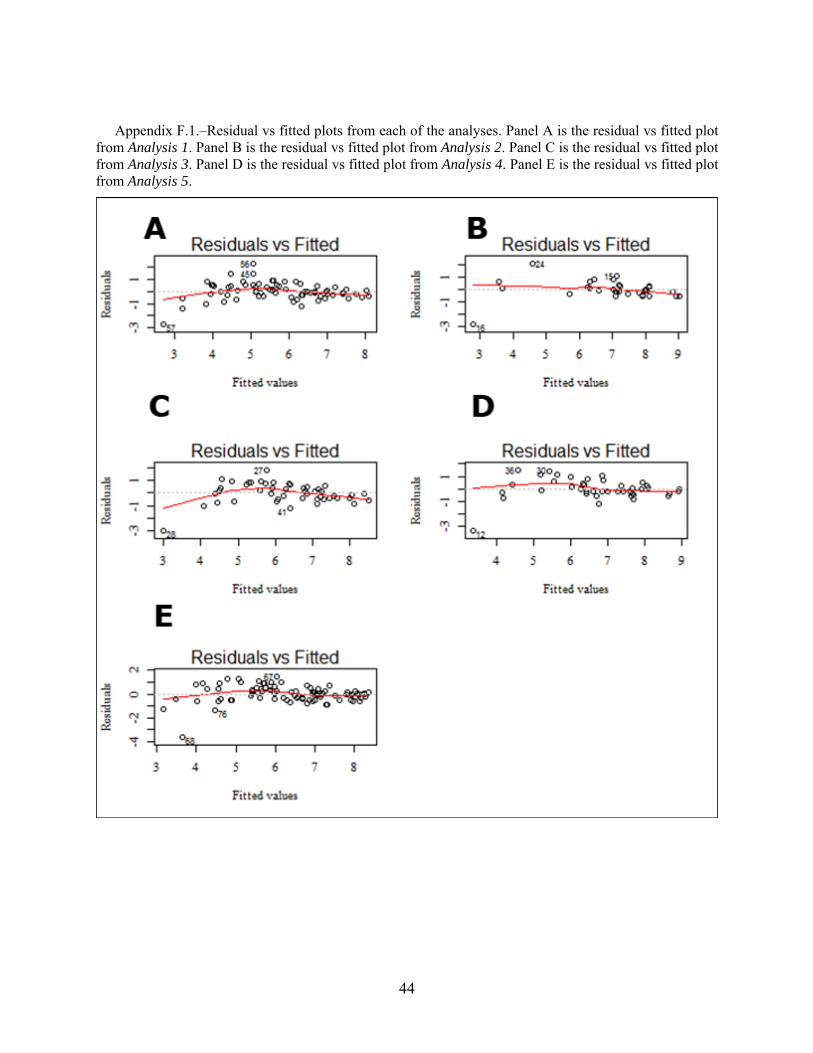
Appendix F.1.–Residual vs fitted plots from each of the analyses. Panel A is the residual vs fitted plot from Analysis 1. Panel B is the residual vs fitted plot from Analysis 2. Panel C is the residual vs fitted plot from Analysis 3. Panel D is the residual vs fitted plot from Analysis 4. Panel E is the residual vs fitted plot from Analysis 5.