Embed Size (px)
Citation preview

Does the value of a nursing Baccalaureate degree depend on the type and quality of the program?OLGA YAKUSHEVA, UNIVERSITY OF MICHIGAN
MARIANNE WEISS, MARQUETTE UNIVERSITY

Background Increasing nurse education is the focal point of the healthcare reform
◦ Nurse education has been linked to improved patient outcomes ◦ Nurse education (Aiken et al. 2003, 2011, 2014; Manojlovich et al. 2011; Blegen et al. 2013; Yakusheva et al. 2014a)◦ Business case for investments in a baccalaureate-educated hospital nursing workforce (Yakusheva et al. 2014b)
◦ Institute of Medicine recommended:◦ Increase the % of Baccalaureate-educated nurses to 80%◦ Double the number of Nursing doctorates◦ Tuition reimbursement, scholarship and loan forgiveness
2015
55%
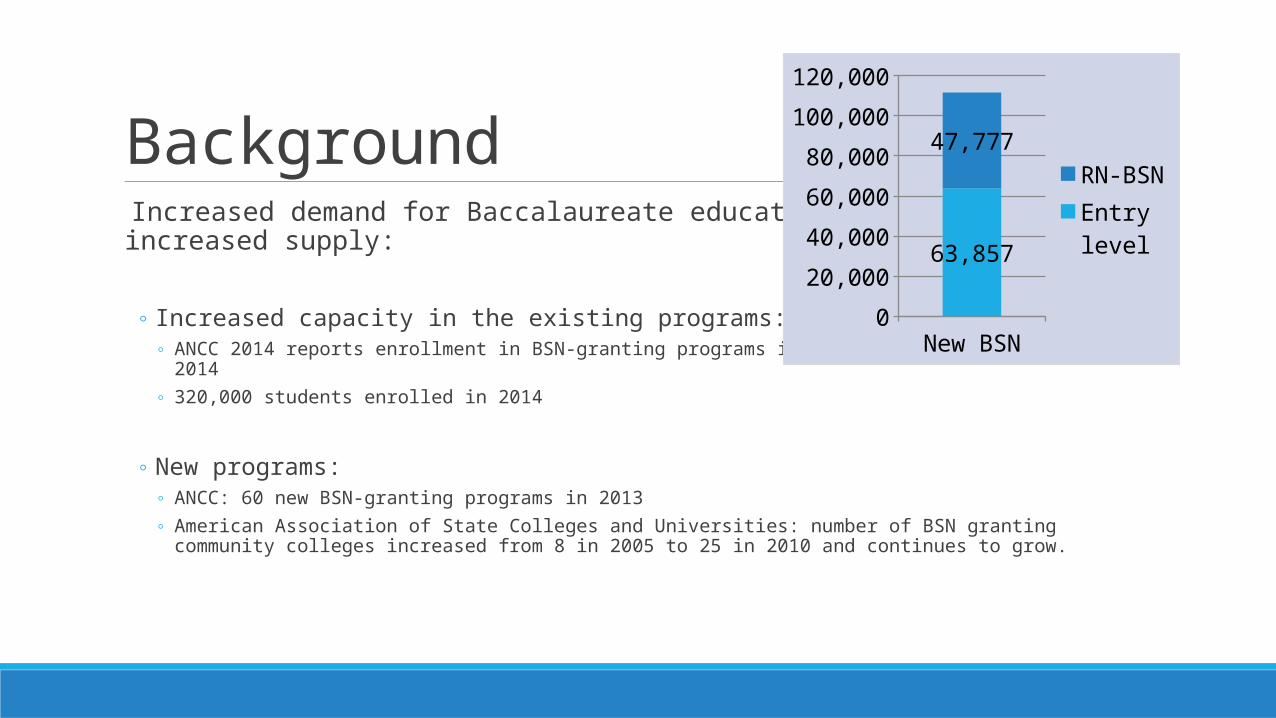
Background Increased demand for Baccalaureate education is met with an increased supply:
◦ Increased capacity in the existing programs:◦ ANCC 2014 reports enrollment in BSN-granting programs increased 10.4% between 2013 & 2014 ◦ 320,000 students enrolled in 2014
◦ New programs:◦ ANCC: 60 new BSN-granting programs in 2013◦ American Association of State Colleges and Universities: number of BSN granting community colleges increased from 8 in 2005 to
25 in 2010 and continues to grow.
New BSN0
20,000
40,000
60,000
80,000
100,000
120,000
63,857
47,777
RN-BSNEntry level
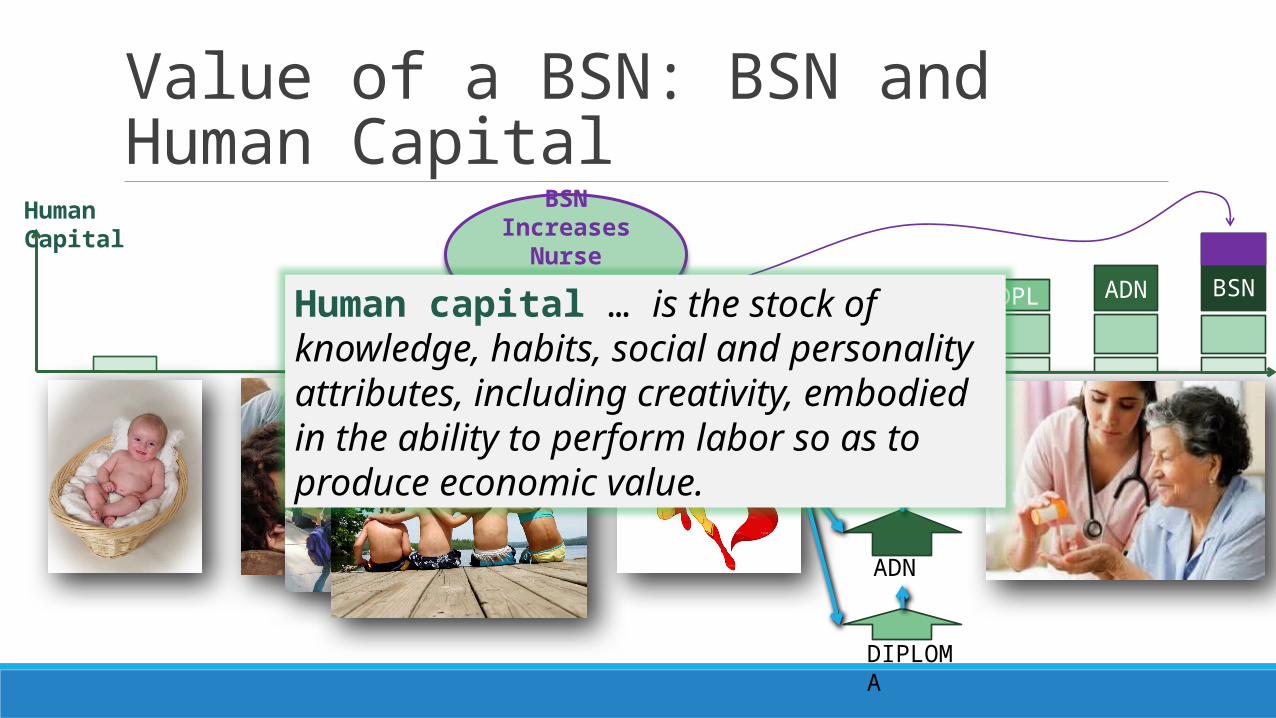
Value of a BSN: BSN and Human Capital
ADN
DIPLOMA
BSN
DPL BSNADN
BSN Increases Nurse Human
Capital Human capital … is the stock of knowledge, habits, social and personality attributes, including creativity, embodied in the ability to perform labor so as to produce economic value.
Human Capital
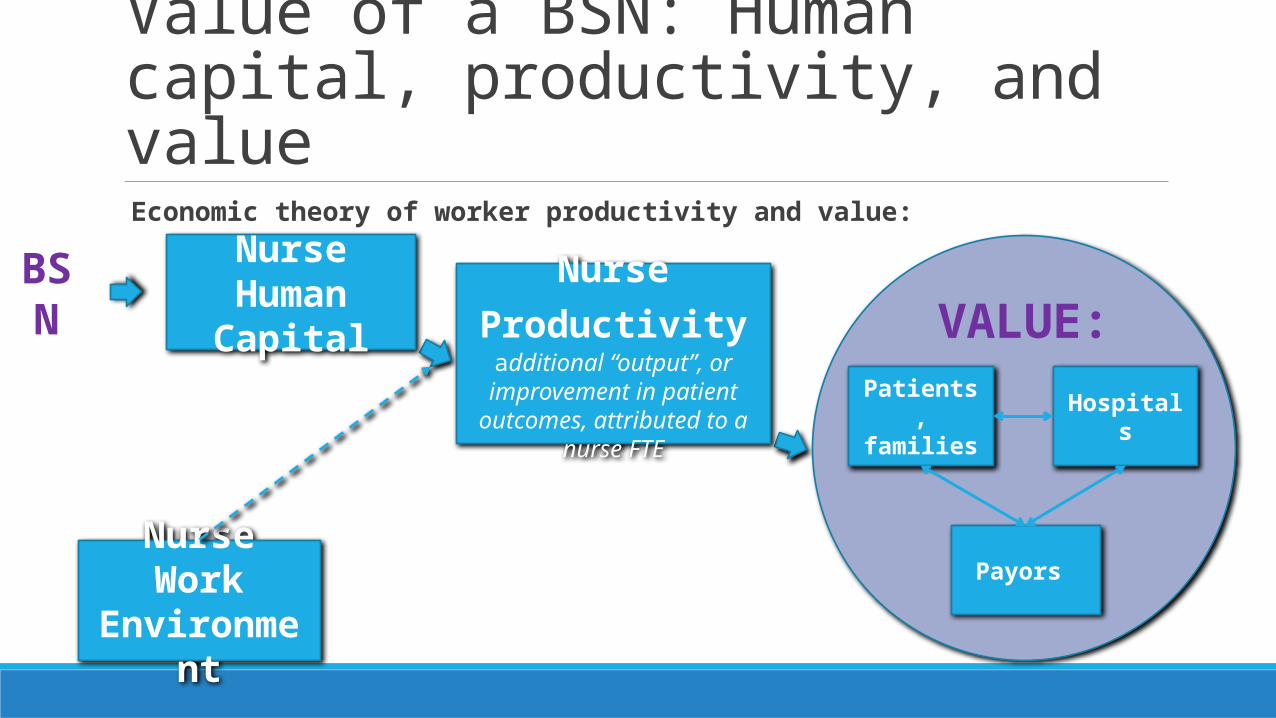
Economic theory of worker productivity and value:
VALUE:
Value of a BSN: Human capital, productivity, and value
Nurse Productivity additional “output”, or improvement in patient
outcomes, attributed to a nurse FTE
Nurse Human Capital
Nurse Work Environment
Patients, families Hospitals
Payors
BSN
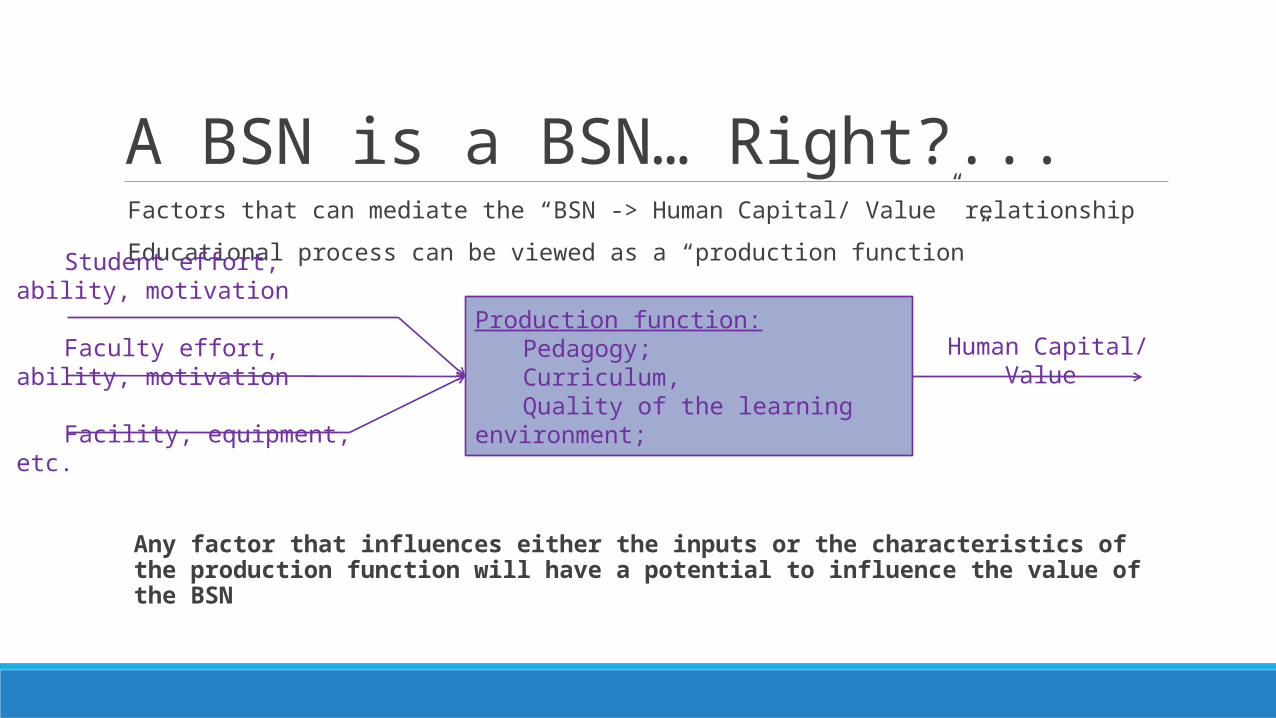
A BSN is a BSN… Right?... Factors that can mediate the “BSN -> Human Capital/ Value” relationship
Educational process can be viewed as a “production function”
Any factor that influences either the inputs or the characteristics of the production function will have a potential to influence the value of the BSN
Student effort, ability, motivation
Faculty effort, ability, motivation
Facility, equipment, etc.
Production function:Pedagogy;Curriculum,Quality of the learning
environment;
Human Capital/ Value
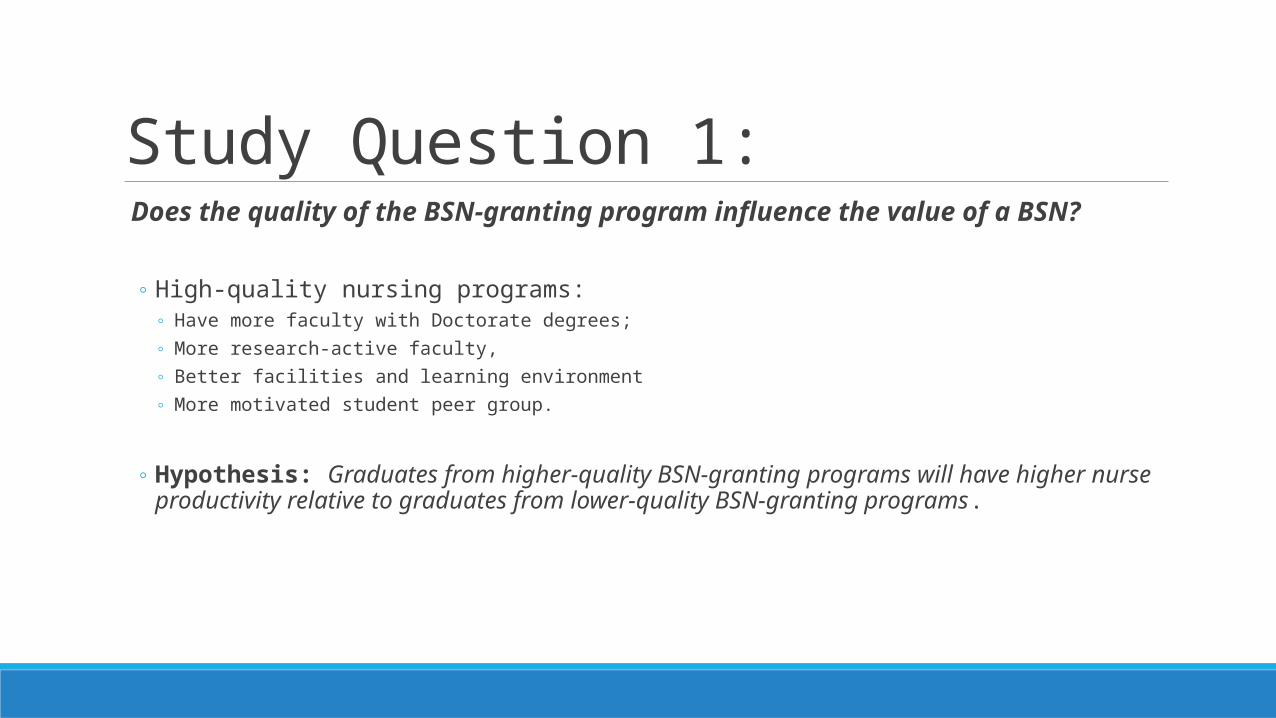
Study Question 1: Does the quality of the BSN-granting program influence the value of a BSN?
◦ High-quality nursing programs:◦ Have more faculty with Doctorate degrees; ◦ More research-active faculty, ◦ Better facilities and learning environment◦ More motivated student peer group.
◦ Hypothesis: Graduates from higher-quality BSN-granting programs will have higher nurse productivity relative to graduates from lower-quality BSN-granting programs.
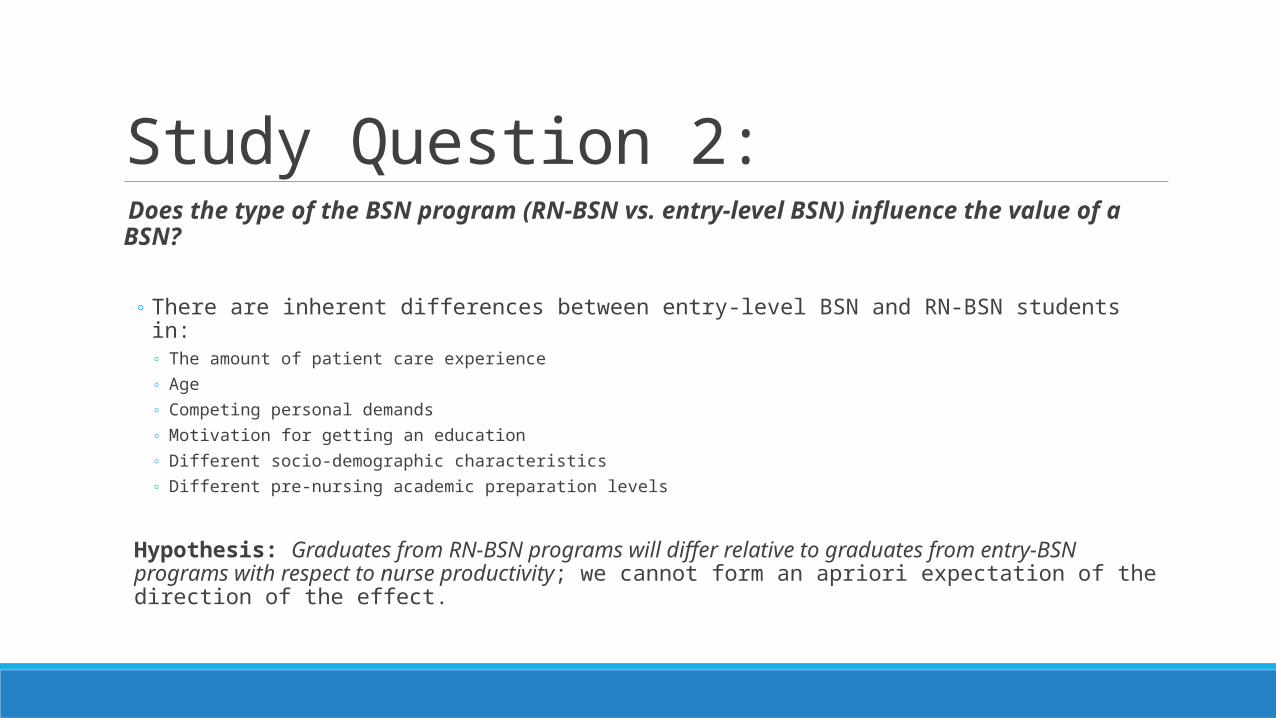
Study Question 2: Does the type of the BSN program (RN-BSN vs. entry-level BSN) influence the value of a BSN?
◦ There are inherent differences between entry-level BSN and RN-BSN students in:◦ The amount of patient care experience◦ Age ◦ Competing personal demands ◦ Motivation for getting an education◦ Different socio-demographic characteristics◦ Different pre-nursing academic preparation levels
Hypothesis: Graduates from RN-BSN programs will differ relative to graduates from entry-BSN programs with respect to nurse productivity; we cannot form an apriori expectation of the direction of the effect.
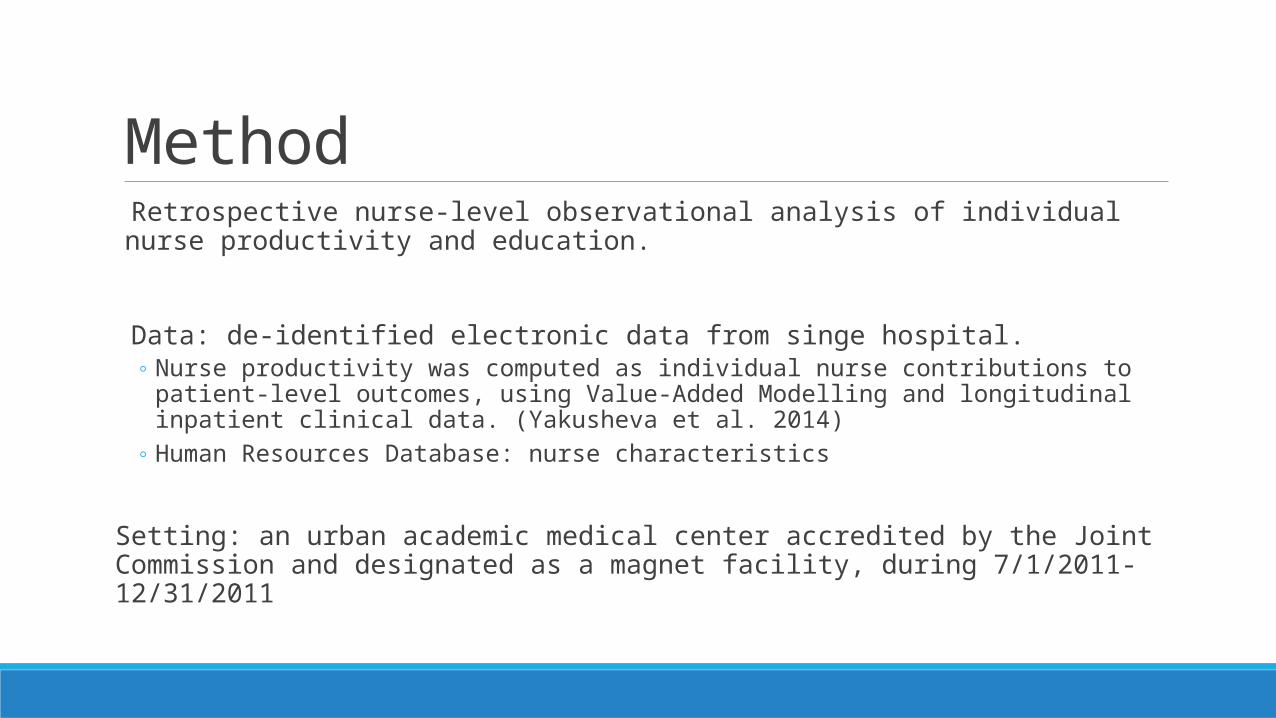
Method Retrospective nurse-level observational analysis of individual nurse productivity and education.
Data: de-identified electronic data from singe hospital. ◦ Nurse productivity was computed as individual nurse contributions to patient-level outcomes, using
Value-Added Modelling and longitudinal inpatient clinical data. (Yakusheva et al. 2014)◦ Human Resources Database: nurse characteristics
Setting: an urban academic medical center accredited by the Joint Commission and designated as a magnet facility, during 7/1/2011-12/31/2011
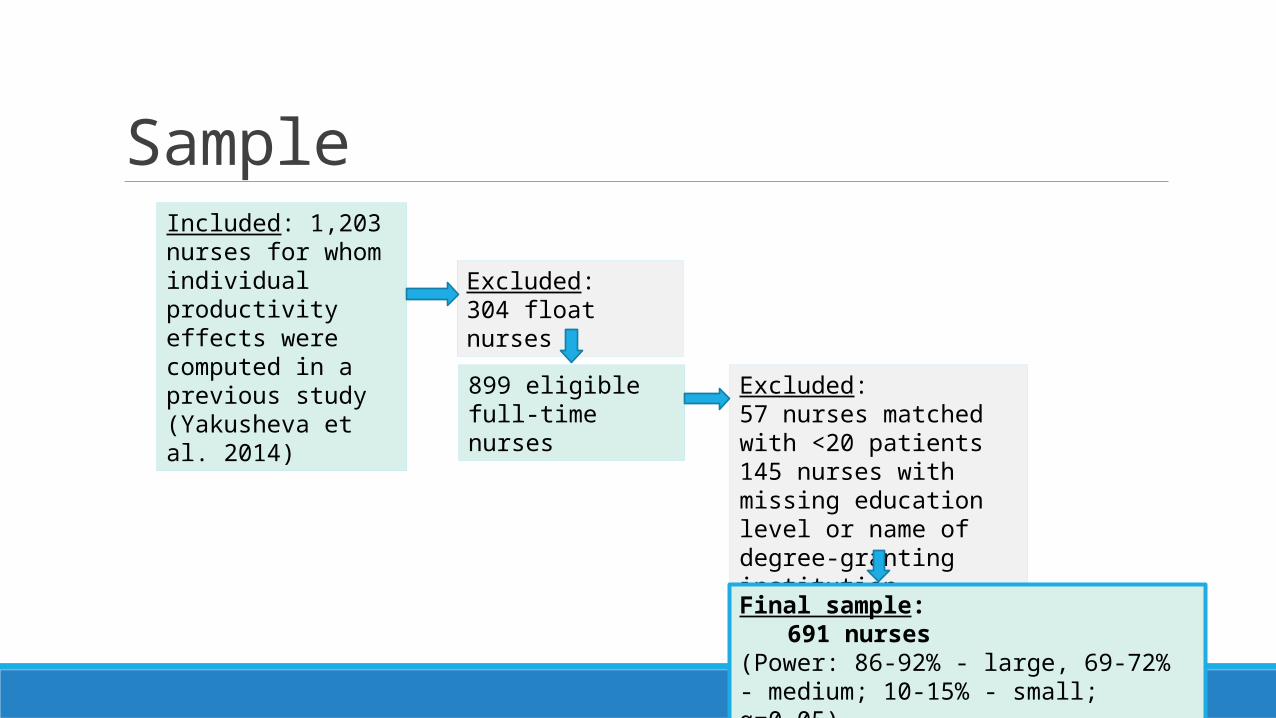
SampleIncluded: 1,203 nurses for whom individual productivity effects were computed in a previous study (Yakusheva et al. 2014)
Excluded: 304 float nurses
899 eligible full-time nurses
Excluded: 57 nurses matched with <20 patients145 nurses with missing education level or name of degree-granting institution
Final sample: 691 nurses
(Power: 86-92% - large, 69-72% - medium; 10-15% - small; α=0.05)
MeasuresNURSE EDUCATION VARIABLES NURSE PRODUCTIVITY CONTOLS
Education: BSN: 1 if Bachelor’s or higher degree/ 0 if Diploma/ Associate’s degree
Quality of the degree-granting program: High-quality BSN: 1 if graduated from a program ranked in US News and World Report’s Best College RankingAverage-quality BSN: 1 if graduated from non-ranked program
Type of program: Entry-BSN: 1 if completed degree prior to starting employment; RN-BSN: 1 if completed degree after starting employment.
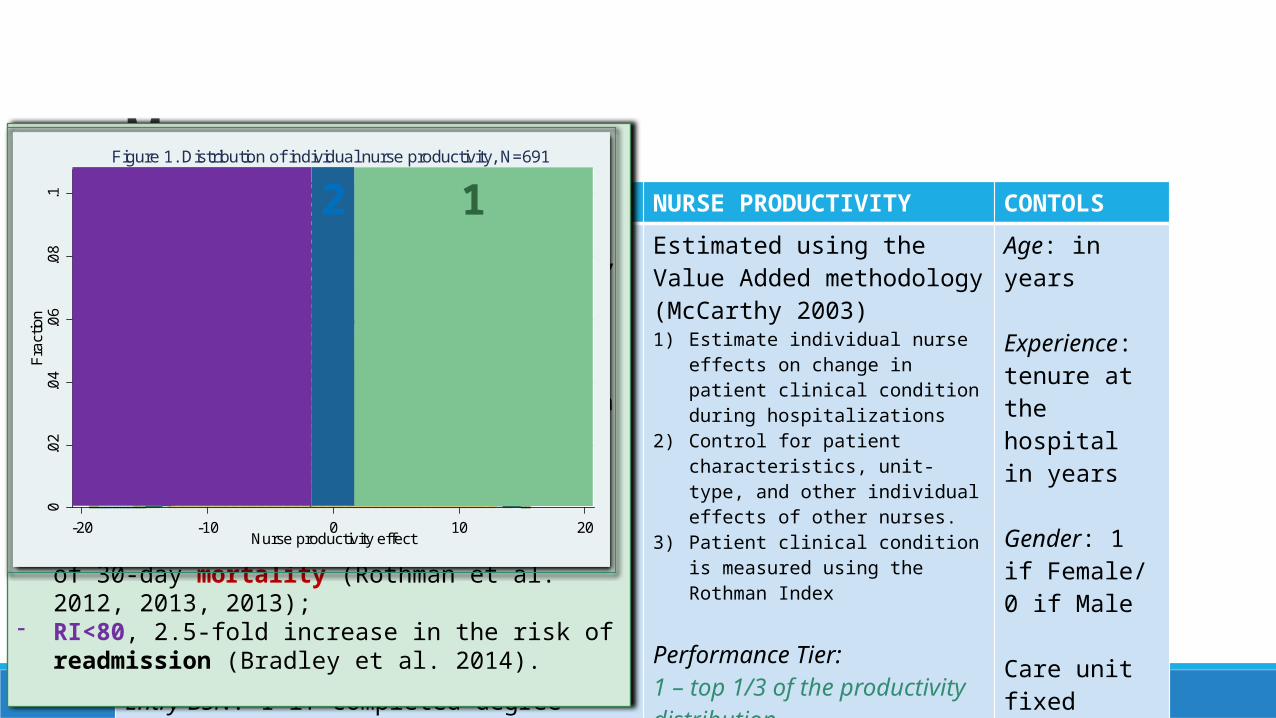
Estimated using the Value Added methodology (McCarthy 2003) 1) Estimate individual nurse effects on
change in patient clinical condition during hospitalizations
2) Control for patient characteristics, unit-type, and other individual effects of other nurses.
3) Patient clinical condition is measured using the Rothman Index
Performance Tier:1 – top 1/3 of the productivity distribution2 – middle 1/3 of the productivity distribution3 – bottom 1/3 of the productivity distribution
Age: in years
Experience: tenure at the hospital in years
Gender: 1 if Female/ 0 if Male
Care unit fixed effects
The Rothman Index (RI) (Rothman et al. 2012, 2013, 2013):- 26 clinical parameters from the EMR
- nurse assessments (e.g., food/nutrition, skin, psycho-social, etc.), vital signs (e.g., temperature, blood pressure, etc.), heart rhythms (sinus bradycardia, sinus rhythm, etc.), and lab tests;
- Updated in real time as new information is entered into the system.
- Theoretical range of (-69 to 100); higher values indicate better clinical condition.
- RI<40, five-fold increase in the risk of 30-day mortality (Rothman et al. 2012, 2013, 2013);
- RI<80, 2.5-fold increase in the risk of readmission (Bradley et al. 2014). 0
.02
.04
.06
.08
.1F
ract
ion
-20 -10 0 10 20Nurse productivity effect
Figure 1. Distribution of individual nurse productivity, N=691
123
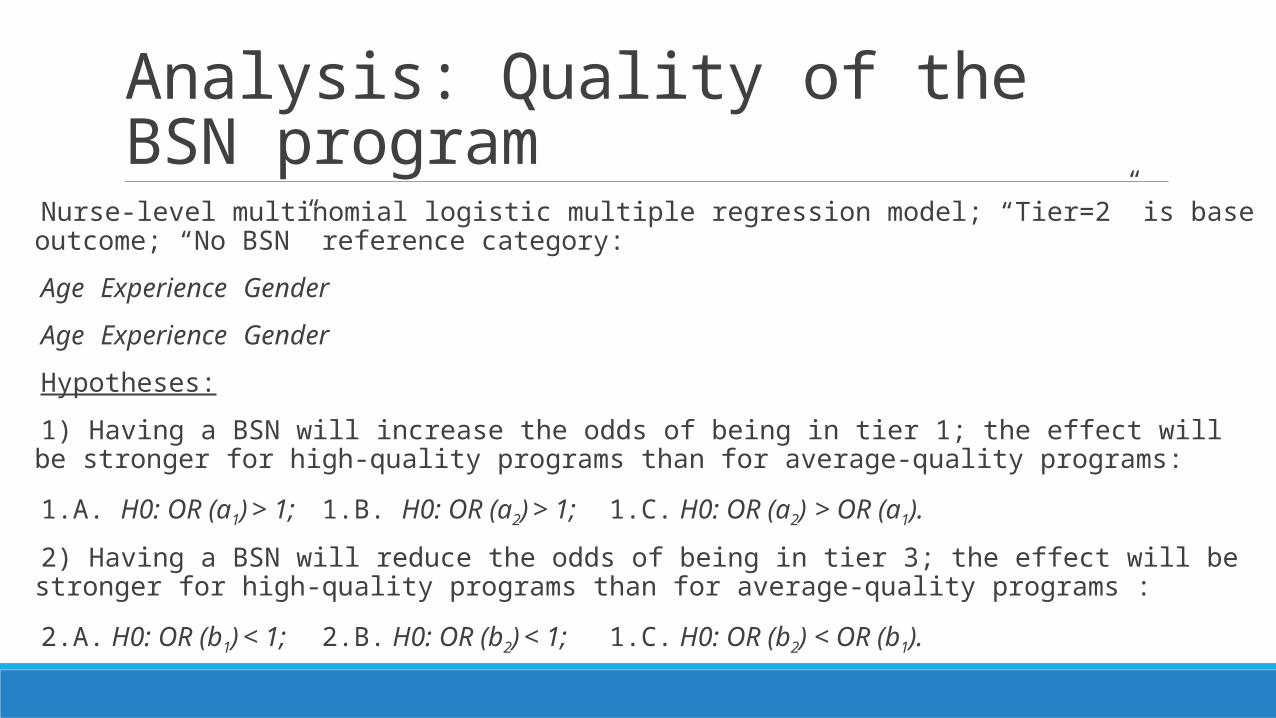
Analysis: Quality of the BSN program
Nurse-level multinomial logistic multiple regression model; “Tier=2” is base outcome; “No BSN” reference category:
Age Experience Gender
Age Experience Gender
Hypotheses:
1) Having a BSN will increase the odds of being in tier 1; the effect will be stronger for high-quality programs than for average-quality programs:
1.A. H0: OR (a1) > 1; 1.B. H0: OR (a2) > 1; 1.C. H0: OR (a2) > OR (a1).
2) Having a BSN will reduce the odds of being in tier 3; the effect will be stronger for high-quality programs than for average-quality programs :
2.A. H0: OR (b1) < 1; 2.B. H0: OR (b2) < 1; 1.C. H0: OR (b2) < OR (b1).
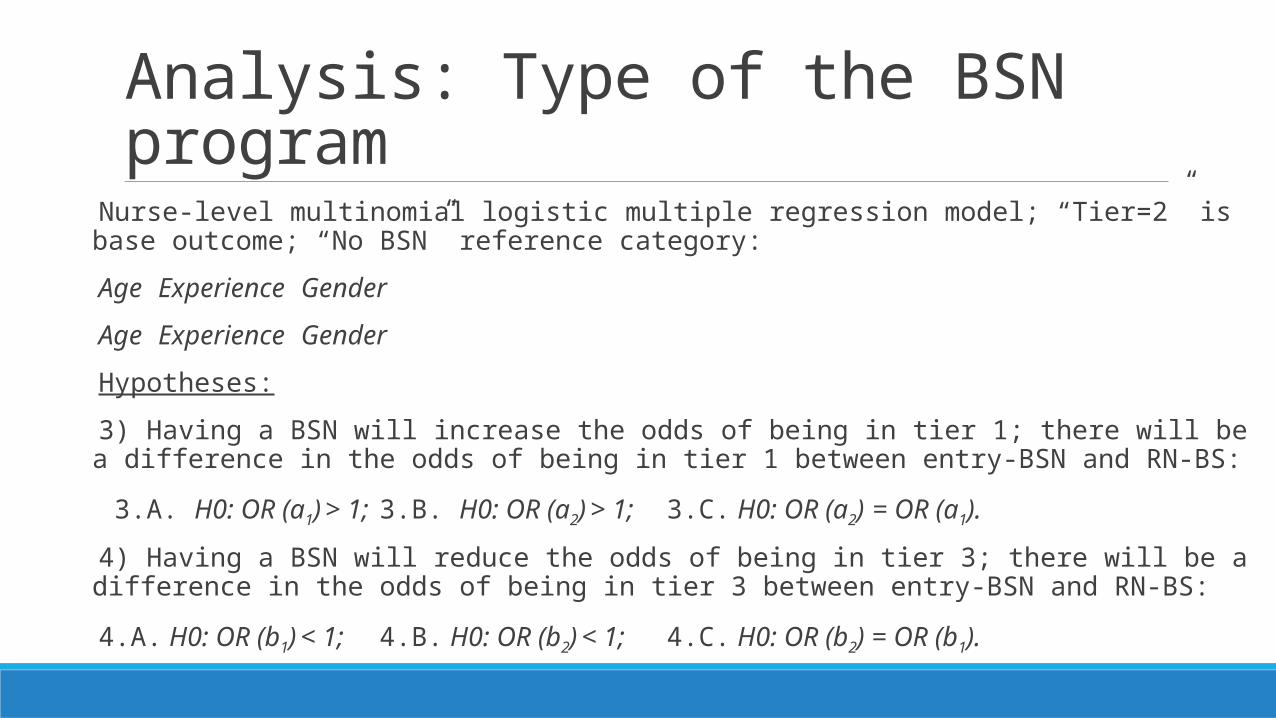
Analysis: Type of the BSN program
Nurse-level multinomial logistic multiple regression model; “Tier=2” is base outcome; “No BSN” reference category:
Age Experience Gender
Age Experience Gender
Hypotheses:
3) Having a BSN will increase the odds of being in tier 1; there will be a difference in the odds of being in tier 1 between entry-BSN and RN-BS:
3.A. H0: OR (a1) > 1; 3.B. H0: OR (a2) > 1; 3.C. H0: OR (a2) = OR (a1).
4) Having a BSN will reduce the odds of being in tier 3; there will be a difference in the odds of being in tier 3 between entry-BSN and RN-BS:
4.A. H0: OR (b1) < 1; 4.B. H0: OR (b2) < 1; 4.C. H0: OR (b2) = OR (b1).
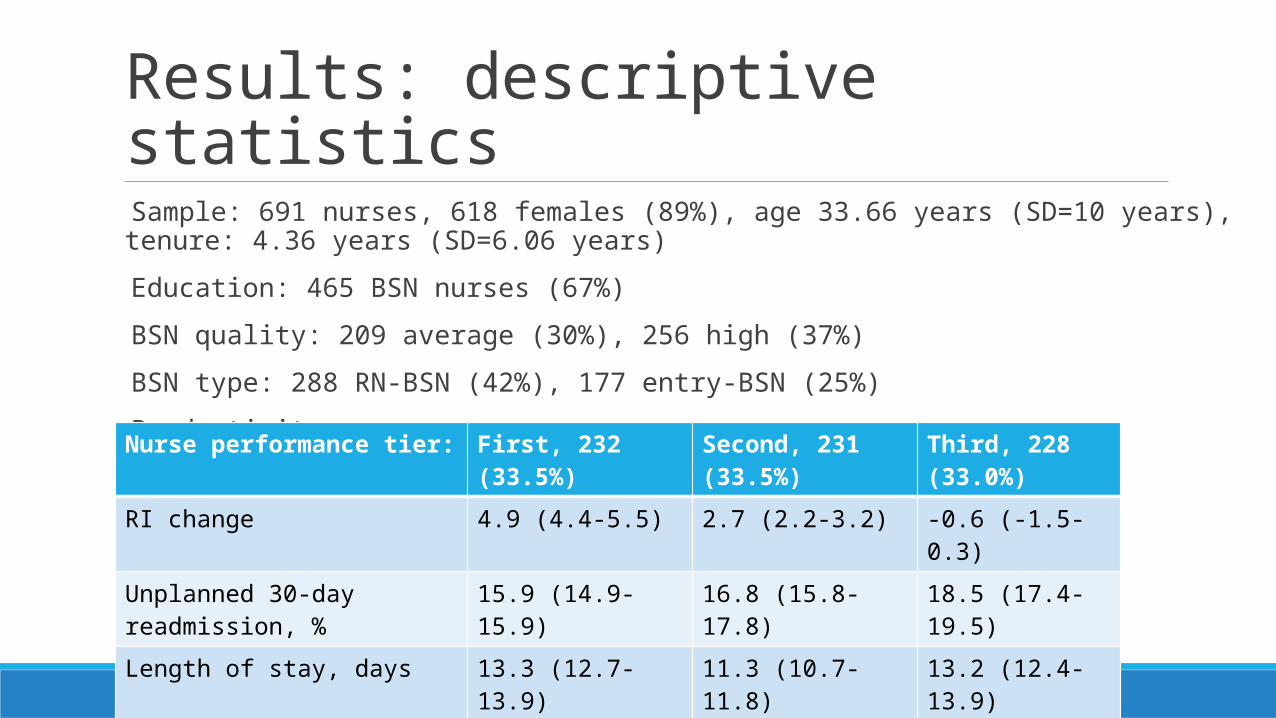
Results: descriptive statistics Sample: 691 nurses, 618 females (89%), age 33.66 years (SD=10 years), tenure: 4.36 years (SD=6.06 years)
Education: 465 BSN nurses (67%)
BSN quality: 209 average (30%), 256 high (37%)
BSN type: 288 RN-BSN (42%), 177 entry-BSN (25%)
Productivity:Nurse performance tier: First, 232 (33.5%) Second, 231 (33.5%) Third, 228 (33.0%)
RI change 4.9 (4.4-5.5) 2.7 (2.2-3.2) -0.6 (-1.5-0.3)
Unplanned 30-day readmission, % 15.9 (14.9-15.9) 16.8 (15.8-17.8) 18.5 (17.4-19.5)
Length of stay, days 13.3 (12.7-13.9) 11.3 (10.7-11.8) 13.2 (12.4-13.9)
Cost, $1000 50.2 (46.5-53.0) 38.1 (35.1-41.0) 48.9 (45.3-52.4)
RI at admission 65.7 (64.6-66.7) 70.4 (69.4-71.4) 69.8 (68.5-71.2)
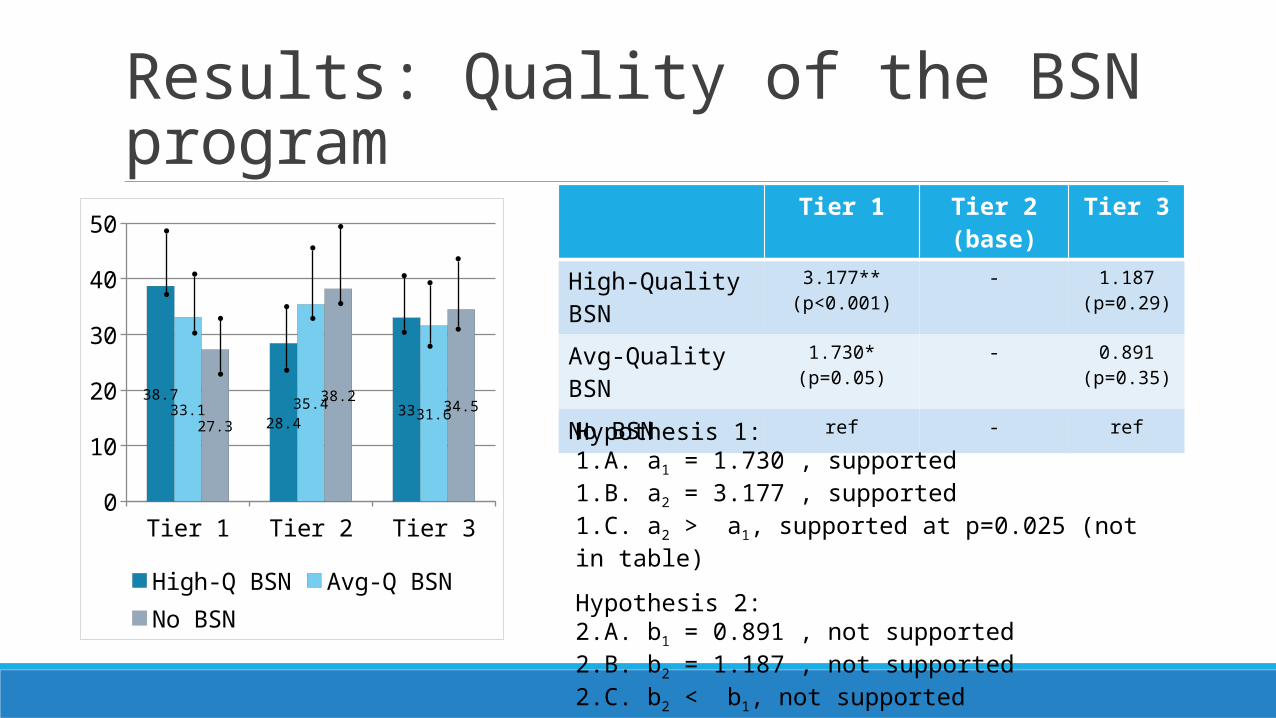
Results: Quality of the BSN program
Tier 1 Tier 2 Tier 305
1015202530354045
38.7
28.43333.1 35.4
31.627.3
38.234.5
High-Q BSN Avg-Q BSNNo BSN
Tier 1 Tier 2(base)
Tier 3
High-Quality BSN 3.177**(p<0.001)
- 1.187(p=0.29)
Avg-Quality BSN 1.730*(p=0.05)
- 0.891(p=0.35)
No BSN ref - ref
Hypothesis 1: 1.A. a1 = 1.730 , supported1.B. a2 = 3.177 , supported1.C. a2 > a1, supported at p=0.025 (not in table)
Hypothesis 2: 2.A. b1 = 0.891 , not supported2.B. b2 = 1.187 , not supported2.C. b2 < b1, not supported
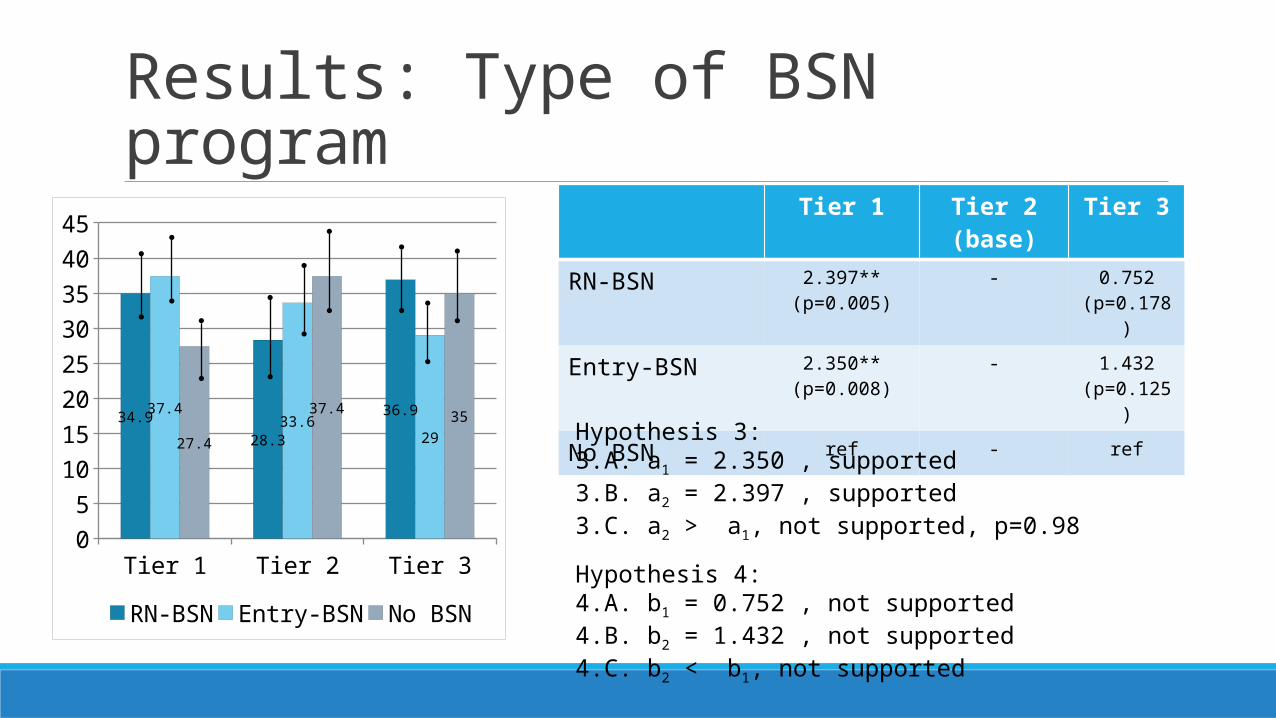
Results: Type of BSN program
Tier 1 Tier 2 Tier 30
5
10
15
20
25
30
35
40
45
34.9
28.3
36.937.433.6
2927.4
37.435
RN-BSN Entry-BSN No BSN
Tier 1 Tier 2(base)
Tier 3
RN-BSN 2.397**(p=0.005)
- 0.752(p=0.178)
Entry-BSN 2.350**(p=0.008)
- 1.432(p=0.125)
No BSN ref - ref
Hypothesis 3: 3.A. a1 = 2.350 , supported3.B. a2 = 2.397 , supported3.C. a2 > a1, not supported, p=0.98
Hypothesis 4: 4.A. b1 = 0.752 , not supported4.B. b2 = 1.432 , not supported4.C. b2 < b1, not supported
Discussion 1) Having a BSN is strongly and positively associated with being in the top performance tier, regardless of the type of the BSN (RN-BSN vs Entry-BSN) or the quality of the program (Ranked vs non-ranked).
Federal, state, and health systems initiatives to build a BSN-educated workforce.
2) BSNs from high-quality programs add significantly more value than BSN from non-ranked programs.
transitioning to the 80% BSN target could dilute the value of BSN if not accompanied by improved access to high-quality education through state and federal tuition assistance programs
3) The value of a BSN does not depend on the type of the program (Entry-level vs. RN-BSN)
Preferential hiring of new BSNs and supporting RN-BSN transitions for the existing non-BSN nurses are both key to achieving the 80% BSN target
4) Being in the bottom tier is not associated with the education level, quality of the program, or type of the program.
Education does safeguard against low individual productivity.
Limitations 1) Threats to generalizability
◦ Single large Magnet teaching facility with a high proportion of BSN-prepared nurses
2) Sample size powered for large effect sizes only.
3) Measurement error◦ US News and World report ranking does not capture all aspects of quality. Non-ranked programs and
community colleges may provide high quality BSN education. This will attenuate (bias to down) the results in the quality of BSN analysis.
◦ Type of the program is ascertained from date of employment. Some nurses may have transitioned from an ADN to a BSN prior to employment but would be coded as entry BSNs in this analysis, biasing estimates of productivity differences down.
◦ Experience as an RN was not available in the data. Controlling for age and hospital tenure may not fully control for differences in experiences as an RN among the study nurses, further contributing to non-significant findings in the RN-BSN vs. Entry-BSN analysis.
Large, multi-site studies are needed to confirm and extend the results of this study.
Conclusions Federal, state, and health systems initiatives to build a BSN-educated workforce.
Tuition support programs to improve access to high-quality regional and national educational programs
Drivers of high and low performance are different. Education is associated with high quality. The questions that we ask about low performance might be different than the questions that we ask about high performance.