Embed Size (px)
Citation preview
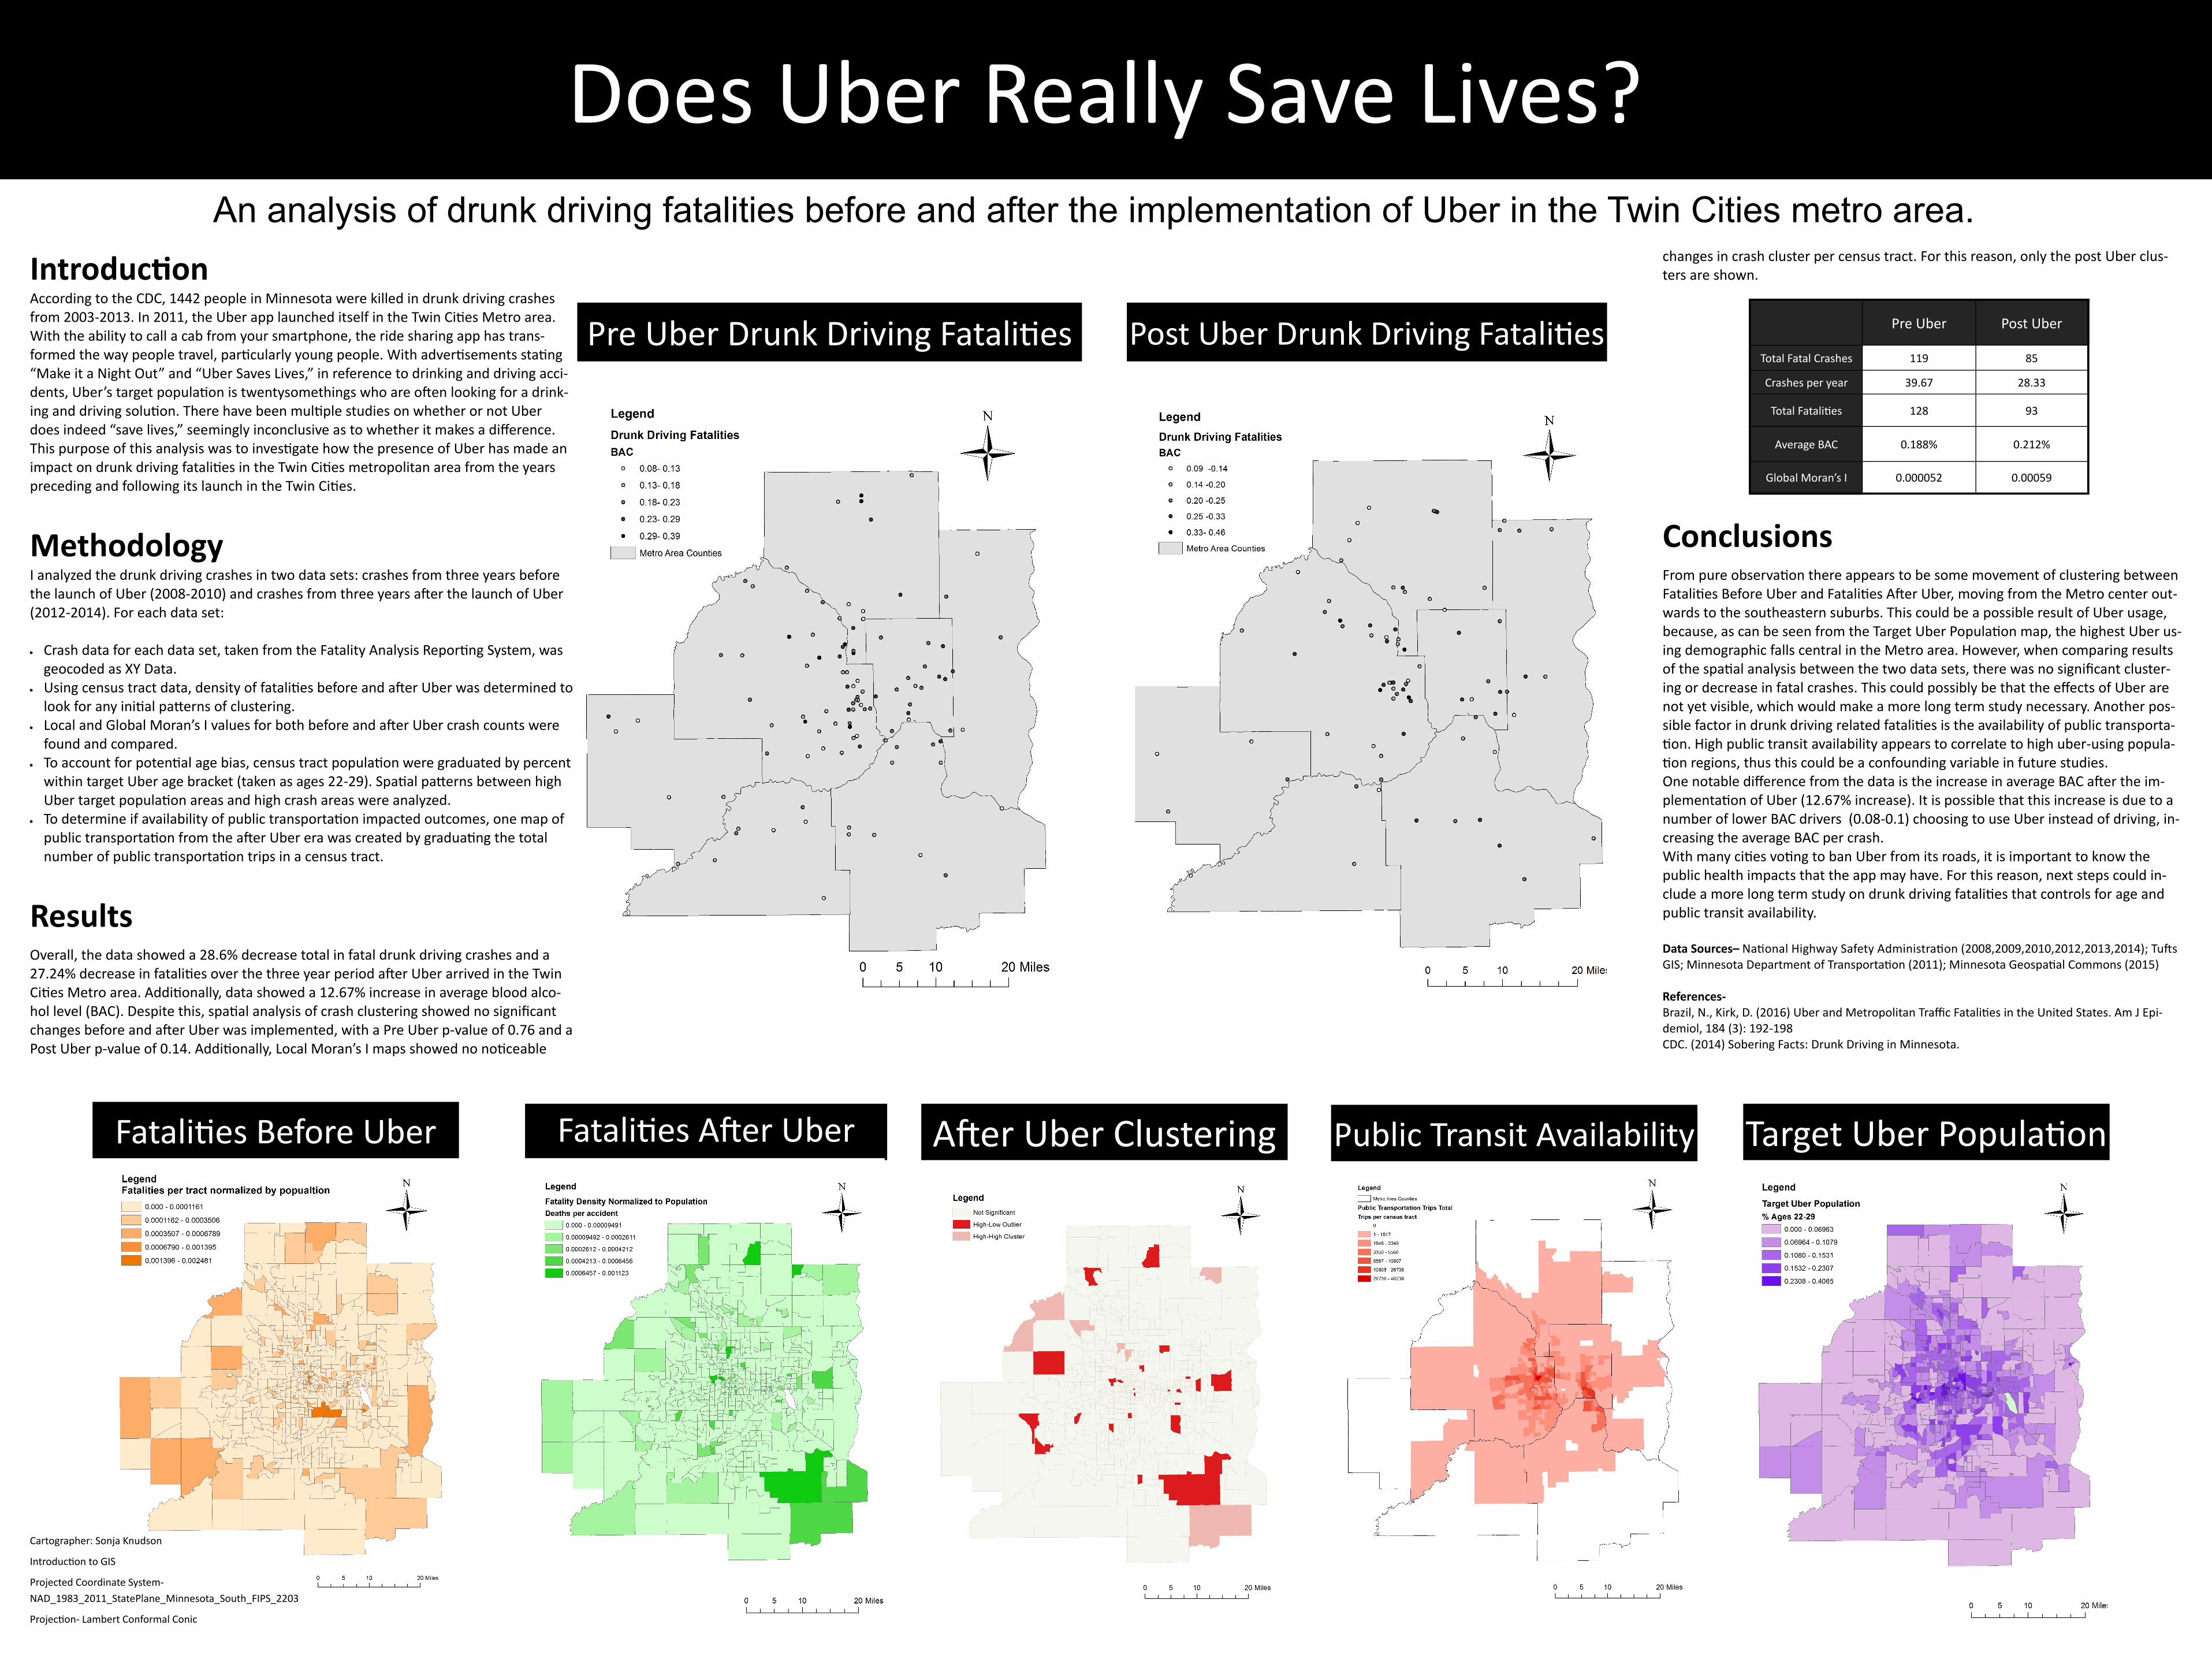
Does Uber Really Save Lives?
Introduction
According to the CDC, 1442 people in Minnesota were killed in drunk driving crashes from 2003-2013. In 2011, the Uber app launched itself in the Twin Cities Metro area. With the ability to call a cab from your smartphone, the ride sharing app has trans-formed the way people travel, particularly young people. With advertisements stating “Make it a Night Out” and “Uber Saves Lives,” in reference to drinking and driving acci-dents, Uber’s target population is twentysomethings who are often looking for a drink-ing and driving solution. There have been multiple studies on whether or not Uber does indeed “save lives,” seemingly inconclusive as to whether it makes a difference. This purpose of this analysis was to investigate how the presence of Uber has made an impact on drunk driving fatalities in the Twin Cities metropolitan area from the years preceding and following its launch in the Twin Cities.
Methodology
I analyzed the drunk driving crashes in two data sets: crashes from three years before the launch of Uber (2008-2010) and crashes from three years after the launch of Uber (2012-2014). For each data set: Crash data for each data set, taken from the Fatality Analysis Reporting System, was
geocoded as XY Data. Using census tract data, density of fatalities before and after Uber was determined to
look for any initial patterns of clustering. Local and Global Moran’s I values for both before and after Uber crash counts were
found and compared. To account for potential age bias, census tract population were graduated by percent
within target Uber age bracket (taken as ages 22-29). Spatial patterns between high Uber target population areas and high crash areas were analyzed.
To determine if availability of public transportation impacted outcomes, one map of public transportation from the after Uber era was created by graduating the total number of public transportation trips in a census tract.
Results
Overall, the data showed a 28.6% decrease total in fatal drunk driving crashes and a 27.24% decrease in fatalities over the three year period after Uber arrived in the Twin Cities Metro area. Additionally, data showed a 12.67% increase in average blood alco-hol level (BAC). Despite this, spatial analysis of crash clustering showed no significant changes before and after Uber was implemented, with a Pre Uber p-value of 0.76 and a Post Uber p-value of 0.14. Additionally, Local Moran’s I maps showed no noticeable
An analysis of drunk driving fatalities before and after the implementation of Uber in the Twin Cities metro area.
Post Uber Drunk Driving Fatalities Pre Uber Drunk Driving Fatalities
Fatalities Before Uber Fatalities After Uber After Uber Clustering Public Transit Availability
changes in crash cluster per census tract. For this reason, only the post Uber clus-ters are shown.
Conclusions
From pure observation there appears to be some movement of clustering between Fatalities Before Uber and Fatalities After Uber, moving from the Metro center out-wards to the southeastern suburbs. This could be a possible result of Uber usage, because, as can be seen from the Target Uber Population map, the highest Uber us-ing demographic falls central in the Metro area. However, when comparing results of the spatial analysis between the two data sets, there was no significant cluster-ing or decrease in fatal crashes. This could possibly be that the effects of Uber are not yet visible, which would make a more long term study necessary. Another pos-sible factor in drunk driving related fatalities is the availability of public transporta-tion. High public transit availability appears to correlate to high uber-using popula-tion regions, thus this could be a confounding variable in future studies. One notable difference from the data is the increase in average BAC after the im-plementation of Uber (12.67% increase). It is possible that this increase is due to a number of lower BAC drivers (0.08-0.1) choosing to use Uber instead of driving, in-creasing the average BAC per crash. With many cities voting to ban Uber from its roads, it is important to know the public health impacts that the app may have. For this reason, next steps could in-clude a more long term study on drunk driving fatalities that controls for age and public transit availability. Data Sources– National Highway Safety Administration (2008,2009,2010,2012,2013,2014); Tufts GIS; Minnesota Department of Transportation (2011); Minnesota Geospatial Commons (2015) References- Brazil, N., Kirk, D. (2016) Uber and Metropolitan Traffic Fatalities in the United States. Am J Epi-demiol, 184 (3): 192-198 CDC. (2014) Sobering Facts: Drunk Driving in Minnesota.
Target Uber Population
Pre Uber Post Uber
Total Fatal Crashes 119 85
Crashes per year 39.67 28.33
Total Fatalities 128 93
Average BAC 0.188% 0.212%
Global Moran’s I 0.000052 0.00059
Cartographer: Sonja Knudson
Introduction to GIS
Projected Coordinate System-
NAD_1983_2011_StatePlane_Minnesota_South_FIPS_2203
Projection- Lambert Conformal Conic