Embed Size (px)
Citation preview
DOES COLLEGE FOOTBALL SUCCESS IMPACT
ACADEMIC RANKINGS AND THE OVERALL ACADEMIC QUALITY
OF INCOMING STUDENTS FOR PRIVATE UNIVERSITIES? by
Robert Taylor Baker
Submitted in partial fulfillment of the
requirements for Departmental Honors in
the Department of Finance
Texas Christian University
Fort Worth, Texas
May 2, 2014
ii
DOES COLLEGE FOOTBALL SUCCESS IMPACT
ACADEMIC RANKINGS AND THE OVERALL ACADEMIC QUALITY
OF INCOMING STUDENTS FOR PRIVATE UNIVERSITIES?
Project Approved:
Joe Lipscomb, Ph.D.
Department of Finance
(Supervising Professor)
Mauricio Rodriguez, Ph.D.
Department of Finance
Christopher Del Conte
Director of Intercollegiate Athletics
iii
ABSTRACT
The purpose of this study was to gain a better understanding of the
relationship that exists between the football success of the seventeen NCAA
Division-‐1 FBS private universities and the US News and World Report college
rankings. This study shines more light on the constant debate about whether or not
football success significantly impacts the reputation of a university. This study
measures the relationship between college football success and the potential
indirect benefits a university experiences from this success. These indirect benefits
include things such as increases in applications and alumni donations. This study
measures the correlations between football success and academic reputation
through the use of regression analysis models that look at the change in US News
and World Report college rankings from 1998 to 2013.
The results from these statistical models demonstrated an undeniable
correlation between the football success of the seventeen NCAA Division-‐1 FBS
private universities and the US News and World Report college rankings. In other
words, the better a private university performs in football, the better its academic
reputation will become, assuming the university has continually invested in its
academics.
iv
TABLE OF CONTENTS
INTRODUCTION .......................................................................................................................................... 1 Premise and Rational ................................................................................................................. 2 RESEARCH QUESTION ............................................................................................................................ 8 LITERATURE REVIEW .......................................................................................................................... 11 Sociology of Sports ................................................................................................................... 11
Flutie Factor ................................................................................................................................ 12 Alumni Giving ............................................................................................................................. 12 Academic Implications ........................................................................................................... 14
METHODS AND RESULTS .................................................................................................................... 17 Test I ............................................................................................................................................... 20 Test II ............................................................................................................................................. 22 Test III ........................................................................................................................................... 23 DISCUSSION & IMPLICATIONS .......................................................................................................... 24 CONCLUSION ............................................................................................................................................. 25 REFERENCES ............................................................................................................................................. 27 APPENDIX A ............................................................................................................................................... 32 APPENDIX B ............................................................................................................................................... 43
1
INTRODUCTION
The relationship between collegiate athletics and higher education has been
a topic of heated debate for quite some time. As the salaries of college coaches
continue to increase and more and more money is poured into collegiate athletics,
one must begin to question the rationale behind this ever-‐increasing trend. In fact,
in recent years, congress has even begun to question the role of the National
Collegiate Athletic Association (NCAA) in higher education. In 2006, Californian
Representative, Bill Thomas asked the NCAA president the following question, “How
does playing major college football or men's basketball in a highly commercialized,
profit-‐seeking, entertainment environment further the educational purpose of your
member institutions” (Thomas, 2006)? Some people would answer this question by
saying that collegiate athletics do not further the academic objectives of higher
education. These people would argue that the money spent on athletic programs
should be spent solely for the purpose of improving a school’s academic mission.
However, others would argue that college athletics act more as a complement to a
school’s academic mission rather than a substitute for it. They believe that
universities receive a variety of indirect benefits from college athletics such as
increased applications, more academically competitive incoming classes, increased
student body unity, and increased alumni donations.
According Christopher Del Conte, athletic director of Texas Christian
University, “I believe athletics is the front porch for the university. No doubt about it.
It puts us in a position to sell our university coast to coast. As our program has risen
in football, the amount of applicants has risen from 4000 or 5000 six to seven years
2
ago to well over 20,000 applicants per year now. The popularity of TCU to share the
vision of what the university is, athletics has helped sell that vision.” Del Conte went
onto compare TCU’s recent success to what happened to Duke University in the
early 80s, “I refer to this as the Duke effect. Duke University was a great regional
university in the early 80s. Because of the basketball program, they became a national
university and their brand has been branded coast to coast. You could say the same for
TCU. We’d been a great regional university, but because of our [athletic] success, we’ve
become a national university (Del Conte, 2012). This study explores the theory expressed
by Del Conte in greater detail by examining the impact athletic success has on the many
variables that make up the annual college rankings published by the U.S. News and
World Report.
Premise and Rationale
The basic assumption throughout this study is that a university is always
striving to maximize the overall student quality for its future incoming classes, as
well as increase the amount of donations the university receives. The idea is that
higher achieving students and increased donations naturally will lead to an overall
betterment of the university. As the overall academic quality of students continues
to improve and the increase in donations allows for things such as the hiring of
better professors, increased resources for academic programs, and upgrades to
academic facilities, the overall reputation of a university is naturally expected
to increase.
When it comes to admissions, the more applications a university receives, the
more selective the admissions department is able to be during the acceptance
3
process. In theory, assuming a university’s acceptance numbers remain relatively
constant, an unusual increase in the amount of applications a university receives
allows the insinuation to be much more selective by accepting students with
superior academic credentials. This decrease in acceptance rate and the superior
students that bring with them increased SAT scores would help improve the overall
ranking of the university. It is also assumed that this increased university ranking
would lead to even more applications and student interest in the future. Institutions
are also always striving to find ways to increase alumni donations. In the case of
private universities that rely solely on tuition and private donations for funding, an
increase in alumni donations is especially beneficial to the university.
Next, it is important to note that all of the previously mentioned measurables
such as applications, acceptance rate, SAT scores, and alumni donations play a role
in determining the University Rankings produced by the US News and World Report.
Because of these things, the proposition of this study is that collegiate athletic
success, specifically the football success of the seventeen NCAA Division-‐1 FBS
private universities, positively influences the variables that make up the US News
and World Report rankings. In essence, having a successful football team results in
large amounts of positive coverage through many different channels of media. This
media coverage acts as fantastic advertising for the university, which in theory,
leads to improvements such as an increase in applications, higher-‐quality students,
and increased amounts of alumni donations.
As previously mentioned, a school’s athletic program, especially its football
and men’s basketball team, is often considered the “front porch” of the university.
4
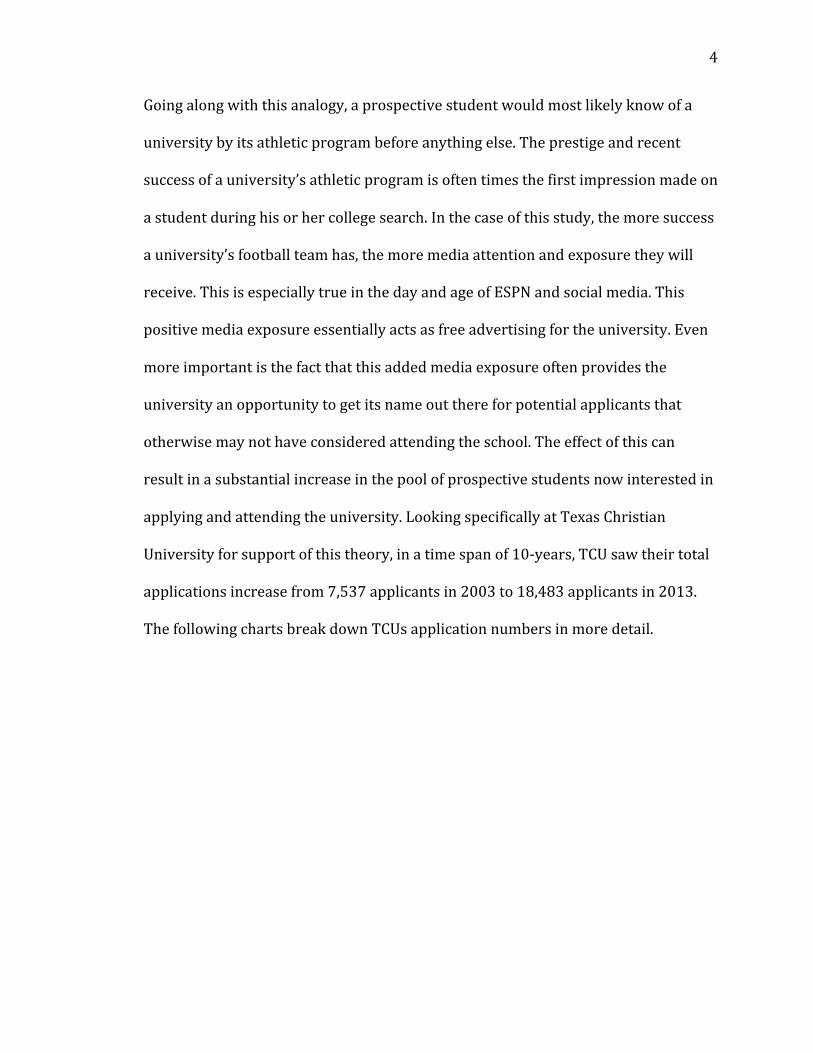
Going along with this analogy, a prospective student would most likely know of a
university by its athletic program before anything else. The prestige and recent
success of a university’s athletic program is often times the first impression made on
a student during his or her college search. In the case of this study, the more success
a university’s football team has, the more media attention and exposure they will
receive. This is especially true in the day and age of ESPN and social media. This
positive media exposure essentially acts as free advertising for the university. Even
more important is the fact that this added media exposure often provides the
university an opportunity to get its name out there for potential applicants that
otherwise may not have considered attending the school. The effect of this can
result in a substantial increase in the pool of prospective students now interested in
applying and attending the university. Looking specifically at Texas Christian
University for support of this theory, in a time span of 10-‐years, TCU saw their total
applications increase from 7,537 applicants in 2003 to 18,483 applicants in 2013.
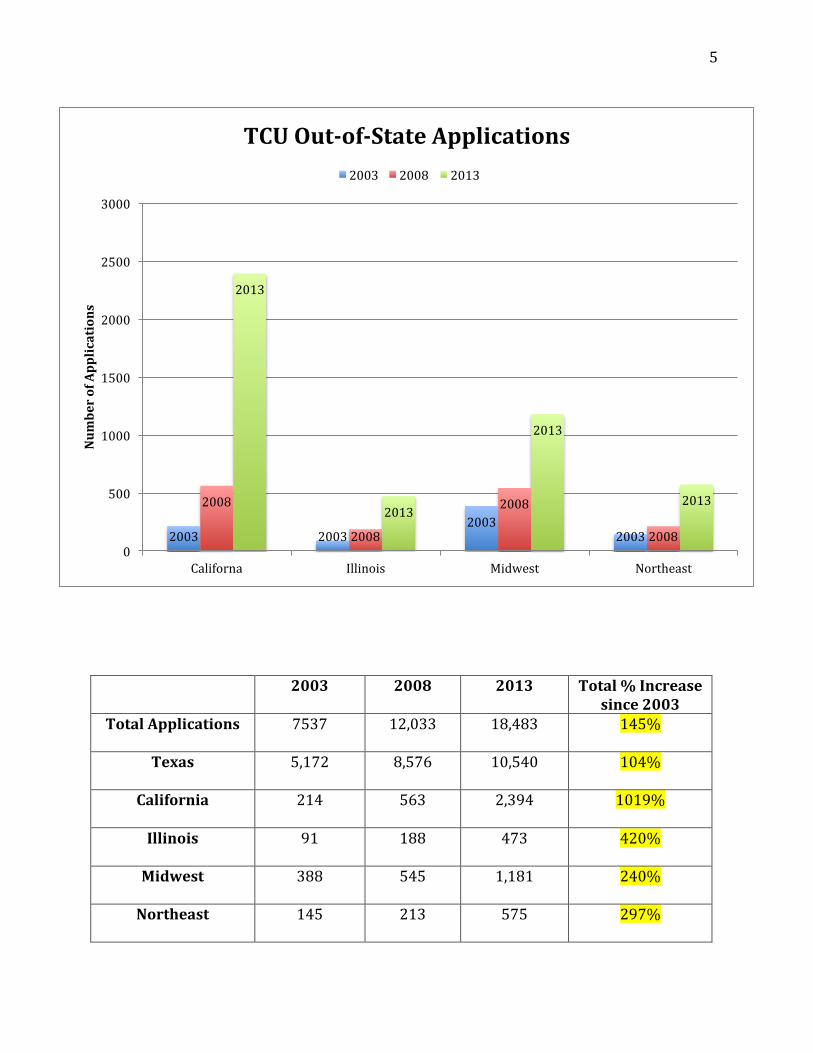
The following charts break down TCUs application numbers in more detail.
5
2003 2008 2013 Total % Increase since 2003
Total Applications 7537 12,033 18,483 145%
Texas 5,172 8,576 10,540 104%
California 214 563 2,394 1019%
Illinois 91 188 473 420%
Midwest 388 545 1,181 240%
Northeast 145 213 575 297%
2003 2003 2003
2003
2008
2008
2008
2008
2013
2013
2013
2013
0
500
1000
1500
2000
2500
3000
Californa Illinois Midwest Northeast
Num
ber of Applications
TCU Out-‐of-‐State Applications 2003 2008 2013
6
These numbers are hard to ignore, but it would be naïve to claim that this
enormous increase in applications was solely because of TCU’s football During this
10-‐year span, TCU’s football team experienced 8 seasons of at least 10 wins, as well
as playing in two BCS bowl games, one of which was TCU’s Rose Bowl Victory in
2011. Even more astounding was the amount of growth TCU experienced from out-‐
of-‐state applications. In 2008, TCU received 563 applications from Californian high
school students. Five years later, after winning the Rose Bowl, TCU received 2,394
applications from California, a 325% increase. The increase in out-‐of-‐state
applications did not stop in California. TCU saw a surge in applications from all
regions of the country with there being a 152% increase in applications from
students in Illinois, a 117% increase from students in the Midwest, and a 170%
increase from students in the Northeast since 2008. Along with this, there has also
been a 23% increase in applications from students within the state of Texas over the
past 5 years.
As stated by TCU athletic director Christopher Del Conte, “[Academics and
athletics] go hand in hand. The tail does not wag the dog… I don’t think we just
invest heavily in athletics; we invest heavily in the overall university. If you’re going
to be great in something, you must have the very best facilities to attract the best
students in the country. You can’t use 1950 Bunsen burners if you’re going to be
great in Chemistry. So, it’s the same philosophy. It has to be a core mission of the
university” (Del Conte, 2012). In other words, athletic success alone cannot be the
sole driver. A university must be investing everywhere if it wants to attract the best
students, with athletic success simply acting as the thing that sparks a prospective
7
student’s initial interest. It is also important to note that a successful athletic
program may represent a potential social and cultural atmosphere that a
prospective student desires from his or her college experience. This is because
successful athletic programs are often located at universities that provide the
traditional college activities that many students desire to experience such as Greek
Life, Homecoming, and, of course, the ability to experience big-‐time college sporting
events (Toma, 2003). In his book, Football U: Spectator Sports in the Life of the
American University, Doug Toma suggests that students will usually develop a strong
connection with their university based on their school’s athletic teams, often
becoming donating alumni in the future. Going along with this approach, a
successful athletic program can carry much more weight than one would
initially expect.
The goal of this study is to determine whether or not this notion that football
success benefits a university can be statically supported. The question that arises is
how does one accurately measure athletic success? This study will look specifically at
the football success of the seventeen NCAA Division-‐1 FBS private universities by
taking into account things such as the amount of wins per season, their final AP Poll
ranking, and whether or not they played in a BCS bowl. It is assumed that private
universities are affected differently than large public universities when it comes to
football success, which is why this study is specifically focusing in on private
universities only. The rationale behind this assumption is that large public
universities are drastically less sensitive to the effects of football success. This is
because many public universities already act as their state’s flagship university and
8
naturally attract large amounts of applications. Another assumption is that large
public universities with successful athletic programs are a dime a dozen in the
United States. Very rarely would an out-‐of-‐state student from California be drawn to
look at a large rural university such as Nebraska, solely because they have a good
football team. There are clearly plenty of other public universities with good football
teams that this theoretical student would likely consider first. Private universities
that offer big-‐time college football, however, are much more rare. Pairing this with
the fact that private universities often offer a much more personalized college
experience helps explain why this study assumes that private universities are much
more affected by football success.
RESEARCH QUESTION
This study will attempt to answer the following question:
Does statistical data support the theory that there is a significant correlation
between the football success of NCAA Division-‐1 FBS private universities and
the U.S. News and World Report College Rankings?
Before proceeding it is essential to explain the reasoning behind using the
college rankings from the U.S. News and World Report. The U.S. News and World
Report, which will be referred to as the “USNWR” from this point forward, has been
producing college rankings for over 25 years and has really established themselves
as the premiere college ranking system. According to the USNWR website, the
rankings are created through the use of widely accepted indicators of university
excellence. The formula to calculate these rankings uses quantitative measures that
9
education experts have proposed as reliable indicators of academic quality. These
seven weighted measures are: alumni giving rate (5 percent), Graduation rate (7.5
percent), financial resources (10 percent), student selectivity, which includes SAT
score percentiles and the percent of incoming students that graduate from the Top
10% of their high school. (12.5 percent), faculty resources (20 percent), retention
rate (22.5 percent), and an undergraduate academic reputation score, which is a
peer assessment survey that allows top academics-‐ presidents, provosts, and deans
of admissions-‐ to account for intangibles at peer institutions such as faculty
dedication to teach (22.5 percent) (USNWR, 2014).
This study focuses in on the overall college ranking, the SAT score
percentiles, the amount of freshmen in the top 10% of their high school class,
alumni giving percentage, and the academic reputation score. These measurables
are believed to be the most influenced by an increase in the overall quality of
incoming students. The most closely looked at and used measure throughout this
study is the academic reputation score. Referring back to the analogy that athletics
acts as a university’s “front porch,” the academic reputation score acts a great
measure for how people view a university overall. If a correlation can be found that
supports the idea that football success helps influence a university’s academic
reputation score, then the results of this study would provide a great amount of
insight into the relationship between athletics and academia. The indirect benefits
of athletic success that may very likely influence a university’s academic reputation
score could include an increase in applications, mean SAT scores, and alumni
donations. As a university’s academic reputation score increases, its overall
10
academic prestige increases as well. With academic prestige comes benefits such as
a higher research-‐classification, additional giving to the university, and, naturally, an
opportunity to move up in the college-‐rankings publications. According to sports
sociologist James Frey, there are three reasons why a university’s president would
support athletics:
1. Presidents believe having a winning program helps attract students and
increases financial contributions.
2. Presidents believe that football is the only thing in higher education powerful
enough to unite a university’s entire community together, including its
diverse student body, faculty, and staff.
3. Presidents recognize and acknowledge the kind of national exposure that
athletic success brings to their university.
All things considered, a study that could statistically prove a correlation
between the college football success of NCAA Division-‐1 FBS private universities
and the U.S. News and World Report College Rankings would carry great
implications for all parties involved in higher education, including athletic directors,
admission departments, university presidents, and boards of trustees. If a
correlation is found, the inference can be made that the relationship that exists
between football success and USNWR college rankings is because of the previously
mentioned measurables that make up the USNWR college rankings such as,
academic reputation, acceptance rate, SAT scores, and alumni giving. These finding
11
would be important in beginning to understand how college football in today’s day
and age indirectly affects the rest of its university.
LITERATURE REVIEW
Sociology of Sports
The overlying basis of this study looks at how sports influence the opinions
of others. There are many examples of published literature that look at the
sociological effects of sports. For instance, in a study published by Eric Dunning,
college sports are considered social establishments that can unite a large and
diverse community that otherwise would be disconnected (Dunning, 1999). The
community and unification that one experiences through the spectatorship of sports
is almost religion-‐like. Dunning goes on to elaborate on this idea by saying,
“…identification with a sports team can provide people with an important identity
prop, a source of ‘we-‐feelings’ and a sense of belonging (p. 32). Other published
articles also support the idea that people are strongly influenced by sports. The
article, “Motivating College Athletics” states:
“It seems reasonable that, all things being equal, students prefer their schools
to win rather than lose, and yet it may be that the “consumption capital”
provided by attendance at games and creation of lifetime memories is the
biggest attraction of major athletics for students. Many students may see
athletics as an essential part of the college experience” (Osborne, 2004).”
By examining the sociology of sports, it is clear that there is a high probability that
12
prospective students and alumni are strongly influenced by the effects of college
athletics. This study expands on this logic and tests to see if football success
influences the academic reputation of a university through the use of USNWR
college rankings.
Flutie Factor
It all began during Thanksgiving weekend of 1984. 10th ranked Boston
College was playing the defending national champions, 12th ranked University of
Miami on the new nationally broadcasted cable television network, ESPN. Boston
College was losing with only a few seconds left. On the final play, as the clock
expired, quarterback Doug Flutie threw the ball 65 yards into the end zone where it
was caught by a Boston College wide receiver, giving BC a 47-‐45 victory. Flutie later
went on to win that year’s Heisman Trophy, which is awarded annually to college
football’s best player. Boston College quickly became the talk of the sports country
(Oslin, 2004). The following academic school year, Boston College had a 25 percent
increase in applications (Sperber, 2000). This event was deemed the “Flutie Factor.
This has become the go-‐to example of how athletic success can profoundly benefit a
university.
Alumni Giving
Studies that explore the impact college athletics have on a university first
started being published over 30 years ago. Some of the earliest studies looked into
the relationship between collegiate football winning percentage and its effect on
13
alumni donations only to conclude that very little correlation existed at all
(Sigelman and Carter, 1979; Brooker and Klastorin, 1981). Another study shortly
followed attempting to look at more football variables than simply winning
percentage. They, however, came to same conclusion that there was no correlation
between athletic success and alumni donations (Sigelman and Bookheimer, 1983).
More recent studies tend to be more successful at finding positive trends
between the relationship of football success and donations to the school. In 1990, an
article was published that studied Clemson University over a four-‐year period
looking at alumni donations. This study found there was, in fact, a strong correlation
between winning percentage and alumni donations. Their study estimated that for
every 10 percent increase in contributions towards athletics, there was a 5 percent
increase in contributions in academics (McCormick and Tinsley, 1990). The obvious
downside to this study was that it only covered a very short period of time.
According to another study, bowl appearances were found to increase alumni giving
at both public and private universities. (Baade and Sundburg, 1996). The authors
found that football postseason success was much more effective than basketball
postseason success. They attributed this to the different postseason structures of
the two sports. In basketball, it is not common for a team’s postseason basketball
experience to abruptly end after the first weekend, leading to very short-‐lived
excitement. Football, on the other hand, has a postseason that creates multiple
weeks of buildup and anticipation as fans count down the days between the end of
the season and the start of bowl games. Some of the studies finding positive
correlations between athletic success and alumni donations got a little creative
14
when trying to define what it meant to have athletic success, using variables such as
television coverage (Chressanthis & Grimes, 1994), postseason participation (Baade
& Sundberg, 1996), and home attendance (McEvoy, 2005). There is essentially no
literature that looks closely into how athletic success should be measured. With
different studies defining “athletic success” differently, the established conclusions
become slightly weakened. This study will look at multiple measures of athletic
success in hopes of coming to a more solidified conclusion. While proof seemed to
be lacking during the early years of these studies, there seems to be a pretty
constant trend as of late that shows that there is, in fact, a correlation between
athletic success and alumni donations. If this is true, then there is certainly potential
that USNWR rankings can be influenced too.
Academic Implications
There have been several studies throughout the years that delve into the
relationship between the athletic performance of universities and its impact on the
number of applications they receive (Allen & Peters,1982; Chressanthis & Grimes,
1993; Chu, 1989; Frank, 2004; Murphy & Trandel, 1994; Toma & Cross, 1998;
Zimbalist, 1999). There are also several studies that specifically focus on how SAT
scores of incoming students are affected by athletic success. (Bremmer & Kesserling,
1993; McCormick & Tinsley, 1987; Mixon, 1995; Tucker & Amato, 1993). Out of all
the studies, two are most referred to throughout literature:
• “Athletics versus academics: Evidence from SAT scores”(McCormick & Tinsley, 1987)
• “The relation between a university's football record and the size of its applicant pool” (Murphy & Trandel, 1994).
15
McCormick and Tinsley released the first study in 1987 that analyzed the
relationship between athletic success and SAT scores. Since then, many other
researchers have referenced them and used their methodology in similar studies.
Their study collected data between the years 1971-‐1984 on about 150 schools, with
63 of them being identified as having “big-‐time” athletic programs. Using freshman
average SAT score as their dependent variable, they used a multiple regression
analysis model to determine whether a series of different independent variables had
any influence on SAT scores. Included in their independent variables were things
such as: total enrollment, type of school (public or private), student/faculty ratio,
total enrollment, percent of doctorates per faculty member, tuition, university age,
professor salaries, endowment per student, and library volumes. McCormick and
Tinsley came up with a calculation that stated that colleges with a big-‐time athletic
program automatically had a 3 percent advantage in SAT score, making the claim
that “other things the same, a school that participates in major college athletics has a
better undergraduate student body than one that does not” (pg. 1106). While their
hypothesis was proven to be statistically significant, it is essentially impossible to
account for all the possible factors that could affect the SAT scores for an incoming
freshman class.
The study conducted my Murphy and Trandel in 1994 focused on the
relationship between athletic success and application numbers. The athletic
programs of 46 different universities were analyzed over a ten-‐year period from
1978-‐1987 using the Peterson’s Guide to Colleges and Universities as their primary
16
data source. They performed a multiple linear regression analysis using
independent variables that included: tuition rate, average professor salary, and high
school graduates available within the state. Total applications acted as their
dependent variable. At the end of their study, Murphy and Trandel came up with the
calculation that a school that experienced a 25 percent increase in football winning
percentage would also experience 1.4 times more applications. Within the article,
Murphy and Tradel conclude that their study “provides some weak evidence that
consistent, long term football success raises applicant totals; however, our results
do not allow us to disentangle fully this possible effect from the effects of other
cross-‐sectional differences among universities” (p. 268).
As a whole, most studies focused on application numbers and SAT scores,
often times finding conflicting results, or results that lacked concrete support. While
there were many studies that found a positive correlation, the significance of these
relationships were typically relatively small. The many different approaches and
techniques used to conduct the different studies of the past make the complexity of
this situation very apparent. This present study hopes to achieve a more concrete
conclusion by narrowing down the subjects to only NCAA Division-‐1 FBS private
universities and looking at the data on a year-‐by-‐year basis, something that is rarely
done in past studies. Lastly, this study will use the USNWR rankings, a variable not
often used, as a core basis for analysis. The USNWR college rankings contain many
very relevant variables that will be interesting to explore.
17
METHODS & RESULTS
This section will explain the methods used to carry out the following study.
The particular methods used will help to discover the type of relationship that exists
between football success and a private university’s ranking in the U.S. News and
World Report. The study will first prove the correlation that exists between the
variables used to create the USNWR college rankings. Next, a multivariable
regression model will be run to determine how a multitude of football variables
affect the college rankings and academic reputation determined by the USNWR.
Lastly, single variable regression models will be run to determine how individual
football variables influence a school’s academic reputation.
Participants & Data
The sample for this study includes the seventeen private universities that
have a NCAA Division-‐1 FBS football team:
1. Baylor University 2. Boston College 3. Brigham Young University 4. Duke University 5. University of Miami, FL 6. Northwestern University 7. Notre Dame University 8. Rice University 9. Southern Methodist
University
10. Stanford University 11. Syracuse University 12. Texas Christian University 13. Tulane University 14. Tulsa University 15. University of Southern
California 16. Vanderbilt University 17. Wake Forest University
18
The data was collected from the U.S. News and World Report college rankings
from 1998-‐2013. Data used in this study that was collected for every university
includes:
• Overall university ranking given by USNWR
• Academic reputation
• Percent of freshman in the Top 10% of high school class
• SAT 25th and 75th percentile
• Acceptance rate
• Alumni giving percentage
The data used to measure football success for every university includes:
• Wins per year
• Top 25 finishes
• Final AP poll
• Bowl game
• BCS bowl game
These data inputs will be analyzed to determine if a correlation between football
success and the USNWR rankings can be proven to exist.
19
Regression Analysis Explained
Excel computes a multitude of outputs when running a regression analysis.
This section will briefly explain the four most relevant parts of a Regression Output
that are looked at throughout this study. The first output number that is looked at is
R-‐Square, which measures the overall regression’s accuracy. In other words, R-‐
Square explains how much of the dependent variable’s variance is supported by the
explanatory variable’s variance. Variance is used by statisticians to see how
individual numbers compare to each other within a set of data. A good R-‐Square is
typically at least 0.6 (60%) or 0.7 (70%). The next output number looked at is
known as Significance of F. This explains the probability that a model’s output was
not by chance. In order to confirm the validity of a regression output, one typically
wants a very small Significance of F (usually below 5%). The third important part of
a Regression Output is the P-‐value of each coefficient and the Y-‐Intercept. Each P-‐
value represents the likelihood that the results are real and did not happen by
chance. The lower the P-‐value, the more likely that the coefficient or the Y-‐Intercept
is valid. For example, if the P-‐value for a regression coefficient is 0.018, then there is
only a 1.8% probability that the result occurred by chance. In this study, a P-‐value
below 10% is considered ideal. The last part looked at is referred to as the t-‐statistic.
A relatively high t-‐statistic indicates a strong relationship between variables.
Therefore, a model with high t-‐statistics as well as low p-‐values indicates a
statistically significant relationship between the dependent variable and the
explanatory variables.
20
SUMMARY OUTPUT
Regression StatisticsMultiple R 0.854667043R Square 0.730455755Adjusted R Square 0.726417639Standard Error 0.066029137Observations 272
ANOVAdf SS MS F Significance F
Regression 4 3.154614971 0.788653743 180.890234 0.00000%Residual 267 1.164079147 0.004359847Total 271 4.318694118
Coefficients Standard Error t Stat P-‐value Lower 95%Intercept -‐0.551493829 0.173601857 -‐3.176773795 0.166417% -‐0.89329655SAT 75 Percentile 0.000920535 0.000136317 6.752888902 0.000000% 0.000652142
Percent of Freshman in Top 10% of HS Class -‐0.043345613 0.060845336 -‐0.712390076 47.68% -‐0.163143303
Acceptance Rate-‐0.088241543 0.040642232 -‐2.171178547 3.080% -‐0.168261571
Alumni Giving Rate (Percentage) 0.203313999 0.059432706 3.420910999 0.07219% 0.086297619
Design
The study will be broken into three main parts in order to come to an overall
conclusion. The first test will simply look at the relationship between academic
reputation and the independent academic variables. Once this is determined, a more
extensive multivariable regression test will be run to determine the relationship
between academic reputation and football success on a year-‐by-‐year basis. Lastly,
multiple single variable regression tests will be run to determine how individual
football variables influence a school’s academic reputation. These variables will use
three separate 5-‐year time ranges to measure how relationships are affected when
looking at changes over time, rather than year-‐by-‐year.
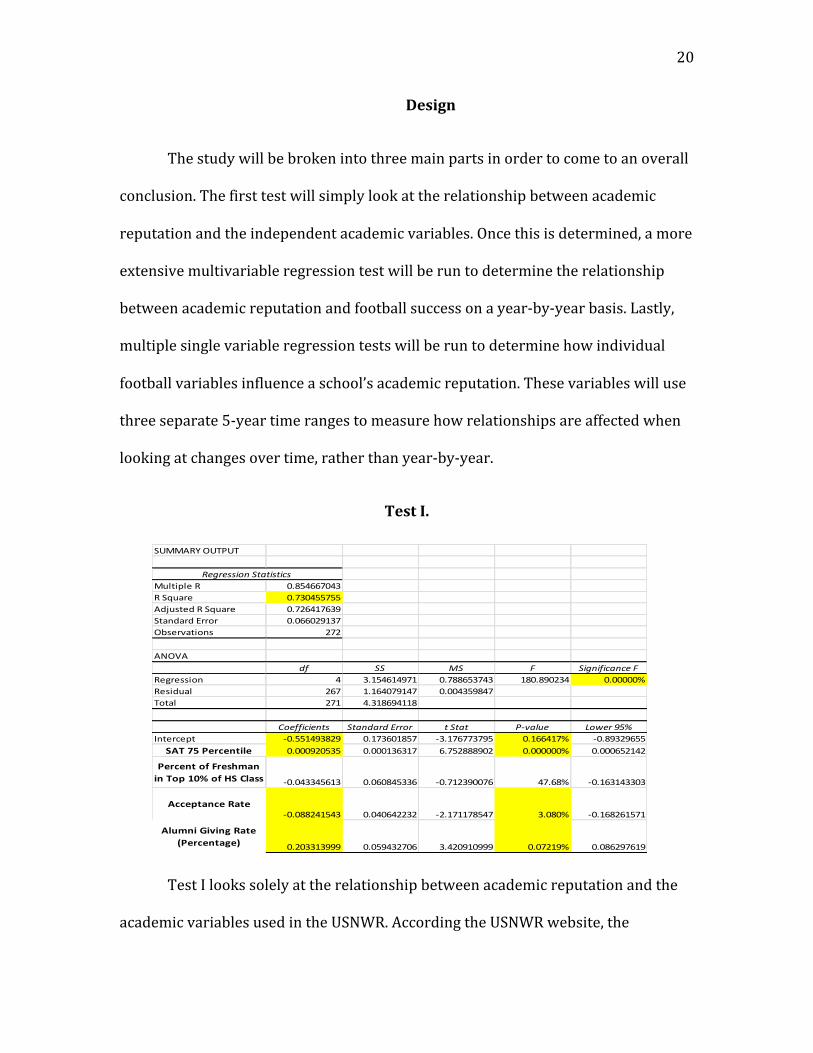
Test I.
Test I looks solely at the relationship between academic reputation and the
academic variables used in the USNWR. According the USNWR website, the
21
academic reputation score makes up 22.5% of the overall college ranking and is
determined through a peer assessment survey that allows top academics-‐
presidents, provosts, and deans of admissions-‐ to account for intangibles at peer
institutions such as faculty dedication to teach. This study assumes that academic
reputation would be a good representative of how college football acts as the “front
porch” of a university. Before proceeding with any regression models that looked at
the relationship between football and academic reputation, it is important to first
determine the relationship academic reputation has with other academic variables.
The regression analysis above shows that there is, in fact, a clear relationship
between the two. As academic reputation increases, SAT scores and Alumni giving
move up and acceptance rate goes down, just as one would expect. The only
surprise is that there does not seem to be much a correlation for the number of
students in the Top 10% of their high school class.
Another regression was run to see the relationship between academic
reputation and academic ranking. As expected there was an extremely strong
correlation between the two. As reputation moved up, so did overall ranking. Now
that is has been proven that Academic reputation and rankings are directly
correlated with the other academic variables (minus the top 10%), it is now
appropriate to move forward.
22
SUMMARY OUTPUT
Regression StatisticsMultiple R 0.866038306R Square 0.750022348Adjusted R Square 0.742418465Standard Error 0.064069147Observations 272
ANOVAdf SS MS F Significance F
Regression 8 3.239117101 0.404889638 98.63675595 0.0000000000%Residual 263 1.079577016 0.004104856Total 271 4.318694118
Coefficients Standard Error t Stat P-‐value Lower 95%Intercept -‐0.378152209 0.180674503 -‐2.093002623 0.037307117 -‐0.733904818Wins 0.005983424 0.001715481 3.487898137 0.000570469 -‐0.009361249
Final AP Poll 0.00764509 0.000697916 2.109541696 0.091285639 -‐0.001450665BCS 0.043081746 0.016132905 2.67042696 0.008047475 0.011315652
SAT 25 Percentile 0.0094239% 5.04676E-‐05 1.86731845 0.062969492 -‐5.13288E-‐06
SAT 75 Percentile 0.000730616 0.00014559 5.018321331 0.0000961% 0.000443946
Percent of Freshman in Top 10% of HS Class 0.019346731 0.060041331 -‐0.32222355 0.747539329 -‐0.137569611
Acceptance Rate-‐0.095829805 0.041058379 -‐2.333989011 0.020349839 -‐0.176674779
Alumni Giving Rate (Percentage) 0.204587799 0.058619777 3.490081497 0.000566034 0.089163994
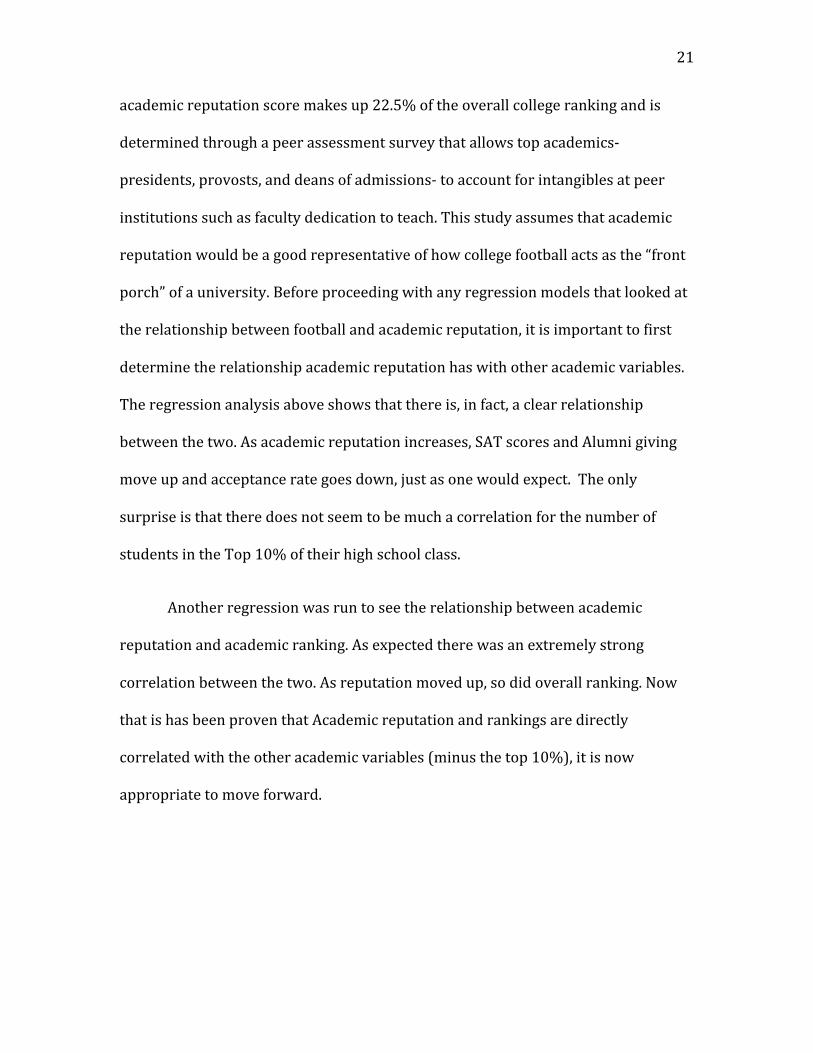
Test II.
Test II incorporates a more extensive multivariable regression test will to
determine the relationship between academic reputation and football success on a
year-‐by-‐year basis. The results showed that there is indeed a relatively strong
correlation between academic reputation and the football variables: wins, final AP
poll, and BCS bowl appearances. This is the first proof that begins to support the
idea that football success and academic reputation is related. The data used for this
test can be found in Appendix A.
23
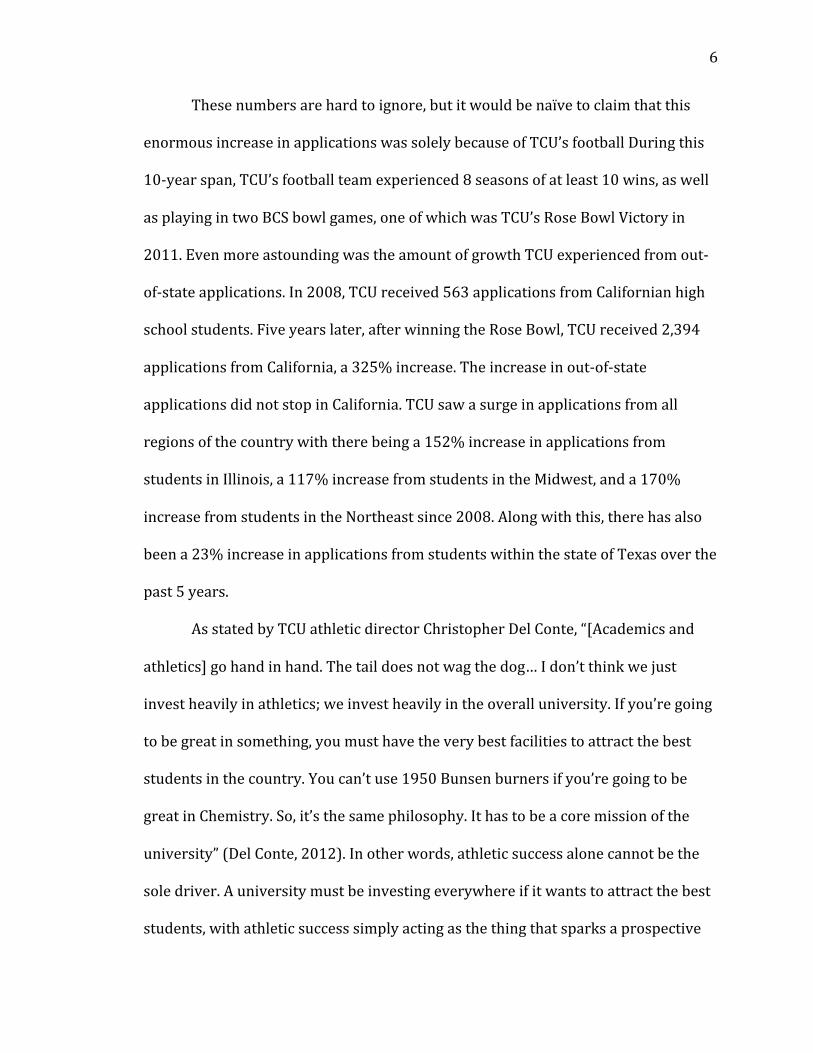
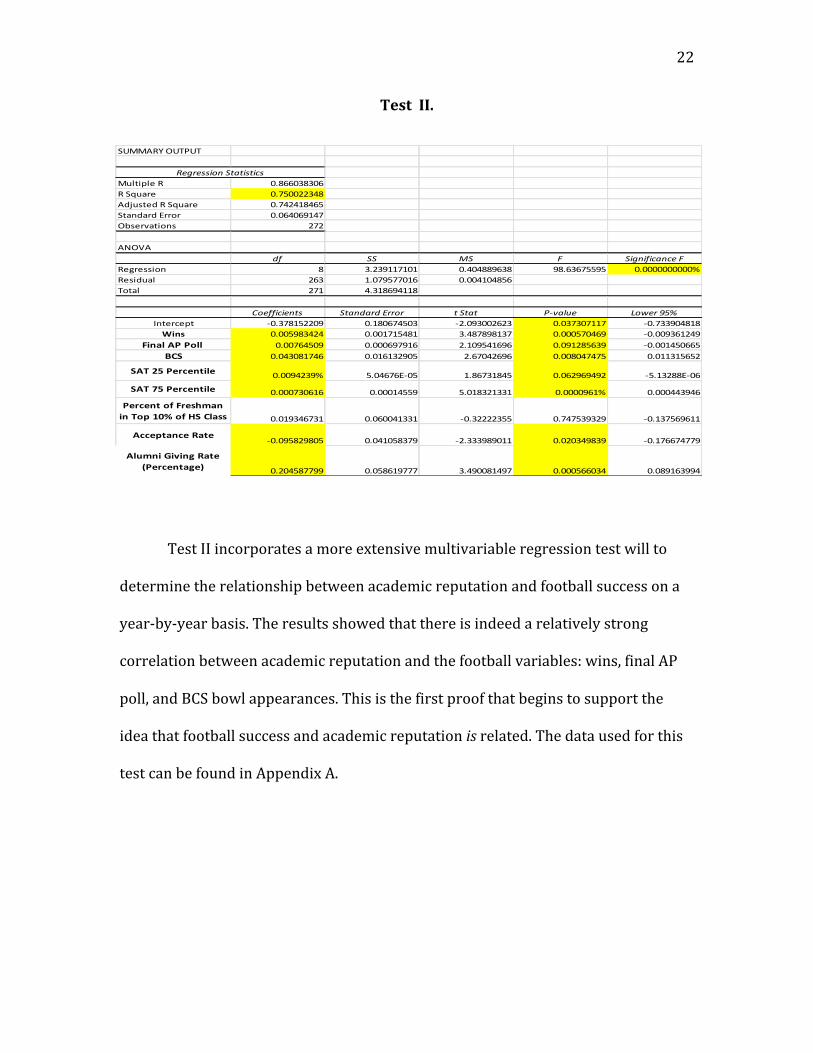
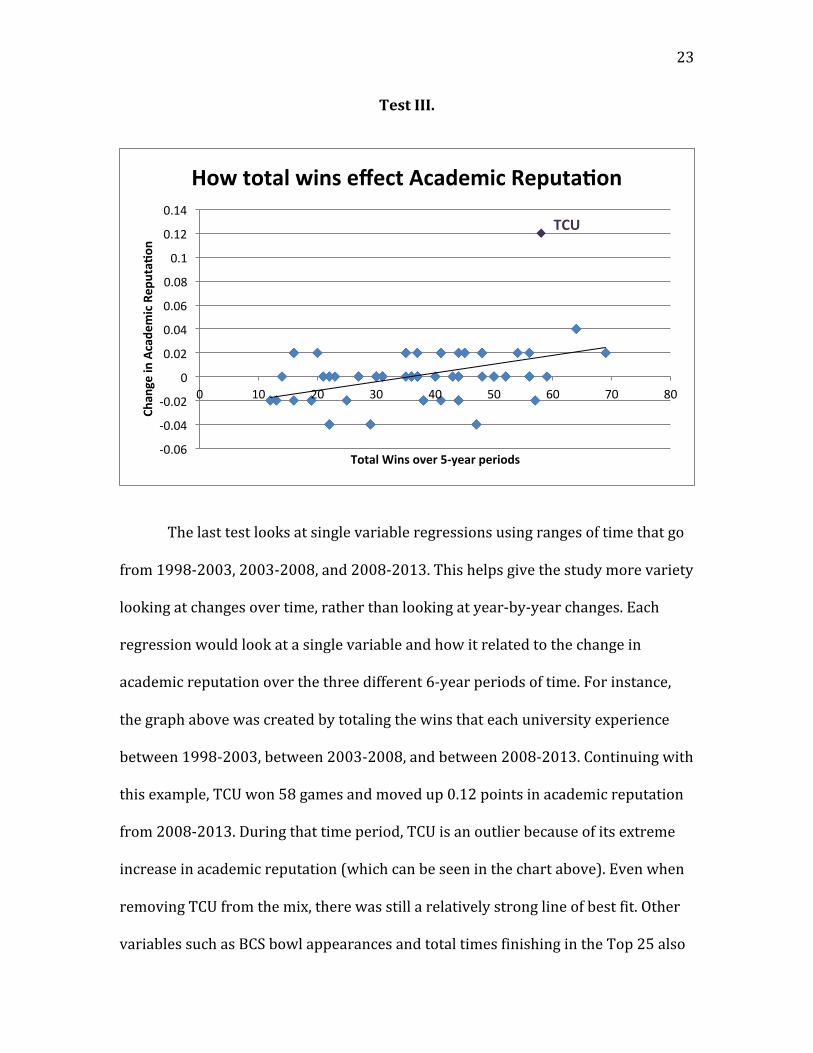
Test III.
The last test looks at single variable regressions using ranges of time that go
from 1998-‐2003, 2003-‐2008, and 2008-‐2013. This helps give the study more variety
looking at changes over time, rather than looking at year-‐by-‐year changes. Each
regression would look at a single variable and how it related to the change in
academic reputation over the three different 6-‐year periods of time. For instance,
the graph above was created by totaling the wins that each university experience
between 1998-‐2003, between 2003-‐2008, and between 2008-‐2013. Continuing with
this example, TCU won 58 games and moved up 0.12 points in academic reputation
from 2008-‐2013. During that time period, TCU is an outlier because of its extreme
increase in academic reputation (which can be seen in the chart above). Even when
removing TCU from the mix, there was still a relatively strong line of best fit. Other
variables such as BCS bowl appearances and total times finishing in the Top 25 also
-‐0.06
-‐0.04
-‐0.02
0
0.02
0.04
0.06
0.08
0.1
0.12
0.14
0 10 20 30 40 50 60 70 80
Chan
ge in Acade
mic Rep
uta1
on
Total Wins over 5-‐year periods
How total wins effect Academic Reputa1on
TCU
24
showed strong correlation to academic reputation. The data used for this test can
be found in Appendix B.
Discussion & Implications
After performing the regression models, there is statistically
significant support for the correlation between athletic success and US News and
World Report college rankings. This is relevant for many reasons. Whenever the
implications of college football success is discussed, there is often debate regarding
the potential indirect benefits caused by football success such as increased
applications, higher SAT scores for incoming classes, and increases in alumni
donations. As discussed previously, the US News and World Report college rankings
take all these indirect benefits into consideration when calculating their rankings.
Since there was a statistically significant correlation between the USNWR rankings
and college football success, it is fair to say that the college football success does in
fact provide indirect benefits to private universities.
One of the worries for this study was the lack of sensitivity found in the
USNWR rankings. This lack of sensitivity means that they do not change very easily,
so there was a concern that the impact college football success had would not be
significant enough to effect the rankings. The fact that rankings were affected speaks
to the significance that football success has on private universities. This study
obviously did not look at how public universities are affected by football success.
This study felt that private schools had the potential to be affected much more
significantly that public schools, which is why only private schools were looked at.
25
For future studies, it would be worth focusing on public universities and seeing if
college football success had the same impact on them as it does on private
universities.
While football success clearly benefits private universities, this study has no
ability to measure the economic efficiently of what it takes to have football success.
Running a football program is extremely expensive and requires very large financial
investments. Even with a significant investment in college football, success is far
from guaranteed. Something else this study failed to measure was the amount
institutions were investing in the academic side of a university. It is assumed that
universities willing to invest in sports are also simultaneously investing in
academics. As discussed earlier, “the tail does not wag the dog.” To attract the best
students, college football success is not enough by itself. Universities must be willing
to provide the best academic faculty and facilities as well.
Conclusion
The results of this study show that there is, in fact, a statistically significant
correlation between the football success of the seventeen NCAA Division-‐1 FBS
private universities and academic reputation within the USNWR college rankings.
This data from this study supports the theory that college football acts as the “front
porch” of a private university and truly influences how people view the school.
These indirect influences lead to more students applying to a particular school,
which allows the school to be more selective and increase their overall student
prestige. Football success also leads to other indirect benefits such as increased
26
Alumni Donations. All of these variables combine to increase the overall rankings
and reputations of a private university. As the popularity of college football
continues to rise, so does the amount of criticism regarding what college football
continues to become. While this study fails to prove the economic efficiently of
college football, there is no denying that college football success does indeed
provide shared value for a private university.
27
REFERENCES
Allen, B. H., & Peters, J. I. (1982). The influence of a winning basketball program
upon undergraduate student enrollment decisions at DePaul University. In
M.J. Etzel & J.F. Gaski (eds.), Applying marketing technology to spectator sports
(pp. 136-‐148). Notre Dame, IN: University of Notre Dame.
Baade, R. A., & Sundberg, J. (1996). Fourth down and gold to go? Assessing the link
between athletics and alumni giving. Social Science Quarterly, 77(2), 790-‐803.
Bremmer, D.S., & Kesselring, R.G. (1993). The advertising effect o f university
athletic success: a reappraisal of the evidence. The Quarterly Review of
Economics and Finance, 53(4), 409-‐421.
Brooker. G., & Klastorin, T. D. (1981). To the victor belong the spoils? College
athletics and alumni giving. Social Science Quarterly, 62, 744-‐750.
Brown, R. (2013). TCU Application Numbers through the Years. Fort Worth, TX: TCU
Admissions.
Chressanthis, G. A., & Grimes, P.W. (1993). Intercollegiate and first year student
enrollment demand. Sociology o f Sports Journal, 10(3), 286-‐300.
Chressanthis, G. A., & Grimes, P.W. (1994). Alumni contributions to academics: The
role of intercollegiate sports and NCAA sanctions. American Journal o f
Economics and Sociology, 52(1), 27-‐34.
Chu, D. (1989). The character o fAmerican Higher Education and intercollegiate sport.
Albany, NY: State University of New York Press.
Frank, R. H. (2004). Challenging the myth: A review o f the links among college
athletic success, student quality and donations. Retrieved March 1, 2005 from
http://www.knightfdn.org/athletics/reports/2004_frankreport/KCIA_Frank
_report _2004.pdf
28
Frey, J. H. (1982). Boosterism: Scarce resources and institutional control: The future
of American intercollegiate athletics. International Review o f Sport Sociology,
2(17), 53-‐70.
Del Conte, Christopher. Interview by Joel Cantalamessa. Be Bold CSU, Colorado State
University, 2012. Web. 28 Mar. 2014.
Dunning, E. (1999). Sports matters: Sociological studies o f sport,
violence and civilization. London: Routledge.
McCormick , R. E., & Tinsley, M. (1987). Athletics versus Academics? Evidence from
SAT Scores. Journal of Political Economy, 95(5), 1103-‐1116.
McCormick, R.E., & Tinsley, M. (1990). Athletics and academics: A model of
university contributions. In Goff, B.L. & Tollison, R.D., Sportometrics (pp. 193
204). College Station, TX: Texas A&M University Press.
McEvoy, C. (2005). Predicting fund raising revenues in NCAA division I-‐A
Intercollegiate Athletics. The Sports Journal, 5(1), 43-‐51.
Mixon, F. G. (1995). Athletics versus academics? Rejoining the evidence from SAT
scores. Education Economics, 3(3), 277-‐283.
Murphy, R. G., & Trandel, G. A. (1994). The relation between a university's football
record and the size of its applicant pool. Economics ofEducation Review, 13(3),
265-‐270.
Osbome, E. (2004). Motivating college athletics. In Fizel, J. & Fort, R. (eds.),
Economics o f College Sports (pp. 51-‐62). Westport, Ct. Praeger Publishers.
Oslin, R. (2004, Nov. 18). Remembering the miracle in Miami. The Boston College
Chronicle. Retrieved from http://www.bc.edu
29
Sigelman, L., & Bookheimer, S. (1983). Is it Wherther You Win or Lose? Monetary
Contributions to Big-‐Time College Athletic Programs. Social Science Quarterly
(University of Texas Press), 64(2), 347-‐359.
Sigelman, Lee, and Robert Carter. (1979). “Win One for the Giver? Alumni Giving and
Big-‐Time College Sports.” Social Science Quarterly 60(2): 284–294.
Sperber, M. (2000). Beer and circus: How big-‐time college sports is crippling undergraduate education. New York: Henry Holt and Company. Thomas, B. (2006, October 5). USATODAY.com - Congress' letter to the NCAA.
Retrieved February 12, 2014, from http://usatoday30.usatoday.com/ sports/college/2006-10-05-congress-ncaa-tax-letter_x.htm
Toma, D. J. (2003). Football U: Spectator sports in the life o f the American university.
Ann Arbor, MI: The University of Michigan Press.
Toma, J. D., & Cross, M. E. (1998). Intercollegiate athletics and student college
choice: Exploring the impact of championship seasons on undergraduate
applications. Research in Higher Education, 39(6), 633-‐661.
Tucker, I. B., & Amato, L. (1993). Does big-‐time success in football or basketball
affect SAT scores.Economics ofEducation Review, 72(June), 177-‐181.
U.S. News and World Report (2014). How U.S. News Calculated the 2014 Best
Colleges Rankings. Retrieved January 24th, 2014 from http://www.usnews.
com/education/best-‐colleges/articles/2013/09/09/how-‐us-‐news-‐
calculated-‐the-‐2014-‐best-‐colleges-‐rankings
U.S. News and World Report (1998). Best National Universities. U.S. News and
World Report, 125(8), 84.
U.S. News and World Report (1999). Best National Universities. U.S. News and
30
World Report, 127(8), 88
U.S. News and World Report (2000). Best National Universities. U.S. News and
World Report, 129(10), 140.
U.S. News and World Report (2001). Best National Universities. U.S. News and
World Report, 131(8), 114-‐117.
U.S. News and World Report (2002). Best National Universities. U.S. News and
World Report, 133(7), 124-‐127.
U.S. News and World Report (2003). Best National Universities. U.S. News and
World Report, 135(6), 94-‐96.
U.S. News and World Report (2004). Best National Universities. U.S. News and
World Report, 137(6), 94-‐96.
U.S. News and World Report (2005). Best National Universities. U.S. News and
World Report, 139(7), 80-‐82.
U.S. News and World Report (2006). Best National Universities. U.S. News and
World Report, 141(7), 111-‐112.
U.S. News and World Report (2007). Best National Universities. U.S. News and
World Report, 143(6), 114-‐117.
U.S. News and World Report (2008). Best National Universities. U.S. News and
World Report, 145(5), 76-‐79.
U.S. News and World Report (2009). Best National Universities. U.S. News and
World Report, 147(6), 112-‐115.
U.S. News and World Report (2010). Best National Universities. U.S. News and
World Report, 149(6), 110-‐113.
31
U.S. News and World Report (2011). Best National Universities. U.S. News and
World Report, 151(6), 88-‐91.
U.S. News and World Report (2012). Best National Universities. U.S. News and
World Report, 153(6), 98-‐101.
U.S. News and World Report (2013). Best National Universities. U.S. News and
World Report, 156(6), 77-‐79.
Zimbalist, A. (1999). Unpaid Professionals: Commercialism and conflict in big-‐time
college sports.. Princeton, NJ: Princeton University Press.