Embed Size (px)
Citation preview

á
DOHA WATER TABLE INVESTIGATION
This report is prepared for
ASCO (Qatar) Consulting Engineers
by
Institute of Hydrology
WALLINGFORD
OXON
U.K.
March 1982

•••••
•
••••
Water supply
hater Department, Doha
DOHA WATER TABLE INVESTIGATION
The enormous increase in the water supply to Doha over the past 5 years
has resulted in an aquifer being formed under the city. As the rate
of recharge to this aquifer exceeds the rate of natural drainage to the
sea and inland, the water table has risen at an alarndng rate, resulting
in flooded cable ducts and building basements and also in the water table
being at approximately ground level in low lying parts of town. This
groundwater body is also affecting the water quality of the blending
boreholes for water supply and fears exist that bacteriological contamina-
tion from septic tanks or sewerage soakaways may also result.
The purpose of this study is to investigate the regional extent and
magnitude of the rise in water table, to identify the causes for the
rise and advise what measures may be taken to renedy the situation.
A similar problem is beginning to occur at U iuu Said hhere groundwater
levels have risen to the land surface in certain areas. Unlike Doha
there is virtually no data concerning the rate of rise, distribution
or cause of this problem and consequently a study to set up a data base
is necessary before a more detailed investigation can be formulated.
This report will therefore primarily consider Doha but recom endation
will be given for a study of Ulm Said.
The primary source of water' for Doha is from the desalination plants at
Abu Aboud and Ras Abu Fontas. Since 1977 hben the Ras Abu Fontas plant
began to augment supply a large part of Doha relied on a Tanker Service
for water supply. Since then a rapid growth in the commissioning of
primary and secondary distribution mains has occurred and at present these
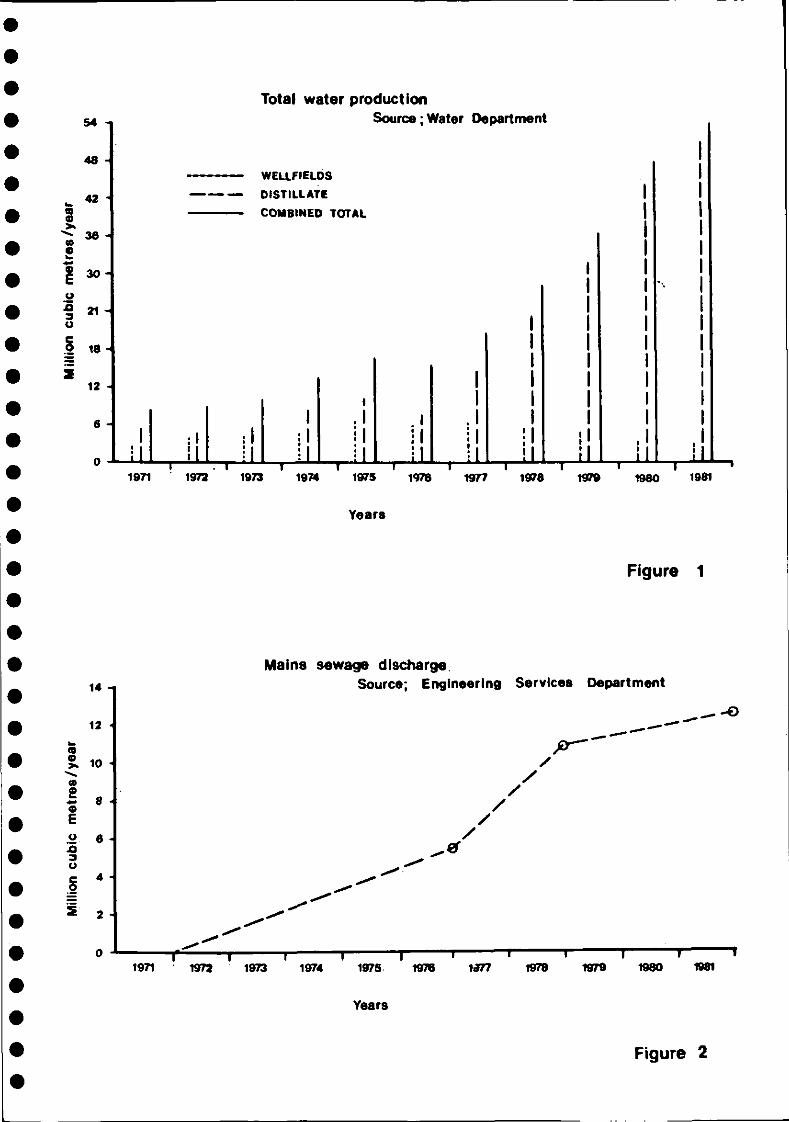
account for about 95 per cent of supply distribution. The total production
of water each year from the desalination plants and wellfield blending
water is shown in figure 1 and it can be seen that since 1977 the total
supply has increased from 21 million m 3 per year to 54 million m3 per year
in 1981 of which approximately 2 million m3 is used by Umm Said.
••
Years
1971 1972 1973 1974 1975 . 1975 1077 7978 1979 1980 1981
Years
Figure 1
Figure 2

Demand however still exceeds supply and further desalination units are
being installed which should bring the total supply up to about
• 88 million TO per year by 1983.
Water disposal
• The construction of the Doha mains sewerage system has developed steadily
since about 1972 and at present the treatment works handle about 12.8
million m3 per year. Properties that are not connected to the main sewer
system rely on septic tanks many of which are emptied by tanker and
• disposed of at the treatment works. Figure 2 shows how the outflow has
increased with tine from 1972 to the present day. Until recently this
effluent was discharged to the desert some 7 km south of Doha but at
present it is being piped some 30 km to the south west at Abu NTalah
• where it is lagooned. Approximately 10 per cent of the effluent is
treated further and returned to Doha for municipal irrigation. A limited
surface hater seh rage system, separate from the foul sewer network,
helps drain the central part of Doha. The location of this system
• is shown on figure 3 and it discharges via a screw pumping station at
•the Central Bank to sea.
•
The Study Area
• Doha, the capital of Qatar, has a population of about 190,000 people and
at present covers a land area of approximately 25 square kilometres.ID
Topographically the Doha area is of low relief with land elevations
• typically in the range 2-to.16 metres above sea level. Although natural
410 drainage channels did exist through the city, as shallow wadis, extensive
development has infilled the majority of these and urban runoff often gives
rise to flooding in the lower lying parts of town which once has part of
411 the wadi system. Natural drainage is generally seahard within the
• 'C' ring road.
411
41
40
••
410

41
41
41The climate of Qatar has been extensively.discussed in the FAO report',
• the average annual rainfall is low approximately 65 mm in Doha and this
• normally occurs during the winter months of November to March. Although
not common, intense storms can occur; for example 150 mm was recorded41at Doha over a period of 3 days in December 1963; however such a storm has
• a recurrence interval of about 28 years. The mean maximum monthly
• temperature is 41.5°C which occurs in July and falls to a mean minimum
monthly temperature of 13.1°C in January. The total potential evaporation41is approximately 2070 mm per year for Doha which greatly exceeds the
41 average rainfall. However as the groundwater is at or close to the
• surface in many part of town , groundwater evaporation will take place
41 possibly at a rate of 0.40 of the total potential', 828 mm per year.
41 Geology
41 A detailed description of the geology of the Qptar Peninsular is given
• in the FAO report. Underlying Doha, the Rus Formation of Lower Eocene
• age may attain a thickness of 100 m. The Rus i s predominantly a limestone
interbedded with marls, clays and massive gypsum beds. Occasionally41 solution cavities in the gypsum beds give rise to collapse structures,
41 dahls, which result regionally in a hydraulic connection with the overlying
• formation. The Rus i s water bearing throughout Qatar and provides an
aquifer of sulphate rich water in the Doha area.41
• Conformably overlying the Rus i s the Lower Dammam Formation which is
• also of Lower Eocene age. This formation can be between 1 and 12 metres
thick and is comprised of shales,marls and clays, with subordinate limestone.41
The Lower Dammam is an aquitard hydraulically separating the overlying
10 strata from the Rus Formation except in areas where collapse structures
• exist, when the two are connected.
41The Simsima Dolomite and Limestone of the Upper Dam an Formation is of
• Maddle Eocene age and provides the eroded land surface for the whole of the
• Doha area. The dolomite is a diagenetic replacement of the original chalky
limestone and may extend to up to 10 metres below ground level. The total41thickness of the Simsima' is unlikely to exceed 30 metres and may in places
•
•
•Water resources of Qatar and their development
• FAO Doha 1981
•

40
40be considerably thinner in the Doha area. Fissures appear to be fairlY
common in the dolomite but not in the chalky limestone.
40 The Simsima is normally non water bearing in Qatar but beneath Doha
40 an aquifer is being formed. Along the coastline superficial beach
deposits of calcareous and locally cemented sands are present and these
in part have been reclaimed by rock fill along the corniche and by
compacted dredged calcareous sand forming the peninsular to the north
41 of Doha bay.
41Water Level
As a consequence of the rapid development of Doha, numerous trial pits
and cored boreholes are constructed each year for site investigation
40 purposes. During a 9 month period in 1981 Pencol collected water level
• elevation data from 33 of these sites within the city. The Water
Department' has also started to routinely measure water levels and
these two sets of data with the exception of pumped water levels are
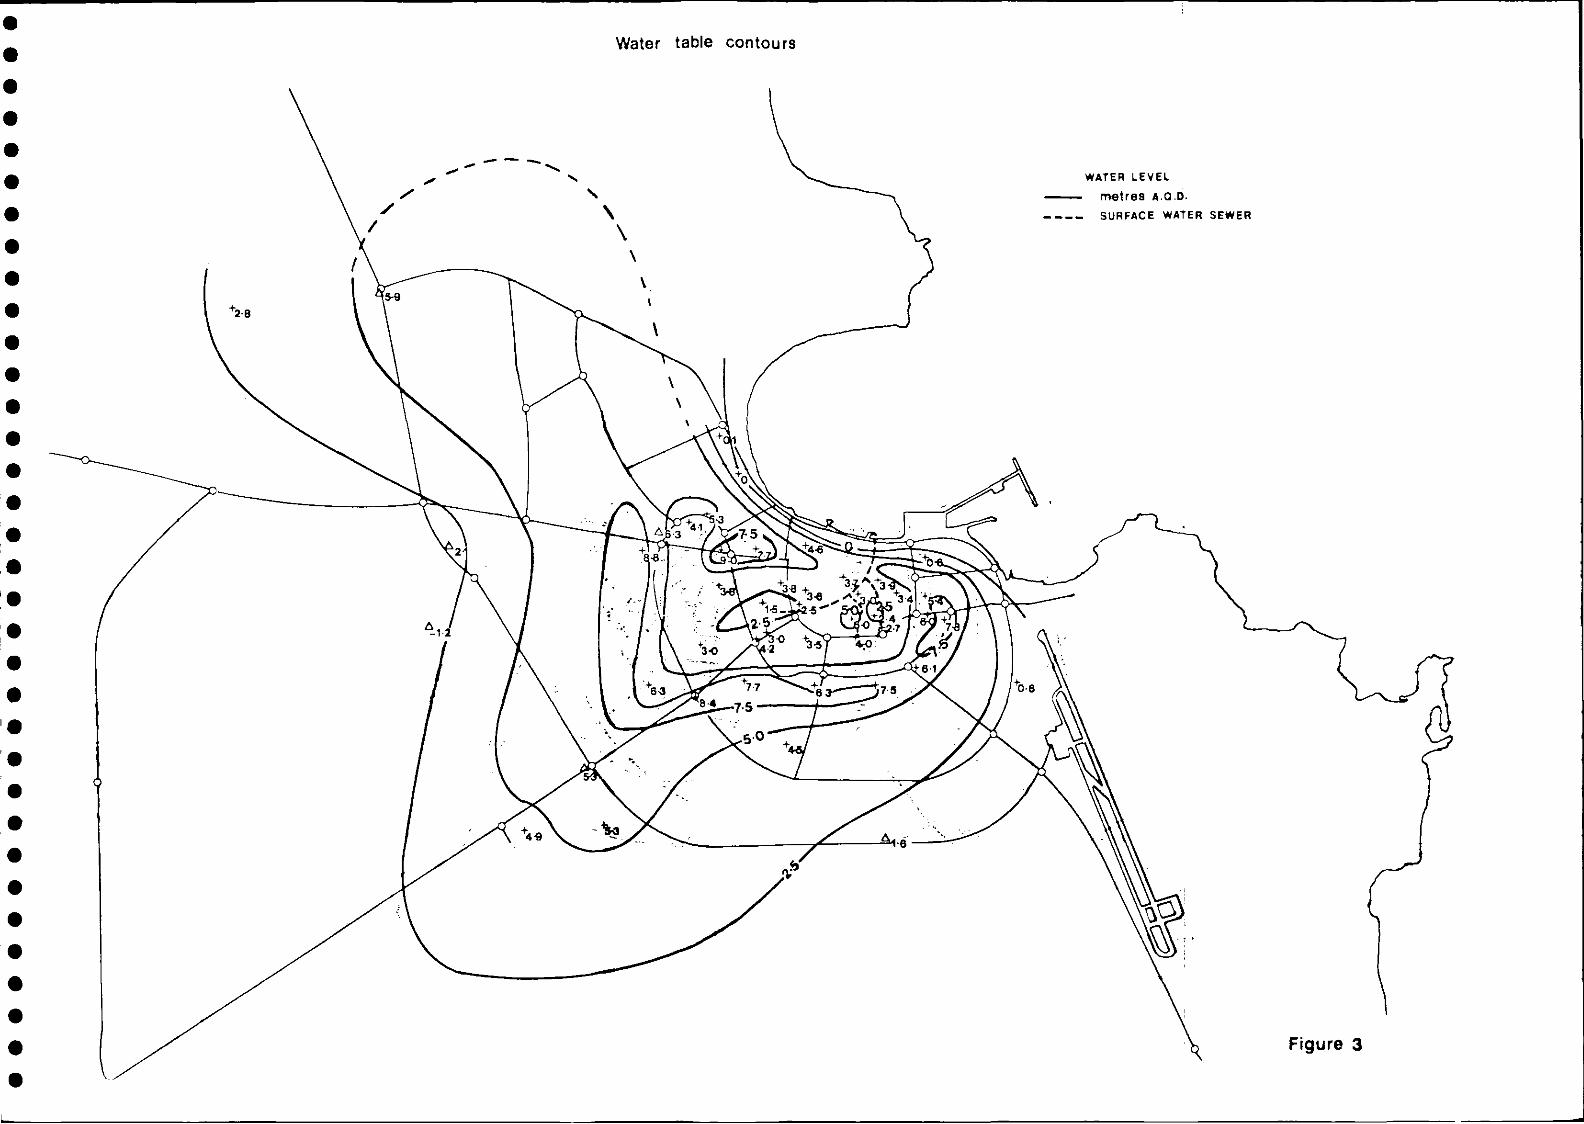
• shown together on figure 3 as elevations above sea level. We have
• contoured these data using a 2.5 metre interval to show the
•general form of the water table. A closer contouring interval is not
possible as water levels are changing with time at different rates but we
believe that the water levels were unlikely to have altered by more than
• 1 metre in this nine month period .
It can be seen that an extensive groundwater mound corresponding with
the developed area of town with an elevation more than 7.5 metres above
• sea level has formed beneath the city uhich is draining radially with a
• steep gradient towards the coast and a more shallow gradient inland.
However, this mound is complicated by the fact that there would appear
to be two substantial depressions within it ufiere the groundwater
• elevations fall to 1.5 and 2.4 metres above sea level. Consequently,
•as u,ell as the radial groundwater movement inland and towards the coast
groundwater is also draining within the mound towards these two groundwater
lows.
41Preliminary report on groundwater under Doha City
• N.R.G. Walton October 1981 WD/A20.
40
•
•Water table contours
•
•
•"• .
•
•7
•
• k5-9
• +2 8
•
•
•
•
•
: •
•2
•
• -1.
•
I
•
•
• +4 9
8-3
1
0
0 .8
WATER LEV EL
me t re s A .Q .D.
— - - - SURFAC E WATER SEW ER
•
•
• )4C
•
•
•
•
•
Figu re 3
ID
The correspondence of these lows with the main surface water sewers
• main may in fact account for these groundwater depressions. Alternatively,
• the historic natural drainage of the surface water catchments may have
resulted in collapse structures being formed which would provide naturalID
groundwater sinks to the system. It may also be noted that some,
• although not all, of the groundwater highs appear to be associated
• with surface water gullies which discharge to soakaway boreholes and that
in fact the soakaway boreholes are behaving as recharge wells. TheID
general nature of the groundwater contours do surprisingly tend to
• suggest uniform aquifer conditions. However further exploration hould
• be necessary to confirm this and it could be that our data base is too
sparse to make this observation.
• Aq ui f e r c ha r a c t e r i s t i c s
40The aquifer that we are considering is hdthin the Simsima dolomite and
chalky limestone, the base of which may be defined as the top of the• Midra shales. As this formation is non water bearing little data
• concerning the aquifer characteristics are available. However, Wimpey
as part of the Qatar National Museum dewatering study have carried out
pumping tests and obtained average permeabilities of 80 m/day and
1400 m/day.
ID
41 Their calculations assumed a saturated thickness of 6 metres which was
equivalent to the depth of the well below the water table. It is moreID likely that the saturated thickness is 20 metres regionally and a
• recalculation of permeability gives 30 m/day and 800 m/day. The low
• permeability is obtained from water level observations taken in 40 mm
diameter observation wells and the high permeability from water level
observations taken in a pit measuring 1.9 x 2.0 metres. These results
• can be considered to be consistent with each other if it is assumed that
•high values for the pit results from the effect of more fissures being
intercepted and also by the greater volume of water stored in the pit.
Because o f the effect of storage it might be more appropriate to assign
• a value of say 100 m/day rather than SOO m/day as an upper limit for the
• permeability.
4I
ID

ID
• Obviously more tests are necessary to determine the range Of permeabilities
that do apply to the Simsima formation. Hohever he feel that low
permeabilities in the range 1-10 m/day would apply to the primary permeability
• with perhaps 50-100 m/day being the range appropriate for the fissured
• part of the formation.
IDThe Wimpey test data does not produce a solution for the storage coefficient
• of the aquifer. Hohever, the lithology of the Simsima suggest that the
• storage coefficient is very unlikely to exceed 0.01.
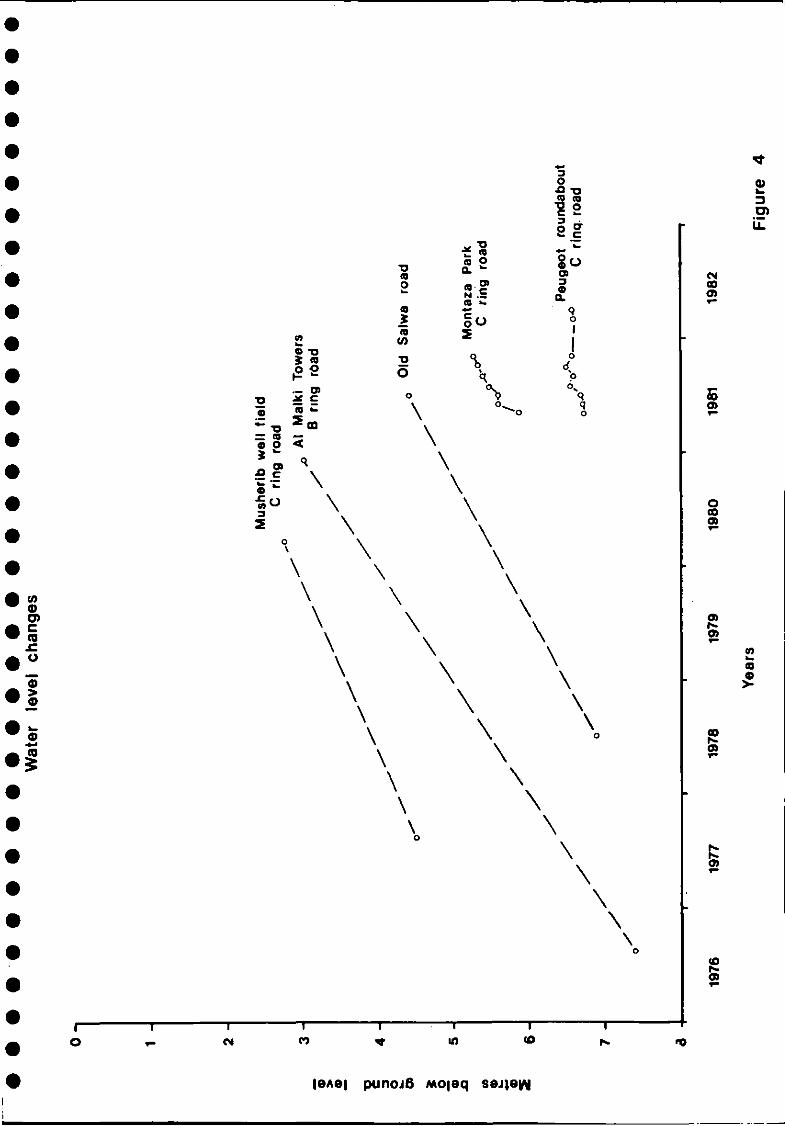
IDWater ievei changes
IDUntil 1981 no routine water level measurements have been carried out in
Doha. However, data from site investigations carried out several years
ago can occasionally be compared with recent water level . data obtained
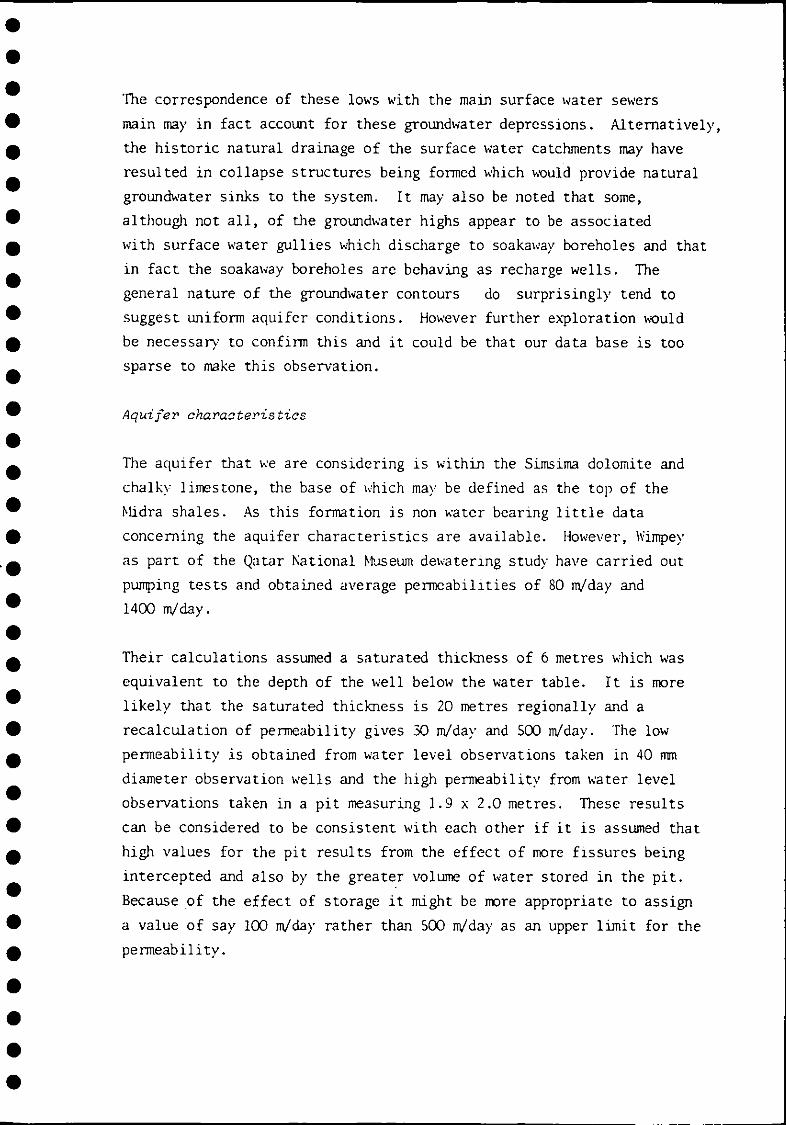
• from investigations at adjacent sites1. These, together with the routine
•hater level observations initiated by the Water Department, are shohn
in figure 4 . These show an even more alarming rate of rise
hithin the range 0.7 to 1.0 m/year over the past five years.
' ID We have no data to show when this rapid rise In water level started but
411 . it is knohm from observations recorded by Le Grand Adsco in 1959 thatthe hater levels at the State Hospital and Mbntaza Park were only
ID 0.5 m AQND and toha rds the end of 1981 at Montaza Park the water level
• is 4:5 m AQND.
It is unlikely that the water levels hill have risen uniformly during this411
period and seasonal and other fluctuations must exist. However, the
• overall trend is that of a rising water table and it is well knohn that
• groundwater is at or close to the surface in many of the loher lying parts
of town. The data collected by the hater Department from the PeugeotID
Roundabout appears to be ahay from the main recharge area, but as the
• development of Doha expands it seems reasonable to assume that the
• groundwater mound hill also expand in area.
•Aqu-ifer storage
•
411 If we assume that the average rise in water level over the area say
50 km2 bound by the 2.5 m contour shohn in figure 3 has been 4 metres
•
411' Wimpey - verbal communication
•
• •
• •
• •
• •
• •
• •
• •
• •
• •
• •
• •
• •
• •
• •
• •
• •
••
Wat
er
leve
l c
han
ges
0 1 2
Mu
sher
ib w
ell
fiel
dC
rin
g
road
-0
3..--
--A
l M
alk
i To
wer
s--
---.o
78
rung
ro
ad7
7
o•
7V
e.../
.../
/
2
V..--
----
4 V
o...-
-*o
---'
/-
6O
ld
Sal
wa
road
0.--
---
. X
o
3 7
Vo To
5V
V
Mo
nta
za
Park
wV
V
-oc
zn-o
-°-
C
rin
g
road
PI7
7
26
7V
1esi
7V
7 /
/ V
ply
0-
- -
owo..
Peug
eot
rou
nda
bou
t
XV
0.0w
C
ring
. roa
d
77
oV
7
a
1976
19
77
1978
19
79
198
0 19
81
198
2
Year
sF
igu
re
4

IDand that the storage coefficient of the aquifer is 0 .01, then the total
volume of water added to storage is 2 x 10⁶m3 since water levels started
• rising from their natural level possibly 10 years ago. If over the past year,
• the average overall rise was 0.5 metres, then this is equivalent to a
change in storage of 0.25 million m3.ID
• Rec ha r ge
• The potential sources of recharge to groundwater are easy to identify; however
• it is extremely difficult to quantify them. The possible sources are as follows:
• Rainwater
411 Domestic fresh water irrigation return
Treated sewage effluent irrigation returnID
Foul sewer leakage
Leakage from effluent network
• Leakage from cess pits and septic tanks
•Leakage from water distribution system
Overflow from domestic freshwater storage tanks• Fresh water leakage from reservoirs
• Fresh water spillage from tanker filling stations
In assessing the recharge to groundhater it is also necessary to estimate411 losses from the system. As with recharge these are easy to identify but
• difficult to quantify. The possible losses are:
•
IDSubsurface flow of groundwater away from the mound
Evaporation of groundwater close to the surface
• Piped removal of sewage effluent from the system
• Evapotranspirational losses from vegetation
Leakage to other aquifer systems40
Losses resulting from the change in aquifer storage
• Storm water sewer outflow
111It has been reported by both FAO and Halcrow Balfour in the context of water
• resources studies, that perhaps SO per cent of the water supplied to Doha is lost
• by subsurface leakage from the system. This figure however has not been obtained
by direct measurement but is simply an assumption; it represents the average410
leakage to be expected from a water distribution system based on a world-wide
ID range from a minimum of 10-15 per cent to a maximum of 40-50 per cent. Since
• the Doha distribution system is for the most part modern it is
consequently reasonable to assume that the leakage rate will
Master water resources and agricultural development planHalcroh— Balfour Ltd. September 1981
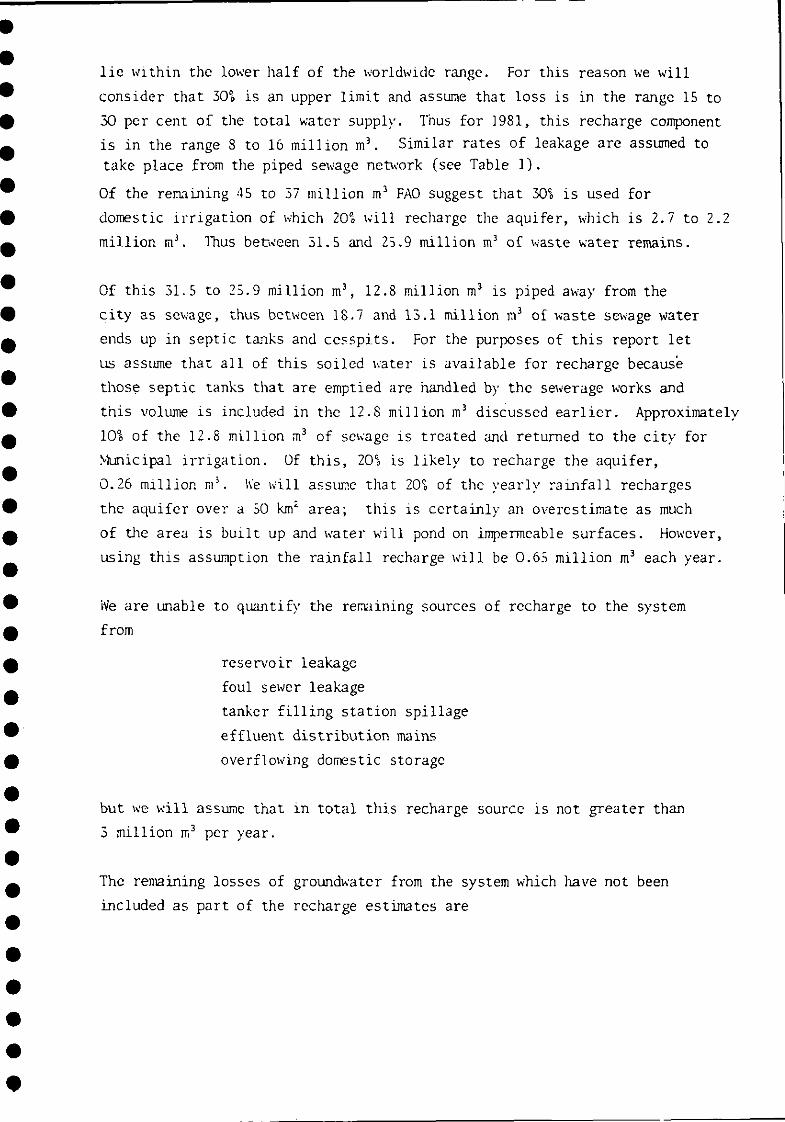
lie within the lower half of the horldhddc range. For this reason we udll
41 consider that 30% is an upper limit and assume that loss is in the range IS to
30 per cent of the total water supply. Thus for 1981, this recharge component
is in the range 8 to 16 million m3. Similar rates of leakage are assumed to
take place from the piped sewage network (see Table 1).
Of the remaining 45 to 37 million m 3 FAO suggest that 30% is used for
ID domestic irrigation of hhich 20% will recharge the aquifer, which is 2.7 to 2.2
million m3. Thus between 31.5 and 25.9 million m3 of haste water remains.
ID Of this 31.5 to 25.9 million 1113, 12.8 million m3 is piped away from the
411 city as sehage, thus beth en 18.7 and 13.1 million m3 of waste sewage water
ends up in septic tanks and cesspits. For the purposes of this report let
us assume that all of this soiled hater is available for recharge becauseID those septic tanks that are emptied are handled by the sewerage works and
ID this volume is included in the 12.8 million m3 disCussed earlier. Approximately
111 10% of the 12.8 million m3 of sewage is treated and returned to the city for
Minicipal irrigation. Of this, 20% is likely to recharge the aquifer,
0.26 million nY . he will assume that 20% of the yearly rainfall recharges
the aquifer over a 50 km2 area; this is certainly an overestimate as much
111 of the area is built up and water will pond on impermeable surfaces. However,
using this assumption the rainfall recharge will be 0 .65 million re each year.40
We are unable to quantify the remaining sources of recharge to the system
ID from
reservoir leakage
foul sewer leakage
tanker filling station spillage
• effluent distribution mains
• overflowing domestic storage
but we will assume that in total this recharge source is not greater than
• 3 million m3 per year.
The remaining losses of groundhater from the system which have not been
included as part of the recharge estimates are

40
IDleakage of groundhater to other aquifers
ID storm water seher outflow
• evaporation of near surface groundwater
groundwater flow through the aquifer
changes in groundwater storage.
411As there appears to be no change in water level hhen the lower Rus formation
is penetrated during drilling, we would conclude that there is little if
411 any transfer of water between the two aquifer systems. Direct evaporation
• of near surface groundhater can be assessed if W e make the assumptions
that water within 2 m of the surface wil l evaporate at a rate which will
not exceed the potential evaporation of 2000 mm per year. A more realistic
• evaporation figure may be to use that derived by Pike for Sabkha which
• would be 700 mm per year. Using the data for depth to groundhater, the
surface area with groundwater within 2 m of the surface is 2.25 million m2.40
Thus the groundwater evaporation will be in the range 1.6 to 4.5 million TO
• each year, and let us assume 3 million m2 for this report.
411 Additions to groundwater storage during the year can be considered to be
equivalent to a loss from recharge, and as shohm earlier, even if what
we consider to be a high storage coefficient of 1 per cent is used in
• the calculations, this change in storage is only equivalent to
ID 0.25 million m3/year.
40 The storm water sewer discussed earlier would appear to exert a very
• strong control on the form of the water table contours within the
•recharge mound. The maximum capacity of the system is 0.75 m3/second and
if we make the assumption that pumping takes place in total for 12 hours
each day, then this sewer effectively drains about 12 million m3 per year
411 from the recharge mound.
Table 1 summarises all these components of recharge that we have discussed41
including the losses from the system. Surprisingly Table 1 shows that
• groundwater recharge is largely insensitive to the amount of distillate
• leakage. Using the high figure of 30 per cent leakage the total recharge is
35 million m3, but the 15 per cent leakage reduces this estimated recharge
volume to 33 million. However the two main components of recharge are
• predominantly those due to sewage recharge of the aquifer from properties
• which are not yet connected to the main sewer system hhose septic tanks
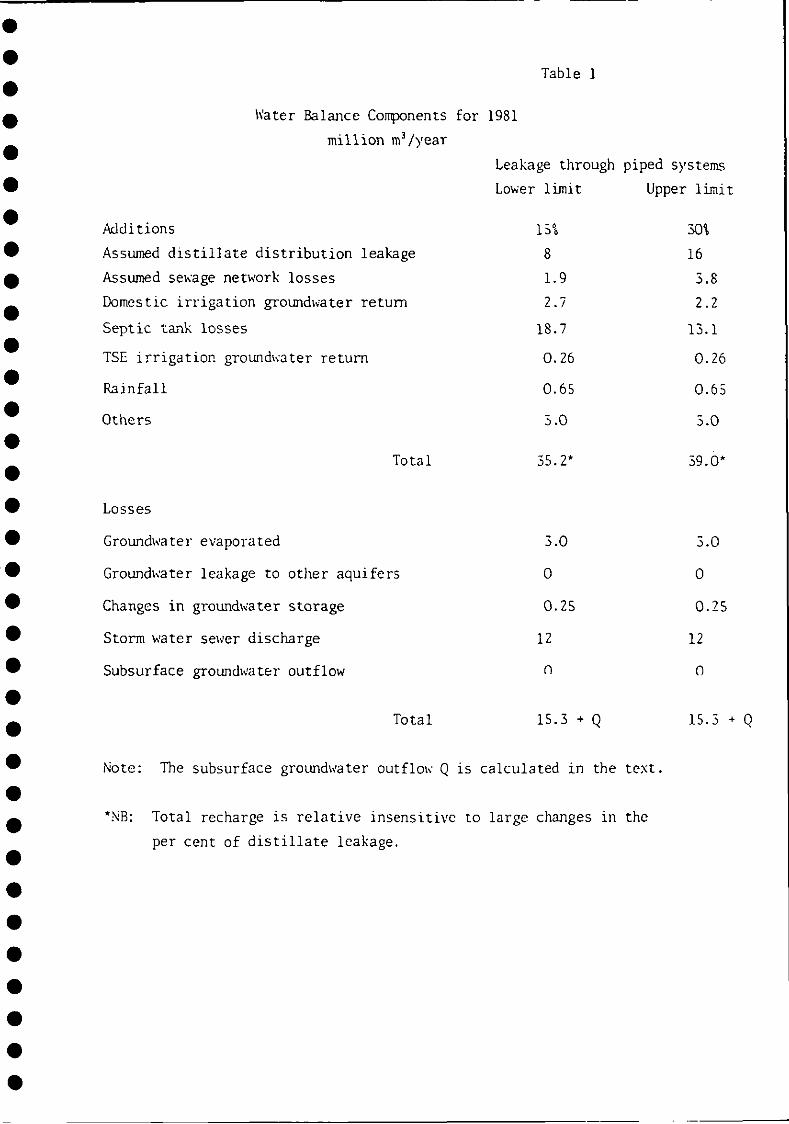
41Table 1
40 Water Balance Components for 1981
million mV year
40Total 15.3 + Q 15.3 + Q
• Note: The subsurface groundwater outflow Q is calculated in the text.
40
•*NB: Total recharge is relative insensitive to large changes in the
per cent of distillate leakage.40
•
•
ID
41
ID
• are not routinely tankered to the main sewerage horks and also to a lesserextent
• distillatedistribution system. Obviously, further study of these recharge
processes is necessary but if our assumptions are correct then our attemptID
to estimate recharge for the system clearly shows the main components
• to be waste water as well as a lesser extent distributed distillate.
Groundwater movement and water balance
• We can in part attempt to interrogate our model by calculating the
subsurface groundwater flow. If using our best estimate of the aquifer40
characteristics the groundwater flow balances the other components
411 of the water balance,then we can have some confidence in the model. The
• subsurface flow of groundwater away from the recharge mound can be
calculated using the Darcy equation and the hnter table configuration shown
in figure 3. Flow will depend on the permeability we assign to the aquifer• and as we have discussed earlier is likely to be in the range 1-10 m/day
• for primary permeability and 30-100 m/day for the overall fissure
•permeability. Flow wi.11 also depend on the saturated thickness A ich
believe to be about 20 metres. n ius the total recharge to the systemID should equal the change in aquifer storage, the subsurface flow of
411 groundwater away from the recharge mound, direct evaporation of groundhater
and the discharge of the storm sewer which drains groundwater from central
Doha.4I
• Using a value of say 5 m/day for the primary permeability gives, in
• million m3/year
•subsurface groundwater flow 1.6
• direct groundwater evaporation 3.0
• change in groundwater storage 0.25
storm sewer discharge 12.0
• This total is approximately 17 million m3 whereas our best estimate for
• recharge is in the range 35 to 39 million m3. Thus, using a permeability
of 5 m/day for the aquifer results in a discrepancy of 20 million 1113ID
between recharge and discharge from the system and we do not feel justified
• with the available data to alter any of the component to recharge to
• account for this large amount. The only way of approaching a balance is
by raising the permeability to 50 m/day. This will increase the411
subsurface groundwater flow to 16 million m3 and hence

32 million m' can be accounted for as the loss to recharge which is
much closer to our recharge estimate. Further field investigations
are obviously necessary to substantiate this high permeability and also
• to refine the other key components of the water balance which are distillate
•leakage,storm sewer discharge and unaccounted sewage ; meanwhile from
our present knowledge of the aquifer lithology it does not seem unreasonable
to postulate a fairly homogeneous fracture system within the dolomite.
Gr o undwat e r i den t i t y
The thb main sources of groundhater which form the aquifer arc sehage leakage
from septic tanks, sehage network effluent and distilled water from the main
distribution system. Individually these haters hill have verydifferent
chemistries; hohbver Onc e they have entered the aquifer system their chemistries;
• alter due to the presence of high concentrations of sodium,magnesium,
• sulphate carbonate and chloride. The presence of sewage hill be indicated
by high potassium and nitrate concentrations, a high dissolved organic
carbon content and a highly negative redox potential indicating reducing
• conditions . The distributed distillate on the other hand hill have a
lohbr total dissolved salts, a much higher redox potential and low
organic carbon concentrations.
• It may not be possible to determine the relative proportions of fresh to
• sewage waters in the system but the relative concentrations of,say,
nitrates hi l l indicate areas where sewage recharge is particularly high.
• Temperature may also prove a useful indicator for detecting fresh hater
• leakage for the distillate reaching Doha is at approximately 40°C as
compared with about 30°C for naturally occurring groundwater.40
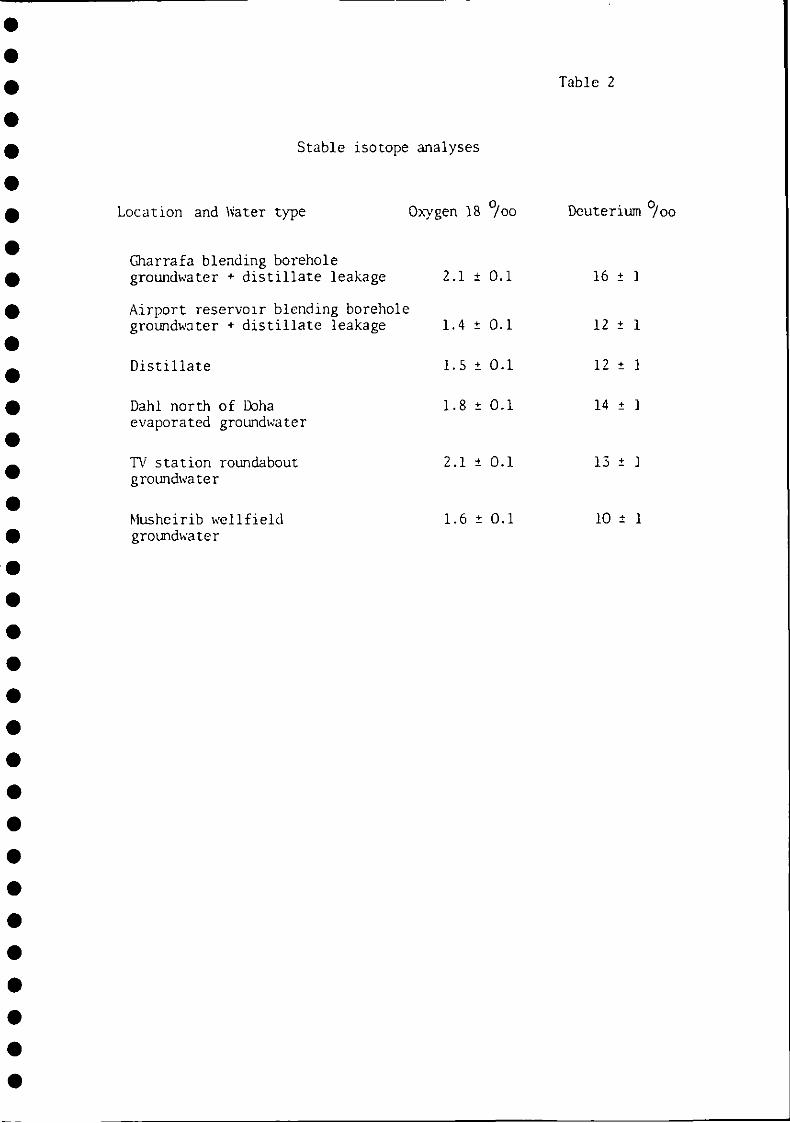
411 One further parameter uttich may help identify the sources of sehage
• recharge and fresh water is the ratio of the stable isotopes deuterium
and oxygen 18. As part of our reconnaissance we took 6 samples of
groundwater naturally mixed hith distillate and distilled water for• stable isotope analysis; unfortunately these samples were taken well
• to the edge of the recharge mound and are probably not contaminated with sewage.
The results of these analyses are shohm in Table 2 and we consider that
a more extensive sampling programme is necessary to show whether this
approach would be successful.
••
Location and Water type
Distillate
Dahl north of Dohaevaporated groundwater
TV station roundaboutgroundwater
Musheirib wellfieldgroundwater
Stable isotope analyses
Gharrafa blending boreholegroundwater + distillate leakage
Airport reservoir blending boreholegroundwater + distillate leakage
Table 2
Oxygen 18 ()/oo Deuterium c)/oo
2.1 ± 0.1 16 ± 1
1.4 ± 0.1 12 ± 1
1.5 ± 0.1 12 ± 1
1 . 8 ± 0.1 14 ± ]
2.1 ± 0.1 13 ± ]
1.6 ± 0.1 10 ± 1

41
41
41 Conclusions
• Our reconnaissance mission using existing data to investigate the rising
• water table beneath Doha has revealed the folloh.ing disturbing features:
41The average rate of rise over a S year period of the water table
41is at least 1.0 m/year in places, over thdce that previously reported.
411
• Our preliminary water balance,considerations suggest the cause of
41the rising water table is due not only to possible leaking sewage and
distillate networks but perhaps more importantly to septic tank overflow.
41
• Recharge from the leakage of distillate must be reduced simultaneously
41with reduction of leakage from the sewage system in order to prevent
a build up of sewage content within the groundwater body.
41
• Some of the surface water drainage gullies connected to soakaway
boreholes appear to be recharging the aquifer.41
41 The storm uater sewer, despite its limitations in performing its
.41 primary function, appears to have acted as an effective control on the
rising groundwater levels.41
• The leakage from reservoirs and tanker filling stations do not
• appear to be major sources of recharge to the system .
41
41 In view of our summary conclusions we would propose that there is an
immediate urgent need to prove whether extensive sehage contamination41 of the aquifer is taking place. This could best be effected by taking
• as many pumped water samples from the aquifer within the C ring road to
• the coast as possible, from site investigation pits, cored boreholes,
flooded cable ducts etc. which are above the Nlidra shales aquiclude.41 Should the chemical analysis of these samples reveal high potassium and
41 nitrate concentrations, these would be indicative of sehage recharge.
• Should this prove to be the case we would recommend that the efEectiveness
41of the septic tank emptying service is reviewed, and that the replacement
of septic tanks with mains sewage is accelerated.
41

• The consequence of the aquifer being recharged by possible septic tank
overflow and pipe sewage leakage would be that low pressure water mains
beneath the water table could locally become contaminated and also that with
• time the belnding wellfield boreholes may also risk contamination. To
ID give warning of wellfield contamination we would recommend the
construction of boreholes from which water samples would be taken by either
air lift or pumping sited between the wellfields and the city.
ID
• Further investigations are obviously urgently necessary to improve our
analysis so that recommendations may be made as to where the main areas of
recharge are taking place and also to identify more in detail the cause
• of recharge.
IDThis exploratory programme will have the following objectives:
• To accurately determine the form of the water table and its
elevation above sea level.
• To determine the rate of change of hater levels by routine
• measurement.
• To build up a more detailed understanding of the lithology of the
410 aquifer.
To determine the aquifer characteristics by pumping test.
To determine the source of groundwater by the chemical and stable41
isotopic composition of the groundwater from pumped or airlifted
411 water samples.
IDTo attempt to quantify each source of recharge to the aquifer.
•To measure the losses to recharge such as the storm water sewer
discharge and main sewerage disposal.
•To qualitatively assess whether groundha ter movement by fissure flow
IDis taking place to sea by fluid conductivity and temperature
• measurements in Doha Bay and possibly to complement this assessment
• by aerial infra-red photography.
• To give particular attention to the sewage and distillate networks
• and to carry out leak detection work for both .
••

•••
At present, the Water Department is developing a water level monitoring41
network using boreholcs constructed by contractors such as Wimpey
• for site investigation purposes. Unfortunately this network is not
• secure as building development is likely to take place at these sites.
41 However the network is providing a valuable set of data of routine
groundwater level measurements. This network could be improved still
• further if the design of electrical earth boreholes for building was
• modified so that it included a water level measuring facility within
41 the bore and also if part of the proposed cadastral network to be
constructed within the city was also modified for this purpose. Common
41 to all these measuring points however, it is essential that the elevation
41 above sea level of the measurement datum is known .
41As part of our exploratory investigation we hbuld propose that this
41 secure network is enhanced by the drilling of further observation
41 boreholes. These boreholes should be of sufficient diameter to allow
• electrical logging to be carried out and also to provide either pumped
or air lifted water samples for chemical and stable isotope analysis.41 Because of the problems of land acquisition and subsequent security of
• the borehole it is not possible to give borehole locations in this report;
41 hohbver ub would envisage that the total nethbrk would comprise some
4140 boreholcs, predominantly constructed by rock coring techniques to an
average depth of 20 metres with a diameter of 113 mm. At 5 of these
41 sites, which can only be defined during the survey, pumped wells of
• diameter, say, n inches would also be constructed so that pumping tests
41up to 14 days in duration could be carried out to determine the aquifer
characteristics.
4141 Finally, in advance of these exploratory works we would recommend that the
routine measurements of hater levels are continued and that the elevation41
of-the measuring datums are accurately measured. As well as the urgent
41 chemical sampling prognimme we outlined earlier, we would also suggest
41 that routine measurements of the storm water sewer discharge are measured.
41414141
•

Umm Sai d i nve s t i ga t i on
• It is most probable that the causes for the rise in water table at thin Said
• are similar to those for DOha. Experience has shown that in such areas of
rapid development the capacities of existing sewage and water networks
are always under strain and frequently cannot cope with ever increasing
• demands. Thus we recommend that an observation borehole network for
• groundwater level measurement and water chemistry determination be carried
out. We will then be able to establish a data base from which we will be
able to show the cause for water level rise and subsequently advise which
• measures need to be taken for control.
•