Embed Size (px)
Citation preview

https://doi.org/10.1177/2167702617723376
Clinical Psychological Science 1 –15© The Author(s) 2017Reprints and permissions: sagepub.com/journalsPermissions.navDOI: 10.1177/2167702617723376www.psychologicalscience.org/CPS
Empirical Article
Depression and suicide are significant public health concerns, with over 40,000 Americans dying by suicide each year (Centers for Disease Control [CDC], 2017). Beyond the lives lost to suicide, death by suicide has significant emotional and economic costs, resulting in approximately $44.6 billion a year in combined medical and work loss costs in the United States alone (CDC, 2017). As such, suicide—and factors that may increase risk for suicide, including depression—is a serious public health concern that warrants extensive empirical investigation.
In recent years, clinicians heading university counseling centers have reported markedly increased caseloads, with many more students seeking help for mental health issues in the years after 2010 compared to a few years prior (Beiter et al., 2015; New, 2017; Novotney, 2014). One analysis found a 30% increase in caseloads
between 2009–2010 and 2014–2015 at 93 university counseling centers, especially in mood and anxiety disorders and suicidal ideation (Center for Collegiate Mental Health, 2015). Reports of increases in counseling use among high school students have also surfaced (Anderssen, 2013; Noguchi, 2014). If true, that would mean more young people than in previous years are suffering from mental health issues, putting them at risk for suicide and other negative outcomes (Berman, 2009).
However, these increases in counseling center caseloads could be due to other factors, such as more students
723376 CPXXXX10.1177/2167702617723376Twenge et al.Suicide and Increased New Media Screen Timeresearch-article2017
Corresponding Author:Jean M. Twenge, Department of Psychology, San Diego State University, 5500 Campanile Drive, San Diego, CA 921824611 Email: [email protected]
Increases in Depressive Symptoms, Suicide-Related Outcomes, and Suicide Rates Among U.S. Adolescents After 2010 and Links to Increased New Media Screen Time
Jean M. Twenge1, Thomas E. Joiner2, Megan L. Rogers2, and Gabrielle N. Martin1
1San Diego State University and 2Florida State University
AbstractIn two nationally representative surveys of U.S. adolescents in grades 8 through 12 (N = 506,820) and national statistics on suicide deaths for those ages 13 to 18, adolescents’ depressive symptoms, suiciderelated outcomes, and suicide rates increased between 2010 and 2015, especially among females. Adolescents who spent more time on new media (including social media and electronic devices such as smartphones) were more likely to report mental health issues, and adolescents who spent more time on nonscreen activities (inperson social interaction, sports/exercise, homework, print media, and attending religious services) were less likely. Since 2010, iGen adolescents have spent more time on new media screen activities and less time on nonscreen activities, which may account for the increases in depression and suicide. In contrast, cyclical economic factors such as unemployment and the Dow Jones Index were not linked to depressive symptoms or suicide rates when matched by year.
Keywordsdepression, sociocultural factors, suicide prevention, interpersonal interaction, mass media
Received 4/25/17; Revision accepted 7/6/17

2 Twenge et al.
with alreadydiagnosed mental health issues enrolling in college, improved outreach by counseling centers, and students being more willing to seek help. As Collishaw (2014) notes in his review of research on trends in the prevalence of psychiatric disorders in child populations, “substantial increases in diagnosis and treatment of child psychiatric disorders in clinical practice do not necessarily reflect changes in population prevalence. Likeforlike comparisons using unselected cohorts are required to test mental health trends” (p. 19).
Thus, it would be useful to determine trends in mental health in general samples of adolescents, preferably with data collected concurrently over several years, rather than retrospectively, to minimize issues with recall (Klerman & Weissman, 1989). Previous studies examining such concurrent samples over time up to the 2000s found incongruent results, with some identifying significant increases in psychopathology (Collishaw, Maughan, Goodman, & Pickles, 2004; Collishaw, Maughan, Natarajan, & Pickles, 2010; Twenge et al., 2010) and others concluding that no changes occurred (Costello, Erkanli, & Angold, 2006; for reviews, see Collishaw, 2014; Twenge, 2011). In some cases, these disparate findings may have been caused by changes in the measurement of mental health issues, emphasizing the importance of using the same measures over time. In addition, research on trends in mental health after 2010, the time when mental health issues were rumored to have increased, is scant (Mojtabai, Olfson, & Han, 2016), though suicide rates appear to have increased (Curtin, Warner, & Hedegaard, 2016).
Furthermore, if mental health issues have increased among adolescents, the reasons are unclear (Collishaw, 2014; Glowinski & D’Amelio, 2016). Some have speculated that increased academic pressure and homework loads are the culprit (Galloway, Conner, & Pope, 2013; Neighmond, 2013), whereas others point to the severe recession of the late 2000s (Cummins, 2016). Continuing changes in family structure (e.g., Brown, Stykes, & Manning, 2016), in patterns of substance misuse (e.g., opioids; but see McCabe et al., 2017), and in obesity rates (e.g., Ogden et al., 2016) may also be implicated.
Another possible reason for the suspected increase in mental health issues is the growing popularity of electronic communication, especially social media. Some studies link frequency of social media use to poor psychological wellbeing (Augner & Hacker, 2012; Kross et al., 2013; Huang, 2017; Shakya & Christakis, 2017; Tromholt, 2016), although other studies instead find links with positive wellbeing (e.g., Dienlin, Masur, & Trepte, 2017; Oh, Ozkaya, & LaRose, 2014; Valkenburg, Peter, & Schouten, 2006), with outcomes depending on motivation for using social media (Valkenburg & Peter, 2007) and whether the frequency
of use qualifies as addictive (Andreassen et al., 2016). However, most of these studies use convenience samples of adults, with few using nationally representative samples and even fewer including the especially vulnerable population of adolescents.
Examining how adolescents spend their time—including both screen and nonscreen activities—may be especially important, as iGen1 adolescents in the 2010s spent more time on electronic communication and less time on inperson interaction than their Millennial and Generation X (GenX) predecessors at the same age (Twenge, 2017; Twenge & Uhls, 2017). It is worth remembering that humans’ neural architecture evolved under conditions of close, mostly continuous facetoface contact with others (including nonvisual and nonauditory contact; i.e., touch, olfaction; Baumeister & Leary, 1995; Lieberman, 2013) and that a decrease in or removal of a system’s key inputs may risk destabilization of the system (e.g., Badcock, Davey, Whittle, Allen, & Friston, 2017).
Inperson social interaction (also known as facetoface communication) provides more emotional closeness than electronic communication (Sherman, Minas, & Greenfield, 2013) and, at least in some studies, is more protective against loneliness (Kross et al., 2013; cf. Deters & Mehl, 2013). Some research suggests that electronic communication, particularly social media, may even increase feelings of loneliness (Song et al., 2014), and time spent on electronic communication has increased considerably since the smartphone (a mobile phone with Internet access) was introduced in 2007 and gained market saturation around 2012 (Smith, 2017).
These changes in social interaction are especially relevant for suicide and suiciderelated outcomes, as posited by the interpersonal theory of suicide. Briefly, the interpersonal theory of suicide ( Joiner, 2005; Van Orden et al., 2010) proposes that the desire for suicide results from the combination of two interpersonal risk factors: thwarted belongingness (i.e., social disconnection/alienation, loneliness) and perceived burdensomeness (i.e., feeling as though one is a burden on others). Empirical support for the theory’s propositions is considerable. For example, Chu et al. (2017) metaanalyzed work on 122 published and unpublished samples and found support for theory predictions; both perceived burdensomeness and thwarted belongingness displayed robust connections to suicidal ideation (with some evidence for burdensomeness having a stronger connection). Given the recent shifts in adolescent social interaction, increases in both perceived burdensomeness and thwarted belongingness may be particularly salient risk factors for suicide in this population. As such, exploring trends in mental health and examining possible causes (e.g., changes in the mode and quantity

Suicide and Increased New Media Screen Time 3
of adolescent social interaction leading to increased perceived burdensomeness and thwarted belongingness) may be an informative avenue of research.
The current research has two goals. First, we seek to determine if the prevalence of depressive symptoms, suiciderelated outcomes (i.e., suicidal ideation, plans, and attempts), and suicide deaths has increased in nationally representative samples of U.S. adolescents in recent years and whether these birth cohort trends2 differ by gender, race, age, region, and socioeconomic status (SES). Second, we examine possible causes behind trends in adolescents’ mental health, primarily focusing on shifts in adolescents’ use of leisure time in these same nationally representative samples. We examine correlations between mental health and a wide array of activities including new media screen time (e.g., electronic device use, social media), older media screen time (TV watching), and nonscreen activities (e.g., inperson social interaction, sports/exercise, homework, attending religious services). We also examine the role of economic factors at the group level, including cyclical economic trends (unemployment, stock index performance) and income inequality, as economic hardships have been linked with depression (Zhai et al., 2016) and income inequality has been linked to lower overall happiness (Oishi, Kesebir, & Diener, 2011).
Identifying the mechanisms underlying trends in mental health is necessarily difficult as experimental trials are not possible: Adolescents cannot be randomly assigned to experience different eras. Thus, we must turn to correlational research to provide evidence. At minimum, possible causes must meet two criteria. First, they must be linked to mental health indicators in a population of individuals. For example, more frequent use of new media might be correlated with higher levels of depressive symptoms. Second, the variable must change over the years in parallel with trends in mental health indicators.
In this paper, we take these two steps, drawing on data from two large, nationally representative surveys of U.S. adolescents conducted since 1991 (the Monitoring the Future [MtF] survey and the Youth Risk Behavior Surveillance System [YRBSS]) and the U.S. CDC data on suicide deaths since 1999. These three sources allow a timelag design that holds age constant while birth cohort and time period vary, allowing for the examination of cultural change across three generations of adolescents (GenX, Millennials, and iGen) disentangled from age effects. After determining trends in depressive symptoms, suiciderelated outcomes, and suicide rates, we applied a twostep process to rule in or out possible causes. First, we examined which activities (e.g., electronic device use, social media, inperson social interaction, homework time) were correlated with depressive
symptoms and suiciderelated outcomes. Second, we determined whether the temporal trends in adolescents’ screen and nonscreen activities and grouplevel economic factors paralleled the trends in depressive symptoms, suiciderelated outcomes, and suicide rates.
Methods
Samples
MtF is a nationally representative survey of 8th, 10th, and 12th graders administered every year since 1991 ( Johnston, Bachman, O’Malley, Schulenberg, & Miech, 2016). All procedures of the survey are annually reviewed and approved by the University of Michigan Institutional Review Board. For the items used here, n = 388,275.
The YRBSS is a nationally representative sample of high school students (9th, 10th, 11th, and 12th graders) administered by the CDC every other year since 1991. The YRBSS protocol was approved by the CDC Institutional Review Board (CDC, 2016). For the items used here, n = 118,545.
Suicide deaths per 100,000 population for the age group corresponding to the MtF and YRBSS respondents (ages 13 to 18) were calculated from the online version of the CDC Fatal Injury Reports, which has data available from 1999 to 2015 (CDC, 2017). This site provides custom age ranges and breakdowns by sex, race/ethnicity, and region for suicide rates in each year.
Assessments
Depressive symptoms. MtF included six items from the Bentler Medical and Psychological Functioning Inventory depression scale (Newcomb, Huba, & Bentler, 1981): “Life often seems meaningless,” “I enjoy life as much as anyone” (reverse scored), “The future often seems hopeless,” “I feel that I can’t do anything right,” “I feel that my life is not very useful,” and “It feels good to be alive” (reverse scored). Response choices ranged from 1 (dis-agree) to 5 (agree). After recoding the two reversescored items, itemmean scores were computed (α = .86).
Suicide-related outcomes. This section on the YRBSS included four items: “During the past 12 months, did you ever feel so sad or hopeless almost every day for two weeks or more in a row that you stopped doing some usual activities?” “During the past 12 months, did you ever seriously consider attempting suicide?” “During the past 12 months, did you make a plan about how you would attempt suicide?” Response choices for these three items were “yes” or “no.” Another item, “During the past 12 months, how many times did you actually attempt

4 Twenge et al.
suicide?” was recoded to 0 times = “no” and one time, two or three times, four or five times, or six or more times = “yes.” Participants who responded “yes” to any of the four items were recorded as having at least one suiciderelated outcome (α = .75).
Electronic device use. In 2009, YRBSS asked, “On an average school day, how many hours do you play video or computer games or use a computer for something that is not school work? (Include activities such as Nintendo, Game Boy, PlayStation, Xbox, computer games, and the Internet.)” In 2011, “On an average school day, how many hours do you play video or computer games or use a computer for something that is not school work? (Include activities such as Xbox, PlayStation, Nintendo DS, iPod touch, Facebook, and the Internet.)” In 2013 and 2015, “On an average school day, how many hours do you play video or computer games or use a computer for something that is not school work? (Count time spent on things such as Xbox, PlayStation, an iPod, an iPad or other tablet, a smartphone, YouTube, Facebook or other social networking tools, and the Internet.)” Response choices were recoded as follows: “I do not play video or computer games or use a computer for something that is not school work” = 0; “less than 1 hour per day” = .5; “1 hour per day” = 1; “2 hours per day” = 2; “3 hours per day” = 3; “4 hours per day” = 4; and “5 or more hours per day” = 6.
Social media use. MtF asked beginning in 2009, “How often do you do each of the following? Visit social networking websites (like Facebook).” Response choices were never = 1, a few times a year = 2, once or twice a month = 3, at least once a week = 4, and almost every day = 5.
Internet news. The MtF 8th and 10th grade surveys asked, “How often do you use each of the following to get information about news and current events? The Internet.” Response choices were never = 1, a few times a year = 2, once or twice a month = 3, at least once a week = 4, and almost every day = 5.
TV watching. The MtF 8th and 10th grade surveys asked two questions on TV watching. First, “How much TV do you estimate you watch on an average weekday?” Response choices were recoded to none = 0, half-hour or less = .25, about 1 hour = 1, about 2 hours = 2, about 3 hours = 3, about 4 hours = 4, and 5 hours or more = 6. Second, “How much TV do you estimate you watch on an average WEEKEND (both Saturday and Sunday combined)?” Response choices were recoded to none = 0, an hour or less = .5, 1–2 hours = 1.5, 3–4 hours = 3.5, 5–6 hours = 5.5, 7–8 hours = 7.5, and 9 or more hours = 10. We multiplied the weekday estimate by 5, added the
weekend estimate, and divided the total by 7 to obtain a daily estimate.
YRBSS asked, “On an average school day, how many hours do you watch TV?” Response choices were recoded as “I do not watch TV on an average school day” = 0, “Less than 1 hour per day” = .5, “1 hour per day” = 1, “2 hours per day” = 2, “3 hours per day” = 3, “4 hours per day” = 4, and “5 or more hours per day” = 6.
Homework. MtF asked, “About how many hours do you spend in an average week on all your homework including both in school and out of school?” with response choices recoded to 0 hours = 0, 1–4 hours = 2.5, 5–9 hours = 7, 10–14 hours = 12, 15–19 hours = 17, 20–24 hours = 22, and 25 or more hours = 30.
In-person social interaction. MtF asked six items about different types of inperson social interaction. Four items were asked in the same section beginning “How often do you do each of the following?”: “get together with friends, informally”; “go to parties or other social affairs”; “ride around in a car (or motorcycle) just for fun”; or “go to a shopping mall.” Response choices were never = 1, a few times a year = 2, once or twice a month = 3, at least once a week = 4, and almost every day = 5. Another item asked about going out: “During a typical week, on how many evenings do you go out for fun and recreation? (Don’t count things you do with your parents or other adult relatives)” with response choices recoded to less than one = .25, one = 1, two = 2, three = 3, four or five = 4.5, and six or seven = 6.5. Less than one was recoded as .25 instead of .50 because “none” was not a response choice on this item. Another asked about dating: “On average, how often (if ever) do you go out with a date?” with choices recoded to never = 0, once a month or less = .12, 2 or 3 times a month = .58, once a week = 1, 2 or 3 times a week = 2.5, and over 3 times a week = 4. The calculations for the first two recodes were as follows: once a month or less = .50 times a month, divided by 4.3 (the average number of weeks in a month) = .12; 2 or 3 times a month = 2.5, divided by 4.3 = .58. The six items were zscored, added together, and divided by 6 (α = .68).
Print media. The MtF 8th and 10thgrade surveys asked, “How often do you do each of the following? Read magazines. Read newspapers.” Response choices were never = 1, a few times a year = 2, once or twice a month = 3, at least once a week = 4, and almost every day = 5. Responses were zscored, added, and divided by 2 (α = .59).
Sports or exercise. MtF asked, “How often do you do each of the following? Actively participate in sports, athletics, or exercising.” Response choices were never = 1, a
Suicide and Increased New Media Screen Time 5
few times a year = 2, once or twice a month = 3, at least once a week = 4, and almost every day = 5.
YRBSS asked, “During the past 7 days, on how many days were you physically active for a total of at least 60 minutes per day? (Add up all the time you spent in any kind of physical activity that increased your heart rate and made you breathe hard some of the time.)” Response choices were recoded to 0 days = 0, 1 day = 1, 2 days = 2, 3 days = 3, 4 days = 4, 5 days = 5, 6 days = 6, and 7 days = 7.
Religious services. MtF asked, “How often do you attend religious services?” Response choices were never = 1, rarely = 2, once or twice a month = 3, and once a week or more = 4.
Paid job. The MtF 8th and 10thgrade surveys asked, “On average over the school year, how many hours per week do you work in a paid job?” Those who answered anything but “none” were coded as having a paid job.
Demographic moderators and controls. Both surveys assessed grade, sex (male vs. female), and race (Black, White, and Hispanic in MtF, with Hispanic measured only for 2005 and later; Black, White, Hispanic, and other in YRBSS). MtF also assessed region (Northeast, Midwest, South, and West) as well as mother’s and father’s highest level of education, a proxy for SES; we used mother’s education as it had less missing data than father’s education. The CDC suicide death data can be separated by sex, age, region, and race/ethnicity, with race recorded as Black, White, American Indian/Alaska Native, Asian/Pacific Islander, and other (filtered to all be nonHispanic), and Hispanic (of all races).
Economic factors. We gathered yearly statistics on the (a) unemployment rate, (b) the change in the Dow Jones Industrial Average (DJIA), and (c) the GINI index of income inequality from publicly available sources such as the Bureau of Labor Statistics.
Statistical analyses
For our analyses of trends over time in depressive symptoms, suiciderelated outcomes, and suicide rates, we separated the older data into 5year intervals (e.g., 2000–2004) to provide a compromise between specificity and breadth, dividing at the decade and halfdecade marks to enable references to specific time periods (e.g., “the early 2000s,” for 2000–2004). For the years 2010 and later, we display the yearbyyear data. Due to the large sample sizes, we focus primarily on percentage change or effect sizes rather than statistical significance in the change over time analyses.
Depressive symptoms are reported as item means and as the percentage of adolescents with item means over 3 (which is the midpoint of the scale and about 1 SD above the mean). Suiciderelated outcomes are presented as the percentage who reported at least one outcome, and the suicide rate is reported as deaths per 100,000 population.
We examined correlations between the mental health indicators (depressive symptoms and suiciderelated outcomes) and screen and nonscreen activities. In MtF, these analyses were limited to 8th and 10th graders as the depressive symptoms and social media items were not asked of the same participants on the 12th grade survey. We first present bivariate correlations, followed by partial correlations controlling for sex, race/ethnicity, grade, US region, and SES (using dummy codes for race/ethnicity, grade, and region), and correlations for boys and girls separately. We also report partial correlations for depressive symptoms controlling for inperson social interaction (to capture the unique effects of activities on depressive symptoms apart from inperson social interaction) and examine levels of depressive symptoms among those low and high (±1 SD) in inperson social interaction and low and high in social media use (low = never; high = use almost every day). As the survey designs include different participants every year (a timelag design), we were only able to examine concurrent correlations between activities and mental health; thus, lagged analyses examining the time course of activities and mental health (such as those used in longitudinal designs following the same participants) were not possible. We focused on 2009 through 2015, as the question on social media was first asked in 2009. As suggested by the survey administrators, the YRBSS data were weighted using the “weight” variable.
To examine the cooccurrence of adolescent mental health issues with economic factors and new media screen time, we matched the means of these variables by year, an established method for exploring cultural change at the group level (Grossmann & Varnum, 2015; Twenge, Campbell, & Carter, 2014; Varnum & Grossmann, 2016). Because means vary less than individuals, these ecological correlations are often high; to compensate, the df is the number of years rather than the number of individuals. We matched the means for depressive symptoms, suiciderelated outcomes, and suicide rates by year with the unemployment rate, DJIA change, and the GINI measure of income inequality. To provide a direct comparison with new media screen time, we also matched the mental health indicators by year with smartphone adoption rates (Smith, 2017; these statistics were available beginning in 2011, and smartphones were introduced in 2007, so we assumed linear growth between 2007 and 2010) and with mean frequency of

6 Twenge et al.
social media use from the MtF dataset (see Table S1 in the Supplemental Material available online). Because the items on suiciderelated outcomes were asked only every other year, these analyses are based on a smaller number of years and thus should be interpreted with caution.
Results
Trends in mental health indicators
Depressive symptoms, suiciderelated outcomes, and suicide deaths among adolescents all rose during the 2010s. These increases follow a period when mental health issues were declining or stable (see Table 1). Between 2009/2010 and 2015, 33% more adolescents exhibited high levels of depressive symptoms (item mean of 3 or over; 16.13% in 2010, 21.48% in 2015), 12% more reported at least one suiciderelated outcome (31.93% in 2009, 35.80% in 2015; 5% more since 2011, 34.21%), and 31% more died by suicide (5.38 per 100,000 population in 2010, 7.04 in 2015).
The increase in depressive symptoms and suiciderelated outcomes was driven almost exclusively by
females (see Table 1 and Fig. 1). Between 2009/2010 and 2015, 58% more females scored high in depressive symptoms (16.74% in 2010, 26.40% in 2015) and 14% more reported at least one suiciderelated outcome (39.82% in 2009, 45.39% in 2015; 12% more since 2011, 40.67%). The increase in suicide rates among adolescents also appeared among males but was larger among females, rising 65% between 2010 and 2015 (from 2.93 to 4.21) and more than doubling between the late 1990s and 2015 (from 1.99 to 4.21; see Table 1 and Fig. S1 in the Supplemental Material). The increases in depressive symptoms and suiciderelated outcomes were fairly similar among Hispanics, Blacks, and Whites, with more variation in suicide rate trends by race or ethnicity. Increases in depressive symptoms were similar among those of lower and higher SES and were larger in the West and among 12th graders. The recent increase in suicide rates appeared only in the Midwest, South, and West, but not in the Northeast (see Table 1).
The effect size for the rise in depressive symptoms among females in 2010 through 2015 was d = .27, which falls between a small and medium effect size. However, this change must be understood in the context of the brief 5year period over which it occurred. The change
1.8
1991
1992
1993
1994
1995
1996
1997
1998
1999
2000
2001
2002
2003
2004
2005
2006
2007
2008
2009
2010
2011
2012
2013
2014
2015
1.9
2.0
2.1
2.2
2.3
Depr
essi
ve S
ympt
oms
Item
Mea
n
Year
FemalesMales
Fig. 1. Depressive symptoms (item mean), 8th, 10th, and 12th graders, by sex, MtF, 1991–2015.

7
Tab
le 1
. U
.S. ad
ole
scen
ts’ dep
ress
ive
sym
pto
ms
(8th
, 10
th, an
d 1
2th g
rader
s, M
tF),
suic
ide
rela
ted o
utc
om
es (
9–12
th g
rader
s, Y
outh
Ris
k S
urv
eillan
ce S
yste
m),
and
suic
ide
rate
s (a
ges
13 t
o 1
8, C
DC
Dat
a), 19
91–2
015
N19
91–
1994
1995
–19
9920
00–
2004
2005
–20
0920
1020
1120
1220
1320
1420
15
d o
r %
ch
ange
ea
rlie
st to
2009
/201
0
d o
r %
ch
ange
20
09/2
010
to 2
015
Dep
ress
ive
sym
ptom
s38
8,27
51.
99
(0.9
0)1.
97
(0.9
1)1.
96
(0.9
1)1.
92
(0.9
1)1.
92
(0.9
2)1.
93
(0.9
2)1.
91
(0.9
2)1.
98
(0.9
6)2.
07
(1.0
1)2.
06
(1.0
0)–0
.08
0.15
Fem
ales
198,
415
1.99
(0
.93)
1.96
(0
.92)
1.94
(0
.93)
1.96
(0
.94)
1.94
(0
.94)
1.97
(0
.96)
1.97
(0
.97)
2.08
(1
.02)
2.19
(1
.06)
2.21
(1
.06)
–0.0
50.
27
Mal
es18
1,31
31.
95
(0.8
7)1.
95
(0.8
8)1.
95
(0.9
0)1.
89
(0.8
8)1.
89
(0.8
9)1.
88
(0.8
9)1.
84
(0.8
6)1.
87
(0.8
8)1.
93
(0.9
2)1.
90
(0.9
0)–0
.07
0.01
His
pan
ic24
,496
——
—2.
04
(0.9
2)2.
01
(0.9
1)2.
03
(0.9
4)2.
04
(0.9
3)2.
08
(0.9
6)2.
18
(0.9
8)2.
16
(0.9
8)–0
.03
0.16
Bla
ck43
,949
1.90
(0
.86)
1.90
(0
.85)
1.87
(0
.84)
1.87
(0
.85)
1.86
(0
.83)
1.93
(0
.87)
1.87
(0
.86)
1.90
(0
.84)
1.96
(0
.90)
2.00
(0
.93)
–0.0
50.
16
White
241,
619
1.96
(0
.90)
1.94
(0
.90)
1.92
(0
.91)
1.87
(0
.90)
1.86
(0
.91)
1.88
(0
.92)
1.86
(0
.91)
1.92
(0
.96)
2.01
(1
.02)
2.00
(1
.00)
–0.1
10.
15
Low
er S
ES
134,
474
2.05
(0
.92)
2.04
(0
.92)
2.05
(0
.94)
2.03
(0
.95)
2.02
(0
.94)
2.03
(0
.94)
2.05
(0
.98)
2.11
(0
.99)
2.21
(1
.03)
2.20
(1
.01)
–0.0
30.
18
Hig
her
SES
223,
443
1.91
(0
.87)
1.90
(0
.88)
1.87
(0
.88)
1.83
(0
.87)
1.83
(0
.88)
1.84
(0
.89)
1.82
(0
.87)
1.90
(0
.94)
1.96
(0
.98)
1.97
(0
.97)
–0.0
90.
15
Northea
st76
,806
1.98
(0
.91)
1.99
(0
.92)
1.96
(0
.92)
1.90
(0
.90)
1.91
(0
.93)
1.87
(0
.90)
1.87
(0
.91)
1.95
(0
.95)
2.04
(1
.02)
2.01
(1
.00)
–0.0
80.
10
Mid
wes
t96
,687
1.98
(0
.90)
1.97
(0
.91)
1.94
(0
.91)
1.91
(0
.91)
1.92
(0
.92)
1.93
(0
.93)
1.87
(0
.89)
1.93
(0
.95)
2.02
(1
.00)
2.04
(0
.99)
–0.0
70.
13
South
134,
886
1.97
(0
.90)
1.95
(0
.90)
1.92
(0
.90)
1.92
(0
.91)
1.91
(0
.90)
1.93
(0
.91)
1.93
(0
.94)
2.00
(0
.96)
2.06
(1
.00)
2.05
(1
.00)
–0.0
70.
15
Wes
t79
,896
2.02
(0
.90)
1.99
(0
.91)
2.03
(0
.93)
1.94
(0
.91)
1.95
(0
.93)
1.96
(0
.94)
1.95
(0
.92)
2.04
(0
.98)
2.15
(1
.01)
2.16
(1
.00)
–0.0
80.
22
8th
164,
039
2.00
(0
.92)
1.98
(0
.92)
1.96
(0
.94)
1.93
(0
.95)
1.94
(0
.95)
1.92
(0
.94)
1.90
(0
.95)
1.98
(0
.98)
2.07
(1
.03)
2.05
(1
.03)
–0.0
70.
11
10th
168,
007
1.99
(0
.90)
1.98
(0
.91)
1.97
(0
.91)
1.92
(0
.90)
1.91
(0
.91)
1.94
(0
.92)
1.93
(0
.91)
2.01
(0
.97)
2.08
(1
.01)
2.08
(0
.99)
–0.0
90.
18
12th
54,7
121.
93
(0.8
5)1.
91
(0.8
4)1.
89
(0.8
4)1.
87
(0.8
2)1.
87
(0.8
3)1.
89
(0.8
7)1.
89
(0.8
5)1.
90
(0.8
5)2.
01
(0.9
3)2.
04
(0.9
0)–0
.07
0.20
Per
cen
t w
ith
hig
h
dep
ress
ive
sym
ptom
s38
8,27
516
.96
17.0
616
.98
16.0
116
.13
16.6
915
.98
18.4
621
.21
21.4
8–4
.89
33.1
7
Fem
ales
198,
415
17.7
917
.51
16.8
916
.75
16.7
417
.93
17.8
721
.85
25.4
426
.40
–5.9
057
.71
Mal
es18
1,31
315
.90
16.4
017
.00
14.9
415
.08
15.3
313
.77
14.6
516
.61
16.3
7–5
.44
8.55
His
pan
ic24
,496
——
—18
.94
17.7
019
.32
19.3
520
.29
23.0
324
.10
6.55
36.1
6B
lack
43,9
4914
.73
14.6
713
.46
13.8
012
.80
15.4
114
.01
14.7
217
.20
18.5
5–1
3.10
44.9
2W
hite
241,
619
16.1
416
.17
16.0
114
.85
15.0
215
.71
14.9
217
.28
19.8
119
.56
–6.9
430
.23
Low
er S
ES
134,
474
18.9
318
.90
19.7
819
.15
18.6
119
.54
19.9
021
.82
25.6
225
.74
–1.6
938
.31
(Con
tin
ued
)

8
N19
91–
1994
1995
–19
9920
00–
2004
2005
–20
0920
1020
1120
1220
1320
1420
15
d o
r %
ch
ange
ea
rlie
st to
2009
/201
0
d o
r %
ch
ange
20
09/2
010
to 2
015
Hig
her
SES
223,
443
14.5
414
.84
14.3
213
.27
13.7
914
.16
13.2
616
.12
18.0
918
.70
–5.1
635
.61
Northea
st76
,806
16.8
517
.58
17.1
015
.41
16.3
815
.08
14.8
317
.15
20.7
420
.19
–2.7
923
.26
Mid
wes
t96
,687
16.6
017
.43
16.5
415
.94
16.2
917
.21
15.3
416
.82
19.6
020
.31
–1.8
723
.99
South
134,
886
16.8
416
.33
16.0
716
.19
15.8
316
.32
16.7
719
.12
21.2
121
.30
–6.0
034
.55
Wes
t79
,896
17.7
717
.36
18.9
916
.37
16.2
418
.01
16.2
420
.05
23.1
424
.35
–8.6
149
.94
8th
164,
039
17.7
617
.72
17.6
017
.03
17.4
316
.52
16.4
819
.00
21.4
121
.23
–1.8
621
.80
10th
168,
007
17.1
717
.31
17.2
715
.88
15.7
817
.39
16.1
119
.32
21.9
822
.08
–8.1
039
.92
12th
54,7
1214
.19
14.1
713
.69
13.2
413
.22
15.0
214
.35
14.0
818
.06
20.0
1–6
.84
51.3
6Su
icid
e-re
late
d
outc
omes
(%
wit
h a
t le
ast
on
e su
icid
e ri
sk
fact
or)
118,
545
—36
.22
36.4
133
.48
—34
.21
—35
.17
—35
.80
–5.5
54.
65
Fem
ales
58,8
70—
44.6
743
.50
41.4
0—
40.6
7—
43.9
6—
45.3
9–8
.95
11.6
1M
ales
59,3
37—
27.8
029
.09
25.7
2—
28.0
2—
26.2
8—
26.3
5–0
.79
–5.9
6H
ispan
ic19
,066
—43
.69
44.3
140
.33
—39
.45
—41
.82
—40
.66
–9.7
03.
07B
lack
14,7
03—
36.4
834
.33
35.3
5—
32.8
9—
35.1
4—
34.2
5–9
.84
4.13
White
72,3
08—
32.5
834
.03
30.8
0—
31.9
4—
32.0
7—
33.5
8–1
.96
5.13
Oth
er10
,748
44.7
744
.89
36.9
5—
39.6
3—
40.3
8—
39.7
5–1
1.48
0.30
9th
33,0
95—
36.1
816
.90
34.1
0—
34.1
5—
34.9
0—
34.2
3–5
.39
0.23
10th
30,5
56—
38.6
337
.59
33.6
8—
34.8
2—
34.6
4—
35.6
7–9
.86
2.44
11th
27,9
58—
34.0
636
.09
34.0
1—
35.0
5—
36.8
4—
37.9
9–2
.91
8.39
12th
26,3
00—
35.7
134
.17
31.6
7—
32.7
0—
34.2
2—
35.6
2–8
.43
8.93
Suic
ide
rate
(ou
t of
10
0,00
0)—
—5.
635.
345.
045.
385.
886.
006.
136.
637.
04–4
.44
30.8
6
Fem
ales
——
1.99
2.27
2.30
2.55
2.93
3.19
3.35
3.70
4.21
28.1
465
.10
Mal
es—
—9.
088.
257.
648.
078.
688.
688.
789.
439.
76–1
1.12
20.9
4H
ispan
ic—
—3.
943.
933.
743.
933.
984.
173.
864.
514.
11–0
.25
4.58
Bla
ck—
—3.
933.
173.
013.
043.
363.
433.
823.
454.
12–2
2.65
35.5
3W
hite
——
6.31
6.11
5.81
6.37
7.24
7.39
7.60
8.35
8.94
0.95
40.3
5A
sian
/Pac
ific
Isl
ander
——
3.94
3.60
3.38
3.19
3.31
3.65
3.64
4.20
4.91
–19.
0453
.92
Am
eric
an India
n/
Ala
ska
Nat
ive
——
16.3
515
.21
19.3
623
.44
19.1
416
.74
19.2
317
.79
22.6
743
.36
–3.2
8
Oth
er—
—6.
596.
086.
556.
766.
015.
836.
176.
347.
642.
5813
.02
Northea
st—
—3.
814.
063.
304.
504.
814.
244.
454.
944.
4918
.11
–0.2
2M
idw
est
——
6.10
5.96
5.99
6.71
7.00
7.35
7.15
7.79
8.08
10.0
020
.42
South
——
5.93
5.22
4.94
4.71
5.34
6.00
5.94
6.55
6.69
–20.
5742
.04
Wes
t—
—6.
125.
895.
625.
856.
466.
066.
716.
938.
49–4
.41
45.1
3A
ges
13–1
4—
—2.
262.
402.
022.
462.
572.
843.
503.
703.
768.
8552
.84
Age
s 15
–16
——
5.36
5.19
4.97
5.16
5.89
6.16
6.25
6.68
6.88
–3.7
333
.33
Age
s 17
–18
——
9.28
8.48
8.03
8.32
9.00
8.89
8.61
9.51
10.4
4–1
0.34
25.4
8
Note
: SE
S = s
oci
oec
onom
ic s
tatu
s. H
ispan
ic e
thnic
ity w
as m
easu
red in M
tF in 2
005
and lat
er o
nly
. N
s ar
e not gi
ven for
the
suic
ide
rate
s as
they
are
bas
ed o
n a
com
ple
te s
ample
of th
e popula
tion.
Per
centa
ge c
han
ge c
alcu
late
d u
sing
the
form
ula
: per
centa
ge1
– per
centa
ge2
/ per
centa
ge1,
or
rate
1 –
rate
2 /
rate
1. T
his
cap
ture
s th
e per
centa
ge incr
ease
in the
num
ber
of peo
ple
affec
ted.
Tab
le 1
. (C
ontinued
)

Suicide and Increased New Media Screen Time 9
Table 2. Correlations Between Screen and Nonscreen Activities and Depressive Symptoms (8th and 10th Graders, MtF) and SuicideRelated Outcomes (9–12th Graders, YRBSS), 2009–2015
Bivariate r
Controlled for sex, race, SES, grade, and region
Controlled for sex, race, SES,
grade, and region and inperson
social interaction
Girls (controlled for race,
SES, grade, and region)
Boys (controlled
for race, SES, grade, and
region)
MtF (correlations with depressive symptoms)
Screen activities Social media use .05* .03* .06* .06* .01TV viewing .04* .02* .03* .03* .02*Internet news use .00 .00 .01* .01 –.02Nonscreen activities Inperson social interaction –.07* –.08* –.09* –.08* –.09*Religious services attendance –.15* –.14* –.14* –.16* –.13*Sports or exercise –.22* –.19* –.18* –.20* –.19*Homework hours –.06* –.05* –.06* –.06* –.04*Print media use –.11* –.10* –.09* –.12* –.08*Having a paid job .00 .01 .02* –.01 .02*YRBSS (correlations with suicide-related outcomes)
Screen activities Electronic device use .12* .13* — .14* .12*TV viewing .03* .02* — .02 .03*Nonscreen activities Exercise –.12* –.08* — –.08* –.08*
Note: YRBSS items are not controlled for SES, region, or inperson interaction as these factors were not reported in the dataset. Religious service attendance is not controlled for region as this item was not asked in California. In the third column, inperson social interaction is instead controlled for social media use. MtF analyses include only 8th and 10th graders because the depressive symptoms and social media items were not asked of the same participants on the 12th grade survey.*p < .001.
here corresponds to d = .054 per year, an unusual amount of change for a short period of time. On average, birth cohort shifts are around d = .015 to d = .02 per year in national samples (Twenge & Foster, 2010). Thus, this yearly rate of change is more than twice as large as many previously identified birth cohort differences.
Correlations with screen and nonscreen activities
Next, we examined possible causes of the increase in depressive symptoms and suiciderelated outcomes among adolescents. First, we examined links between depressive symptoms/suiciderelated outcomes and an array of adolescent activities. Adolescents who spent more time on screen activities were significantly more likely to have high depressive symptoms or have at least one suiciderelated outcome, and those who spent more time on nonscreen activities were less likely. These nonscreen activities included print media, suggesting that only some types of media use (e.g., screens) were associated with higher risk. Time spent on homework was negatively correlated with depressive symptoms. The correlations were similar when controlled for
sex, race, grade, SES, and region (see Table 2). The correlations between mental health and new media screen activities were higher among girls than among boys; for example, social media use was significantly correlated with depressive symptoms among girls, r(37,830) = .06, p < .001, but not among boys, r(36,291) = .01, p = .08 (with demographic controls). When examined individually, the four suiciderelated outcomes were all significantly correlated with electronic device use: feeling sad or hopeless, r(59,115) = .11, p < .001; seriously considering suicide, r(59,102) = .10, p < .001; making a suicide plan, r(58,805) = .09, p < .001; and making a suicide attempt, r(53,602) = .07, p < .001.
Overall, the results show a clear pattern linking screen activities with higher levels of depressive symptoms/suiciderelated outcomes and nonscreen activities with lower levels. All activities associated with higher depressive symptoms or suiciderelated outcomes involved screens, and all activities associated with lower depressive symptoms or suiciderelated outcomes did not involve screens (see Fig. S2 in the Supplemental Material). In terms of relative risk, adolescents using electronic devices 3 or more hours a day were 34% more likely to have at least one suiciderelated outcome

10 Twenge et al.
than those using devices 2 or fewer hours a day, and adolescents using social media sites every day were 13% more likely to report high levels of depressive symptoms than those using social media less often.
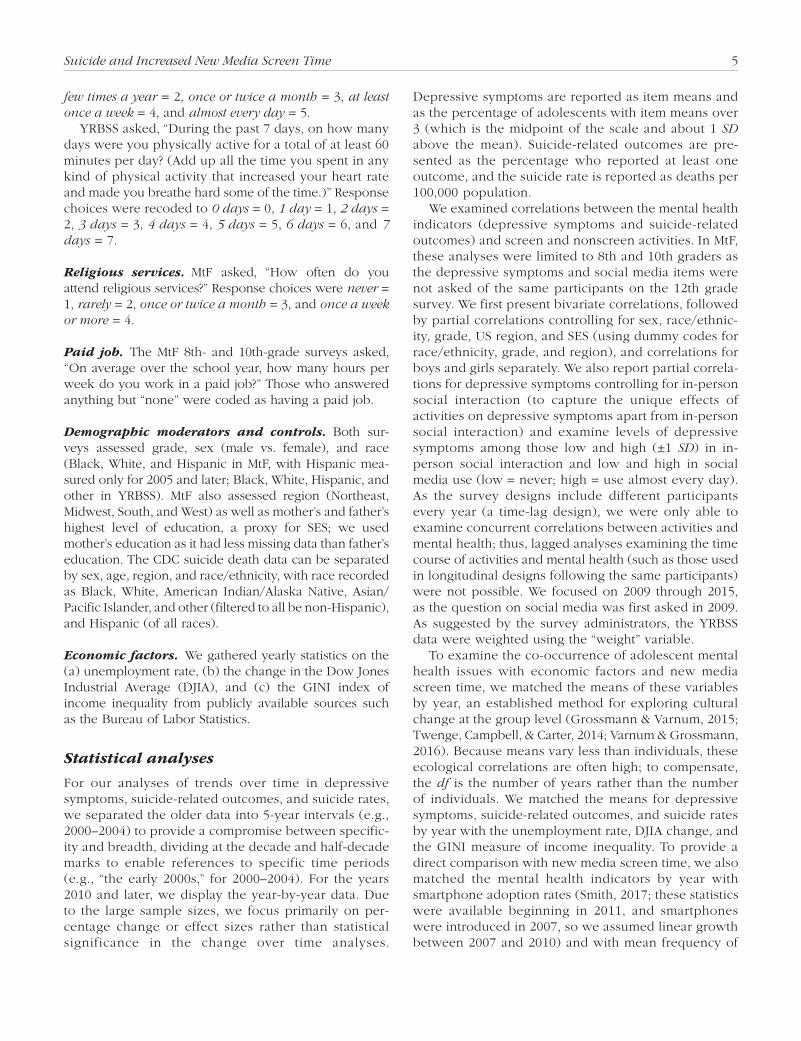
Electronic device use showed a clear exposureresponse relationship with having at least one suicide risk factor, in both bivariate analyses and those including demographic controls (see Fig. 2). Risks became elevated after 2 hours or more a day of electronic device use, when 33% of adolescents had at least one suiciderelated outcome, compared to 29% of those using electronic devices 1 hour a day. Among those who used electronic devices 5 or more hours a day, 48% had at least one suiciderelated outcome. Thus, adolescents using devices 5 or more hours a day (vs. 1 hour) were 66% more likely to have at least one suiciderelated outcome.
Because social media is a social activity, we also examined its links to inperson social interaction and their interaction in predicting depressive symptoms. Likely due to individual differences in sociability, adolescents who spent more time interacting with friends in person also spent more time on social media, r(110,603) = .27, p < .001 (with demographic controls included). Inperson social interaction was the only nonscreen activity correlated > .20 with social media use,3 creating the possibility of additive or suppressive effects. Thus, the third column in Table 2 reports correlations between activities and depressive symptoms
controlled for inperson social interaction (as well as the demographic controls). The correlation between depressive symptoms and social media use increases to r(75,371) = .06, p < .001, when inperson social interaction is controlled—with r(37,829) = .08, p < .001 for girls, and r(36,290) = .04, p < .001 for boys. In a regression equation including social media use, inperson social interaction, and their crossproduct to predict depressive symptoms, both social media use (β = .07, p < .001) and inperson social interaction (β = –.09, p < .001) were significant predictors, as was the crossproduct (β = .02, p < .001). Adolescents low in inperson social interaction and high in social media use reported the highest levels of depressive symptoms (see Fig. S3 in the Supplemental Material). Among those low in inperson social interaction, social media use had a significant effect on depressive symptoms, F(1, 8,906) = 165.41, p < 001, but among those high in inperson social interaction, social media did not have a significant effect, F(1, 12,078) = 2.16, p = .14.
Over the same time period that depressive symptoms and suiciderelated outcomes increased, screen activities such as electronic device use, social media use, and reading Internet news increased and nonscreen activities decreased (see Table S1 and Fig. S4 in the Supplemental Material). Thus, the only activities that both (a) predicted higher depressive symptoms or suiciderelated outcomes and (b) increased at d ≥ .05
25
30
35
40
45
50
% W
ith a
t Lea
st O
ne S
uici
de R
isk
Fact
or
Hours a Day Electronic Device Use, 2009–2015
Bivariate
With Controls
None
< 1
hou
r
1 ho
ur
2 ho
urs
3 ho
urs
4 ho
urs
5 +
hou
rs
Fig. 2. Exposureresponse relationship between electronic device use and having at least one suiciderelated outcome, bivariate and with demographic controls for race, sex, and grade, 9–12th graders, Youth Risk Behavior Surveillance Survey (YRBSS), 2009–2015.

Suicide and Increased New Media Screen Time 11
since 2011/2012 are electronic device use, social media use, and reading Internet news. The only activities that (a) predicted lower depressive symptoms and (b) decreased at d ≥ .05 since 2011/2012 are inperson social interaction, print media use, sports/exercise, and religious service attendance. Thus, the increases in new media screen activities and the decreases in nonscreen activities may explain why depression and suicide increased among U.S. adolescents since 2010: Teens have spent more time on activities associated with increased risk of mental health issues and less time on activities associated with decreased risk of mental health issues.
Economic factors and new media by year
Next, we considered whether economic factors might be possible mechanisms for the increase in mental health issues. The most data were available for depressive symptoms, which were collected every year since 1991. When matched by year, depressive symptoms (among 8th, 10th, and 12th graders) were not significantly correlated with any of the economic factors, including unemployment, r(25) = –.12, p = .57; Dow Jones Index change, r(25) = .22, p = .30; or the GINI index of income inequality, r(25) = –.10, p = .64. Suiciderelated outcomes were negatively related to the unemployment rate, r(9) = –.67, p = .05, but were not significantly correlated with Dow Jones Index change, r(9) = –.08, p = .84, or the GINI index of income inequality, r(9) = –.11, p = .79. Suicide rates were not significantly correlated with unemployment, r(17) = .15, p = .57, or Dow Jones Index change, r(17) = .08, p = .76, but were significantly correlated with the GINI index of income inequality, r(17) = .69, p = .002. Thus, the mental health indicators were mostly unconnected to cyclical economic factors, although suiciderelated outcomes were higher when unemployment was lower, in direct opposition to the idea that economic hardship might be connected to more mental health issues. In contrast, the indicators of poor mental health rose in tandem with smartphone adoption: for depressive symptoms, r(9) = .87, p = .002; for suiciderelated outcomes, r(5) = .78, p =. 12; and for suicide rates, r(9) = .97, p < .001. The mental health indicators were also linked to mean frequency of social media use when matched by year: for depressive symptoms, r(7) = .87, p = .01; for suiciderelated outcomes, r(4) = .97, p = .03; and for suicide rates, r(7) = .96, p < .001.
Discussion
After declining or staying stable for several decades, depressive symptoms, suiciderelated outcomes, and
suicide deaths became more prevalent among American adolescents between 2010 and 2015, especially among females. Thus, in these nationally representative samples, iGen adolescents reported experiencing more mental health issues than Millennial and GenX adolescents did at the same age, and more committed suicide. For the most part, the increases in mental health issues appeared across groups regardless of race/ethnicity, SES, region, and age/grade. Since 2010, adolescents spent more time on social media and electronic devices, activities positively correlated with depressive symptoms and suiciderelated outcomes. Over the same years, adolescents spent less time on nonscreen activities such as inperson social interaction, print media, sports/exercise, and attending religious services, activities negatively correlated with depressive symptoms. If the rise in screen time caused the declines in nonscreen activities, new media screen time may be both directly and indirectly responsible for the increase in depressive symptoms and suiciderelated outcomes. Thus, the rise in caseloads at high school and university counseling centers may be caused by greater numbers of iGen adolescents experiencing mental health issues, perhaps due to the profound shifts in how adolescents spend their leisure time. Thus, new media screen time should be understood as an important modern risk factor for depression and suicide.
The rise in depressive symptoms and suiciderelated outcomes was exclusive to females. This suggests that screen time, perhaps especially social media, may have larger effects on adolescent girls’ mental health than on boys’ (and that is indeed what we found, with social media significantly correlated with depressive symptoms only among girls in some analyses and stronger correlations in others). The pattern for males, with increases in suicide deaths but not in depressive symptoms or suiciderelated outcomes, suggests that boys’ suicide deaths may be driven by other disorders and risk factors not assessed here (cf. Joiner, BuchmanSchmitt, & Chu, 2017).
Some have speculated that academic pressure and increased homework loads may be making students vulnerable to stress (Galloway et al., 2013; Neighmond, 2013) and thus at higher risk for developing mental health issues. However, adolescents who spent more time on homework had lower depressive symptoms, in effect ruling homework out as a possible direct cause. In addition, homework time declined slightly from 2012 through 2015, when depressive symptoms increased. Television watching was positively correlated with depressive symptoms and suiciderelated outcomes but decreased since 2010 and thus is unlikely to be a current driving cause.
Indicators of economic recession (high unemployment and negative Dow Jones Index change) were not positively correlated with depressive symptoms,

12 Twenge et al.
suiciderelated outcomes, or suicide deaths when matched by year (in contrast to smartphone adoption and social media use, which were positively correlated with mental health indicators when matched by year). The only significant correlation for economic factors went in the other direction, with higher suiciderelated outcomes when unemployment was lower. This pattern likely occurred because these economic indicators bottomed out in 2007 through 2009 (the years of the Great Recession), whereas mental health issues did not begin to increase until after 2011, when the U.S. economy was improving. It is possible that economic hardship may have a delayed effect on adolescent mental health, in which effects do not appear until several years later. In this case, that would mean a delay of approximately 4 years (from 2008 to 2012) between the financial crisis and the increase in mental health issues among adolescents. It is possible that economic factors affect adults first and then take several years to affect adolescents. Perhaps future research will more precisely model delay times between these two variables and discover if they differ this much for adult versus adolescent populations. Finally, there is some evidence that income inequality is related to the rise in mental health issues, particularly suicide; this is consistent with previous research finding links between income inequality and lower happiness (Oishi et al., 2011).
The timing of the uptick in mental health issues, beginning around 2011–2012, is also worth noting. Smartphones were used by about half of Americans by late 2012. By 2015, 92% of teens and young adults owned a smartphone (Smith, 2017). Thus, smartphones were used by the majority of teens the year that depressive symptoms began to increase and by nearly all teens when depressive symptoms peaked. Another study found that major depressive episodes among teens ages 12 to 17 increased beginning in 2011 (Mojtabai et al., 2016). Although screen time was increasing and nonscreen activity time was decreasing for several years before 2011, the mental health effects of the shifts in adolescents’ time use seems to have reached a tipping point around 2011–2012.
Screen time does not seem to displace inperson social interaction among individuals, likely due to individual differences in sociability. However, screen time does seem to have displaced inperson social interaction and other nonscreen activities on average over time, perhaps leading to the increase in mental health issues. Adolescents low in inperson social interaction and high in social media use reported the highest levels of depressive symptoms, suggesting this group is the most in need of intervention.
Of course, without experimental evidence, we cannot be certain that the increase in new media screen
time is the cause of the increase in mental health issues after 2011. It is possible, for example, that mental health issues increased for some other unknown reason and depressed teens were more likely to spend time on screens. However, three previous studies provide evidence that screen time, particularly social media use, may cause depressed mood rather than vice versa, at least among adults. One study using a longitudinal daily diary method found that the more participants used Facebook, the more negative mood they later felt. In contrast, negative mood did not lead to more Facebook use (Kross et al., 2013). Second, an experiment randomly assigned adults to either continue their usual Facebook use or to give up Facebook use for a week. Those who gave up Facebook reported fewer depressive symptoms at the end of the week than those still using Facebook, suggesting that Facebook use causes higher depressive symptoms (Tromholt, 2016). A third study using three longitudinal assessments each a year apart found that Facebook use lowered psychological wellbeing among adults but inperson social interaction increased it (Shakya & Christakis, 2017). These studies suggest that at least some of the causal arrow points from social media use to mental health issues. In addition, a wellcharacterized and empirically validated treatment for depression involves the routinization of the nonscreen activities examined here (e.g., inperson social interaction, exercise, and attending of communal events like religious services; e.g., Cuijpers, van Straten, & Warmerdam, 2007).
The current study has other strengths and limitations worth noting. The use of nationally representative samples suggests that the results should generalize to the population of 13 to 18yearolds in the United States. However, we cannot know if these trends are similar among adolescents in other countries. The measures of depressive symptoms and suiciderelated outcomes are based on selfreport and thus carry the usual limitations of that method. However, previous research suggests that changes in socially desirable responding do not explain trends in reports of mood disorder symptoms (Twenge et al., 2010). However, the measure of suiciderelated outcomes may be subject to more underreporting, with nonresponders more likely to have suicide risk factors (Podlogar et al., 2016). That may be one reason why the rise in suiciderelated outcomes was smaller than that for depressive symptoms. However, suicide death rates, which are not subject to reporting biases, showed roughly the same magnitude of change as depressive symptoms, suggesting that the rise is not due to reporting bias.
The time use items in these surveys also have limitations. First, they are retrospective, asking participants to reflect on past activities, rather than contemporaneous timediary studies, the gold standard in time use

Suicide and Increased New Media Screen Time 13
research. Fortunately, comparisons of survey responses and experience sampling in the same individuals find that survey estimates are consistent with experience sampling results, especially for regularly occurring activities (Sonnenberg, Bettina, Michaela, Cornelia, & Wagner, 2012). The social media item here is especially limited given its use of broad categories such as “almost every day,” especially given that a sizable majority of adolescents now use social media every day. Nevertheless, it produces similar, though smaller, correlations than the electronic device item, which was instead asked in terms of hours per day. Finally, we do not know if adolescents who are depressed display more recall bias about their activities.
Another measurementrelated limitation is that the syndromal coverage of the depressive symptoms measure used here was incomplete. Although symptoms like anhedonia and low selfesteem were assessed, other key symptoms such as insomnia and anergia were not. Insomnia and/or reduced sleep time may be of particular interest, as previous research has linked screen time to reduced sleep (Hysing et al., 2015) and short sleep duration is a risk factor for depression and suicide (Glozier et al., 2010; Zhai, Zhang, & Zhang, 2015). Future research should explore whether the increase in screen time has led to a decrease in total sleep time, which could in turn be at least partially responsible for the increases in mental health issues.
In conclusion, adolescent mental health issues rose sharply since 2010, especially among females. New media screen time is both associated with mental health issues and increased over this time period. Thus, it seems likely that the concomitant rise of screen time and adolescent depression and suicide is not coincidental.
Notes
1. The generations represented here include GenX (born approximately 1965–1979), Millennials (1980–1994), and iGen (1995–2012). The birth year cutoffs for generations are arbitrary and not necessarily scientific (Twenge, 2014, 2017), so we will use them only to discuss the results and not as groupings for analyses.2. The databases here employ a timelag design (samples of the same age during different years). This design eliminates age effects, but any differences can be due to either birth cohort (year of birth) or time period (year of the survey). A birth cohort effect impacts only those born at a certain time, but a time period effect impacts those of all ages (Campbell, Campbell, Siedor, & Twenge, 2015). We rely on the term birth cohort trends for the sake of brevity, but these effects could also be appearing among adults as well (a time period effect).3. Of the nonscreen activities in MtF, sports/exercise had the second highest correlation with social media use, r(110,603) = .11, p < .001, and was also correlated with inperson social interaction, r(120,227) = .24, p < .001. A regression equation including
social media use, inperson interaction, sports/exercise, and the demographic factors showed significant effects for all three activities on depressive symptoms: for social media use, β = .07, p < .001; for inperson social interaction, β = –.05, p < .001; and for sports/exercise, β = –.19, p < .001. Thus, among these three activities, sports/exercise was the strongest predictor of depressive symptoms. However, sports/exercise changed less between 2012 and 2015 (d = –.07) than inperson social interaction (d = –.18) or social media use (d = .19; see Table S1 in the Supplemental Material), suggesting shifts over the years in all three may have played a role in the increase in depressive symptoms.
References
Anderssen, E. (2013, January 21). Why are today’s teenagers feeling so anxious? The Globe and Mail. Retrieved from https://beta.theglobeandmail.com/life/healthandfitness/health/conditions/whyaretodaysteenagersfeelingsoanxious/article7604612/
Andreassen, C. S., Billieux, J., Griffiths, M. D., Kuss, D. J., Demetrovics, Z., Mazzoni, E., & Pallesen, S. (2016). The relationship between addictive use of social media and video games and symptoms of psychiatric disorders: A largescale crosssectional study. Psychology of Addictive Behaviors, 30, 252–262.
Augner, C., & Hacker, G. W. (2012). Associations between problematic mobile phone use and psychological parameters in young adults. International Journal of Public Health, 57, 437–441.
Badcock, P., Davey, C., Whittle, S., Allen, N., & Friston, K. (2017). The depressed brain: An evolutionary systems theory. Trends in Cognitive Sciences, 21, 182–194.
Baumeister, R. F., & Leary, M. R. (1995). The need to belong: Desire for interpersonal attachments as a fundamental human motivation. Psychological Bulletin, 117, 497–529.
Beiter, R., Nash, R., McCrady, M., Rhoades, D., Linscomb, M., Clarahan, M., & Sammut, S. (2015). The prevalence and correlates of depression, anxiety, and stress in a sample of college students. Journal of Affective Disorders, 17390–17396.
Berman, A. L. (2009). Depression and suicide. In I. H. Gotlib & C. L. Hammen (Eds.), Handbook of depression (2nd ed., pp. 510–530). New York, NY: Guilford.
Brown, S., Stykes, B. L., & Manning, W. (2016). Trends in children’s family instability, 19952010. Journal of Marriage & Family, 78, 1173–1183.
Campbell, W. K., Campbell, S., Siedor, L. E., & Twenge, J. M. (2015). Generational differences are real and useful. Industrial and Organizational Psychology: Perspectives on Science and Practice, 8, 324–331.
Center for Collegiate Mental Health. (2015). 2015 annual report, Pennsylvania State University. Retrieved from https://sites.psu.edu/ccmh/files/2016/01/2015_CCMH_Report_1182015.pdf
Centers for Disease Control. (2016). Youth Risk Behavior Surveillance System (YRBSS). Division of Adolescent and School Health. Retrieved from https://www.cdc.gov/healthyyouth/data/yrbs/index.htm

14 Twenge et al.
Centers for Disease Control. (2017). WISQARS fatal injury reports, national and regional, 1999–2015. National Center for Injury Prevention and Control. Retrieved from https://webappa.cdc.gov/sasweb/ncipc/mortrate10_us.html
Centers for Disease Control and Prevention (2017). Suicide and self-inflicted injury. Fast Stats. Retrieved from https://www.cdc.gov/nchs/fastats/suicide.htm
Chu, C., BuchmanSchmitt, J., Stanley, I., Hom, M., Tucker, R., Hagan, C., . . . Joiner, T. (2017). The Interpersonal Theory of Suicide: A systematic review and meta-analysis of a decade of cross-national research. Manuscript under editorial review.
Collishaw, S. (2014). Annual research review: Secular trends in child and adolescent mental health. Journal of Child Psychology and Psychiatry, 56, 370–393.
Collishaw, S., Maughan, B., Goodman, R., & Pickles, A. (2004). Time trends in adolescent mental health. Journal of Child Psychology and Psychiatry, 45, 1350–1362.
Collishaw, S., Maughan, B., Natarajan, L., & Pickles, A. (2010). Trends in adolescent emotional problems in England: A comparison of two national cohorts twenty years apart. Journal of Child Psychology and Psychiatry, 51, 885–894.
Costello, J. E., Erkanli, A., & Angold, A. (2006). Is there an epidemic of child or adolescent depression? Journal of Child Psychology and Psychiatry, 47, 1263–1271.
Cuijpers, P., van Straten, A., & Warmerdam, L. (2007). Behavioral activation treatments for depression: A metaanalysis. Clinical Psychology Review, 27, 318–326.
Cummins, D. (2016, August 29). What’s making students ‘less resilient’? PBS Newshour. Retrieved from http://www.pbs .org/newshour/makingsense/studentresiliencetimelow/
Curtin, S. C., Warner, M., & Hedegaard, H. (2016). Increase in suicide in the United States, 19992014. NCHS Data Brief, 241. Hyattsville, MD: National Center for Health Statistics.
Deters, F. G., & Mehl, M. R. (2013). Does posting Facebook status updates increase or decrease loneliness? An online social networking experiment. Social Psychological and Personality Science, 4, 579–586.
Dienlin, T., Masur, P. K., & Trepte, S. (2017). Reinforcement or displacement? The reciprocity of FtF, IM, and SNS communication and their effects on loneliness and life satisfaction. Journal of Computer-Mediated Communication, 22, 71–87.
Galloway, M., Conner, J., & Pope, D. (2013). Nonacademic effects of homework in privileged, highperforming high schools. Journal of Experimental Education, 81, 490–510.
Glowinski, A. L., & D’Amelio, G. (2016). Depression is a deadly growing threat to our youth: Time to rally. Pediatrics, 138(6), 2869.
Glozier, N., Martiniuk, A., Patton, G., Ivers, R., Li, Q., Hickie, I., Senserrick, T., Woodward, M., Norton, R., & Stevenson, M. (2010). Short sleep duration in prevalent and persistent psychological distress in young adults: The DRIVE study. Sleep, 33, 1139–1145.
Grossmann, I., & Varnum, M. W. (2015). Social structure, infectious diseases, disasters, secularism, and cultural change in America. Psychological Science, 26, 311–324.
Huang, C. (2017). Time spent on social network sites and psychological wellbeing: A metaanalysis. Cyberpsychology, Behavior, and Social Networking, 20(6), 346–354.
Hysing, M., Pallesen, S., Stormark, K. M., Jakobsen, R., Lundervold, A. J., & Sivertsen, B. (2015). Sleep and use of electronic devices in adolescence: Results from a large populationbased study. BMJ Open, 5(1), e006748.
Johnston, L. D., Bachman, J. G., O’Malley, P. M., Schulenberg, J. E., & Miech, R. A. (2016). Monitoring the Future: A continuing study of American youth (8th- and 10th-Grade Surveys), 2015 (ICPSR36407). Ann Arbor: Institute for Social Research, The University of Michigan.
Joiner, T. E. (2005). Why people die by suicide. Cambridge, MA: Harvard University Press.
Joiner, T. E., BuchmanSchmitt, J., & Chu, C. (2017). Do undiagnosed suicide decedents have symptoms of a mental disorder? Journal of Clinical Psychology. Advance online publication. doi:10.1002/jclp.22498
Klerman, G. L., & Weissman, M. M. (1989). Increasing rates of depression. Journal of the American Medical Association, 261, 2229–2235.
Kross, E., Verduyn, P., Demiralp, E., Park, J., Lee, D. S., Lin, N., . . . Ybarra, O. (2013). Facebook use predicts declines in subjective wellbeing in young adults. PLOS One, 8, e69841. doi:10.1371/journal.pone.0069841
Lieberman, M. (2013). Social: Why our brains are hardwired to connect. New York, NY: Crown.
McCabe, S. E., West, B. T., Veliz, P., McCabe, V. V., Stoddard, S. A., & Boyd, C. J. (2017). Trends in medical and nonmedical use of prescription opioids among U.S. adolescents: 1976–2015. Pediatrics, 139, e2016–e2387.
Mojtabai, R., Olfson, M., & Han, B. (2016). National trends in the prevalence and treatment of depression in adolescents and young adults. Pediatrics, 138(6).
Neighmond, P. (2013, December 2). School stress takes a toll on health, teens and parents say. Shots: Health News from National Public Radio. Retrieved from http://www.npr .org/sections/healthshots/2013/12/02/246599742/schoolstresstakesatollonhealthteensandparentssay
New, J. (2017, January 13). Balancing response and treatment. Inside Higher Ed. Retrieved from https://www .insidehighered.com/news/2017/01/13/collegesstruggle provideongoingtreatmentdemandsmentalhealth servicesincreases
Newcomb, M. D., Huba, G. J., & Bentler, P. M. (1981). A multidimensional assessment of stressful life events among adolescents: Derivation and correlates. Journal of Health and Social Behavior, 22, 400–415.
Noguchi, S. (2014, February 5). Teen health: Depression, anxiety and social phobias rising in kids, educators say. San Jose Mercury News. Retrieved from http://www .mercurynews.com/2014/02/05/teenhealthdepressionanxietyandsocialphobiasrisinginkidseducatorssay/
Novotney, A. (2014, September). Students under pressure: College and university counseling centers are examining how best to serve the growing number of students seeking their services. APA Monitor. Retrieved from http://www.apa.org/monitor/2014/09/coverpressure.aspx
Ogden, C. L., Carroll, M. D., Lawman, H. G., Fryar, C. D., KruszonMoran, D., Kit, B. K., & Flegal, K. M. (2016). Trends in obesity prevalence among children and adolescents in the United States, 19881994 through 20132014.

Suicide and Increased New Media Screen Time 15
JAMA: Journal of the American Medical Association, 315, 2292–2299.
Oh, H. J., Ozkaya, E., & LaRose, R. (2014). How does online social networking enhance life satisfaction? The relationships among online supportive interaction, affect, perceived social support, sense of community, and life satisfaction. Computers in Human Behavior, 30, 69–78.
Oishi, S., Kesebir, S., & Diener, E. (2011). Income inequality and happiness. Psychological Science, 22, 1095–1100.
Podlogar, M. C., Rogers, M. L., Chiurliza, B., Hom, M. A., Tzoneva, M., & Joiner, T. E. (2016). Who are we missing? Nondisclosure in online suicide risk screening questionnaires. Psychological Assessment, 28, 963–974.
Shakya, H. B., & Christakis, N. A. (2017). Association of Facebook use with compromised wellbeing: A longitudinal study. American Journal of Epidemiology, 185(3), 203–211.
Sherman, L. E., Minas, M., & Greenfield, P. M. (2013). The effects of text, audio, video, and inperson communication on bonding between friends. Cyberpsychology: Journal of Psychosocial Research on Cyberspace, 7(2), article 3.
Smith, A. (2017, January 12). Record shares of Americans now own smartphones, have home broadband. Pew Research Center. Retrieved from http://www.pewresearch.org/facttank/2017/01/12/evolutionoftechnology/
Song, H., Hayeon, S., Anne, Z. S., Jinyoung, K., Adam, D., Angela, V., . . . Mike, A. (2014). Does Facebook make you lonely? A meta analysis. Computers in Human Behavior, 36, 446–452.
Sonnenberg, B., Bettina, S., Michaela, R., Cornelia, W., & Wagner, G. G. (2012). Measuring time use in surveys—How valid are time use questions in surveys? Concordance of survey and experience sampling measures. SSRN Electronic Journal. http://doi.org/10.2139/ssrn.1895307
Tromholt, M. (2016). The Facebook experiment: Quitting Facebook leads to higher levels of wellbeing. Cyberpsychology, Behavior, and Social Networking, 19, 661–666.
Twenge, J. M. (2011). Generational differences in mental health: Are children and adolescents suffering more, or less? American Journal of Orthopsychiatry, 81, 469–472.
Twenge, J. M. (2014). Generation me: Why today’s young Americans are more confident, assertive, entitled–and
more miserable than ever before (2nd ed.). New York, NY: Atria Books.
Twenge, J. M. (2017). iGen: Why today’s super-connected kids are growing up less rebellious, more tolerant, less happy – and completely unprepared for adulthood. New York, NY: Atria Books.
Twenge, J. M., Campbell, W. K., & Carter, N. T. (2014). Declines in trust in others and confidence in institutions among American adults and late adolescents, 19722012. Psychological Science, 25, 1914–1923.
Twenge, J. M., Gentile, B., DeWall, C. N., Ma, D. S., Lacefield, K., & Schurtz, D. R. (2010). Birth cohort increases in psychopathology among young Americans, 19382007: A crosstemporal metaanalysis of the MMPI. Clinical Psychology Review, 30, 145–154.
Twenge, J. M., & Foster, J. D. (2010). Birth cohort increases in narcissistic personality traits among American college students, 19822009. Social Psychological and Personality Science, 1, 99–106.
Twenge, J. M., & Uhls, Y. T. (2017). Less in-person social interaction among U.S. adolescents in the 21st century and links to loneliness. Submitted for publication.
Valkenburg, P. M., & Peter, J. (2007). Internet communication and its relation to wellbeing: Identifying some underlying mechanisms. Media Psychology, 9, 43–58.
Valkenburg, P. M., Peter, J., & Schouten, A. P. (2006). Friend networking sites and their relationship to adolescents’ wellbeing and social selfesteem. Cyberpsychology & Behavior, 9, 584–590.
Van Orden, K. A., Witte, T. K., Cukrowicz, K. C., Braithwaite, S. R., Selby, E. A., & Joiner, T. J. (2010). The interpersonal theory of suicide. Psychological Review, 117(2), 575–600.
Varnum, M. E. W., & Grossmann, I. (2016). Pathogen prevalence is associated with cultural changes in gender equality. Nature Human Behavior, 1(1), 0003. doi:10.1038/s415620160003
Zhai, H., Chen, L., Yang, Y., Sun, H., Pan, H., He, J., & He, C. (2016). Family and college environmental exposures mediate the relationship between parental education and depression among college students. PLOS One, 11(3), e0151759. doi:10.1371/journal.pone.0151759
Zhai, L., Zhang, H., & Zhang, D. (2015). Sleep duration and depression among adults: A metaanalysis of prospective studies. Depression and Anxiety, 32, 664–670.