Embed Size (px)
Citation preview
Journal of Microwaves, Optoelectronics and Electromagnetic Applications, Vol. 16, No. 4, December 2017 DOI: http://dx.doi.org/10.1590/2179-10742017v16i41087
Brazilian Microwave and Optoelectronics Society-SBMO received 18 Aug 2017; for review 19 Aug 2017; accepted 16 Oct 2017
Brazilian Society of Electromagnetism-SBMag © 2017 SBMO/SBMag ISSN 2179-1074
954
Abstract— Microwave irradiations from vegetation canopy are
strongly influenced by its dielectric properties and give useful
information for microwave remote sensing -interpretation and
applications. This paper reports on the laboratory measurements of
dielectric properties of corn vegetation at C-Band frequency. Von
Hipple method is used to measure complex dielectric properties
using automated C-Band microwave bench set up. The least square
fitting technique is used to calculate dielectric constant (ε'),
dielectric loss (ε'') and errors in their measurements. The
measured data is compared with Debye-Cole Dual Dispersion
model. Emissivity and radiometric brightness temperature are
theoretically estimated from measured dielectric properties at
different angles of incidence for dry and moist corn leaves using
Fresnel equations.
Index Terms— Corn leaves, dielectric constant, microwave remote
sensing, Von Hipple method
I. INTRODUCTION
Vegetation dielectric properties play key role in microwave remote sensing (MWRS) interpretation
and applications. The dielectric property of vegetation canopy is important factor that determines the
interaction of canopy with electromagnetic waves, affects microwave (MW) emission and scattering.
The complex dielectric property is the ability of material to absorb, reflects and transmits the
electromagnetic energy incident and is a measure of electric conductivity. It is ability of material to
polarize under the influence of electric field. The complex dielectric property consists of real
dielectric constant and imaginary dielectric loss and both are related by following equation number 1.
Microwave Measurements of Dielectric
Properties of Corn Vegetation at C-Band and
Comparison with Debye- Cole Dual
Dispersion Model
Ashish B. Itolikara, M.L. Kurtadikar
b
aApplied Science Department, Jawaharlal Nehru Engineering College, Aurangabad (MS), India
bP.G. Department of Physics, Faculty of Science, J.E.S. College, Jalna (MS), India
*Correspondence: [email protected]

Journal of Microwaves, Optoelectronics and Electromagnetic Applications, Vol. 16, No. 4, December 2017 DOI: http://dx.doi.org/10.1590/2179-10742017v16i41087
Brazilian Microwave and Optoelectronics Society-SBMO received 18 Aug 2017; for review 19 Aug 2017; accepted 16 Oct 2017
Brazilian Society of Electromagnetism-SBMag © 2017 SBMO/SBMag ISSN 2179-1074
955
ϵ∗ = ϵ′ − jϵ′′ (1)
Where
ϵ' – Dielectric constant (real part)
ϵ’’ – Dielectric loss (imaginary part)
The dielectric properties of vegetation are depend on temperature and salinity dominantly on
water content [1].The complex dielectric property of vegetation is combined effect of vegetation
constituents i.e. leaves, branch, stem and fruits. Most of the covered part of canopy is leaf. In present
work, the laboratory measurement of the complex dielectric properties were conducted for corn leaves
at C –Band (in this case 5 GHz) frequency, at room temperature (270C).
Corn leaves are isohydric in nature (water potential of leaves does not fluctuate during day
regardless of soil water status) [2]. The leaf is heterogeneous medium consists of water, bulk organic
matter and air spaces. But water in fresh leaf is major (80- 90%) constituent and also important for
overall growth of the plant [3]. Therefore the dielectric properties of the leaves are mainly driven by
water content. These facts motivate to conduct the dielectric measurements of corn leaves as a
function of moisture content.
In this paper laboratory dielectric measurements were performed for freshly cut corn leaves
(containing natural moisture) and of different moisture content (due to natural evaporation over time)
including dry (oven dried 0% moisture).This study provides relationship between dielectric property
and physical characteristics like moisture of vegetation leaves. The measured data of dielectric
constant and loss is compared by Debye-Cole Dual dispersion model constructed on by Ulaby and El-
Rayes, (1987) [4]. The laboratory validation of dielectric properties is also important for data
pertaining to MWRS [5]. Further radiometric emissivity and brightness temperature are estimated
from measured dielectric properties at a different angle of incidence for the moist and dry corn leaves
by using Fresnel’s equations. This data is useful for passive remote sensing of vegetation.
Such type of work was insisted by Indian Space Research Organization (ISRO) in anticipation
of launching of MWRS Satellite at C-Band frequency. Dielectric properties of the soil [6], sea water
[7] and vegetation like Algae-Aquatic Vegetation [8] were studied and reported by MW group of this
laboratory by using the same method and the same C-Band microwave bench set up provided by

Journal of Microwaves, Optoelectronics and Electromagnetic Applications, Vol. 16, No. 4, December 2017 DOI: http://dx.doi.org/10.1590/2179-10742017v16i41087
Brazilian Microwave and Optoelectronics Society-SBMO received 18 Aug 2017; for review 19 Aug 2017; accepted 16 Oct 2017
Brazilian Society of Electromagnetism-SBMag © 2017 SBMO/SBMag ISSN 2179-1074
956
Indian Space Research Organization (ISRO) under a research project to the PI, (M. L. Kurtadikar) and
is used for present work as well.
II. MATERIALS AND METHOD
A. Fabrication of sample cell for vegetation leaves
A solid dielectric cell with a movable reflector for compaction of vegetation leaves was fabricated. It
consists of a movable rectangular reflector that is fitted on the rear end of the waveguide cell. The
dimensions of the reflector are just smaller than that of the inner dimensions of the wave guide so that
it can easily slide inside the wave guide cell. A long screw is connected to the rear side of the solid
reflector and is externally connected to a micrometer screw gauge. By rotating the micrometer screw
gauge, the thickness of sample inside the cell is measured. Sample is fitted between the reflector and a
mica sheet by giving appropriate rotations to the screw for homogeneity and constant compactness of
each sample inside the cell. These modifications were carried out at a workshop of the government
Industrial Training Institute, Aurangabad (MS), India. The modified sample cell is shown in
Fig.1.This cell is already used to measured dielectric properties of other vegetation sample banana
reported [9].
Fig. 1 Sample cell fabricated for vegetation material
B. Sampling
Leaves of a fresh corn crop were cut from the farm location, 5 kilometres away from Jalna city,
Maharashtra state, India. Leaves were cut from various crops of corn having different height (01.0 to
02.2 m). The measurements were started on the same day to preserve the physical characteristics of
leaves. A freshly cut corn leaf starts shrinking and loses moisture content over a period. To avoid the
loss of moisture, the leaves were covered in a polythene bag and transported to the laboratory. The

Journal of Microwaves, Optoelectronics and Electromagnetic Applications, Vol. 16, No. 4, December 2017 DOI: http://dx.doi.org/10.1590/2179-10742017v16i41087
Brazilian Microwave and Optoelectronics Society-SBMO received 18 Aug 2017; for review 19 Aug 2017; accepted 16 Oct 2017
Brazilian Society of Electromagnetism-SBMag © 2017 SBMO/SBMag ISSN 2179-1074
957
leaves were cut in to the rectangular shapes the size of the cross-section of the waveguide cell.
Bunches of the cut size leaves were inserted in to the waveguide cell with a compactness to achieve
the homogeneity of the material medium. The equal and constant compactness was maintained by
fitting the sampled leaves in the cell between the reflector (rear end of the cell) and the mica window
(front end of the cell). The reflector is movable and can slide inside the cell to push the sample
towards the mica window. Due to time consumption of transportation of sample to laboratory and
sampling, tracing of natural moisture is difficult for laboratory measurements. The natural moisture
mentioned in this paper is inclusion of this barrier. Authors able to trace 82.51% moist corn leaves.
The dielectric measurements were done for freshly cut corn leaves with natural (82.51%), and of
different moisture 73.95%, 56.06%, 16.10% and 00% (oven dry). Then the moisture of leaves is
reduced by the natural evaporation over a period and finally the sample is oven dried at 700 C in oven
for 24 hours. The moisture of the leaves was measured gravimetrically on the weight basis given in
equation 2.
% 𝐌𝐨𝐢𝐬𝐭𝐮𝐫𝐞 𝐜𝐨𝐧𝐭𝐞𝐧𝐭 = 𝐖𝐬−𝐖𝐝
𝐖𝐬× 𝟏𝟎𝟎 (2)
Where,
Ws- Weight of sample
Wd-weight of dry sample
C. Experimental set up
There are a several methods of the dielectric measurement [10]. The dielectric of corn leaves was
measured using Von Hipple method [11]. It has good accuracy agreement and is easy too. The block
diagram of the setup is shown in Fig. 2. It consists of a low power microwave source Varactor Tuned
Oscillator (VTO), isolator, coaxial-waveguide adapter, attenuator, Sliding Screw tuner (SS tuner),
slotted section and modified solid dielectric cell with movable reflector.
MW generated by the VTO is propagated through passive components of rectangular
waveguides into the dielectric cell with a perfect reflector at the closed rear end. The MW source is
tuned to give 5 GHz frequency by applying a tuning voltage of 7 volts. An attenuator is used to keep
the desired power in the waveguide assembly of the bench. A slotted section with a tuneable probe

Journal of Microwaves, Optoelectronics and Electromagnetic Applications, Vol. 16, No. 4, December 2017 DOI: http://dx.doi.org/10.1590/2179-10742017v16i41087
Brazilian Microwave and Optoelectronics Society-SBMO received 18 Aug 2017; for review 19 Aug 2017; accepted 16 Oct 2017
Brazilian Society of Electromagnetism-SBMag © 2017 SBMO/SBMag ISSN 2179-1074
958
containing a 1N23 detector with the square law characteristics has been used to measure power
(current) along the slotted line.
Fig. 2 Block diagram of automated C-Band Microwave bench set up
The detector is connected to a micro ammeter and to the PC to read and record the measured
power. The probe sits on the slot line such that the tip of the tuneable probe is slightly penetrated and
it can be moved forwarded and backward along the slot line section to sense the electromagnetic field
in the wave guide. The bench is tuned to get a symmetrical standing wave pattern in the slot line. The
tuning of the bench is possible by critical adjustments of the probe detector and S.S. Tuner. A
symmetrical standing wave pattern with an empty dielectric cell is obtained. The dielectric sample
under consideration (corn leaves) is inserted in the dielectric cell with a constant compaction (for
homogeneity of the medium). The probe is traversed along the slot line at equal intervals and power
(current) is recorded with respect to the corresponding probe positions. This data is acquired and
stored in a file using a microcontroller interface system. This data makes use of α and β as fitting
parameters, where α = attenuation factor, β = phase shift constant. The data is stored for corn leaves
samples of different thicknesses (in this case for three thicknesses 0.5 cm, 1.0cm and 1.5 cm). The
guided wavelength λg is measured from the minima of the standing wave pattern.
β =2π
λg (3)
The free space wavelength, λ0 is determined using the relation refer equation 4.
1
λ02 =
1
λg2 +
1
λc2
(4)
Journal of Microwaves, Optoelectronics and Electromagnetic Applications, Vol. 16, No. 4, December 2017 DOI: http://dx.doi.org/10.1590/2179-10742017v16i41087
Brazilian Microwave and Optoelectronics Society-SBMO received 18 Aug 2017; for review 19 Aug 2017; accepted 16 Oct 2017
Brazilian Society of Electromagnetism-SBMag © 2017 SBMO/SBMag ISSN 2179-1074
959
Where, λc = 2 × a = 2 × 4.73 = 9.46 cm, ‘a’ being the broader side of the C-band rectangular wave-
guide. The real and imaginary parts of the complex dielectric constant are calculated using the
relations given in equations 5 and 6.
ε′ = λ02 (
1
λc2 +
(α2−β2)
4π2 ) (5)
ε′′ =λ0
2αβ
2π2 (6)
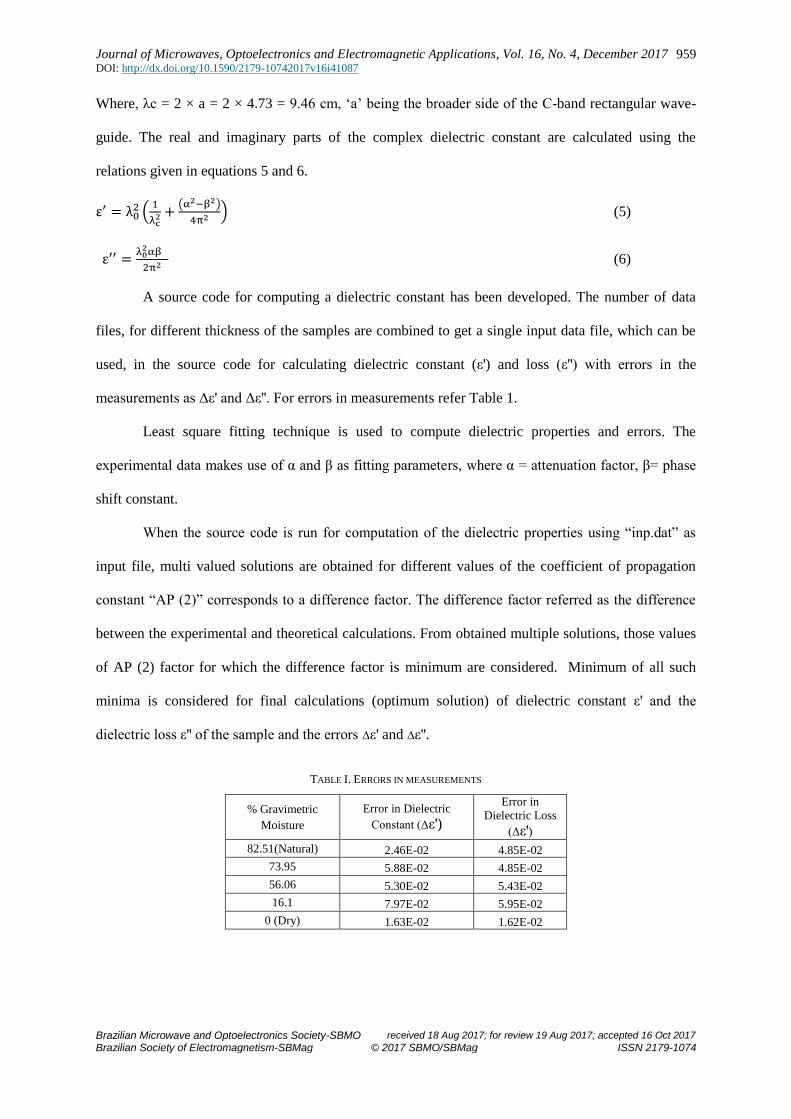
A source code for computing a dielectric constant has been developed. The number of data
files, for different thickness of the samples are combined to get a single input data file, which can be
used, in the source code for calculating dielectric constant (ε') and loss (ε'') with errors in the
measurements as Δε' and Δε''. For errors in measurements refer Table 1.
Least square fitting technique is used to compute dielectric properties and errors. The
experimental data makes use of α and β as fitting parameters, where α = attenuation factor, β= phase
shift constant.
When the source code is run for computation of the dielectric properties using “inp.dat” as
input file, multi valued solutions are obtained for different values of the coefficient of propagation
constant “AP (2)” corresponds to a difference factor. The difference factor referred as the difference
between the experimental and theoretical calculations. From obtained multiple solutions, those values
of AP (2) factor for which the difference factor is minimum are considered. Minimum of all such
minima is considered for final calculations (optimum solution) of dielectric constant ε' and the
dielectric loss ε'' of the sample and the errors Δε' and Δε''.
TABLE I. ERRORS IN MEASUREMENTS
% Gravimetric
Moisture
Error in Dielectric
Constant (Δε')
Error in
Dielectric Loss
(Δε')
82.51(Natural) 2.46E-02 4.85E-02
73.95 5.88E-02 4.85E-02
56.06 5.30E-02 5.43E-02
16.1 7.97E-02 5.95E-02
0 (Dry) 1.63E-02 1.62E-02
Journal of Microwaves, Optoelectronics and Electromagnetic Applications, Vol. 16, No. 4, December 2017 DOI: http://dx.doi.org/10.1590/2179-10742017v16i41087
Brazilian Microwave and Optoelectronics Society-SBMO received 18 Aug 2017; for review 19 Aug 2017; accepted 16 Oct 2017
Brazilian Society of Electromagnetism-SBMag © 2017 SBMO/SBMag ISSN 2179-1074
960
D. Debye Cole Dual Dispersion Model (Ulaby& El-Rays, 1987)
This model is chosen because it has physical basis for formulation. The complex dielectric constant of
leaf is modelled as a simple mixture of three components:
(i) Non dispersive residual component, εs ;
(ii) a free water component vfw εw, where vfw is volume fraction of water and εw the free water
dielectric constant; and
(iii) A bulk vegetation bound water component vb εb, where vb is volume fraction of bulk
vegetation-bound water component and εb its dielectric constant.
ε = ε𝑠 + 𝑣𝑓𝑤ε𝑤 + 𝑣𝑏ε𝑏 (7)
The values of ϵw can be estimated using Debye Equation. Substituting the equation for ϵw and ϵb in
equation7 can be written as.
ε = ε𝑠 + 𝑉𝑓𝑤 [4.9 +73.5
1+𝑗𝑓
19.7
− 𝑗18𝜎
𝑓] + 𝑉𝑏 [2.9 +
55.0
(1+𝑗𝑓
0.18)
0.5] (8)
ε𝑠 = 1.7 − 0.74Mg + 6.16Mg2 (9)
𝑉𝑓𝑤 = 𝑀𝑔(0.55𝑀𝑔 − 0.076) (10)
𝑉𝑏 =4.64𝑀𝑔
2
1+7.36 𝑀𝑔2 (11)
𝜎 = 1.27 (12)
Where,
J2= -1, f- Frequency in GHz, Mg- Gravimetric moisture content and σ- Ionic conductivity.
E. Estimation of Emissivity and Brightness Temperature
From the definition of emissivity can be expressed as given in equation 13
es(p) = (1 − Rs(p)) (13)
Where Rs(p) is the smooth- surface reflectivity. For a homogeneous leaves sample with a smooth
surface, the reflectivity at vertical and horizontal polarizations, RsV and RsH, are given by the Fresnel
expressions given by equations 14 and 15 [12].
RsV = |K cos u−√K−sin2 u
K cos u+√K−sin2 u|
2
(14)
Journal of Microwaves, Optoelectronics and Electromagnetic Applications, Vol. 16, No. 4, December 2017 DOI: http://dx.doi.org/10.1590/2179-10742017v16i41087
Brazilian Microwave and Optoelectronics Society-SBMO received 18 Aug 2017; for review 19 Aug 2017; accepted 16 Oct 2017
Brazilian Society of Electromagnetism-SBMag © 2017 SBMO/SBMag ISSN 2179-1074
961
RsH = | cos u−√K−sin2 u
cos u+√K−sin2 u|2
(15)
Where ‘u’ is the incidence angle and ‘K’ is the absolute value of the dielectric constant of corn leaves,
which is a measure of the response of the leaves to an electromagnetic wave and is largely determined
by moisture content of the leaves. Emissivity of corn leaves for different moisture content, for
different angles of incidence is calculated using Fresnel equations.
Passive microwave remote sensing is based on the measurement of thermal radiation in the
centimetre wave band of the electromagnetic spectrum Tb. This radiation is determined largely by the
physical temperature and the emissivity of the radiating body and can be approximated by using
equation 16.
Tb(p) ≈ es(p)T (16)
Where Tb observed brightness temperature; T physical temperature of the emitting layer; p refers to
vertical or horizontal polarization; es- smooth-surface emissivity.
III. RESULTS AND DISCUSSION
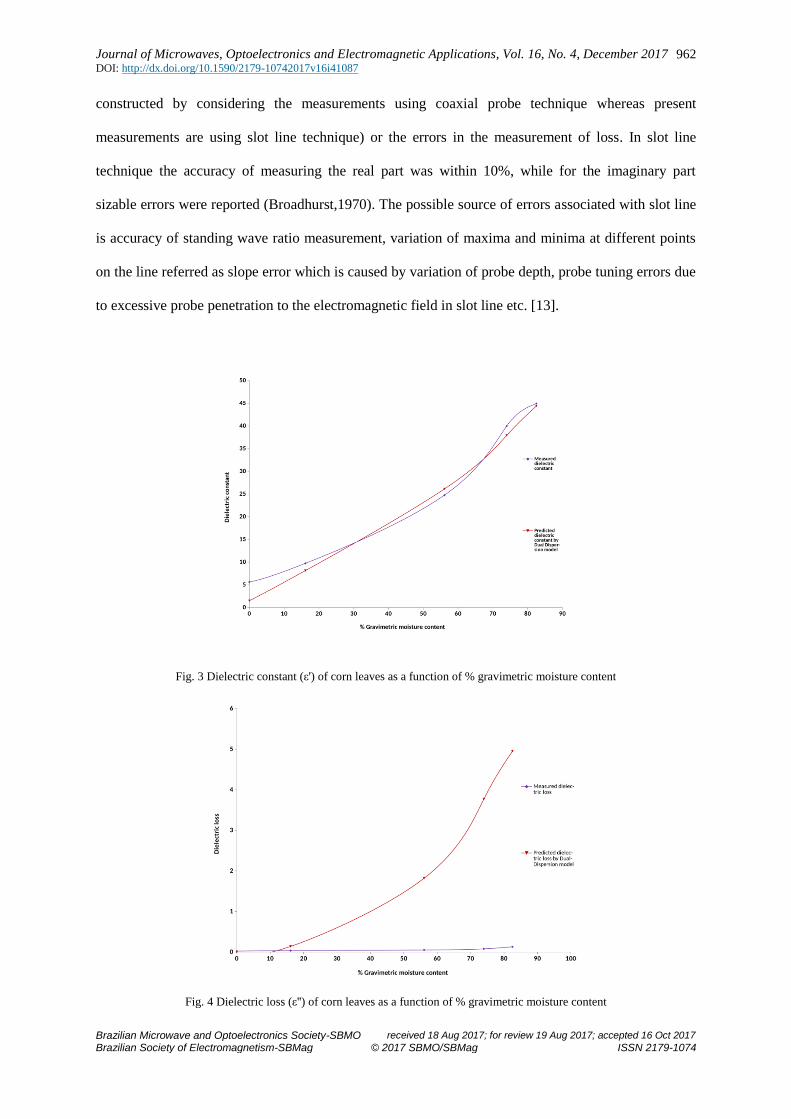
Fig. 3 and 4 shows the variation of ε' and ε'' as a function of gravimetric moisture content of corn
leaves respectively. It is observed that both the measured ε' and ε'' are increased exponentially with
percent gravimetric moisture content. For low moistures, ε' and ε'' increased with slow rate. However
the rate is more rapid for high moist leaves. This might be due to the polarizability of free and bound
water molecules. When electric field at MW frequency is interacted with asymmetric molecule like
water linked with bulk material. It gets polarized in dipolar manner. At low moisture the water
molecules are tightly bound to the bulk material of leaves causes less polarization. As moisture
increased further the water molecule becomes free and loosely bound to the system causes more
polarization.
The measured data of ε' of corn leaves has good agreement with model values. This
agreement may be due to the fact that the original model was constructed by using the corn
vegetation. The measured ε'' is not agreeable with the model values. The difference of measured and
predicted ε'' may contributes due to the difference in measurement method (The actual model is
Journal of Microwaves, Optoelectronics and Electromagnetic Applications, Vol. 16, No. 4, December 2017 DOI: http://dx.doi.org/10.1590/2179-10742017v16i41087
Brazilian Microwave and Optoelectronics Society-SBMO received 18 Aug 2017; for review 19 Aug 2017; accepted 16 Oct 2017
Brazilian Society of Electromagnetism-SBMag © 2017 SBMO/SBMag ISSN 2179-1074
962
constructed by considering the measurements using coaxial probe technique whereas present
measurements are using slot line technique) or the errors in the measurement of loss. In slot line
technique the accuracy of measuring the real part was within 10%, while for the imaginary part
sizable errors were reported (Broadhurst,1970). The possible source of errors associated with slot line
is accuracy of standing wave ratio measurement, variation of maxima and minima at different points
on the line referred as slope error which is caused by variation of probe depth, probe tuning errors due
to excessive probe penetration to the electromagnetic field in slot line etc. [13].
Fig. 3 Dielectric constant (ε') of corn leaves as a function of % gravimetric moisture content
Fig. 4 Dielectric loss (ε'') of corn leaves as a function of % gravimetric moisture content
Journal of Microwaves, Optoelectronics and Electromagnetic Applications, Vol. 16, No. 4, December 2017 DOI: http://dx.doi.org/10.1590/2179-10742017v16i41087
Brazilian Microwave and Optoelectronics Society-SBMO received 18 Aug 2017; for review 19 Aug 2017; accepted 16 Oct 2017
Brazilian Society of Electromagnetism-SBMag © 2017 SBMO/SBMag ISSN 2179-1074
963
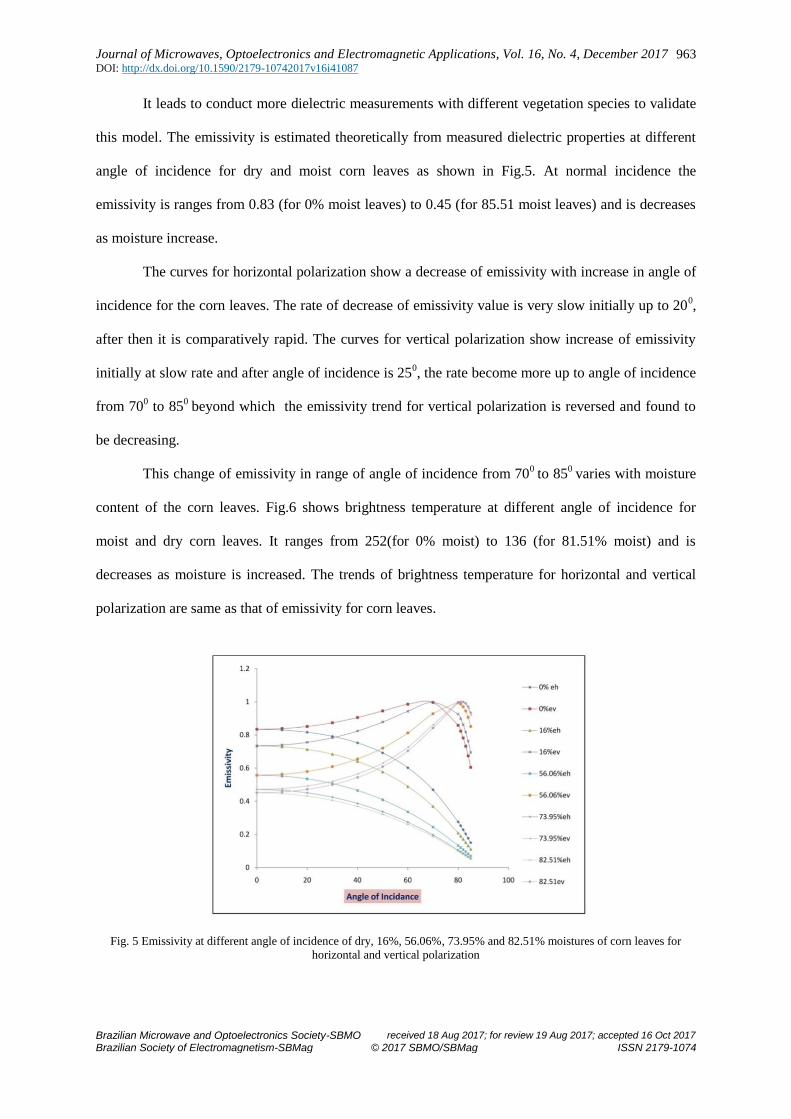
It leads to conduct more dielectric measurements with different vegetation species to validate
this model. The emissivity is estimated theoretically from measured dielectric properties at different
angle of incidence for dry and moist corn leaves as shown in Fig.5. At normal incidence the
emissivity is ranges from 0.83 (for 0% moist leaves) to 0.45 (for 85.51 moist leaves) and is decreases
as moisture increase.
The curves for horizontal polarization show a decrease of emissivity with increase in angle of
incidence for the corn leaves. The rate of decrease of emissivity value is very slow initially up to 200,
after then it is comparatively rapid. The curves for vertical polarization show increase of emissivity
initially at slow rate and after angle of incidence is 250, the rate become more up to angle of incidence
from 700 to 85
0 beyond which the emissivity trend for vertical polarization is reversed and found to
be decreasing.
This change of emissivity in range of angle of incidence from 700
to 850
varies with moisture
content of the corn leaves. Fig.6 shows brightness temperature at different angle of incidence for
moist and dry corn leaves. It ranges from 252(for 0% moist) to 136 (for 81.51% moist) and is
decreases as moisture is increased. The trends of brightness temperature for horizontal and vertical
polarization are same as that of emissivity for corn leaves.
Fig. 5 Emissivity at different angle of incidence of dry, 16%, 56.06%, 73.95% and 82.51% moistures of corn leaves for
horizontal and vertical polarization

Journal of Microwaves, Optoelectronics and Electromagnetic Applications, Vol. 16, No. 4, December 2017 DOI: http://dx.doi.org/10.1590/2179-10742017v16i41087
Brazilian Microwave and Optoelectronics Society-SBMO received 18 Aug 2017; for review 19 Aug 2017; accepted 16 Oct 2017
Brazilian Society of Electromagnetism-SBMag © 2017 SBMO/SBMag ISSN 2179-1074
964
Fig.6 Brightness temperature at different angle of incidence of dry, 16%, 56.06, 73.95, 82.51% moistures of corn leaves for
horizontal and vertical polarization
IV. CONCLUSIONS
The present investigations provide the experimental results of dielectric properties as a function of
gravimetric moisture at C-Band frequency for corn vegetation. The relationship is direct between
dielectric properties and physical characteristics (in this case moisture). This linkage is important and
provide physical basis for MWRS of vegetation. Estimated emissivity and brightness temperature are
the parameters that can be used for designing passive MW sensors especially for vegetation
assessment. The comparison of measured dielectric properties with theoretical model (Ulaby and El-
Rays, 1987) implies that the model performance is good for just prediction of dielectric constant only
and not for dielectric loss of vegetation. This work provides the dielectric data base for corn
vegetation in Indian context.
ACKNOWLEDGMENT
Authors are thankful to Indian Space Research Organization (ISRO) for providing the facility of MW
C-Band set up through “RESPOND” project at J.E.S. College Jalna. Prof. S.C. Mehrotra, Ramanujan
Chair of Remote Sensing and GIS, is also acknowledged for fruitful discussion.
REFERENCES
[1] Nelson, Stuart O. IEEE Trans. on Electrical Insulation. 1991 26(5), 845-869
[2] Francois, Tardieu; Thierry, Simonneau. Journal of Experimental Botany. 1998 49, 419–432
[3] Ferguson, Marvin H. USGA Journal and Turf management. 1959, 30-33.
[4] Fawwaz T, Ulaby; Mohamed A, EL-Rayes. IEEE Trans.on Geo. and Remote Sensing , 1987,GE-25(5) 550-557
[5] Kurtadikar, M.L.; Popalghat, S.K.; Mehrotra, S.C.2013, International Experts Meet on Microwave Remote Sensing,
Abstract-2, 16-17
[6] Deshpande, S.S.;Itolikar, A.B.;Joshi,A.S.,Kurtadikar,M.L. In Conference Proceedings: 11th International Conference
on Microwaves, Antena, Propagation & Remote Sensing ICMAR-2015,India, Dec.15-17,2015.
Journal of Microwaves, Optoelectronics and Electromagnetic Applications, Vol. 16, No. 4, December 2017 DOI: http://dx.doi.org/10.1590/2179-10742017v16i41087
Brazilian Microwave and Optoelectronics Society-SBMO received 18 Aug 2017; for review 19 Aug 2017; accepted 16 Oct 2017
Brazilian Society of Electromagnetism-SBMag © 2017 SBMO/SBMag ISSN 2179-1074
965
[7] Joshi, A.S.; Kurtadikar, M.L. Journal of Geomatics SAC-ISRO- The Journal of Indian society of Geomatics, 2013, 7(1),
33-40
[8] Itolikar, Ashish B.; Kurtadikar, M.L. Bionano Frontier, 2015 8(3), 371- 374.
[9] Itolikar, Ashish B.; Kurtadikar, M.L. Int. Journal of Advances in Remote Sensing and GIS, 2017, Vol.5, No.1, 58-66
[10] Kaatze, Udo. IOP publishing, Metrologia, 2010, 47, 91-113
[11] Von Hipple, A.R., Dielectric materials and Applications, New York, Wiley-1954.
[12] Griffiths, David J., Introduction to Electrodynamics, Prentice Hall, ISBN 0-13-805326-X, 390
[13] Kulkarni,P.G., Ph.D. Thesis submitted to Dr. Babasaheb Ambedkar Marathawada University,Aurangabad, India, 2006.