Embed Size (px)
Citation preview

usfunds.com
usfunds.com November 2016 | 16-438
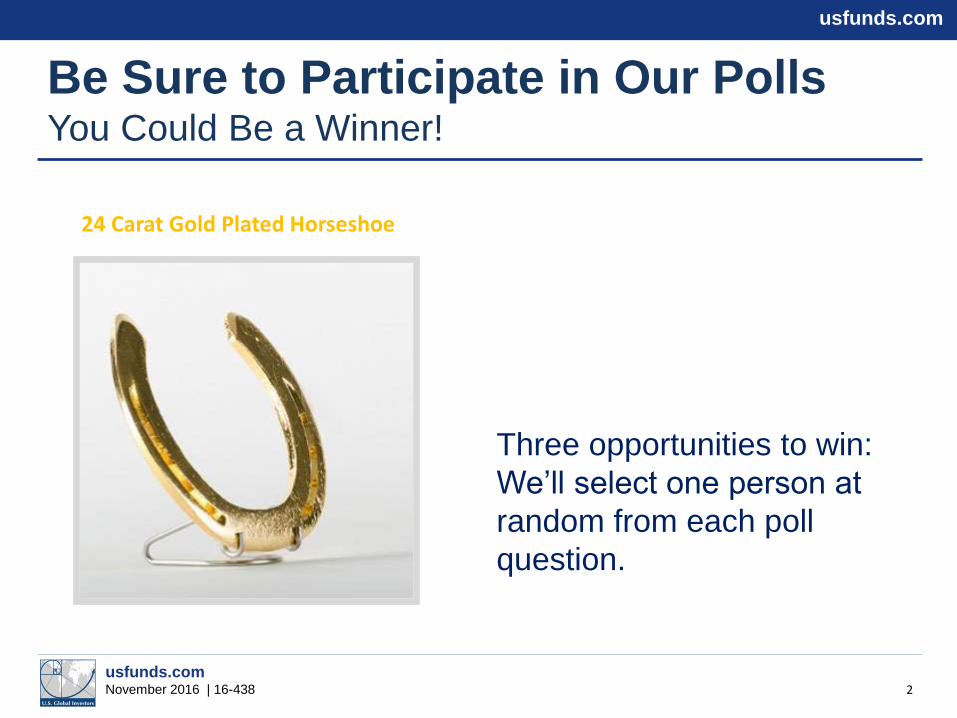
Be Sure to Participate in Our Polls You Could Be a Winner!
24 Carat Gold Plated Horseshoe
2
Three opportunities to win:
We’ll select one person at
random from each poll
question.
usfunds.com
usfunds.com November 2016 | 16-438
Poll Question #1
How is gold included in your portfolio?
3

usfunds.com
usfunds.com November 2016 | 16-438
Facebook Use Around the World 1.7 Billion People Connected Without Passports!
usfunds.com
usfunds.com November 2016 | 16-438
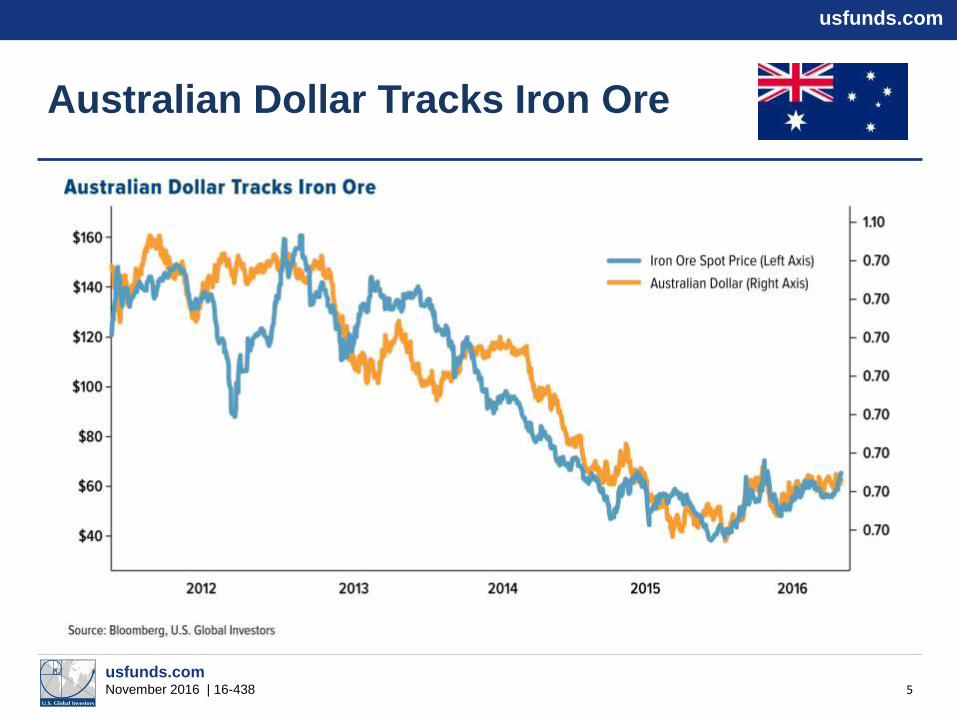
Australian Dollar Tracks Iron Ore
5
usfunds.com
usfunds.com November 2016 | 16-438
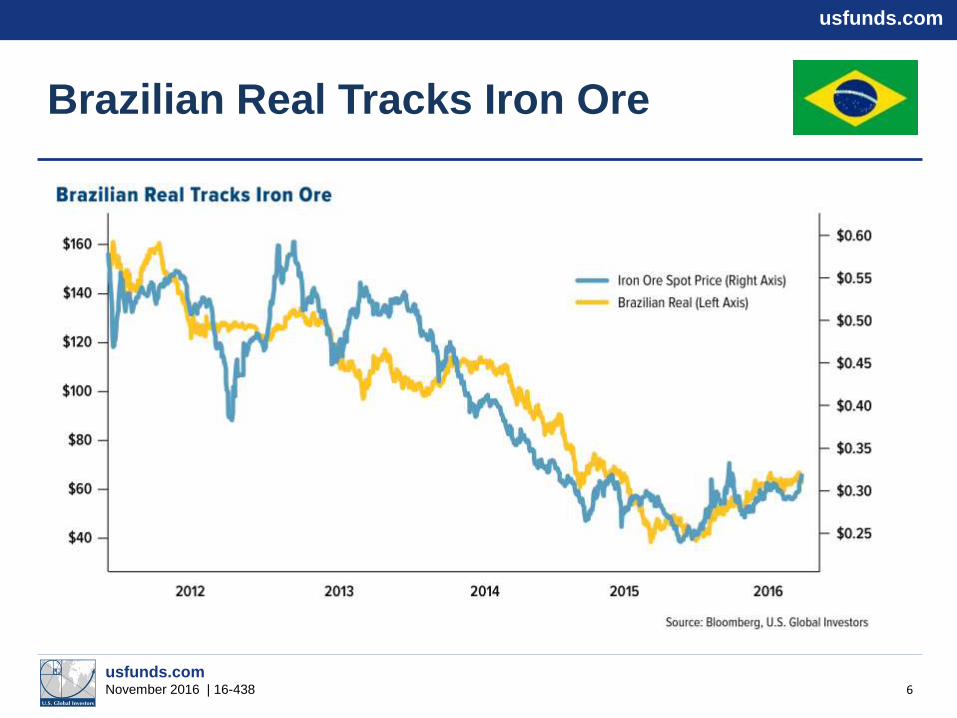
Brazilian Real Tracks Iron Ore
6

usfunds.com
usfunds.com November 2016 | 16-438
The Peruvian Sol Tracks Copper Prices
7

usfunds.com
usfunds.com November 2016 | 16-438
Canadian Dollar and Russian
Ruble Track Oil Prices
8

usfunds.com
usfunds.com November 2016 | 16-438
Colombian Peso Tracks Oil Prices
9

usfunds.com
usfunds.com November 2016 | 16-438
Global PMI — Upturn May Be
Good for Commodity Demand
10
11
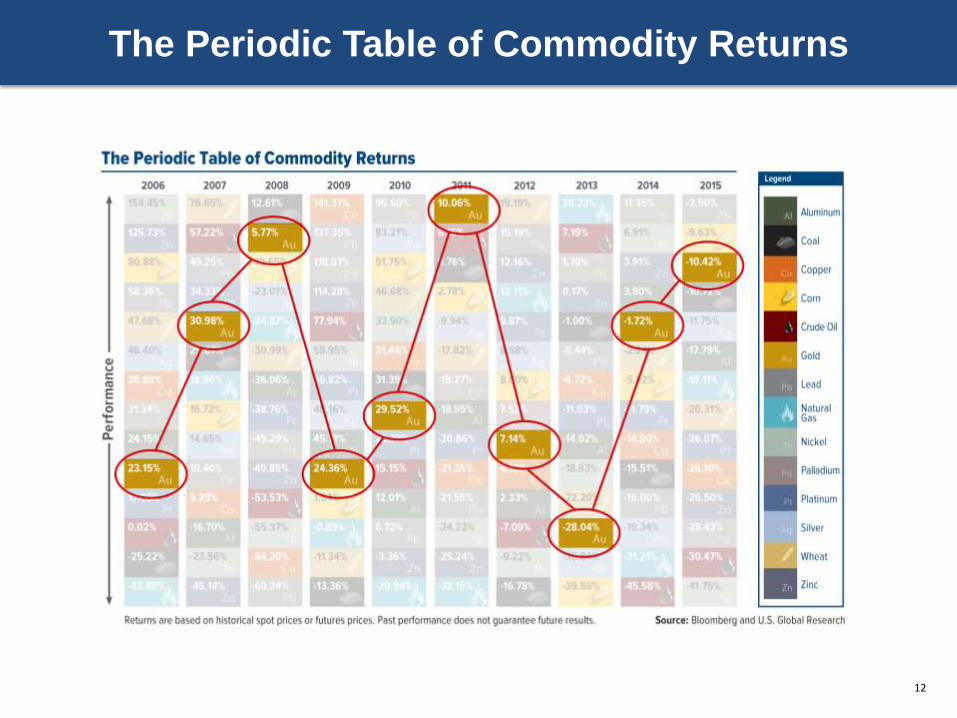
The Periodic Table of Commodity Returns The Periodic Table of Commodity Returns
12
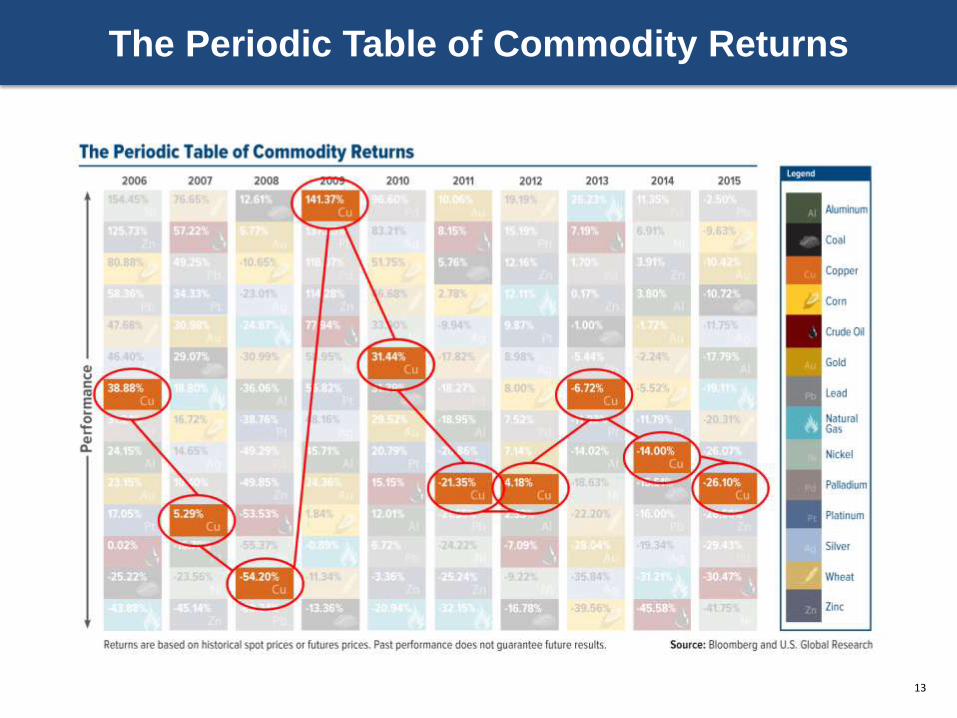
The Periodic Table of Commodity Returns The Periodic Table of Commodity Returns
13

usfunds.com
usfunds.com November 2016 | 16-438
Each Asset Class Has Its Own DNA of Volatility
Daily Rolling 1
Year
Gold Bullion ±1% ±19%
NYSE Arca Exchange Gold BUGS Index ±3% ±39%
WTI Crude Oil ±3% ±38%
S&P 500 Index (SPX) ±1% ±18%
Euro ±1% ±10%
Canadian Dollar ±1% ±10%
U.S. Dollar Index ±1% ±9%
Source: Bloomberg, U.S. Global Investors
Standard deviation based on 10-year daily data as of 9/30/2016
14
Standard deviation is a measure of the dispersion of a set of data from its mean. The more
spread apart the data, the higher the deviation. Standard deviation is also known as
historical volatility. Past performance is no guarantee of future results.
usfunds.com
usfunds.com November 2016 | 16-438
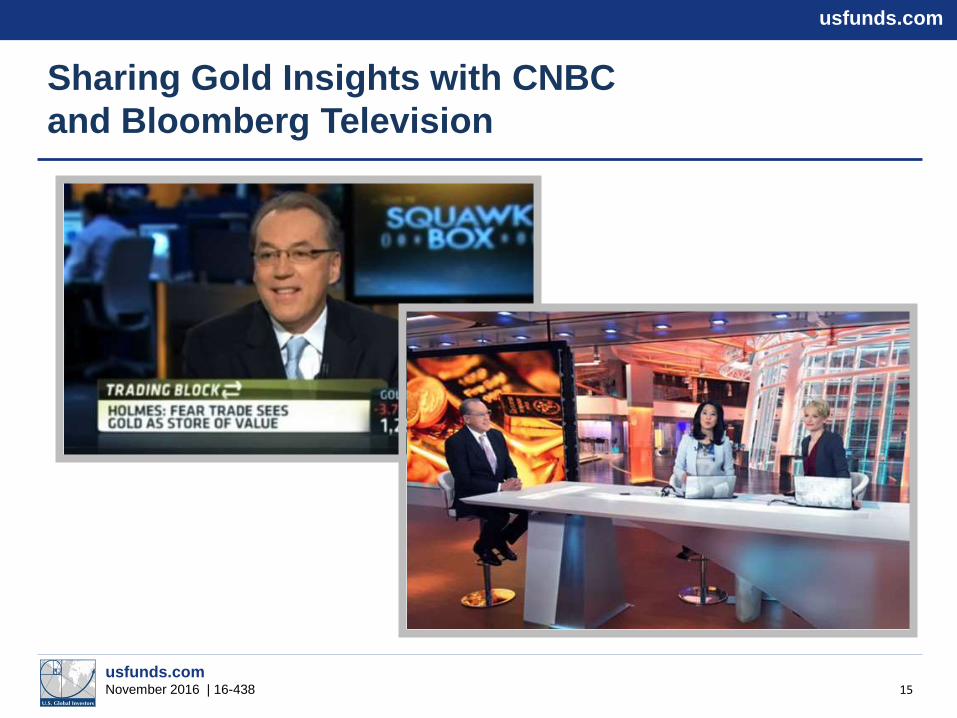
Sharing Gold Insights with CNBC
and Bloomberg Television
15
usfunds.com
usfunds.com November 2016 | 16-438
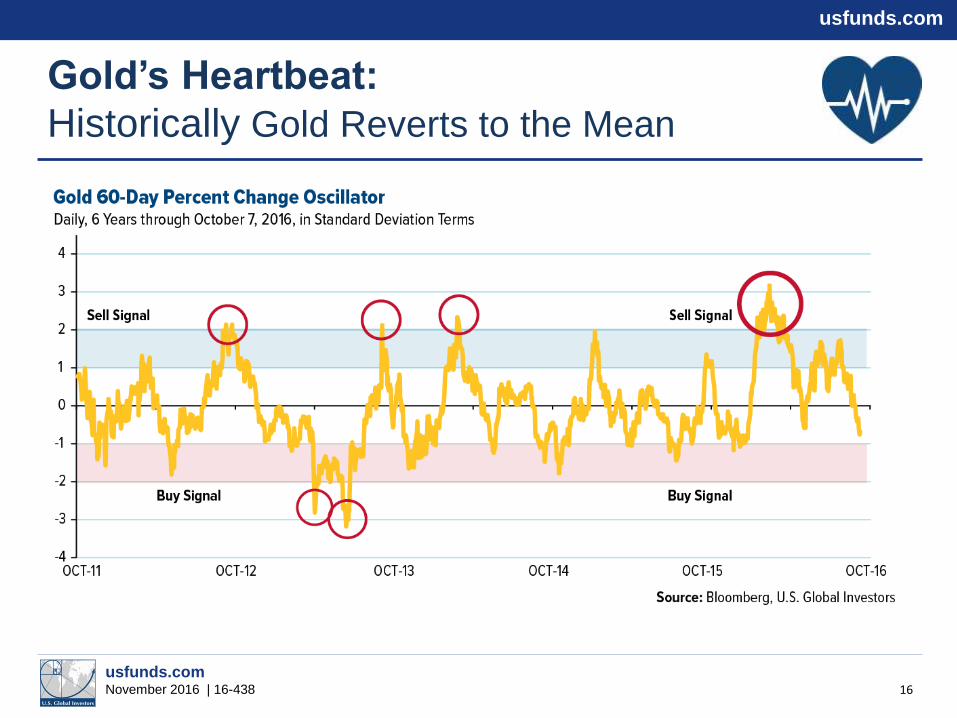
Gold’s Heartbeat:
Historically Gold Reverts to the Mean
16
usfunds.com
usfunds.com November 2016 | 16-438
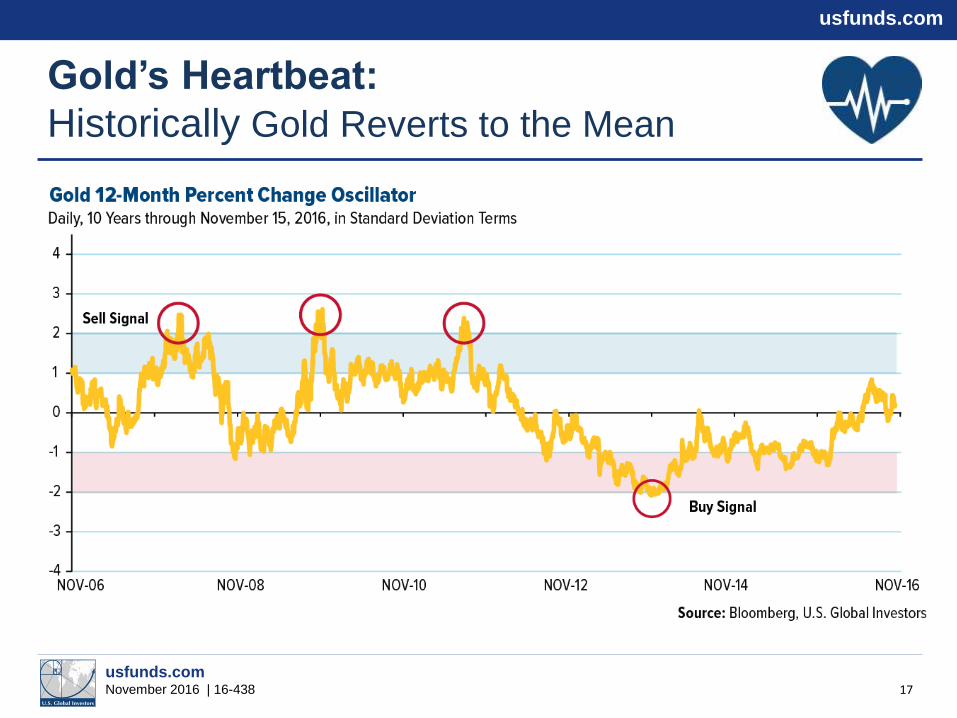
Gold’s Heartbeat:
Historically Gold Reverts to the Mean
17
usfunds.com
usfunds.com November 2016 | 16-438
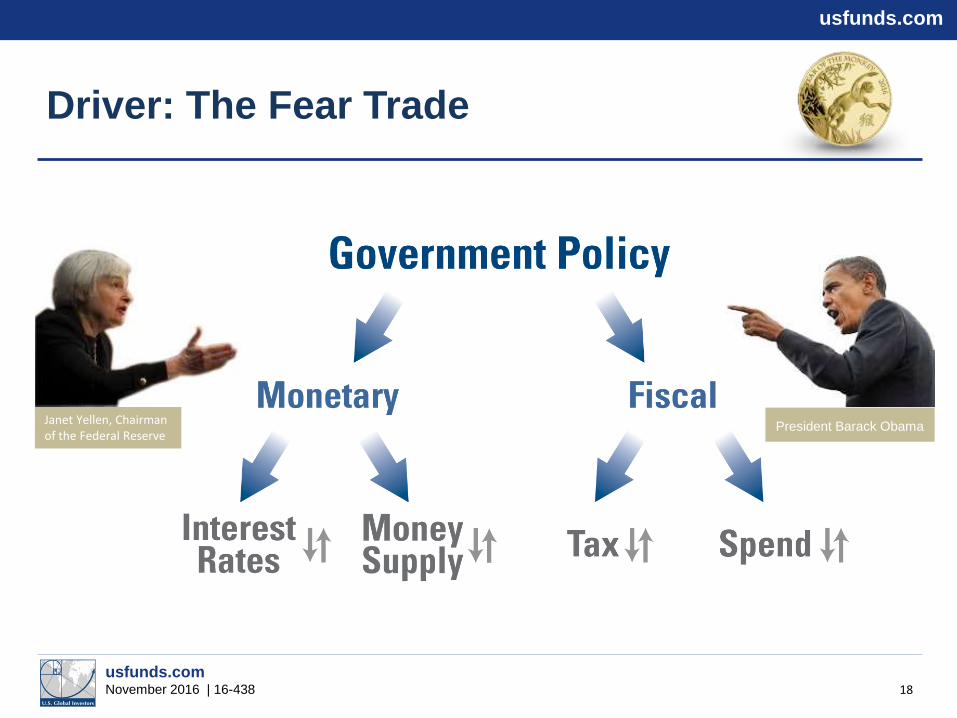
Driver: The Fear Trade
President Barack Obama Janet Yellen, Chairman of the Federal Reserve
18

Nominal Interest Rates
19
Real Interest Rates
Investors Focus on Tip of Interest Rates
INVESTORS NEED TO FOCUS ON REAL INTEREST RATES (Nominal Rates – CPI = Real Rates)
Historically, when CPI inflation has been greater than
nominal rates, real interest rates became negative,
and gold rose in value.

usfunds.com
usfunds.com November 2016 | 16-438
Historically Gold Corrects on Rise of
10-Year Treasury Yield
20
usfunds.com
usfunds.com November 2016 | 16-438
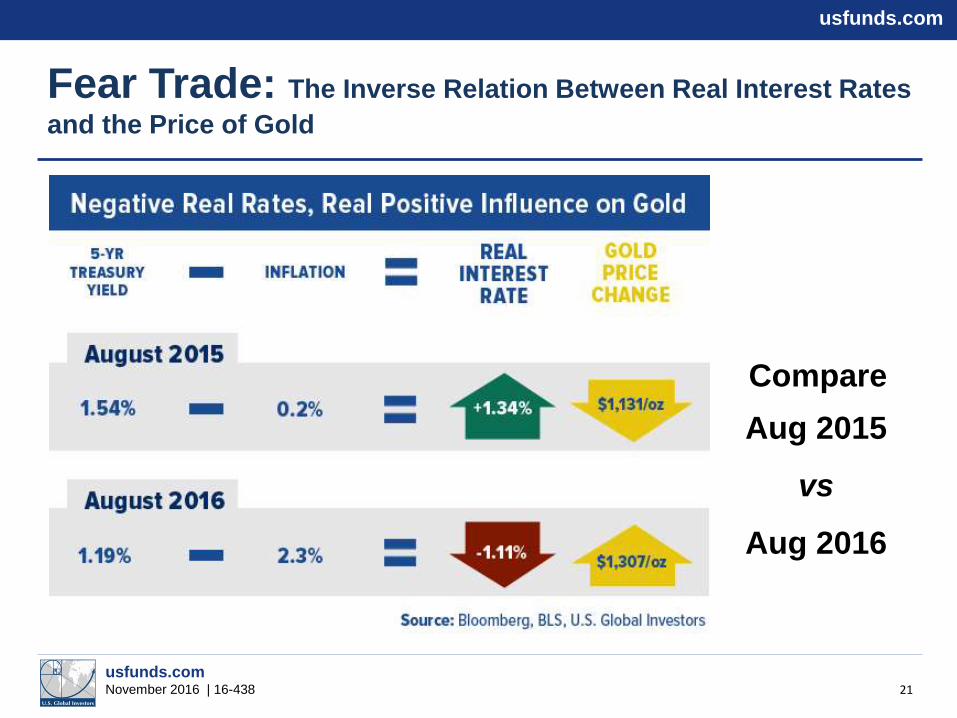
Fear Trade: The Inverse Relation Between Real Interest Rates
and the Price of Gold
21
Aug 2015
vs
Aug 2016
Compare

usfunds.com
usfunds.com November 2016 | 16-438
Fear Trade: The Inverse Relation Between Real Interest Rates
and the Price of Gold
22
Nov 2015
vs
Nov 2016
Compare

23
usfunds.com
usfunds.com November 2016 | 16-438
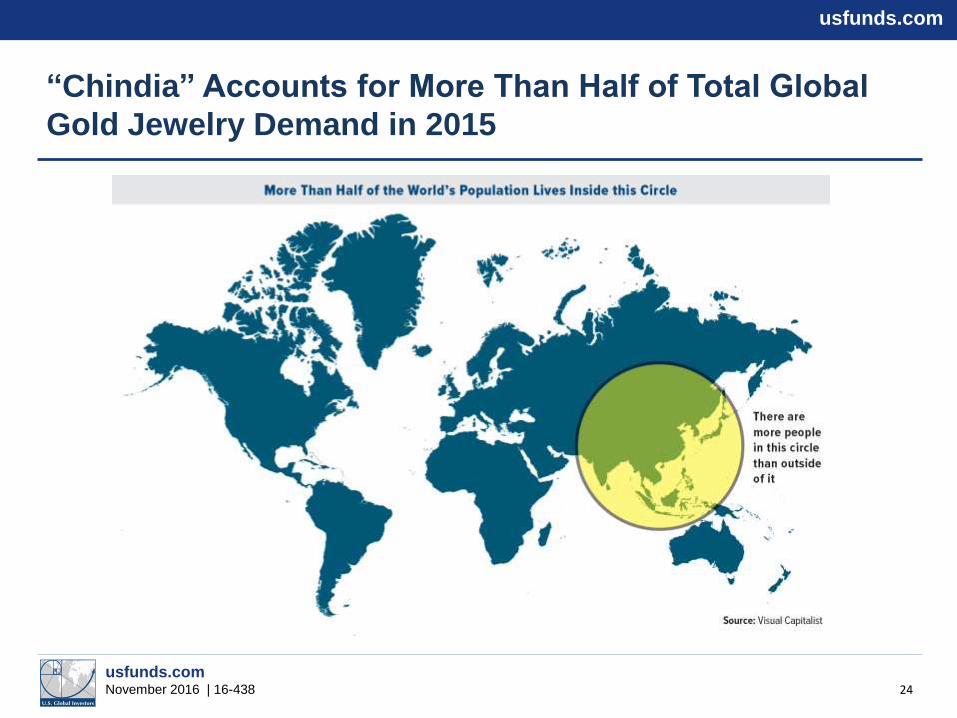
“Chindia” Accounts for More Than Half of Total Global
Gold Jewelry Demand in 2015
24

usfunds.com
usfunds.com June 2016 | 16-196
Understanding Various Market Cycles Managing Expectations — Cycles
DAY MONTH ANNUAL SEASONAL
PRESIDENTIAL 4-YEAR
LIFE CYCLE OF MINE
8-YEAR
25
26
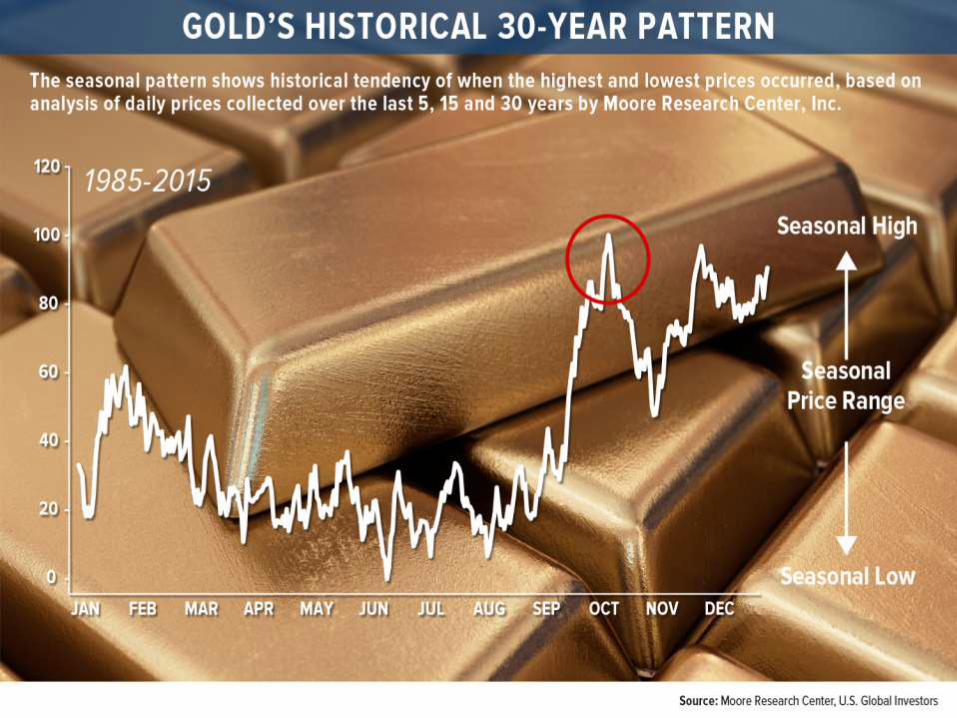
The seasonal pattern shows historical tendency of when the highest and lowest prices occurred, based on analysis of daily prices collected over the last 5, 15 and 30 years by Moore Research Center, Inc.

usfunds.com
usfunds.com November 2016 | 16-438
Gold’s Love Trade: Cultural Celebrations
Prompting the Purchase of Gold
27

28

29

30

31

32
33
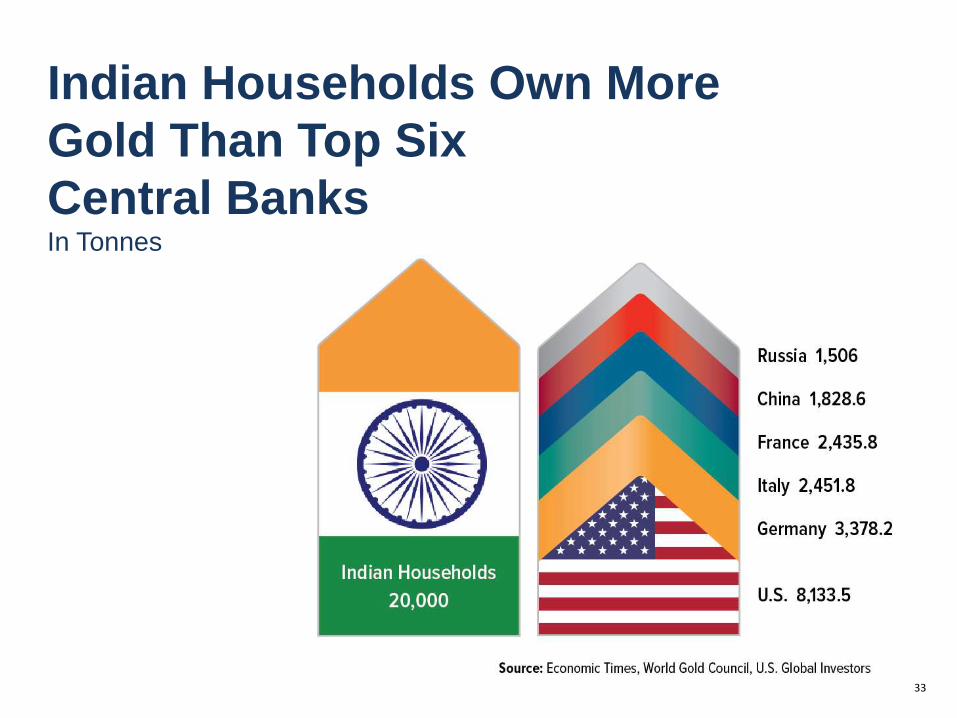
Indian Households Own More
Gold Than Top Six
Central Banks In Tonnes
usfunds.com
usfunds.com November 2016 | 16-438
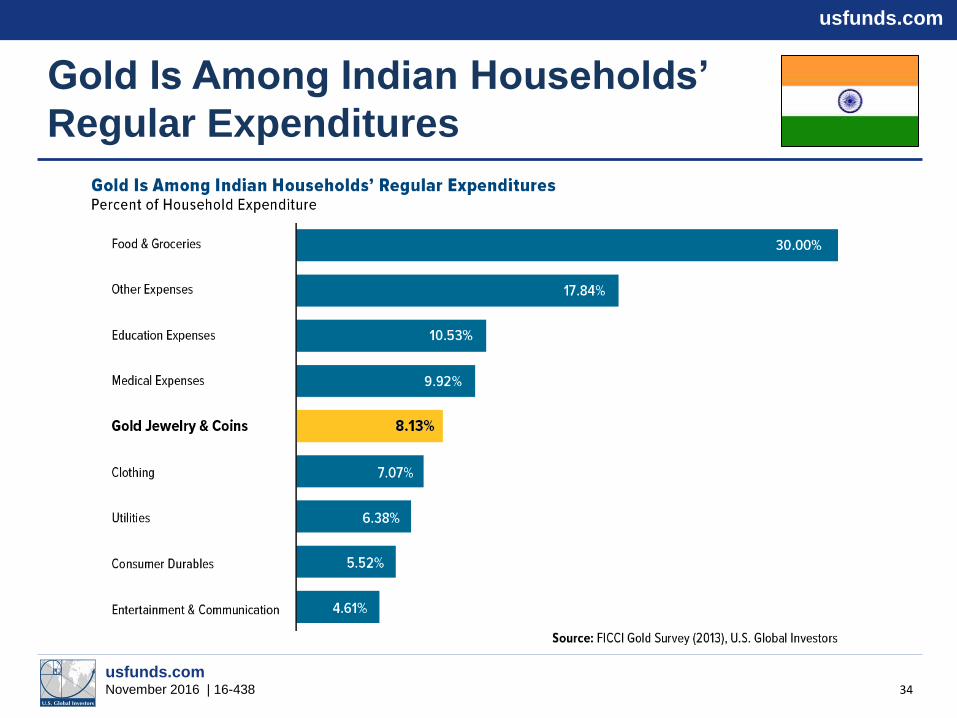
Gold Is Among Indian Households’
Regular Expenditures
34
usfunds.com
usfunds.com November 2016 | 16-438
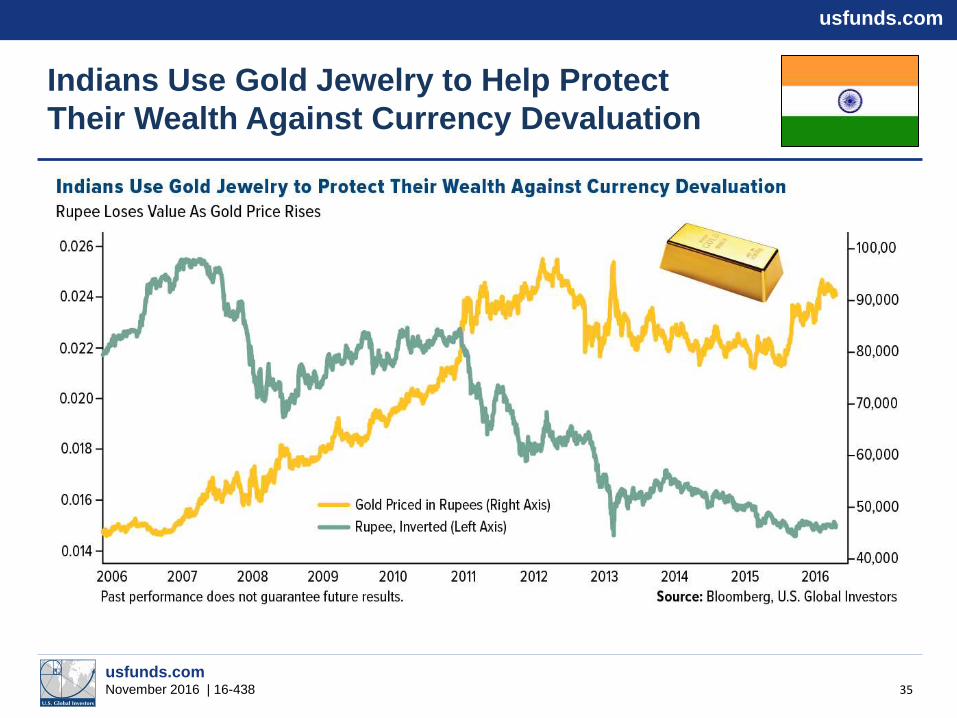
Indians Use Gold Jewelry to Help Protect
Their Wealth Against Currency Devaluation
35

36
usfunds.com
usfunds.com November 2016 | 16-438
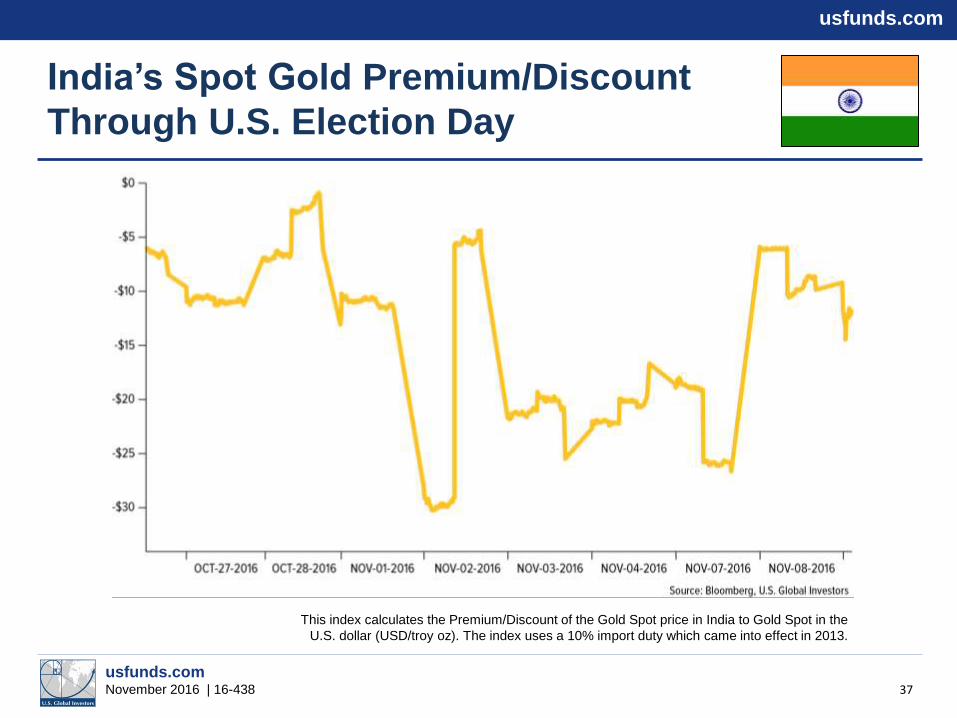
India’s Spot Gold Premium/Discount
Through U.S. Election Day
37
This index calculates the Premium/Discount of the Gold Spot price in India to Gold Spot in the
U.S. dollar (USD/troy oz). The index uses a 10% import duty which came into effect in 2013.

usfunds.com
usfunds.com November 2016 | 16-438
India’s Spot Gold Premium/Discount
After U.S. Election Day
38
This index calculates the Premium/Discount of the Gold Spot price in India to Gold Spot in the
U.S. dollar (USD/troy oz). The index uses a 10% import duty which came into effect in 2013.
usfunds.com
usfunds.com November 2016 | 16-438
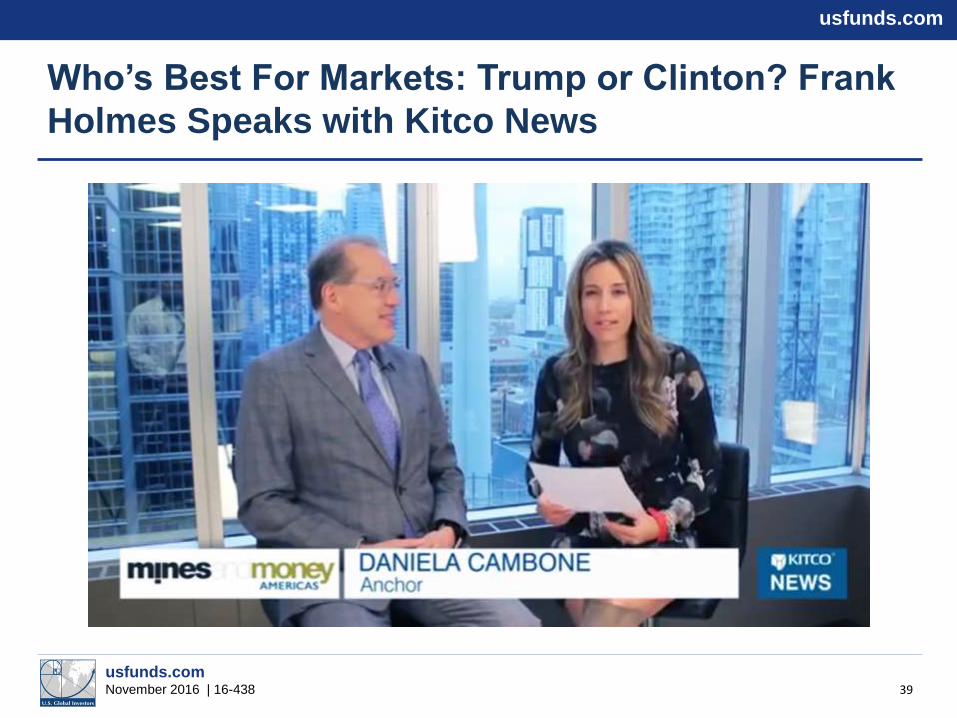
Who’s Best For Markets: Trump or Clinton? Frank
Holmes Speaks with Kitco News
39

40

41
42
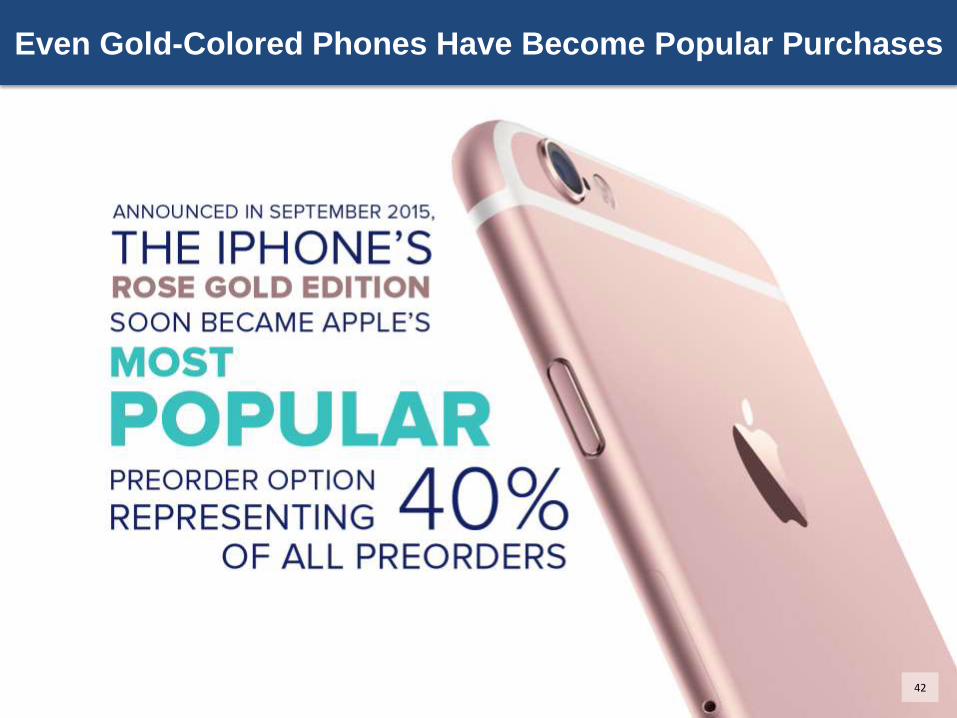
Even Gold-Colored Phones Have Become Popular Purchases

usfunds.com
usfunds.com November 2016 | 16-438
The Great Tectonic Shift of Physical
Gold From West to East
43
February 8, 2016
In December 2015, China imported 180 tonnes of
gold from Switzerland alone.
usfunds.com
usfunds.com November 2016 | 16-438
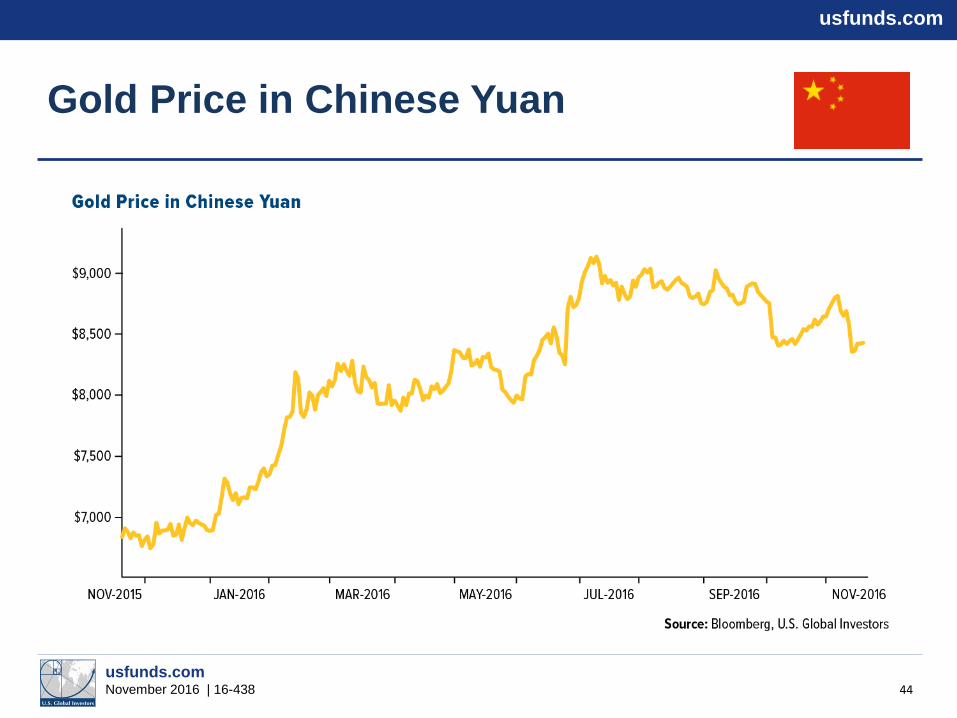
Gold Price in Chinese Yuan
44
usfunds.com
usfunds.com November 2016 | 16-438
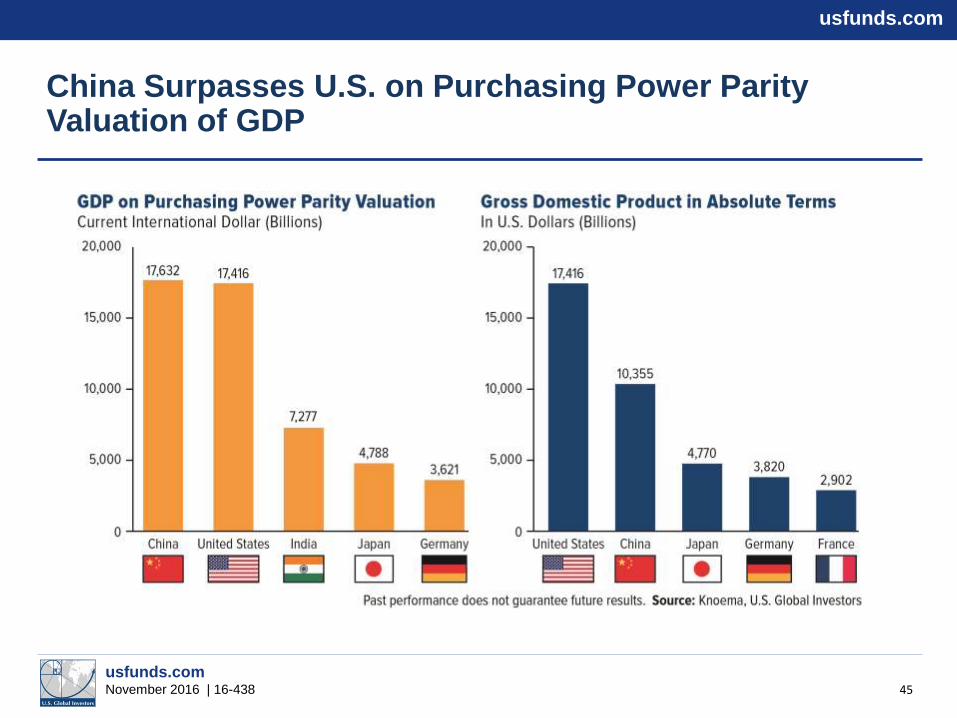
China Surpasses U.S. on Purchasing Power Parity Valuation of GDP
45

46

usfunds.com
usfunds.com November 2016 | 16-438
Poll Question #2
What do you think the price of gold will be by year end?
47
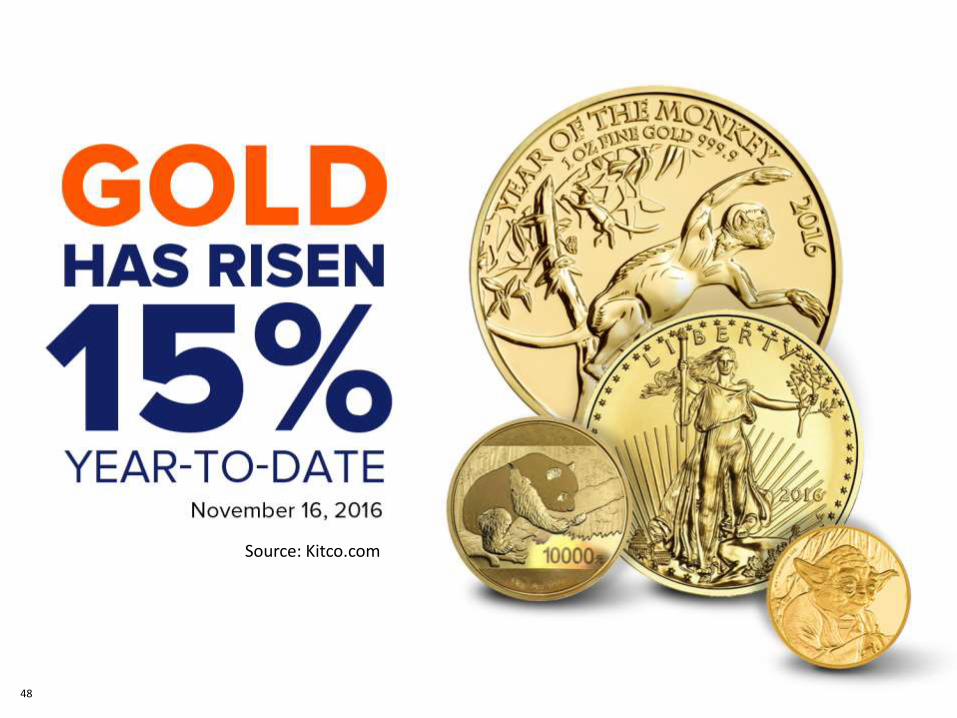
48
Source: Kitco.com

49
*Three Hedge Fund Managers’ Thoughts on Gold
*
usfunds.com
usfunds.com November 2016 | 16-438
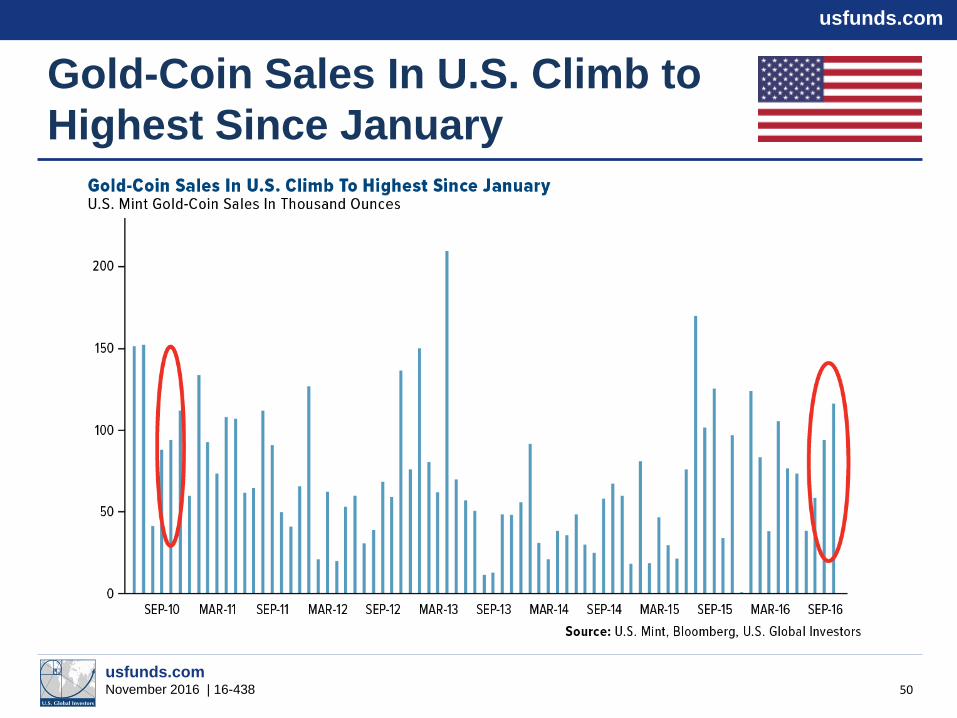
Gold-Coin Sales In U.S. Climb to
Highest Since January
50

usfunds.com
usfunds.com November 2016 | 16-438
Near-Record Gold ETF Inflows
in First Quarter
The price of gold is subject to substantial price fluctuations over short periods of time and
may be affected by unpredicted international monetary and political policies.
51
Visit usfunds.com to watch a replay
of our webcast, All Eyes on Gold:
What’s Attracting
Investors to the Yellow Metal
usfunds.com
usfunds.com November 2016 | 16-438
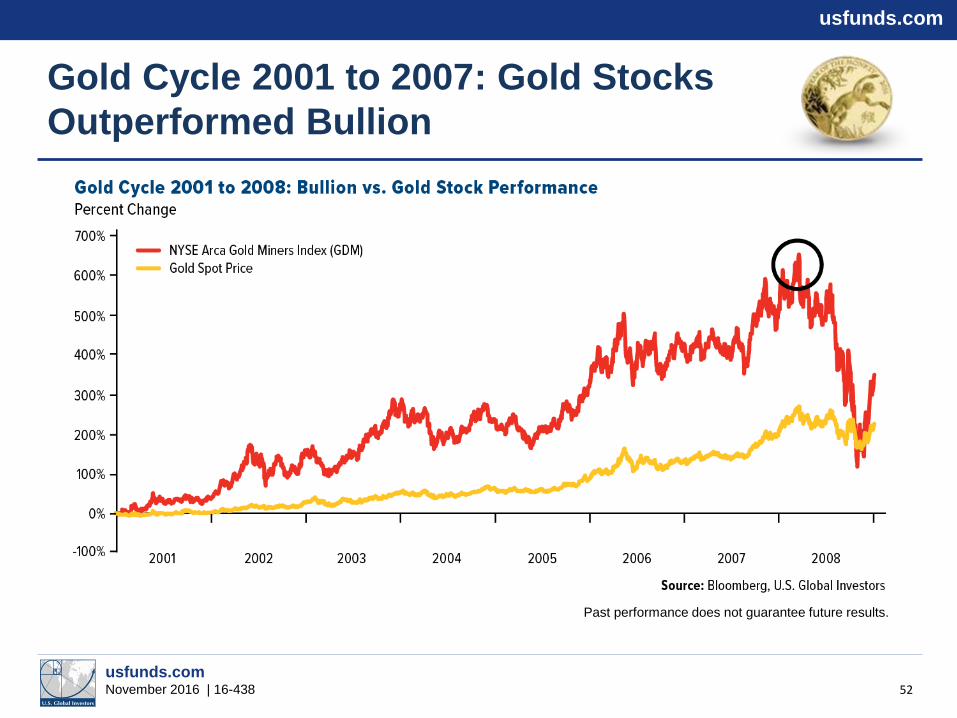
Gold Cycle 2001 to 2007: Gold Stocks
Outperformed Bullion
52
Past performance does not guarantee future results.

usfunds.com
usfunds.com November 2016 | 16-438
Gold Cycle 2009 to 2016: Bullion
Outperformed Gold Stocks
53
Past performance does not guarantee future results.
usfunds.com
usfunds.com November 2016 | 16-438
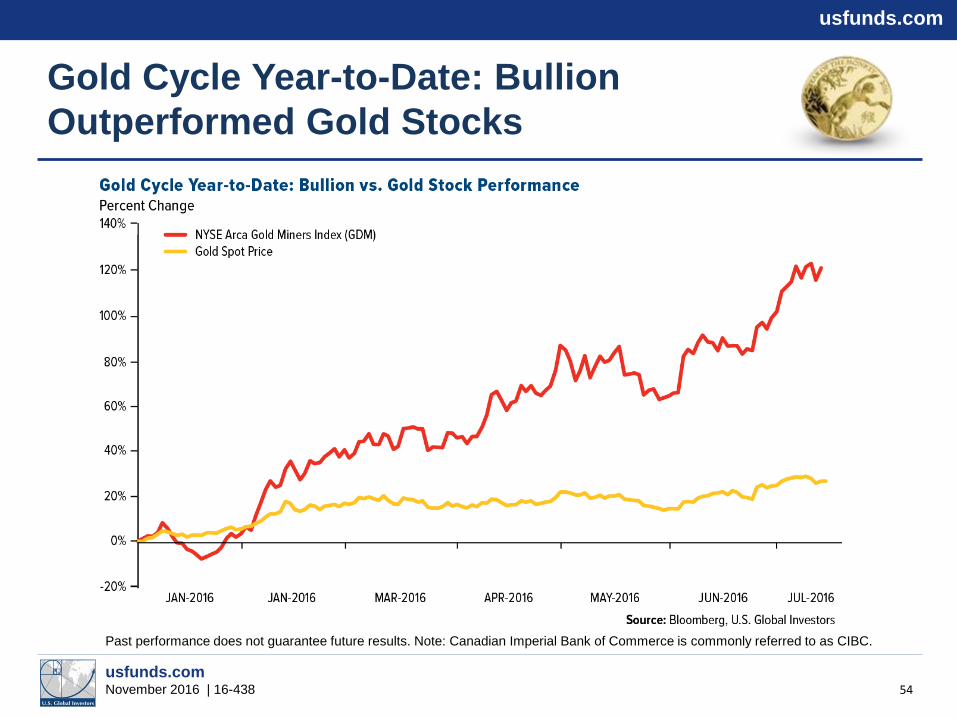
Gold Cycle Year-to-Date: Bullion
Outperformed Gold Stocks
54
Past performance does not guarantee future results. Note: Canadian Imperial Bank of Commerce is commonly referred to as CIBC.

usfunds.com
usfunds.com November 2016 | 16-438
Gold’s Performance in Various World Currencies
Since 2011 Peak
55
+80%
+20%
+18%
-20%
usfunds.com
usfunds.com November 2016 | 16-438
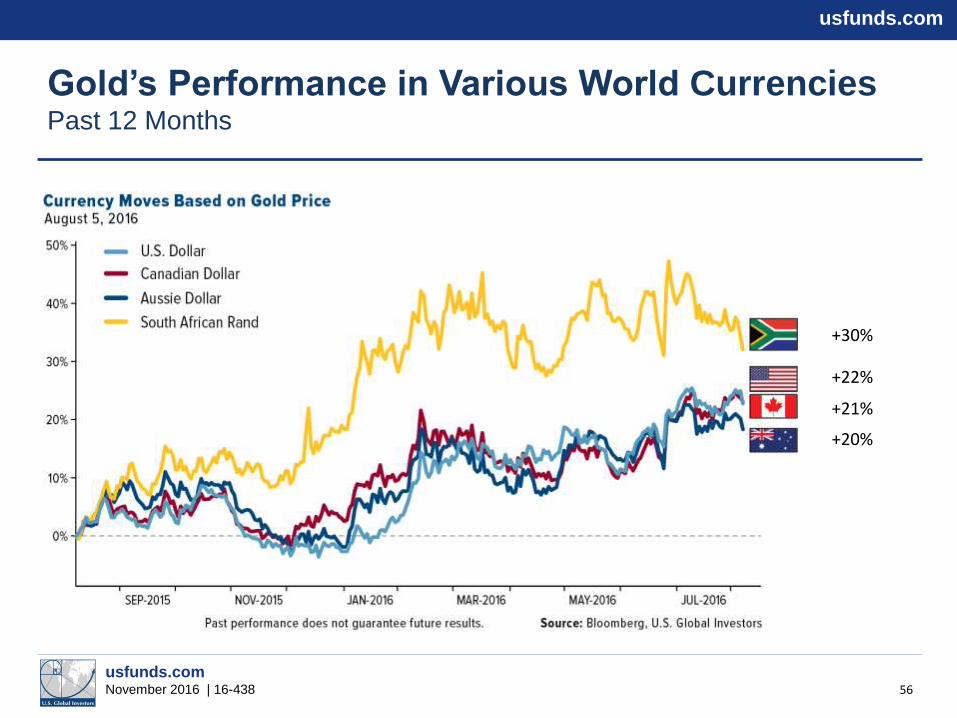
Gold’s Performance in Various World Currencies Past 12 Months
56
+30%
+22%
+21%
+20%
usfunds.com
usfunds.com November 2016 | 16-438
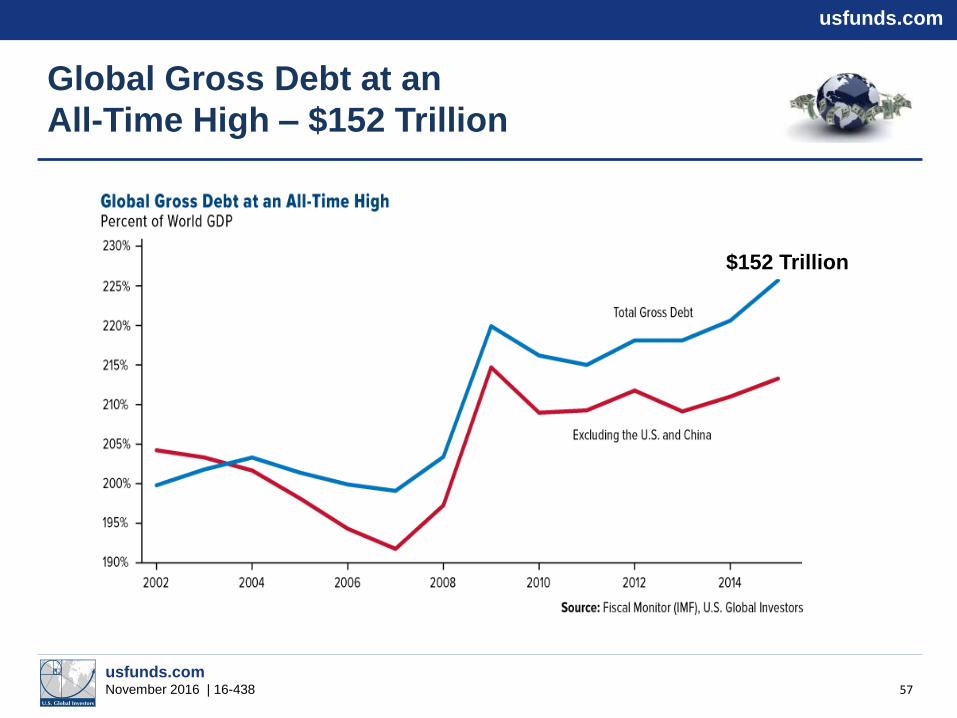
Global Gross Debt at an
All-Time High – $152 Trillion
57
$152 Trillion
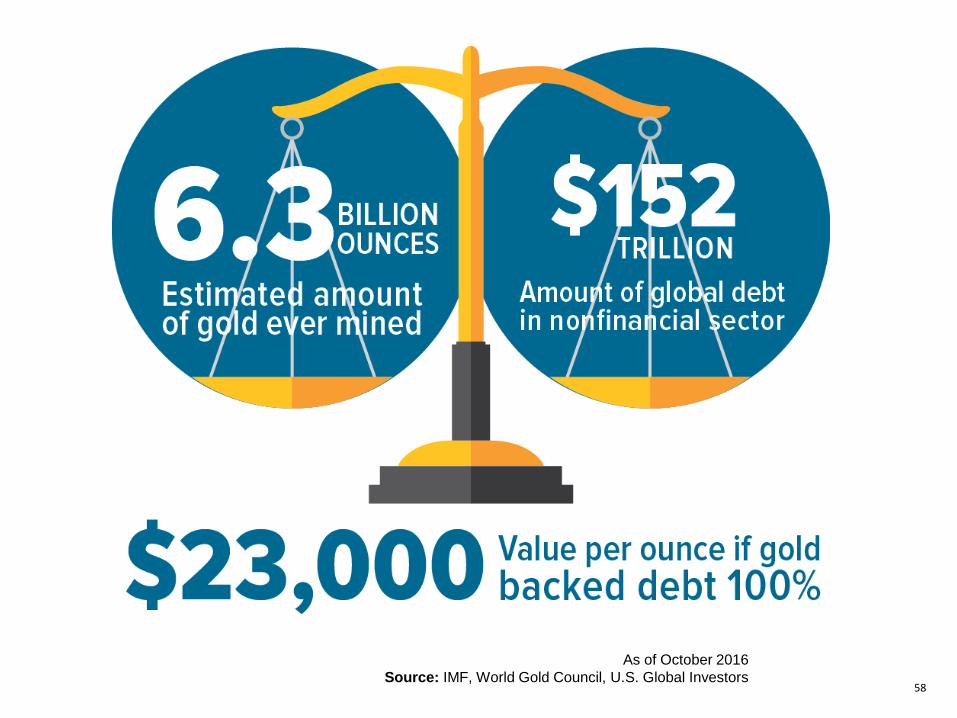
58
As of October 2016
Source: IMF, World Gold Council, U.S. Global Investors
59

60
61
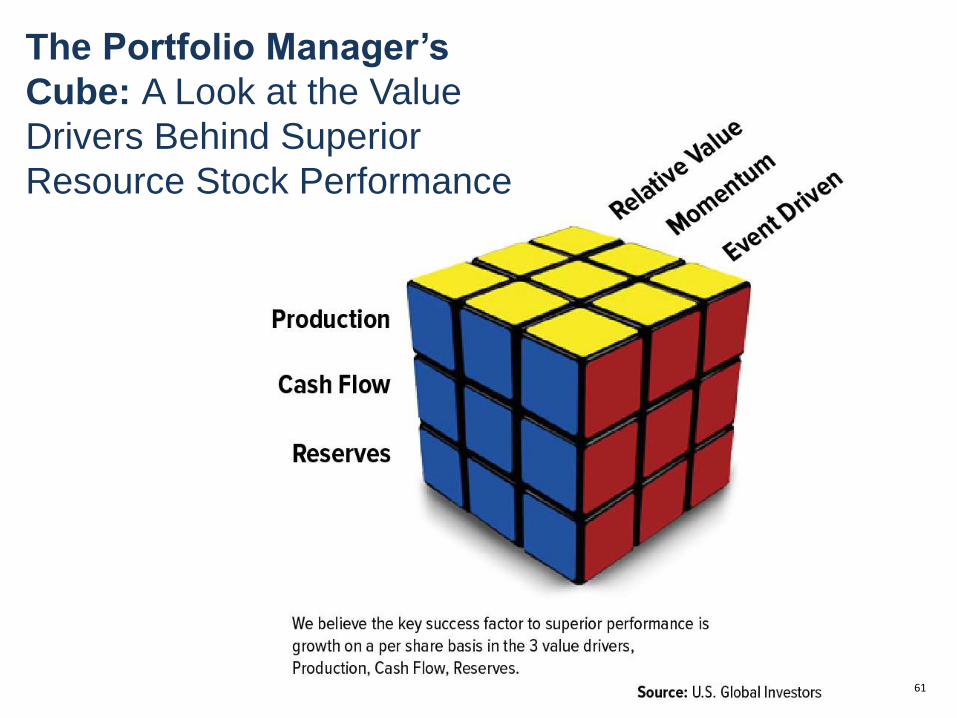
The Portfolio Manager’s
Cube: A Look at the Value
Drivers Behind Superior
Resource Stock Performance

62
63
64

65

66

67
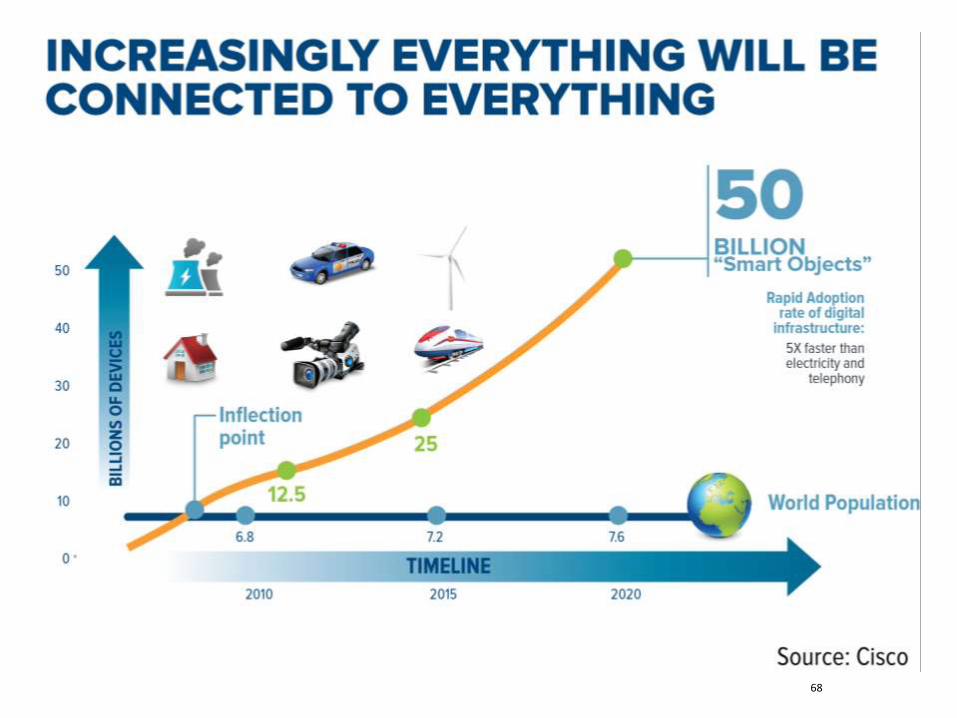
68
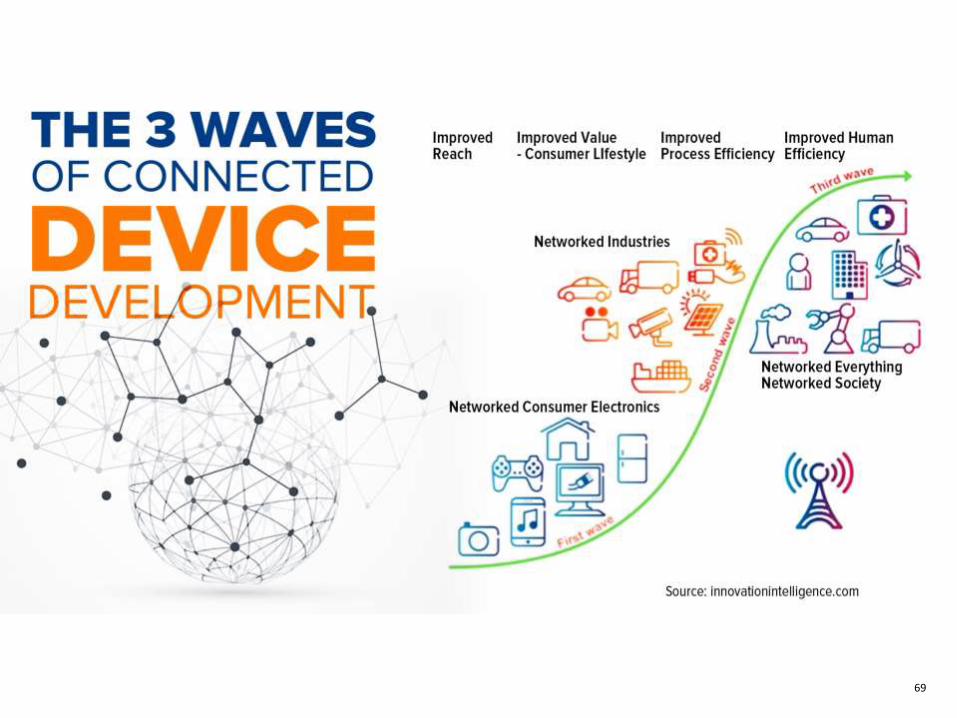
69

70
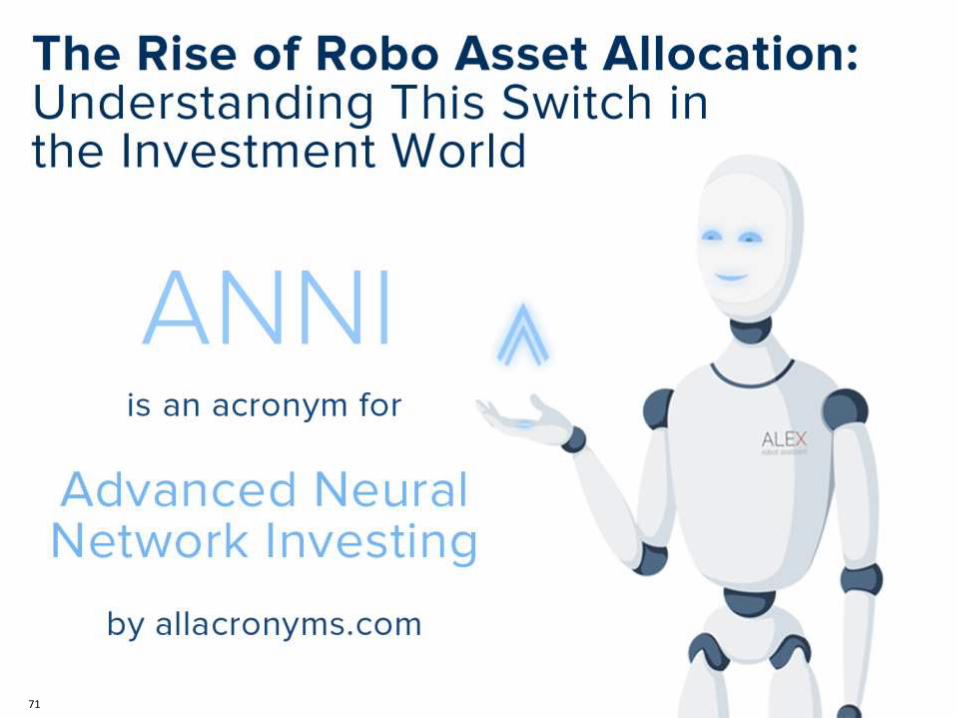
71
usfunds.com
usfunds.com November 2016 | 16-438
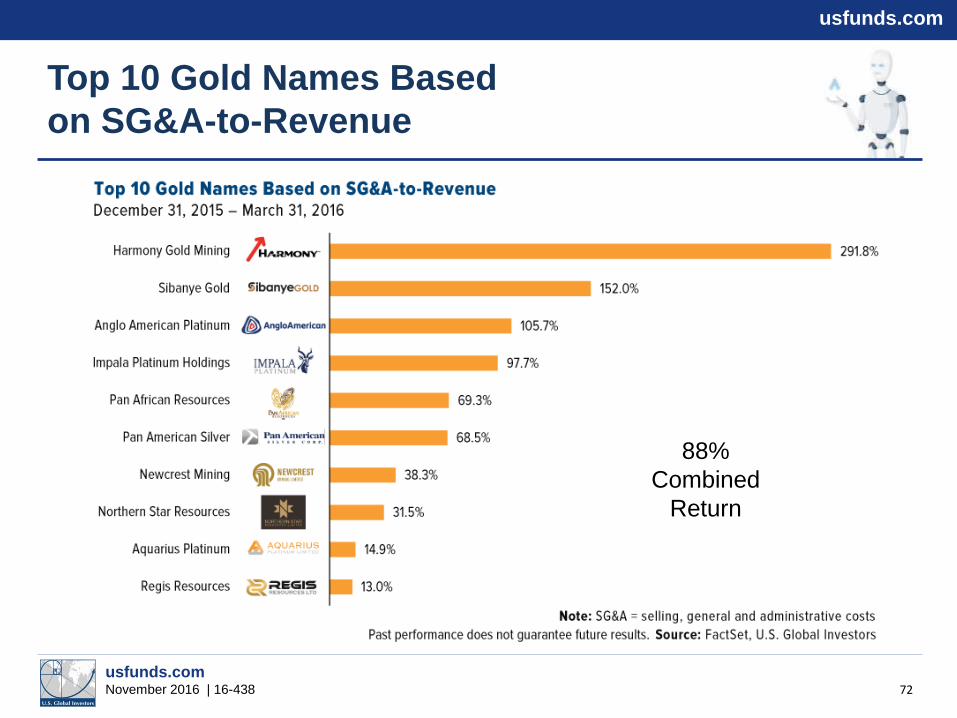
Top 10 Gold Names Based
on SG&A-to-Revenue
72
88%
Combined
Return
usfunds.com
usfunds.com November 2016 | 16-438
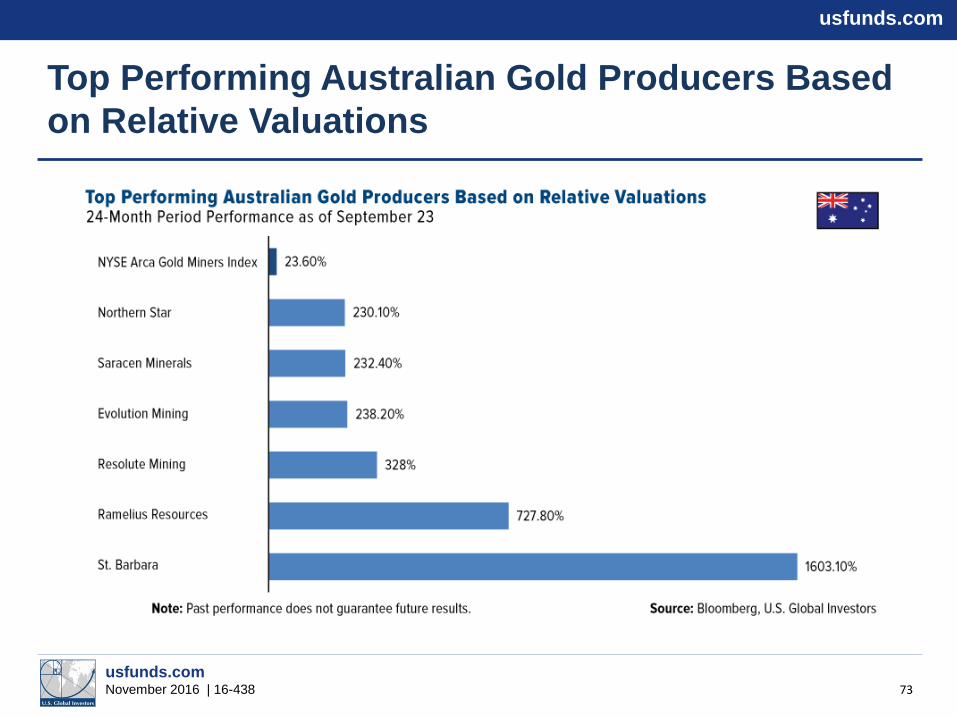
Top Performing Australian Gold Producers Based
on Relative Valuations
73
usfunds.com
usfunds.com November 2016 | 16-438
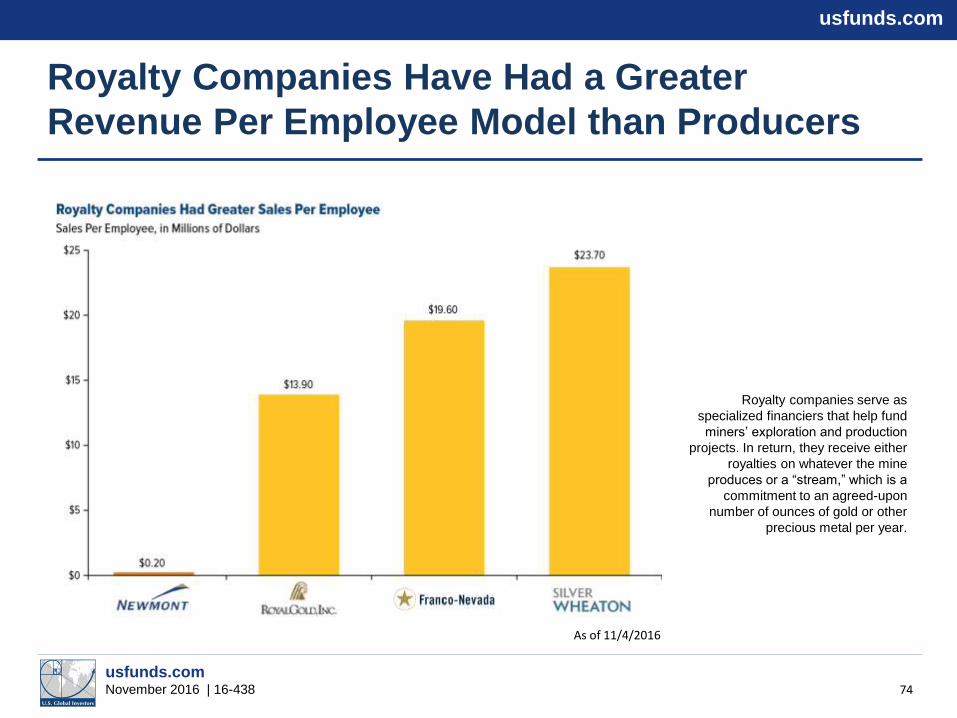
Royalty Companies Have Had a Greater
Revenue Per Employee Model than Producers
Royalty companies serve as
specialized financiers that help fund
miners’ exploration and production
projects. In return, they receive either
royalties on whatever the mine
produces or a “stream,” which is a
commitment to an agreed-upon
number of ounces of gold or other
precious metal per year.
74
As of 11/4/2016
usfunds.com
usfunds.com November 2016 | 16-438
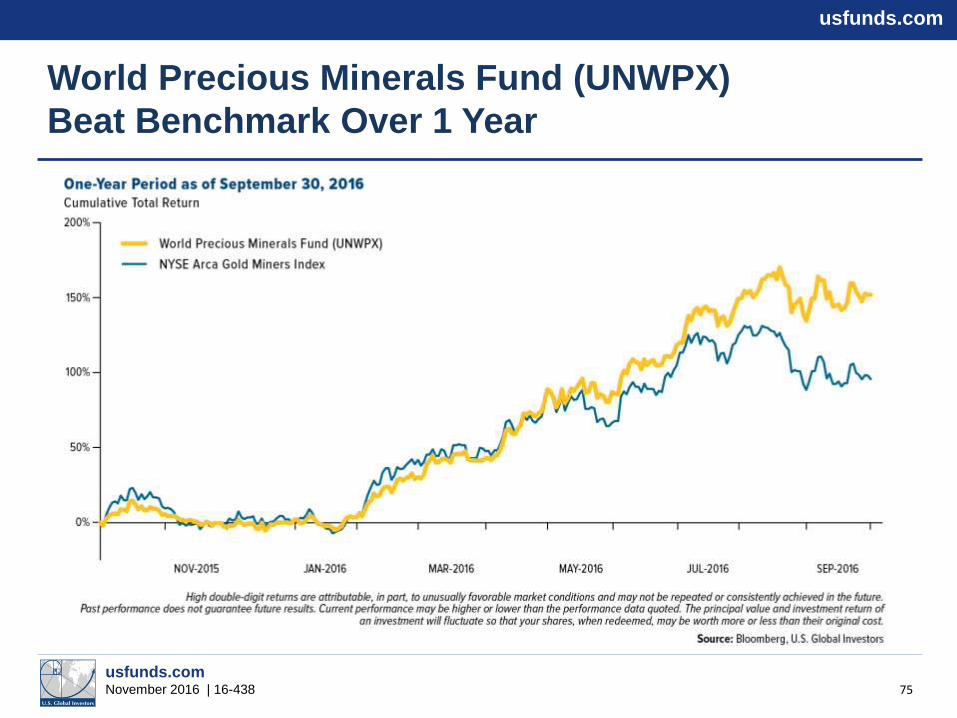
World Precious Minerals Fund (UNWPX)
Beat Benchmark Over 1 Year
75
usfunds.com
usfunds.com November 2016 | 16-438
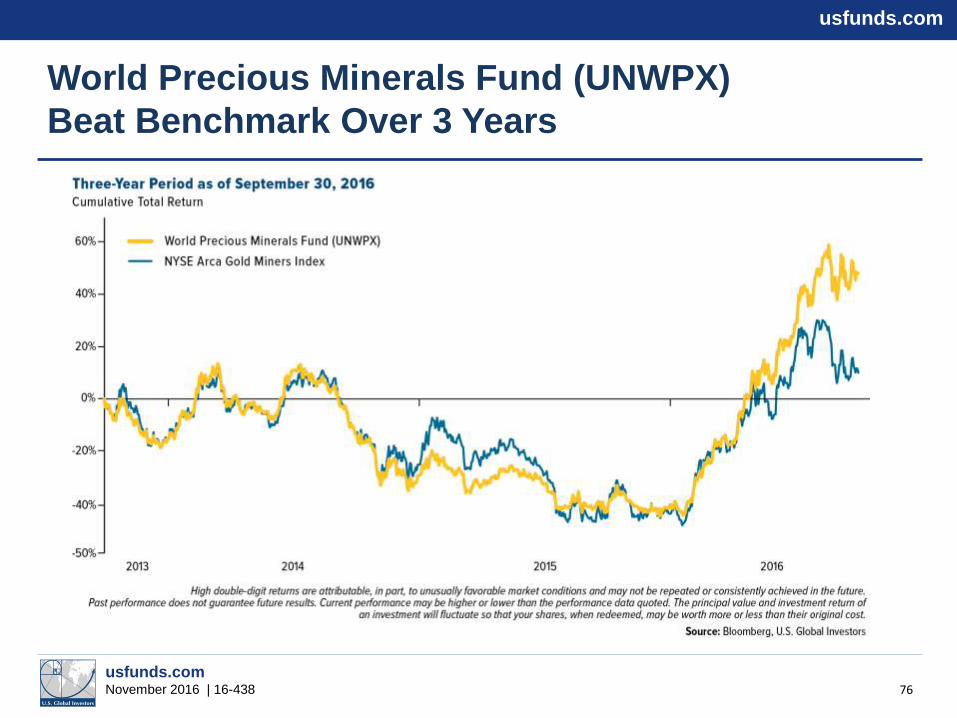
World Precious Minerals Fund (UNWPX)
Beat Benchmark Over 3 Years
76
usfunds.com
usfunds.com November 2016 | 16-438
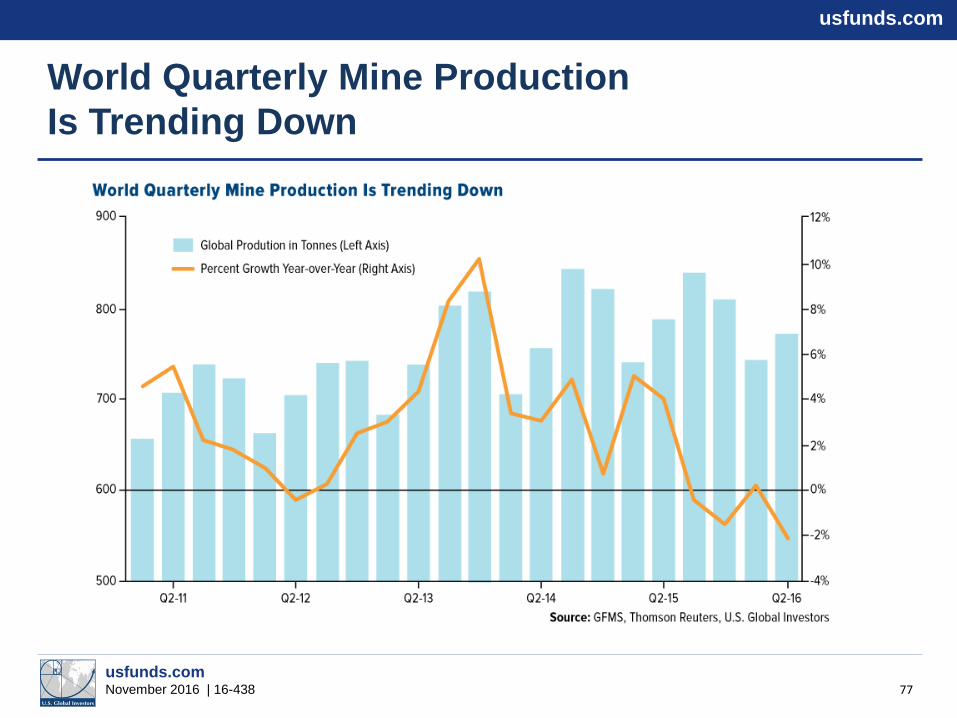
World Quarterly Mine Production
Is Trending Down
77
usfunds.com
usfunds.com November 2016 | 16-438
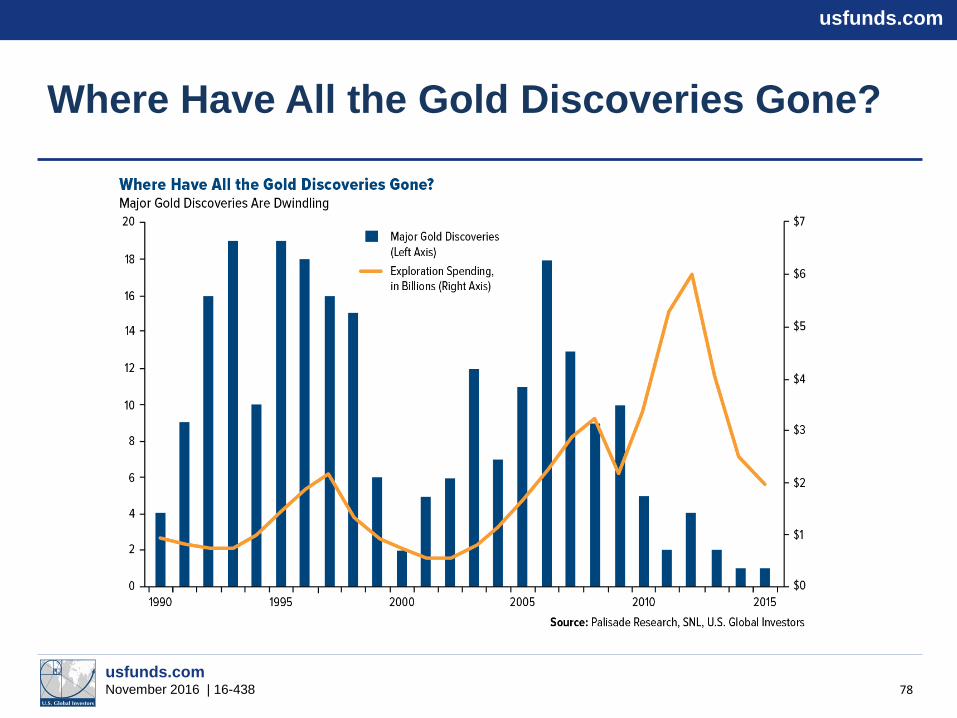
Where Have All the Gold Discoveries Gone?
78
usfunds.com
usfunds.com November 2016 | 16-438
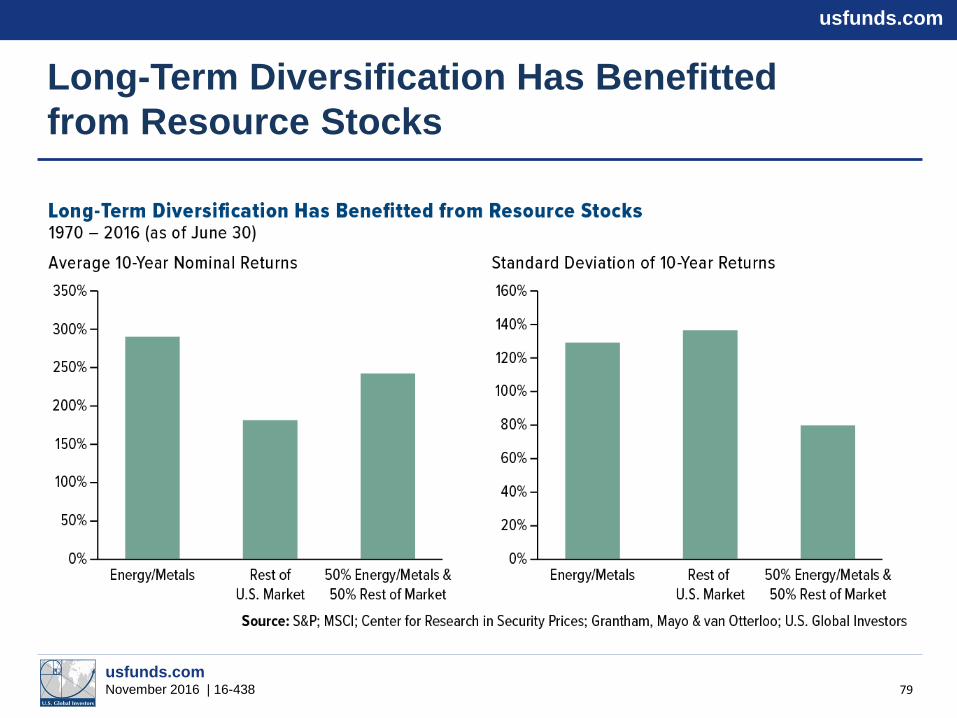
Long-Term Diversification Has Benefitted
from Resource Stocks
79

80
Are you tuning in? Don’t miss Frank Holmes’ weekly gold commentary on Kitco News
with Daniela Cambone!
Kitco.com on July 14, 2016

81

usfunds.com
usfunds.com November 2016 | 16-438
Recognition As an Industry Leader
in Investor Education — 80 Awards
82
80 Mutual Fund Education Alliance STAR Awards
2007 - 2016
MFEA
The Mutual Fund Education Alliance (MFEA) is a national industry association committed to investor education, and its
STAR Awards program recognizes marketing communications efforts in the mutual fund industry. The awards competition is
judged by industry professionals, and based on criteria including educational value, content, design and functionality.
usfunds.com
usfunds.com November 2016 | 16-438
Poll Question #3
Do you plan on adding to your gold allocation in the next 12 months?
83

usfunds.com
usfunds.com November 2016 | 16-438
Total Annualized Returns as of 9/30/2016
84
Expense cap is 1.90% for the World Precious Minerals Fund. Expense ratios as stated in the most recent prospectus. The
expense cap is a voluntary limit on total fund operating expenses (exclusive of any acquired fund fees and expenses,
performance fees, extraordinary expenses, taxes, brokerage commissions and interest) that U.S. Global Investors, Inc.
can modify or terminate at any time, which may lower a fund’s yield or return.
Performance data quoted above is historical. Past performance is no guarantee of future results. Results reflect the
reinvestment of dividends and other earnings. For a portion of periods, the fund had expense limitations, without which
returns would have been lower. Current performance may be higher or lower than the performance data quoted. The
principal value and investment return of an investment will fluctuate so that your shares, when redeemed, may be worth
more or less than their original cost. Performance does not include the effect of any direct fees described in the fund’s
prospectus (e.g., short-term trading fees of 0.05%) which, if applicable, would lower your total returns. Performance
quoted for periods of one year or less is cumulative and not annualized. Obtain performance data current to the most
recent month-end at www.usfunds.com or 1-800-US-FUNDS. High double-digit returns are attributable, in part, to
unusually favorable market conditions and may not be repeated or consistently achieved in the future.
One-Year Five-Year Ten-Year Gross Expense
Ratio
World Precious Minerals Fund
(UNWPX) 151.98% -6.49% -0.75% 2.01%
NYSE Arca Gold Miners Index 95.49% -12.44% -1.75% N/A

usfunds.com
usfunds.com November 2016 | 16-438
Disclosures
85
Please consider carefully a fund’s investment objectives, risks, charges and expenses. For this and other important information, obtain a fund prospectus by visiting www.usfunds.com or by calling 1-800-US-FUNDS (1-800-873-8637). Read it carefully before investing. Foreside Fund Services, LLC, Distributor. U.S. Global Investors is the investment adviser.
Gold, precious metals, and precious minerals funds may be susceptible to adverse economic, political or regulatory developments due to concentrating in a single theme. The prices of gold, precious metals, and precious minerals are subject to substantial price fluctuations over short periods of time and may be affected by unpredicted international monetary and political policies. We suggest investing no more than 5% to 10% of your portfolio in these sectors.
All opinions expressed and data provided are subject to change without notice. Some of these opinions may not be appropriate to every investor.
Past performance does not guarantee future results.
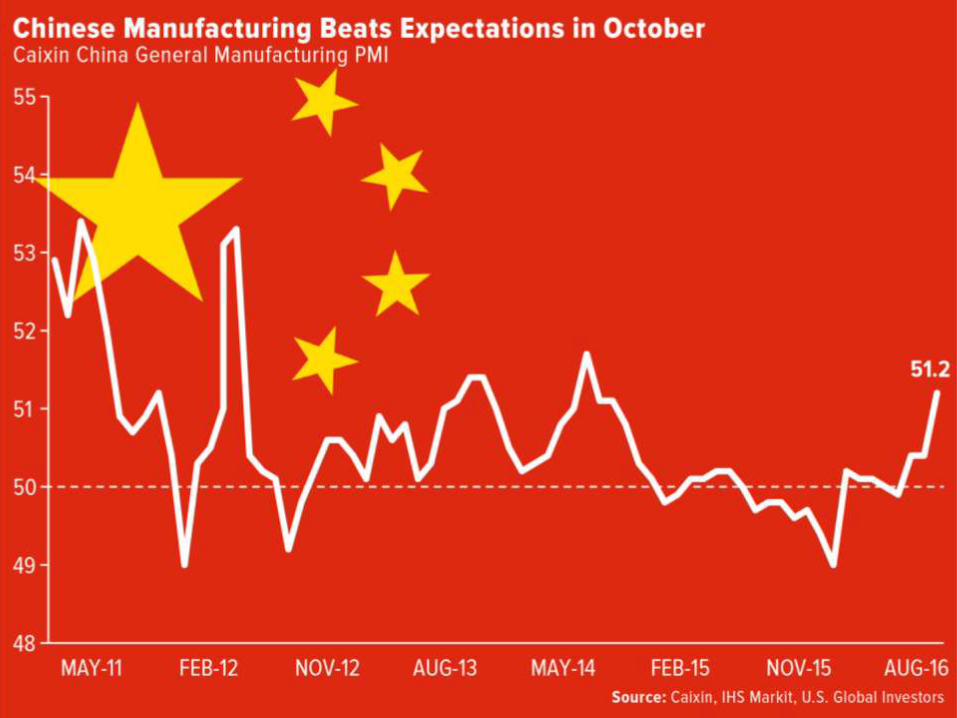
The Caixin China Manufacturing PMI is a composite indicator designed to provide an overall view of activity in the manufacturing sector and acts as a leading indicator for the whole economy.
usfunds.com
usfunds.com November 2016 | 16-438
Disclosures
86
The J.P. Morgan Global Purchasing Manager’s Index is an indicator of the economic health of the global manufacturing sector. The
PMI index is based on five major indicators: new orders, inventory levels, production, supplier deliveries and the employment
environment.
The NYSE Arca Gold BUGS (Basket of Unhedged Gold Stocks) Index (HUI) is a modified equal dollar weighted index of companies
involved in gold mining. The HUI Index was designed to provide significant exposure to near term movements in gold prices by
including companies that do not hedge their gold production beyond 1.5 years.
The NYSE Arca Gold Miners Index is a modified market capitalization weighted index comprised of publicly traded companies
involved primarily in the mining for gold and silver. The index benchmark value was 500.0 at the close of trading on December 20,
2002.
The S&P 500 Stock Index is a widely recognized capitalization-weighted index of 500 common stock prices in U.S. companies.
Standard deviation is a measure of the dispersion of a set of data from its mean. The more spread apart the data, the higher the
deviation. Standard deviation is also known as historical volatility.
The U.S. Trade Weighted Dollar Index provides a general indication of the international value of the U.S. dollar.
usfunds.com
usfunds.com November 2016 | 16-438
Disclosures
87
Fund portfolios are actively managed, and holdings may change daily. Holdings are reported as of the most recent quarter-end.
Companies not held in a U.S. Global Investors fund at quarter end may have previously been held in a fund and may be held in a
fund in the future.
Holdings in the World Precious Minerals Fund (UNWPX) as a percentage of net assets as of 09/30/2016: Anglo American Platinum
0.00%, Aquarius Platinum 0.00%, Evolution Mining 0.00%, Facebook 0.00%, Franco Nevada 0.00%, Harmony Gold Mining 0.00%,
Impala Platinum Holdings 0.00%, Newcrest Mining 0.00%, Newmont 0.00%, Northern Star Resources 0.33%, Pan African
Resources 0.00%, Pan American Silver 0.00%, Ramelius Resources 0.00%, Regis Resources 0.00%, Resolute Mining 0.00%,
Royal Gold Inc. 0.00%, Saracen Minerals 0.00%, Sibanye Gold 0.00%, Silver Wheaton 0.00%, St. Barbara 1.67%