Embed Size (px)
Citation preview
Memorandum
U.S. Department of Transportation Office of the Secretary of Transportation
Office of Inspector General
Subject: INFORMATION: Airline Industry Metrics
Date: July 2, 2003
From: Kenneth M. Mead Inspector General
Reply to Attn of:
JA-50 x69970
To: The Secretary Deputy Secretary Chief of Staff Associate Deputy Secretary Assistant Secretary for Aviation and International Affairs Assistant Secretary for Transportation Policy Federal Aviation Administrator Deputy Director, Bureau of Transportation Statistics
Attached is the fourth in a series of periodic updates to our airline industry metrics. As a result of the September 11, 2001 terrorist attacks, the war in Iraq, and the weakness in business travel that has persisted since early 2001, the airline industry is facing its greatest challenge since deregulation. The attached metrics were developed as a means for monitoring airline industry trends relating to domestic system demand and capacity, performance, finances, and air service at small airports. Overall, the metrics illustrate a number of important trends, including: �
�
The continuing weakness in passenger demand (down 11 percent in May 2003 from May 2000) coupled with the lack of full-fare business travelers (business travel dropped 26 percent in December 2002 from December 2000) and the drop in fare prices, continue to hamper the industry’s ability to increase yields, and in turn, return to profitability.
Due to the lessening distinction between full-fare and discount ticket prices, the Air Transport Association ceased collecting and reporting data on business fares as of January 2003. We are in the process of determining whether an alternative source for these data is available.
CC-2003-048
2
CC-2003-048
�
�
�
�
The larger network airlines, facing growing losses, have cut service and/or shifted capacity to their regional affiliates—leading to low-fare and other smaller airlines expanding their domestic market shares.
Although service cuts have helped increase passenger load factors, the “break even” load factor (the average percentage of paying passengers needed on all flights to cover airline costs) has risen even faster, due in large part to declining fares and higher fuel costs.
While the number of flight operations is approaching pre-September 11 levels, the average size of aircraft being flown has dropped due to the rapid introduction of regional jets and the retirement of larger aircraft. Finally, the smallest airports (non-hub) continue to experience a disproportionate reduction in air service.
If you have any questions or if I can be of further assistance, please feel free to contact me at (202) 366-1959, or Mark R. Dayton, Assistant Inspector General for Competition and Economic Analysis, at (202) 366-9970. Attachment
#
AIRLINE INDUSTRY METRICS
Trends on Demand and Capacity,
Aviation System Performance, Airline Finances, and Service to Small Airports
Number: CC-2003-048
Date Issued: July 2, 2003
SUMMARY OF AIRLINE INDUSTRY METRICS This is the fourth in a series of periodic updates to our airline industry metrics. As a result of the September 11 terrorist attacks, the war in Iraq, and the weakness in business travel demand that has persisted since early 2001, the airline industry is facing its greatest challenge since deregulation. Based on data obtained from the U.S. Department of Transportation (DOT), Federal Aviation Administration (FAA), and Air Transport Association (ATA), the Office of Inspector General has developed 38 metrics (see Figures 1 through 38, pages 6 through 12) for monitoring airline industry trends relating to domestic system demand and capacity, performance, finances, and air service at small airports.1 Although subject to change, these metrics provide decisionmakers with past, present, and future indicators of domestic service levels and general state of the airline industry.
I. Air Service Demand and Capacity
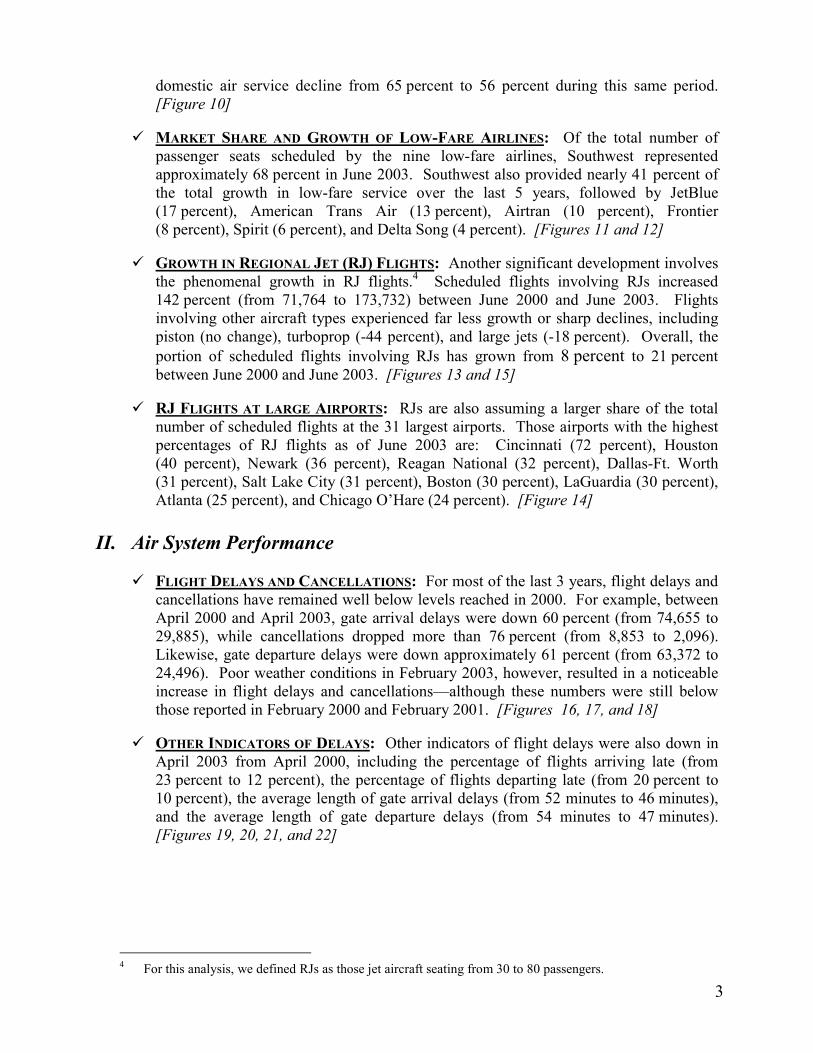
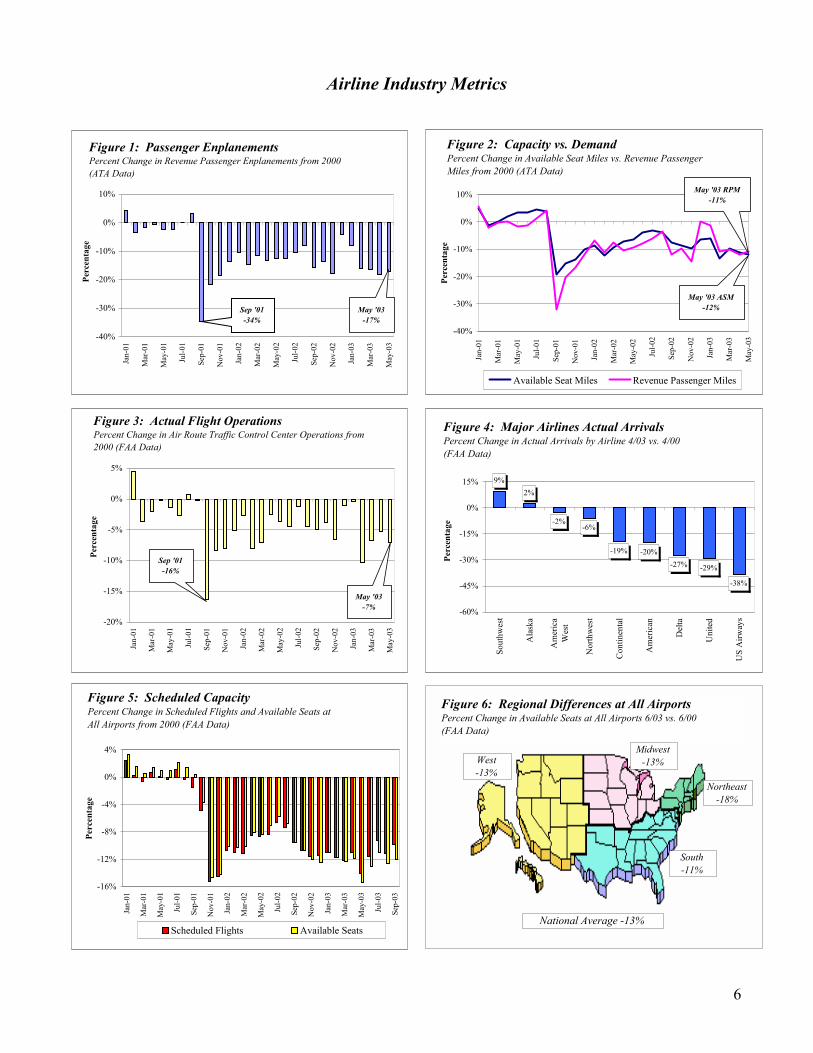
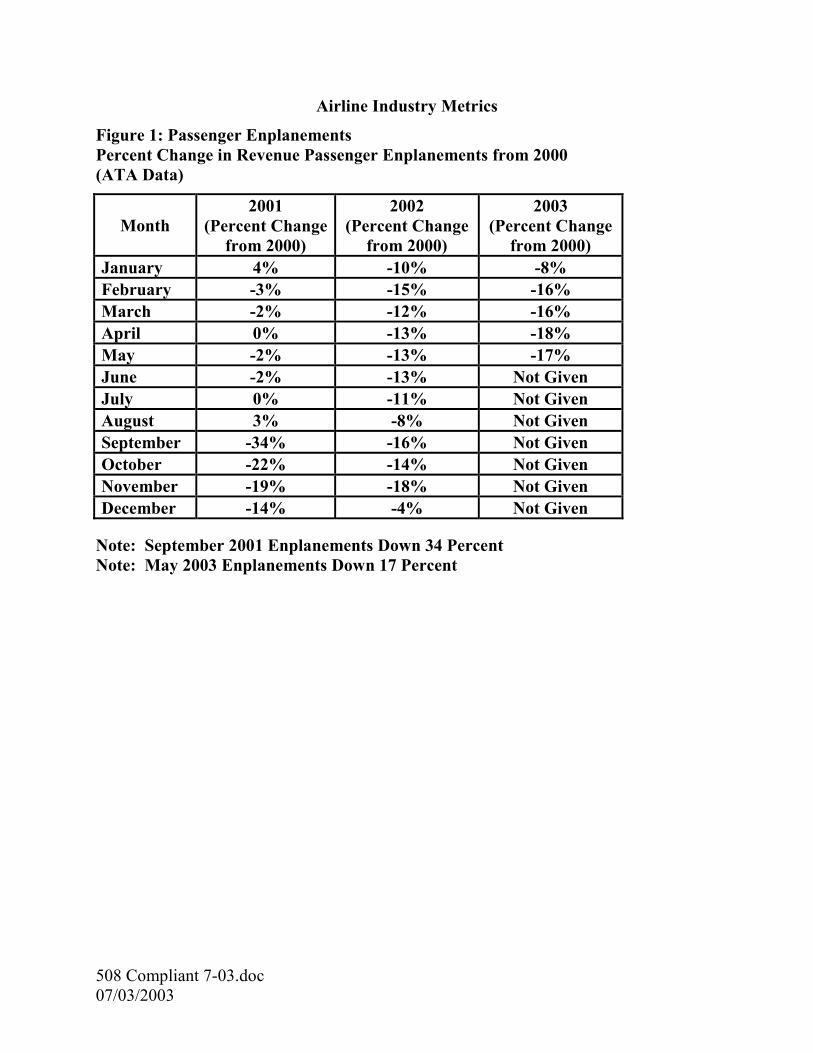
� AIR TRAFFIC DEMAND: Although the number of air travelers had been increasing from the sharp decline following September 11, 2001, the number began falling again during the latter part of 2002. While the December 2002 number showed some improvement (down only 4 percent from 2 years earlier), this was due in large part to the timing of holiday travel. With the approach of the war in Iraq, however, passenger enplanements again began dropping, with February through May 2003 numbers down between 16 percent and 18 percent from the same period in 2000. [Figure 1]
� CAPACITY VERSUS DEMAND: Actual domestic capacity as measured in available seat
miles (ASMs) increased after September 11, 2001, at a faster rate than passenger demand as measured by revenue passenger miles (RPMs)—especially during the spring and early summer of 2002. However, during the latter part of 2002 and first 2 months of 2003, the reverse appeared to be the case as airlines brought capacity in line with travel demand. As of May 2003, passenger demand (RPMs) and actual capacity (ASMs) were down 11 percent and 12 percent, respectively, from May 2000. [Figure 2]
� FLIGHT OPERATIONS: FAA’s Air Route Traffic Control Centers reported handling
nearly the same number of flight operations in January 2003 as in January 2000.2 Nevertheless, the last 4 months have shown a significant decrease with the number of flight operations down 7 percent in May 2003 versus May 2000. [Figure 3]
� MAJOR AIRLINES ARRIVALS: The decline in capacity has not been uniform among
major carries as roughly shown by flight arrivals. Southwest and Alaska reported increases in the number of flight arrivals (i.e., 9 percent and 2 percent, respectively)
1 Due to the sizable impact that the terrorist attacks had on domestic flight service during the latter part of
2001, we used 2000 as the base year in many of our metrics. 2 Includes both scheduled and non-scheduled (for example, general aviation and military) air traffic.
1
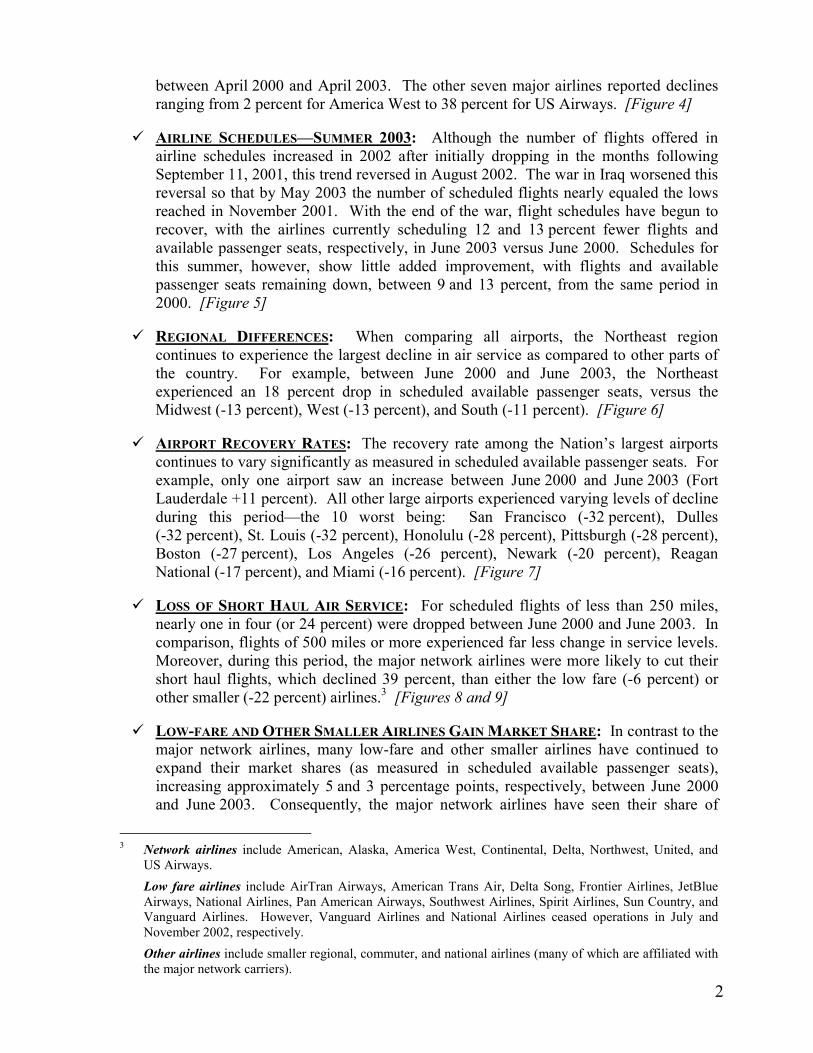
between April 2000 and April 2003. The other seven major airlines reported declines ranging from 2 percent for America West to 38 percent for US Airways. [Figure 4]
� AIRLINE SCHEDULES—SUMMER 2003: Although the number of flights offered in
airline schedules increased in 2002 after initially dropping in the months following September 11, 2001, this trend reversed in August 2002. The war in Iraq worsened this reversal so that by May 2003 the number of scheduled flights nearly equaled the lows reached in November 2001. With the end of the war, flight schedules have begun to recover, with the airlines currently scheduling 12 and 13 percent fewer flights and available passenger seats, respectively, in June 2003 versus June 2000. Schedules for this summer, however, show little added improvement, with flights and available passenger seats remaining down, between 9 and 13 percent, from the same period in 2000. [Figure 5]
� REGIONAL DIFFERENCES: When comparing all airports, the Northeast region
continues to experience the largest decline in air service as compared to other parts of the country. For example, between June 2000 and June 2003, the Northeast experienced an 18 percent drop in scheduled available passenger seats, versus the Midwest (-13 percent), West (-13 percent), and South (-11 percent). [Figure 6]
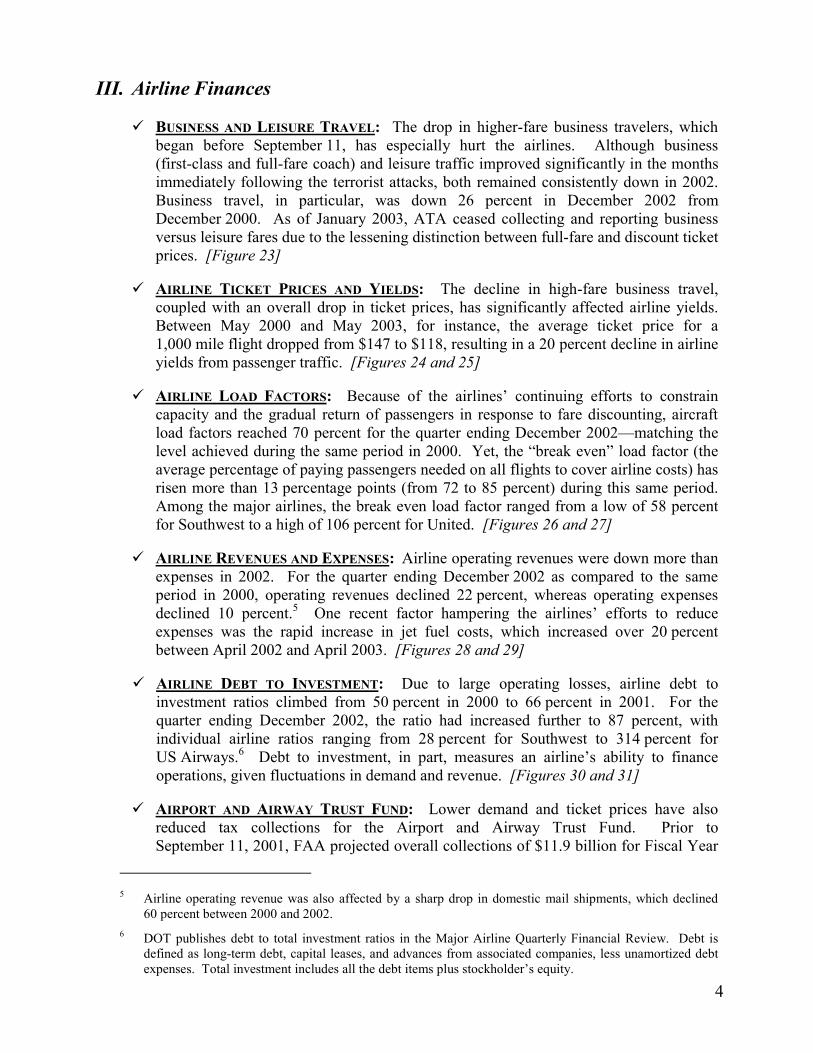
� AIRPORT RECOVERY RATES: The recovery rate among the Nation’s largest airports
continues to vary significantly as measured in scheduled available passenger seats. For example, only one airport saw an increase between June 2000 and June 2003 (Fort Lauderdale +11 percent). All other large airports experienced varying levels of decline during this period—the 10 worst being: San Francisco (-32 percent), Dulles (-32 percent), St. Louis (-32 percent), Honolulu (-28 percent), Pittsburgh (-28 percent), Boston (-27 percent), Los Angeles (-26 percent), Newark (-20 percent), Reagan National (-17 percent), and Miami (-16 percent). [Figure 7]
� LOSS OF SHORT HAUL AIR SERVICE: For scheduled flights of less than 250 miles,
nearly one in four (or 24 percent) were dropped between June 2000 and June 2003. In comparison, flights of 500 miles or more experienced far less change in service levels. Moreover, during this period, the major network airlines were more likely to cut their short haul flights, which declined 39 percent, than either the low fare (-6 percent) or other smaller (-22 percent) airlines.3 [Figures 8 and 9]
� LOW-FARE AND OTHER SMALLER AIRLINES GAIN MARKET SHARE: In contrast to the
major network airlines, many low-fare and other smaller airlines have continued to expand their market shares (as measured in scheduled available passenger seats), increasing approximately 5 and 3 percentage points, respectively, between June 2000 and June 2003. Consequently, the major network airlines have seen their share of
3 Network airlines include American, Alaska, America West, Continental, Delta, Northwest, United, and
US Airways.
Low fare airlines include AirTran Airways, American Trans Air, Delta Song, Frontier Airlines, JetBlue Airways, National Airlines, Pan American Airways, Southwest Airlines, Spirit Airlines, Sun Country, and Vanguard Airlines. However, Vanguard Airlines and National Airlines ceased operations in July and November 2002, respectively.
Other airlines include smaller regional, commuter, and national airlines (many of which are affiliated with the major network carriers).
2
domestic air service decline from 65 percent to 56 percent during this same period. [Figure 10]
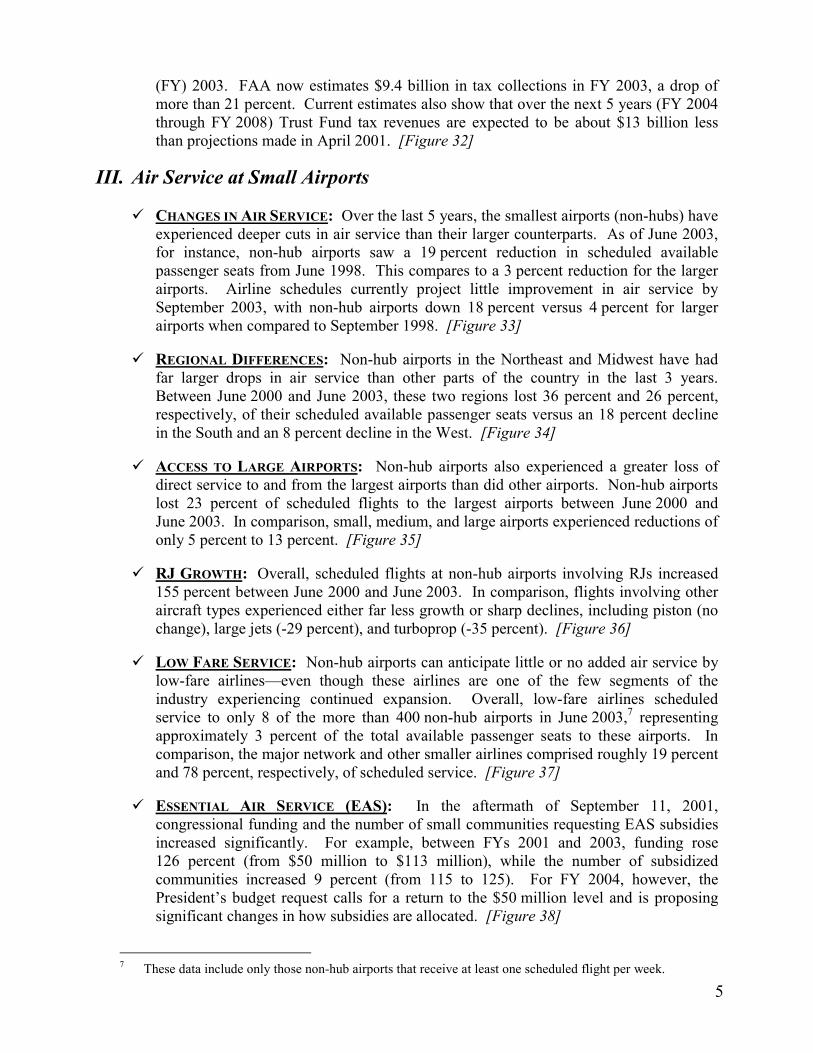
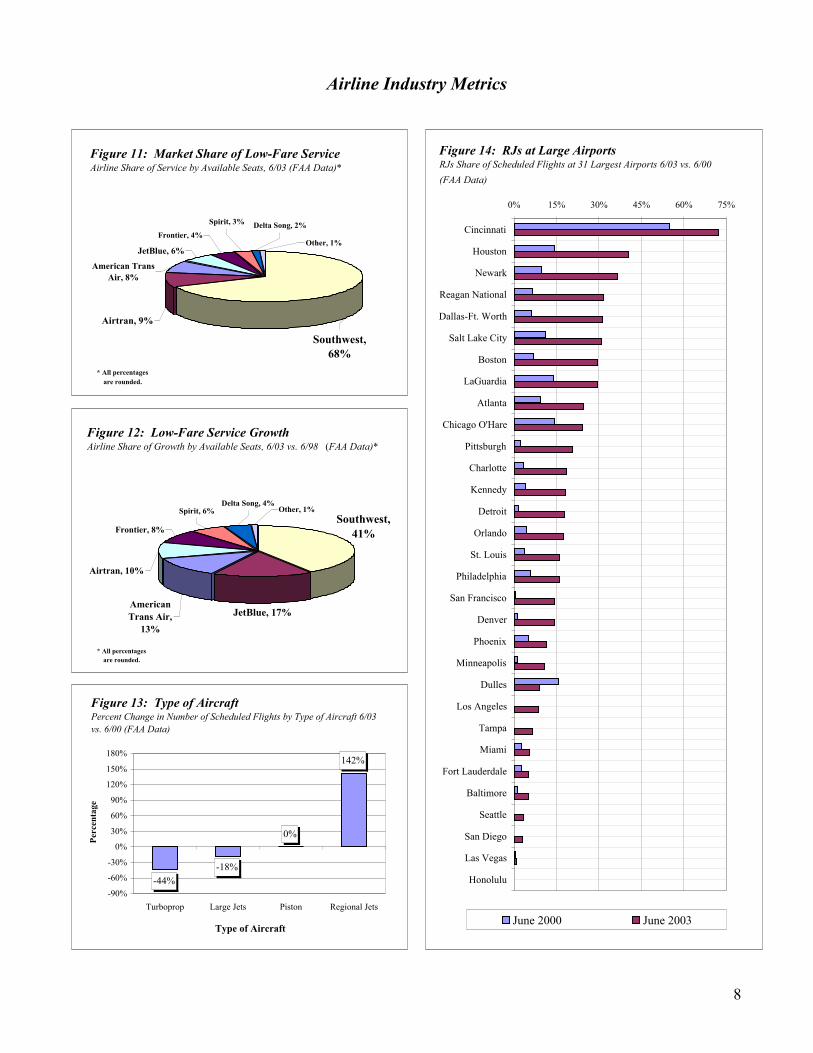
� MARKET SHARE AND GROWTH OF LOW-FARE AIRLINES: Of the total number of
passenger seats scheduled by the nine low-fare airlines, Southwest represented approximately 68 percent in June 2003. Southwest also provided nearly 41 percent of the total growth in low-fare service over the last 5 years, followed by JetBlue (17 percent), American Trans Air (13 percent), Airtran (10 percent), Frontier (8 percent), Spirit (6 percent), and Delta Song (4 percent). [Figures 11 and 12]
� GROWTH IN REGIONAL JET (RJ) FLIGHTS: Another significant development involves
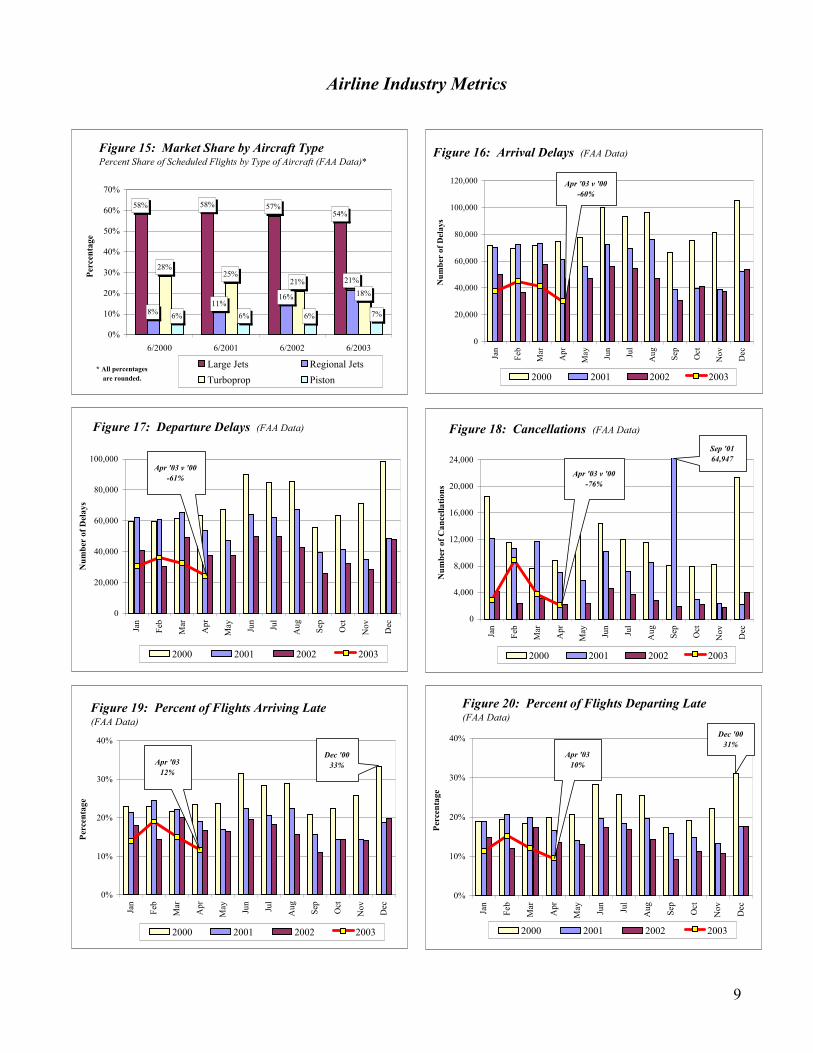
the phenomenal growth in RJ flights.4 Scheduled flights involving RJs increased 142 percent (from 71,764 to 173,732) between June 2000 and June 2003. Flights involving other aircraft types experienced far less growth or sharp declines, including piston (no change), turboprop (-44 percent), and large jets (-18 percent). Overall, the portion of scheduled flights involving RJs has grown from 8 percent to 21 percent between June 2000 and June 2003. [Figures 13 and 15]
� RJ FLIGHTS AT LARGE AIRPORTS: RJs are also assuming a larger share of the total
number of scheduled flights at the 31 largest airports. Those airports with the highest percentages of RJ flights as of June 2003 are: Cincinnati (72 percent), Houston (40 percent), Newark (36 percent), Reagan National (32 percent), Dallas-Ft. Worth (31 percent), Salt Lake City (31 percent), Boston (30 percent), LaGuardia (30 percent), Atlanta (25 percent), and Chicago O’Hare (24 percent). [Figure 14]
II. Air System Performance
� FLIGHT DELAYS AND CANCELLATIONS: For most of the last 3 years, flight delays and
cancellations have remained well below levels reached in 2000. For example, between April 2000 and April 2003, gate arrival delays were down 60 percent (from 74,655 to 29,885), while cancellations dropped more than 76 percent (from 8,853 to 2,096). Likewise, gate departure delays were down approximately 61 percent (from 63,372 to 24,496). Poor weather conditions in February 2003, however, resulted in a noticeable increase in flight delays and cancellations—although these numbers were still below those reported in February 2000 and February 2001. [Figures 16, 17, and 18]
� OTHER INDICATORS OF DELAYS: Other indicators of flight delays were also down in
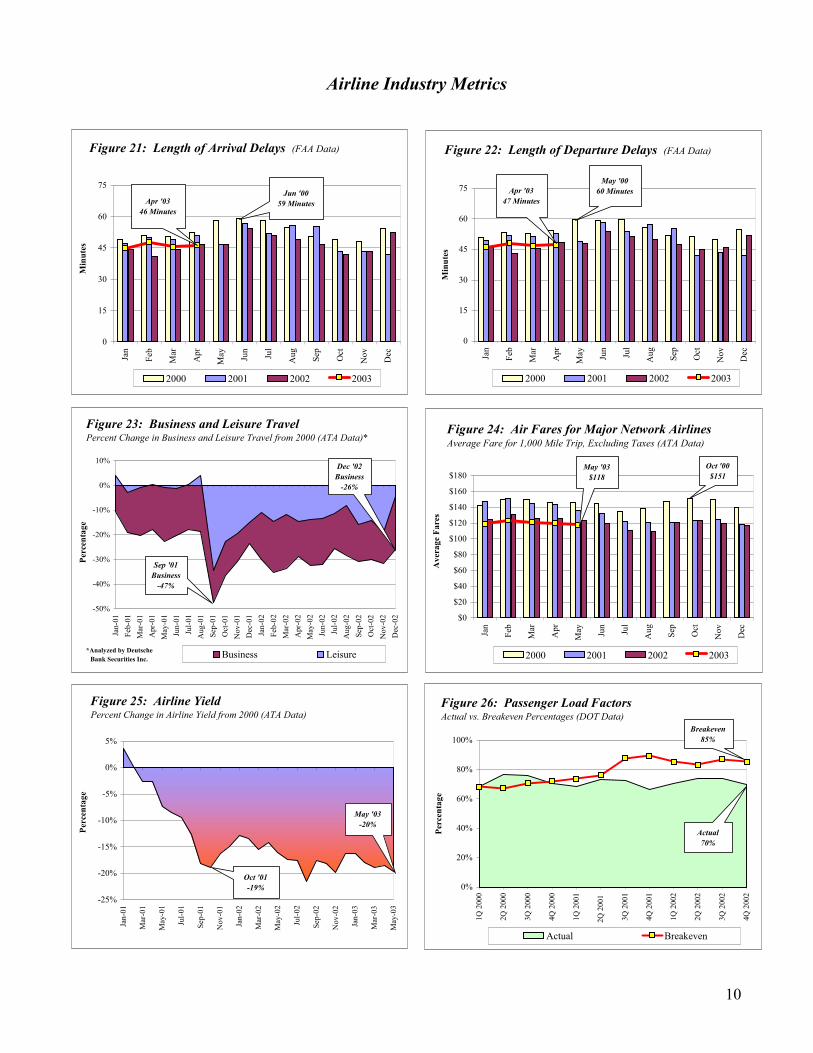
April 2003 from April 2000, including the percentage of flights arriving late (from 23 percent to 12 percent), the percentage of flights departing late (from 20 percent to 10 percent), the average length of gate arrival delays (from 52 minutes to 46 minutes), and the average length of gate departure delays (from 54 minutes to 47 minutes). [Figures 19, 20, 21, and 22]
4 For this analysis, we defined RJs as those jet aircraft seating from 30 to 80 passengers.
3
III. Airline Finances � BUSINESS AND LEISURE TRAVEL: The drop in higher-fare business travelers, which
began before September 11, has especially hurt the airlines. Although business (first-class and full-fare coach) and leisure traffic improved significantly in the months immediately following the terrorist attacks, both remained consistently down in 2002. Business travel, in particular, was down 26 percent in December 2002 from December 2000. As of January 2003, ATA ceased collecting and reporting business versus leisure fares due to the lessening distinction between full-fare and discount ticket prices. [Figure 23]
� AIRLINE TICKET PRICES AND YIELDS: The decline in high-fare business travel, coupled with an overall drop in ticket prices, has significantly affected airline yields. Between May 2000 and May 2003, for instance, the average ticket price for a 1,000 mile flight dropped from $147 to $118, resulting in a 20 percent decline in airline yields from passenger traffic. [Figures 24 and 25]
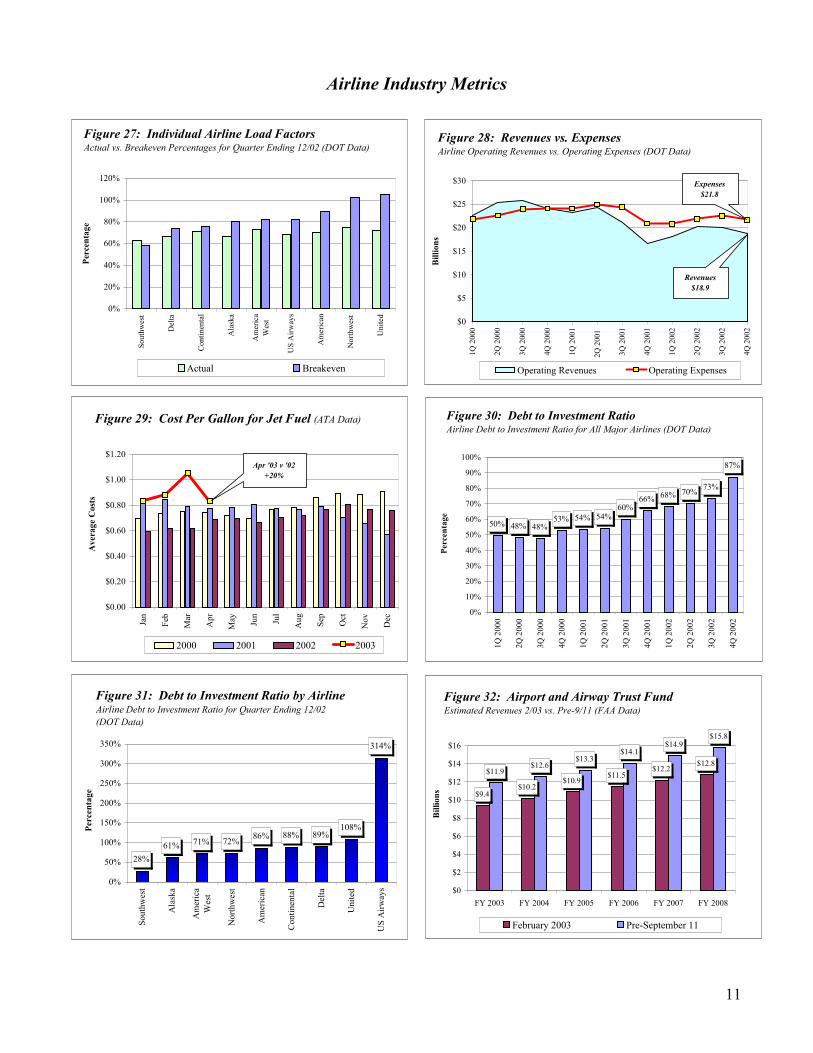
� AIRLINE LOAD FACTORS: Because of the airlines’ continuing efforts to constrain capacity and the gradual return of passengers in response to fare discounting, aircraft load factors reached 70 percent for the quarter ending December 2002—matching the level achieved during the same period in 2000. Yet, the “break even” load factor (the average percentage of paying passengers needed on all flights to cover airline costs) has risen more than 13 percentage points (from 72 to 85 percent) during this same period. Among the major airlines, the break even load factor ranged from a low of 58 percent for Southwest to a high of 106 percent for United. [Figures 26 and 27]
� AIRLINE REVENUES AND EXPENSES: Airline operating revenues were down more than expenses in 2002. For the quarter ending December 2002 as compared to the same period in 2000, operating revenues declined 22 percent, whereas operating expenses declined 10 percent.5 One recent factor hampering the airlines’ efforts to reduce expenses was the rapid increase in jet fuel costs, which increased over 20 percent between April 2002 and April 2003. [Figures 28 and 29]
� AIRLINE DEBT TO INVESTMENT: Due to large operating losses, airline debt to investment ratios climbed from 50 percent in 2000 to 66 percent in 2001. For the quarter ending December 2002, the ratio had increased further to 87 percent, with individual airline ratios ranging from 28 percent for Southwest to 314 percent for US Airways.6 Debt to investment, in part, measures an airline’s ability to finance operations, given fluctuations in demand and revenue. [Figures 30 and 31]
� AIRPORT AND AIRWAY TRUST FUND: Lower demand and ticket prices have also reduced tax collections for the Airport and Airway Trust Fund. Prior to September 11, 2001, FAA projected overall collections of $11.9 billion for Fiscal Year
5 Airline operating revenue was also affected by a sharp drop in domestic mail shipments, which declined 60 percent between 2000 and 2002.
6 DOT publishes debt to total investment ratios in the Major Airline Quarterly Financial Review. Debt is
defined as long-term debt, capital leases, and advances from associated companies, less unamortized debt expenses. Total investment includes all the debt items plus stockholder’s equity.
4
5
(FY) 2003. FAA now estimates $9.4 billion in tax collections in FY 2003, a drop of more than 21 percent. Current estimates also show that over the next 5 years (FY 2004 through FY 2008) Trust Fund tax revenues are expected to be about $13 billion less than projections made in April 2001. [Figure 32]
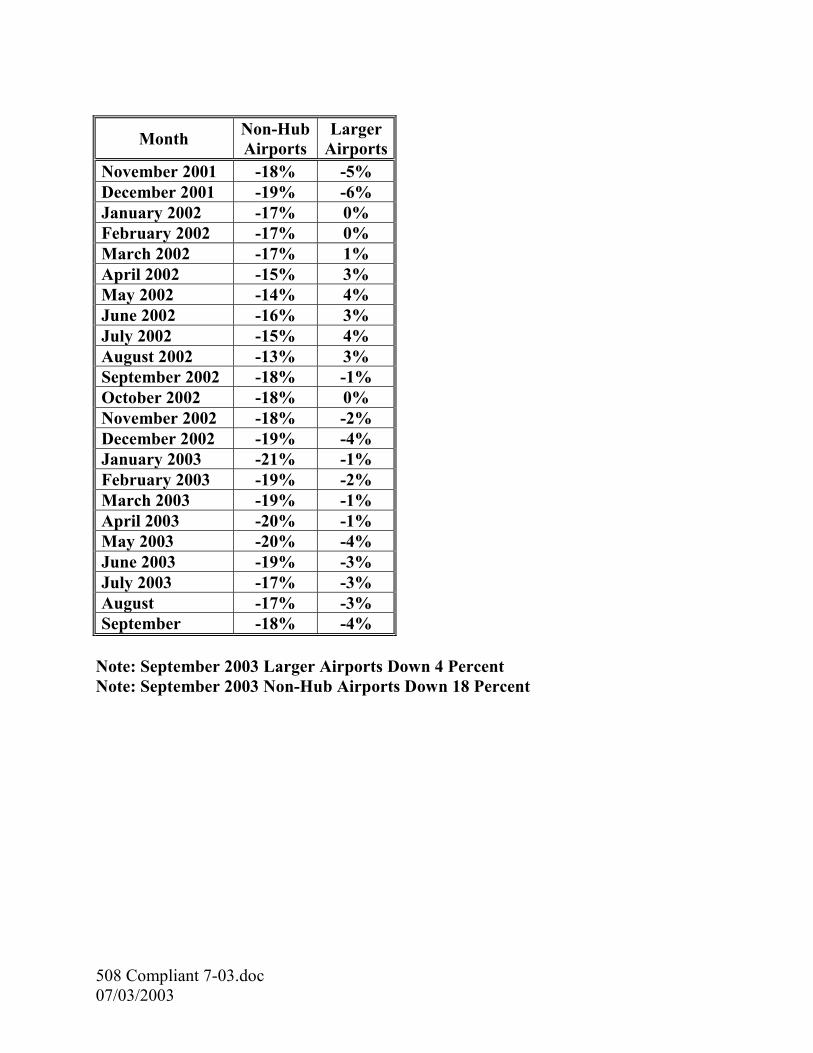
III. Air Service at Small Airports � CHANGES IN AIR SERVICE: Over the last 5 years, the smallest airports (non-hubs) have
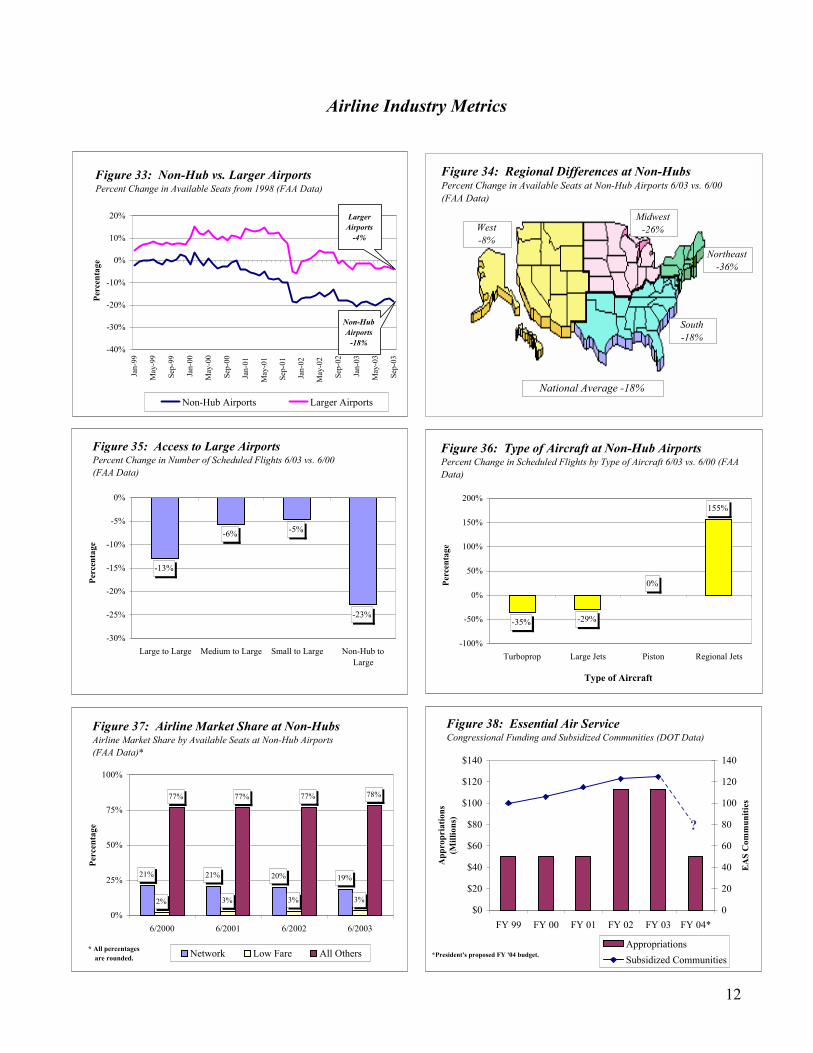
experienced deeper cuts in air service than their larger counterparts. As of June 2003, for instance, non-hub airports saw a 19 percent reduction in scheduled available passenger seats from June 1998. This compares to a 3 percent reduction for the larger airports. Airline schedules currently project little improvement in air service by September 2003, with non-hub airports down 18 percent versus 4 percent for larger airports when compared to September 1998. [Figure 33]
� REGIONAL DIFFERENCES: Non-hub airports in the Northeast and Midwest have had
far larger drops in air service than other parts of the country in the last 3 years. Between June 2000 and June 2003, these two regions lost 36 percent and 26 percent, respectively, of their scheduled available passenger seats versus an 18 percent decline in the South and an 8 percent decline in the West. [Figure 34]
� ACCESS TO LARGE AIRPORTS: Non-hub airports also experienced a greater loss of
direct service to and from the largest airports than did other airports. Non-hub airports lost 23 percent of scheduled flights to the largest airports between June 2000 and June 2003. In comparison, small, medium, and large airports experienced reductions of only 5 percent to 13 percent. [Figure 35]
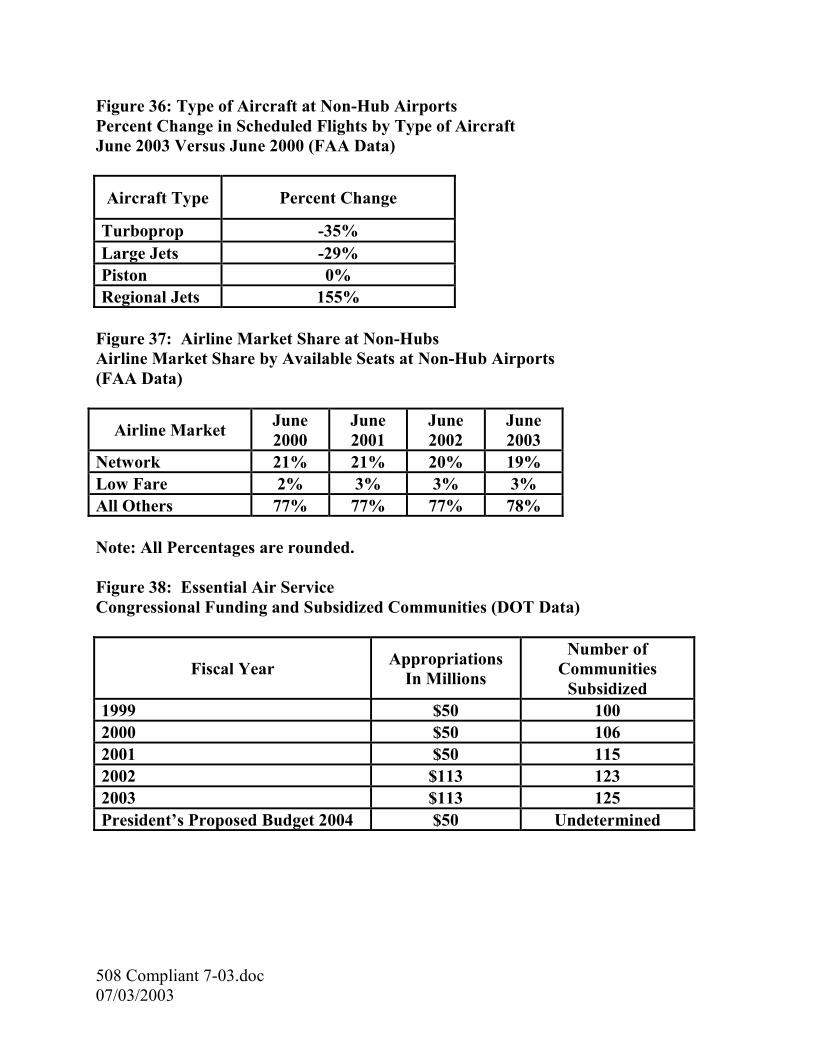
� RJ GROWTH: Overall, scheduled flights at non-hub airports involving RJs increased
155 percent between June 2000 and June 2003. In comparison, flights involving other aircraft types experienced either far less growth or sharp declines, including piston (no change), large jets (-29 percent), and turboprop (-35 percent). [Figure 36]
� LOW FARE SERVICE: Non-hub airports can anticipate little or no added air service by
low-fare airlines—even though these airlines are one of the few segments of the industry experiencing continued expansion. Overall, low-fare airlines scheduled service to only 8 of the more than 400 non-hub airports in June 2003,7 representing approximately 3 percent of the total available passenger seats to these airports. In comparison, the major network and other smaller airlines comprised roughly 19 percent and 78 percent, respectively, of scheduled service. [Figure 37]
� ESSENTIAL AIR SERVICE (EAS): In the aftermath of September 11, 2001,
congressional funding and the number of small communities requesting EAS subsidies increased significantly. For example, between FYs 2001 and 2003, funding rose 126 percent (from $50 million to $113 million), while the number of subsidized communities increased 9 percent (from 115 to 125). For FY 2004, however, the President’s budget request calls for a return to the $50 million level and is proposing significant changes in how subsidies are allocated. [Figure 38]
7 These data include only those non-hub airports that receive at least one scheduled flight per week.
Airline Industry Metrics
Figure 6: Regional Differences at All AirportsPercent Change in Available Seats at All Airports 6/03 vs. 6/00(FAA Data)
National Average -13%
West-13%
Midwest-13%
Northeast-18%
South-11%
9%2%
-2%-6%
-19% -20%-27% -29%
-38%
-60%
-45%
-30%
-15%
0%
15%
Sout
hwes
t
Ala
ska
Am
eric
aW
est
Nor
thw
est
Con
tinen
tal
Am
eric
an
Del
ta
Uni
ted
US
Airw
ays
Perc
enta
ge
Figure 4: Major Airlines Actual ArrivalsPercent Change in Actual Arrivals by Airline 4/03 vs. 4/00(FAA Data)
-16%
-12%
-8%
-4%
0%
4%
Jan-
01
Mar
-01
May
-01
Jul-0
1
Sep-
01
Nov
-01
Jan-
02
Mar
-02
May
-02
Jul-0
2
Sep-
02
Nov
-02
Jan-
03
Mar
-03
May
-03
Jul-0
3
Sep-
03
Perc
enta
ge
Scheduled Flights Available Seats
Figure 5: Scheduled CapacityPercent Change in Scheduled Flights and Available Seats at All Airports from 2000 (FAA Data)
-40%
-30%
-20%
-10%
0%
10%
Jan-
01
Mar
-01
May
-01
Jul-0
1
Sep-
01
Nov
-01
Jan-
02
Mar
-02
May
-02
Jul-0
2
Sep-
02
Nov
-02
Jan-
03
Mar
-03
May
-03
Perc
enta
ge
Figure 1: Passenger EnplanementsPercent Change in Revenue Passenger Enplanements from 2000 (ATA Data)
May '03-17%
Sep '01-34%
-40%
-30%
-20%
-10%
0%
10%
Jan-
01
Mar
-01
May
-01
Jul-0
1
Sep-
01
Nov
-01
Jan-
02
Mar
-02
May
-02
Jul-0
2
Sep-
02
Nov
-02
Jan-
03
Mar
-03
May
-03
Perc
enta
ge
Available Seat Miles Revenue Passenger Miles
Figure 2: Capacity vs. DemandPercent Change in Available Seat Miles vs. Revenue PassengerMiles from 2000 (ATA Data)
May '03 RPM-11%
May '03 ASM-12%
-20%
-15%
-10%
-5%
0%
5%
Jan-
01
Mar
-01
May
-01
Jul-0
1
Sep-
01
Nov
-01
Jan-
02
Mar
-02
May
-02
Jul-0
2
Sep-
02
Nov
-02
Jan-
03
Mar
-03
May
-03
Perc
enta
ge
Figure 3: Actual Flight OperationsPercent Change in Air Route Traffic Control Center Operations from 2000 (FAA Data)
Sep '01-16%
May '03-7%
6

Airline Industry Metrics
56%60%
64%65%
21%19%17%15%
23%21%20%20%
0%
15%
30%
45%
60%
75%
6/2000 6/2001 6/2002 6/2003
Perc
enta
ge
Network Low Fare All Others
Figure 10: Airline Market ShareAirline Market Share by Available Seats (FAA Data)*
* All percentagesare rounded.
-24%
-12%
5%
-2%
-40%
-30%
-20%
-10%
0%
10%
0 to 249 250 to 499 500 to 999 1,000+
Miles
Perc
enta
ge
Figure 8: Length of FlightPercent Change in Scheduled Flights by Length of Flight6/03 vs. 6/00 (FAA Data)
-39%
-6%
-22%
-50%
-40%
-30%
-20%
-10%
0%
Network Low Fare All Others
Type of Air Carrier
Perc
enta
ge
Figure 9: Short Haul Flights by Type of AirlinePercent Change in Scheduled Flights Less Than 250 Miles by Type of Airline 6/03 vs. 6/00 (FAA Data)
-50% -40% -30% -20% -10% 0% 10% 20%
Fort Lauderdale
Baltimore
Kennedy
Las Vegas
Salt Lake City
Houston
Charlotte
Tampa
Minneapolis
San Diego
Atlanta
Detroit
Cincinnati
Seattle
LaGuardia
Phoenix
Orlando
Denver
Chicago O'Hare
Philadelphia
Dallas-Ft. Worth
Miami
Reagan National
Newark
Los Angeles
Boston
Pittsburgh
Honolulu
St. Louis
Dulles
San Francisco
Scheduled Flights Available Seats
Figure 7: Large AirportsPercent Change in Scheduled Flights and Available Seats at the 31 Largest Airports 6/03 vs. 6/00 (FAA Data)
7
Airline Industry Metrics
Other, 1%
Southwest, 68%
Airtran, 9%
American Trans Air, 8%
JetBlue, 6%
Frontier, 4%
Spirit, 3% Delta Song, 2%
* All percentagesare rounded.
Figure 11: Market Share of Low-Fare ServiceAirline Share of Service by Available Seats, 6/03 (FAA Data)*
Delta Song, 4%Spirit, 6%
Frontier, 8%
Airtran, 10%
American Trans Air,
13%
JetBlue, 17%
Southwest, 41%
Other, 1%
* All percentagesare rounded.
Figure 12: Low-Fare Service GrowthAirline Share of Growth by Available Seats, 6/03 vs. 6/98 (FAA Data)*
-44%-18%
0%
142%
-90%
-60%
-30%
0%
30%
60%
90%
120%
150%
180%
Turboprop Large Jets Piston Regional Jets
Type of Aircraft
Perc
enta
ge
Figure 13: Type of AircraftPercent Change in Number of Scheduled Flights by Type of Aircraft 6/03 vs. 6/00 (FAA Data)
0% 15% 30% 45% 60% 75%
Cincinnati
Houston
Newark
Reagan National
Dallas-Ft. Worth
Salt Lake City
Boston
LaGuardia
Atlanta
Chicago O'Hare
Pittsburgh
Charlotte
Kennedy
Detroit
Orlando
St. Louis
Philadelphia
San Francisco
Denver
Phoenix
Minneapolis
Dulles
Los Angeles
Tampa
Miami
Fort Lauderdale
Baltimore
Seattle
San Diego
Las Vegas
Honolulu
June 2000 June 2003
Figure 14: RJs at Large AirportsRJs Share of Scheduled Flights at 31 Largest Airports 6/03 vs. 6/00 (FAA Data)
8
Airline Industry Metrics
0
20,000
40,000
60,000
80,000
100,000
120,000
Jan
Feb
Mar
Apr
May Jun
Jul
Aug Sep
Oct
Nov Dec
Num
ber
of D
elay
s
2000 2001 2002 2003
Figure 16: Arrival Delays (FAA Data)
Apr '03 v '00-60%
0
20,000
40,000
60,000
80,000
100,000
Jan
Feb
Mar
Apr
May Jun
Jul
Aug Sep
Oct
Nov Dec
Num
ber
of D
elay
s
2000 2001 2002 2003
Figure 17: Departure Delays (FAA Data)
Apr '03 v '00-61%
0
4,000
8,000
12,000
16,000
20,000
24,000
Jan
Feb
Mar
Apr
May Jun
Jul
Aug Sep
Oct
Nov Dec
Num
ber
of C
ance
llatio
ns
2000 2001 2002 2003
Figure 18: Cancellations (FAA Data)
Apr '03 v '00-76%
Sep '01 64,947
0%
10%
20%
30%
40%
Jan
Feb
Mar
Apr
May Jun
Jul
Aug Sep
Oct
Nov Dec
Perc
enta
ge
2000 2001 2002 2003
Figure 19: Percent of Flights Arriving Late (FAA Data)
Apr '03 12%
Dec '00 33%
0%
10%
20%
30%
40%
Jan
Feb
Mar
Apr
May Jun
Jul
Aug Sep
Oct
Nov Dec
Perc
enta
ge
2000 2001 2002 2003
Figure 20: Percent of Flights Departing Late(FAA Data)
Apr '0310%
Dec '0031%
54%57%58%58%
8%11%
21%
16%
25%28%
21%18%
7%6%6%6%
0%
10%
20%
30%
40%
50%
60%
70%
6/2000 6/2001 6/2002 6/2003
Perc
enta
ge
Large Jets Regional JetsTurboprop Piston
Figure 15: Market Share by Aircraft TypePercent Share of Scheduled Flights by Type of Aircraft (FAA Data)*
* All percentagesare rounded.
9
Airline Industry Metrics
-50%
-40%
-30%
-20%
-10%
0%
10%
Jan-
01Fe
b-01
Mar
-01
Apr
-01
May
-01
Jun-
01Ju
l-01
Aug
-01
Sep-
01O
ct-0
1N
ov-0
1D
ec-0
1Ja
n-02
Feb-
02M
ar-0
2A
pr-0
2M
ay-0
2Ju
n-02
Jul-0
2A
ug-0
2Se
p-02
Oct
-02
Nov
-02
Dec
-02
*Analyzed by Deutsche Bank Securities Inc.
Perc
enta
ge
Business Leisure
Figure 23: Business and Leisure TravelPercent Change in Business and Leisure Travel from 2000 (ATA Data)*
Dec '02Business
-26%
Sep '01 Business
-47%
0%
20%
40%
60%
80%
100%
1Q 2
000
2Q 2
000
3Q 2
000
4Q 2
000
1Q 2
001
2Q 2
001
3Q 2
001
4Q 2
001
1Q 2
002
2Q 2
002
3Q 2
002
4Q 2
002
Perc
enta
ge
Actual Breakeven
Figure 26: Passenger Load FactorsActual vs. Breakeven Percentages (DOT Data)
Breakeven85%
Actual70%
0
15
30
45
60
75
Jan
Feb
Mar
Apr
May Jun
Jul
Aug Sep
Oct
Nov Dec
Min
utes
2000 2001 2002 2003
Figure 21: Length of Arrival Delays (FAA Data)
Apr '0346 Minutes
Jun '0059 Minutes
0
15
30
45
60
75
Jan
Feb
Mar
Apr
May Jun
Jul
Aug Sep
Oct
Nov Dec
Min
utes
2000 2001 2002 2003
Figure 22: Length of Departure Delays (FAA Data)
Apr '0347 Minutes
May '0060 Minutes
$0
$20
$40
$60
$80
$100
$120
$140
$160
$180Ja
n
Feb
Mar
Apr
May Jun
Jul
Aug Sep
Oct
Nov Dec
Ave
rage
Far
es
2000 2001 2002 2003
Figure 24: Air Fares for Major Network AirlinesAverage Fare for 1,000 Mile Trip, Excluding Taxes (ATA Data)
May '03$118
Oct '00 $151
-25%
-20%
-15%
-10%
-5%
0%
5%
Jan-
01
Mar
-01
May
-01
Jul-0
1
Sep-
01
Nov
-01
Jan-
02
Mar
-02
May
-02
Jul-0
2
Sep-
02
Nov
-02
Jan-
03
Mar
-03
May
-03
Perc
enta
ge
Figure 25: Airline YieldPercent Change in Airline Yield from 2000 (ATA Data)
Oct '01-19%
May '03-20%
10
Airline Industry Metrics
$9.4$10.2
$10.9$11.5
$12.2$12.8
$11.9$12.6
$13.3$14.1
$14.9$15.8
$0
$2
$4
$6
$8
$10
$12
$14
$16
FY 2003 FY 2004 FY 2005 FY 2006 FY 2007 FY 2008
Bill
ions
February 2003 Pre-September 11
Figure 32: Airport and Airway Trust FundEstimated Revenues 2/03 vs. Pre-9/11 (FAA Data)
28%61% 71% 72% 86% 88% 89%
108%
314%
0%
50%
100%
150%
200%
250%
300%
350%
Sout
hwes
t
Ala
ska
Am
eric
aW
est
Nor
thw
est
Am
eric
an
Con
tinen
tal
Del
ta
Uni
ted
US
Airw
ays
Perc
enta
ge
Figure 31: Debt to Investment Ratio by AirlineAirline Debt to Investment Ratio for Quarter Ending 12/02(DOT Data)
0%
20%
40%
60%
80%
100%
120%
Sout
hwes
t
Del
ta
Con
tinen
tal
Ala
ska
Am
eric
aW
est
US
Airw
ays
Am
eric
an
Nor
thw
est
Uni
ted
Perc
enta
ge
Actual Breakeven
Figure 27: Individual Airline Load FactorsActual vs. Breakeven Percentages for Quarter Ending 12/02 (DOT Data)
$0
$5
$10
$15
$20
$25
$30
1Q 2
000
2Q 2
000
3Q 2
000
4Q 2
000
1Q 2
001
2Q 2
001
3Q 2
001
4Q 2
001
1Q 2
002
2Q 2
002
3Q 2
002
4Q 2
002
Bill
ions
Operating Revenues Operating Expenses
Figure 28: Revenues vs. ExpensesAirline Operating Revenues vs. Operating Expenses (DOT Data)
Expenses$21.8
Revenues$18.9
50% 48% 48%53% 54% 54%
60%66% 68% 70% 73%
87%
0%
10%
20%
30%
40%
50%
60%
70%
80%
90%
100%
1Q 2
000
2Q 2
000
3Q 2
000
4Q 2
000
1Q 2
001
2Q 2
001
3Q 2
001
4Q 2
001
1Q 2
002
2Q 2
002
3Q 2
002
4Q 2
002
Perc
enta
ge
Figure 30: Debt to Investment RatioAirline Debt to Investment Ratio for All Major Airlines (DOT Data)
$0.00
$0.20
$0.40
$0.60
$0.80
$1.00
$1.20
Jan
Feb
Mar
Apr
May Jun
Jul
Aug Sep
Oct
Nov Dec
Ave
rage
Cos
ts
2000 2001 2002 2003
Figure 29: Cost Per Gallon for Jet Fuel (ATA Data)
Apr '03 v '02 +20%
11
Airline Industry Metrics
Figure 34: Regional Differences at Non-HubsPercent Change in Available Seats at Non-Hub Airports 6/03 vs. 6/00(FAA Data)
National Average -18%
West-8%
Midwest-26%
Northeast-36%
South-18%
$0
$20
$40
$60
$80
$100
$120
$140
FY 99 FY 00 FY 01 FY 02 FY 03 FY 04*
App
ropr
iatio
ns(M
illio
ns)
0
20
40
60
80
100
120
140E
AS
Com
mun
ities
AppropriationsSubsidized Communities
Figure 38: Essential Air ServiceCongressional Funding and Subsidized Communities (DOT Data)
*President's proposed FY '04 budget.
?
-40%
-30%
-20%
-10%
0%
10%
20%
Jan-
99
May
-99
Sep-
99
Jan-
00
May
-00
Sep-
00
Jan-
01
May
-01
Sep-
01
Jan-
02
May
-02
Sep-
02
Jan-
03
May
-03
Sep-
03
Perc
enta
ge
Non-Hub Airports Larger Airports
Figure 33: Non-Hub vs. Larger Airports Percent Change in Available Seats from 1998 (FAA Data)
Larger Airports
-4%
Non-Hub Airports
-18%
-13%
-6% -5%
-23%
-30%
-25%
-20%
-15%
-10%
-5%
0%
Large to Large Medium to Large Small to Large Non-Hub toLarge
Perc
enta
ge
Figure 35: Access to Large AirportsPercent Change in Number of Scheduled Flights 6/03 vs. 6/00(FAA Data)
-35% -29%
0%
155%
-100%
-50%
0%
50%
100%
150%
200%
Turboprop Large Jets Piston Regional Jets
Type of Aircraft
Perc
enta
geFigure 36: Type of Aircraft at Non-Hub AirportsPercent Change in Scheduled Flights by Type of Aircraft 6/03 vs. 6/00 (FAA Data)
21% 21% 20% 19%
2% 3% 3% 3%
77% 77% 77% 78%
0%
25%
50%
75%
100%
6/2000 6/2001 6/2002 6/2003
Perc
enta
ge
Network Low Fare All Others
Figure 37: Airline Market Share at Non-HubsAirline Market Share by Available Seats at Non-Hub Airports(FAA Data)*
* All percentagesare rounded.
12
Airline Industry Metrics
Figure 1: Passenger Enplanements Percent Change in Revenue Passenger Enplanements from 2000 (ATA Data)
Month 2001
(Percent Change from 2000)
2002 (Percent Change
from 2000)
2003 (Percent Change
from 2000) January 4% -10% -8% February -3% -15% -16% March -2% -12% -16% April 0% -13% -18% May -2% -13% -17% June -2% -13% Not Given July 0% -11% Not Given August 3% -8% Not Given September -34% -16% Not Given October -22% -14% Not Given November -19% -18% Not Given December -14% -4% Not Given
Note: September 2001 Enplanements Down 34 Percent Note: May 2003 Enplanements Down 17 Percent
508 Compliant 7-03.doc 07/03/2003
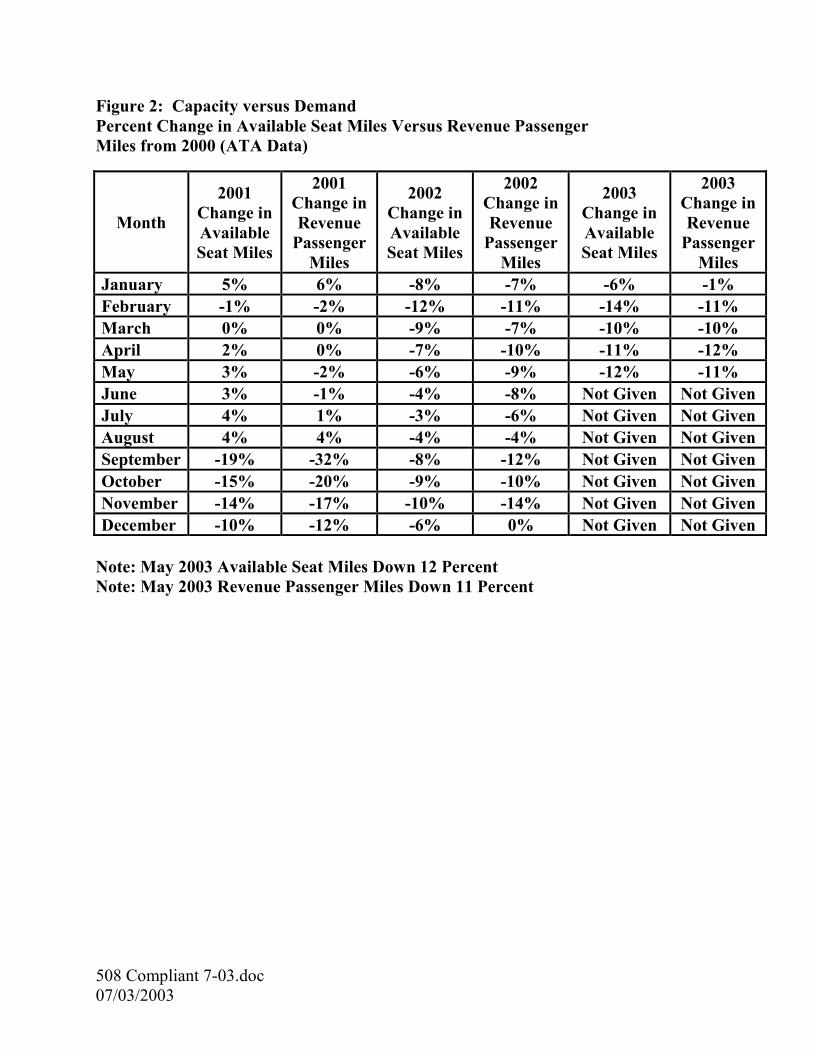
Figure 2: Capacity versus Demand Percent Change in Available Seat Miles Versus Revenue Passenger Miles from 2000 (ATA Data)
Month
2001 Change in Available Seat Miles
2001 Change in Revenue
Passenger Miles
2002 Change in Available Seat Miles
2002 Change in Revenue
Passenger Miles
2003 Change in Available Seat Miles
2003 Change in Revenue
Passenger Miles
January 5% 6% -8% -7% -6% -1% February -1% -2% -12% -11% -14% -11% March 0% 0% -9% -7% -10% -10% April 2% 0% -7% -10% -11% -12% May 3% -2% -6% -9% -12% -11% June 3% -1% -4% -8% Not Given Not Given July 4% 1% -3% -6% Not Given Not Given August 4% 4% -4% -4% Not Given Not Given September -19% -32% -8% -12% Not Given Not Given October -15% -20% -9% -10% Not Given Not Given November -14% -17% -10% -14% Not Given Not Given December -10% -12% -6% 0% Not Given Not Given
Note: May 2003 Available Seat Miles Down 12 Percent Note: May 2003 Revenue Passenger Miles Down 11 Percent
508 Compliant 7-03.doc 07/03/2003
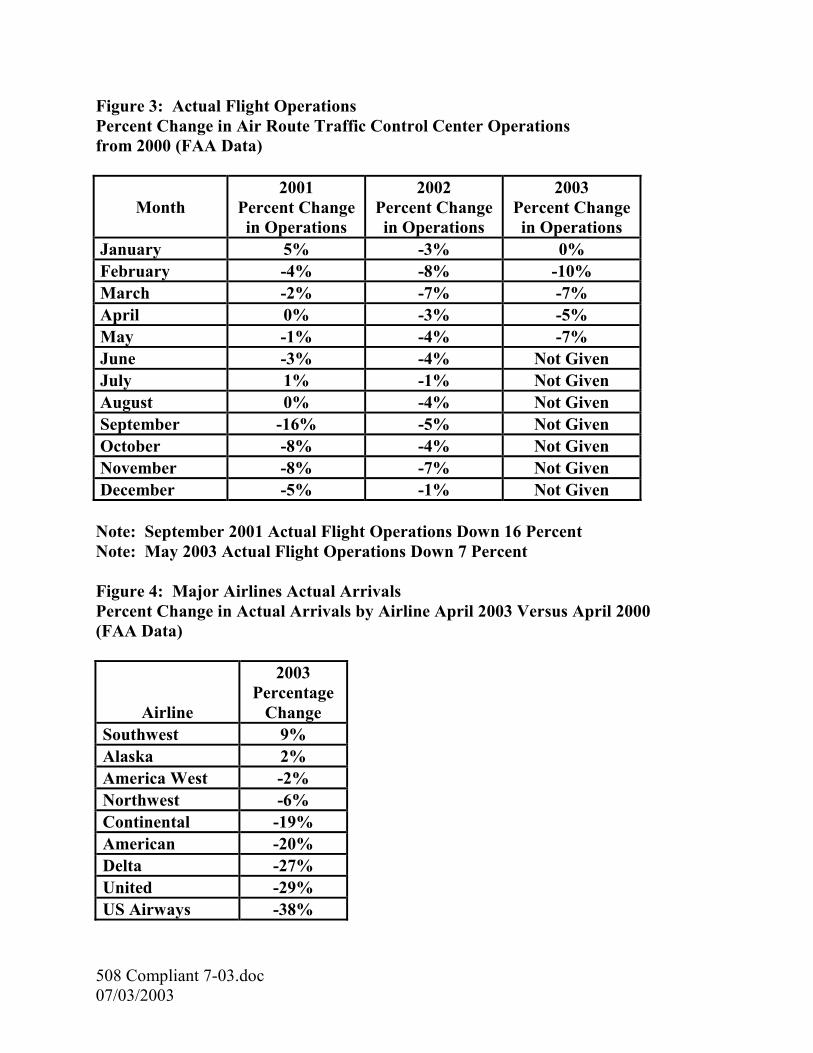
Figure 3: Actual Flight Operations Percent Change in Air Route Traffic Control Center Operations from 2000 (FAA Data)
Month 2001
Percent Change in Operations
2002 Percent Change in Operations
2003 Percent Change in Operations
January 5% -3% 0% February -4% -8% -10% March -2% -7% -7% April 0% -3% -5% May -1% -4% -7% June -3% -4% Not Given July 1% -1% Not Given August 0% -4% Not Given September -16% -5% Not Given October -8% -4% Not Given November -8% -7% Not Given December -5% -1% Not Given Note: September 2001 Actual Flight Operations Down 16 Percent Note: May 2003 Actual Flight Operations Down 7 Percent Figure 4: Major Airlines Actual Arrivals Percent Change in Actual Arrivals by Airline April 2003 Versus April 2000 (FAA Data)
Airline
2003 Percentage
Change Southwest 9% Alaska 2% America West -2% Northwest -6% Continental -19% American -20% Delta -27% United -29% US Airways -38%
508 Compliant 7-03.doc 07/03/2003
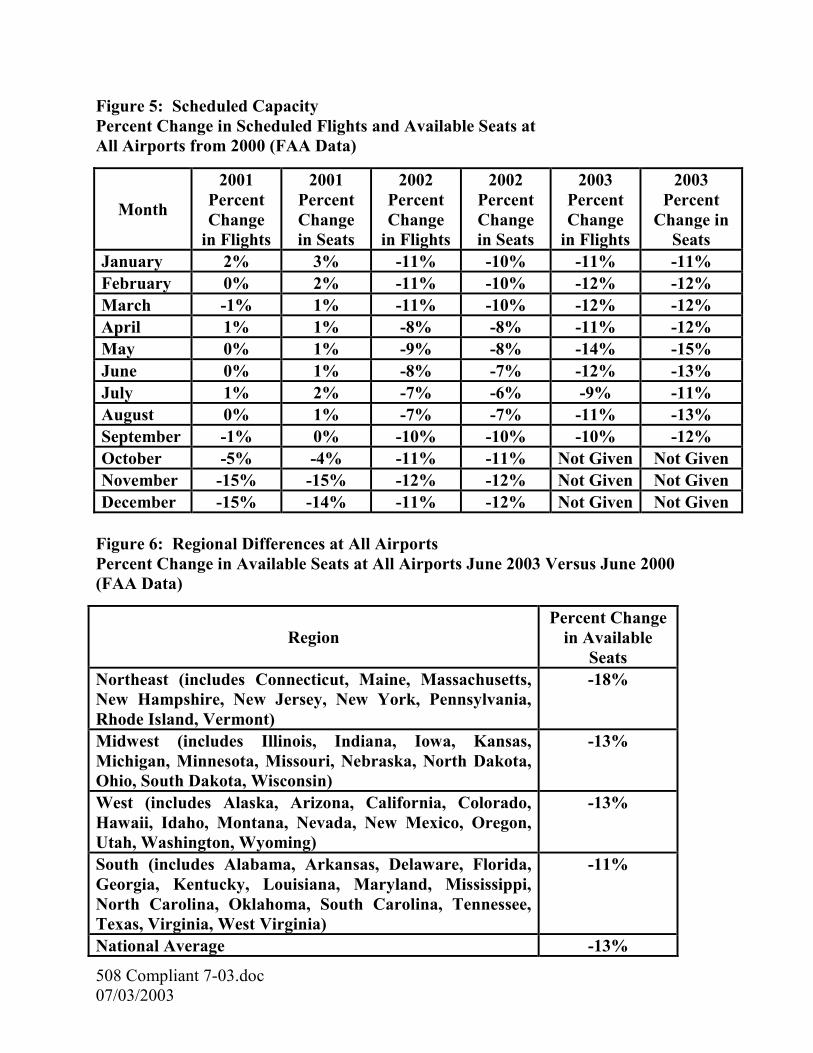
Figure 5: Scheduled Capacity Percent Change in Scheduled Flights and Available Seats at All Airports from 2000 (FAA Data)
Month
2001 Percent Change
in Flights
2001 Percent Change in Seats
2002 Percent Change
in Flights
2002 Percent Change in Seats
2003 Percent Change
in Flights
2003 Percent
Change in Seats
January 2% 3% -11% -10% -11% -11% February 0% 2% -11% -10% -12% -12% March -1% 1% -11% -10% -12% -12% April 1% 1% -8% -8% -11% -12% May 0% 1% -9% -8% -14% -15% June 0% 1% -8% -7% -12% -13% July 1% 2% -7% -6% -9% -11% August 0% 1% -7% -7% -11% -13% September -1% 0% -10% -10% -10% -12% October -5% -4% -11% -11% Not Given Not Given November -15% -15% -12% -12% Not Given Not Given December -15% -14% -11% -12% Not Given Not Given
Figure 6: Regional Differences at All Airports Percent Change in Available Seats at All Airports June 2003 Versus June 2000 (FAA Data)
Region Percent Change
in Available Seats
Northeast (includes Connecticut, Maine, Massachusetts, New Hampshire, New Jersey, New York, Pennsylvania, Rhode Island, Vermont)
-18%
Midwest (includes Illinois, Indiana, Iowa, Kansas, Michigan, Minnesota, Missouri, Nebraska, North Dakota, Ohio, South Dakota, Wisconsin)
-13%
West (includes Alaska, Arizona, California, Colorado, Hawaii, Idaho, Montana, Nevada, New Mexico, Oregon, Utah, Washington, Wyoming)
-13%
South (includes Alabama, Arkansas, Delaware, Florida, Georgia, Kentucky, Louisiana, Maryland, Mississippi, North Carolina, Oklahoma, South Carolina, Tennessee, Texas, Virginia, West Virginia)
-11%
National Average -13%
508 Compliant 7-03.doc 07/03/2003
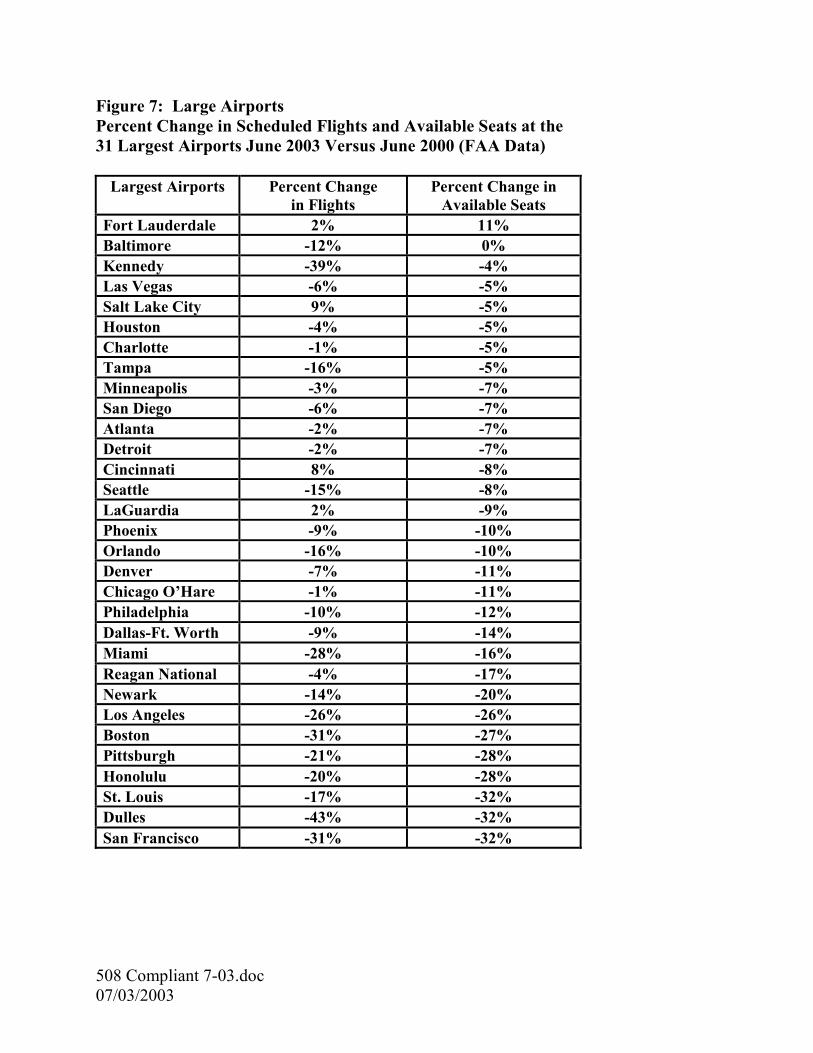
Figure 7: Large Airports Percent Change in Scheduled Flights and Available Seats at the 31 Largest Airports June 2003 Versus June 2000 (FAA Data)
Largest Airports Percent Change in Flights
Percent Change in Available Seats
Fort Lauderdale 2% 11% Baltimore -12% 0% Kennedy -39% -4% Las Vegas -6% -5% Salt Lake City 9% -5% Houston -4% -5% Charlotte -1% -5% Tampa -16% -5% Minneapolis -3% -7% San Diego -6% -7% Atlanta -2% -7% Detroit -2% -7% Cincinnati 8% -8% Seattle -15% -8% LaGuardia 2% -9% Phoenix -9% -10% Orlando -16% -10% Denver -7% -11% Chicago O’Hare -1% -11% Philadelphia -10% -12% Dallas-Ft. Worth -9% -14% Miami -28% -16% Reagan National -4% -17% Newark -14% -20% Los Angeles -26% -26% Boston -31% -27% Pittsburgh -21% -28% Honolulu -20% -28% St. Louis -17% -32% Dulles -43% -32% San Francisco -31% -32%
508 Compliant 7-03.doc 07/03/2003
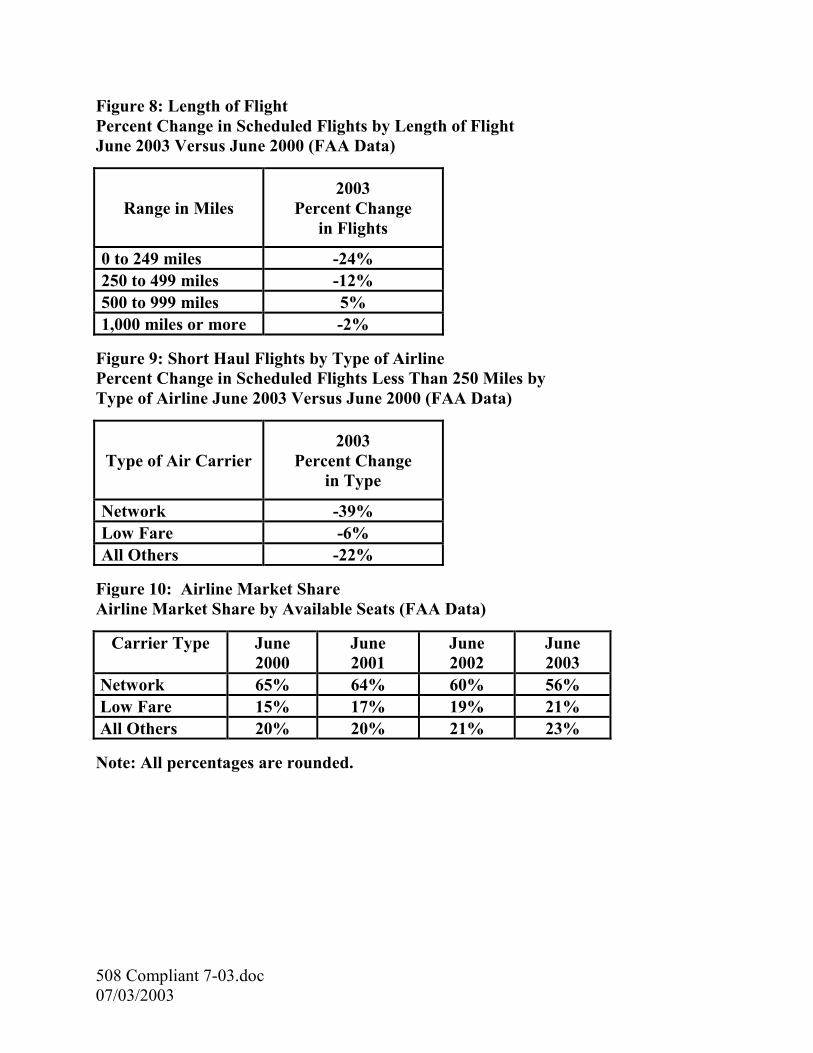
Figure 8: Length of Flight Percent Change in Scheduled Flights by Length of Flight June 2003 Versus June 2000 (FAA Data)
Range in Miles 2003
Percent Change in Flights
0 to 249 miles -24% 250 to 499 miles -12% 500 to 999 miles 5% 1,000 miles or more -2%
Figure 9: Short Haul Flights by Type of Airline Percent Change in Scheduled Flights Less Than 250 Miles by Type of Airline June 2003 Versus June 2000 (FAA Data)
Type of Air Carrier 2003
Percent Change in Type
Network -39% Low Fare -6% All Others -22%
Figure 10: Airline Market Share Airline Market Share by Available Seats (FAA Data)
Carrier Type June 2000
June 2001
June 2002
June 2003
Network 65% 64% 60% 56% Low Fare 15% 17% 19% 21% All Others 20% 20% 21% 23%
Note: All percentages are rounded.
508 Compliant 7-03.doc 07/03/2003
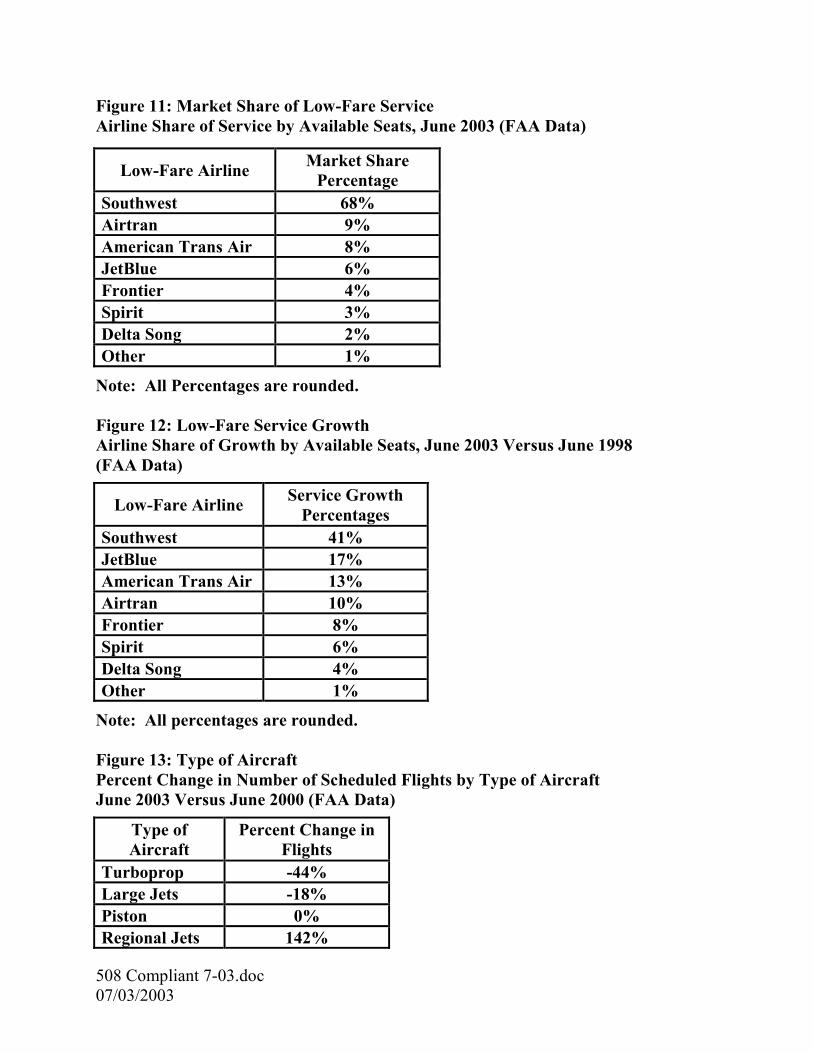
Figure 11: Market Share of Low-Fare Service Airline Share of Service by Available Seats, June 2003 (FAA Data)
Low-Fare Airline Market Share Percentage
Southwest 68% Airtran 9% American Trans Air 8% JetBlue 6% Frontier 4% Spirit 3% Delta Song 2% Other 1%
Note: All Percentages are rounded. Figure 12: Low-Fare Service Growth Airline Share of Growth by Available Seats, June 2003 Versus June 1998 (FAA Data)
Low-Fare Airline Service Growth Percentages
Southwest 41% JetBlue 17% American Trans Air 13% Airtran 10% Frontier 8% Spirit 6% Delta Song 4% Other 1%
Note: All percentages are rounded. Figure 13: Type of Aircraft Percent Change in Number of Scheduled Flights by Type of Aircraft June 2003 Versus June 2000 (FAA Data)
Type of Aircraft
Percent Change in Flights
Turboprop -44% Large Jets -18% Piston 0% Regional Jets 142%
508 Compliant 7-03.doc 07/03/2003
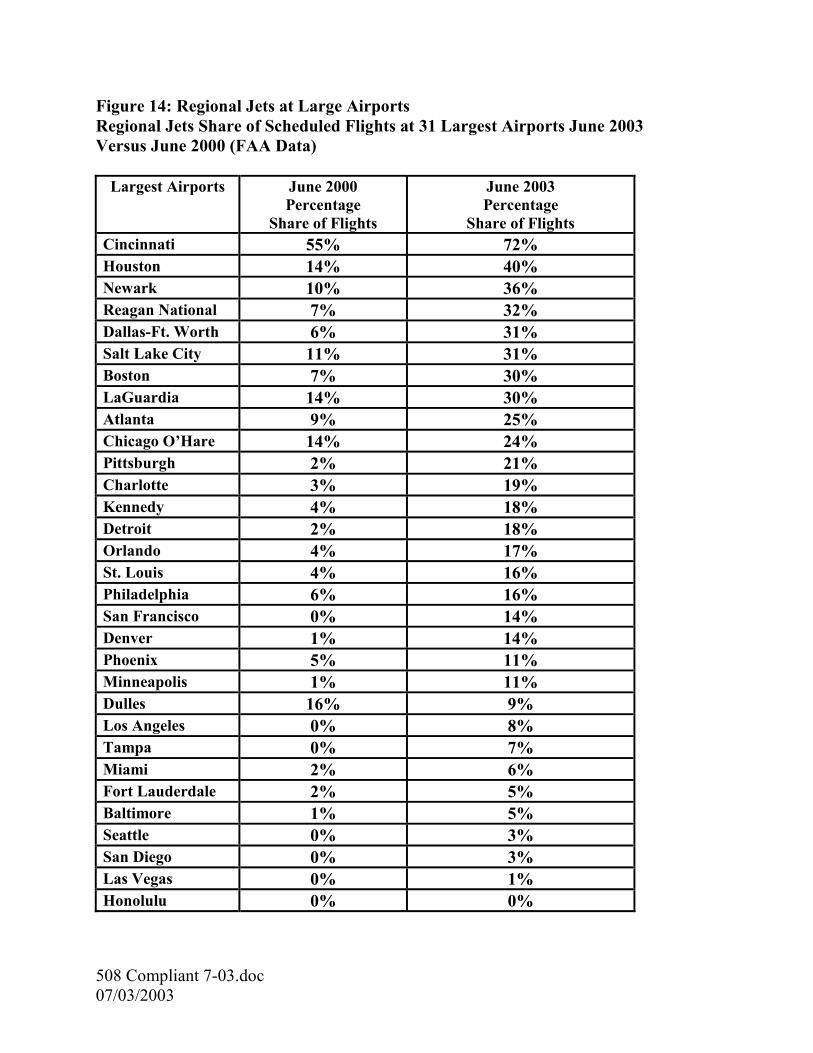
Figure 14: Regional Jets at Large Airports Regional Jets Share of Scheduled Flights at 31 Largest Airports June 2003 Versus June 2000 (FAA Data)
Largest Airports June 2000 Percentage
Share of Flights
June 2003 Percentage
Share of Flights Cincinnati 55% 72% Houston 14% 40% Newark 10% 36% Reagan National 7% 32% Dallas-Ft. Worth 6% 31% Salt Lake City 11% 31% Boston 7% 30% LaGuardia 14% 30% Atlanta 9% 25% Chicago O’Hare 14% 24% Pittsburgh 2% 21% Charlotte 3% 19% Kennedy 4% 18% Detroit 2% 18% Orlando 4% 17% St. Louis 4% 16% Philadelphia 6% 16% San Francisco 0% 14% Denver 1% 14% Phoenix 5% 11% Minneapolis 1% 11% Dulles 16% 9% Los Angeles 0% 8% Tampa 0% 7% Miami 2% 6% Fort Lauderdale 2% 5% Baltimore 1% 5% Seattle 0% 3% San Diego 0% 3% Las Vegas 0% 1% Honolulu 0% 0%
508 Compliant 7-03.doc 07/03/2003
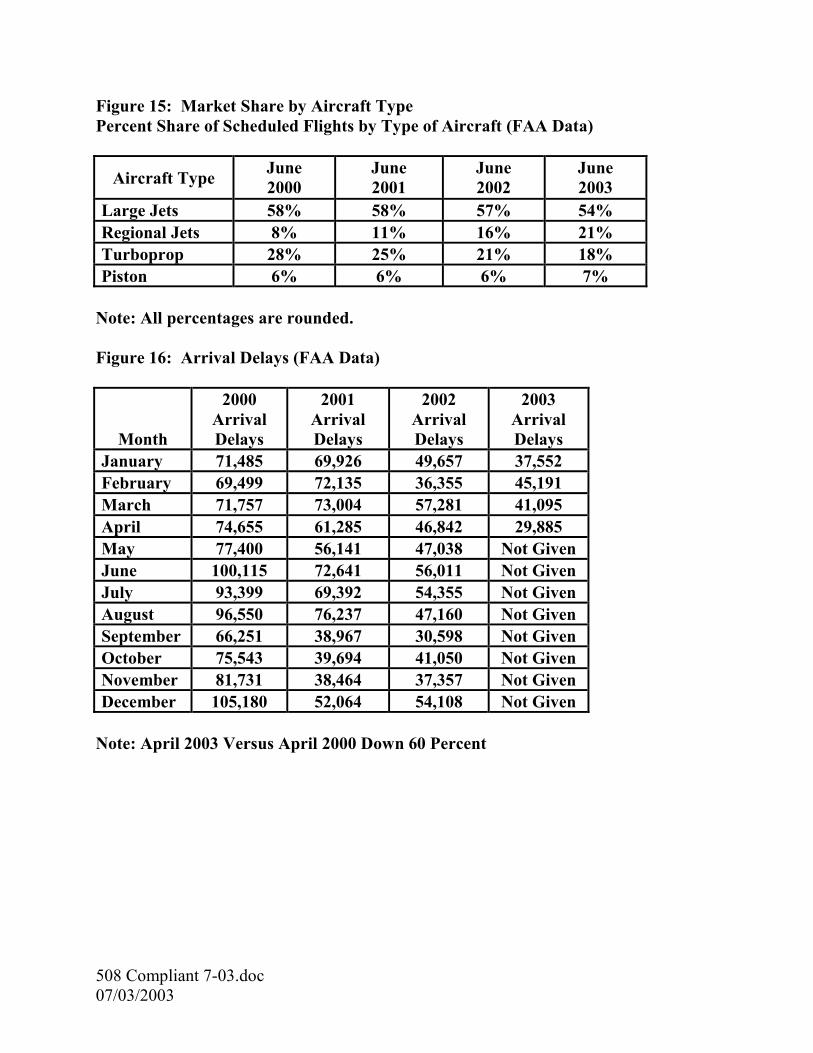
Figure 15: Market Share by Aircraft Type Percent Share of Scheduled Flights by Type of Aircraft (FAA Data)
Aircraft Type June 2000
June 2001
June 2002
June 2003
Large Jets 58% 58% 57% 54% Regional Jets 8% 11% 16% 21% Turboprop 28% 25% 21% 18% Piston 6% 6% 6% 7%
Note: All percentages are rounded. Figure 16: Arrival Delays (FAA Data)
Month
2000 Arrival Delays
2001 Arrival Delays
2002 Arrival Delays
2003 Arrival Delays
January 71,485 69,926 49,657 37,552 February 69,499 72,135 36,355 45,191 March 71,757 73,004 57,281 41,095 April 74,655 61,285 46,842 29,885 May 77,400 56,141 47,038 Not Given June 100,115 72,641 56,011 Not Given July 93,399 69,392 54,355 Not Given August 96,550 76,237 47,160 Not Given September 66,251 38,967 30,598 Not Given October 75,543 39,694 41,050 Not Given November 81,731 38,464 37,357 Not Given December 105,180 52,064 54,108 Not Given
Note: April 2003 Versus April 2000 Down 60 Percent
508 Compliant 7-03.doc 07/03/2003
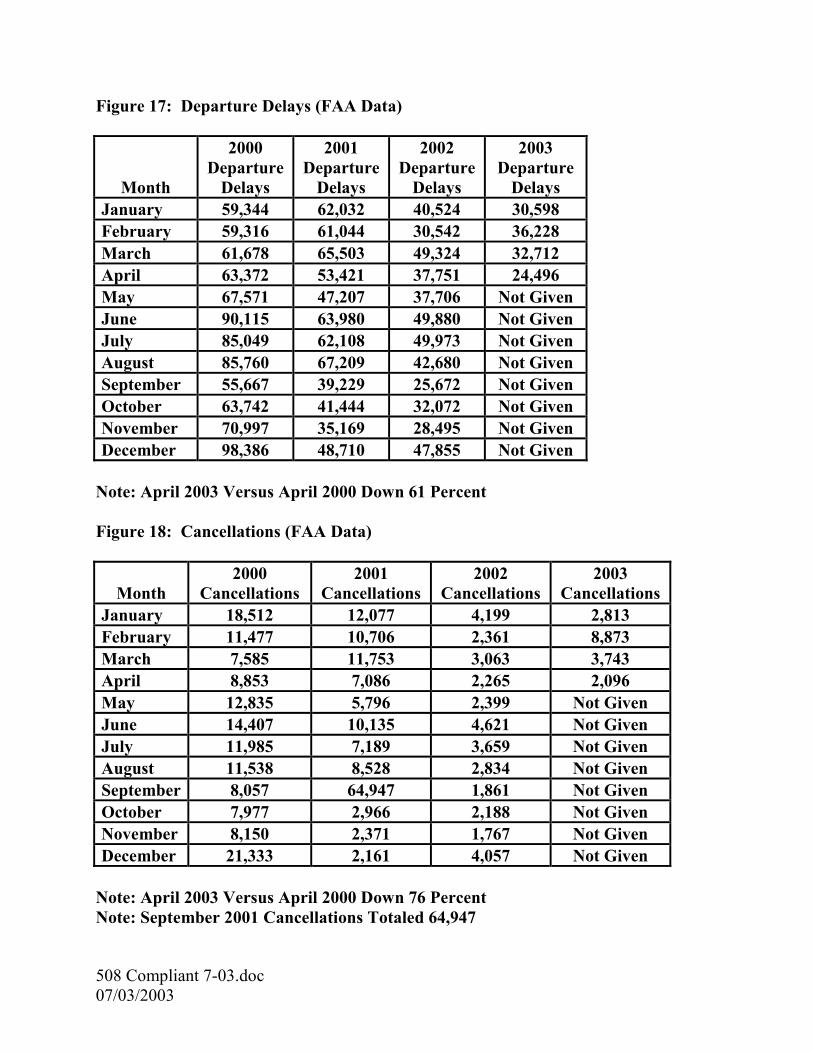
Figure 17: Departure Delays (FAA Data)
Month
2000 Departure
Delays
2001 Departure
Delays
2002 Departure
Delays
2003 Departure
Delays January 59,344 62,032 40,524 30,598 February 59,316 61,044 30,542 36,228 March 61,678 65,503 49,324 32,712 April 63,372 53,421 37,751 24,496 May 67,571 47,207 37,706 Not Given June 90,115 63,980 49,880 Not Given July 85,049 62,108 49,973 Not Given August 85,760 67,209 42,680 Not Given September 55,667 39,229 25,672 Not Given October 63,742 41,444 32,072 Not Given November 70,997 35,169 28,495 Not Given December 98,386 48,710 47,855 Not Given
Note: April 2003 Versus April 2000 Down 61 Percent Figure 18: Cancellations (FAA Data)
Month 2000
Cancellations 2001
Cancellations 2002
Cancellations 2003
Cancellations January 18,512 12,077 4,199 2,813 February 11,477 10,706 2,361 8,873 March 7,585 11,753 3,063 3,743 April 8,853 7,086 2,265 2,096 May 12,835 5,796 2,399 Not Given June 14,407 10,135 4,621 Not Given July 11,985 7,189 3,659 Not Given August 11,538 8,528 2,834 Not Given September 8,057 64,947 1,861 Not Given October 7,977 2,966 2,188 Not Given November 8,150 2,371 1,767 Not Given December 21,333 2,161 4,057 Not Given
Note: April 2003 Versus April 2000 Down 76 Percent Note: September 2001 Cancellations Totaled 64,947
508 Compliant 7-03.doc 07/03/2003
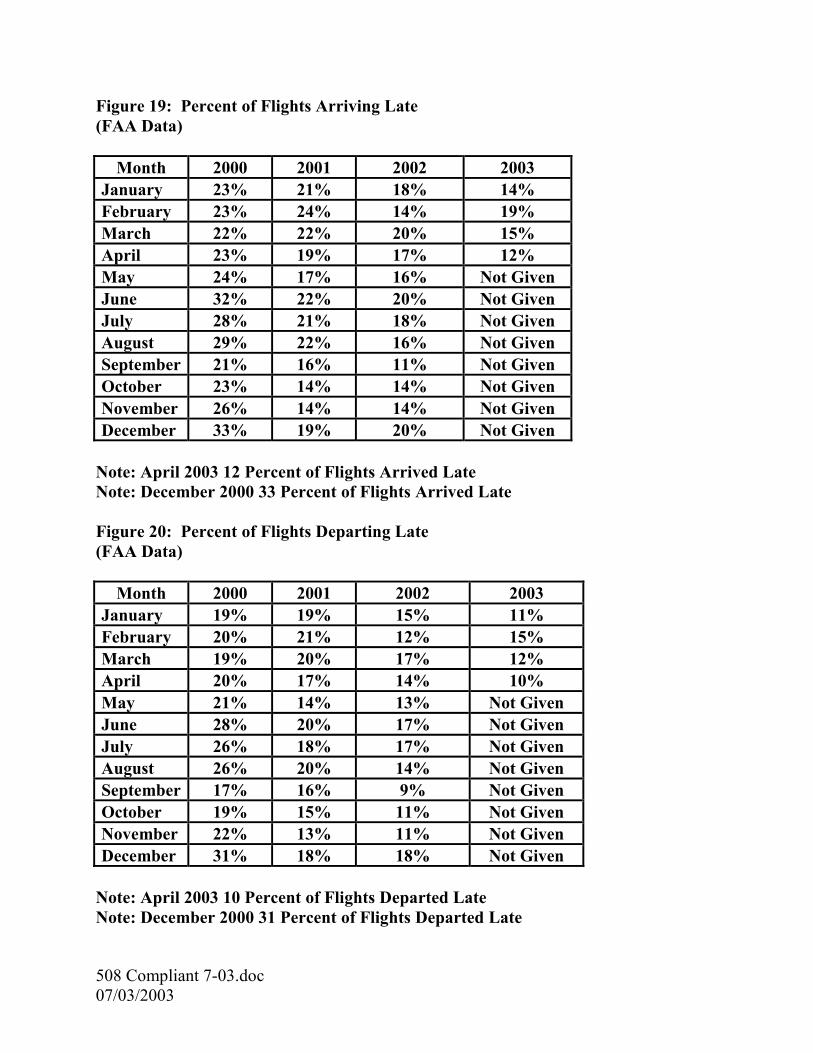
Figure 19: Percent of Flights Arriving Late (FAA Data)
Month 2000 2001 2002 2003 January 23% 21% 18% 14% February 23% 24% 14% 19% March 22% 22% 20% 15% April 23% 19% 17% 12% May 24% 17% 16% Not Given June 32% 22% 20% Not Given July 28% 21% 18% Not Given August 29% 22% 16% Not Given September 21% 16% 11% Not Given October 23% 14% 14% Not Given November 26% 14% 14% Not Given December 33% 19% 20% Not Given
Note: April 2003 12 Percent of Flights Arrived Late Note: December 2000 33 Percent of Flights Arrived Late Figure 20: Percent of Flights Departing Late (FAA Data)
Month 2000 2001 2002 2003 January 19% 19% 15% 11% February 20% 21% 12% 15% March 19% 20% 17% 12% April 20% 17% 14% 10% May 21% 14% 13% Not Given June 28% 20% 17% Not Given July 26% 18% 17% Not Given August 26% 20% 14% Not Given September 17% 16% 9% Not Given October 19% 15% 11% Not Given November 22% 13% 11% Not Given December 31% 18% 18% Not Given
Note: April 2003 10 Percent of Flights Departed Late Note: December 2000 31 Percent of Flights Departed Late
508 Compliant 7-03.doc 07/03/2003
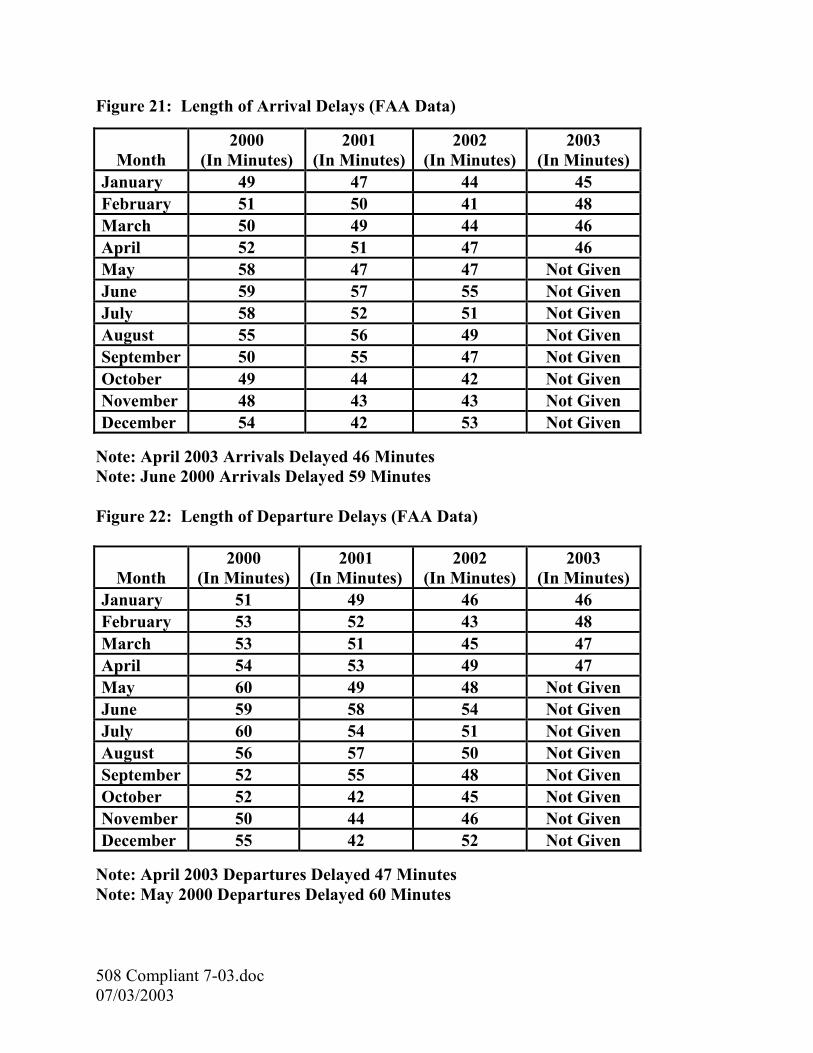
Figure 21: Length of Arrival Delays (FAA Data)
Month 2000
(In Minutes) 2001
(In Minutes)2002
(In Minutes) 2003
(In Minutes) January 49 47 44 45 February 51 50 41 48 March 50 49 44 46 April 52 51 47 46 May 58 47 47 Not Given June 59 57 55 Not Given July 58 52 51 Not Given August 55 56 49 Not Given September 50 55 47 Not Given October 49 44 42 Not Given November 48 43 43 Not Given December 54 42 53 Not Given
Note: April 2003 Arrivals Delayed 46 Minutes Note: June 2000 Arrivals Delayed 59 Minutes Figure 22: Length of Departure Delays (FAA Data)
Month 2000
(In Minutes) 2001
(In Minutes) 2002
(In Minutes) 2003
(In Minutes) January 51 49 46 46 February 53 52 43 48 March 53 51 45 47 April 54 53 49 47 May 60 49 48 Not Given June 59 58 54 Not Given July 60 54 51 Not Given August 56 57 50 Not Given September 52 55 48 Not Given October 52 42 45 Not Given November 50 44 46 Not Given December 55 42 52 Not Given
Note: April 2003 Departures Delayed 47 Minutes Note: May 2000 Departures Delayed 60 Minutes
508 Compliant 7-03.doc 07/03/2003
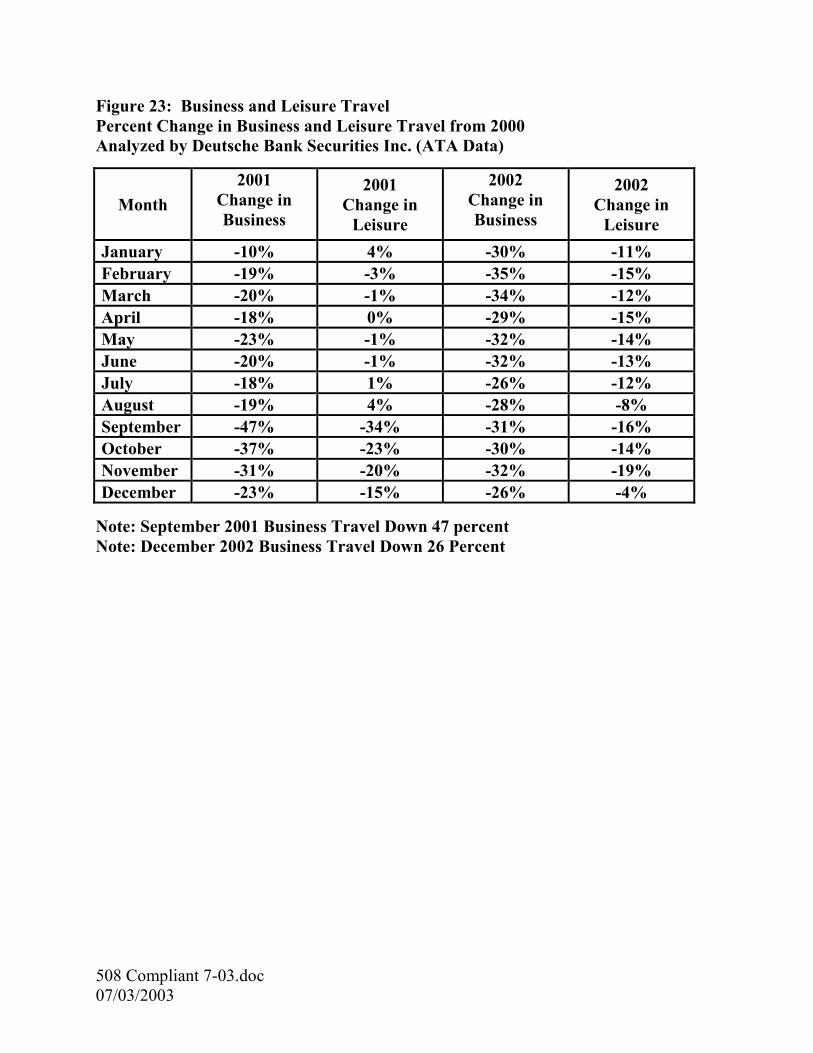
Figure 23: Business and Leisure Travel Percent Change in Business and Leisure Travel from 2000 Analyzed by Deutsche Bank Securities Inc. (ATA Data)
Month 2001
Change in Business
2001 Change in
Leisure
2002 Change in Business
2002 Change in
Leisure January -10% 4% -30% -11% February -19% -3% -35% -15% March -20% -1% -34% -12% April -18% 0% -29% -15% May -23% -1% -32% -14% June -20% -1% -32% -13% July -18% 1% -26% -12% August -19% 4% -28% -8% September -47% -34% -31% -16% October -37% -23% -30% -14% November -31% -20% -32% -19% December -23% -15% -26% -4%
Note: September 2001 Business Travel Down 47 percent Note: December 2002 Business Travel Down 26 Percent
508 Compliant 7-03.doc 07/03/2003
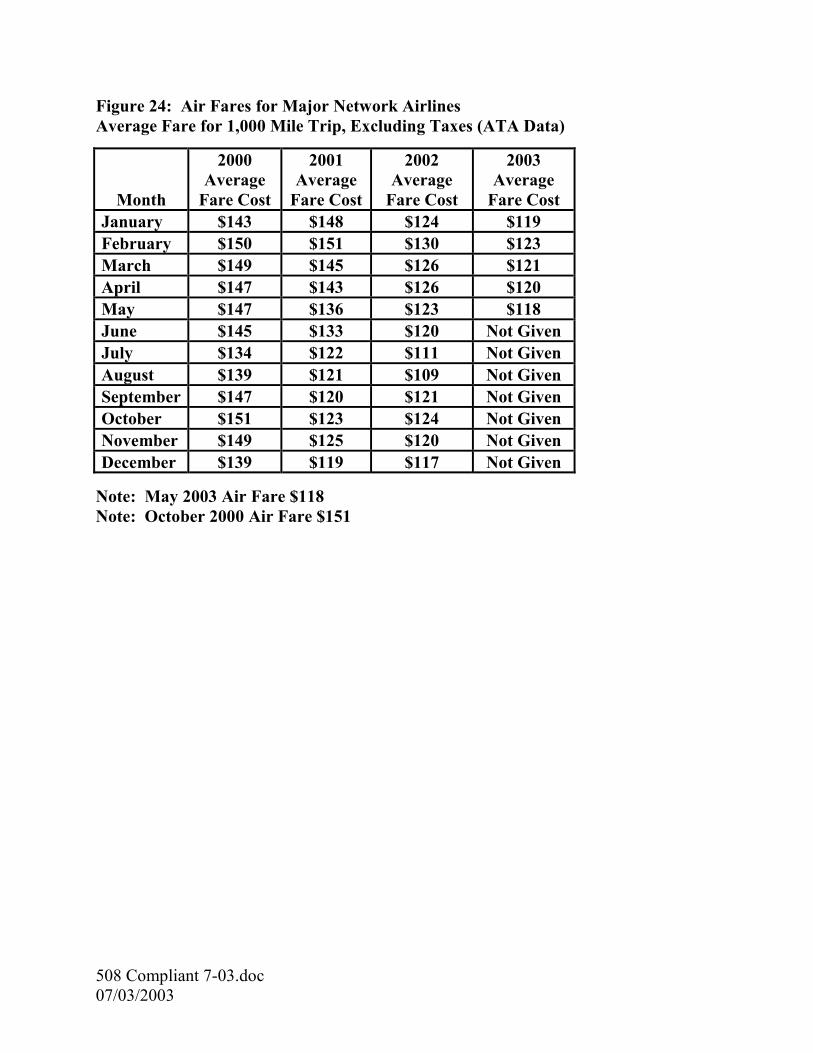
Figure 24: Air Fares for Major Network Airlines Average Fare for 1,000 Mile Trip, Excluding Taxes (ATA Data)
Month
2000 Average
Fare Cost
2001 Average
Fare Cost
2002 Average
Fare Cost
2003 Average
Fare Cost January $143 $148 $124 $119 February $150 $151 $130 $123 March $149 $145 $126 $121 April $147 $143 $126 $120 May $147 $136 $123 $118 June $145 $133 $120 Not Given July $134 $122 $111 Not Given August $139 $121 $109 Not Given September $147 $120 $121 Not Given October $151 $123 $124 Not Given November $149 $125 $120 Not Given December $139 $119 $117 Not Given
Note: May 2003 Air Fare $118 Note: October 2000 Air Fare $151
508 Compliant 7-03.doc 07/03/2003
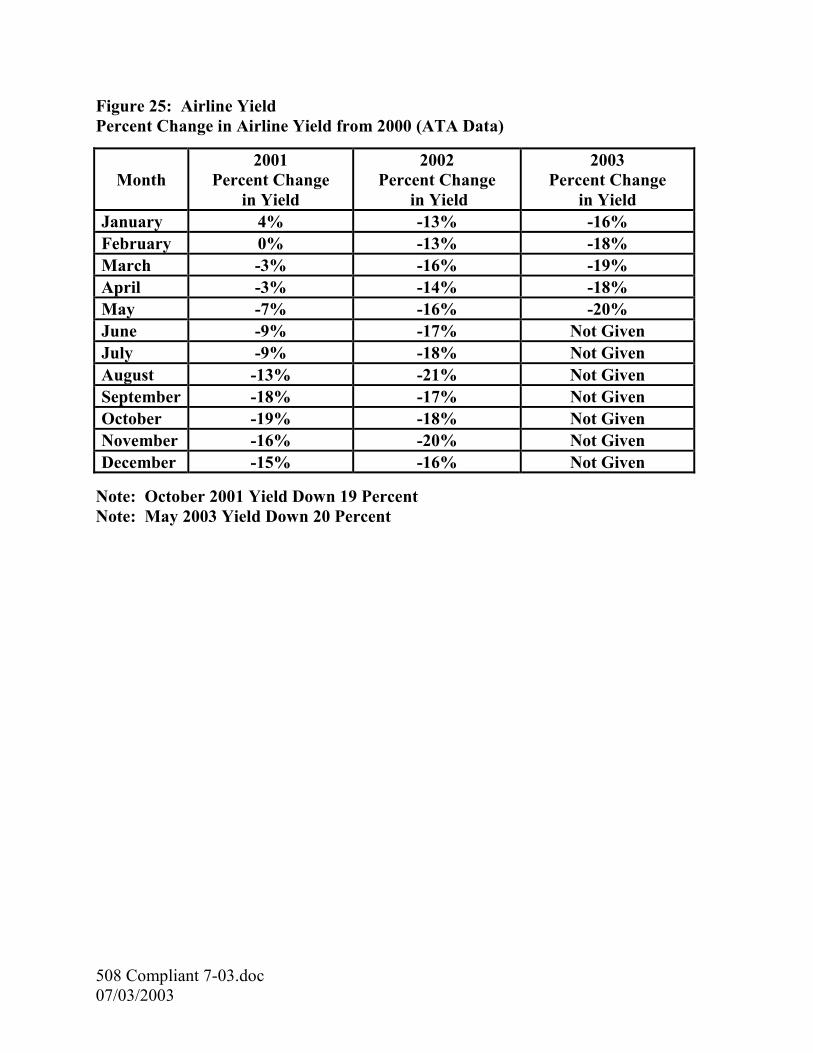
Figure 25: Airline Yield Percent Change in Airline Yield from 2000 (ATA Data)
Month 2001
Percent Change in Yield
2002 Percent Change
in Yield
2003 Percent Change
in Yield January 4% -13% -16% February 0% -13% -18% March -3% -16% -19% April -3% -14% -18% May -7% -16% -20% June -9% -17% Not Given July -9% -18% Not Given August -13% -21% Not Given September -18% -17% Not Given October -19% -18% Not Given November -16% -20% Not Given December -15% -16% Not Given
Note: October 2001 Yield Down 19 Percent Note: May 2003 Yield Down 20 Percent
508 Compliant 7-03.doc 07/03/2003
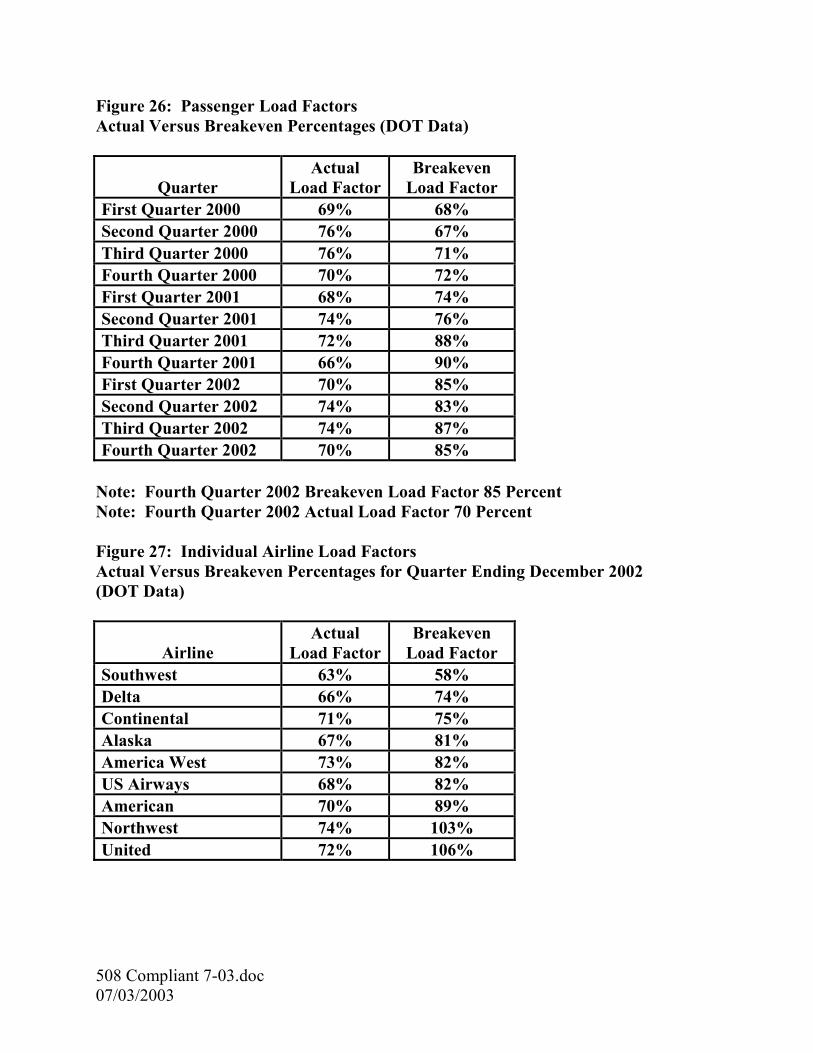
Figure 26: Passenger Load Factors Actual Versus Breakeven Percentages (DOT Data)
Quarter Actual
Load FactorBreakeven
Load Factor First Quarter 2000 69% 68% Second Quarter 2000 76% 67% Third Quarter 2000 76% 71% Fourth Quarter 2000 70% 72% First Quarter 2001 68% 74% Second Quarter 2001 74% 76% Third Quarter 2001 72% 88% Fourth Quarter 2001 66% 90% First Quarter 2002 70% 85% Second Quarter 2002 74% 83% Third Quarter 2002 74% 87% Fourth Quarter 2002 70% 85%
Note: Fourth Quarter 2002 Breakeven Load Factor 85 Percent Note: Fourth Quarter 2002 Actual Load Factor 70 Percent Figure 27: Individual Airline Load Factors Actual Versus Breakeven Percentages for Quarter Ending December 2002 (DOT Data)
Airline Actual
Load FactorBreakeven
Load Factor Southwest 63% 58% Delta 66% 74% Continental 71% 75% Alaska 67% 81% America West 73% 82% US Airways 68% 82% American 70% 89% Northwest 74% 103% United 72% 106%
508 Compliant 7-03.doc 07/03/2003
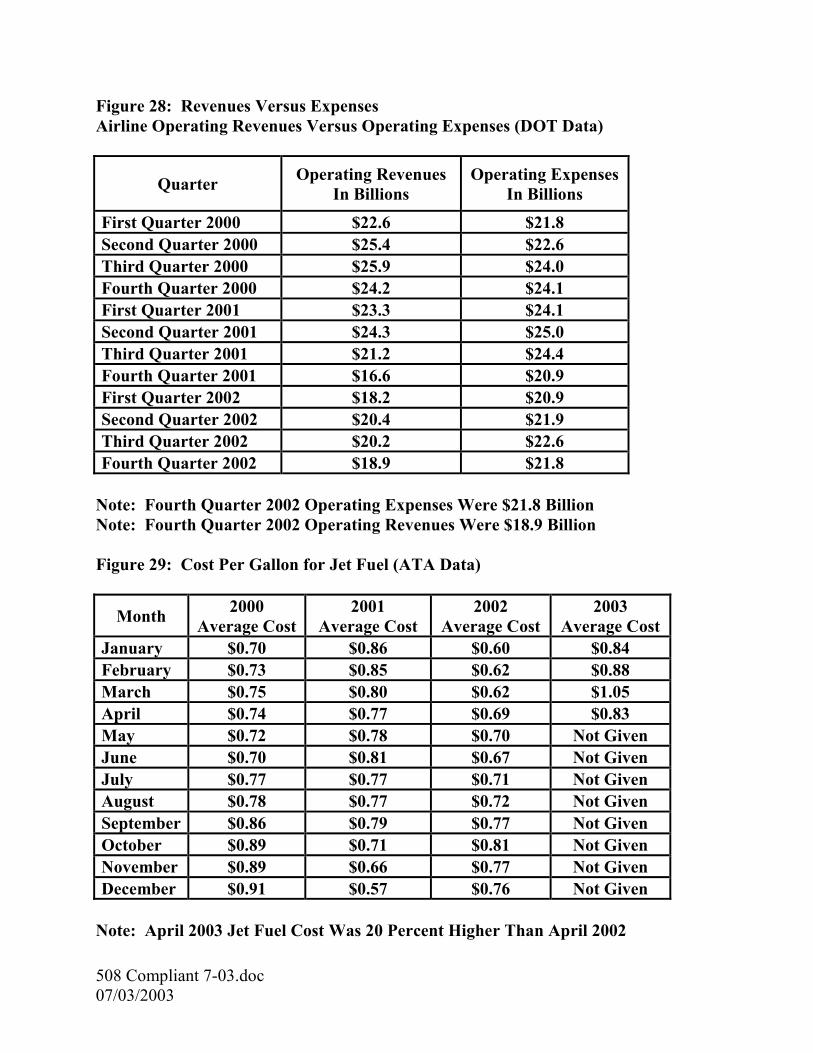
Figure 28: Revenues Versus Expenses Airline Operating Revenues Versus Operating Expenses (DOT Data)
Quarter Operating Revenues In Billions
Operating Expenses In Billions
First Quarter 2000 $22.6 $21.8 Second Quarter 2000 $25.4 $22.6 Third Quarter 2000 $25.9 $24.0 Fourth Quarter 2000 $24.2 $24.1 First Quarter 2001 $23.3 $24.1 Second Quarter 2001 $24.3 $25.0 Third Quarter 2001 $21.2 $24.4 Fourth Quarter 2001 $16.6 $20.9 First Quarter 2002 $18.2 $20.9 Second Quarter 2002 $20.4 $21.9 Third Quarter 2002 $20.2 $22.6 Fourth Quarter 2002 $18.9 $21.8
Note: Fourth Quarter 2002 Operating Expenses Were $21.8 Billion Note: Fourth Quarter 2002 Operating Revenues Were $18.9 Billion Figure 29: Cost Per Gallon for Jet Fuel (ATA Data)
Month 2000 Average Cost
2001 Average Cost
2002 Average Cost
2003 Average Cost
January $0.70 $0.86 $0.60 $0.84 February $0.73 $0.85 $0.62 $0.88 March $0.75 $0.80 $0.62 $1.05 April $0.74 $0.77 $0.69 $0.83 May $0.72 $0.78 $0.70 Not Given June $0.70 $0.81 $0.67 Not Given July $0.77 $0.77 $0.71 Not Given August $0.78 $0.77 $0.72 Not Given September $0.86 $0.79 $0.77 Not Given October $0.89 $0.71 $0.81 Not Given November $0.89 $0.66 $0.77 Not Given December $0.91 $0.57 $0.76 Not Given
Note: April 2003 Jet Fuel Cost Was 20 Percent Higher Than April 2002
508 Compliant 7-03.doc 07/03/2003
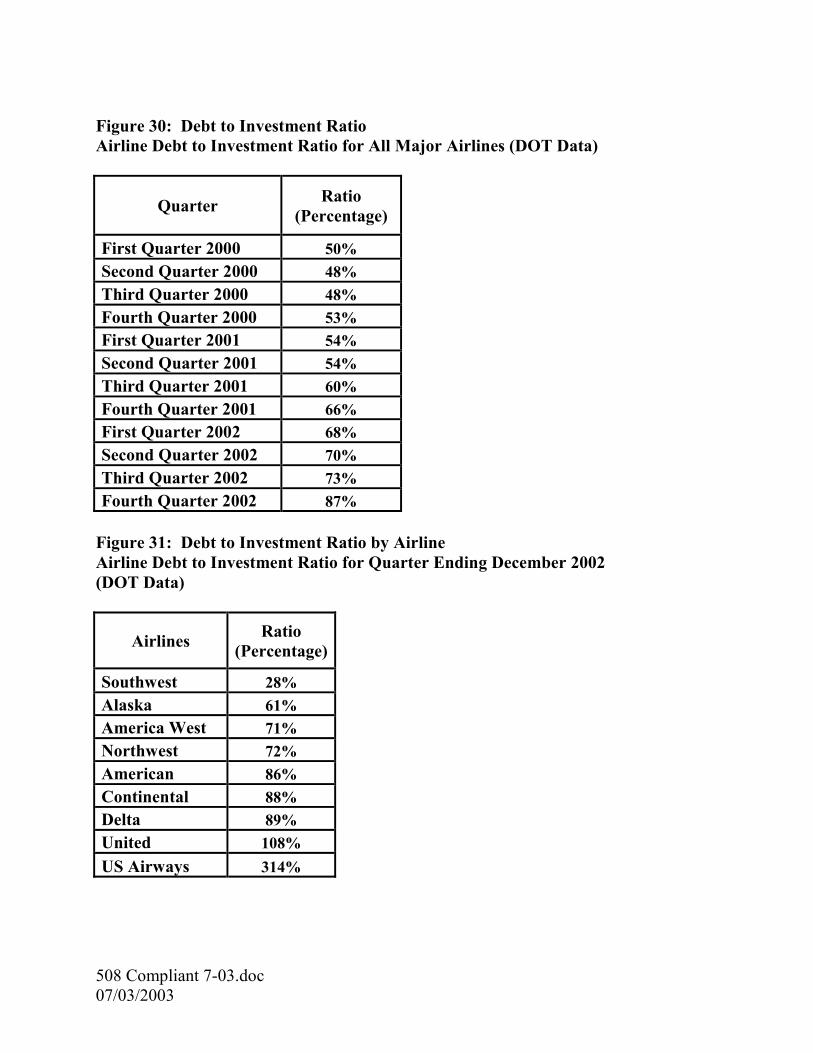
Figure 30: Debt to Investment Ratio Airline Debt to Investment Ratio for All Major Airlines (DOT Data)
Quarter Ratio (Percentage)
First Quarter 2000 50% Second Quarter 2000 48% Third Quarter 2000 48% Fourth Quarter 2000 53% First Quarter 2001 54% Second Quarter 2001 54% Third Quarter 2001 60% Fourth Quarter 2001 66% First Quarter 2002 68% Second Quarter 2002 70% Third Quarter 2002 73% Fourth Quarter 2002 87%
Figure 31: Debt to Investment Ratio by Airline Airline Debt to Investment Ratio for Quarter Ending December 2002 (DOT Data)
Airlines Ratio (Percentage)
Southwest 28% Alaska 61% America West 71% Northwest 72% American 86% Continental 88% Delta 89% United 108% US Airways 314%
508 Compliant 7-03.doc 07/03/2003
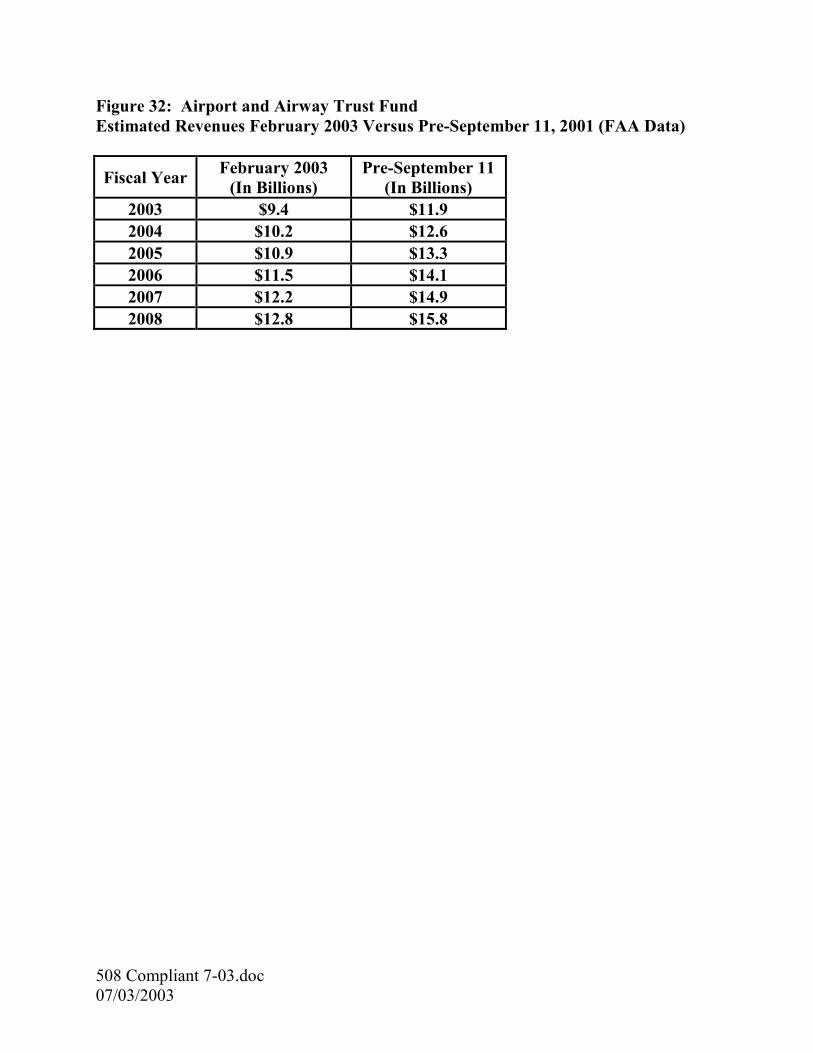
Figure 32: Airport and Airway Trust Fund Estimated Revenues February 2003 Versus Pre-September 11, 2001 (FAA Data)
Fiscal Year February 2003 (In Billions)
Pre-September 11 (In Billions)
2003 $9.4 $11.9 2004 $10.2 $12.6 2005 $10.9 $13.3 2006 $11.5 $14.1 2007 $12.2 $14.9 2008 $12.8 $15.8
508 Compliant 7-03.doc 07/03/2003
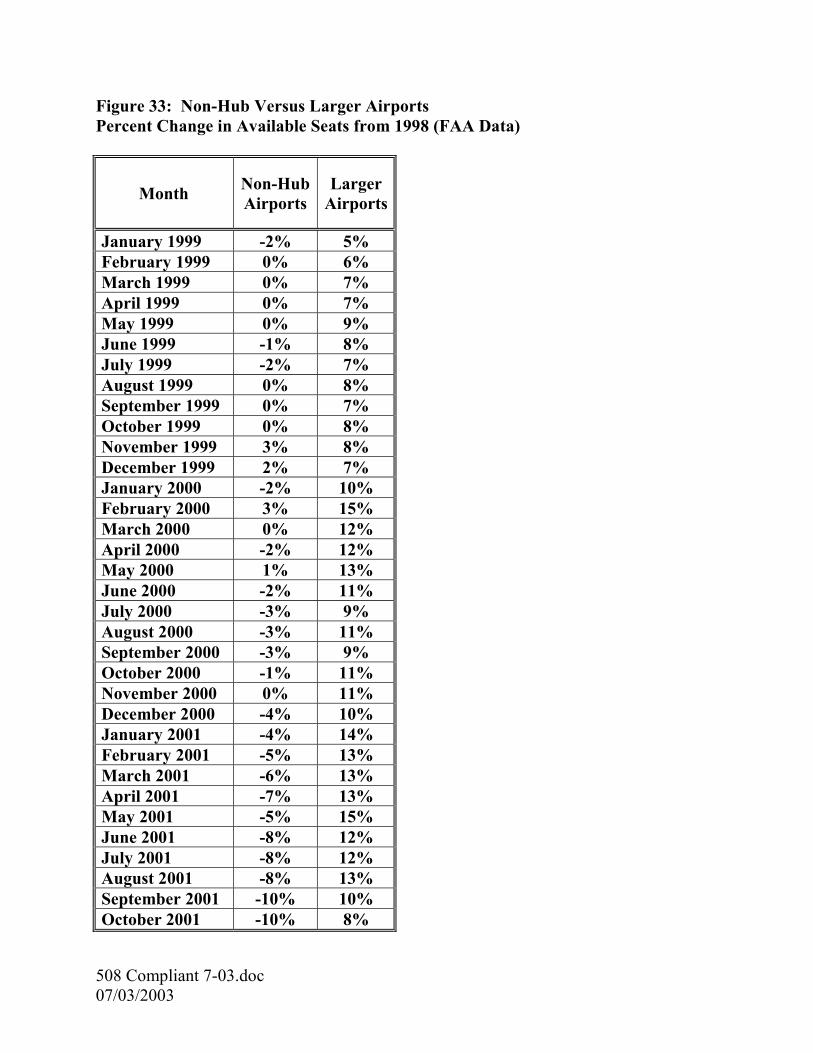
Figure 33: Non-Hub Versus Larger Airports Percent Change in Available Seats from 1998 (FAA Data)
Month Non-Hub Airports
Larger Airports
January 1999 -2% 5% February 1999 0% 6% March 1999 0% 7% April 1999 0% 7% May 1999 0% 9% June 1999 -1% 8% July 1999 -2% 7% August 1999 0% 8% September 1999 0% 7% October 1999 0% 8% November 1999 3% 8% December 1999 2% 7% January 2000 -2% 10% February 2000 3% 15% March 2000 0% 12% April 2000 -2% 12% May 2000 1% 13% June 2000 -2% 11% July 2000 -3% 9% August 2000 -3% 11% September 2000 -3% 9% October 2000 -1% 11% November 2000 0% 11% December 2000 -4% 10% January 2001 -4% 14% February 2001 -5% 13% March 2001 -6% 13% April 2001 -7% 13% May 2001 -5% 15% June 2001 -8% 12% July 2001 -8% 12% August 2001 -8% 13% September 2001 -10% 10% October 2001 -10% 8%
508 Compliant 7-03.doc 07/03/2003
Month Non-Hub Airports
Larger Airports
November 2001 -18% -5% December 2001 -19% -6% January 2002 -17% 0% February 2002 -17% 0% March 2002 -17% 1% April 2002 -15% 3% May 2002 -14% 4% June 2002 -16% 3% July 2002 -15% 4% August 2002 -13% 3% September 2002 -18% -1% October 2002 -18% 0% November 2002 -18% -2% December 2002 -19% -4% January 2003 -21% -1% February 2003 -19% -2% March 2003 -19% -1% April 2003 -20% -1% May 2003 -20% -4% June 2003 -19% -3% July 2003 -17% -3% August -17% -3% September -18% -4%
Note: September 2003 Larger Airports Down 4 Percent Note: September 2003 Non-Hub Airports Down 18 Percent
508 Compliant 7-03.doc 07/03/2003
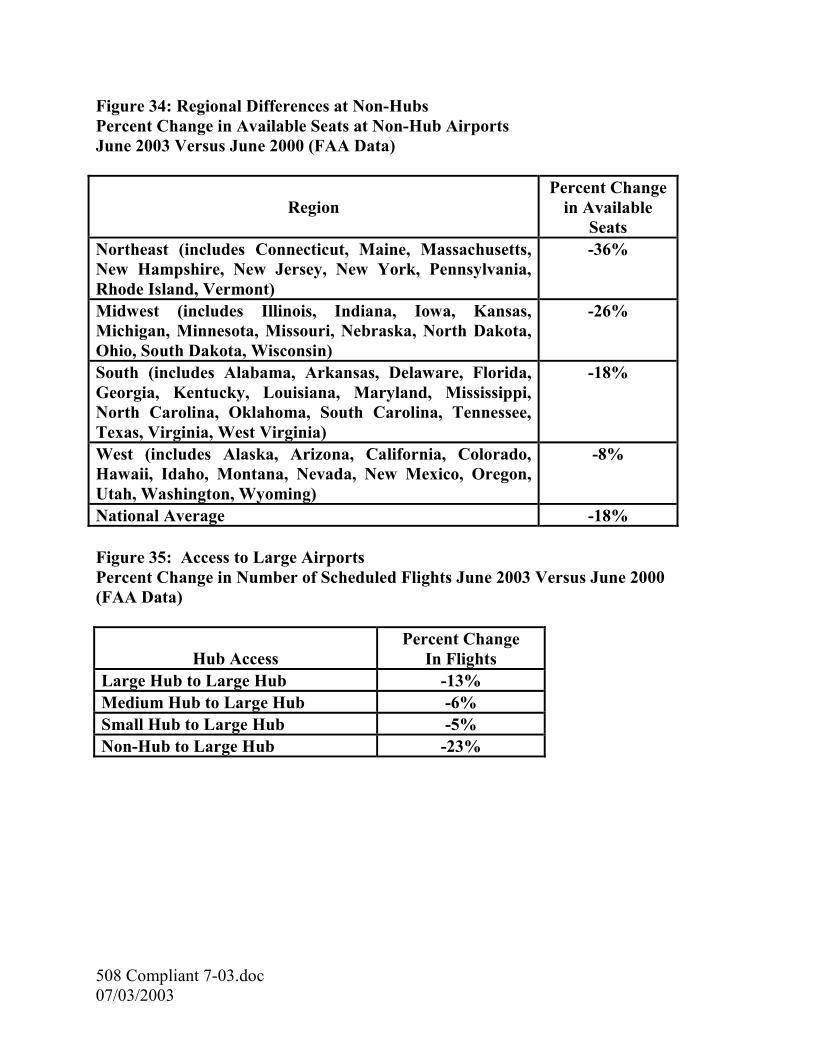
Figure 34: Regional Differences at Non-Hubs Percent Change in Available Seats at Non-Hub Airports June 2003 Versus June 2000 (FAA Data)
Region Percent Change
in Available Seats
Northeast (includes Connecticut, Maine, Massachusetts, New Hampshire, New Jersey, New York, Pennsylvania, Rhode Island, Vermont)
-36%
Midwest (includes Illinois, Indiana, Iowa, Kansas, Michigan, Minnesota, Missouri, Nebraska, North Dakota, Ohio, South Dakota, Wisconsin)
-26%
South (includes Alabama, Arkansas, Delaware, Florida, Georgia, Kentucky, Louisiana, Maryland, Mississippi, North Carolina, Oklahoma, South Carolina, Tennessee, Texas, Virginia, West Virginia)
-18%
West (includes Alaska, Arizona, California, Colorado, Hawaii, Idaho, Montana, Nevada, New Mexico, Oregon, Utah, Washington, Wyoming)
-8%
National Average -18% Figure 35: Access to Large Airports Percent Change in Number of Scheduled Flights June 2003 Versus June 2000 (FAA Data)
Hub Access Percent Change
In Flights Large Hub to Large Hub -13% Medium Hub to Large Hub -6% Small Hub to Large Hub -5% Non-Hub to Large Hub -23%
508 Compliant 7-03.doc 07/03/2003
508 Compliant 7-03.doc 07/03/2003
Figure 36: Type of Aircraft at Non-Hub Airports Percent Change in Scheduled Flights by Type of Aircraft June 2003 Versus June 2000 (FAA Data)
Aircraft Type Percent Change
Turboprop -35% Large Jets -29% Piston 0% Regional Jets 155%
Figure 37: Airline Market Share at Non-Hubs Airline Market Share by Available Seats at Non-Hub Airports (FAA Data)
Airline Market June 2000
June 2001
June 2002
June 2003
Network 21% 21% 20% 19% Low Fare 2% 3% 3% 3% All Others 77% 77% 77% 78% Note: All Percentages are rounded. Figure 38: Essential Air Service Congressional Funding and Subsidized Communities (DOT Data)
Fiscal Year Appropriations In Millions
Number of Communities
Subsidized 1999 $50 100 2000 $50 106 2001 $50 115 2002 $113 123 2003 $113 125 President’s Proposed Budget 2004 $50 Undetermined