Embed Size (px)
Citation preview

22nd October 2015
invest in
Invest in remarkable indonesia Invest in
remarkable indonesiaindonesia
Invest in remarkable indonesia
Invest in remarkable indonesia
Invest in remarkable indonesia
indonesia
Invest in
Invest in remarkable indonesia
Invest in remarkable indonesia
Invest in remarkable indonesia
indonesia
Invest in
Invest in
Invest in
able indonesia Invest
© 2015 by Indonesia Investment Coordinating Board. All rights reserved
Indonesia Investment Coordinating Board
DOMESTIC AND FOREIGN DIRECT INVESTMENT REALIZATION IN QUARTER III AND JANUARY – SEPTEMBER 2015
The Investment Coordinating Board of the Republic of Indonesia
2
TABLE OF CONTENTS
I. QUARTER III AND JANUARY - SEPTEMBER 2015: In Comparison with 2014
II. QUARTER III 2015: Sector, Location, and Country of Origin
III. JANUARY – SEPTEMBER 2015: Sector, Location, Country of Origin, and Economic Corridor
IV. Indonesian Labor Absorption
V. PROGRESS OF INVESTMENT REALIZATION: 2010 – SEPTEMBER 2015

The Investment Coordinating Board of the Republic of Indonesia
3
I. Quarter III and January - September 2015: In Comparison with 2014

The Investment Coordinating Board of the Republic of Indonesia
4
*) 2015 Investment Target, BKPM’s Strategic Planning 2015 - 2019
**) Achievements January - September 2015 towards 2015 target
Investment Realization in Quarter III 2015
The value of investment in Quarter III 2015 is investment realization during threemonths period of report (July - September 2015) based on investment realizationreport from DDI and FDI companies
Oil and Gas, Banking, Non-Bank Financial Institution, Insurance, Leasing, and HomeIndustry are excluded
The investment value is in Rp Trillion (T) and the currency rate of US$ 1= Rp 12,500based on State Budget 2015
Investment Realization in Quarter III 2015: Rp 140.3 T, increases around 3.8% fromQuarter II 2015 (Rp 135.1 T) or increases around 17.0% from Quarter III 2014 (Rp119.9 T)
Investment realization in January – September 2015: Rp 400.0 T, increases around16.7% from that in January - September 2014 (Rp 342.7 T)
DDI: Domestic Direct Investment
FDI: Foreign Direct Investment
Quarter III and January - September 2015 : In Comparison With 2014
Q III 2015 y-o-y q-o-q
DDI 14.9% 11.4%
FDI 18.1% 0.3%
TOTAL 17.0% 3.8%
Jan-Sep 2015 y-o-y
DDI 16.4%
FDI 16.9%
TOTAL 16.7%
Q I 2014 Q II 2014 Q III 2014 Jan-Sep 2014 Q I 2015 Q II 2015 Q III 2015 Jan-Sep 2015Target2015*)
Achievements**)
TOTAL 106,6 116,2 119,9 342,7 124,6 135,1 140,3 400,0 519,5 77,0%
DDI 34,6 38,2 41,6 114,4 42,5 42,9 47,8 133,2 175,8 75,8%
FDI 72,0 78,0 78,3 228,3 82,1 92,2 92,5 266,8 343,7 77,6%
050
100150200250300350400450500550
Rp
Tri
llio
n

The Investment Coordinating Board of the Republic of Indonesia
5
Investment Realization in Quarter III and January - September 2015
Compared to The Same Period in 2014 : DDI and FDI
Quarter III 2014 Quarter III 2015
Jan-Sep 2014 Jan-Sep 2015
Quarter III and January - September 2015 : In Comparison With 2014
1. Quarter III 2014 and Quarter III 2015 : DDI dan FDI
2. Jan-Sep 2014 and Jan-Sep 2015 : DDI and FDI
DDIRp 114.4 T
(33.4%)
FDIRp 228.3 T
(66.6%)
T= Trillion
DDIRp 41.6 T(34.7%)
FDIRp 78.3 T(65.3%)
DDIRp 47.8 T(34.1%)
FDIRp 92.5 T(65.9%)
DDIRp 133.2 T
(33.3%)
FDIRp 266.8 T
(66.7%)

The Investment Coordinating Board of the Republic of Indonesia
6
Investment Realization in Quarter III and January – September 2015
Compared to The Same Period in 2014: Java and Outside Java
Quarter III 2014 Quarter III 2015
Jan-Sep 2014 Jan-Sep 2015
Quarter III and January - September 2015 : In Comparison With 2014
1. Quarter III 2014 and Quarter III 2015 : Java and Outside Java
2. Jan-Sep 2014 and Jan-Sep 2015 : Java and Outside Java
JavaRp 62.2 T(51.9%)
Outside JavaRp 57.7 T(48.1%)
JavaRp 193.3 T
(56.4%)
Outside JavaRp 149.4 T
(43.6%)
T= Trillion
JavaRp 74.8 T(53.3%)
Outside JavaRp 65.5 T(46.7%)
JavaRp 219.3 T
(54.8%)
OutsideJava
Rp 180.7 T(45.2%)

The Investment Coordinating Board of the Republic of Indonesia
7
II. Quarter III 2015 : Sector, Location, and Country Of Origin

The Investment Coordinating Board of the Republic of Indonesia
8
FDI
DDI DDI+FDI
T= TrillionB= Billion
Quarter III 2015 : Sector, Location, and Country of Origin
Investment Realization in Quarter III 2015: Based on Sector
Electricity, Gas and Water Supply
US$ 1.1 B(14.8%)
MiningUS$ 0.9 B(12.2%)
Real Estates,Industrial Estates
and Office Building US$ 0.8 B(10.8%)
Metal, Machinery and Electronic
Industry US$ 0.7 B
(9.5%)
Chemical and Pharmaceutical
Industry US$ 0.6 B
(8.1%)
OthersUS$ 3.3 B(44.6%)
Transportation, Warehouse and
Telecommunication Rp 10.7 T(22.4%)
Electricity, Gas and Water Supply
Rp 5.8 T(12.1%)
Non Metallic Mineral Industry
Rp 5.3 T(11.1%)
Chemical and Pharmaceutical Industry Rp 5.0 T(10.5%)
Food IndustryRp 4.0 T(8.4%)
OthersRp 17.0 T(35.5%)
Electricity, Gas and Water Supply
Rp 19.1 T(13.6%)
Transportation, Warehouse and
TelecommunicationRp 15.4 T(11.0%)
MiningRp 14.1 T(10.0%)
Chemical and Pharmaceutical
Industry Rp 12.3 T
(8.8%)
Real Estates,Industrial Estates
and Office Building Rp 11.4 T
(8.1%)
OthersRp 68.0 T(48.5%)

The Investment Coordinating Board of the Republic of Indonesia
9
NO SECTORINVESTMENT(US$ Million)
PROJECT
1 Electricity, Gas and Water Supply 1,064.94 992 Mining 907.74 2853 Real Estates, Industrial Estates and
Office Building820.08 303
4 Metal, Machinery and Electronic Industry
723.98 394
5 Chemical and Pharmaceutical Industry
578.24 199
6 Food Crops and Plantation 558.05 142
7 Transport Equipment and Other Transport Industry
526.21 183
8 Food Industry 420.58 328
9 Transportation, Warehouse andTelecommunication
373.76 120
10 Non Metallic Mineral Industry 255.13 7311 Rubber and Plastic Industry 236.40 11712 Hotel dan Restaurant 224.47 31013 Paper and Printing Industry 185.93 4914 Trade and Reparation 149.01 843
15 Textile Industry 135.61 13716 Construction 91.62 83
17 Leather Goods and Footwear Industry
61.19 63
18 Other Services 50.68 41219 Other Industries 15.46 78
20 Livestock 8.55 22
21 Wood Industry 6.45 2522 Forestry 4.60 2223 Fishery 2.13 2124 Medical Instrument, Precision, Optic
and Watch Industry0.27 2
TOTAL 7,401.12 4,310
FDIDDI
Investment Realization in Quarter III 2015: Based on Sector
NO SECTORINVESTMENT(Rp Billion)
PROJECT
1 Transportation, Warehouse andTelecommunication
10,743.87 59
2 Electricity, Gas and Water Supply 5,830.18 69
3 Non Metallic Mineral Industry 5,255.28 45
4 Chemical and Pharmaceutical Industry
5,019.89 71
5 Food Industry 3,969.32 204
6 Food Crops and Plantation 3,884.30 85
7 Mining 2,729.42 37
8 Metal, Machinery and Electronic Industry
2,052.61 64
9 Paper and Printing Industry 2,002.25 19
10 Hotel dan Restaurant 1,657.06 78
11 Construction 1,306.20 40
12 Real Estates, Industrial Estates and Office Building
1,165.13 50
13 Wood Industry 942.21 18
14 Rubber and Plastic Industry 408.88 46
15 Textile Industry 273.59 23
16 Trade and Reparation 264.84 162
17 Other Services 182.75 63
18 Transport Equipment and Other Transport Industry
103.52 17
19 Other Industries 21.41 4
20 Livestock 16.30 13
21 Fishery 0.03 3
22 Medical Instrument, Precision, Optic and Watch Industry
0.00 1
23 Leather Goods and Footwear Industry
0.00 4
TOTAL 47,829.04 1,175
Quarter III 2015 : Sector, Location, and Country of Origin

The Investment Coordinating Board of the Republic of Indonesia
10
FDI
DDI
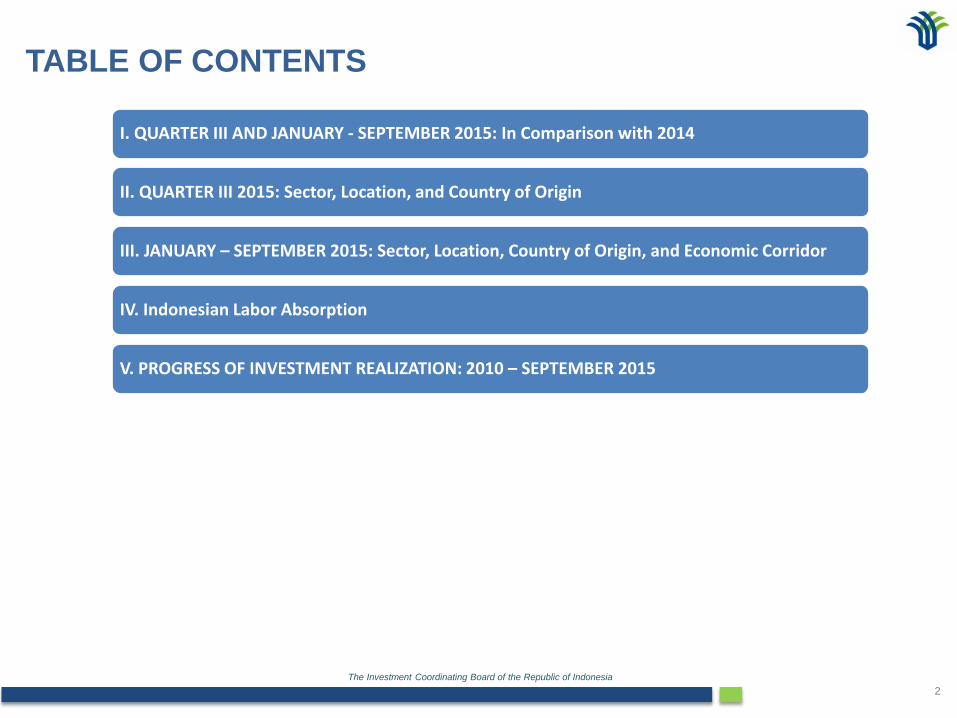
Investment Realization in Quarter III 2015: Based on LocationQuarter III 2015 : Sector, Location, and Country Of Origin
DDI+FDI
T= TrillionB= Billion
West JavaRp 27.9 T(19.9%)
East JavaRp 16.6 T(11.8%)
Special Teritory of Jakarta
Rp 15.0 T(10.7%)Banten
Rp 10.5 T(7.5%)
East KalimantanRp 10.3 T
(7.3%)
OthersRp 60.0 T(42.8%)
West JavaUS$ 1.5 B(20.3%)
East JavaUS$ 0.8 B(10.8%)
Special Teritoryof JakartaUS$ 0.7 B
(9.5%)
BantenUS$ 0.6 B
(8.1%)
East KalimantanUS$ 0.6 B
(8.1%)
Others US$ 3.2 B(43.2%)
West JavaRp 8.6 T(18.0%)
Special Teritory of JakartaRp 6.8 T(14.2%)
East JavaRp 6.0 T(12.5%)
Central JavaRp 3.1 T(6.5%)
BantenRp 2.9 T(6.1%)
OthersRp 20.4 T(42.7%)
The Investment Coordinating Board of the Republic of Indonesia
11
NO LOCATIONINVESTMENT(US$ Million)
PROJECT
1 West Java 1,544.26 1,014
2 East Java 847.13 1783 Special Teritory of Jakarta 654.52 1,0144 Banten 606.75 452
5 East Kalimantan 594.29 776 West Kalimantan 577.73 1187 South Kalimantan 352.11 51
8 North Sumatera 308.22 1019 Bali 213.65 214
10 Riau 208.62 5311 Papua 201.50 2712 West Nusa Tenggara 171.65 148
13 South Sumatera 155.60 3114 North Kalimantan 137.92 815 Central Java 115.05 168
16 Central Sulawesi 94.48 4917 North Maluku 88.67 1318 Maluku 76.48 7
19 Riau Islands 73.29 14320 Central Kalimantan 67.65 4521 West Papua 60.40 26
22 South Sulawesi 45.51 4523 Southeast Sulawesi 40.79 5724 Lampung 32.37 22
25 Jambi 31.08 2526 Bangka Belitung Islands 29.71 22
27 East Nusa Tenggara 21.90 3928 Spesial Region of Yogyakarta 14.00 3229 West Sumatera 13.51 34
30 North Sulawesi 11.83 4931 Aceh 4.29 2332 Bengkulu 4.08 7
33 Gorontalo 1.32 1034 West Sulawesi 0.75 8
TOTAL 7,401.12 4,310
FDIDDI
Investment Realization in Quarter III 2015 : Based on Location
NO LOCATIONINVESTMENT(Rp Billion)
PROJECT
1 West Java 8,614.66 202
2 Special Teritory of Jakarta 6,836.07 75
3 East Java 5,970.53 132
4 Central Java 3,103.13 248
5 Banten 2,951.50 100
6 East Kalimantan 2,901.63 15
7 Riau 2,809.58 54
8 Jambi 2,517.09 32
9 South Sulawesi 2,062.40 32
10 South Sumatera 1,691.84 16
11 West Sumatera 1,249.32 21
12 West Kalimantan 1,143.11 30
13 Aceh 1,133.60 40
14 Bali 972.58 9
15 Papua 872.63 10
16 Southeast Sulawesi 781.34 17
17 Riau Islands 493.46 26
18 West Sulawesi 369.82 2
19 Lampung 331.54 7
20 North Kalimantan 271.60 3
21 Central Sulawesi 227.16 15
22 West Nusa Tenggara 157.72 9
23 Bangka Belitung Islands 134.14 9
24 North Sumatera 82.76 24
25 Spesial Region of Yogyakarta 56.88 8
26 Gorontalo 29.41 1
27 South Kalimantan 26.94 16
28 Central Kalimantan 16.64 3
29 North Sulawesi 10.85 9
30 Bengkulu 9.02 4
31 West Papua 0.07 3
32 North Maluku 0.00 1
33 East Nusa Tenggara 0.00 2
TOTAL 47,829.04 1,175
Quarter III 2015 : Sector, Location, and Country of Origin

The Investment Coordinating Board of the Republic of Indonesia
12
Investment Realization in Quarter III 2015 : Based on Country of OriginQuarter III 2015 : Sector, Location, and Country of Origin
B= Billion
Singapore US$ 1.2 B(16.2%)
JapanUS$ 0.9 B(12.2%)
NetherlandsUS$ 0.5 B
(6.8%)
MalaysiaUS$ 0.3 B
(4.0%)
China US$ 0.2 B
(2.7%)
Others US$ 4.3 B(58.1%)

The Investment Coordinating Board of the Republic of Indonesia
13
NO COUNTRY OF ORIGININVESTMENT(US$ Million)
PROJECT
1 Singapore 1,248.80 734
2 Japan 917.27 399
3 Netherlands 494.88 166
4 Malaysia 322.93 206
5 China 245.75 300
6 United State of America 241.84 77
7 Hong Kong 241.57 130
8 British Virgin Islands 227.84 138
9 South Korea 214.83 531
10 Italy 91.89 34
11 Australia 32.91 10912 France 29.00 51
13 Spain 25.26 19
14 Luxembourg 22.56 9
15 United Kingdom 19.34 54
16 India 18.08 63
17 Thailand 15.16 16
18 Switzerland 14.73 30
19 Marshall Island 12.06 2
20 Taiwan 11.34 58
21 Seychelles 7.87 8
22 Yemen 4.83 3
23 Mauritius 3.79 19
24 Germany 2.51 33
25 Turkey 2.46 6
26 New Zealand 2.19 7
27 Belgium 1.06 16
28 Sudan 0.70 3
29 Saudi Arabia 0.61 9
30 Pakistan 0.60 14
31 Panama 0.50 2
32 West Samoa 0.50 10
33 Somalia 0.40 334 Czech 0.35 2
35 Portugal 0.35 1
36 Nigeria 0.30 2
Investment Realization in Quarter III 2015 : Based on Country of Origin
NO COUNTRY OF ORIGININVESTMENT(US$ Million)
PROJECT
37 Norway 0.30 2
38 Iraq 0.25 3
39 Canada 0.22 9
40 Cameroon 0.20 2
41 Bangladesh 0.15 2
42 United Arab Emirates 0.15 3
43 Denmark 0.15 2
44 Philipines 0.14 4
45 Austria 0.11 4
46 Isle of Man 0.09 2
47 Jordan 0.08 2
48 South Africa 0.07 3
49 Polandia 0.01 3
50 Khyrgiztan 0.00 1
51 Burkina Faso 0.00 1
52 Sweden 0.00 1
53 Scotland 0.00 1
54 Afghanistan 0.00 2
55 Suriah 0.00 1
56 Ukraine 0.00 1
57 Cook Islands 0.00 1
58 Lebanon 0.00 2
59 Russia 0.00 2
60 Kenya 0.00 1
61 Ireland 0.00 1
62 Guinea 0.00 1
63 Libya 0.00 1
64 Egypt 0.00 1
65 Bahrain 0.00 1
66 Mexico 0.00 1
67 Vietnam 0.00 3
68 Belize 0.00 3
69 Cayman Islands 0.00 1
70 Morocco 0.00 1
71 Joint Countries 2,922.14 977
Total 7,401.12 4,310
Quarter III 2015 : Sector. Location. and Country of Origin
The Investment Coordinating Board of the Republic of Indonesia
14
III. January – September 2015 : Sector, Location, Country of Origin, and Economic Corridor

The Investment Coordinating Board of the Republic of Indonesia
15
FDI
DDI DDI + FDI
T= TrillionB= Billion
MiningUS$ 3.1 B(14.6%)
Transportation, Warehouse, and
TelecommunicationUS$ 2.8 B(13.1%)
Metal, Machinery, and Electronic
US$ 2.1 B(9.9%)
Transport Eqipment and Other Transport
IndustryUS$ 1.6 B
(7.7%)Electricity, Gas, and
Water SupplyUS$ 1.6 B
(7.5%)
OthersUS$ 10.1 B
(47.4%)
Food IndustryRp 18.1 T(13.6%)Electricity, Gas, and
Water SupplyRp 17.4 T
(13.1)
Transportation, Warehouse, and
TelecommunicationRp 17.4 T
(13.1)
Chemical and Pharmacetical
IndustryRp 16.1 T
(12.1)
Non Metallic Mineral IndustryRp 11.9 T (18.9%)
OthersRp 52.3 T(39.3%)
Transportation, Warehouse, and
TelecommunicationRp 52.6 T(13.1%)
MiningRp 42.8 T(10.7%)
Electricity, Gas, and Water Supply
Rp 37.9 T(9.5%)
Chemical and Pharmacetical
IndustryRp 34.5 T
(8.6%)Metal, Machinery,
and ElectronicRp 33.2 T
(8.3%)
OthersRp 199.1 T
(49.8%)
January – September 2015 : Sector, Location, Country of Origin, and Economic Corridor
Investment Realization in January - September 2015 : Based on Sector

The Investment Coordinating Board of the Republic of Indonesia
16
NO SECTORINVESTMENT(Rp Billion)
PROJECT
1 Food Industry 18,109.11 628
2 Electricity, Gas, and Water Supply 17,446.49 169
3 Transportation, Warehouse, and Telecomunication
17,386.53 161
4 Chemical and Pharmaceutical Industry
16,058.76 206
5 Non Metallic Mineral Industry 11,905.75 135
6 Construction 9,631.22 141
7 Food Crops and Plantation 9,569.52 269
8 Metal, Machinery, and Electronic Industry
6,573.10 220
9 Real Estates, Industrial Estates, and Office Building
5,888.02 154
10 Mining 3,910.16 96
11 Paper and Printing Industry 3,593.17 77
12 Hotel dan Restaurant 3,559.09 189
13 Textile Industry 2,417.38 112
14 Rubber and Plastic Industry 2,321.05 169
15 Trade and Reparation 1,253.10 519
16 Transport Equipment and Other Transport Industry
1,037.71 65
17 Wood Industry 998.34 48
18 Others Services 755.45 164
19 Livestock 307.26 59
20 Fishery 271.74 11
21 Forestry 245.92 11
22 Others Industry 44.05 23
23 Leather Goods and Footwear Industry
5.40 10
24 Medical Instrument, Precision, Optic and Watch Industry
0.00 4
TOTAL 133,288.33 3,640
FDIDDI
NO SECTORINVESTMENT(US$ Million)
PROJECT
1 Mining 3,107.33 726
2 Transportation, Warehouse, and Telecomunication
2,816.46 341
3 Metal, Machinery, and Electronic Industry
2,126.94 1220
4 Transport Equipment and Other Transport Industry
1,645.14 518
5 Electricity, Gas, and Water Supply 1,635.82 245
6 Real Estates, Industrial Estates, and Office Building
1,481.25 629
7 Chemical and Pharmaceutical Industry
1,477.47 557
8 Food Crops and Plantation 1,421.04 399
9 Food Industry 1,161.05 886
10 Construction 921.16 246
11 Non Metallic Mineral Industry 842.13 186
12 Rubber and Plastic Industry 558.26 367
13 Hotel and Restaurant 542.14 735
14 Paper and Printing Industry 424.83 135
15 Trade and Reparation 394.07 2290
16 Textile Industry 274.62 411
17 Others Services 207.25 1089
18 Leather Goods and Footwear Industry
128.49 154
19 Fishery 52.11 60
20 Others Industry 51.63 224
21 Wood Industry 37.77 67
22 Livestock 14.88 44
23 Forestry 14.87 60
24 Medical Instrument, Precision, Optic, and Watch Industry
0.50 5
TOTAL 21,337.21 11,594
Investment Realization in January - September 2015 : Based on SectorJanuary – September 2015 : Sector, Location, Country of Origin, and Economic Corridor

The Investment Coordinating Board of the Republic of Indonesia
17
DDI Trends Sector: 2010 – September 2015
T = Trillion
ManufacturingRp 24.4 T(40.3%)
ServicesRp 22.8 T(37.6%)
Food Crops and Plantations
Rp 8.9 T(14.7%)
MiningRp 3.0 T(5.1%)
LivestockRp 1.2 T(2.0%)
ForestryRp 0.2 T(0.3%) Fishery
Rp 0.001 T(0.0%)
2010
ManufacturingRp 38.5T(50.7%)
ServicesRp 20.9 T(27.6%)
Food Crops and Plantations
Rp 9.4 T(12.3%)
MiningRp 6.9 T(9.1%)
LivestockRp 0.3 T(0.3%)
ForestryRp 0.001 T
(0.0%)
2011
ManufacturingRp 49.9 T(54.1%)
ServicesRp 21.9 T(23.8%)
MiningRp 10.5 T(11.4%)
Food Crops and Plantations
Rp 9.6 T(10.4%)
ForestryRp 0.1 T(0.2%)
LivestockRp 0.1 T(0.1%)
FisheryRp 0.01 T
(0.0%)
2012
ServicesRp 80.6 T(51.6%)
ManufacturingRp 59.0 T(37.8%)
Food Crops and PlantationsRp 12.7 T
(8.1%)
MiningRp 3.1 T(2.0%)
LivestockRp 0.7 T(0.4%)
FisheryRp 0.02 T
(0.0%)
ForestryRp 0.0003 T
(0.0%)
2014
ServicesRp 51.3 T(40.0%)
ManufacturingRp 51.2 T(40.0%)
MiningRp 18.8 T(14.6%)
Food Crops and Plantations
Rp 6.6 T(5.1%)
LivestockRp 0.3 T (0.3%)
2013Food Crops and Plantations
Rp. 9.5 T(7.2% )
MiningRp. 3.9 T
(2.9%)
LivestockRp. 0.3 T
(0.2%)
FisheryRp. 0.3 T
(0.2%)
ForestryRp. 0.3 T
(0.1%)
ManufacturingRp. 63.1 T
(47.4%)
ServicesRp. 55.9 T
(42.0%)
Jan – Sep 2015
January – September 2015 : Sector, Location, Country of Origin, and Economic Corridor

The Investment Coordinating Board of the Republic of Indonesia
18
FDI Trends Sector : 2010 – September 2015
M = Million
ServicesUS$ 7.8 M
(40.0%)
ManufacturingUS$ 6.8 M
(34.8%)
MiningUS$ 3.6 M
(18.6%)
Food Crops and PlantationUS$ 1.2 M
(6.3%)
LivestockUS$ 0.02 M
(0.1%)
ForestryUS$ 0.01 M
(0.1%)
FisheryUS$ 0.01 M
(0.1%)
2011
ManufacturingUS$ 11.8 M
(47.9%)
ServicesUS$ 6.9 M
(28.0%)
MiningUS$ 4.2 M
(17.3%)
Food Crops and PlantationUS$ 1.6 M
(6.5%)
FisheryUS$ 0.03 M
(0.1%)
ForestryUS$ 0.03 M
(0.1%)
LivestockUS$ 0.02 M
(0.1%)
2012
ServicesUS$ 9.8 M
(60.7%)
ManufacturingUS$ 3.3 M
(20.6%)
MIningUS$ 2.2 M
(13.6%)
Food Crops and PlantationUS$ 0.8 M
(4.6%)
ForestryUS$ 0.04 M
(0.2%)
LivestockUS$ 0.025 M
(0.2%)Fishery
US$ 0.002 M(0.1%)
2010
ManufacturingUS$ 15.8 M
(55.4%)
ServicesUS$ 6.3 M
(22.0%)
MiningUS$ 4.8 M
(16.8%)
Food Crops and PlantationUS$ 1.6 M
(5.6%)
ForestryUS$ 0.03 M
(0.1%)
LivestockUS$ 0.01 M
(0.1%)
FisheryUS$ 0.01 M
(0.0%)
2013
ManufacturingUS$ 13.0 M
(45.6%)
ServicesUS$ 8.5 M
(29.9%)
PertambanganUS$ 4.7 M
(16.4%)
Food Crops and PlantationUS$ 2.2 M
(7.7%)
ForestryUS$ 0.05 M
(0.2%)
FisheryUS$ 0.04 M
(0.1%)Livestock
US$ 0.03 M(0.1%)
2014
MiningUS$ 3.1 M(14.5%)
Food Crops and PlantationUS$ 1.4 M
(6.6%)
FisheryUS$ 0.052 M
(0.2%)
LivestockUS$ 0.015 M
(0.1%)
ForestryUS$ 0.015
(0.1%)
ManufacturingUS$ 8.7 M(40.9%)
ServicesUS$ 8 M(37.6%)
Jan - Sep 2015
January – September 2015 : Sector, Location, Country of Origin, and Economic Corridor

The Investment Coordinating Board of the Republic of Indonesia
19
T = Trilion
ManufacturingRp 89.8 T
(60.7%)
ServicesRp 30.4 T (20.6%)
Food Crops and Plantations
Rp 20.1 T (13.6%)
MiningRp 6.8 T (4.6%)
LivestockRp 0.4 T (0.2%)
ForestryRp 0.2 T (0.2%)
FisheryRp 0.2 T (0.1%)
2010
ManufacturingRp 108.7 T
(43.3%)
ServicesRp 82.0 T (32.7%)
Food Crops and PlantationsRp 41.9 T (16.7%)
MiningRp 17.9 T
(7.1%)
LivestockRp 0.4 T (0.2%)
ForestryRp 0.1 T (0.0%) Fishery
Rp 0.1 T (0.0%)
2011
ManufacturingRp 155.8 T
(49.7%)ServicesRp 83.7 T (26.7%)
MiningRp 48.8 T (15.6%)
Food Crops and PlantationsRp 24.0 T
(7.7%)
ForestryRp 0.4 T (0.1%)
LivestockRp 0.3 T (0.1%) Fishery
Rp 0.2 T(0.1%)
2012
ServicesRp 201.1 T
(50.5%)
ManufacturingRp 110.6 T
(27.7%)
MiningRp 64.3 T(16.1%)
Food Crops and PlantationsRp 21.8 T
(5.5%)
LivestockRp 0.6 T(0.2%)
FisheryRp 0.1 T(0.0%)
ForestryRp 0.1 T(0.0%)
2013
DDI and FDI Trends Sector: 2010 - September 2015
ManufacturingRp 199.1 T
(43.0%)
ServicesRp 172.3 T
(37.2%)
MiningRp 53.3 T(11.5%)
Food Crops and PlantationsRp 36.4 T
(7.9%)
LivestockRp 1.0 T(0.2%)
ForestryRp 0.6 T(0.1%)
FisheryRp 0.4 T(0.1%)
2014
January – September 2015 : Sector, Location, Country of Origin, and Economic Corridor
Food Crops and PlantationsRp 48.4 T(12.1%)
MiningRp 21.7 T
(5.4%)LivestockRp 0.9 T(0.2%)
FisheryRp 0.5 T(0.1%)
ForestryRp 0.4 T(0.1%)
ManufacturingRp 172.2 T
(43.1%)
ServicesRp 155.9 T
(39.0%)
Jan – Sep 2015

The Investment Coordinating Board of the Republic of Indonesia
20
DDI + FDIDDI
January - September 2015 : Sector, Location, Country of Origin, and Economic CorridorInvestment Realization in January - September 2015 : Based on Location
FDI
T= TrillionB= Billion
West JavaRp 24.0 T(18.0%)
East JavaRp 18.6 T(14.0%)
Special Territory of
JakartaRp 15.1 T(11.3%)
Central JavaRp 10.3 T
(7.7%)
South SumateraRp 8.9 T(6.7%)
OthersRp 56.3 T(42.3%)
West JavaUS$ 5.2 B(24.3%)
Special Territory of
JakartaUS$ 2.3 B…
East KalimantanUS$ 1.8 B
(8.3%)
East JavaUS$ 1.7 B
(7.9%)
BantenUS$ 1.6 B
(7.6%)
OthersUS$ 8.8 B(41.4%)
West JavaRp 88.9 T(22.2%)
Special Territory of
JakartaRp 43.3 T(10,8%)
East KalimantanRp 30.9 T
(7.7%)
East JavaRp 39.6 T
(9.9%)
BantenRp 28.2 T
(7.1%)
OthersRp 169.1 T
(42.3%)
Jan - Sep 2015

The Investment Coordinating Board of the Republic of Indonesia
21
NO LOCATIONINVESTMENT(US$ Million
PROJECT
1 West Java 5,188.67 3,0462 Special Territory of Jakarta 2,255.69 2,7413 East Kalimantan 1,768.12 1834 East Java 1,682.59 5185 Banten 1,616.08 1,0546 West Kalimantan 1,146.96 3097 North Sumatera 939.97 3248 Papua 831.39 929 Central Sulawesi 624.62 118
10 Central Java 613.39 358
11 Riau Islands 515.07 42612 South Kalimantan 513.16 9913 West Nusa Tenggara 511.55 26014 South Sumatera 484.81 10515 Bali 454.84 56416 Riau 388.12 16617 Central Kalimantan 273.77 9318 Lampung 236.17 4719 North Kalimantan 195.62 2920 South Sulawesi 164.36 11221 West Papua 136.87 68
22 North Maluku 132.99 4323 Southeast Sulawesi 114.50 14224 Jambi 104.57 8725 Special Region of Yogyakarta 84.22 8526 Maluku 82.35 3827 Bangka Belitung Islands 80.98 5728 North Sulawesi 76.77 13829 East Nusa Tenggara 38.52 7530 West Sumatera 37.74 8831 Bengkulu 19.37 2532 Aceh 18.16 5833 Gorontalo 3.53 2934 West Sulawesi 1.69 17
TOTAL 21,337.21 11,594
FDIDDI
NO LOCATIONINVESTMENT(Rp Billion)
PROJECT
1 West Java 24,034.37 6192 East Java 18,612.25 4293 Special Territory of Jakarta 15,103.09 2184 Central Java 10,322.61 724
5 South Sumatera 8,894.58 586 East Kalimantan 8,814.27 707 Banten 7,962.60 2228 Riau 7,163.03 1309 West Kalimantan 5,201.46 123
10 South Sulawesi 4,829.30 16611 Aceh 3,792.52 14912 Jambi 3,202.55 7113 North Sumatera 3,097.93 13114 West Sumatera 1,509.01 5515 Bali 1,225.54 3516 Lampung 1,068.63 2717 West Sulawesi 1.003.85 1218 Papua 995.82 3719 South Kalimantan 961.05 4620 Bangka Belitung Islands 889.78 2021 Southeast Sulawesi 878.44 3622 Central Sulawesi 775.93 2623 Central Kalimantan 726.18 1624 Riau Islands 598.12 8825 North Kalimantan 531.67 1626 Bengkulu 338.79 1127 Special Region of Yogyakarta 309.38 3028 West Nusa Tenggara 265.15 1229 West Papua 60.00 1430 North Maluku 48.23 331 Gorontalo 39.97 432 North Sulawesi 31.22 3933 East Nusa Tenggara 1.00 3
TOTAL 133,288.32 3,640
Investment Realization in January - September 2015 : Based On LocationJanuary - September 2015 : Sector, Location, Country of Origin, and Economic Corridor

The Investment Coordinating Board of the Republic of Indonesia
22
East JavaRp 34.8 T(27.2%)
EastKalimantan
Rp 15.8 T(12.4%)Central Java
Rp 12.6 T(9.8%)
West JavaRp 9.0 T(7.0%)
SouthKalimantan
Rp 8.3 T(6.5%)
OthersRp 47.7 T(37.1%)
2013
DDI Trends Location: 2010 – September 2015
T= Trillion
West JavaRp 11.2 T(14.7%)
East JavaRp 9.7 T(12.7%)
Special Territory of
JakartaRp 9.3 T(12.2%)
RiauRp 7.5 T(9.8%)
East Kalimantan
Rp 6.6 T(8.6%)
OthersRp 31.7 T(41.9%)
2011
East JavaRp 21.5 T(23.3%)
West JavaRp 11.4 T(12.3%)
Special Territory of
JakartaRp 8,5 T(9.3%)
EastKalimantan
Rp 5,9 T(6,4%)
Central JavaRp 5.8 T(6.3%)
OthersRp 39.1 T(42.4%)
2012
West JavaRp 15.8 T(26.1%)
East JavaRp 8.1 T(13.3%)
East Kalimantan
Rp 7.9 T (13.0%)
BantenRp 5.8 T (9.6%)
Special Territory of
JakartaRp 18.4 T
(7.6%)
OthersRp 18.4 T (30.4%)
2010
East JavaRp 38.1 T(24.4%)
West JavaRp 18.7 T(12.0%)
Special Territory of
JakartaRp 17.8 T(11.4%)
Central JavaRp 13.6 T
(8.7%)
EastKalimantan
Rp 12.9 T(8.2%)
OthersRp 55.0 T(35.3%)
2014
January - September 2015 : Sector, Location, Country of Origin, and Economic Corridor
West JavaRp 24.0 T(18.0%)
East JavaRp 18.6 T(14.0%)
Special Territory of
JakartaRp 15.1 T(11.3%)
Central Java
Rp 10.3 T(7.7%)
South SumatraRp 8.9 T(6.7%)
OthersRp 56.3 T(42.3%)
Jan - Sep 2015

The Investment Coordinating Board of the Republic of Indonesia
23
FDI Trends Location : 2010 – September 2015
B = Billion
Special Territory of
JakartaUS$ 4.8 B(24.8%)
West JavaUS$ 3.8 B(19.7%)
BantenUS$ 2.2 B(11.2%)
PapuaUS$ 1.3 B
(6.7%)
East JavaUS$ 1.3 B
(6.7%)
OthersUS$ 6.1 B(30.9%)
2011
West JavaUS$ 4.2 B(17.1%)
Special Territory of
JakartaUS$ 4.1 B(16.7%)
BantenUS$ 2.7 B(11.1%)
East JavaUS$ 2.3 B
(9.4%)
East KalimantanUS$ 2.0 B
(8.2%)
OthersUS$ 9.2 B(37.5%)
2012
West JavaUS$ 7.1 B(24.9%)
BantenUS$ 3,7 B(13,0%)East Java
US$ 3.4 B(11,9%)
Special Territory of
JakartaUS$ 2.6 B
(9.1%)
PapuaUS$ 2.4 B
(8.2%)
OthersUS$ 9.4 B(32.9%)
2013
Special Territory of Jakarta US$ 6.4 B(39.7%)
East Java US$ 1.8 B(10.9%)
West Java US$ 1.7 B(10.4%)
BantenUS$ 1.5 B
(9.5%)
East KalimantanUS$ 1.1 B
(6.7%)
Others US$ 3.7 B(22.8%)
2010
West JavaUS$ 6.6 B(23.0%)
Special Territory of
JakartaUS$ 4.5 B(15.8%)
EastKalimantanUS$ 2.1 B
(7.5%)
BantenUS$ 2.0 B
(7.1%)
East JavaUS$ 1.8 B
(6.3%)
OthersUS$ 11.5 B
(40.3%)
2014
January - September 2015 : Sector, Location, Country of Origin, and Economic Corridor
West JavaUS$ 5.2 B(24.4%)
Special Territory of
JakartaUS$ 2.3 B(10.3%)
East KalimantanUS$ 1.8 B
(8.5%)
East JavaUS$ 1.7 B
(8.0%)
BantenUS$ 1.6 B
(7.5%)
OthersUS$ 8.8 B(41.3%)
Jan – Sep 2015

The Investment Coordinating Board of the Republic of Indonesia
24
Special Territoryof JakartaRp 63.4 T(30.4%)
West JavaRp 31.3 T(15.0%)
East JavaRp 24.3 T(11.6%)
BantenRp 19.8 T
(9.5%)
EastKalimantan
Rp 15.9 T(7.6%)
OthersRp 54.2 T(25.9 %)
2010
DDI and FDI Trends Location : 2010 – September 2015
West JavaRp 76.5 T(19.2%)
East JavaRp 67.0 T(16.8%)
BantenRp 39.0 T
(9.8%)Special
Territory of Jakarta
Rp 30.2 T(7.6%)
EastKalimantan
Rp 28.3 T(7.1%)
OthersRp 157.5 T
(39.5%)
2013
T = Trillion
Special Territory of
JakartaRp 52.7 T(21.0%)
West JavaRp 45.8 T(18.2%)
BantenRp 23,8 T
(9,5%)
East JavaRp 21.5 T
(8.5%)
PapuaRp 13.2 T
(5.3%)
OthersRp 94.3 T(37.5%)
2011West JavaRp 49.3 T(15.7%)
SpecialTeritory
of JakartaRp 45,5 T(14,5%)
East JavaRp 42.2 T(13.5%)
BantenRp 29.6 T
(9.4%)
EastKalimantan
Rp 23,1 T(7,4%)
OthersRp 123.6 T
(39.5%)
2012
West JavaRp 89.3 T(19.3%)
Special Territory of
JakartaRp 66.3 T(14.3%)
East JavaRp 57.5 T(12.4%)East
KalimantanRp 36.0 T
(7.8%)
BantenRp 30.0 T
(6.5%)
OthersRp 184.0 T
(39.7%)
2014
January - September 2015 : Sector, Location, Country of Origin, and Economic Corridor
West JavaRp 88.9 T(22.2%)
Special Teritory of
JakartaRp 43.3 T(10.8%)
East Kalimantan
Rp 30.9 T(7.7%)
East JavaRp 39.6 T
(9.9%)
BantenRp 28.2 T
(7.0%)
OthersRp 169.1 T
(42.3%)
Jan - Sep 2015

The Investment Coordinating Board of the Republic of Indonesia
25
Investment Realization in January - September 2015 : Based on Country of OriginJanuary - September 2015 : Sector, Location, Country of Origin, and Economic Corridor
B= Billion
SingaporeUS$ 3.5 B(16.4%)
MalaysiaUS$ 2.9 B(13.6%)
JapanUS$ 2.5 B(11.8%)
South KoreaUS$ 1.0 B
(4.7%)
NetherlandsUS$ 0.9 B
(4.2%)
OthersUS$ 10.5 B
(49.3%)

The Investment Coordinating Board of the Republic of Indonesia
26
NO COUNTRY OF ORIGININVESTMENT(US$ Million)
PROJECT
1 Singapore 3,551.42 1,9992 Malaysia 2,917.21 6003 Japan 2,494.98 1,3184 South Korea 1,002.66 1,5295 Netherlands 908.30 3016 United States of America 853.71 1737 British Virgin Islands 670.80 3608 United Kingdom 444.28 1589 Hong Kong 416.61 265
10 China 406.02 70511 Thailand 169.76 5512 Australia 104.61 29613 Italy 97.99 7414 Taiwan 96.43 17115 France 94.94 11816 Canada 73.56 2217 Luxembourg 54.32 2418 Switzerland 36.98 6719 Mauritius 33.93 3920 Seychelles 33.80 2721 India 33.20 14522 Saudi Arabia 29.93 1823 Germany 27.37 9424 Cayman Islands 26.72 1325 Spain 25.91 4226 New Zealand 16.26 1327 United Arab Emirates 13.76 1228 Brazil 12.70 429 Marshall Islands 12.06 530 Poland 11.48 831 Afghanistan 8.14 532 Yemen 7.10 533 Belgium 4.77 5034 Turkey 3.08 1435 Denmark 1.85 936 West Samoa 1.66 1537 Belize 1.50 938 Pakistan 1.44 2939 Egypt 1.36 240 Somalia 0.90 441 Bulgaria 0.87 142 Czech 0.76 443 Sudan 0.70 344 Iraq 0.60 6
Investment Realization in January - September 2015 : Based on Country of OriginNO COUNTRY OF ORIGIN
INVESTMENT(US$ Million)
PROJECT
45 Lebanon 0.56 4
46 Panama 0.53 5
47 Guatemala 0.38 2
48 Portugal 0.35 2
49 Bangladesh 0.35 3
50 Nigeria 0.31 5
51 Norway 0.31 6
52 Russia 0.30 14
53 Tanzania 0.30 1
54 Austria 0.24 10
55 Jordan 0.23 5
56 Sri Lanka 0.21 1
57 Cameroon 0.20 2
58 Philippines 0.14 12
59 Argentina 0.11 1
60 Guinea 0.10 4
61 Isle of Man 0.09 2
62 Channel Islands 0.08 1
63 South Africa 0.07 3
64 Vietnam 0.06 5
65 Ireland 0.05 3
66 Scotland 0.02 2
67 Suriah 0.02 5
68 Kyrgizstan 0.01 2
69 Burkina Faso 0.00 1
70 Sweden 0.00 5
71 Qatar 0.00 2
72 Hungary 0.00 1
73 Venezuela 0.00 1
74 Slovakia 0.00 1
75 Mexico 0.00 2
76 Libya 0.00 1
77 Morocco 0.00 3
78 Cook Islands 0.00 2
79 Ukraine 0.00 1
80 Slovenia 0.00 1
81 Barbados 0.00 3
82 Bahrain 0.00 2
83 Cyprus 0.00 3
84 Algeria 0.00 1
85 Kenya 0.00 1
86 Joint Countries 6,625.79 2,652Total 21,337.21 11,594
January - September 2015 : Sector, Location, Country of Origin, and Economic Corridor
The Investment Coordinating Board of the Republic of Indonesia
27
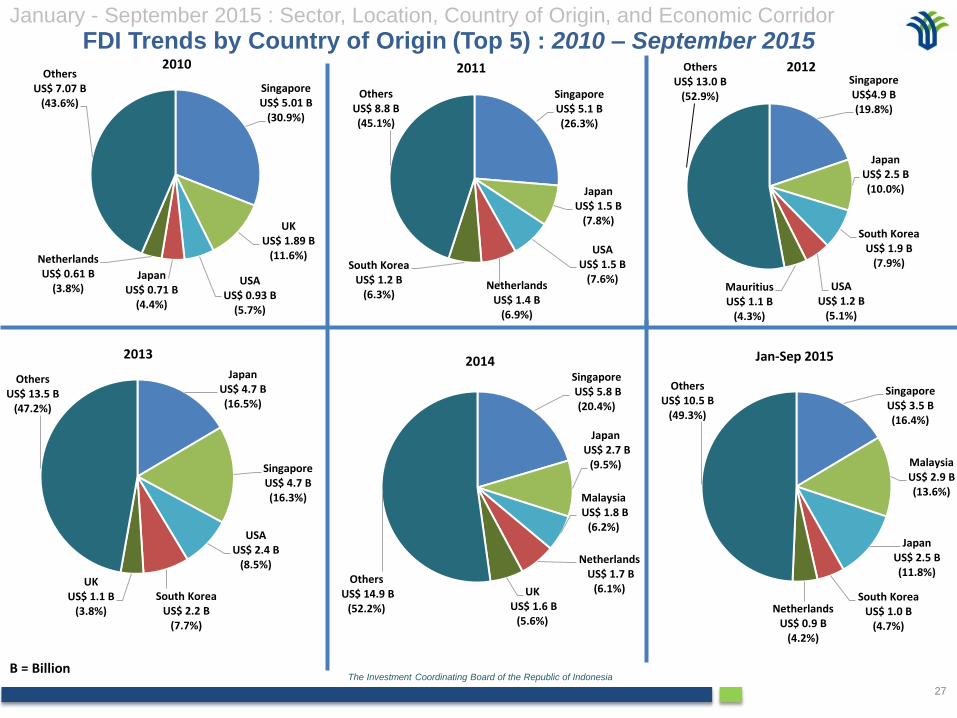
SingaporeUS$ 5.01 B
(30.9%)
UKUS$ 1.89 B
(11.6%)
USAUS$ 0.93 B
(5.7%)
Japan US$ 0.71 B
(4.4%)
Netherlands US$ 0.61 B
(3.8%)
Others US$ 7.07 B
(43.6%)
2010
FDI Trends by Country of Origin (Top 5) : 2010 – September 2015
B = Billion
SingaporeUS$ 5.1 B(26.3%)
JapanUS$ 1.5 B
(7.8%)
USAUS$ 1.5 B
(7.6%)Netherlands
US$ 1.4 B(6.9%)
South KoreaUS$ 1.2 B
(6.3%)
OthersUS$ 8.8 B(45.1%)
2011SingaporeUS$4.9 B(19.8%)
JapanUS$ 2.5 B(10.0%)
South KoreaUS$ 1.9 B
(7.9%)
USAUS$ 1.2 B
(5.1%)
MauritiusUS$ 1.1 B
(4.3%)
OthersUS$ 13.0 B
(52.9%)
2012
JapanUS$ 4.7 B(16.5%)
SingaporeUS$ 4.7 B(16.3%)
USAUS$ 2.4 B
(8.5%)
South KoreaUS$ 2.2 B
(7.7%)
UKUS$ 1.1 B
(3.8%)
OthersUS$ 13.5 B
(47.2%)
2013
SingaporeUS$ 5.8 B(20.4%)
JapanUS$ 2.7 B
(9.5%)
MalaysiaUS$ 1.8 B
(6.2%)
NetherlandsUS$ 1.7 B
(6.1%)UKUS$ 1.6 B
(5.6%)
OthersUS$ 14.9 B
(52.2%)
2014
January - September 2015 : Sector, Location, Country of Origin, and Economic Corridor
SingaporeUS$ 3.5 B(16.4%)
MalaysiaUS$ 2.9 B(13.6%)
JapanUS$ 2.5 B(11.8%)
South KoreaUS$ 1.0 B
(4.7%)
NetherlandsUS$ 0.9 B
(4.2%)
OthersUS$ 10.5 B
(49.3%)
Jan-Sep 2015

The Investment Coordinating Board of the Republic of Indonesia
28
FDI Trend by Main Country of Origin: 2010 – September 2015
B = Billion
Singapore US$ 5.0 B
(30.4%)
EUUS$ 1.2 B
(7.3%)
USAUS$ 0.9 B
(5.5%)
JapanUS$ 0.7 B
(4.3%)Hong Kong US$ 0.6 B
(3.6%)
Malaysia US$ 0.5 B
(3.0%)
South Korea US$ 0.3 B
(1.8%)
AustraliaUS$ 0.2 B
(1.2%)
China US$ 0.2 B
(1.2%)
Taiwan US$ 0.0 B
(0.3%)
Others US$ 6.8 B (41.4%)
2010
Singapore US$ 4.9 B
(19.7%)
Japan US$ 2.5 B
(10.0%)
EUUS$ 2.3 B
(9.2%)
South Korea US$ 1.9 B
(7.6%)
USA US$ 1.2 B
(4.8%)
Australia US$ 0.7 B
(2.8%)
TaiwanUS$ 0.6 B
(2.6%)
Malaysia US$ 0.5 B
(2.0%)
Hong Kong US$ 0.3 B
(1.2%)
China US$ 0.1 B
(0.4%)
Others US$ 9.9 B
(39.7%)
2012
Japan US$ 4.7 B
(16.2%)
Singapore US$ 4.7 B
(16.2%)
USA US$ 2.4 B
(8.3%)
EUUS$ 2.4 B
(8.3%)
South Korea US$ 2.2 B
(7.6%)Malaysia US$ 0.7 B
(2.4%)
Hong Kong US$ 0.4 B
(1.4%)
Taiwan US$ 0.4 B
(1.4%)
China US$ 0.3 B
(1.0%)
Australia US$ 0.2 B
(0.7%)
Others US$ 10.6 B
(36.5%)
2013
Singapore US$ 5.8 B
(20.3%)
EUUS$ 3.8 B (13.3%)
Japan US$ 2.7 B
(9.5%)
Malaysia US$ 1.8 B
(6.3%)
USA US$ 1.3 B
(4.5%)South Korea
US$ 1.1 B(3.8%)
China US$ 0.8 B
(2.8%)
Hong Kong US$ 0.7 B
(2.4%)
Australia US$ 0.6 B
(2.1%)
Taiwan US$ 0.1 B
(0.4%)
Others US$ 9.9 B
(34.6%)
2014
Singapore US$ 5.1 B
(25.8%)
EU US$ 2.2 B
(11.1%)
Japan US$ 1.5 B
(7.6%)
USA US$ 1.5 B
(7.6%)South Korea
US$ 1.2 B(6.1%)
MalaysiaUS$ 0.6 B
(3.1%)Taiwan
US$ 0.2 B(1.2%)
Hong Kong US$ 0.1 B
(0.5%)
China US$ 0.1 B
(0.5%)
Australia US$ 0.1 B
(0.5%)
LainnyaUS$ 7,1 B (36,0%)
2011
January – September 2015 : Sector, Location, Country of Origin, and Economic Corridor
SingaporeUS$ 3.5 B(16.9%)
MalaysiaUS$ 2.9 B(13.6%)
JapanUS$ 2.5 B(11.7%)EU
US$ 1.7 B(8.0%)
South KoreaUS$ 1.0 B
(4.7%)
USAUS$ 0.8 B
(3.7%)
British Virgin Island
US$ 0.7 B(3.3%)
Hong KongUS$ 0.4 B
(1.9%)
ChinaUS$ 0.4 B
(1.9%)
TaiwanUS$ 0.1 B
(0.5%)
OthersUS$ 7.3 B(34.3%)
Jan-Sep 2015

The Investment Coordinating Board of the Republic of Indonesia
29
DDI
FDI
DDI and FDI
Based on Economic Corridor in January -September 2015period, the highest realization of DDI and FDI is located inJava Corridor. The further ranks of realization of the DDI isin Sumatera, Kalimantan, Sulawesi, Bali and NusaTenggara, also Maluku and Papua. The further ranks ofrealization of the FDI is also in Kalimantan, Sumatera,Sulawesi, Bali and Nusa Tenggara, as well as Maluku andPapua Corridor.
Economic Corridor
T= Trillion
January - September 2015 : Sector, Location, Country of Origin, and Economic Corridor
JavaRp219.3 T
(54.8%)Bali and Nusa
TenggaraRp 14.1 T
(3.5%)
KalimantanRp 64.9 T(16.2%)
Maluku and Papua
Rp15.9 T(4.0%)
SulawesiRp19.9 T
(5.0%)
SumateraRp 65.9 T(16.5%)
30.554,9
76.344,3
16.234,6
7.558,71.491,7 1.104,0
0
10.000
20.000
30.000
40.000
50.000
60.000
70.000
80.000
90.000
Sumatera Java Kalimantan Sulawesi Bali andNusa
Tenggara
Malukuand Papua
Rp
Bill
ion
2.825,0
11.440,6
3.897,6
985,5 1.004,9 1.183,6
0
2.000
4.000
6.000
8.000
10.000
12.000
14.000
Sumatera Java Kalimantan Sulawesi Bali andNusa
Tenggara
Maluku andPapua
US$
Mill
ion

The Investment Coordinating Board of the Republic of Indonesia
30
IV. Indonesia Labor Absorption
The Investment Coordinating Board of the Republic of Indonesia
31
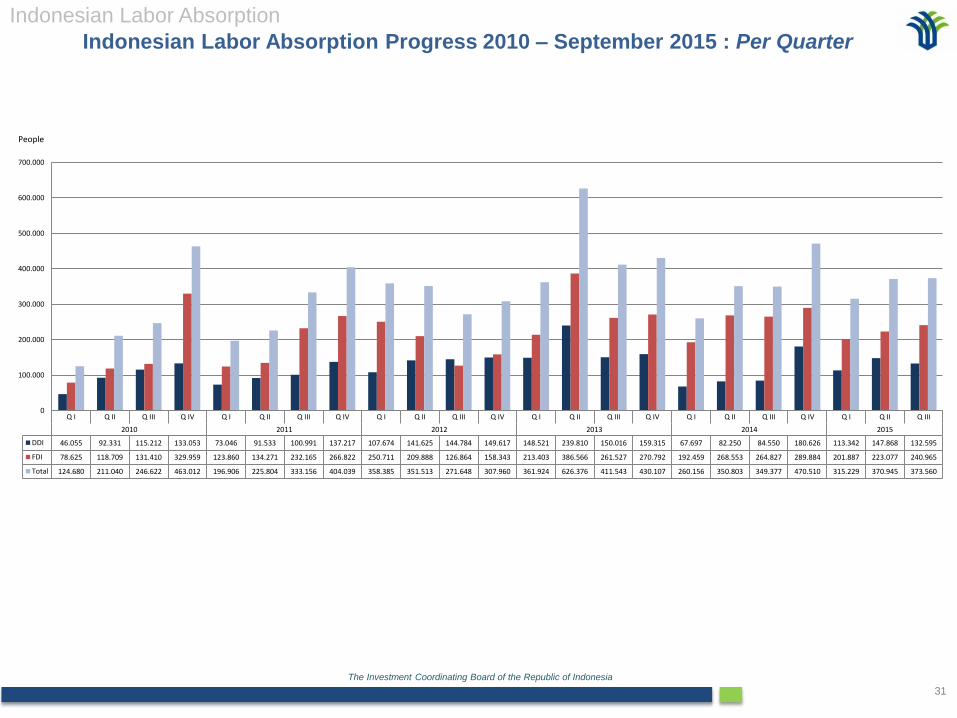
Indonesian Labor Absorption Progress 2010 – September 2015 : Per Quarter
Indonesian Labor Absorption
Q I Q II Q III Q IV Q I Q II Q III Q IV Q I Q II Q III Q IV Q I Q II Q III Q IV Q I Q II Q III Q IV Q I Q II Q III
2010 2011 2012 2013 2014 2015
DDI 46.055 92.331 115.212 133.053 73.046 91.533 100.991 137.217 107.674 141.625 144.784 149.617 148.521 239.810 150.016 159.315 67.697 82.250 84.550 180.626 113.342 147.868 132.595
FDI 78.625 118.709 131.410 329.959 123.860 134.271 232.165 266.822 250.711 209.888 126.864 158.343 213.403 386.566 261.527 270.792 192.459 268.553 264.827 289.884 201.887 223.077 240.965
Total 124.680 211.040 246.622 463.012 196.906 225.804 333.156 404.039 358.385 351.513 271.648 307.960 361.924 626.376 411.543 430.107 260.156 350.803 349.377 470.510 315.229 370.945 373.560
0
100.000
200.000
300.000
400.000
500.000
600.000
700.000
People

The Investment Coordinating Board of the Republic of Indonesia
32
V. Progress of Investment Realization 2010 - September 2015

The Investment Coordinating Board of the Republic of Indonesia
33
Progress of Investment Realization 2010 - September 2015 : Per QuarterProgress of Investment Realization : 2010 - September 2015
Q I Q II Q III Q IV Q I Q II Q III Q IV Q I Q II Q III Q IV Q I Q II Q III Q IV Q I Q II Q III Q IV Q I Q II Q III
2010 2011 2012 2013 2014 2015
DDI 6,7 15,2 16,6 22,0 14,1 18,9 19,0 24,0 19,7 20,8 25,2 26,5 27,5 33,1 33,5 34,1 34,6 38,2 41,6 41,7 42,5 42,9 47,8
FDI 35,4 35,6 40,1 36,9 39,5 43,1 46,5 46,2 51,5 56,1 56,6 56,8 65,5 66,7 67,0 71,2 72,0 78,0 78,3 78,7 82,1 92,2 92,5
Total 42,1 50,8 56,7 58,9 53,6 62,0 65,5 70,2 71,2 76,9 81,8 83,3 93,0 99,8 100,5 105,3 106,6 116,2 119,9 120,4 124,6 135,1 140,3
0
20
40
60
80
100
120
140
Rp
Tri
llio
n

The Investment Coordinating Board of the Republic of Indonesia
34
Progress of Investment Realization of FDI 2010 - September 2015 in US Dolar : Per Quarter
Progress of Investment Realization : 2010 - September 2015
Q I Q II Q III Q IV Q I Q II Q III Q IV Q I Q II Q III Q IV Q I Q II Q III Q IV Q I Q II Q III Q IV Q I Q II Q III
2010 2011 2012 2013 2014 2015
FDI 3,9 3,9 4,5 4,1 4,4 4,8 5,2 5,1 5,7 6,2 6,3 6,3 7,0 7,2 7,0 7,4 6,9 7,4 7,4 6,8 6,6 7,4 7,4
0
1
2
3
4
5
6
7
8
US$
Bill
ion
FDI
Notes:- 2010, 2011, and 2012, exchange rate US$ 1 = Rp 9,000- 2013 (Q I and Q II), exchange rate US$ 1 = Rp 9,300 (based on State Budget 2013)- 2013 (Q III and Q IV),exchange rate US$ 1 = Rp 9,600 (based on Revised State Budget 2013)- 2014 (Q I, Q II, and Q III), exchange rate US$ 1 = Rp 10,500 (based on State Budget 2014)- 2014 (Q IV), exchange rate US$ 1 = Rp 11,600 (based on Revised State Budget 2014)- 2015 (Q I , Q II, and Q III), exchange rate US$ 1 = Rp 12,500 (based on State Budget 2015)

The Investment Coordinating Board of the Republic of Indonesia
35
I = Investment (Rp Trillion)
Progress of Investment Realization : 2010 – September 2015
Progress of Investment Realization 2010 – September 2015 : New and Expansion Project
DDI 2010 2011 2012 2013 2014 Jan-Sep 2015
Total
2010 - Sep 2015
I % I % I % I % I % I % I %
New 30.8 50.9 34.3 45.1 46.0 49.9 74.8 58.3 110.1 70.5 81.8 61.4 377.8 58.5
Expansion 29.7 49.1 41.7 54.9 46.2 50.1 53.4 41.7 46.0 29.5 51.4 38.6 268.4 41.5
Total 60.5 100.0 76.0 100.0 92.2 100.0 128.2 100.0 156.1 100.0 133.2 100.0 646.2 100.0
FDI2010 2011 2012 2013 2014 Jan-Sep 2015
Total
2010 - Sep 2015
I % I % I % I % I % I % I %
New 65.2 44.1 78.3 44.7 115.7 52.4 176.0 65.1 213.1 69.4 210.8 79.0 859.1 61.9
Expansion 82.8 55.9 97.0 55.3 105.3 47.6 94.4 34.9 93.9 30.6 56.0 21.0 529.4 38.1
Total 148.0 100.0 175.3 100.0 221.0 100.0 270.4 100.0 307.0 100.0 266.8 100.0 1.388.5 100.0
2010 2011 2012 2013 2014 Jan-Sep 2015Percentage basedon Jan - Sep 2015
New 96,0 112,6 161,7 250,8 323,2 292,6 73,1%
Expansion 112,5 138,7 151,5 147,8 139,9 107,4 26,9%
Total 208,5 251,3 313,2 398,6 463,1 400,0 100,0%
0
100
200
300
400
500R
p T
rilli
on

The Investment Coordinating Board of the Republic of Indonesia
36
I = Investment (Rp Trillion)
Progress of Investment Realization 2010 – September 2015 : Based on Primary, Secondary, Tertiary Sector
Progress of Investment Realization : 2010 – September 2015
FDI 2010 2011 2012 2013 2014 Jan - Sep 2015 Total2010- Sep 2015
I % I % I % I % I % I % I %
Primary 27.7 18.7 44.0 21.7 53.4 22.1 61.1 20.1 75.2 24.5 57.7 21.6 319.1 23.0
Secondary 30.5 20.6 61.1 50.7 105.9 54.1 149.9 39.9 140.1 45.6 109.1 40.9 596.6 43.0
Tertiary 89.8 60.7 70.2 27.6 61.7 23.8 59.4 40.0 91.7 29.9 100.0 37.5 472.8 34.1
Total 148.0 100.0 175.3 100.0 221.0 100.0 270.4 100.0 307.0 100.0 266.8 100.0 1.388.5 100.0
DDI 2010 2011 2012 2013 2014 Jan - Sep 2015 Total2010- Sep 2015
I % I % I % I % I % I % I %
Primary 13.4 22.2 16.5 21.7 20.4 22.1 25.7 20.1 16.5 10.6 14.3 10.7 106.8 16.5
Secondary 24.4 40.3 38.5 50.7 49.9 54.1 51.2 39.9 59.0 37.8 63.1 47.3 286.0 44.3
Tertiary 22.7 37.5 21.0 27.6 21.9 23.8 51.3 40.0 80.6 51.6 55.9 42.0 253.4 39.2
Total 60.5 100.0 76.0 100.0 92.2 100.0 128.2 100.0 156.1 100.0 133.3 100.0 646.2 100.0
2010 2011 2012 2013 2014 Jan-Sep 2015Percentage basedon Jan-Sep 2015
Primary 41,1 60,5 73,8 86,8 91,7 71,9 18,0%
Secondary 54,9 99,6 155,8 201,1 199,1 172,2 43,1%
Tertiary 112,5 91,2 83,6 110,7 172,3 155,9 39,0%
Total 208,5 251,3 313,2 398,6 463,1 400,0 100,0%
0
100
200
300
400
500R
p T
rilli
on

THANK YOU
Invest in...
© 2015 by Indonesia Investment Coordinating Board. All rights reserved
CONTACT US
BADAN KOORDINASI PENANAMAN MODAL (BKPM)
Jl. Jend. Gatot Subroto No. 44. Jakarta 12190
P.O. Box 3186. Indonesia
P : +62 21 5252008 ext 7002
E : [email protected] , [email protected]
Seoul
International Representatives Office